Agenda. Puerto Rico s Highway System. An Overview of Puerto Rico
|
|
|
- Rosanna Green
- 6 years ago
- Views:
Transcription


1 Motorcycle Crashes and its Implications to Local Roads Dr. Alberto Figueroa Dr. Benjamin Colucci University of Puerto Rico at Mayagüez Puerto Rico LTAP Southeast Local Roads Conference (SELRC) Orange Beach, Alabama May 14, 2007 Agenda Overview of Puerto Rico Road safety fundamentals Motorcycle research methodology Trends in motorcycle registrations and fatalities in Puerto Rico Comparison of motorcycle-related crash elements in California and Puerto Rico Relevant motorcycle crashes statistics in US Southeast Region and Puerto Rico Contributory factors of motorcycle crashes in local roads Safety countermeasures and recommendations Puerto Rico s Highway System An Overview of Puerto Rico 3,500 sq. mi. 2.3 million licensed drivers 115,000 registered motorcycles 504 road fatalities 3.84 million inhabitants 2.8 million registered motor vehicles 26,647 kilometers of roads 80% urban roads 77% local roads


2 OUR MISSION plan, design, operate, and maintain streets and highways provide a balanced system for the movement of people and goods When does a road can be considered SAFE for motorcycle riders safe, rapid, comfortable, convenient, economical, and environmentally compatible How to Measure Road Safety Pyramid of Highway Traffic Events Nominal safety determined by compliance with design guidelines and standards Objective safety Measured with crashes Likelihood of crash on the road for a particular driver Subjective / perceived safety Safety as perceived and interpreted by drivers Driver behavior / speed selection Crashes PDO
3 Highway System Components and Crashes Motorcycle Research Methodology From Rumar, 1985 torcycles Registered mot Trends in Motorcycle Registrations and Fatalities in Puerto Rico ( ) 120, ,000 80,000 60,000 40,000 20, Registered motorcycles Motorcycle-related fatalities es Fatalitie Crash-related Elements Crash type Hurt Report, California (1981) 2.6% property damage only (PDO) 97.4% injury or fatal Puerto Rico ( ) 40.1% property damage only (PDO) 59.9% injury or fatal Area type 9.4% occurred in a rural area 18.5% occurred in a rural area Road classification Crash location 55.9% occurred on arterial highways 59.7% occurred in roadway segments 29.7% occurred on arterial highways 75.2% occurred in roadway segments Roadway alignment 81.3% on straight and level segment 75.7% on straight and level segment Maneuver type 29.5% right angle crashes 17.5% side crashes in same direction Traffic control type 25.5% in signalized intersections 8.9% in signalized intersections Roadway defects 2.0% were caused by roadway defects 3.0% were caused by roadway defects Gender of riders 97% of motorcycle riders were men 95% of motorcycle riders were men Age of riders Fatality rate (2006) 62.6% between years old 35.6% between years old

 100 600 90 80 Motorcycles")


4 Relevant Motorcycle Crash Statistics Southeastern Region of U.S. and Puerto Rico Source: NHTSA, Motorcycle Safety Plan Comparison of US Highway and Motorcycle Fatalities ( ) 700 Comparison of PR Highway and Motorcycle Fatalities ( ) Motorcycles Highway Fatalities in Puerto Rico Motorcycle Fatalities in Puerto Rico Year 0 Highway fatalities Motorcycle Fatalities


5 Rank State / U.S. Territory Motorcycle Fatalities 1 California Florida Texas Pennsylvania Illinois New York North Carolina Ohio Arizona Puerto Rico (2006 update) Georgia 111 Source: NHTSA, Motorcycle Safety Plan Source: NHTSA, Motorcycle Safety Plan


6 Motorcycle Riding Behavior in Puerto Rico Contributory Factors Motorcycle Riding Behavior in Puerto Rico Percentage of Contributory Factors in Highway Fatalities by Year Motorcycle riders Alcohol-related Speeding Roadway departure Single vehicle Pedestrians Total Road Fatalities

7 Annual Motorcycle Cras shes and Number of Vehicles In nvolved Motorcycle Crashes per Day Sunday 72 Monday 49 Tuesday 52 Wednesday 51 Thursday 53 Friday 54 Saturday Total Crashes Vehicles Involved Injuries and Fatalities / 100 Crashes Injuries and Fa atalities / 100 Crashes Female, 5% Unknown, 3% Male, 92% Human Factors of Motorcycle Crashes in Puerto Rico 0.48% 12.65% 6.23% 25.58% 19.53% 35.53% <16 YEARS YEARS YEARS YEARS YEARS >50 YEARS Survey of Motorcycle Riders 500 motorcycle riders surveyed 78% of municipalities Female 13% Gender Male 87% 31% Education 8% 0% Characteristics of Survey Sample 28% 33% Int./High School Technical Degree Bachelor Graduate Other Age Range Groups of Age Motorcycle Type 12% 1% 10% 5% 7% 26% 18% 29% 30% 30% < >51 32% Scooter Sport Cruiser Standard Other


8 Preferred Day of More Day Frequent for Using Use of Motorcycle 6% 4% 2% 9% 49% 30% All days Weekend Hollydays Holidays Monday to Friday Other Weekend & Hollydays Holidays Stated Motorcycle Use Primary Principal Motorcycle Use Use 5% 4% Presence of Retroreflective Raised Pavement Markers Absence of Ilumination Presence of Gravel or Sand in the Pavement Bad Weather Pavement Marking Obstacle Blocking Visibility Lane Width Perception of Contributing Road Factor to Motorcycle Crashes 24% Steep Grades Sharp Curves 67% Recreation Go to School or Work To Working Other Pavement Defects 0% 10% 20% 30% 40% 50% 60% 70% 80% 90% 100% Don t Know Does not contribute Partially Contibutes Signigicantly Contributes Driver in the side of other motorcycle in the same lane Drive use a cellular Not Keeping Distance Drive with a Passenger Drive Over Alcohol Influence Pass Front the Traffic Line in the Red Light Driver Over a Speed Limit General Behavior of Other Drivers Unexperiece Driver Motorcycle Driving on the Shoulder Driving Between Vehicles Perception of Contributing Factor of Human Behavior in Motorcycle Crashes 0% 10% 20% 30% 40% 50% 60% 70% 80% 90% 100% Don t Know Does not contribute Partially Contibutes Signigicantly Contributes Twelve Contributory Factors to Motorcycle-related related Crashes 1. Untrained and inexperienced riders 2. Risk acceptance (speed differential, etc.) 3. Driving under the influence - DUI (alcohol, drugs, etc.) 4. Lack of safety garment (severity-related) related) 5. Highway geometry (sharp curvature) 6. Hidden driveways and sight distance restrictions 7. Pavement markings at crosswalks and stop bars approaching an intersection 8. Pavement conditions 9. Climatic conditions 10. Inadequate nighttime illumination 11. Inadequate transition tapers at work zones 12. Inadequate road signage


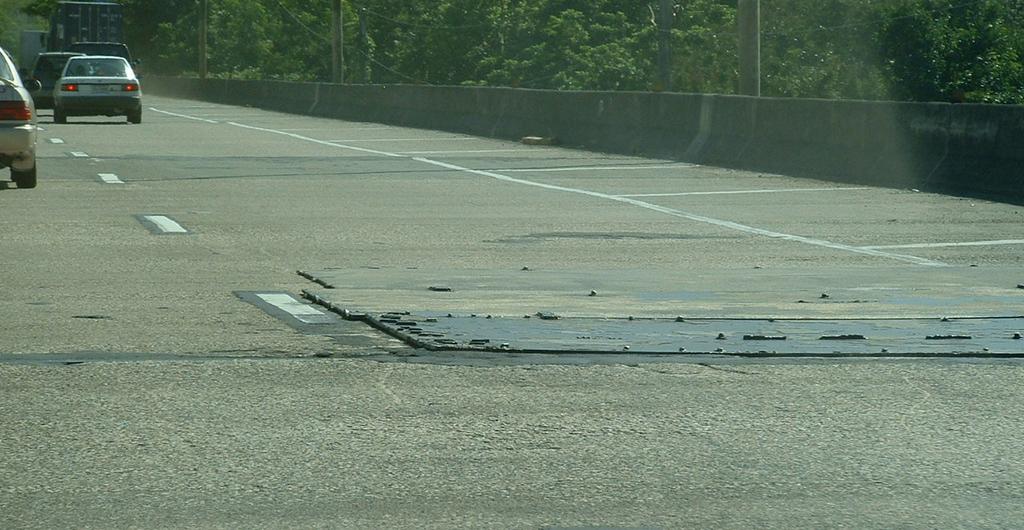

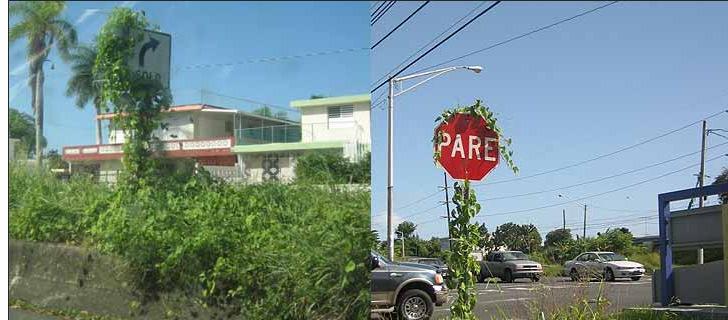
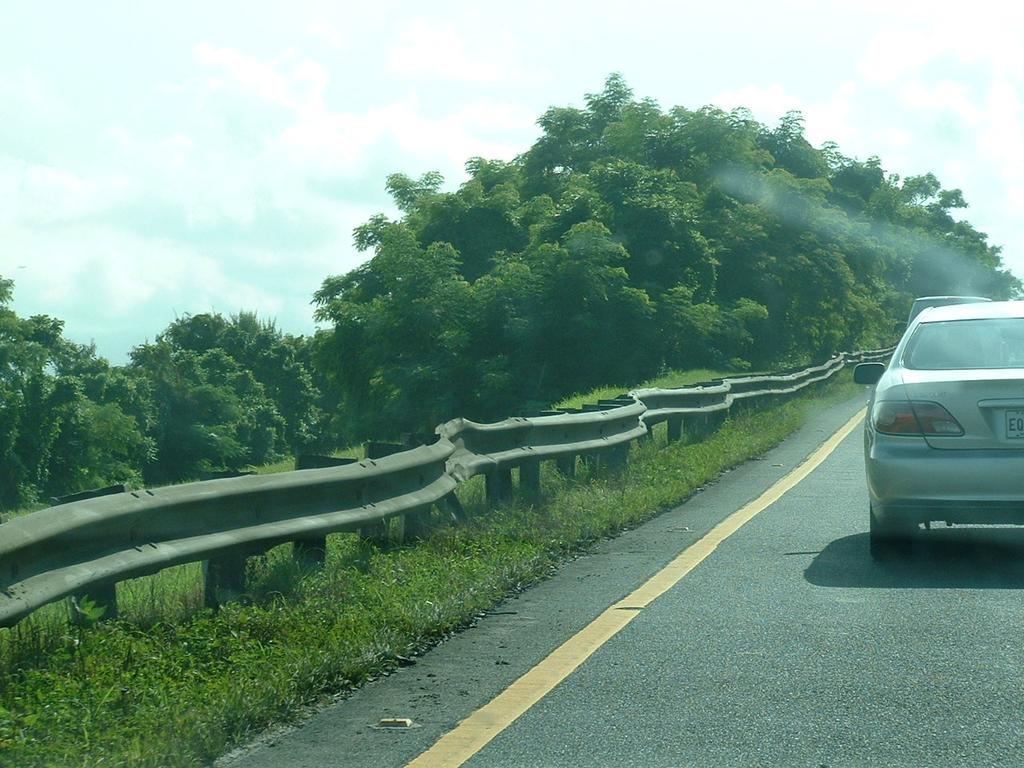


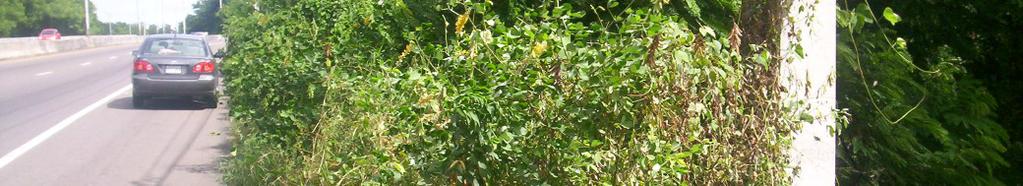
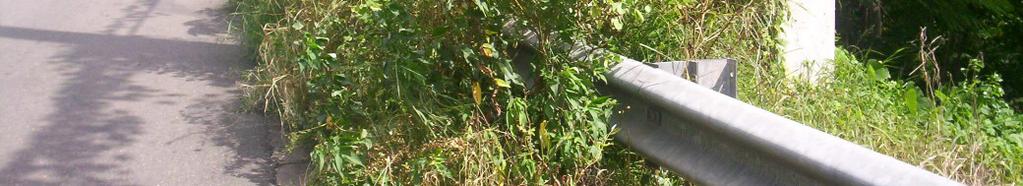

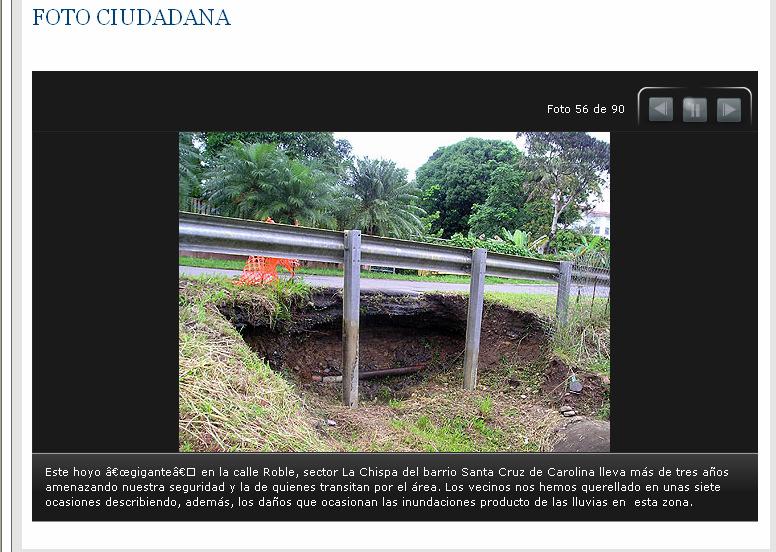


9 Potentially Hazardous Pavement Surfaces Deficiencies for Motorcycles Ten Contributory Factors to MotorcycleMotorcyclerelated Crashes at Local Roads Transition from highhigh-speed to low low--speed roads 2. Abrupt changes in geometry 3. Limited sight distances 4. Hidden driveways 5. Vegetation / Lack of roadside maintenance 6. Obsolete roadside safety features 7. Loose gravel on pavement surface and intersections 8. Pavement conditions (rutting, shoving, polished aggregate, lane shoulder dropdrop-offs) 9. First First--time drivers at tourism and recreational areas 10. Inadequate advanced warning signs General Safety Countermeasures Exclusive motorcycle lanes Advanced stop bars Improve road signage Pavement maintenance Forgiving roadside


10 2. Recommended Motorcycle Training for Riding on Horizontal Curves 3. Improve warning signs to address local prevailing conditions H eye 0.6 m H eye = 1.3 m 3. Improve warning signs to address local prevailing conditions 4. Recommended Advanced Markings at Intersections
11 4. Experimental Motorcycle Advanced Stop Line at Intersections 5. Enforcement, Education, Training, Engineering, and Administrative-related related Recommendations Thrust Areas Short (S), Medium (M) and Long (L) Term Recommendations to Reduce Motorcycle Crash Potential Enforcement Increase fines of motorcycle traffic-related related violations (S) Education campaign on helmet and safety clothing, increasing risk perception, crash consequences that results in impairment Education that affects your future quality of life, etc. (M-L) Training Implement a motorcycle training and riding test for motorcycle licensing (S-M) Engineering Provide effective and preventive maintenance to highways (M-L) Administrative Legislative action to establish 18-years old as minimum age to obtain a motorcycle license (S) Include specifications for motorcycles in roadway and roadside design manuals and Manual of Uniform Traffic Control Devices (MUTCD) Thank you for the opportunity! Additional information: amfigueroa@uprm.edu bcolucci@uprm.edu
Motorcycle Safety Program Assessments
 2015 s Conference 2015 ASK 1 Andrew Krajewski Project Manager, SMSA What is a state motorcycle safety program assessment? An independent review of a state s motorcycle safety efforts NHTSA facilitates
FHWA Motorcycle Crash Causation Study
 Office of Safety Research and Development FHWA Motorcycle Crash Causation Study Carol H. Tan, Ph.D Office of Safety Research & Development 2017 SMSA Sept 28, 2017 1 Presentation Overview Background Data
ABSTRACT INTRODUCTION
 Roadway Improvements to Increase Motorcycle Safety in Puerto Rico by Alberto M. Figueroa Medina, PhD, PE Benjamín Colucci Ríos, PhD, PE, PTOE Juan C. Torréns, EIT ABSTRACT The registration of motorcycles
Traffic Safety Facts. Alcohol Data. Alcohol-Related Crashes and Fatalities
 Traffic Safety Facts 2005 Data Alcohol There were 16,885 alcohol-related fatalities in 2005 39 percent of the total traffic fatalities for the year. Alcohol-Related Crashes and Fatalities DOT HS 810 616
DOT HS October 2011
 TRAFFIC SAFETY FACTS 2009 Data DOT HS 811 389 October 2011 Motorcycles Definitions often vary across publications with respect to individuals on motorcycles. For this document, the following terms will
Contributory factors of powered two wheelers crashes
 Contributory factors of powered two wheelers crashes Pierre Van Elslande, IFSTTAR George Yannis, NTUA Veronique Feypell, OECD/ITF Eleonora Papadimitriou, NTUA Carol Tan, FHWA Michael Jordan, NHTSA Research
DOT HS July 2012
 TRAFFIC SAFETY FACTS 2010 Data DOT HS 811 639 July 2012 Motorcycles In 2010, 4,502 motorcyclists were killed a slight increase from the 4,469 motorcyclists killed in 2009. There were 82,000 motorcyclists
Where are the Increases in Motorcycle Rider Fatalities?
 Where are the Increases in Motorcycle Rider Fatalities? Umesh Shankar Mathematical Analysis Division (NPO-121) Office of Traffic Records and Analysis National Center for Statistics and Analysis National
Missouri Seat Belt Usage Survey for 2017
 Missouri Seat Belt Usage Survey for 2017 Conducted for the Highway Safety & Traffic Division of the Missouri Department of Transportation by The Missouri Safety Center University of Central Missouri Final
TABLE OF CONTENTS CRASHES.. VI TRENDS. VII
 TABLE OF CONTENTS Introduction. I Letter from the Governor II Executive Summary of this Report. III-IV 1998 Nevada Quick Collision Facts V CRASHES.. VI a. Statewide Total Crashes by Severity... 1 b. Statewide
Understanding and Identifying Crashes on Curves for Safety Improvement Potential in Illinois
 Understanding and Identifying Crashes on Curves for Safety Improvement Potential in Illinois Priscilla Tobias, P.E. Mouyid Islam, Ph.D. Kim Kolody, P.E. Optional Agenda Image Title Background Workflow
TRAFFIC SAFETY FACTS Fatal Motor Vehicle Crashes: Overview. Research Note. DOT HS October 2017
 TRAFFIC SAFETY FACTS Research Note DOT HS 812 456 October 2017 2016 Fatal Motor Vehicle Crashes: Overview There were 37,461 people killed in crashes on U.S. roadways during 2016, an increase from 35,485
ITSMR Research Note. Motorcyclists and Impaired Driving ABSTRACT INTRODUCTION KEY FINDINGS. September 2013
 September 2013 KEY FINDINGS F&PI CRASHES INVOLVING IMPAIRED MOTORCYCLISTS 27% of the fatal MC crashes over the five year period, 2008-2012, were alcohol-related. 48% of the alcohol-related F&PI MC crashes
I-95 Corridor-wide safety data analysis and identification of existing successful safety programs. Traffic Injury Research Foundation April 22, 2010
 I-95 Corridor-wide safety data analysis and identification of existing successful safety programs Traffic Injury Research Foundation April 22, 2010 Overview Background Methodology Purpose Crash analysis
Federal Motor Carrier Safety Administration
 Federal Motor Carrier Safety Administration Earl Hardy Senior Policy Advisor Office of the Assistant Administrator and Chief Safety Officer 2 Who We Are FMCSA Regulates 551,000 active motor carriers 13,000
RTCSNV CRASH ANALYSIS REPORT
 2011-2015 RTCSNV CRASH ANALYSIS REPORT TABLE OF CONTENTS Summary... 3 Crash Types... 4 Time and Day of Crashes... 7 Crash Factors... 9 Fatalities... 10 Driver s Behavior... 11 Crash Locations... 15 Non-Motorized
Alberta. Collision Facts. 330 people killed. 17,907 people injured. 140,705 collisions.
 Collision Facts 330 people killed 17,907 people injured 140,705 collisions May 2017 www.transportation.alberta.ca/statistics Collision Facts 330 people killed 17,907 people injured 140,705 collisions Monday
2018 NDACE CONFERENCE
 2018 NDACE CONFERENCE Setting Speed Limits Ward County Highway Department 1 NDCC 39-09-02. Speed limitations (2003) NDCC 39-09-02 f -Fifty-five miles [88.51 kilometers] an hour on gravel, dirt, or loose
2017 MDTSEA Manual - How it Corresponds to the ADTSEA 3.0 Curriculum for Segment 1 and 2 Classroom Education
 2017 MDTSEA - How it Corresponds to the ADTSEA 3.0 Curriculum for Segment 1 and 2 Classroom Education Section 5A Segment 1 Classroom Content, Objectives, and Resources 1 Introduction to Novice Driver Responsibilities
Alberta Speeding Convictions and Collisions Involving Unsafe Speed
 Alberta Speeding Convictions and Collisions Involving Unsafe Speed 2004-2008 Overview This document was prepared under the Alberta Traffic Safety Plan, Strategic Research Plan for 2008-2010, with the objective
Collect and analyze data on motorcycle crashes, injuries, and fatalities;
 November 2006 Highway Safety Program Guideline No. 3 Motorcycle Safety Each State, in cooperation with its political subdivisions and tribal governments and other parties as appropriate, should develop
Factors Affecting Highway Safety in Louisiana
 Factors Affecting Highway Safety in Louisiana Conducted by the Louisiana Transportation Research Center for the Louisiana Department of Transportation and Development Results Fatality rates 1999 2004 3
AUTONOMOUS VEHICLES AND THE TRUCKING INDUSTRY
 AUTONOMOUS VEHICLES AND THE TRUCKING INDUSTRY Presentation for the Maine State Agencies Working Group on Connected and Autonomous Vehicles August 14, 2017 Brian Parke bparke@mmta.com Tim Doyle timd@mmta.com
TRAFFIC SAFETY FACTS. Overview Data
 TRAFFIC SAFETY FACTS 2009 Data Overview Motor vehicle travel is the primary means of transportation in the United States, providing an unprecedented degree of mobility. Yet for all its advantages, injuries
City State Zip. Mistake 1 Mistake 2 Mistake 3 Mistake 4 Mistake 5. Mistake 6 Mistake 7 Mistake 8 Mistake 9 Mistake 10
 SCOUT S INFORMATION MERIT BADGE COUNSELOR INFORMATION Name Name Phone Address Organization City State Zip WORKBOOK INFORMATION Scoutmaster Bucky Workbook based off of Boy Scout Requirements 2018 Edition
Traffic Safety Facts 2000
 DOT HS 809 326 U.S. Department of Transportation National Highway Traffic Safety Administration Traffic Safety Facts 2000 Motorcycles In 2000, 2,862 motorcyclists were killed and an additional 58,000 were
DOT HS April 2013
 TRAFFIC SAFETY FACTS 2011 Data DOT HS 811 753 April 2013 Overview Motor vehicle travel is the primary means of transportation in the United States, providing an unprecedented degree of mobility. Yet for
Young drivers. Drivers involved in fatal or injury crashes. Drivers involved in fatal/injury crashes per 100. per licence holders (lines)
") Young drivers CRASH FACTSHEET 2012 CRASH STATISTICS FOR THE YEAR ENDED 31 DECEMBER 2011 Prepared by the Ministry of Transport In 2011 young drivers aged 15 24 were involved in 80 fatal traffic crashes,
Young drivers CRASH FACTSHEET 2012 CRASH STATISTICS FOR THE YEAR ENDED 31 DECEMBER 2011 Prepared by the Ministry of Transport In 2011 young drivers aged 15 24 were involved in 80 fatal traffic crashes,
4 th IRTAD CONFERENCE Road safety data: collection and analysis for target setting and monitoring performances and progress
 Characteristics of Motorcycle Crashes in the U.S. Jeya Padmanaban M.S. Vitaly Eyges PhD 4 th IRTAD CONFERENCE Road safety data: collection and analysis for target setting and monitoring performances and
Alcohol Related Accidents in Mahoning County:
 Alcohol Related Accidents in Mahoning County: 2013-2015 Alcohol Related Accidents in Mahoning County: 2013-2015 Each year the Eastgate Regional Council of Governments collects crash data from the Ohio
NCDOT Report on Improving Safety on Secondary Roads
 April 8, 2016 NCDOT Report on Improving Safety on Secondary Roads Kevin Lacy, PE, State Traffic Engineer Overview Crash data and Safety Performance on Secondary Roads Driver Behavior Roadway Environment
Department of Highway Safety and Motor Vehicles
 Department of Highway Safety and Motor Vehicles Traffic Report 2005 A Compilation of Motor Vehicle Crash Data from the Florida Crash Records Database Fred O. Dickinson Executive Director Our Mission: Making
Puerto Rico Observational Survey of Seat Belt Use, 2017
 Puerto Rico Observational Survey of Seat Belt Use, 2017 Final Report Submitted to: Traffic Safety Commission of Puerto Rico September 29, 2017 TABLE OF CONTENT Introduction... 3 Methodology... 3 FINDINGS...
Traffic Safety Facts 1996
 U.S. Department of Transportation National Highway Traffic Safety Administration Traffic Safety Facts 1996 Motorcycles In 1996, 2,160 motorcyclists were killed and an additional 56,000 were injured in
Mac McCall VTTI Motorcycle Research Group September 28, 2017
 Motorcycle Crashes and Some Guidance to Avoid Them Mac McCall VTTI Motorcycle Research Group September 28, 2017 Innovation 2015 4,976 killed Why? 29X more likely than in cars per mile traveled 88,000 injured
SPATIAL AND TEMPORAL PATTERNS OF FATIGUE RELATED CRASHES IN HAWAII
 SPATIAL AND TEMPORAL PATTERNS OF FATIGUE RELATED CRASHES IN HAWAII By Karl E. Kim Eric Y. Yamashita Hawaii CODES Project Traffic Records Forum July 29 - August 2, 2001 New Orleans, Louisiana Overview Background
MAIDS Workshop. 01 April 2009
 MAIDS Workshop 01 April 2009 Road Safety: the Industry Strategy Improve the knowledge Safety Plan for Action: Integrated approach Act on the product Act on the human factor Act on the infrastructure Cooperate
Conventional Approach
 Session 6 Jack Broz, PE, HR Green May 5-7, 2010 Conventional Approach Classification required by Federal law General Categories: Arterial Collector Local 6-1 Functional Classifications Changing Road Classification
Delaware Information and Analysis Center
 Delaware Information and Analysis Center 2015 DELAWARE THERE WERE 684,731 LICENSED DRIVERS, 892,508 REGISTERED MOTOR VEHICLES, AND 9,761,000,000 VEHICLE MILES DRIVEN*. THERE WERE 24,066 TRAFFIC CRASHES
ITSMR Research Note. Young Drivers on New York Roadways:
 January 2019 KEY FINDINGS In 2017: 113 persons were killed in motor vehicle crashes involving young drivers, compared to 139 in 2013. 22,485 persons were injured in young driver crashes, down 5% from 2013.
National Center for Statistics and Analysis Research and Development
 U.S. Department of Transportation National Highway Traffic Safety Administration DOT HS 809 360 October 2001 Technical Report Published By: National Center for Statistics and Analysis Research and Development
Horizontal Alignment
 Session 8 Jim Rosenow, PE, Mn/DOT March 5-7, 2010 Horizontal Alignment The shortest distance between two points is: A straight line The circumference of a circle passing through both points and the center
USE RESTRICTED 23 USC 409
 Study Map & Totals Legend Fatality Injury Property Damage Remarks: NONE Date Range: 01-01-2010 thru 12-31-2014 2010 2011 2012 Fat Incap Inj Non-Incap Inj Poss Inj PD Tot Fat Incap Inj Non-Incap Inj Poss
DOT HS August Motor Vehicle Crashes: Overview
 TRAFFIC SAFETY FACTS Research Note DOT HS 812 318 August 2016 2015 Motor Vehicle Crashes: Overview The Nation lost 35,092 people in crashes on U.S. roadways during 2015, an increase from 32,744 in 2014.
Road fatalities in 2012
 Lithuania 1 Inhabitants Vehicles/1 000 inhabitants Road fatalities in 2012 Fatalities /100 000 inhabitants in 2012 2.98 million 751 301 10.1 1. Road safety data collection Definitions Road fatality: person
Shedding light on the nighttime driving risk
 Shedding on the nighttime driving risk An analysis of fatal crashes under dark conditions in the U.S., 1999-2008 Russell Henk, P.E., Senior Research Engineer Val Pezoldt, Research Scientist Bernie Fette,
NHTSA Role in The Future of Automated Vehicles
 NHTSA Role in The Future of Automated Vehicles Monday, July 15, 2013. John W. Marshall, Director Office of Safety Programs, NHTSA NHTSA s Mission Save lives, prevent injuries and reduce economic costs
National Center for Statistics and Analysis Research and Development
 U.S. Department of Transportation National Highway Traffic Safety Administration DOT HS 809 271 June 2001 Technical Report Published By: National Center for Statistics and Analysis Research and Development
Florida Strategic Highway Safety Planning Florida Strategic Highway Safety Plan (SHSP) Update and Performance Overview
 Update and Performance Overview") Session 1 Florida Strategic Highway Safety Planning Florida Strategic Highway Safety Plan (SHSP) Update and Performance Overview Joe Santos, PE, FDOT, State Safety Office October, 23, 2013 Florida Statistics
Session 1 Florida Strategic Highway Safety Planning Florida Strategic Highway Safety Plan (SHSP) Update and Performance Overview Joe Santos, PE, FDOT, State Safety Office October, 23, 2013 Florida Statistics
the Ministry of Transport is attributed as the source of the material
 Young Drivers 2016 Disclaimer All reasonable endeavours are made to ensure the accuracy of the information in this report. However, the information is provided without warranties of any kind including
Traffic Accident Statistics
 2000 Missouri State Highway System Traffic Accident Statistics Missouri State Highway System Traffic Accident Statistics Table of Contents Subject Chapter 1: Statewide Traffic Accident Statistics, Introduction
An Evaluation on the Compliance to Safety Helmet Usage among Motorcyclists in Batu Pahat, Johor
 An Evaluation on the Compliance to Safety Helmet Usage among Motorcyclists in Batu Pahat, Johor K. Ambak 1, *, H. Hashim 2, I. Yusoff 3 and B. David 4 1,2,3,4 Faculty of Civil and Environmental Engineering,
2014 Community Report Truth or Consequences
 4 Truth or Consequences Produced for the New Mexico Department of Transportation, Traffic Safety Division, Traffic Records Bureau, Under Contract 58 by the University of New Mexico, Geospatial and Population
MOTORCYCLE SAFETY. FY 14 Motorcycle Safety Assessment
 MOTORCYCLE SAFETY FY 14 Motorcycle Safety Assessment Introduction Texas Motorcycle Safety Assessment The assessment program offers States a tool to use over time to review their motorcycle safety program,
2011 TOWN OF CASTLE ROCK MOTOR VEHICLE ACCIDENT FACTS PREPARED BY THE PUBLIC WORKS DEPARTMENT
 2011 TOWN OF CASTLE ROCK MOTOR VEHICLE ACCIDENT FACTS PREPARED BY THE PUBLIC WORKS DEPARTMENT ACKNOWLEDGEMENTS This report was assembled from data provided by the Castle Rock Police Department accident
NEW JERSEY LAW ENFORCEMENT LIAISON NEWSLETTER
 NEW JERSEY LAW ENFORCEMENT LIAISON NEWSLETTER JUNE 2018/21 WWW..ORG NJ DIVISION OF HIGHWAY TRAFFIC SAFETY DRIVE SOBER OR GET PULLED OVER 2018 MOBILIZATION The mission of the Division of The Drive Sober
2016 Community Report New Mexico
 216 Produced for the Department of Transportation, Traffic Safety Division, Traffic Records Bureau, Under Contract 581 by the University of, Geospatial and Population Studies, Traffic Research Unit Distributed
Percentage of crashes with driving too fast for the conditions cited as a contributing factor ( ) 0% 5% 10% 15% 20% 25% 30% 35% Percentage
 0% 5% 10% 15% 20% 25% 30% 35% Percentage") Speeding CRASH FACTSHEET November 2013 CRASH STATISTICS FOR THE YEAR ENDED 31 DECEMBER 2012 Prepared by the Ministry of Transport In this fact sheet speeding is defined as driving too fast for the conditions.
Speeding CRASH FACTSHEET November 2013 CRASH STATISTICS FOR THE YEAR ENDED 31 DECEMBER 2012 Prepared by the Ministry of Transport In this fact sheet speeding is defined as driving too fast for the conditions.
CASCAD. (Causal Analysis using STAMP for Connected and Automated Driving) Stephanie Alvarez, Yves Page & Franck Guarnieri
 Stephanie Alvarez, Yves Page & Franck Guarnieri") CASCAD (Causal Analysis using STAMP for Connected and Automated Driving) Stephanie Alvarez, Yves Page & Franck Guarnieri Introduction: Vehicle automation will introduce changes into the road traffic system
CASCAD (Causal Analysis using STAMP for Connected and Automated Driving) Stephanie Alvarez, Yves Page & Franck Guarnieri Introduction: Vehicle automation will introduce changes into the road traffic system
Conventional Paving Process: Vertical Drop-off
 SAFETY EDGE Module 2: Equipment and Construction of Safety Edge Level of Audience: Engineers, Project Managers and Municipal Authorities Instructor: Eng. Freddie Salado Duration: 1 Hour 1 Acronyms AAA
Unit 1 - Driving, Mobility and Laws. Chapter 1 - Driving and Mobility
 The outline listed below is meant to be used as a reference for the placement of The Driving Zone 2 DVD clips into Responsible Driving text book where they may provide benefit and talking points for the
New York City Motorcycle Safety Study ALLEN MALLS: BEFORE, TEMPORARY MATERIALS, AFTER (CAPITAL): CHINATOWN (MANHATTAN)
: CHINATOWN (MANHATTAN)") New York City Motorcycle Safety Study 2014 Chris Brunson, Project Manager, Research Implementation and Safety Alicia Posner, Project Manager, Research Implementation and Safety New York City Department
New York City Motorcycle Safety Study 2014 Chris Brunson, Project Manager, Research Implementation and Safety Alicia Posner, Project Manager, Research Implementation and Safety New York City Department
2015 Community Report White Rock
 5 White Rock Produced for the New Mexico Department of Transportation, Traffic Safety Division, Traffic Records Bureau, Under Contract 58 by the University of New Mexico, Geospatial and Population Studies,
Illinois State Police Enforcement Initiatives. Commander Robert W. Haley Statewide Patrol Support Command
 Illinois State Police Enforcement Initiatives Commander Robert W. Haley Statewide Patrol Support Command Speed Motorcycle Enforcement Bureau Total Citations 5000 4500 4000 3500 3000 2500 2000 1500 1000
2016 Community Report Los Alamos County
 6 Los Alamos County Produced for the New Mexico Department of Transportation, Traffic Safety Division, Traffic Records Bureau, Under Contract 58 by the University of New Mexico, Geospatial and Population
2014 Community Report Portales
 4 Portales Produced for the New Mexico Department of Transportation, Traffic Safety Division, Traffic Records Bureau, Under Contract 58 by the University of New Mexico, Geospatial and Population Studies,
Speed Limit Study: Traffic Engineering Report
 Speed Limit Study: Traffic Engineering Report This report documents the engineering and traffic investigation required by Vermont Statutes Annotated Title 23, Chapter 13 1007 for a municipal legislative
Pedestrians Road Safety
 Pedestrians Road Safety Overview Over the period 1996-2009, 5,323 people have been killed on Irish road. Out of this 22% (1162) were pedestrians. Additional 3863 pedestrians were seriously injured in the
2016 Community Report Portales
 6 Portales Produced for the New Mexico Department of Transportation, Traffic Safety Division, Traffic Records Bureau, Under Contract 58 by the University of New Mexico, Geospatial and Population Studies,
Motorcycle Helmet Use and Crash Trends 10 years after Florida s Helmet Law Change in 2000
 Motorcycle Helmet Use and Crash Trends 10 years after Florida s Helmet Law Change in 2000 *Chanyoung Lee, Ph.D., PTP Meeta Saxena, E.I.T. Pei-Sung Lin, Ph.D., P.E., PTOE Center for Urban Transportation
2014 Community Report Luna County
 4 Luna County Produced for the New Mexico Department of Transportation, Traffic Safety Division, Traffic Records Bureau, Under Contract 58 by the University of New Mexico, Geospatial and Population Studies,
2016 Community Report Torrance County
 6 Torrance County Produced for the New Mexico Department of Transportation, Traffic Safety Division, Traffic Records Bureau, Under Contract 58 by the University of New Mexico, Geospatial and Population
2015 Community Report Torrance County
 5 Torrance County Produced for the New Mexico Department of Transportation, Traffic Safety Division, Traffic Records Bureau, Under Contract 58 by the University of New Mexico, Geospatial and Population
2015 Community Report Grants
 5 Grants Produced for the New Mexico Department of Transportation, Traffic Safety Division, Traffic Records Bureau, Under Contract 58 by the University of New Mexico, Geospatial and Population Studies,
Motorcycle Accident Causation and Identification of Countermeasures in Thailand Summary of Findings - Bangkok
 Motorcycle Accident Causation and Identification of Countermeasures in Thailand Summary of Findings - Bangkok The data obtained from all 723-on scenes, in-depth accident investigation cases reveal several
2016 Community Report De Baca County
 6 De Baca County Produced for the New Mexico Department of Transportation, Traffic Safety Division, Traffic Records Bureau, Under Contract 58 by the University of New Mexico, Geospatial and Population
Wrong Way Driving - Statewide Initiative
 Florida Department of TRANSPORTATION Wrong Way Driving - Statewide Initiative District 7 Safety Summit Traffic Engineering and Operations office January 13, 2015 Overview At the instance of the Secretary,
2008 TOWN OF CASTLE ROCK MOTOR VEHICLE ACCIDENT FACTS
 2008 TOWN OF CASTLE ROCK MOTOR VEHICLE ACCIDENT FACTS 2008 TOWN OF CASTLE ROCK MOTOR VEHICLE ACCIDENT FACTS ACKNOWLEDGEMENTS This report was assembled from data provided by the Castle Rock Police Department
Fred H. Heery, Sr., P.E.
 Fred H. Heery, Sr., P.E. Deputy State Traffic Operations Engineer Florida Department of Transportation Florida Transportation Builders Association Construction Conference March 20-21, 2012 Florida s sunny
2015 Community Report Las Vegas
 5 Las Vegas Produced for the New Mexico Department of Transportation, Traffic Safety Division, Traffic Records Bureau, Under Contract 58 by the University of New Mexico, Geospatial and Population Studies,
2014 Community Report Las Vegas
 4 Las Vegas Produced for the New Mexico Department of Transportation, Traffic Safety Division, Traffic Records Bureau, Under Contract 58 by the University of New Mexico, Geospatial and Population Studies,
2015 Community Report Tularosa
 5 Tularosa Produced for the New Mexico Department of Transportation, Traffic Safety Division, Traffic Records Bureau, Under Contract 58 by the University of New Mexico, Geospatial and Population Studies,
2016 Community Report Santa Fe County
 26 Santa Fe County Produced for the New Mexico Department of Transportation, Traffic Safety Division, Traffic Records Bureau, Under Contract 58 by the University of New Mexico, Geospatial and Population
2014 Community Report Tularosa
 4 Tularosa Produced for the New Mexico Department of Transportation, Traffic Safety Division, Traffic Records Bureau, Under Contract 8 by the University of New Mexico, Geospatial and Population Studies,
2016 Community Report San Juan County
 26 San Juan County Produced for the New Mexico Department of Transportation, Traffic Safety Division, Traffic Records Bureau, Under Contract 58 by the University of New Mexico, Geospatial and Population
2015 Community Report San Juan County
 25 San Juan County Produced for the New Mexico Department of Transportation, Traffic Safety Division, Traffic Records Bureau, Under Contract 58 by the University of New Mexico, Geospatial and Population
Target Zero: Underutilized Strategies in Traffic Safety That Work
 Target Zero: Underutilized Strategies in Traffic Safety That Work James C. Fell National Opinion Research Center (NORC) at the University of Chicago, Bethesda, MD Office The Problem In 2015, 35,092 people
2015 Community Report Chaparral
 5 Chaparral Produced for the New Mexico Department of Transportation, Traffic Safety Division, Traffic Records Bureau, Under Contract 58 by the University of New Mexico, Geospatial and Population Studies,
2015 Community Report Doña Ana County
 25 Doña Ana County Produced for the New Mexico Department of Transportation, Traffic Safety Division, Traffic Records Bureau, Under Contract 58 by the University of New Mexico, Geospatial and Population
2016 Community Report Aztec
 Aztec Produced for the New Mexico Department of Transportation, Traffic Safety Division, Traffic Records Bureau, Under Contract 58 by the University of New Mexico, Geospatial and Population Studies, Traffic
2015 Community Report Aztec
 25 Aztec Produced for the New Mexico Department of Transportation, Traffic Safety Division, Traffic Records Bureau, Under Contract 58 by the University of New Mexico, Geospatial and Population Studies,
2014 Community Report Aztec
 Aztec Produced for the New Mexico Department of Transportation, Traffic Safety Division, Traffic Records Bureau, Under Contract 58 by the University of New Mexico, Geospatial and Population Studies, Traffic
2015 Community Report Los Lunas
 25 Los Lunas Produced for the New Mexico Department of Transportation, Traffic Safety Division, Traffic Records Bureau, Under Contract 58 by the University of New Mexico, Geospatial and Population Studies,
briefing notes road safety issues
 briefing notes road safety briefing notes road safety issues Land Transport New Zealand has prepared this road safety issues report. It is based on reported crash data and trends for the 2002 2006 period.
2014 Community Report Los Lunas
 4 Los Lunas Produced for the New Mexico Department of Transportation, Traffic Safety Division, Traffic Records Bureau, Under Contract 58 by the University of New Mexico, Geospatial and Population Studies,
Michigan State Police (MSP) Post 21 - Metro North
 Post 21 - Metro North") June 2018 Revised 8/3/2018 2017 Reporting Criteria Please pay particular attention to the wording when interpreting the three levels of data gathered for this report. Crash The Crash Level analyzes data
June 2018 Revised 8/3/2018 2017 Reporting Criteria Please pay particular attention to the wording when interpreting the three levels of data gathered for this report. Crash The Crash Level analyzes data
Michigan State Police (MSP) Post 21 - Metro North
 Post 21 - Metro North") October 2017 2016 Reporting Criteria Please pay particular attention to the wording when interpreting the three levels of data gathered for this report. Crash The Crash Level analyzes data related to crash
October 2017 2016 Reporting Criteria Please pay particular attention to the wording when interpreting the three levels of data gathered for this report. Crash The Crash Level analyzes data related to crash
Traffic Safety Network Huron Valley
 June 2018 Revised 8/3/2018 2017 Reporting Criteria Please pay particular attention to the wording when interpreting the three levels of data gathered for this report. Crash The Crash Level analyzes data
the Ministry of Transport is attributed as the source of the material images contained in the material are not copied
 Speed 2017 Disclaimer All reasonable endeavours are made to ensure the accuracy of the information in this report. However, the information is provided without warranties of any kind including accuracy,
Act 229 Evaluation Report
 R22-1 W21-19 W21-20 Act 229 Evaluation Report Prepared for Prepared by Table of Contents 1. Documentation Page 3 2. Executive Summary 4 2.1. Purpose 4 2.2. Evaluation Results 4 3. Background 4 4. Approach