INNOVATIONS IN TRAVEL TIME RELIABILITY MONITORING EMPOWERMENT FROM EMERGING TECHNOLOGIES
|
|
|
- John Bridges
- 5 years ago
- Views:
Transcription
1 INNOVATIONS IN TRAVEL TIME RELIABILITY MONITORING EMPOWERMENT FROM EMERGING TECHNOLOGIES Presentation to the: Research and Innovative Technology Administration (RITA) October 19, 2011 George List, PhD, PE North Carolina State University
2 Main Topics The metrics of interest Understanding the data Building the Textbook Creating TT-PDFs Causes and counteractions Predicting travel times Future advances
3 Desired Time of Arrival (DTA) Window Metrics of Interest Destination Location Reliability On-time or not Disutility, risk, and regret Desired Time of Arrival (DTA) Window Origin Time Actual Time of Arrival (ATA) P(late), P(on-time), P(early) Consistency Variance in travel time Disutility Disutility Function On-time independent Actual Time of Arrival Individuals and averages Causal Factors Most important ones Separate or together Differences by percentile


4 4 Understanding the Data Driver behavior Operating plan impacts Trends in time Trends across time Trends by condition Spot rates Space rates Individual vehicles Averages Segments Routes
5 5 Travel Times on Freeways 400 Travel Times Monday Jan Travel Times Thursday Jan 20, :00:00 2:24:00 4:48:00 7:12:00 9:36:00 12:00:00 14:24:00 16:48:00 19:12:00 21:36:00 0:00:00 0 0:00:00 2:24:00 4:48:00 7:12:00 9:36:00 12:00:00 14:24:00 16:48:00 19:12:00 21:36:00 0:00:00
6 Cumulative Probability Cumulative Probability Cumulative Probability TT-CDFs for Freeways 120% CDFs for Transition-to-Peak Travel Rates 100% 80% 60% 40% 20% All Days 13-Jan 20-Jan 22-Jan 24-Jan 0% Travel Rate (sec/mi) CDFs for Off-Peak Travel Rates CDFs for Peak Travel Rates 120% 120% 100% 100% 80% All Days 80% All Days 60% 13-Jan 60% 13-Jan 40% 20-Jan 22-Jan 40% 20-Jan 22-Jan 20% 24-Jan 20% 24-Jan 0% Travel Rate (sec/mi) 0% Travel Rate (sec/mi)
7 Trip Time (min) Travel Times on Arterials Trip Times (6 to 3) / Week of North Multi-day trips NY Shorter trips with stops :00 4:48 9:36 14:24 19:12 0:00 4:48 Time of Observation at 3 Actual travel times
8 CDFs for Arterials (Histograms) 8
9 9 Developing the TT-PDFs State-of-the-Practice State-of-the-Art Processing Steps Average Rate Estimator Average Segment Times TT 1b TT-PDF Inference Segment TT-PDFs TT 2b Incidence Matrix Estimator Segment TT-PDFS and Incidence Matrices TT 3b Route Route TT Simulator TT- PDFs Data Types Volumes/ Occupancies TT 1a Measured Rates TT 2a Measured Segment Travel Times TT 3a Measured Segment and Route Travel Times TT 4a Traffic Data Sources Infrastructure-based Single Loop Dual Loops AVI Some AVL Vehicle-based AVL
10 10 Developing TT-PDFs and TR-PDFs Generating PDFs and Measures of Interest Data Type Enhancement or Type #1 Type #2 Type #3 Type #4 Metric Single Loops Double Loops AVI AVL Passage Times Not applicable Not applicable Use signal strength or Use passage times for bounce-back time Lat/Lon locations Average Spot Rates Spot Rates for Individual Vehicles Average Times or Rates for Segments Segment IV-PDFs Incidence Matrices AVG-PDFs for Segments or Routes IV-PDFs for Routes Use occupancy, flow, and assumed vehicle length Cannot be obtained Combine adjacent sensor spot rates Use average times or rates and IV-PDF typical of the traffic conditoins Base on field studies or similar segment-tosegment flow conditions Add estimated segment or route times or rates Simulation based on IV- PDFs and Coincidence Matrices Directly computed by the sensor Could be obtained Combine adjacent sensor spot rates Use average times or rates and IV-PDF typical of the traffic conditoins Base on field studies or similar segment-tosegment flow conditions Add estimated segment or route times or rates Simulation based on IV- PDFs and Coincidence Matrices Not needed Use signal strength or bounce-back times Determine from adjusted IV-PDFs Adjust the observed IV- PDFs to account for unequipped vehicles Use equipped vehicles on adjacent segments Compute from segment or route IV-PDFs Use equipped vehicles or simulation based on IV- PDFs and Coincidence Matrices Not needed Use GPS speeds at Lat/Lon locations Determine from adjusted IV-PDFs Adjust the observed IV- PDFs to account for unequipped vehicles Use equipped vehicles on adjacent segments Compute from segment or route IV-PDFs Use equipped vehicles or simulation based on IV- PDFs and Coincidence Matrices
11 11 Developing Passage Times Especially for Bluetooth data (Last-First)/2? Max signal strength?
12 Estimating Average Spot Rates Enter Exit 80 Speed Field Sensor Field Sensor 10 0 Bluetooth 0:00:00 2:24:00 4:48:00 7:12:00 9:36:00 12:00:00 14:24:00 16:48:00 19:12:00 21:36:00 0:00:00 Speed Speed Exit Speed Enter
13 Percentage of Values in 50sec Range ( PDF) Percentage of Values in 50sec Range ( PDF) 13 Estimating Spot Rate Distributions Off-Peak Travel Rate PDFs Approximate Peak Travel Rate PDFs 30% 25% 25% 20% 20% All 15% All 15% 13-Jan 13-Jan 10% 20-Jan 22-Jan 24-Jan 10% 20-Jan 22-Jan 24-Jan 5% 5% 0% Travel Rate (sec/mi) 0% Travel Rate (sec/mi)
14 Travel Time (min) Segment Time and Rate PDFs Travel Times Weekdays :00:00 2:24:00 4:48:00 7:12:00 9:36:00 12:00:00 14:24:00 16:48:00 19:12:00 21:36:00 0:00:00 Time of Day 11
15 Percentile (CDF) Percentile (CDF) Percentile (CDF) PDFs for TTs and TRs 120% 100% CDFs by Regime - Weekdays 39 80% TranFrPk 60% Mar15Pk Peak 40% TranToPk Off-Peak 120% 100% TR-CDFs by Regime - Weekdays 20% 0% Trip Time (min) 80% TranFrPk 60% Mar15Pk Peak 9 40% 20% TranToPk Off-Peak 120% CDFs by Regime - Weekdays 0% Trip Rate (min/mi) 100% 80% 10 60% 40% 20% TranFrPk Mar15Pk Peak TranToPk Off-Peak 11 0% Trip Time (min)
16 Trip Time (min) 16 Finding Travel Times in Trip Times 6 5 NY North Trip Times (6 to 3) / Week of Especially for arterials and long freeway segments :00 4:48 9:36 14:24 19:12 0:00 4:48 Time of Observation at 3 This is arterial data
17 17 Finding the Operational Impacts 6 5 North NY This is arterial data Signal control impacts
18 18 Average Times or Rates for Segments Upstream rate Downstream rate Segment Upstream rate Downstream rate Bluetooth data for vehicles Spot rates from field sensors Regression analysis Works for all => works for average Analyze each regime Segment rate Regime adjustment a b ab 2 ab a b (1 ) ab a b
19 Cumulative Probability 19 Fitting the Density Function Segment Transition-to-Peak CDF Four-Parameter Burr Distribution 120% 100% 80% k: a continuous shape parameter (k > 0); α: a second continuous shape parameter (α > 0); β: a continuous scale parameter (β > 0); and γ: a continuous location parameter (unbounded), less than the minimum observed value 60% 40% 20% 0% Time (min) Observed Estimated
20 Average Time and Rate PDFs for Routes Pick starting times Pick a network condition Generate the average rates and times Walk the time-space matrix
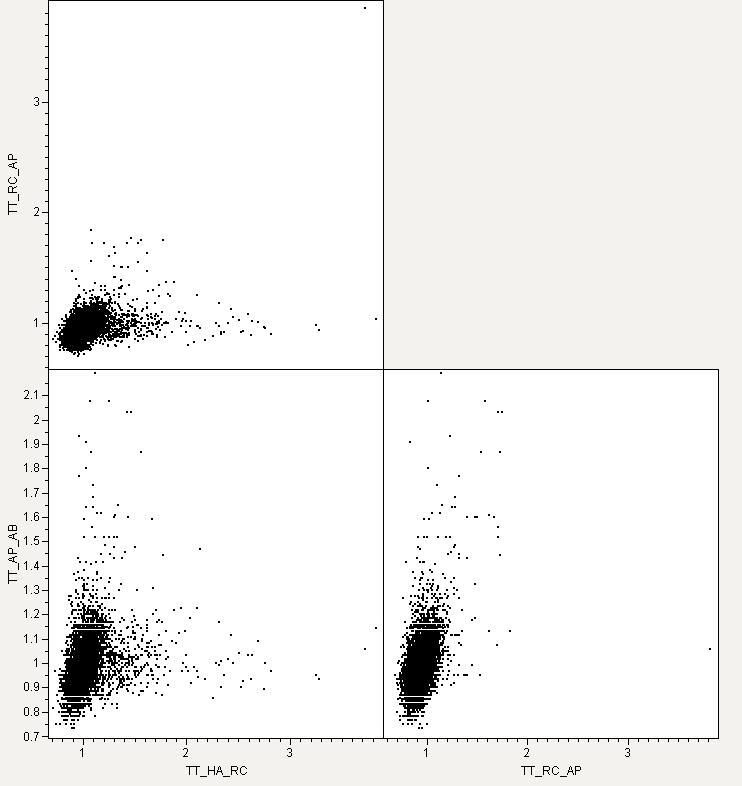

21 Incidence (Correlation) Matrices 21
22 Incidence (Correlation) Matrices In this case, simulated data Segment ab Segment bc τ bc (sec/mi) % 0% 0% 0% 0% 0% 0% 80 0% 0% 0% 0% 0% 0% 0% 100 0% 0% 8% 24% 5% 0% 0% 120 0% 0% 6% 21% 7% 1% 0% 140 0% 0% 1% 7% 2% 0% 0% 160 0% 0% 1% 3% 2% 0% 0% τ ab (sec/mi) 180 0% 0% 1% 2% 1% 0% 0% 200 0% 0% 0% 2% 1% 0% 0% 220 0% 0% 0% 1% 1% 0% 0% 240 0% 0% 0% 1% 1% 0% 0% 260 0% 0% 0% 0% 0% 0% 0% 280 0% 0% 0% 0% 0% 0% 0% 300 0% 0% 0% 0% 0% 0% 0% >300 0% 0% 0% 0% 0% 0% 0%

23 23 Vehicle PDFs for Routes TT-PDFs for segments Incidence matrix for pairwise regimes Monte Carlo simulation

24 24 Finding the Regimes Regimes Peak Off-peak Transition Weather Incidents Special Events Other Akin to signal timing plans
25 Cumulative Probability Travel Time (minutes) Travel Time (minutes) Finding the Regimes (2) Variations in Travel Time by Time of Day during Workdays Travel Time versus VMT for Various Situations Demand Incident Normal Event Weather :00 4:48 9:36 14:24 19:12 0:00 4:48 Time of Day 120% 100% Travel Time CDFs VMT/hr 80% 60% 40% 20% 0% Travel Time (min) Normal Incident Weather All

26 Regimes for a Single Load Condition 26

27 Differences among Load Conditions 27
28 Building the Textbook Fundamental outputs Travel and trip time probability distribution functions (TT-PDFs, TR-PDFs) Individual vehicles or averages Vocabulary Data streams: SPS (Single Point Sensor), AVI, AVL Travel rates: time per distance - minutes/mile - spot and segment Monuments: mid-link locations Segments: monument to monument links Routes: sequences of segments Regimes: different operating conditions different PDFs Time periods: spans of time, e.g., 5 minute time slice, AM peak User groups: travelers of a similar type Use cases: a specific question about travel time reliability TPC segments: contiguous fragmentation of the highway network
29 29 More Thoughts about PDFs AVI: location time stamps ( v, x, y, t E) AVL: bread crumbs / virtual AVI ( v, x, y, t, s, h E) SPS: flow and travel rates for time slices ( x, y, f, r, n, k E) Ways to think about the PDFs f ( t i, c, d, E) or g( t, ) where h( i, c, d, E) t t t t t v vi c E all random variables, or a a a a a v vi c E,
30 30 Considering Signal Timing Impacts t = t v + t c t v = t min 1000 simulated vehicles 4-signal arterial t min = 220 sec Random arrivals at first signal


31 Questions / Thank you
1 On Time Performance
 MEMORANDUM: US 29 Travel Time & OTP To: From: Joana Conklin, Montgomery County DOT James A. Bunch, SWAI Subject: US 29 Travel Time and On Time Performance Analysis Date: This memorandum documents the US
Appendix SAN San Diego, California 2003 Annual Report on Freeway Mobility and Reliability
 (http://mobility.tamu.edu/mmp) Office of Operations, Federal Highway Administration Appendix SAN San Diego, California 2003 Annual Report on Freeway Mobility and Reliability This report is a supplement
Technical Memorandum Analysis Procedures and Mobility Performance Measures 100 Most Congested Texas Road Sections What s New for 2015
 Technical Memorandum Analysis Procedures and Mobility Performance Measures 100 Most Congested Texas Road Sections Prepared by Texas A&M Transportation Institute August 2015 This memo documents the analysis
Online Appendix for Subways, Strikes, and Slowdowns: The Impacts of Public Transit on Traffic Congestion
 Online Appendix for Subways, Strikes, and Slowdowns: The Impacts of Public Transit on Traffic Congestion ByMICHAELL.ANDERSON AI. Mathematical Appendix Distance to nearest bus line: Suppose that bus lines
CITY OF VANCOUVER ADMINISTRATIVE REPORT
 Supports Item No. 1 T&T Committee Agenda May 13, 2008 CITY OF VANCOUVER ADMINISTRATIVE REPORT Report Date: April 29, 2008 Author: Don Klimchuk Phone No.: 604.873.7345 RTS No.: 07283 VanRIMS No.: 13-1400-10
Interstate Operations Study: Fargo-Moorhead Metropolitan Area Simulation Output
 NDSU Dept #2880 PO Box 6050 Fargo, ND 58108-6050 Tel 701-231-8058 Fax 701-231-6265 www.ugpti.org www.atacenter.org Interstate Operations Study: Fargo-Moorhead Metropolitan Area 2015 Simulation Output Technical
Introduction. Traffic data collection. Introduction. Introduction. Traffic stream parameters
 Introduction Traffic data collection Transportation Systems Engineering Outline Point measurement Measurement over a short stretch Measurement over a long stretch Measurement over an area 20080813 Traffic
Development of the Idaho Statewide Travel Demand Model Trip Matrices Using Cell Phone OD Data and Origin Destination Matrix Estimation
 Portland State University PDXScholar TREC Friday Seminar Series Transportation Research and Education Center (TREC) 10-24-2016 Development of the Idaho Statewide Travel Demand Model Trip Matrices Using
Interstate Operations Study: Fargo-Moorhead Metropolitan Area Simulation Results
 NDSU Dept #2880 PO Box 6050 Fargo, ND 58108-6050 Tel 701-231-8058 Fax 701-231-6265 www.ugpti.org www.atacenter.org Interstate Operations Study: Fargo-Moorhead Metropolitan Area 2025 Simulation Results
Performance Measure Summary - Buffalo NY. Performance Measures and Definition of Terms
 Performance Measure Summary - Buffalo NY There are several inventory and performance measures listed in the pages of this Urban Area Report for the years from 1982 to 2014. There is no single performance
August ATR Monthly Report
 August ATR Monthly Report Minnesota Department of Transportation Office of Transportation Data and Analysis August 2011 Introduction The purpose of this report is to examine monthly traffic trends on
Travel Time Savings Memorandum
 04-05-2018 TABLE OF CONTENTS 1 Background 3 Methodology 3 Inputs and Calculation 3 Assumptions 4 Light Rail Transit (LRT) Travel Times 5 Auto Travel Times 5 Bus Travel Times 6 Findings 7 Generalized Cost
FE Review-Transportation-II. D e p a r t m e n t o f C i v i l E n g i n e e r i n g U n i v e r s i t y O f M e m p h i s
 FE Review-Transportation-II D e p a r t m e n t o f C i v i l E n g i n e e r i n g U n i v e r s i t y O f M e m p h i s Learning Objectives Design, compute, and solve FE problems on Freeway level of
Impact of the North South Line Project
 Impact of the North South Line Project Dr. Ties Brands Malvika Dixit 27 th November 2018 1 North-South metro line in Amsterdam 2 Time for a Quiz! kahoot.it 3 Travel time from Centraal Station to Station
Performance Measure Summary - New York-Newark NY-NJ-CT. Performance Measures and Definition of Terms
 Performance Measure Summary - New York-Newark NY-NJ-CT There are several inventory and performance measures listed in the pages of this Urban Area Report for the years from 1982 to 2014. There is no single
Trip Generation Study: Provo Assisted Living Facility Land Use Code: 254
 Trip Generation Study: Provo Assisted Living Facility Land Use Code: 254 Introduction The Brigham Young University Institute of Transportation Engineers (BYU ITE) student chapter completed a trip generation
Project Title: Using Truck GPS Data for Freight Performance Analysis in the Twin Cities Metro Area Prepared by: Chen-Fu Liao (PI) Task Due: 9/30/2013
 Task Due: 9/30/2013") MnDOT Contract No. 998 Work Order No.47 213 Project Title: Using Truck GPS Data for Freight Performance Analysis in the Twin Cities Metro Area Prepared by: Chen-Fu Liao (PI) Task Due: 9/3/213 TASK #4:
MnDOT Contract No. 998 Work Order No.47 213 Project Title: Using Truck GPS Data for Freight Performance Analysis in the Twin Cities Metro Area Prepared by: Chen-Fu Liao (PI) Task Due: 9/3/213 TASK #4:
Engineering Dept. Highways & Transportation Engineering
 The University College of Applied Sciences UCAS Engineering Dept. Highways & Transportation Engineering (BENG 4326) Instructors: Dr. Y. R. Sarraj Chapter 4 Traffic Engineering Studies Reference: Traffic
Introduction and Background Study Purpose
 Introduction and Background The Brent Spence Bridge on I-71/75 across the Ohio River is arguably the single most important piece of transportation infrastructure the Ohio-Kentucky-Indiana (OKI) region.
APPENDIX C ROADWAY BEFORE-AND-AFTER STUDY
 APPENDIX C ROADWAY BEFORE-AND-AFTER STUDY The benefits to pedestrians and bus patrons are numerous when a bus bay is replaced with a bus bulb. Buses should operate more efficiently at the stop when not
An Innovative Approach
 Traffic Flow Theory and its Applications in Urban Environments An Innovative Approach Presented by Dr. Jin Cao 30.01.18 1 Traffic issues in urban environments Pedestrian 30.01.18 Safety Environment 2 Traffic
EXECUTIVE SUMMARY. The following is an outline of the traffic analysis performed by Hales Engineering for the traffic conditions of this project.
 EXECUTIVE SUMMARY This study addresses the traffic impacts associated with the proposed Shopko redevelopment located in Sugarhouse, Utah. The Shopko redevelopment project is located between 1300 East and
The major roadways in the study area are State Route 166 and State Route 33, which are shown on Figure 1-1 and described below:
 3.5 TRAFFIC AND CIRCULATION 3.5.1 Existing Conditions 3.5.1.1 Street Network DRAFT ENVIRONMENTAL IMPACT REPORT The major roadways in the study area are State Route 166 and State Route 33, which are shown
Median Barriers in North Carolina -- Long Term Evaluation. Safety Evaluation Group Traffic Safety Systems Management Section
 Median Barriers in North Carolina -- Long Term Evaluation Safety Evaluation Group Traffic Safety Systems Management Section Background In 1998 North Carolina began a three pronged approach to prevent and
8.2 ROUTE CHOICE BEHAVIOUR:
 8.2 ROUTE CHOICE BEHAVIOUR: The most fundamental element of any traffic assignment is to select a criterion which explains the choice by driver of one route between an origin-destination pair from among
In-vehicle monitoring system (IVMS) data: An examination of patterns of risky driving behavior Kyla Retzer, NIOSH Gregory Kushnir, Cartasite
 data: An examination of patterns of risky driving behavior Kyla Retzer, NIOSH Gregory Kushnir, Cartasite") In-vehicle monitoring system (IVMS) data: An examination of patterns of risky driving behavior Kyla Retzer, NIOSH Gregory Kushnir, Cartasite Disclaimer The findings and conclusions in this report are those
In-vehicle monitoring system (IVMS) data: An examination of patterns of risky driving behavior Kyla Retzer, NIOSH Gregory Kushnir, Cartasite Disclaimer The findings and conclusions in this report are those
MEMORANDUM. Figure 1. Roundabout Interchange under Alternative D
 MEMORANDUM Date: To: Liz Diamond, Dokken Engineering From: Subject: Dave Stanek, Fehr & Peers Western Placerville Interchanges 2045 Analysis RS08-2639 Fehr & Peers has completed a transportation analysis
Real-time Bus Tracking using CrowdSourcing
 Real-time Bus Tracking using CrowdSourcing R & D Project Report Submitted in partial fulfillment of the requirements for the degree of Master of Technology by Deepali Mittal 153050016 under the guidance
HALTON REGION SUB-MODEL
 WORKING DRAFT GTA P.M. PEAK MODEL Version 2.0 And HALTON REGION SUB-MODEL Documentation & Users' Guide Prepared by Peter Dalton July 2001 Contents 1.0 P.M. Peak Period Model for the GTA... 4 Table 1 -
Reliability-Based Bridge Load Posting
 Reliability-Based Bridge Load Posting The LRFR Approach 2013 Louisiana Transportation conference February 17-20, 2013 Lubin Gao, Ph.D., P.E. Senior Bridge Engineer Load Rating Office of Bridge Technology
Performance Measure Summary - Large Area Sum. Performance Measures and Definition of Terms
 Performance Measure Summary - Large Area Sum There are several inventory and performance measures listed in the pages of this Urban Area Report for the years from 1982 to 2014. There is no single performance
Performance Measure Summary - Medium Area Sum. Performance Measures and Definition of Terms
 Performance Measure Summary - Medium Area Sum There are several inventory and performance measures listed in the pages of this Urban Area Report for the years from 1982 to 2014. There is no single performance
Conventional Approach
 Session 6 Jack Broz, PE, HR Green May 5-7, 2010 Conventional Approach Classification required by Federal law General Categories: Arterial Collector Local 6-1 Functional Classifications Changing Road Classification
Metropolitan Freeway System 2013 Congestion Report
 Metropolitan Freeway System 2013 Congestion Report Metro District Office of Operations and Maintenance Regional Transportation Management Center May 2014 Table of Contents PURPOSE AND NEED... 1 INTRODUCTION...
Enhancing a Vehicle Re-Identification Methodology based on WIM Data to Minimize the Need for Ground Truth Data
 Enhancing a Vehicle Re-Identification Methodology based on WIM Data to Minimize the Need for Ground Truth Data Andrew P. Nichols, PhD, PE Director of ITS, Rahall Transportation Institute Associate Professor,
Performance Measures and Definition of Terms
 Performance Measure Summary - All 471 Areas Sum There are several inventory and performance measures listed in the pages of this Urban Area Report for the years from 1982 to 2014. There is no single performance
R.M.N.T. Sirisoma a Doug Morgan b S.C. Wirasinghe a
 R.M.N.T. Sirisoma a Doug Morgan b S.C. Wirasinghe a a Dept. of Civil Engineering, Schulich School of Engineering, University of Calgary b Calgary Transit, Calgary, Canada Introduction Study Area Availability
Performance Measure Summary - Austin TX. Performance Measures and Definition of Terms
 Performance Measure Summary - Austin TX There are several inventory and performance measures listed in the pages of this Urban Area Report for the years from 1982 to 2014. There is no single performance
Performance Measure Summary - Pittsburgh PA. Performance Measures and Definition of Terms
 Performance Measure Summary - Pittsburgh PA There are several inventory and performance measures listed in the pages of this Urban Area Report for the years from 1982 to 2014. There is no single performance
Performance Measure Summary - New Orleans LA. Performance Measures and Definition of Terms
 Performance Measure Summary - New Orleans LA There are several inventory and performance measures listed in the pages of this Urban Area Report for the years from 1982 to 2014. There is no single performance
Performance Measure Summary - Portland OR-WA. Performance Measures and Definition of Terms
 Performance Measure Summary - Portland OR-WA There are several inventory and performance measures listed in the pages of this Urban Area Report for the years from 1982 to 2014. There is no single performance
Performance Measure Summary - Oklahoma City OK. Performance Measures and Definition of Terms
 Performance Measure Summary - Oklahoma City OK There are several inventory and performance measures listed in the pages of this Urban Area Report for the years from 1982 to 2014. There is no single performance
Performance Measure Summary - Seattle WA. Performance Measures and Definition of Terms
 Performance Measure Summary - Seattle WA There are several inventory and performance measures listed in the pages of this Urban Area Report for the years from 1982 to 2014. There is no single performance
Performance Measure Summary - Fresno CA. Performance Measures and Definition of Terms
 Performance Measure Summary - Fresno CA There are several inventory and performance measures listed in the pages of this Urban Area Report for the years from 1982 to 2014. There is no single performance
Performance Measure Summary - Hartford CT. Performance Measures and Definition of Terms
 Performance Measure Summary - Hartford CT There are several inventory and performance measures listed in the pages of this Urban Area Report for the years from 1982 to 2014. There is no single performance
Performance Measure Summary - Boise ID. Performance Measures and Definition of Terms
 Performance Measure Summary - Boise ID There are several inventory and performance measures listed in the pages of this Urban Area Report for the years from 1982 to 2014. There is no single performance
Performance Measure Summary - Tucson AZ. Performance Measures and Definition of Terms
 Performance Measure Summary - Tucson AZ There are several inventory and performance measures listed in the pages of this Urban Area Report for the years from 1982 to 2014. There is no single performance
Performance Measure Summary - Wichita KS. Performance Measures and Definition of Terms
 Performance Measure Summary - Wichita KS There are several inventory and performance measures listed in the pages of this Urban Area Report for the years from 1982 to 2014. There is no single performance
Performance Measure Summary - Spokane WA. Performance Measures and Definition of Terms
 Performance Measure Summary - Spokane WA There are several inventory and performance measures listed in the pages of this Urban Area Report for the years from 1982 to 2014. There is no single performance
Craig Scheffler, P.E., PTOE HNTB North Carolina, P.C. HNTB Project File: Subject
 TECHNICAL MEMORANDUM To Kumar Neppalli Traffic Engineering Manager Town of Chapel Hill From Craig Scheffler, P.E., PTOE HNTB North Carolina, P.C. Cc HNTB Project File: 38435 Subject Obey Creek TIS 2022
Abstract. Executive Summary. Emily Rogers Jean Wang ORF 467 Final Report-Middlesex County
 Emily Rogers Jean Wang ORF 467 Final Report-Middlesex County Abstract The purpose of this investigation is to model the demand for an ataxi system in Middlesex County. Given transportation statistics for
Performance Measure Summary - Grand Rapids MI. Performance Measures and Definition of Terms
 Performance Measure Summary - Grand Rapids MI There are several inventory and performance measures listed in the pages of this Urban Area Report for the years from 1982 to 2014. There is no single performance
Trip Generation and Parking Study New Californian Apartments, Berkeley
 Trip Generation and Parking Study New Californian Apartments, Berkeley Institute of Transportation Engineers University of California, Berkeley Student Chapter Spring 2012 Background The ITE Student Chapter
Opportunities to Leverage Advances in Driverless Car Technology to Evolve Conventional Bus Transit Systems
 Opportunities to Leverage Advances in Driverless Car Technology to Evolve Conventional Bus Transit Systems Podcar City 7 Symposium Emerging Transportation Technologies R&D George Mason University, October
Performance Measure Summary - Washington DC-VA-MD. Performance Measures and Definition of Terms
 Performance Measure Summary - Washington DC-VA-MD There are several inventory and performance measures listed in the pages of this Urban Area Report for the years from 1982 to 2014. There is no single
Performance Measure Summary - Charlotte NC-SC. Performance Measures and Definition of Terms
 Performance Measure Summary - Charlotte NC-SC There are several inventory and performance measures listed in the pages of this Urban Area Report for the years from 1982 to 2014. There is no single performance
A Review on Cooperative Adaptive Cruise Control (CACC) Systems: Architectures, Controls, and Applications
 Systems: Architectures, Controls, and Applications") A Review on Cooperative Adaptive Cruise Control (CACC) Systems: Architectures, Controls, and Applications Ziran Wang (presenter), Guoyuan Wu, and Matthew J. Barth University of California, Riverside Nov.
A Review on Cooperative Adaptive Cruise Control (CACC) Systems: Architectures, Controls, and Applications Ziran Wang (presenter), Guoyuan Wu, and Matthew J. Barth University of California, Riverside Nov.
Performance Measure Summary - Toledo OH-MI. Performance Measures and Definition of Terms
 Performance Measure Summary - Toledo OH-MI There are several inventory and performance measures listed in the pages of this Urban Area Report for the years from 1982 to 2014. There is no single performance
Performance Measure Summary - Pensacola FL-AL. Performance Measures and Definition of Terms
 Performance Measure Summary - Pensacola FL-AL There are several inventory and performance measures listed in the pages of this Urban Area Report for the years from 1982 to 2014. There is no single performance
2016 Congestion Report
 2016 Congestion Report Metropolitan Freeway System May 2017 2016 Congestion Report 1 Table of Contents Purpose and Need...3 Introduction...3 Methodology...4 2016 Results...5 Explanation of Percentage Miles
Performance Measure Summary - Omaha NE-IA. Performance Measures and Definition of Terms
 Performance Measure Summary - Omaha NE-IA There are several inventory and performance measures listed in the pages of this Urban Area Report for the years from 1982 to 2014. There is no single performance
Travel Demand Modeling at NCTCOG
 Travel Demand Modeling at NCTCOG Arash Mirzaei North Central Texas Council Of Governments for Southern Methodist University The ASCE Student Chapter October 24, 2005 Contents NCTCOG DFW Regional Model
Performance Measure Summary - Allentown PA-NJ. Performance Measures and Definition of Terms
 Performance Measure Summary - Allentown PA-NJ There are several inventory and performance measures listed in the pages of this Urban Area Report for the years from 1982 to 2014. There is no single performance
Performance Measure Summary - Nashville-Davidson TN. Performance Measures and Definition of Terms
 Performance Measure Summary - Nashville-Davidson TN There are several inventory and performance measures listed in the pages of this Urban Area Report for the years from 1982 to 2014. There is no single
Performance Measure Summary - Corpus Christi TX. Performance Measures and Definition of Terms
 Performance Measure Summary - Corpus Christi TX There are several inventory and performance measures listed in the pages of this Urban Area Report for the years from 1982 to 2014. There is no single performance
Activity-Travel Behavior Impacts of Driverless Cars
 January 12-16, 2014; Washington, D.C. 93 rd Annual Meeting of the Transportation Research Board Activity-Travel Behavior Impacts of Driverless Cars Ram M. Pendyala 1 and Chandra R. Bhat 2 1 School of Sustainable
Performance Measure Summary - Boston MA-NH-RI. Performance Measures and Definition of Terms
 Performance Measure Summary - Boston MA-NH-RI There are several inventory and performance measures listed in the pages of this Urban Area Report for the years from 1982 to 2014. There is no single performance
Performance Measure Summary - El Paso TX-NM. Performance Measures and Definition of Terms
 Performance Measure Summary - El Paso TX-NM There are several inventory and performance measures listed in the pages of this Urban Area Report for the years from 1982 to 2014. There is no single performance
Performance Measure Summary - Minneapolis-St. Paul MN-WI. Performance Measures and Definition of Terms
 Performance Measure Summary - Minneapolis-St. Paul MN-WI There are several inventory and performance measures listed in the pages of this Urban Area Report for the years from 1982 to 2014. There is no
Performance Measure Summary - Louisville-Jefferson County KY-IN. Performance Measures and Definition of Terms
 Performance Measure Summary - Louisville-Jefferson County KY-IN There are several inventory and performance measures listed in the pages of this Urban Area Report for the years from 1982 to 2014. There
Capacity and Level of Service for Highway Segments (I)
") Capacity and Level of Service for Highway Segments (I) 1 Learn how to use the HCM procedures to determine the level of service (LOS) Become familiar with highway design capacity terminology Apply the equations
Capacity and Level of Service for Highway Segments (I) 1 Learn how to use the HCM procedures to determine the level of service (LOS) Become familiar with highway design capacity terminology Apply the equations
Appendix B CTA Transit Data Supporting Documentation
 RED ED-PURPLE BYPASS PROJECT ENVIRONMENTAL ASSESSMENT AND SECTION 4(F) EVALUATION Appendix B CTA Transit Data Supporting Documentation 4( Memorandum Date: May 14, 2015 Subject: Chicago Transit Authority
Traffic Data Services: reporting and data analytics using cellular data
 Make traffic and population movement analysis smart, fast, pervasive and cost-effective. Data sheet Traffic Data Services: reporting and data analytics using cellular data Accurate data collection and
Spatial and Temporal Analysis of Real-World Empirical Fuel Use and Emissions
 Spatial and Temporal Analysis of Real-World Empirical Fuel Use and Emissions Extended Abstract 27-A-285-AWMA H. Christopher Frey, Kaishan Zhang Department of Civil, Construction and Environmental Engineering,
An overview of the on-going OSU instrumented probe vehicle research
 An overview of the on-going OSU instrumented probe vehicle research Benjamin Coifman, PhD Associate Professor The Ohio State University Department of Civil, Environmental, and Geodetic Engineering Department
Acceleration Behavior of Drivers in a Platoon
 University of Iowa Iowa Research Online Driving Assessment Conference 2001 Driving Assessment Conference Aug 1th, :00 AM Acceleration Behavior of Drivers in a Platoon Ghulam H. Bham University of Illinois
Investigation of Alternative Work Zone Merging Sign Configurations
 Report # MATC-MU: 176 Final Report 25-1121-0003-176 Investigation of Alternative Work Zone Merging Sign Configurations Praveen Edara, Ph.D., P.E., PTOE Associate Professor Department of Civil Engineering
TEXAS CITY PARK & RIDE RIDERSHIP ANALYSIS
 TEXAS CITY PARK & RIDE RIDERSHIP ANALYSIS This document reviews the methodologies and tools used to calculate the projected ridership and parking space needs from the proposed Texas City Park & Ride to
May ATR Monthly Report
 May ATR Monthly Report Minnesota Department of Transportation Office of Transportation Data and Analysis May 2011 Introduction The purpose of this report is to examine monthly traffic trends on Minnesota
I-95 Corridor Coalition. I-95 Corridor Coalition Vehicle Probe Project: Validation of INRIX Data Monthly Report Virginia
 I-95 Corridor Coalition I-95 Corridor Coalition Vehicle Probe Project: Validation of INRIX Data Monthly Report Virginia February 2010 I-95 CORRIDOR COALITION VEHICLE PROBE PROJECT: VALIDATION OF INRIX
DEVELOPMENT OF RIDERSHIP FORECASTS FOR THE SAN BERNARDINO INFRASTRUCTURE IMPROVEMENT STUDY
 APPENDIX 1 DEVELOPMENT OF RIDERSHIP FORECASTS FOR THE SAN BERNARDINO INFRASTRUCTURE IMPROVEMENT STUDY INTRODUCTION: This Appendix presents a general description of the analysis method used in forecasting
Using "Big Data" for Transportation Analysis: A Case Study of the LA Metro Expo Line
 Portland State University PDXScholar TREC Friday Seminar Series Transportation Research and Education Center (TREC) 10-3-2014 Using "Big Data" for Transportation Analysis: A Case Study of the LA Metro
Analyzing Crash Risk Using Automatic Traffic Recorder Speed Data
 Analyzing Crash Risk Using Automatic Traffic Recorder Speed Data Thomas B. Stout Center for Transportation Research and Education Iowa State University 2901 S. Loop Drive Ames, IA 50010 stouttom@iastate.edu
microscopic activity based travel demand modelling in large scale simulations The application of
 The application of microscopic activity based travel demand modelling in large scale simulations Georg Hertkorn, Peter Wagner georg.hertkorn@dlr.de, peter.wagner@dlr.de German Aerospace Centre Deutsches
Reliability of Hybrid Vehicle System
 Reliability of Hybrid Vehicle System 2004 Toyota Prius hybrid vehicle Department of Industrial and Manufacturing Systems Engineering Iowa State University December 13, 2016 1 Hybrid Vehicles 2 Motivation
Facts and Figures. October 2006 List Release Special Edition BWC National Benefits and Related Facts October, 2006 (Previous Versions Obsolete)
") Facts and Figures Date October 2006 List Release Special Edition BWC National Benefits and Related Facts October, 2006 (Previous Versions Obsolete) Best Workplaces for Commuters - Environmental and Energy
Facts and Figures Date October 2006 List Release Special Edition BWC National Benefits and Related Facts October, 2006 (Previous Versions Obsolete) Best Workplaces for Commuters - Environmental and Energy
TRAVEL DEMAND FORECASTS
 Jiangxi Ji an Sustainable Urban Transport Project (RRP PRC 45022) TRAVEL DEMAND FORECASTS A. Introduction 1. The purpose of the travel demand forecasts is to assess the impact of the project components
Written Exam Public Transport + Answers
 Faculty of Engineering Technology Written Exam Public Transport + Written Exam Public Transport (195421200-1A) Teacher van Zuilekom Course code 195421200 Date and time 7-11-2011, 8:45-12:15 Location OH116
Fleet Penetration of Automated Vehicles: A Microsimulation Analysis
 Fleet Penetration of Automated Vehicles: A Microsimulation Analysis Corresponding Author: Elliot Huang, P.E. Co-Authors: David Stanek, P.E. Allen Wang 2017 ITE Western District Annual Meeting San Diego,
Meeting product specifications
 Optimisation of a diesel hydrotreating unit A model based on operating data is used to meet sulphur product specifications at lower DHT reactor temperatures with longer catalyst life Jose Bird Valero Energy
I-95 Corridor Coalition Vehicle Probe Project: HERE, INRIX and TOMTOM Data Validation. Report for North Carolina (#08) I-240, I-40 and I-26
 I-240, I-40 and I-26") I-95 Corridor Coalition Vehicle Probe Project: HERE, INRIX and TOMTOM Data Validation Report for North Carolina (#08) I-240, I-40 and I-26 Prepared by: Masoud Hamedi, Sanaz Aliari University of Maryland,
I-95 Corridor Coalition Vehicle Probe Project: HERE, INRIX and TOMTOM Data Validation Report for North Carolina (#08) I-240, I-40 and I-26 Prepared by: Masoud Hamedi, Sanaz Aliari University of Maryland,
DEVELOPMENT PROPERTY 1627 MAXIME STREET CITY OF OTTAWA TRANSPORTATION OVERVIEW. Prepared for: Subhas Bhargava. July 9, Overview_1.
 DEVELOPMENT PROPERTY 1627 MAXIME STREET CITY OF OTTAWA TRANSPORTATION OVERVIEW Prepared for: Subhas Bhargava July 9, 2015 115-620 Overview_1.doc D. J. Halpenny & Associates Ltd. Consulting Transportation
Trip Generation and Parking Utilization Data Collection at Mini-Mart with Gas Station
 Trip Generation and Parking Utilization Data Collection at Mini-Mart with Gas Station Final Report 2013 ITE District 6 - Data Collection Project Institute of Transportation Engineers Student Chapter at
Prediction Model of Driving Behavior Based on Traffic Conditions and Driver Types
 Proceedings of the 12th International IEEE Conference on Intelligent Transportation Systems, St. Louis, MO, USA, October 3-7, 29 WeAT4.2 Prediction Model of Driving Behavior Based on Traffic Conditions
What is ELToD and Why Use it? Toll Choice Key Concepts. ELToD Applications. SW 10 th Street. ELToD Future Enhancements
 June 16, 2017 What is ELToD and Why Use it? Toll Choice Key Concepts ELToD Applications SW 10 th Street ELToD Future Enhancements 2 ELToD (Express Lanes Time of Day) Model is a traffic assignment model
Geometric Design Elements to Reduce Wrong-Way (WW) Entry at Freeway Interchanges Hugo Zhou, Ph.D., P.E.
 Entry at Freeway Interchanges Hugo Zhou, Ph.D., P.E.") Geometric Design Elements to Reduce Wrong-Way (WW) Entry at Freeway Interchanges Hugo Zhou, Ph.D., P.E. Department of Civil Engineering Auburn University March, 2017 Why People Drive Wrong-way? WW Entry:
Geometric Design Elements to Reduce Wrong-Way (WW) Entry at Freeway Interchanges Hugo Zhou, Ph.D., P.E. Department of Civil Engineering Auburn University March, 2017 Why People Drive Wrong-way? WW Entry:
USES OF ANPR DATA IN TRAFFIC MANAGEMENT AND TRANSPORT MODELLING ABSTRACT
 USES OF ANPR DATA IN TRAFFIC MANAGEMENT AND TRANSPORT MODELLING A ROBINSON and A VAN NIEKERK* Hatch Goba (Pty) Ltd, Private Bag X20, Gallo Manor Tel: 011-239-5614; Email: robinsona@hatch.co.za *South African
Act 229 Evaluation Report
 R22-1 W21-19 W21-20 Act 229 Evaluation Report Prepared for Prepared by Table of Contents 1. Documentation Page 3 2. Executive Summary 4 2.1. Purpose 4 2.2. Evaluation Results 4 3. Background 4 4. Approach
Reallocation of Empty PRT Vehicles en Route
 I. Andréasson 1 Reallocation of Empty PRT Vehicles en Route Dr. Ingmar Andréasson, LogistikCentrum, Taljegardsgatan 11, SE-431 53 Molndal Phone: +46 31 877724, Fax: +46 31 279442, E-mail: ingmar@logistikcentrum.se
Step on It: Driving Behavior and Vehicle Fuel Economy
 Step on It: Driving Behavior and Vehicle Fuel Economy Ashley Langer and Shaun McRae University of Arizona and University of Michigan November 1, 2014 How do we decrease gasoline use? Drive more efficient