C-BOA Tool. Comparison of Peak Demand Savings Estimation Methods. February 7, of 14
|
|
|
- Marilyn Hoover
- 5 years ago
- Views:
Transcription

1 C-BOA Tool Comparison of Peak Demand Savings Estimation Methods February 7, of 14
2 Table of Contents Summary... 3 Recommendation... 3 DEER Periods... 4 Comparison of Estimated Demand Savings... 4 Appendix A - Detailed Results... 8 Air Handler ECMs... 8 Chiller Plant ECMs... 9 Appendix B Sample Building Characteristics Baseline Inputs ECM Inputs of 14
3 Summary This report summarizes how the new C-BOA Tool (Custom Building Optimization Analysis Tool) calculates annual peak demand savings, and shows how those savings compare to savings estimated for the DEER peak demand period. The result will help California utilities determine how the C-BOA Tool is used to report estimated peak demand savings as part of utility retrocommissioning programs in California. The C-BOA Tool estimates annual peak demand savings as the calculated demand savings at the highest outside air temperature (OAT) from TMY weather data 1 for a given climate zone and schedule. This matches the methodology currently used by commissioning providers in many of California s utility retrocommissioning programs. When providers use the bin temperature method to calculate the estimated demand savings related to implementing ECMs, they select the demand savings at the highest bin temperature for program reporting of peak demand. This approach is slightly different from the DEER 28 definition of peak demand, but during development of C-BOA it was judged to be a reasonable approximation. The DEER 28 peak demand periods occur at high OATs. To quantitatively assess the reasonableness of the C-BOA Tool s approximation of peak demand, we have compared annual peak demand savings calculated by two methods: 1) Using the C-BOA Tool but limiting the timeframe of the analysis to only the DEER 28 peak demand periods, and 2) Using the C- BOA Tool s default of peak outside air temperatures selected from the full TMY. The two methods were applied to a sample building with each of the nine energy conservation measures (ECMs) included in the tool. The analysis found that the DEER period demand savings are reasonably close to the peak temperature demand savings, only slightly greater. This variation is probably due to the fact that the OATs in the DEER periods are lower than the peak OATs, and the demand savings for these ECMs decreases with increasing OAT. Recommendation Based on the results of this analysis, which are detailed in the body of this report, we recommend that the estimated annual demand savings as calculated and reported by the C-BOA Tool, which is based on peak OATs, be allowed for use in reporting estimated ECM peak demand savings as part of utility retrocommissioning programs in California, except for climate zone 1 (see discussion in following paragraph regarding climate zone 1). The reported peak demand savings may be slightly conservative (low), since the analysis presented in this report found that the peak temperature demand savings values are lower than the DEER period demand savings. At this time, the C-BOA Tool is complete and ready for release by industry practitioners. Since this analysis shows that the estimated demand savings using the two methods are reasonably close, we recommend allowing use of the tool for calculating estimated peak demand savings. Perhaps a future version of the tool could directly calculate the estimated DEER demand period savings, based on the 8,76 weather data. However, this would not necessary be an improvement, as the DEER peak demand period itself is only an approximation of the system peak load that is approved for planning purposes. The analysis showed a large variation in the DEER demand savings and the peak temperature demand savings for climate zone 1, likely due to the significant temperature difference between the DEER period OATs and the peak OAT for climate zone 1 included in the TMY3 data set. We recommend that providers use an alternate method for calculating the estimated demand savings in climate zone 1. We don t expect this to have a significant impact on the current retrocommissioning programs, though, as climate zone 1, which is the coastal area north of the Bay Area, represents an area with relatively few medium to large commercial buildings. 1 Typical meteorological year weather data available from NREL. 3 of 14

4 DEER Periods For reporting peak demand savings, utility energy efficiency programs in California use the peak demand periods defined in DEER In DEER 28, these periods are defined as follows: The DEER demand period is from 2p.m. to 5p.m. on the days listed [in Table 1] for each climate zone. Demand values are calculated as the average hourly energy reduction during this nine-hour period. This is different from the DEER 25 definition of the peak demand period, which is the hottest 3-day heat wave that does not include weekends and holidays for all building types except educational buildings. Table 1. Peak demand period used for DEER 28 (changes from 25 analysis are highlighted) 2 Comparison of Estimated Demand Savings The C-BOA Tool currently reports the peak demand savings for each ECM as the estimated demand savings at the highest temperature seen in the hourly weather data for that particular climate zone and operating schedule. To compare the estimated DEER peak demand savings with the estimated peak temperature demand savings, a sample building was input into the tool, with sample ECMs. See the baseline building and ECM inputs in Appendix B Sample Building Characteristics. Each ECM in the C-BOA Tool was run for two scenarios for each climate zone: DEER period as the schedule, for calculating the DEER period demand savings. The DEER periods are shown in Table 1 above. The demand savings was calculated by the tool at each of the nine hours in the DEER period, and then those nine values were manually averaged to obtain the DEER period peak demand savings. Monday - Friday 6 am 6 pm as a typical commercial building operating schedule, for calculating the peak temperature demand savings. The peak demand savings is the demand savings at the highest OAT. The results are shown in Figure 1. 2 From 28 DEER Update - Summary of Measure Energy Analysis Revisions, Version for Planning/Reporting. December of 14
5 Figure 1. Demand savings comparison by ECM Overall, the peak demand savings for these ECMs are low, since these ECMs have a greater impact on the usage of the system than the peak demand, which is typical for HVAC operational ECMs. For example, the CWST Reset measure for the sample building shows the greatest demand savings, at approximately 2 kw. However, this is only 3% of the peak HVAC system demand of ~63 kw. In 83% of the test instances, the estimated DEER peak demand savings is slightly more than the estimated peak temperature demand savings. For the instances where the peak temperature demand savings was greater than the DEER peak demand savings, most of these were in the SAT Reset ECM, which has only a slight estimated demand impact. The DEER savings are greater than the peak temperature savings since the DEER OATs are lower than the peak OATs, and for all ECMs except SAT Reset there s greater demand savings at part load / mild temp conditions, not peak load / peak temp conditions. See Table 2 below for a comparison of OATs seen in the DEER demand periods and the peak OATs in the TMY3 data. Figure 2 compares the estimated savings values by climate zone. Positive values indicate that the DEER period demand savings are greater than the peak temperature demand savings. 5 of 14
6 Figure 2. Demand savings comparison by climate zone As shown in Figure 2, the DEER savings are only slightly greater than the peak temperature savings except for climate zone 1. Overall, the demand savings is low since these ECMs have a greater impact on demand at milder climate conditions. The peak demand of the HVAC system as modeled by the C- BOA Tool is 635 kw. Climate zone 1 shows a large difference between the estimated DEER demand savings and the estimated peak temperature demand savings, which is why we are recommending that the tool not be used for estimating the peak demand savings for projects in climate zone 1. This large difference is likely due to the large OAT difference between the 8,76 peak OAT and the OATs during the DEER period see Table 2Error! Reference source not found.. For most commercial buildings in California, electric demand increases with increasing OAT. Therefore, OAT can be used as an indicator of electric demand the higher the OAT, the higher the electric demand. Table 2 compares the OATs in the DEER demand periods with the peak OAT for each climate zone. The right hand column shows the difference between the two. In all cases, the DEER OATs are less than the peak OAT. For some climate zones, such as climate zone 1, the difference is quite large. DEER 28 revised this definition, and as Table 2 shows, the DEER 28 periods do not necessarily include the hottest time of the year, based on TMY3 data. 6 of 14
7 CZ Zip Code Representative city Peak Temp, F From DEER Start Date of 3-day period Max Temp, F From 8,76 data Date of max temp Average temp during ninehour DEER period, F Difference between Max Temp and Average DEER Temp, F CZ Arcata 8 Sep 3 8 Oct 1, 1 pm CZ Santa Rosa 99 Jul July 22, 2 pm 96 3 CZ Oakland 89 Jul Sept 28, 2 pm 81 1 CZ4 944 Sunnyvale 97 Jul July 18, 2 pm 89 8 CZ Santa Maria 93 Sep 3 93 Sept 4, 1 pm 83 1 CZ Los Angeles 85 Jul 9 89 Sept 24, 11 am 79 1 CZ San Diego 92 Sep 9 92 Sept 11, 2 pm CZ El Toro 98 Sep Sept 24, 1 pm 92 6 CZ9 921 Pasadena 11 Aug 6 12 Sept 24, 2 pm 93 9 CZ Riverside 14 Jul 8 14 July 1, 2 pm 11 3 CZ Red Bluff 14 Jul July 14, 2 pm 99 6 CZ Sacramento 13 Aug 5 13 August 6, 3pm 11 2 CZ Fresno 16 Aug Aaugust 15, 4 pm 14 2 CZ China Lake 16 Jul 9 16 July 1, 2 pm 14 2 CZ El Centro 114 Jul July 9, 3 pm 11 5 CZ Mount Shasta 96 Aug 6 96 August 6, 4 pm 93 3 Table 2. Comparison of DEER period temperatures and peak temperatures 7 of 14
8 Appendix A - Detailed Results The results of the individual runs are presented in this section. Where bars are not shown in the charts for certain scenarios, this means the estimated peak demand savings for that scenario is kw. Air Handler ECMs Peak Demand Savings, kw DEER Economizer Peak Temp Economizer Peak Demand Savings, kw DEER SAT Reset Peak Temp SAT Reset Peak Demand Savings, kw DEER DSP Reset Peak Temp DSP Reset 8 of 14
9 Peak Demand Savings, kw DEER SF VFD Peak Temp SF VFD Peak Demand Savings, kw DEER RF VFD Peak Temp RF VFD Chiller Plant ECMs Peak Demand Savings, kw DEER CHW pump VFD Peak Temp CHW pump VFD 9 of 14
10 Peak Demand Savings, kw DEER CHWST Reset Peak Temp CHWST Reset Peak Demand Savings, kw DEER CWST Reset Peak Temp CWST Reset Peak Demand Savings, kw DEER CT Fan VFD Peak Temp CT Fan VFD 1 of 14
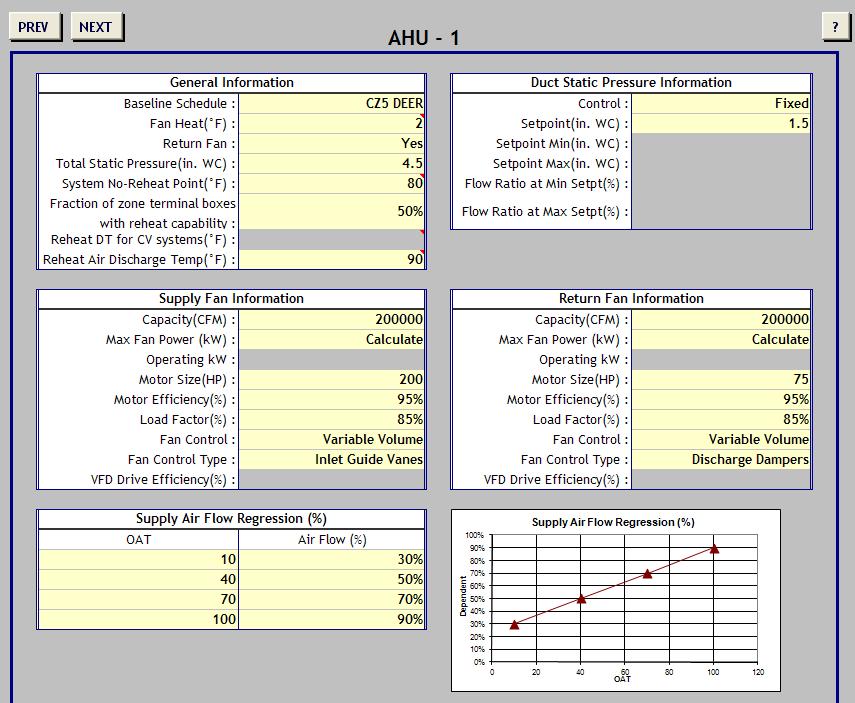
11 Appendix B Sample Building Characteristics Baseline Inputs General Component Value Units Source Area, sf 2, sf Input AHU - Scratch pad for inputs Component Value Units Source SF design airflow 1 cfm/sf Estimate SF design airflow 2, cfm Input, calculated SF TSP 4.5 in H2O Input SF motor eff 95% Input SF motor load 85% Input SF design eff 8% Estimate SF design BHP 177. HP Calculated SF nameplate HP 2 HP Input, based on BHP RF design airflow 2, cfm Input RF TSP 1 in H2O Estimate RF design eff 6% Estimate RF design BHP 52.4 HP Calculated RF nameplate HP 75 HP Input, based on BHP RF motor eff 95% Input RF motor load 85% Input Cooling plant - Scratch pad for inputs Component Value Units Source CHW pump design flow 1,5 gpm Input CHW pump design head 8 ft Input CHW pump design eff 7% Input CHW pump BHP 43.3 HP Calculated CHW pump nameplate 5 HP Input CHW pump motor eff 95% Input CW pump design flow 1,7 gpm Input CW pump design head 4 ft Input CW pump design eff 7% Input CW pump BHP 24.5 HP Calculated CW pump nameplate 3 HP Input CT fan kw input 2 kw Input, based on estimate of.35 kw/ton. 11 of 14

12 12 of 14
.")

13 Climate Zone 1 s inputs are slightly different, due to the milder climate (max 8F temperature). For Climate Zone 1: 7F system no-reheat point Change OATs in SA flow regression to 1/33/57/8 Change OATS in SAT and RAT regressions to 1/38/52/8 13 of 14
14 ECM Inputs ECM Economizer SAT Reset DSP Reset Test Change OAF from 2% to 1% max OAF, 2% min OAF. Change from 55 to 6 at OAT, 55 at 1 OAT, linear in between. Change baseline SF control from IGV to VFD (8% efficient). Change DSPSP from constant 1.5" to reset between.5" (3% flow) and 1" (9% flow). SF VFD RF VFD CHW pump VFD CHWST reset Change SF control from IGVs to VFD. 8% VFD efficiency. Change RF control from DD to VFD. 8% VFD efficiency. Add VFD to pump. 8% efficiency. 2' setpoint. Reset CHWST from 44F (9 OAT) to 54F (33 OAT). CZ1: Reset CHWST from 44F (8 OAT) to 54F (4 OAT). CWST reset Lower CWST from 85F to 75F. CT fan VFD Add VFD to CT fan. 8% VFD efficiency. 14 of 14
Meter Insights for Downtown Store
 Meter Insights for Downtown Store Commodity: Analysis Period: Prepared for: Report Date: Electricity 1 December 2013-31 December 2014 Arlington Mills 12 February 2015 Electricity use over the analysis
February 2012 Caltrain Annual Passenger Counts Key Findings
 February 2012 Caltrain Annual Passenger Counts Key Findings Key Findings February 2012 Caltrain Annual Passenger Counts The 2012 annual Caltrain passenger counts, which were conducted in February 2012,
Water side Economizer WC chiller
 Appendices Water side Economizer WC chiller Power Loading Lighting Load W/ft^2 Area (ft^2) W kw 3.5 48152 168532 Water Cooled Chiller kw/ton 0.7 UA Supply Fan BHP kw wall 1069 58 43 window 3642 roof 295
Key Findings. February 2009 Caltrain Annual Passenger Counts
 Key Findings February 2009 Caltrain Annual Passenger Counts The 2009 annual Caltrain passenger counts, which were conducted starting in late-january and were complete by mid-february, followed the same
February 2011 Caltrain Annual Passenger Counts Key Findings
 February 2011 Caltrain Annual Passenger Counts Key Findings Key Findings February 2011 Caltrain Annual Passenger Counts The 2011 annual Caltrain passenger counts, which were conducted in February 2011,
Motors and Variable Speed Drives for Pumps and Fans. Reid Hart, PE
 Motors and Variable Speed Drives for Pumps and Fans Reid Hart, PE APEM Summer Forum June 2016 Wilsonville, Oregon PNNL-SA-118188 Outline Energy Performance Code Packages Variable speed drives & motors
4 COSTS AND OPERATIONS
 4 COSTS AND OPERATIONS 4.1 INTRODUCTION This chapter summarizes the estimated capital and operations and maintenance (O&M) costs for the Modal and High-Speed Train (HST) Alternatives evaluated in this
Energy Storage in Chicago Lowering Peaks to Reduce Utility Bills
 Energy Storage in Chicago Lowering Peaks to Reduce Utility Bills Evan Berger Director of Energy Solutions, North America Calmac Corp. eberger@calmac.com November 2017 1 Utility Bill Basics 1. There are
JBS Energy, Inc. 311 D Street West Sacramento California, USA tel Prepared by William B. Marcus Greg Ruszovan
 Know Your Customers : A Review of Load Research Data and Economic, Demographic, and Appliance Saturation Characteristics of California Utility Residential Customers Prepared by William B. Marcus Greg Ruszovan
How Much Can a Campus Save on Utility Bills By Turning a 5-Workday Week Into a 4-Workday Week?
 How Much Can a Campus Save on Utility Bills By Turning a 5-Workday Week Into a 4-Workday Week? Jijun Zhou Research Associate Energy System Laboratory Texas A&M University Guanghua Wei, P.E. Assistant Research
2017 Adjusted Count Report February 12, 2018
 A statewide multi-use trail user study and volunteer data collection program 2017 Adjusted Count Report February 12, 2018 The following report includes the final adjusted infrared (IR) counter data at
WIM #41 CSAH 14, MP 14.9 CROOKSTON, MINNESOTA APRIL 2014 MONTHLY REPORT
 WIM #41 CSAH 14, MP 14.9 CROOKSTON, MINNESOTA APRIL 2014 MONTHLY REPORT In order to understand the vehicle classes and groupings, the MnDOT Vehicle Classification Scheme and the Vehicle Classification
Continuous Efficiency Improvement Loop
 Make Data Driven, Continuous Efficiency Improvements as Standard Practice: Technical Loop Lessons Learned & Databases Update Building(s) Benchmarking (Fleet Databases) Energy Use & Performance Deviation
Residential Load Profiles
 Residential Load Profiles TABLE OF CONTENTS PAGE 1 BACKGROUND... 1 2 DATA COLLECTION AND ASSUMPTIONS... 1 3 ANALYSIS AND RESULTS... 2 3.1 Load Profiles... 2 3.2 Calculation of Monthly Electricity Bills...
Effect of DG Installation on Customer Load Shapes
 Effect of DG Installation on Customer Load Shapes P R E S E N T E D T O Westar Energy P R E S E N T E D B Y The Brattle Group J u n e 2 3, 2017 Copyright 2017 The Brattle Group, Inc. Characteristics of
Table of Contents. Attachment 1 Caltrain Service History Attachment 2 Tables and Graphs Caltrain Annual Passenger Counts 1 of 12 Final
 February 2013 Caltrain Annual Passenger Counts Key Finding gs Table of Contents Methodology and Background... 2 Recent Service Changes... 2 Weekday Ridership... 2 Stations... 4 Baby Bullet Stations...
Retro-Commissioning: Energy Hero In Plain Sight. Kevin Gombotz, PE
 Retro-Commissioning: Energy Hero In Plain Sight Kevin Gombotz, PE 10-5-2017 11/10/2017 Copyright Envinity, 2015 1 Kevin Gombotz, PE Envinity Building Energy Solutions Vice President Treasure Hunter 11/10/2017
ELECTRIC VEHICLES TODAY AND TOMORROW Delaware Valley Regional Planning Commission
 ELECTRIC VEHICLES TODAY AND TOMORROW Delaware Valley Regional Planning Commission Monday, November 6, 2017 Gil Tal gtal@ucdavis.edu Wei Ji weiji@ucdavis.edu Tom Turrentine tsturrentine@gmail.com Modeling
Residential Lighting: Shedding Light on the Remaining Savings Potential in California
 Residential Lighting: Shedding Light on the Remaining Savings Potential in California Kathleen Gaffney, KEMA Inc., Oakland, CA Tyler Mahone, KEMA, Inc., Oakland, CA Alissa Johnson, KEMA, Inc., Oakland,
Retro-commissioning for Peak Electric Demand Reduction in New York City. Kim Lenihan , ext.
 Retro-commissioning for Peak Electric Demand Reduction in New York City Kim Lenihan kal@nyserda.org 518-862-1090, ext. 3410 May 3, 2007 System Wide Program Introduction PSC Electric Rate Order requires
Impact Evaluation of 2004 Compressed Air Prescriptive Rebates
 Impact Evaluation of 2004 Compressed Air Prescriptive Rebates May 15, 2006 Prepared for: National Grid USA Service Company P.O. 0000027684 DMI# 05006.520 Prepared by: DMI 450 Lexington Street Newton, MA
PDR Energy Baseline Alternative. Proposal for Discussion October 27, 2015
 PDR Energy Baseline Alternative Proposal for Discussion October 27, 2015 Update Since Last Meeting Since the October 12 th Working Group Meeting Stem, Solar City, AMS and CESA have had over a half-dozen
RESNET San Diego, California February 24, 2003
 RESNET San Diego, California February 24, 2003 Arthur H. Rosenfeld, Commissioner California Energy Commission 1 916 654-4930 ARosenfe@Energy.State.CA.US www.energy.ca.gov California Title 24 Objective
Benefits of a Cooling Tower VFD Retrofit
 Benefits of a Cooling Tower VFD Retrofit Greg Owen Electrical Engineer Ryan Carlson Electrical Engineer 54 th Annual MIPSYCON Conference November 7, 2018 Agenda Project Introduction Project Development
SAN PEDRO BAY PORTS YARD TRACTOR LOAD FACTOR STUDY Addendum
 SAN PEDRO BAY PORTS YARD TRACTOR LOAD FACTOR STUDY Addendum December 2008 Prepared by: Starcrest Consulting Group, LLC P.O. Box 434 Poulsbo, WA 98370 TABLE OF CONTENTS 1.0 EXECUTIVE SUMMARY...2 1.1 Background...2
The impact of electric vehicle development on peak demand and the load curve under different scenarios of EV integration and recharging options
 The impact of electric vehicle development on peak demand and the load curve under different scenarios of EV integration and recharging options Electricity demand in France: a paradigm shift Electricity
Provisional Review of Fatal Collisions. January to December 31 st 2017
 Provisional Review of Fatal Collisions January to December 31 st 17 2 nd January 18 Review of 17 fatal collision statistics as of 31st December 17 Overview This report summarises the main trends in road
Presented by Eric Englert Puget Sound Energy September 11, 2002
 Results from PSE s First Year of Time of Use Program Presented by Eric Englert Puget Sound Energy September 11, 2002 Puget Sound Energy Overview 973,489 Total Electric Customers 908,949 are AMR Capable
Refrigeration Screw Compressor Controller Introduction
 Refrigeration Screw Compressor Controller Introduction Portland, Oregon June 28, 2017 Doug Scott VaCom Technologies Topics New Controller Introduction Suction Group Control VaCom Refrigeration Approach
Appendix SAN San Diego, California 2003 Annual Report on Freeway Mobility and Reliability
 (http://mobility.tamu.edu/mmp) Office of Operations, Federal Highway Administration Appendix SAN San Diego, California 2003 Annual Report on Freeway Mobility and Reliability This report is a supplement
AAFAME Presentation. Shermco Industries Inc. Drives and Automation Application, Sales and Service Manager, Irving Texas.
 AAFAME Presentation Scott D.Holdridge Shermco Industries Inc. Drives and Automation Application, Sales and Service Manager, Irving Texas. 1 What we are going to cover in this Presentation Motor Efficiency-NEMA
Prairie View A&M University Whole Campus Energy Analysis. Final Report. Prairie View A&M University. The Governor's Energy Office
 ESL-TR-91/03-01 Prairie View A&M University Whole Campus Energy Analysis Final Report Requested by: Prairie View A&M University I and The Governor's Energy Office Prepared by: Jeff S. Haberl, Ph.D., P.E.
September 2016 Water Production & Consumption Data
 September 2016 Water Production & Consumption Data September 2016 monthly water production (288.48 AF) was lowest in at least 17 years. Monthly water production has increased slightly each month since
Devin Rauss and Carlos Haiad, Southern California Edison
 What is the Future of Demand Side Management? Studying the Interaction of Energy Efficiency, Demand Response, Energy Storage, Renewables, and Electric Vehicles ABSTRACT Devin Rauss and Carlos Haiad, Southern
C-BOA Tool Validation of Energy Savings Estimation Methods
 C-BOA Tl Validatin f Energy Estimatin Methds February 21, 2012 1 f 7 Table f Cntents Summary... 3 Recmmendatin... 3 Evaluatin Apprach... 3 Technical Advisry Grup Oversight... 3 Prject Specificatins...
Meeting product specifications
 Optimisation of a diesel hydrotreating unit A model based on operating data is used to meet sulphur product specifications at lower DHT reactor temperatures with longer catalyst life Jose Bird Valero Energy
Energize Denver. Unlocking Opportunity in Denver. Public Input Session April 25, 2016
 Energize Denver Unlocking Opportunity in Denver Public Input Session April 25, 2016 How are we doing? #9 on ENERGY STAR ranking of cities #10 on ACEEE ranking of cities: #1 on local government action #16
Dear Matt: Rick Bofinger Jerico Mechanical Office x 112 Cell
 ----- Original Message ----- From: Rick Bofinger To: 'Matt Ross' Cc: 'MacWord' Sent: Wednesday, September 10, 2008 11:08 AM Subject: Demand Buster Dear Matt: We are a mechanical contractor in Northern
Manitoba Hydro Customer Consultation. Industrial Rates Workshop
 Manitoba Hydro Customer Consultation Industrial Rates Workshop Industrial Rates Workshop Engage g Customers in Rate Development Increase understanding of rate-setting process Solicit feedback and input
Jeff Fehr, Senior Application Engineer. ACH550 Flux Optimization White Paper
 Jeff Fehr, Senior Application Engineer ACH550 Flux Optimization White Paper Table of Contents Executive Summary...3 Introduction...3 Problem Statement...4 ABB Solution...5 Implementation...6 Summary...6
White Paper Nest Learning Thermostat Efficiency Simulation for the U.K. Nest Labs April 2014
 White Paper Nest Learning Thermostat Efficiency Simulation for the U.K. Nest Labs April 2014 Introduction This white paper gives an overview of potential energy savings using the Nest Learning Thermostat
Sacramento Municipal Utility District s EV Innovators Pilot
 Sacramento Municipal Utility District s EV Innovators Pilot Lupe Jimenez November 20, 2013 Powering forward. Together. Agenda SMUD Snapshot Pilot Plan v Background v At-a-Glance v Pilot Schedule Treatment
STATE IMPLEMENTATION PLAN CREDIT FOR EMISSION REDUCTIONS GENERATED THROUGH INCENTIVE PROGRAMS (Adopted June 20, 2013)
") RULE 9610 STATE IMPLEMENTATION PLAN CREDIT FOR EMISSION REDUCTIONS GENERATED THROUGH INCENTIVE PROGRAMS (Adopted June 20, 2013) 1.0 Purpose The purpose of this rule is to provide an administrative mechanism
RULE 9610 STATE IMPLEMENTATION PLAN CREDIT FOR EMISSION REDUCTIONS GENERATED THROUGH INCENTIVE PROGRAMS (Adopted June 20, 2013) 1.0 Purpose The purpose of this rule is to provide an administrative mechanism
Cost Reflective Tariffs
 Cost Reflective Tariffs for Large Government,Commercial and Industrial Customers Customer Guide Introduction On September 2016, the Council of Ministers had approved the introduction Cost of Reflective
Lighting and Lighting Controls Energy Savings Opportunities Technical Training Series
 Lighting and Lighting Controls Energy Savings Opportunities 2017 Technical Training Series Agenda Solutions for Business: Overview & Successes Program Rebates: What Qualifies? Submitting an Application:
An Energy Assessment of Fume Hoods with and without Automated Sash Positioning Control Systems at Amgen, Inc.
 Design & Engineering Services An Energy Assessment of Fume Hoods with and without Automated Sash Positioning Control Systems at Amgen, Inc. Emerging Technologies Final Report Prepared by: Design and Engineering
WIM #41 CSAH 14, MP 14.9 CROOKSTON, MINNESOTA MAY 2013 MONTHLY REPORT
 WIM #41 CSAH 14, MP 14.9 CROOKSTON, MINNESOTA MAY 2013 MONTHLY REPORT In order to understand the vehicle classes and groupings the Mn/DOT Vehicle Classification Scheme and the Vehicle Classification Groupings
Texas Tech University Energy Savings Program January 2010 Update
 Texas Tech University Energy Savings Program January 2010 Update The Texas Tech Energy Savings Update is being submitted in accordance with Governor s Executive Order RP 49, Electric Conservation by State
CLIMATOLOGICAL SUMMARY
 DEPARTMENT OF REGISTRATION AND EDUCATION CTATP OF ILLINOIS ILLINOIS STATE WATER SURVEY DIVISION URBANA, ILLINOIS ISWS MP-19 Archive ISWS Illinois State Water Survey )CAL CLIMATOLOGICAL DATA MP-19 LOCAL
Analysis of Impact of Mass Implementation of DER. Richard Fowler Adam Toth, PE Jeff Mueller, PE
 Analysis of Impact of Mass Implementation of DER Richard Fowler Adam Toth, PE Jeff Mueller, PE Topics of Discussion Engineering Considerations Results of Study of High Penetration of Solar DG on Various
Appendix E: Comparison of Results Across Dynamic Pricing and Time-Based Rate Pilot Programs
 Appendix E: Comparison of Results Across Dynamic Pricing and Time-Based Rate Pilot Programs Quantifying the Benefits of Dynamic Pricing In the Mass Market Prepared by: Sanem Sergici The Brattle Group Prepared
2016 U.S. ETHANOL EXPORTS AND IMPORTS
 2016 U.S. ETHANOL EXPORTS AND IMPORTS STATISTICAL SUMMARY Copyright 2017 Renewable Fuels Association. All Rights Reserved 2016 U.S. ETHANOL EXPORTS U.S. Ethanol Exports, 2006-2016 1,200 1,000 800 600 396
SOLAR ENERGY ASSESSMENT REPORT. For 115 kwp. Meteorological Data Source Meteonorm. Date 18 October, Name of Place California.
 SOLAR ENERGY ASSESSMENT REPORT For 115 kwp Name of Place California Client abc Capacity 115 kw Meteorological Data Source Meteonorm Email ezysolare@gmail.com Order No. #1410180005 Date 18 October, 2014
Solar Plus: A Holistic Approach to Distributed Solar PV Eric O'Shaughnessy, Kristen Ardani, Dylan Cutler, Robert Margolis
 Solar Plus: A Holistic Approach to Distributed Solar PV Eric O'Shaughnessy, Kristen Ardani, Dylan Cutler, Robert Margolis NREL is a national laboratory of the U.S. Department of Energy, Office of Energy
NJ Solar Market Update
 NJ Solar Market Update April 16, 20 Renewable Energy Committee Meeting Trenton, NJ Prepared by Charlie Garrison Solar Installed Capacity Data The preliminary installed solar capacity as of 3/31/ is approximately
DRIVER SPEED COMPLIANCE WITHIN SCHOOL ZONES AND EFFECTS OF 40 PAINTED SPEED LIMIT ON DRIVER SPEED BEHAVIOURS Tony Radalj Main Roads Western Australia
 DRIVER SPEED COMPLIANCE WITHIN SCHOOL ZONES AND EFFECTS OF 4 PAINTED SPEED LIMIT ON DRIVER SPEED BEHAVIOURS Tony Radalj Main Roads Western Australia ABSTRACT Two speed surveys were conducted on nineteen
BLACK KNIGHT HPI REPORT
 CONTENTS 1 OVERVIEW 2 NATIONAL OVERVIEW 3 LARGEST STATES AND METROS 4 MARCH S BIGGEST MOVERS 5 20 LARGEST STATES 6 40 LARGEST METROS 7 ADDITIONAL INFORMATION OVERVIEW Each month, the Data & Analytics division
Multiple Listing Service
 For Immediate Release: January 7, 21 CONTACT: Dan Santa Maria MLS President (52) 795-1492 Wes Wiggins Vice President, MLS (52) 382-8792 Cheri Meadows Senior Vice President, TAR (52) 327-4218 For Tucson
California Regional Travel & Tourism Outlook. September 2016
 California Regional Travel & Tourism Outlook September 2016 California regional & seasonal travel trends The number of visits to California regions surpasses that of total California visits in a given
Energy Code Ace 2013 Title 24, Part 6 Standards Effective July 1, 2014
 Energy Code Ace 2013 Title 24, Part 6 Standards Effective July 1, 2014 This site has been developed by the California Statewide Codes & Standards Program to help you meet the requirements of Title 24,
Pacific Gas and Electric Company Monthly Report On Interruptible Load and Demand Response Programs for December 2009 [Amended Version]
![Pacific Gas and Electric Company Monthly Report On Interruptible Load and Demand Response Programs for December 2009 [Amended Version]](/thumbs/89/100341786.jpg "Pacific Gas and Electric Company Monthly Report On Interruptible Load and Demand Response Programs for December 2009 [Amended Version]") Monthly Report On Interruptible Load and Demand Response Programs for December 2009 [Amended Version] April 21, 2010 ( PG&E ) hereby resubmits this report on Interruptible Load and Demand Response Programs
Monthly Report On Interruptible Load and Demand Response Programs for December 2009 [Amended Version] April 21, 2010 ( PG&E ) hereby resubmits this report on Interruptible Load and Demand Response Programs
40KW Solar System for Apple Sauce Co
 2012 40KW Solar System for Apple Sauce Co Document Created for The Apple Sauce Co by Luke M Hardy lmhardy@smartconsult.com.au Smartcom P/L For further details please contact Luke M Hardy SunUp Solar Pty
Engineering Bulletin. Recirculation Energy Recovery Unit Controls CLCH-PRB009-EN
 Engineering Bulletin Recirculation Energy Recovery Unit Controls Introduction The following represents just one of many configurations that are possible with the Trane Climate Changer air handler with
Inergy Systems - Home Energy Management Systems Demand and Distributed Resource Management
 Inergy Systems - Home Energy Management Systems Demand and Distributed Resource Management Presenter: Nick Wold, Director of Business Development Copyright 2017, Inergy Systems 1 Who We Are Inergy Systems
Change in Vehicle Occupancy Used in Mobility Monitoring Efforts
 Change in Vehicle Occupancy Used in Mobility Monitoring Efforts By Phil Lasley, PhD, AICP, PMP Assistant Research Scientist Mobility Analysis Program Texas A&M Transportation Institute August 2017 Summary
Demand Based Static Pressure Reset Control for Laboratories
 Accutrol, LLC Product Sheet Demand Based Static Pressure Reset Control for Laboratories Accutrol, LLC 21 Commerce Drive, Danbury, CT 06810 203-445-9991 www.accutrolllc.com Contents and specifications are
Overview: Division of Rail & Mass Transportation
 Page 2 Overview: Division of Rail & Mass Transportation Mass Transit Funding Programs Federal Transit Grants & Procurement State Transit Programs Cap & Trade Funding Passenger Rail Program Rail Planning
2008 Air Emissions Inventory SECTION 3 HARBOR CRAFT
 SECTION 3 HARBOR CRAFT This section presents emissions estimates for the commercial harbor craft source category, including source description (3.1), data and information acquisition (3.2), operational
NJ Solar Market Update As of 6/30/15
 NJ Solar Market Update As of 6/30/ Prepared by Charlie Garrison July 17, 20 SOLAR INSTALLED CAPACITY DATA The preliminary installed solar capacity as of 6/30/ is approximately 1,500.7 MW. Approximately
WIM #37 was operational for the entire month of September Volume was computed using all monthly data.
 SEPTEMBER 2016 WIM Site Location WIM #37 is located on I-94 near Otsego in Wright county. The WIM is located only on the westbound (WB) side of I-94, meaning that all data mentioned in this report pertains
HVAC Rebates Rebate Application
 Rebate Application Business Member Information Business Name Installation Address City, State, Zip Contact Name Email Phone Number Account Number Rebate Recipient Please Send Rebate to: Recipient Name
AIR COMPRESSOR IMPROVEMENTS
 IAC ENERGY WORKSHOP June 23, 2006 Douglas A. Hopper 1 AIR COMPRESSOR IMPROVEMENTS By Douglas A. Hopper and Michael Kostrzewa June 23, 2006 Save Energy Now Workshop June 23, 2006 Photo by: Douglas A. Hopper
Heating, Ventilation and Air Conditioning Rebate Catalog Saving energy for a brighter future
 Pacific Gas and Electric Company Energy Efficiency s for Your Business Heating, Ventilation and Air Conditioning Catalog Saving energy for a brighter future Customers may be eligible to participate in
The International Cost Estimating and Analysis Association (ICEAA) Southern California Chapter September 9, 2015
 Southern California Chapter September 9, 2015") Sustainable Integrated Grid Initiative (SIGI): Technical and Economic Challenges of Integrating Renewable Energy, Electric Vehicle Charging and Battery Energy Storage in a Modern Grid The International
Sustainable Integrated Grid Initiative (SIGI): Technical and Economic Challenges of Integrating Renewable Energy, Electric Vehicle Charging and Battery Energy Storage in a Modern Grid The International
A9 Data Monitoring and Analysis Report. March Content. 1. Executive Summary and Key Findings. 2. Overview. 3. Purpose
 A9 Data Monitoring and Analysis Report March 2018 Content 1. Executive Summary and Key Findings 2. Overview 3. Purpose 4. Baseline Data Sources and Methodology 5. Casualty Analysis 6. Vehicle Speed Data
MSU Mankato and Ameresco. GESP Project. August 29, Ameresco, Inc. 2017, All Rights Reserved
 MSU Mankato and Ameresco GESP Project August 29, 2017 Agenda Campus Utility Baseline GESP Review and Summary Sustainability Overview Energy Savings Achieved Overview of the Project Time Table Financial
HVAC Rebates Rebate Application
 Rebate Application Business Member Information Business Name Installation Address City, State, Zip Contact Name Email Phone Number Account Number Rebate Recipient To release the rebate incentive check
Traffic Signals and Streetlights
 Traffic Signals and Streetlights Overview This chapter provides an overview of the electricity usage and resulting CO 2 emissions from the City s traffic signals and streetlights. Data for this chapter
Energy Efficiency Benefits
 Energy Efficiency Benefits Heating and Cooling Energy Conservation Case Study 40 W 20 th Street, NRDC New York Headquarters October 2016 Authors Ryan Meinke Anthony Guerrero Contributors Milly Suarez Eileen
Thank you for requesting information on our utility auditing services!
 - EXHIBIT A - ELECTRIC - CLIENT INVOICE: EXAMPLE #1 If we moved a client from an electrical rate 6 to a rate 6L, and, as a result, changed their KWH rate from $.06 per Kilowatt Hour to $.05 per Kilowatt
A9 Data Monitoring and Analysis Report. January Content. 1. Executive Summary. 2. Overview. 3. Purpose. 4. Baseline Data Sources
 A9 Data Monitoring and Analysis Report January 2018 Content 1. Executive Summary 2. Overview 3. Purpose 4. Baseline Data Sources 5. Casualty Analysis 6. Vehicle Speed Data 7. Incident Frequency & Impact
EVALUATION OF DEMONSTRATION PROJECT FOR ICE BEAR THERMAL ICE STORAGE SYSTEM FOR DEMAND SHIFTING. Final Report November 2006
 EVALUATION OF DEMONSTRATION PROJECT FOR ICE BEAR THERMAL ICE STORAGE SYSTEM FOR DEMAND SHIFTING Final Report November 2006 Submitted to: Sacramento Municipal Utility District 6301 S Street Sacramento,
6/6/2018. June 7, Item #1 CITIZENS PARTICIPATION
 June 7, 2018 Item #1 CITIZENS PARTICIPATION 1 Item #2 APPROVAL OF MINUTES Item #3 TRAC GOALS, FRAMEWORK & AGENDA REVIEW 2 COMMITTEE GOALS Learn about Southern Nevada s mobility challenges, new developments
Overview of Plug-In Electric Vehicle Readiness. Coachella Valley Association of Governments
 Overview of Plug-In Electric Vehicle Readiness Coachella Valley Association of Governments Philip Sheehy and Mike Shoberg February 21, 2013 Electric Drive Community Readiness Workshop 2006 ICF International.
UNDERSTANDING YOUR ENERGY BILL
 UNDERSTANDING YOUR ENERGY BILL Chris Favia Commercial Account Manager Madison Gas and Electric Company Today s Discussion Understanding your energy bill Tracking your energy use Benchmarking your energy
Group 3: Pricing from 1 April 2018 and load management
 Group 3: Pricing from 1 April 2018 and load management This document is intended to provide background to Network Tasman s Group 3 pricing, in particular the Regional Coincident Peak Demand (RCPD) price,
Facilities Energy Report Fiscal Year 2016 Third Quarter
 Facilities Energy Report Fiscal Year 2016 Third Quarter I. Energy Use Summary Campus energy use through the third quarter decreased 2.5%, but increased 1.3% weather adjusted, compared to the same period
November 2017 Customer Switching Report for the Electricity and Gas Retail Markets
 An Coimisiún um Rialáil Fóntas Commission for Regulation of Utilities November 2017 Customer Switching Report for the Electricity and Gas Retail Markets Information Paper Reference: CRU18011 Date Published:
Ambient PM 10 Monitoring Sechelt, B.C Update
 Ministry of Environment LOWER MAINLAND REGION Ambient PM 10 Monitoring Sechelt, B.C. 2004-2005 Update E N V I R O N M E N T A L Q U A L I T Y Library and Archives Canada Cataloguing in Publication Data
Total Production by Month (Acre Feet)
") Production by Month (acre-feet) 2008 2009 2010 2011 2012 2013 2014 2015 2016 January 25 339.10 228.90 249.50 297.99 243.06 327.14 247.66 212.37 February 234.00 218.80 212.10 241.52 245.82 279.08 234.16
Production by Month (acre-feet) 2008 2009 2010 2011 2012 2013 2014 2015 2016 January 25 339.10 228.90 249.50 297.99 243.06 327.14 247.66 212.37 February 234.00 218.80 212.10 241.52 245.82 279.08 234.16
Southern California Edison Company Demand Response Appendices to SCE-1, Volumes 1-4 ERRATA Replacing Appendix D, Pages D-1 & D-3
 Application No.: Exhibit No.: Witness: A.11-03-003 SCE-1, Volume 5 (Appendices to SCE-1 Volumes 1 4) - ERRATA (U 338-E) Southern California Edison Company Demand Response Appendices to SCE-1, Volumes 1-4
Energy Performance Information Request Timeline
 Energy Performance Information Request Timeline Project Title: UT Project # Project Manager: Submitted by: Day Submitted: The timeline below outlines a comprehensive list of required documents and when
Energy Design Assistance
 Energy Design Assistance Presented By: Jessie Peterson, Xcel Energy 6-26-08 Agenda Demand-Side Management Programs Program Overview Case Study How to Participate 1 Demand-Side Management Programs Why?
PROCESS VFD SAVINGS CALCULATOR USER GUIDE CONTENTS ENERGY EFFICIENCY FOR BUSINESS CUSTOM INCENTIVES CUSTOM-TO-GO
 PROCESS VFD SAVINGS CALCULATOR USER GUIDE ENERGY EFFICIENCY FOR BUSINESS CUSTOM INCENTIVES CUSTOM-TO-GO CONTENTS 1. Getting Started... 2 2. Measure Tool Description... 2 2.1. Applicable Types of Equipment
Cycle 2 California ZEV Investment Plan Release Briefing. October 3, 2018
 Cycle 2 California ZEV Investment Plan Release Briefing October 3, 2018 Electrify America s Cycle 2 plan supports our mission to develop an ultra-fast, comprehensive fueling network for all Cycle 2 Principles
MARKET RATES UPDATE Paula Gold-Williams Cory Kuchinsky
 MARKET RATES UPDATE I N T R O D U C T I O N BY: Paula Gold-Williams President & Chief Executive Officer (CEO) P R E S E N T E D BY: Cory Kuchinsky Interim Vice President, Financial Services September 24,
PART 2 GUIDELINES. To be eligible to receive a financial incentive, the following conditions must be met:
 PART 2 GUIDELINES 1. Program Objective and Scope The objective of the Business Incentive Program ("BIP") is for Toronto Hydro-Electric System Limited ("Toronto Hydro") to provide financial incentives to
Regulation Update. Operating Committee September 12, PJM 2017
 Regulation Update Operating Committee September 12, 2017 Regulation Market Clearing Price *Data up to Aug 22 2 Mileage Ratio Mileage Ratio has increased since the new signal implementation Larger Utilization
Mr. Kyle Zimmerman, PE, CFM, PTOE County Engineer
 Los Alamos County Engineering Division 1925 Trinity Drive, Suite B Los Alamos, NM 87544 Attention: County Engineer Dear Kyle: Re: NM 502 Transportation Corridor Study and Plan Peer Review Los Alamos, New
12185 Presilla Road Camarillo, California phone: (805) fax: (805)
 fax: (805)") 12185 Presilla Road Camarillo, California 93012-9243 phone: (805) 553-9000 fax: (805) 532-2401 email: Jeff.Hirsch@DOE2.com 12 August 2006 California Energy Commission California Energy Commission Attn.:
12185 Presilla Road Camarillo, California 93012-9243 phone: (805) 553-9000 fax: (805) 532-2401 email: Jeff.Hirsch@DOE2.com 12 August 2006 California Energy Commission California Energy Commission Attn.: