Adopted Budget. July 1, 2016 June 30, 2017
|
|
|
- Jennifer Preston
- 5 years ago
- Views:
Transcription


1 dopted Budget July 1, 2016 June 30, 2017
2

3 Table of Contents 1 Building our Mobility 2 > Message from the CEO 4 > Board of Directors 6 > Organizational Chart 8 Budget Highlights 10 > Metro (LCMT) 12 > Transit Expansion Timeline 14 > Improved Transit Service 16 > Delivering Transit & Highway Projects 20 > Operating Capital 22 > New Projects 24 > Budget Summary 26 Budget Details 28 > Resources 30 > Expenditures 32 > Enterprise Fund: Bus & Rail Operations 34 > Enterprise Fund: Other Operations 35 > Capital Program 36 > Regional Subsidy Funding Programs 38 > Congestion Management 40 > General Planning & Programs 41 > Debt 42 > Fund Balances & Governmental Fund Financial Statements 44 > Measure R 46 > Full-Time Equivalents (FTE) 50 ppendices 52 > ppendix I: Service Statistics 54 > ppendix II: ctivity Based Bus Cost Model 56 > ppendix III: ctivity Based Rail Cost Model 58 > ppendix IV: Capital Program Project Listing 60 > ppendix V: Regional Transit llocations 68 > ppendix VI: Legally Separate Entities 70 bbreviations 74
4

5 Building Our Mobility

6 4 Message from the CEO There was much to celebrate in Fiscal Year 2016 (FY16). During the 25th anniversary year of Metro Rail, we continued our ambitious transportation revolution by opening two rail lines: the Gold Line extension to zusa and the Expo Line extension to Santa Monica. The addition of new service brings the Metro Rail system to more than 100 miles, all of which was built in just 25 years. In FY16, Metro broke ground on many more projects, such as the Southwestern Yard, a maintenance facility that will serve to keep the future Crenshaw/LX light rail line in a state of good repair. We lowered a 950-ton tunnel boring machine into the ground to begin digging twin subway tunnels for Crenshaw/ LX. In partnership with Caltrans, we continued work on important highway improvements, particularly on the trafficclogged 5 Freeway. Meanwhile, we provided almost 450 million rides to Los ngeles County residents and visitors on 2,200 clean-air CNG buses and the expanding Metro Rail system. The year ahead will be every bit as exciting as we continue our efforts to improve traffic and deliver more mobility options to all parts of Los ngeles County for today, for tomorrow and into the future. Our growth continues with construction of one of the largest public works programs in the nation, including the Crenshaw/LX Line connecting the Expo Line and the Green Line with a direct connection to LX, the Regional Connector that will link light rail lines in downtown Los ngeles and the Purple Line subway that is finally headed west toward Beverly Hills and Westwood. s custodians of taxpayer dollars, we pledge to be frugal, responsible, practical and accountable as we invest in the future of Los ngeles County. Even as we continue to grow, we are carefully monitoring our resources. Over the past year we continued to emphasize the importance of tightened financial controls with new tools, such as increased performance monitoring, annual project evaluations, and both mid-year and year-end budget assessments. To complement and strengthen our transit network, we have an aggressive program to create a more walkable and bikeable environment. In FY17, we are launching Metro s Bike Share pilot program with more than a thousand bikes at more than 65 bike share stations throughout downtown Los ngeles. We also have an agreement with the car sharing network Zipcar to provide vehicles for hourly or daily reservations at 10 Metro Park & Ride locations. These programs are just two of the many

7 5 first-last mile connectivity efforts underway to make it easier for our patrons to reach Metro stations and stops. In fact, more than $28 million is dedicated to first-last mile initiatives, active transportation and bike programs in FY17. For FY17, our number one budget priority remains providing excellent, safe, clean and on-time transit service to the public. ccordingly, we have established a thorough asset management plan to keep our buses and trains, along with other facets of our infrastructure, in top form. To that end, we are accepting delivery of the last of 900 new CNG buses to update our fleet and improve comfort and safety for our patrons. In FY16, we opened Division 13, a new state-of-the-art bus maintenance and operations facility that will enhance our ability to service vehicles for lines originating in downtown Los ngeles. We are currently in the process of buying new light rail vehicles to support our expanding rail system, as well as continuing efforts to upgrade the Blue Line, our oldest rail line and one of the busiest light rail lines in the United States. s we upgrade our bus and rail fleets and maintenance facilities, we are also experimenting with new methods like all-door boarding for improving the on-time performance of our traffic-mired buses. mong our safety and security goals is the achievement of an improvement in law enforcement response time to requests for help from customers and staff. We are also working to develop and launch more technology tools so our patrons can reach us when they need us. We recently rolled out cell service into our subways, which will facilitate open lines of communication, even underground. With the benefit of a visionary Board of Directors, we have an opportunity this year to tackle the transportation infrastructure challenges of today, so that once and for all, we can overcome the infrastructure challenges of tomorrow. nd we thank the voters of Los ngeles County for their continued foresight and support as we continue creating a balanced transportation system for all of Los ngeles County. Phillip. Washington Chief Executive Officer


8 6 Board of Directors Mark Ridley-Thomas Chair L County Supervisor 2nd Supervisorial District John Fasana 1st Vice Chair Council Member, City of Duarte Eric Garcetti 2nd Vice Chair Mayor, City of Los ngeles Michael ntonovich L County Supervisor 5th Supervisorial District Mike Bonin Council Member, City of Los ngeles Mayor ppointee James Butts Mayor, City of Inglewood Diane DuBois Vice Mayor, City of Lakewood Jacquelyn Dupont-Walker City of Los ngeles Mayor ppointee Don Knabe L County Supervisor 4th Supervisorial District Paul Krekorian Council Member, City of Los ngeles Mayor ppointee Sheila Kuehl L County Supervisor 3rd Supervisorial District Note ra Najarian Mayor, City of Glendale Hilda L. Solis L County Supervisor 1st Supervisorial District Carrie Bowen, Caltrans Ex-Officio Member Governor ppointee Represents the composition of the Board of Directors that adopted the FY17 budget in May 2016.
9 7 Bob Hope irport 2 2 Los ngeles International irport Long Beach ir port


10 8 Organizational Chart Phillip. Washington Chief Executive Officer Elba Higueros Chief Policy Officer PROGRM Management Planning & Development OFFice of ExTRORDinRY innovtion Risk, SafeTY & sset Management Finance & BUDGET Richard Clarke Executive Director Therese McMillan Chief Planning Officer Joshua Schank Chief Innovation Officer Greg Kildare Executive Director Nalini huja Chief Financial Officer


11 9 Stephanie Wiggins Deputy Chief Executive Officer Management UDit Services Labor / EmplOYee RelTions congestion ReDUction VenDOR / ConTRct Management systems SecURiTY & Law EnFORcement Diana Estrada Chief uditor Joanne Peterson Interim Executive Director Shahrzad miri Executive Officer Debra vila Executive Director lex Wiggins Executive Director INFORMTION Technology Services METRO OPERTIONS communictions Civil Rights & EEO Dave Edwards Chief Information Officer James Gallagher Chief Operations Officer Pauletta Tonilas Chief Communications Officer Dan Levy Executive Officer
12

13 Budget Highlights

14 12 Metro (LCMT) The Los ngeles County Metropolitan Transportation uthority, branded as Metro, adopted a $5.6 billion balanced budget for Fiscal Year 2017 (FY17). Metro s FY17 budget includes a full year of operation for two new rail lines, the Gold Line Foothill extension to zusa and the Expo Line extension to Santa Monica, which opened to the public in March and May 2016, respectively. These two new Measure R rail extensions have significantly enhanced our transit network by connecting our mountains with our beach communities and increasing the total miles of Metro Rail service to more than 100 in Los ngeles County. Metro Rail expansion continues in FY17 with three major rail lines in construction: the Regional Connector, Crenshaw/ LX and the Westside Purple Line extension to La Cienega. s we continue to expand transit services and enhance service quality, projections show that we will face financial challenges. To mitigate future budget shortfalls, we are taking small steps now in order to avoid drastic measures in the future. Even with the addition of new rail services, rising costs and various new projects and programs, the FY17 budget represents a three percent decrease from the FY16 budget, proving Metro is resolute in controlling costs. Pursuing Long Term Financial Stability s we continue to expand our transit system, Metro is in the midst of multiple efforts to increase fiscal discipline and accountability throughout the agency. zero-based budgeting technique was used for FY17, requiring all departments to justify every expense from the ground up. Every single project included in the FY17 budget has been reassessed with an emphasis on deliverables in an effort to increase efficiency while spending taxpayer dollars as responsibly as possible. In January 2016, the Risk llocation Matrix (RM) was approved and the Internal Savings ccount was established by an action of the Metro Board of Directors. These two new tools work in tandem: RM is an ongoing agencywide collaborative process to identify a strategic mix of cost saving and revenue generating new initiatives, while the Internal Savings ccount will capture new savings and revenues realized as a result of the RM process and ensure prudent use of these monies. Ensuring financial stability is an ongoing agencywide responsibility, and each department will continue to identify new and innovative ways to increase revenues and decrease expenses in FY17 and beyond. In FY16, we introduced a new process to true up actual expenses to budget projections at both mid-year and year end. These new strategies complement the RM process and will continue to generate additional deposits to the Internal Savings ccount. We also developed new Key Performance Indicators (KPIs) to help monitor and assess departmental performance. The status of the KPIs will be reported on a quarterly basis along with monitoring of the achievement of RM savings or revenues. In addition to overall performance monitoring, a new effort for regular assessment of existing projects will be launched in FY17, upon which the status and accomplishments of every program will be evaluated annually. By finding new ways to trim costs and generate revenues, holding each department accountable for performance measures and closely monitoring budget-to-actual variances, we are essentially reassessing the way Metro operates. With every efficiency improvement, we continue working toward a more secure financial future.
15 13 Fy16 Budget ($ in millions) $5,802.4 Fy17 dopted Budget ($ in millions) $5,626.2 CapiTL $2, % CapiTL $2, % Operations $1, % SuBSidy FuNDiNG ProGRMS $1, % Operations $1, % SuBSidy FuNDiNG ProGRMS $1, % DEBT SERviCE $ % CoNGESTion Management $ % DEBT SERviCE $ % CoNGESTion Management $ % GENERL PLNNing & ProGRMS $ % GENERL PLNNing & ProGRMS $ % Metro Budget: FY17 vs FY16 Thanks to the completion of major projects, as well as agencywide efforts to control costs, the FY17 adopted budget represents a 3% decrease from the prior year. Through zero-based budgeting, RM and cost control, we have absorbed cost inflation greater than CPI and achieved a $176 million savings from the prior year. s we continue to invest in Los ngeles County s transportation infrastructure, we must also keep our focus on exercising prudent control over our finances. s a share of Metro s entire budget: > Capital expenses decreased from 40% in FY16 to a projected 38% in FY17, primarily due to the completion of construction on the Gold Line Foothill extension to zusa and the Expo Line extension to Santa Monica. > Operations expenses have increased from 26% in FY16 to a projected 28% in FY17, primarily due to the opening of the new Metro Rail extensions.
16 14 Transit Expansion Timeline Countywide Multi-Modal Transportation System s our transit network grows, it is important to remember that Metro is more than just buses and trains. We are also working toward improving available options for first-last mile connections to improve accessibility to the transit system and cultivate a more walkable and bikeable environment. dditionally, Metro works to improve highways, which our sprawling region relies heavily on as part of an integrated and multifaceted transportation network. s the regional transportation planning agency for Los ngeles County, Metro allocates transit funds to Metrolink, ccess Services and all of the municipal transit operators. In addition, a portion of sales taxes collected is provided to the county s 88 cities and unincorporated areas, allowing local governments to provide and maintain the building blocks of transportation at the local level. With all modes and all jurisdictions combined, we clearly are making strides toward achieving our goal of building the best, most innovative, balanced and customer-focused transportation system in the world. Blue Line Opens 7th St / Metro Center to Downtown Long Beach Green Line Opens Norwalk to Redondo Beach Red Line Extended Hollywood / Vine Gold Line opens Union Station to Sierra Madre Villa Red Line & Purple Line open Union Station to Westlake / Macrthur Park Red Line Extended Wilshire / Vermont Purple Line Extended Wilshire / Western Red Line Extended North Hollywood Orange Line opens North Hollywood to Warner Center
17 15 The State of Good Repair (SGR) program continues to be a top priority within the FY17 capital plan. This year, SGR efforts will focus on a wide array of asset improvement and maintenance projects, including bus and rail system reliability improvements and technology improvements. We are also concluding our recent acquisition of new 40-foot buses while completing bus midlife maintenance and engine replacements. In FY17, we will initiate new light rail and heavy rail vehicle acquisitions in addition to conducting component and midlife overhauls. State of Good Repair s we improve the assets of our bus and rail system, we will also place an emphasis on infrastructure improvements. Union Station renovations for Fire and Life Safety improvements and D requirements are underway, while various improvements will be made to the Metro Headquarters building. While we work to expand our transit network, it is of utmost importance that we focus more than ever on maintenance of our assets in order to ensure that the system we are building operates in top form. Gold Line Extended tlantic Station Silver Line Opens El Monte to Harbor Gateway Transit Center Expo Line Phase 2 Santa Monica Gold Line Extension zusa / Citrus Regional Connector Links Rail Lines Downtown L (In progress) Expo Line opens 7th St / Metro Center to Culver City Orange Line extended Chatsworth Crenshaw / LX Green Line to Expo Line Connection (In progress) Westside Purple Line Extension La Cienega (In progress)
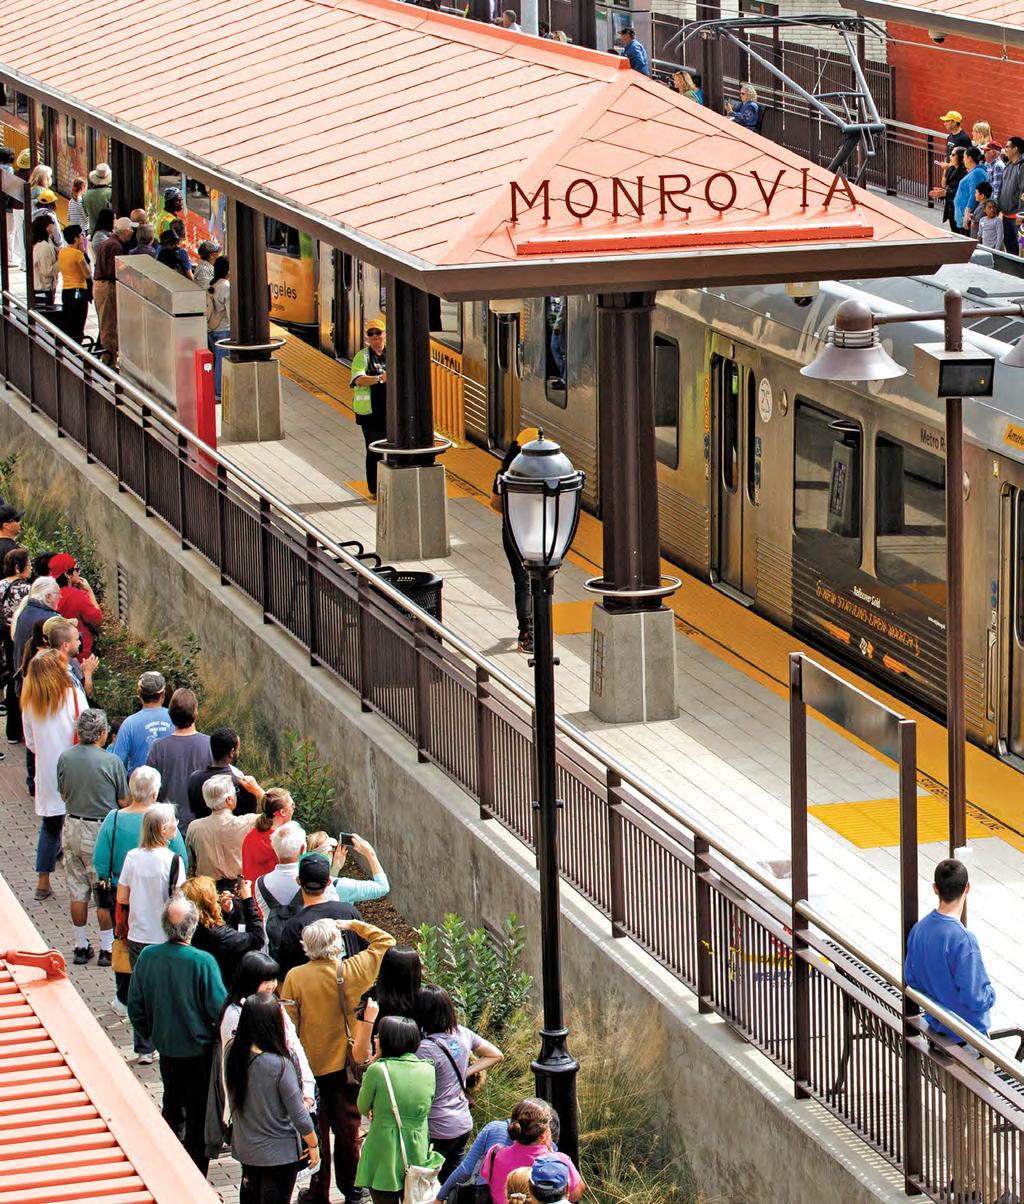
18 16 Improved Transit Services In FY17, the number one budget priority related to transit service is to provide safe, clean and on-time buses and trains to the public. We are also focusing resources on inspecting, cleaning and maintaining our vehicle fleets and our transit stations to ensure our assets meet Metro and industry standards. New light rail vehicles are being procured to support the operation of our expanded Metro Rail system, and the final 75 buses to complete the foot CNG bus buy are being purchased and delivered. With the completion of this most recent bus procurement, one third of the Metro bus fleet is now three years old or newer. More to Explore The end of FY16 marked the highly anticipated openings of the Gold Line Foothill extension to zusa and the Expo Line extension to Santa Monica. These new extensions connect our mountains and beach communities and offer a relaxing and money-saving alternative to driving on the busy I-210 and I-10 Freeways. The Gold Line now extends east from Pasadena to zusa, with six new stations serving five cities and countless destinations in the San Gabriel Valley. The completion of the Expo Line has extended Metro Rail service west from Culver City to the coast, providing an opportunity for rail travel to Santa Monica for the first time in more than six decades. Together, the Gold Line and Expo Line extensions added 13 new rail stations and expanded the Metro Rail system by 20%. To improve system infrastructure and ensure smooth operation of our expanded Gold Line and Expo Line, two new operating and maintenance facilities were opened concurrently with the extensions: the Monrovia Division and the Santa Monica Division. ll-door Boarding We continue to launch new programs designed to improve on-time performance and the rider experience. The FY16 all-door boarding (DB) pilot program reduced dwell time by 30-60% by allowing rear door boarding. Due to these favorable results, the DB program is now being extended to the Silver Line in FY17. This expansion of the DB effort will enable increased data collection and more accurate measurement of the impact DB has on transit service. s we continue to test new approaches to increasing efficiency, we are improving the customer while simultaneously working to reduce operating expenses. Customer Outreach Various efforts are currently underway to increase the flow of transportation information from Metro to the residents of Los ngeles County. s in prior years, Community Relations works to build support and enhance awareness of Metro s services, programs and initiatives with cities, businesses and community leaders. Through these outreach efforts to coordinate activities with key stakeholders, we are maximizing the impact of Metro s relationship with the community. To provide information to potential riders in close proximity to our transit system, safety awareness training continues at K-12 schools, organizations and institutions within a mile and a half of Metro Rail lines. To reach an even wider audience, new programs are also being tested. pilot Metro Mobile Customer Center is being launched at the start of FY17 as a new resource of transportation information for residents of underserved areas. The pilot program is designed to give transit customers in areas without access to a Metro Customer Center the ability FEDERL OVERLND CENTURY CITY BEVERWIL ROBERTSON SN VICENTE 4TH 14TH 26TH SNT MONIC 17TH CLOVERFIELD 17th St/ SMC COLORDO CENTINEL 26th St/ Bergamot BRRINGTON WEST LOS NGELES Expo/ Bundy SEPULVED Expo/ Sepulveda NTIONL Westwood/ Rancho Park SEPULVED PLMS BL Palms Culver City La Cienega/ Jefferson RODEO RD Expo/ La Brea MR Metro Expo Line & Station Parking Subject to Change LCMT Downtown Santa Monica PICO OCEN PRK ROSE 23RD IRPORT WLGROVE BEETHOVEN CENTINEL SWTELLE MCLUGHLIN WSHINGTON PL WSHINGTON BL CULVER BL CULVER CITY OVERLND JEFFERSON L CIENEG L BRE WSHINGTON BL SEPULVED SWTELLE

19 LOM LT LT LTDEN LTDEN DR LT 17 MENDOCINO WO O Eaton Canyon Par k DB UR Y W RD HOW O KS ND H IGH L L C HIL COLLEGE E RIEL V SN GBR O N T VERNON V P PSDEN V CERRITOS V VERNON V GR RND BRRNC CITRUS HOLLENBECK ZUS V LRK ELLEN MINE EN TE V ET NS SU EN DO R S GL YE R EL INGW LEFF L NDO R V V GLE S ZU FWY POMON 60 GLE COLIM ROW WLN N HEIG GHT ST C COLIM RD IM L CO NOGLES OR TH ERTO N GEW V ROWLND FULL N VLIND V V LE DEL VL EN D H CI STIMSON WED RD PT HF IND ER TE LE GR IMPERIL HWY P H T VIST OOD NGW YOU L HBR R L C BR E EL INGW LEFF RUSSELL LEFFINGWELL L M BECH WHITTIER BL 1ST SNT T GERTRUDES SCOTT Whittwoo d Mall MULBERRY CO LIM CRMEN R IT T P H VLLEY V SID PU JNINE T BR O DW Y GR ME ER VIEW LE ELLEN Z US HCIEND NI C LI FO R ST IMS O ER EL G LE INE ON FWY PUENTT HILLLS S MB R SCOTT L MIL N TE RK V ET NS SU C NY ON HC IEND E N NN LS M 72 GU RY L GE N OR HC IEN D RIV TE EN L POM GR O MO N ID E OK INDUSTR TR Schabaru m Par k T GERTRUDES SNT D V ND VLI LL DI INK LE KS LIM L RT C EY V VLL N GU SHOEMKER OL R CO EN UL BE R LKELND BLOOMFIELD TR CO VIE C W T LIN M BE FLORENCE V WLK BL NORW IN L HBR NI IFO R L UR E L C L NT ER P I LE F M EE E ls Puente Hil Mall R T OC PICKERING GR EE NL E F RD GS IN SP R FE NT S L CR MR INYO ME LIM M IS T CU 2N D BL M GR E R LBURTIS PIONEER TU RN BU LL 60 ES RV L ITT I R IE MIL HWY N P R W V H 7T BL M PINTER M L IMPERIL V L HLLIBURT ON P NN PE N L CU UR RT T H TELEGRPH PIONEER NG U DUNNI ORR & DY R EN TE PU IL LO W KW Y PECK CO GS W EL L ER N SO RE N SO SO N BL NORW WLK LEE &D Y S EY OR R JER LONG GWOR RTH GREENLEF BR O DW Y FW Y ER IEL RIV GB R PIO NEE R DED RL ESW OR TH CH LKELND STUDEBKER RO L PUENT NT TEMPL HDLEY WH U BRO PU BL K P R IN B LD W EW OU NT I N VI TYLER M EL L CO GS W RIV NEE R PIO BL K NO P SS O NS RW L SE RO ONS DVEN NRICH TON ROSET FF RU DD WO O R IV ER EL GB RI ZUS CNYON RIV ER L RIE G B DU SNT T N NIT T CENTRL MERCED MERCED L RIE G B N S Y PK W RIV ER LO S VLIND D MR PL E LE Y BEVERLY L BL LPHI PHILDELPH P SL S N WOODDRUFF BELLFLOWER BL LIN K E TURNBULL CNYON WSHI NGTO N PS S BL D KE WO O L OO KS HIR E RD BR RO LI N HCIEND D HEIGHT ST SON SN D B L E RO SEM BL NT OU EY DO WN M BL D CENTRL LEE D BL SE ME RO BL OU NT M P R ME D OU NT BL HON DO M P R RIO ES RIV P R KE WO O L ET G L S N 4TH BL UF F GR EB EL LO EN WO OD NT S M O GR E POTRERO HONDO R IO WLNUT GROVE W L NT B MOU PR RE POPL LR 6TH LE M P M PL E HOW WR D WILCO OX 21ST FI G R GRFIEL D G RF IEL D EE NW S OO MO D NT EB EL LO EL D N FINDLY EL D OL HO SC /M JU US B P H MN CLRKM CL 605 K OC TO R TR NOGLES R TR PR DO N CI MERCED OW D RD M BRODW WY SLU R M N E TE SO EY RK WO BL HDLEY CMERON WEST COVIN C IN MPLEGROVE M IM GR ON ST ES UI TO SH BL SQ Y FW V LS N MO CE NE PO R CI MERCED PL E L IL VERDE HIR N M SN BERNRDINO FWY 10 R M VILL KS SH RU EW OW N VI LI Y EN ES TO NE Y & GR W STEWRT OO NE FI VE RL Y FL OR L IE IN N FW FL OR N 605 NT F Since 2009, Metro transitsnt Sdata SPRING RI GShas been available on Google Maps, allowing customers to plan custom trips using Metro Stonewoo d Cente r buses and trains. Last year, Metro expanded its digital reach through additional partnerships with technology companies such as pple and Waze. Through these agreements, transit FIR BR LE Y N PECK USO N 42 RM T 19 R Y OR W WORKMN O FWY S N J OS E CR E E K BL SL NT S &G V L N TT M N LE CI S NE HI 605 NG TO N TE CE IE HI 5 V HU CE GE EL H EN RID CK PE FI C M M IER P FL OR RB GE TE L IL ITT WH USO GR TE L W MIN ES LE FO S LI OT technologies and mobile devices are on theerrise with WHITTIE Metro customers. The majority of visits to the Metro website occur from mobile devices, and the mobile app GoWhittie Metro r Colleg e Los ngeles has been downloaded more than one million PICO O RIVER R ER R times. This shift to digital and handheld data has created a new way to circulate transportation information, and Metro is intent on maximizing the opportunity by seeking to establish and maintain technology partnerships in FY17 and beyond. TE DO NE DOWNE IN P CI ERNRDIN BER SN BE FR BE BL SL GGE TR BRIEL GB BL UI TO M LI EL KL CROSSR ODS N SQ BLDWIN PR K KM EL HO RNC SO N H ERL Y 72 W S RROW CYPRESS ST T PLM P H P R EG U N L TE MMERC E CE BEV Technology Partnerships C COMMERC RC Map SL D CI N TI L W SH ING TO N EE F UR L G MONTEBELL O COMMERC E LINCOLN LOS N NGE G LE S V OL LYM MP PIC 39 RROW N RFE E N D H DU IC ISON TIIE ER BL BSELINE S DO HO N FR 10 EE RF T O VCCO V IT N FEE DUR LN LINCO MIGOS LOS ER YL Whittier Narrow s Rec. re a RD FO OD WO WHIT BL MD EL OL LYMPIC ERGUSON LINCO LN VICT ORI BEVE RL LY B L RI MONTEBEL MO EBEL BL LO EL EB NT MO N T N S B G WILCOX Y H 60 N FWY ON POM RUSH S O ER TR PO RIGGIN N ELLIOT TT N N KLINGERM RUSH M GR 210 COVIN Y GRVEY TH GE HIL L 19 MBEL B IELD VI ST TL N TIC GR F N OR ST GR VES RUSH ON LT FU RE GRVES V ROUTE 66 ON During FY16, Metro created a database of nearly two million likely or potential transit riders through social media partnerships. SOUT OUTTH EL MON MONT NT This database creates unprecedented opportunities to communicate with our riders and the public. In FY17, we will Montebell o Town Cente r continue to develop advanced targetinglegg capabilities to promote LK E ridership, concentrating on those who live and work within a half mile of transit stations or stops. Using innovative ad targeting and Rio Hondo Colleg e delivery platforms, we expect to see a significant increase in the success of these campaigns, which will result in an increase in ridership and an improved ability to reach Metro customers. E ND BL POTRERO NEWM M RK EL MONT M NT TOWNEW WY LSHBRO RO OOK W NEW ON JCKSO GRVEY Social Media Marketing MONTEREY M REY P 1ST FOOTHILL RM RIO GRFIELD GRVEY BENNETT RD 10 EMERSON IRWINDLE V PEC K OLIVE LIVE OK L OS T FW LEDOR PU/ Citrus College GLDSTONE IRWINDLE BLDWIN PRK BL ENCINIT T RO W VINCENT INO V D MISSION DR IEL RF G R ZUS zusa Downtown LOS NGELES ST ZUS LOWER VLLEY V EN C Santa Fe Dam Recreation rea B TEMPLE CITY to purchase TP fare media, submit reduced fare applications and obtain transportation information. For the pilot period, ROSEMED visits will be focused on senior centers, schools and special R LHMB El Monte community events. S MIS ILL 605 ST SIERR MDRE V 5TH ST FOO TH Irwindale IRWINDLE V MOU NT T VI N UE K LIVE O LS TUN N S TODD T BUEN VIST HIGHLND DURTE City of Hope Medical Center IN V MYRTLE REL RE MIS SIO N ION LS LOMS T IN O NT MOU SHMROCK MYRTLE CLIFORNI V M MGNOLI 10TH 8TH 6TH 2ND 3RD 1ST T V T NIT SNT BLDWIN FOOTHILL N LONGDEN WY BRODW OMMONWELT L H N HUNTINGTON 210 Monrovia CMINO M OKS Y ROYL Duarte/ City of Hope RD MONTE V EL M EL MUSCT DUR BRDBURY Y BL 19 DURTE LEMON DURTE U RD CL IFOR NI MDRE ROSEMED BL CRIG SIERR MDRE BL ST NI S LIFORN CL CMPUS RCDI SUNSET RIEL OK KNOLL HU TE RD R SN M SN GBRIEL ION ON GT IN NT GTON HUNTIN GB GROVE EY TER MON LCMT Subject to Change MONROVI GTON HUNTING L SN K O SN MRINO Santa nita Park OP BL OR CLIFORNI rcadia D PSQUL ST SN P COLORDO R LO CO el Mar Sierra Madre Villa MR BL DEL M MYFLOWER 5TH 210 R DO BL COLOR Metro Gold Line & Station ST RE FOOTHILL W WLNUT ST OUTH DEN ORNGE GROVE BL B LDWIN W RNCH D R TINGS MICHILLIND llen Lake SIERR MDRE HS SIERR MD DRE VILL V V DR BL SIERR MDRE 5TH LT LTDEN DR HILL DR LKE RK YO PSDEN NGE GROVE GRND VIEW W LOS ROBLES NE MOUNTIN T V T NIT NT S WSHINGTON L HBR BL BE RT IMPERIL HWY TTE COLLEGE CENTRL ST BRE E IMPERIL HWY BIRCH

20 18 Improved Transit Services data has become available to an estimated 700 million iphone and ipad users worldwide, with road and construction information now available to an estimated one million Waze customers in the Los ngeles area. These partnerships bring instant travel information to millions of customers, increasing the flow of transportation data and positioning Metro as a leader in public/private partnerships. Long Range Transportation Plan With the completion of the Expo Line and Gold Line extensions in FY16, it is clear that we are making significant progress on the promises of Measure R. t this point, it is important to continue planning for the future. In FY17, the Planning department will lead the development of the 2017 Long Range Transportation Plan (LRTP) for Board adoption. This effort requires extensive coordination with all Metro departments, partner agencies, stakeholders and community members, and the final LRTP will align the agency s capital investment program with adopted board policies. Once the LRTP is formally adopted by the Board, it will act as the governing document for the future of Metro and transportation in the Los ngeles County region. Metro Line to Goal Line s transportation needs change, so does our transit service. In March 2016, a Metro Line to Goal Line task force was created to plan for new transportation needs resulting from the National Football League (NFL) team expected in Los ngeles County later this year. This task force is charged with identifying and addressing the transportation issues and opportunities associated with the imminent arrival of an NFL team, which is expected to dramatically increase transit demand around the football stadium. By planning carefully now, we aim to ensure that Los ngeles County s adjustment to hosting an NFL team will be a smooth one. Furthermore, the enhancements to transit service that will be necessary to accommodate a new professional sports team will benefit all transit riders in the area, improving service for football fans and residents alike. The task force is made up of internal and external partners and is investigating a wide array of transportation issues surrounding the introduction of an NFL team to our region. Topics include a transit operations service plan, increased security and police presence, marketing of transit as a transportation option, joint development and first-last mile opportunities for completing trips to the stadium.
21 19 MeTRO Rail & BuswY Chatsworth mtrak & Metrolink Nordhoff Roscoe Sherman Way Warner Ctr Canoga Canoga De De Soto Soto Pierce Pierce College College Tampa Tampa WESTSIDE SN FERNNDO VLLEY Reseda Reseda Balboa Balboa Woodley Sepulveda Van Nuys Woodman Los ngeles River PURPLE LINE EXTENSION Valley College Laurel Canyon North Hollywood CENTRL L Universal City/Studio City Wilshire/Western Hollywood/Highland Hollywood/Highland Hollywood/Vine Hollywood/Vine Wilshire/ Normandie Hollywood/Western Vermont/Sunset Vermont/Sunset Vermont/Santa Vermont/Santa Monica Monica Vermont/Beverly Wilshire/Vermont Westlake/Macrthur Park Civic Civic Civic Ctr/ Ctr/ Ctr/ Grand Grand Grand Grand Park Park Park Park Lake Del Mar Fillmore llen Memorial Park South Pasadena Highland Park Southwest Museum Heritage Sq Lincoln/Cypress Chinatown Union Station mtrak & Metrolink LX Flyway Sierra Madre Villa rcadia Monrovia LC+USC Medical Ctr Cal State L Metrolink Duarte/City of Hope Irwindale SN GBRIEL VLLEY El Monte zusa Downtown PU/Citrus College Downtown Santa Monica 17th St/SMC 26th St/Bergamot Expo/Bundy Expo/Sepulveda Westwood/Rancho Park Palms Culver City La Cienega/Jefferson Expo/La Brea Farmdale LX Mariposa El Segundo Douglas Redondo Beach Expo/Crenshaw CRENSHW/ LX LINE Expo/Western viation/lx Expo/Vermont 7th St/Metro Ctr Pico LTTC/Ortho Institute Expo Park/USC SOUTH L Jefferson/USC Hawthorne/Lennox Crenshaw Vermont/ thens 37th St/ USC Slauson Manchester Harbor Fwy Rosecrans Harbor Gateway Transit Ctr Carson Pershing Square DOWNTOWN L Grand/LTTC valon San Pedro St Washington Vernon Slauson Florence Firestone Compton rtesia Del mo Wardlow REGIONL CONNECTOR 103rd St/ Watts Towers Willowbrook/ Rosa Parks Little Little Tokyo/ Tokyo/ rts Dist Los ngeles River Pico/liso Pico/liso Long Beach Bl Mariachi Mariachi Plaza Plaza Lakewood Bl Norwalk GTEWY CITIES Soto Indiana Maravilla ESTSIDE East L Civic Ctr tlantic Rail Station Transfer Station Busway Street Service UNDER CONSTRUCTION Metro Rail Red Line North Hollywood to Union Station Purple Line Wilshire/Western to Union Station Blue Line Downtown L to Long Beach Expo Line Downtown L to Santa Monica Green Line Redondo Beach to Norwalk Gold Line East Los ngeles to zusa Busway Station SOUTH BY Pacific Coast Hwy Pacific v Willow St Pacific Coast Hwy naheim St 5th St Metro Busway Orange Line Chatsworth to North Hollywood Silver Line San Pedro to El Monte Street Service in Downtown L and San Pedro Downtown Long Beach 1st St mtrak amtrak.com Regional Rail Metrolink metrolinktrains.com irport Shuttle LX Flyway lawa.org/flyaway MY 2016 Subject to to Change MM 2016 LCMT

22 20 Delivering Transit & Highway Projects Metro continues construction of one of the largest public works programs in merica, thanks to Measure R and other funding partners. These transit and highway construction projects will improve mobility and increase vehicle capacity, allowing for smoother traffic flow, better system connectivity and seamless travel for everyone in Los ngeles County. list of major projects and programs underway in FY17 is shown below. Transit Projects > Crenshaw/LX will complete design efforts and continue construction with station and tunneling activities > lternatives analysis, environmental impact and/or refinement studies ongoing for: - irport Metro Connector - Eastside Extension Phase II - Sepulveda Pass Corridor - East San Fernando Rapidways North/South - South Bay Metro Green Line Extension - West Santa na Branch Highway Projects > Continuation of Countywide Soundwall Projects > Southwestern Yard design/build contract will continue final design and construction with service opening in line to support the Crenshaw/LX project > Metro irport Connector accommodations will continue design efforts and construction to minimize system impacts when the final irport Connector Station project is developed > Construction is underway for: I-5 North & South Capacity Enhancements I-5 South Carmenita Road Interchange Improvement I-5 North SR-134 Improvement - lameda Corridor East Grade Separation - I-405 Enhancements - SR-60 HOV Lane > Regional Connector, connecting Little Tokyo and 7th Street/Metro stations, will continue ongoing design and construction with tunneling work to start in FY17 > Westside Purple Line Extension Section 1 to La Cienega ongoing design and advanced utility relocations leading to construction; continued pursuit of a Full Funding Grant greement (FFG) for Section 2; and pursue project acceleration for Section 3 > Environmental, planning and engineering studies: - I-605 Hot Spots - SR-710 North Gap Closure - SR-710 South and Early ction Projects - SR-138 Capacity Enhancements > Subregional Projects: - Las Virgenes/Malibu Highway Operational Improvements - I-405, I-110, I-105, SR-91 Ramp & Interchange
23 21 MeasURe R Rail and Rapid TRnsit ExPnsion & HighwY Improvements Ventura County C SN FERNNDO VLLEY 1I 118 1M 101 1M J 170 Los ngeles County B 210 RROYO VERDUGO K D E 138 1M NORTH COUNTY 14 C J E Inset Not to Scale L LS VIRGENES/MLIBU F WESTSIDE CITIES 1L 1 1D 134 1M CENTRL LOS NGELES 10 1C I 1E 1F 1M 10 SN GBRIEL VLLEY 1M Metro Rail & Rapid Transit Projects* 1B M 5 1M San Bernardino County Metrolink Capital Improvements 1H Orange County Existing Metro Rail & Busway Transit System Capacity Enhancement Projects 1G M H 1K 91 GTEWY CITIES G 405 Interchange, Ramp and/or Grade Separation Improvements SOUTH BY CITIES rea Operational Improvements 10 Existing Highways Rail and Bus Rapid TRnsit ExPnsion HighwY Improvements 1 Exposition Boulevard Light Rail Transit (completed) I-5 Capacity Enhancement: I-605 to Orange County Line 1B Crenshaw Transit Corridor B I-5 Capacity Enhancement: SR-134 to SR-118 1C Regional Connector C I-5/SR-14 HOV Direct Connector (completed) 1D Westside Purple Line Extension (to be opened in segments) D I-5 HOV Lanes from SR-14 to Parker Rd & Truck Lanes from SR-14 to 1E Gold Line Eastside Extension *(alignment to be selected) Kern County Line 1F Gold Line Foothill Light Rail Transit Extension (completed) E SR-138 Capacity Enhancements 1G Green Line Extension South Bay Corridor * F I-405 Sepulveda Pass Improvements Project (completed) 1H irport Metro Connector G I-605 Corridor Hot Spot Interchanges (Study rea) 1I Orange Line Canoga Extension (completed) H I-710 Corridor Project EIS/EIR 1J East San Fernando Valley Transit Corridor * I SR-710 North (Initial Study rea) 1K West Santa na Branch Corridor * J High Desert Corridor Project 1L Sepulveda Pass Transit Corridor * K rroyo Verdugo Operational Improvements 1M Metrolink Capital Improvement Projects (Los ngeles County) L Las Virgenes/Malibu Operational Improvements M South Bay (I-405, I-110, I-105 & SR-91) Ramp Operational Improvements * Locally Preferred lternative to be selected

24 22 Operating Capital In FY17, we continue our commitment to keeping our system in top form by dedicating $253 million to State of Good Repair (SGR), which is an element of the operating capital program. To ensure our system is safe and reliable, we must emphasize SGR as a major regional transportation priority that is just as important as building transit projects and providing transit service. s we take a proactive approach to continuously maintaining our assets, we are directly improving our ability to deliver more passengers on time without interruptions. SGR capital improvements for FY17 include completion of delivery on the last of the foot CNG buses procured in earlier fiscal years. Procurement will begin for new 40-foot and articulated bus acquisitions, while bus midlife and engine replacements will restore our older vehicles. Similar projects will be undertaken for our rail lines, with contract awards anticipated for new heavy rail vehicles and heavy rail vehicle overhauls, as well as continued delivery of new light rail vehicles and progress on light rail vehicle overhauls. To update our rail stations, SGR improvements are being made to the Willowbrook/Rosa Parks Station, the transfer point between the Blue Line and Green Line. Furthermore, escalators in the aging Red Line stations will be modernized and rehabilitated to improve access to our transit system. Meanwhile, nonrevenue vehicle replacements will provide more reliable transportation for Metro staff and improve response times for service needs and emergencies. Operating Capital by Category OpeRTing CapiTl By MODe sfety & stte OF cpitl MODe ($ in thousands) security GOOD RePiR infrstructure TOTl Note Totals may not add due to rounding. Bus $ 112 $ 96,980 $ 4,056 $ 101,148 Rail Blue Line 19,309 15,961-35,270 Gold Line - 4,316 1,761 6,077 Green Line 770 2,274-3,044 Red/Purple Line 7,356 31,513 1,343 40,212 Multiple Rail Lines 1,503 60, ,112 Mixed Mode 12,203 19,748 12,817 44,768 Bike - - 6,489 6,489 Other (Technologies, Regional, etc.) 12,536 21,626 2,452 36,615 Total Operating Capital $ 53,789 $ 253,035 $ 29,912 $ 336,735

25 23 Safety & Security Improvements Metro defines operating capital as an investment for the repair, rehabilitation and replacement required to maintain reliable, safe, effective and efficient transit service. n operating capital program that achieves this vision requires enhancing and improving the transit system with up-to-date safety features and technological improvements that address security concerns in today s environment. This year, the majority of rail safety and security capital improvements are planned for the oldest Metro Rail line, with $19 million budgeted for improvements on the Blue Line. Infrastructure upgrades are being made to enhance pedestrian safety at grade crossings, and the signal system continues to be rehabilitated on both the Blue Line and the Green Line to ensure that trains can travel safely on our expanding rail system. Construction of the Red Line Universal City pedestrian bridge is expected to be completed in FY17, and work will continue on the Red Line to Orange Line pedestrian underpass at North Hollywood Station. These projects will improve safety by eliminating the necessity of crossing vehicular traffic when traveling to or between these stations on foot. Finally, to enhance systemwide safety and security, improvements to the Emergency Operations Center will continue through FY17, as will security upgrades to the Universal Fare System. $150,000 $125,000 $100,000 $75,000 Safety & Security State of Good Repair Capital Infrastructure Operating Capital by Mode ($ in Thousands) $50,000 $25,000 $0 Rail Bus Mixed MODe, Bike & Other Note Totals may not add due to rounding.

26 24 New Projects ctive Transportation ctive transportation refers to human-powered methods of travel, such as bicycling, walking, skating or using a wheelchair to get from one place to another. Everyone uses active transportation at some point in a trip, whether walking to a rail station, bicycling to work or rolling home from a bus stop. In FY17, Metro continues work on a number of projects and programs to advance active transportation and provide more travel options throughout Los ngeles County. In July 2016, Metro Bike Share will launch in downtown Los ngeles with up to 65 stations and 1,000 bicycles. This form of active transportation is designed to serve as a new first-last mile solution for connecting users with transit in the downtown area. Payment for Metro Bike Share is fully integrated with the bus and rail system: the program utilizes TP fare payment and will be the first bike share program in North merica that was planned as an extension of transit. s we launch Metro Bike Share downtown, we are also working with other communities to expand the system in the next few years to areas such as Pasadena, Huntington Park, Glendale, Burbank, North Hollywood, East Los ngeles, Exposition Park, the San Gabriel Valley and others. Work continues on the L River Gap Closure Project, which will close the gap in the L River Bike Path between Elysian Valley and Vernon. Once the project is complete, there will be a continuous 32-mile bikeway along the river running from the San Fernando Valley in the north to Long Beach in the south. Similarly, the Rail to Rail/River ctive Transportation Corridor (TC) will provide the communities of south and southeast Los ngeles with a dedicated bicycle and pedestrian corridor. The TC will improve multimodal connectivity at three regionally significant north-south transit lines: the future Crenshaw/LX Line, the Silver Line bus and the Blue Line, with future connection to the L River. Together, these efforts will create a backbone for a new active transportation infrastructure while simultaneously enhancing mobility, providing increased commute options and improving the overall quality of life for the local communities surrounding the projects. Joint Development Last year, Metro launched the Transit Oriented Communities Demonstration Program to showcase a comprehensive

27 25 approach to building communities that support transit. Under the program, Metro partnered with other government agencies to develop a Transit Oriented Communities Loan Fund that will support affordable housing and small businesses along transit corridors. We also adopted a formal policy on affordable housing. The new policy encourages the construction of more affordable housing in transit oriented communities by establishing a goal that 35% of residential units built on Metro owned land be affordable to households at or below 60% of the median income for the area. Joint development efforts continue in FY17 with the commencement of community engagement for the El Monte Station, Vermont/Santa Monica Station and Division 6 joint development sites. Four Request for Proposals (RFPs) will be released to solicit new ideas for two sites along the Crenshaw/ LX corridor and two in Boyle Heights along the Gold Line Eastside extension. Developer selections will be brought to the Board before the end of the fiscal year. Goods Movement There is growing interest by our federal and state partners in the Los ngeles County ports as a crucial import and export site. Together, the Ports of Los ngeles and Long Beach make up the largest seaport in the United States, facilitating more than 14 million containers per year. ccordingly, goods movement is a major area of focus for the agency this year as Metro works to coordinate goods movement policy and funding in Los ngeles County and surrounding regions. These efforts will ensure that a plan is in place to alleviate congestion on high traffic goods movement corridors, enabling Los ngeles County to continue to thrive as the country s main port for international trade. Urban Greening Through providing mobility options and choices, Metro plays an active part in lowering greenhouse gas emissions and increasing both physical and economic health in our local communities. In January 2016, the Metro Board adopted the Urban Greening Implementation ction Plan, which includes tools for developing projects that improve transit access and sustainability of areas around stations. The website for the program showcases a user-friendly toolkit that provides placemaking and greening resources for local jurisdictions and community groups spearheading projects around transit locations, making Metro a key player in sustainable planning and design throughout the entire region. Parking Management Metro s parking program, which provides parking for approximately four million cars annually, implemented a new parking ordinance in FY16. The ordinance establishes guidelines that govern the management of Metro s 87 parking facilities, which serve 59 transit stations with approximately 25,000 total parking spaces. In FY17, a parking guidance system will be implemented at targeted high-use facilities to provide real-time parking availability information to our customers. Meanwhile, a parking management pilot program will be launched in order to manage demand through parking fees and permits. To explicitly lay out future enhancements, parking program staff will finalize the Supportive Transit Parking Program Master Plan and bring it to the Board for adoption this year. s we work to improve the management of available parking, we are striving to make it easier and more convenient for drivers to choose transit over their cars.
28 26 Budget Summary Resource ssumptions > Sales tax and TD revenues are expected to grow at 3.3% over the FY16 budget. This represents a growth consistent with actual and projected receipts for FY16 and is in line with nationally recognized economic forecasting sources. Summary of Resources ($ in Millions) CPiTL & BoND ResouRCES $2, % SLES Tax, ST & TD $2, % > Fare revenues will increase by 1.8% over the FY16 budget reflecting a full year of operations of the Gold Line Foothill extension to zusa and the Expo Line extension to Santa Monica. > State Transit ssistance (ST) revenues for bus and rail operations and capital in FY17 are expected to be $52.9 million regionwide, representing a 50.0% decrease from the FY16 budget due to continued statewide decline in diesel fuel prices and demand. > Grant reimbursements, Transportation Infrastructure Finance and Innovation ct (TIFI) loan drawdowns and sales tax carryover will total $2.3 billion in FY17, which is in line with planned expenditure activities. Cap and Trade funding for Metro totals $13 million and Federal CNG fuel credits of $18 million are expected to fund operations. > ExpressLanes toll revenues are expected to come in at $60.0 million in FY17, which equates to a 3.5% decrease from the FY16 budget based on actuals year to date. > dvertising revenues of $25.1 million are based on a fixed guaranteed amount. OperatiNG & other RevENuES $ % FTE Summary Fy16 Fy17 by DePRTMent BUDGet DOPTeD change BUDGeted ResOURces Fy16 Fy17 ($ in Millions) BUDGet DOPTed % Change Board of Directors Chief Executive Office Communications Congestion Reduction Finance & Budget Information Technology Operations 7,855 7,807 (48) Planning & Development Program Management Vendor/Contract Management Subtotal gencywide Non-Represented 1,483 1,483 - Subtotal gencywide Represented 8,263 8, Sales Tax, ST & TD $ 2,801.7 $ 2, % Operating & Other Revenues % Capital & Bond Resources 2, , % Total Resources $ 5,802.4 $ 5, % Total FTEs 9,746 9,776 30
29 27 Summary of Expenditures ($ in Millions) CapiTL $2, % Expenditures ssumptions > The FY17 budget assumes a slight 0.8% decrease in bus revenue service hours, primarily due to increased speed and optimization of service levels. This also includes implementation of Line 501 (North Hollywood to Pasadena Express) for a full year and other anticipated special event coverage and bus bridges. > Rail revenue service hours will increase by 15.4%, reflecting a full year of operations of the Gold Line Foothill extension to zusa and the Expo Line extension to Santa Monica. Budgeted headways will match current actual headways for night service, and weekend mid-day/pm headways on Gold Line will align with other rail lines. > The budget reflects negotiated wage and salary provisions for represented employees. The wage increase by these provisions is at least 3% for annual wage increases and an additional amount for step increases up to the maximum pay rate. In line with these negotiated wage rates, an average 3% merit increase is also included for non-represented employees. Operations $1, % DEBT SERviCE $ % GENERL PLNNing & ProGRMS $ % CoNGESTion Management $ % SuBSidy FuNDiNG ProGRMS $1, % > Health and welfare rates include an annualized average increase of approximately 10% for represented employees and 5% for non-represented employees. > Capital program assumptions include expansion of Measure R transit and highway activities, increased emphasis on safety and security projects and enhanced bus and rail vehicle midlife maintenance projects. BUDGeted ExpendiTURes Fy16 Fy17 ($ in Millions) BUDGet DOPTed % Change ExpendiTURes By DePRTMent Fy16 Fy17 ($ in Millions) BUDGet DOPTed $ Change Operations $ 1,500.4 $ 1, % Capital 2, , % Subsidy Funding Programs 1, , % Congestion Management % General Planning & Programs % Debt Service % Total Expenditures $ 5,802.4 $ 5, % Board of Directors $ 43.4 $ 41.2 $ (2.2) Chief Executive Office (7.0) Communications (1.5) Congestion Reduction Finance & Budget 1, , Information Technology Operations 1, ,621.0 (106.5) Planning & Development Program Management 2, ,976.2 (71.0) Vendor/Contract Management (4.6) Total Expenditures $ 5,802.4 $ 5,626.2 $ (176.2)

30

31 Budget Details
32 30 Resources Summary of Resources, Expenses & Resulting Surplus (Deficit) ResOURces & ExpendiTURes FY16 FY17 ($ in millions) BUDGet DOPTed $ Change % Change Sales Tax, TD & ST Revenues (1) Proposition $ $ $ % Proposition C % Measure R % Transportation Development ct (TD) % State Transit ssistance (ST) (52.8) -50.0% Subtotal Sales Tax, TD & ST $ 2,801.7 $ 2,837.9 $ % Operating & Other Revenues Passenger Fares $ $ $ % ExpressLanes Tolls (2.2) -3.5% dvertising % Other Revenues (2) % Subtotal Operating & Other Revenues $ $ $ % Capital & Bond Resources Grants Reimbursements (3) $ 1,013.2 $ $ (210.4) -20.8% Bond Proceeds, TIFI & Prior Year Carryover (4) 1, ,486.6 (14.0) -0.9% Subtotal Capital and Bond Resources $ 2,513.8 $ 2,289.4 (224.4) -8.9% Total Resources $ 5,802.4 $ 5,626.2 (176.2) -3.0% gencywide Expenditures 5, ,626.2 (176.2) -3.0% (Deficit) / Surplus $ - $ - $ - 0.0% Total FY17 Resources: $ 5,626.2 ($ in Millions) BoND ProCEEDS, TIFI & Prior Year CRRyover $1, % Proposition $ % Notes (1) Sales tax and TD revenues for FY16 Budget represent reforecasted levels based on 2nd quarter actual data from the State Board of Equalization (SBE). Proposition C $ % (2) Includes bike program revenues, park and ride revenues, lease revenues, vending revenues, film revenues, county buy down, auto registration fees, transit court fees, CNG credits, investment income and other miscellaneous revenues. Grants ReiMBuRSEMENTS $ % MeasuRE R $ % (3) Includes grant reimbursement of preventative maintenance, operating capital, highway capital and construction costs. (4) Represents use of bond proceeds, TIFI (Transportation Infrastructure Finance and Innovation ct) drawdowns and sales tax revenue received and unspent in prior years. Totals may not add due to rounding. Other RevENuES $ % dvertising $ % ExPRESSLNES ToLLS $ % PSSENGER FRES $ % STTE TRNSit SSiSTNCE (ST) $ % TRNSPoRTTion Dev ct (TD) $ %
33 31 eligible Revenues FY16 FY17 FOR ($ in millions) BUDGet (1) DOPTed $ Change % Change OpeRTions Sales Tax, TD & ST Revenues Proposition 5% dministration $ 38.5 $ 39.8 $ % 25% Local Return % 35% Rail Development % 40% Discretionary Transit (95% of 40%) % Incentive (5% of 40%) % Estimated Tax Revenue from Prop $ $ $ % Proposition C 1.5% dministration $ 11.6 $ 11.9 $ % 5% Rail/Bus Security % 10% Commuter Rail % 20% Local Return % 25% Freeways/Highways % 40% Discretionary % Estimated Tax Revenue from Prop C $ $ $ % Measure R 1.5% dministration $ 11.6 $ 11.9 $ % 2% Transportation Capital Metro Rail % 3% Transportation Capital Metrolink % 5% Operations - New Rail (2) % 15% Local Return % 20% Operations - Bus % 20% Highway Capital % 35% Transportation Capital New Rail/BRT % Estimated Tax Revenue from Measure R $ $ $ % Transportation Development ct dministration $ 8.5 $ 8.5 $ - 0.0% 2.0% rticle 3 (Pedestrians & Bikeways) % 91.7% rticle 4 (Bus Transit) % 6.3% rticle 8 (Transit/Streets & Highways) % Estimated Tax Revenue from TD $ $ $ % State Transit ssistance ST Bus $ 54.9 $ 24.6 $ (30.3) -55.2% ST Rail (22.5) -44.4% Estimated Tax Revenue from ST $ $ 52.9 $ (52.8) -50.0% Total Sales Tax, TD and ST Revenues $ 2,801.7 $ 2,837.9 $ % Notes Revenues Eligible FOR Bus & Rail OpeRTions FY16 FY17 ($ in millions) BUDGet (1) DOPTed $ Change % Change Proposition $ $ $ % Proposition C % Measure R % TD % ST (52.8) -50.0% Total Revenues Eligible for Bus & Rail Operations $ 1,516.2 $ 1,510.2 $ (6.0) -0.4% (1) Sales tax and TD revenues for FY16 Budget represent reforecasted levels based on FY16 2nd Quarter actual data from the State Board of Equalization (SBE). (2) Measure R Rail 5% Operating funding is restricted to projects beginning rail operations after Measure R passage. Totals may not add due to rounding.
34 32 Expenditures Summary of Expenditures by Program PROGRM Type (1) FY16 FY17 ($ in millions) BUDGet (3) DOPTed $ Change % Change Metro Operations Bus $ 1,056.6 $ 1,118.2 $ % Rail % Subtotal $ 1,481.8 $ 1,573.9 $ % Regional ctivities & Other (0.4) -2.0% Total Metro Operations $ 1,500.4 $ 1,592.0 $ % Metro Capital Transit Capital Expansion $ 1,533.9 $ 1,680.8 $ % Operating Capital (202.7) -37.6% Subtotal $ 2,073.4 $ 2,017.5 $ (55.9) -2.7% Regional Rail Capital (8.6) -18.6% Highway Capital (110.6) -56.8% Total Metro Capital $ 2,314.4 $ 2,139.3 $ (175.0) -7.6% Total Metro Operations & Capital $ 3,814.7 $ 3,731.3 $ (83.4) -2.2% Subsidy Funding Programs Regional Transit (2) $ $ $ (6.3) -1.2% Local gencies % Wilshire BRT (6.1) -38.1% Federal Pass Throughs % Fare ssistance % Highway Subsidy (84.5) -41.8% Total Subsidy Funding Programs $ 1,379.0 $ 1,305.2 $ (73.8) -5.3% Congestion Management Freeway Service Patrol $ 28.3 $ 30.1 $ % ExpressLanes % Kenneth Hahn Call Box Program % Regional Integration of Intelligent Transportation System % Rideshare Services (0.9) -8.6% Total Congestion Management $ 99.3 $ $ % Notes (1) Combines related program costs regardless of Generally ccepted ccounting Principles (GP) reporting criteria used for fund financial statements on pages and General Planning & Programs Programs & Studies $ 41.6 $ 32.5 $ (9.1) -21.8% General Planning & Programming (16.3) -27.0% Legal, udit, Transit Court, Oversight & Other % Property Management/ Union Station & Development (0.1) -0.2% Total General Planning & Programs $ $ $ (22.1) -12.2% Total Debt Service $ $ $ (8.6) -2.6% Total Expenditures by Program $ 5,802.4 $ 5,626.2 $ (176.2) -3.0% (2) Represents subsidies to Municipal Operators, Metrolink and ccess Services. (3) FY16 budget represents all amendments that occurred after budget adoption in May Totals may not add due to rounding.
35 33 SuBSidy FuNDiNG ProGRMS $1, % CoNGESTion Management $ % GENERL PLNNing & ProGRMS $ % Total FY17 Summary of Expenditures by Program: $5,626.2 ($ in Millions) DEBT SERviCE $ % CapiTL $2, % Operations $1, % ExpendiTURes BY DePRTMent FY16 FY17 ($ in millions) BUDGet DOPTed $ Change % Change Summary of Expenditures by Department Board of Directors $ 43.4 $ 41.2 $ (2.2) -5.0% Chief Executive Office (7.0) -3.0% Communications (1.5) -2.5% Congestion Reduction % Finance & Budget 1, , % Information Technology % Operations 1, ,621.0 (106.5) -6.2% Planning & Development % Program Management 2, ,976.2 (71.0) -3.5% Vendor/Contract Management (4.6) -6.3% Total Expenditures by Department $ 5,802.4 $ 5,626.2 $ (176.2) -3.0% ExpendiTURes BY TYPe FY16 FY17 ($ in millions) BUDGet DOPTed $ Change % Change Summary of Expenditures by Type Salaries & Benefits $ 1,091.7 $ 1,140.8 $ % sset cquisitions for Transit & Highway Projects 1, ,570.6 (147.9) -8.6% Professional Services & dvertising (42.4) -7.9% Regional Transit / Highway Subsidies 1, ,305.2 (73.8) -5.3% Maintenance & Security Contracts % Materials & Supplies % Insurance / Taxes / PL/PD / Workers Comp % Training & Travel % s-needed / Interns / ELTPs (1.5) -9.7% Debt (14.7) -4.4% Total Expenditures by Type $ 5,802.4 $ 5,626.2 $ (176.2) -3.0% Note Totals may not add due to rounding.
36 34 Enterprise Fund: Bus & Rail Operations Summary of Resources, Expenses & Resulting (Deficit) / Surplus FY17 DOPTed ResOURces & Expenses FY16 TRnsit Regional ($ in millions) BUDGet TOTl bus rail court ctivities Transit Operations Resources Transit Fares & Other Revenues Fares $ $ $ $ 93.3 $ - $ - dvertising Other Revenues (1) Total Fare & Other Revenues $ $ $ $ 96.7 $ 1.4 $ - Federal & State Grants Federal Preventive Maintenance $ $ $ $ 86.5 $ - $ - Federal CMQ Federal & State Grants Total Federal & State Grants $ $ $ $ $ - $ 2.1 Local Subsidies Prop - (40% Bus) & (35% Rail) $ $ $ $ $ - $ - Prop C - (40% Bus/Rail) & (5% Security) Measure R - (20% Bus) & (5% Rail) TD rticle ST Toll Revenue Grant General Fund & Other Funds Total Local Subsidies $ $ $ $ $ - $ 17.6 Total Transit Operations Resources $ 1,515.5 $ 1,599.5 $ 1,122.7 $ $ 1.4 $ 19.7 Notes (1) Other Revenues include interest income, parking charges, vending revenues, county buy down, transit court and other miscellaneous revenues. (2) Includes funding from Sales Tax, General Fund, State Repayment of Capital Project Loans, local muni participation, and State Proposition 1B cash funds. (3) Year-to-year changes in overhead distribution reflect changes in overhead allocation approved by federal funding partners. (4) Other Expenses includes utilities, credits, taxes, advertisement, settlement, travel expenses and training, seminars and periodicals. (5) Capital expenses for operations and construction project planning are combined for reporting purposes. Totals may not add due to rounding. Transit Capital Resources Federal, State & Local Grants $ $ $ 41.6 $ $ - $ - Local & State Sales Tax (2) Other Capital Financing , , Total Transit Capital Resources $ 2,073.8 $ 2,017.5 $ $ 1,839.4 $ - $ - Total Transit Operations & Capital Resources $ 3,589.3 $ 3,617.0 $ 1,300.8 $ 2,295.0 $ 1.4 $ 19.7 Transit Operations Expenses Labor & Benefits $ $ 1,008.1 $ $ $ 0.5 $ 21.1 Fuel & Propulsion Power Materials & Supplies Contract & Professional Services PL/PD & Other Insurance Purchased Transportation llocated Overhead (3) Regional Chargeback (27.8) Other Expenses (4) Total Transit Operations Expenses $ 1,515.5 $ 1,599.5 $ 1,122.7 $ $ 1.4 $ 19.7 Capital Expenses Transit Capital Expenses Operating 2, , , Transit Capital Expenses Planning Total Transit Capital Expenses (5) $ 2,073.8 $ 2,017.5 $ $ 1,839.4 $ - $ - Total Transit Operations & Capital Expenses $ 3,589.3 $ 3,617.0 $ 1,300.8 $ 2,295.0 $ 1.4 $ 19.7 Transit Operations & Capital (Deficit)/Surplus $ - $ - $ - $ - $ - $ -
37 Enterprise Fund: Other Operations 35 FY17 DOPTed ResOURces & Expenses FY16 Union express Bike PRk & ($ in millions) BUDGet TOTl Station Lanes ShRe Ride Summary of Resources, Expenses & Resulting (Deficit) / Surplus Other Transit Operations Resources Toll Fares & Other Revenues Tolls & Violation Fines $ 62.2 $ 60.0 $ - $ 60.0 $ - $ - Rental & Lease Income Total Toll Fares & Other Revenue $ 62.9 $ 64.9 $ 1.1 $ 60.0 $ 2.7 $ 1.1 Local Subsidies Prop & C $ 0.7 $ 0.3 $ - $ - $ - $ 0.3 General Fund & Other Total Local Subsidies $ 3.3 $ 5.5 $ - $ - $ 1.8 $ 3.7 Total Other Transit Operations Resources $ 66.2 $ 70.4 $ 1.1 $ 60.0 $ 4.5 $ 4.8 Transit Other Operations Expenses Labor & Benefits $ 2.7 $ 3.9 $ 0.5 $ 2.1 $ 0.5 $ 0.8 Materials & Supplies Contract & Professional Services PL/PD & Other Insurance llocated Overhead Other Expenses Total Other Transit Operations Expenses $ 54.0 $ 62.4 $ 1.1 $ 52.4 $ 4.2 $ 4.6 Other Operations non Operating Expenses Congestion Relief Reserve $ 0.1 $ - $ - $ - $ - $ - Congestion Relief Transit Operating Subsidy Congestion Relief Toll Revenue Grant Program (1) Total Other Operations non Operating Expenses $ 12.9 $ 13.6 $ - $ 13.6 $ - $ - Transit Other Operations (Deficit)/Surplus (2) $ (0.7) $ (5.6) $ - $ (6.0) $ 0.3 $ 0.2 Notes (1) Net Tolls are designated for the Metro ExpressLanes Net Toll Revenue Reinvestment Program. (2) Current year deficit is funded with equity earned from prior years. Totals may not add due to rounding.
38 36 Capital Program Capital Projects FORecasted cpitl PROject CateGORY expenditures FY17 life of ($ in thousands) ThRU FY16 DOPTed PROject Measure R Transit Capital Expansion Transit Construction Projects Bus cquisition 30 Zero Emission/Super Low Emission $ 4,510 $ 6,663 $ 30,000 Rail Crenshaw/LX Light Rail Transit 1,079, ,282 2,223,734 Expo Blvd Light Rail Transit Phase 1 969,033 11, ,900 Expo Blvd Light Rail Transit Phase 2 1,168, ,394 1,517,642 Gold Line Foothill Extension to zusa 885,683 15, ,619 Regional Connector 671, ,991 1,599,044 Westside Purple Line Subway Extension 1,043, ,480 3,500,856 Bike Expo Phase 2 Bikeway 15, ,102 subtotal Transit Construction Projects $ 5,838,480 $ 1,654,487 $ 10,816,898 Transit Planning Projects irport Metro Connector (1) $ 13,922 $ 10,784 $ 24,706 Eastside Extension Phase 1 & 2 (1) 23,576 3,242 26,818 Eastside Light Rail ccess (1) 16,164 5,295 21,459 Gold Line Foothill Extension (2) Green Line Ext: Redondo to South Bay (1) 6, ,022 San Fernando Valley East N/S Rapidways (1) 10,562 1,362 11,924 Sepulveda Pass Corridor (1) 6,194 3,332 9,527 West Santa na Branch Corridor (1) (3) 3,872 1,569 5,442 subtotal Transit Planning Projects $ 80,621 $ 26,277 $ 106,897 Total Measure R Transit Capital Expansion $ 5,919,101 $ 1,680,764 $10,923,795 Operating Capital Safety & Security Bus $ 25 $ 112 $ 5,038 Rail Blue Line 99,706 19, ,075 Green Line 6, ,800 Red/Purple Line 38,120 7,356 54,784 Multiple Rail Lines 17,974 1,503 20,594 Mixed Mode 34,046 12,203 67,054 Other (Technologies, Regional, etc.) 10,897 12,536 50,931 subtotal Safety & Security $ 207,258 $ 53,789 $ 390,275 Notes (1) No Board dopted Life of Project (LOP) during planning phase; project is funded on an annual basis. (2) FY17 budget of $8M is captured in subsidies. (3) Total FY17 budget is $1,799K; $230K is captured in subsidies. State of Good Repair Bus $ 601,137 $ 96,980 $ 1,153,358 Rail Blue Line 70,636 15, ,194 Gold Line 2,278 4,316 25,507 Green Line 2,229 2,274 37,051 Red Line 65,400 31, ,155 Multiple Rail Lines 117,112 60, ,794 Mixed Mode 12,320 19,748 35,797 Other (Technologies, Regional, etc.) 175,556 21, ,347 subtotal State of Good Repair $ 1,046,669 $ 253,035 $ 2,764,202 Totals may not add due to rounding.
39 37 FORecasted cpitl PROject CateGORY expenditures FY17 life of ($ in thousands) ThRU FY16 DOPTed PROject Capital Infrastructure Bus $ 185,830 $ 4,056 $ 191,774 Rail Gold Line 890,247 1, ,688 Red/Purple Line 40,571 1,343 46,706 Multiple Rail Lines 3, ,418 Mixed Mode 2,245 12,817 78,558 Bike 6,290 6,489 12,933 Other (Technologies, Regional, etc.) 402 2,452 3,723 subtotal Capital Infrastructure $ 1,129,001 $ 29,912 $ 1,244,800 Total Operating Capital $ 2,382,927 $ 336,735 $ 4,399,277 Total Capital Program $ 8,302,028 $ 2,017,499 $ 15,323,072 FY17 Capital Projects: $2,017.5 ($ in Millions) MESuRE R TRNSit PLNNiNG Projects $ % MESuRE R TRNSit ConstruCTion Projects $1, % STTE of Good REPir $ % SFETy & SECurity Projects $ % CapiTL infrstructure $ % MODe sfety & stte OF cpitl MODe ($ in thousands) security GOOD RePiR infrstructure TOTl FY17 Operating Capital Summary by Mode Bus $ 112 $ 96,980 $ 4,056 $ 101,148 Rail Blue Line 19,309 15,961-35,270 Gold Line - 4,316 1,761 6,077 Green Line 770 2,274-3,044 Red/Purple Line 7,356 31,513 1,343 40,212 Multiple Rail Lines 1,503 60, ,112 Mixed Mode 12,203 19,748 12,817 44,768 Bike - - 6,489 6,489 Other (Technologies, Regional, etc.) 12,536 21,626 2,452 36,615 Total Operating Capital $ 53,789 $ 253,035 $ 29,912 $ 336,735 Note Totals may not add due to rounding.
40 38 Regional Subsidy Funding Programs Summary of Regional Subsidy Funding Programs Regional SubsiDY Funding PROGRMs FY16 FY17 ($ in millions) BUDGet DOPTed $ Change % Change Regional & Local Transit Municipal & Local Operators $ $ $ % ccess Services (11.0) -12.9% Metrolink % Wilshire Bus Rapid Transit (6.1) -38.1% Fare ssistance Programs (INTP, RRTP, SHORE) (1) % Total Regional & Local Transit $ $ $ (12.4) -2.2% Local gencies llocation by Population Local Return (Prop, Prop C & Measure R) $ $ $ % TD rticles 3 & % subtotal llocation by Population $ $ $ % Call for Projects Regional Surface Transportation Improvements $ 61.5 $ 59.4 $ (2.1) -3.4% Local Traffic Systems % Regional Bikeways (0.8) -62.2% Transportation Demand Management (1.8) -32.0% Transportation Enhancements % Bus Capital (0.7) -9.9% subtotal Call for Projects $ 89.6 $ 88.4 $ (1.3) -1.4% Federal Pass Throughs Regional Grantee - FT $ 12.7 $ 16.2 $ % Job ccess & Reverse Commute Program (JRC) % New Freedom Capital & Operating (1.0) -24.7% Highway Pass Through Program (0.2) % Enhanced Mobility of Seniors/Disabled % subtotal Federal Pass Throughs $ 27.9 $ 37.1 $ % Other Toll Revenue Reinvestment Program $ 10.6 $ 7.0 $ (3.6) -33.7% Open Street Grant Program (1.7) -77.3% Transit Oriented Development & Other Sustainability Programs % Demo Projects-Highway (0.3) -40.0% subtotal Other $ 19.0 $ 13.8 $ (5.1) -27.1% Total Local gencies $ $ $ % Notes (1) Fare ssistance Programs include Immediate Needs Transportation Program (INTP), Rider Relief Transportation Program (RRTP) & Support for Homeless Re- Entry Program (SHORE). Totals may not add due to rounding.
41 39 Regional SubsiDY Funding PROGRMs FY16 FY17 ($ in millions) BUDGet DOPTed $ Change % Change Highway Subsidy I-5 North HOV & Truck Lanes $ 25.2 $ 21.2 $ (4.0) -15.9% I-5 South Capacity Enhancements (42.9) -71.1% SR-60 HOV Lane from I-605 to Brea Canyon Rd (1.6) % lameda Corridor East Grade Separation % Highway Operational Improvements - rroyo Verdugo (6.8) -64.3% Highway Operational Improvements - Las Virgenes/Malibu (11.6) -40.9% I-405 / I-110 / I-105 / SR-91 Ramp & Interchange (18.3) -69.8% I-605 Corridor Hot Spot (0.1) -1.9% SR-710 North Gap Closure (0.4) % SR-710 South Early ction Projects (12.9) -67.6% SR-138 Capacity Enhancements (5.0) -53.6% High Desert Corridor (2.0) % Total Highway Subsidies $ $ $ (84.5) -41.8% Total Regional Subsidy Funding Programs $ 1,379.0 $ 1,305.2 $ (73.8) -5.3% REGioNL & LoCL TRNSit $ % LoCL GENCies - LLoCTion by PopuLTion $ % FY17 Regional Subsidy Funding Program: $1,305.2 ($ in Millions) Highway SuBSidy $ % LoCL GENCies - other $ % LoCL GENCies - FEDERL PSS ThrouGHS $ % LoCL GENCies - CLL for ProJECTS $ % Note Totals may not add due to rounding.
42 40 Congestion Management Metro s Congestion Management programs are designed to tackle the ever present issue of traffic congestion in the region, whether by assisting broken down vehicles, clearing traffic accidents, promoting ridesharing or providing toll-based alternatives to waiting in traffic. Metro also sponsors the Regional Integration of Intelligent Transportation Systems (RIITS), a real-time traffic data monitoring network used by emergency services, transit agencies and thirdparty users throughout Southern California. Each of these measures contributes to decreasing traffic congestion, which in turn improves air quality in Los ngeles County. Congestion ManGement FY16 FY17 ($ in millions) BUDGet DOPTed $ Change % Change Freeway Service Patrol $ 28.3 $ 30.1 $ % ExpressLanes % Kenneth Hahn Call Box Program % Regional Integration of Intelligent Transportation System % Rideshare Services (0.9) -8.6% Total Congestion Management $ 99.3 $ $ % FY17 Congestion Management Budget: $110.9 ($ in Millions) FREEWy ServiCE PTRol $ % ExPRESSLNES $ % Note Totals may not add due to rounding. RiDESHRE ServiCES $ % REGioNL integrtion of intelligent TRNSPoRTTion System $ % KENNETH HHN CLL Box ProGRM $ %
43 General Planning & Programs 41 GeneRl Planning & PROGRMs FY16 FY17 ($ in millions) BUDGet DOPTed $ Change % Change ctive Transportation Program $ 8.8 $ 12.9 $ % dministrative & Planning Support (13.2) -40.1% Bus Rapid Transit (5.0) -33.1% Capital Improvement Studies (2.5) -80.6% Financial Planning/Grants Management % Governmental & Oversight ctivities % Joint Development % Parking Program % Real Estate % Sustainability (5.1) -30.9% Systemwide Planning and rts & Design (4.2) -25.8% Transit Court % Transit Security (7.0) -76.9% Union Station (1.5) -20.5% Other % Total General Planning & Programs $ $ $ (22.1) -12.2% CapiTL improvement Studies $ % Governmental & OvERSight CTivitiES $ % FY17 General Planning & Programs Budget: $158.6 ($ in Millions) FiNNCiL PLNNiNG/Grants Management $ % Joint DevELoPMENT $ % Bus RPid TRNSit $ % PRKiNG ProGRM $ % DMiniSTRTive & PLNNiNG SuppoRT $ % CTive TRNSPoRTTion ProGRM $ % Other $ % Union STTion $ % TRNSit CouRT $ % TRNSit SECurity $ % SuSTiNBility $ % SySTEMWiDE PLNNiNG ND RTS & DESiGN $ % REL ESTTE $ % Note Totals may not add due to rounding.
44 42 Debt Current Year Debt Service Expenses FY16 BUDGet FY17 DOPTed Funding DeMnd of DeBT Service ($ in ThOUsands) Bus Rail HighwY TOTl Bus Rail HighwY TOTl Resources Proposition 35% Rail Set side (1) $ - $ 143,296 $ - $ 143,296 $ - $ 139,036 $ - $ 139,036 Proposition 40% Discretionary 1,913-1,913 1,853-1,853 Proposition C 40% Discretionary 9,881 62,874-72,755 5,042 67,356-72,398 Proposition C 10% Commuter Rail - 13,504-13,504-13,533-13,533 Proposition C 25% Street & Highways - 27,022 28,098 55,120-27,651 28,173 55,823 Trans Development ct rticle 4 1, ,534 1, ,544 Measure R Transit Capital - New Rail 35% - 43,898-43,898-46,474-46,474 Measure R Transit Capital - Metrolink 3% Measure R Transit Capital - Metro Rail 2% - 7,163-7,163-2,902-2,902 Measure R Highway Capital 20% Measure R BB Federal Subsidy - 10,302-10,302-10,357-10,357 Proposition 35% Rail Set side (CR Debt) 2, ,179 2, ,184 Total Funding Demand Debt Service $ 15,508 $ 308,059 $ 28,098 $ 351,665 $ 10,624 $ 307,308 $ 28,173 $ 346,104 (Premium)/Discount mortization (2) (1,011) (20,086) (1,832) (22,929) (798) (23,074) (2,115) (25,988) Total Debt Service Expense $ 14,497 $ 287,973 $ 26,266 $ 328,736 $ 9,826 $ 284,234 $ 26,057 $ 320,117 Debt Service (Deficit) / Surplus $ - $ - $ - $ - $ - $ - $ - $ - Long-Term Enterprise Fund Debt Principal Obligations Beginning FY16 Balance Beginning FY17 Balance OUTsTnding DeBT PrinciPl Balance ($ in ThOUsands) Bus Rail HighwY TOTl Bus Rail HighwY TOTl Proposition $ 14,768 $ 1,106,032 $ - $ 1,120,800 $ 14,598 $ 1,095,572 $ - $ 1,110,170 Proposition C 87, , ,685 1,253,424 85, , ,642 1,230,950 Measure R (3) - 869, ,420-1,570,122-1,570,122 Transportation Development ct - rticle 4 3, ,758 2, ,350 Proposition 35% Rail Set side (CR Debt) 19, ,360 18, ,145 Total Outstanding Debt Principal Balance (4) $ 125,626 $ 2,890,452 $ 250,685 $ 3,266,762 $ 120,821 $ 3,566,274 $ 244,642 $ 3,931,736 Notes (1) Proposition 35% Rail Set side includes Union Station Purchase debt funding: $4.3M in FY16 and $3.7M in FY17. (2) mortizing the difference between the market value of the debt instrument and the face value of the debt instrument over the life of the debt. (3) Measure R Bond was issued in November lso included are $300M Measure R revolving credit and $618M TIFI (Transportation Infrastructure Finance and Innovation ct) loan draw down in FY16. (4) The Debt Service Expense and Outstanding Principal Balance excludes USG Building General Revenue Bonds of $13.5M Debt Service and $105.8M Outstanding Principal. It is treated as rent and reimbursed to the Enterprise Fund through the overhead allocation process. lso included $618.1 million of planned federal TIFI loan drawdowns during FY16 to fund Crenshaw and Regional Connector Transit Construction. Repayment of these loans will come from Measure R Transit Capital - New Rail 35% contingency fund and commence in FY21. Totals may not add due to rounding.
45 43 FY17 dopted Debt Policy: Maximum Permitted Debt Service MaxiMUM Tax Revenue Source FY17 MaxiMUM DDitional % of FOR DeBT ServicinG net Sales Tax FY17 nnul Bond Issuance llowble ($ IN MilliOns) Revenue DeBT Service DeBT Service (1) llowed Revenue Used Proposition (P) (2) P 35% (3) $ $ $ $ 1, % P 40% (4) N/ N/ 100.0% Proposition C (PC) (2) PC 10% (5) % PC 25% (6) % PC 40% (7) % Measure R (MR) (8) MR 35% (9) , % MR 20% (10) , % MR 2% (11) % MR 3% (12) % Notes (1) Per Board approved debt policy. (2) ssumes amortization of debt at 4.5% over 30 years. Maximum Permitted Debt Service ($ in Millions) $350 $300 $250 $200 $150 FY17 Net Sales Tax Revenue Maximum nnual Debt Service FY17 Debt Service (3) Debt policy limits annual debt service to 87% of P 35% tax revenue. (4) No further debt issuance is permitted pursuant to the debt policy. (5) Debt policy limits annual debt service to 40% of PC 10% tax revenue. (6) Debt policy limits annual debt service to 60% of PC 25% tax revenue. (7) Debt policy limits annual debt service to 40% of PC 40% tax revenue. (8) ssumes amortization of debt at 4.5% over remaining life of Measure R sales tax. (9) Debt policy limits annual debt service to 87% of MR 35% tax revenue. $100 (10) Debt policy limits annual debt service to 60% of MR 20% tax revenue. $50 (11) Debt policy limits annual debt service to 87% of MR 2% tax revenue. 0 (12) Debt policy limits annual debt service to 87% of MR 3% tax revenue. P 35% P 40% PC 10% PC 25% PC 40% MR 35% MR 20% MR 2% MR 3% Totals may not add due to rounding.
46 44 Fund Balances & Governmental Fund Financial Statements Governmental Funds: Estimated Fund Balances for the Year Ending June 30, 2017 estimted Ending Fund Type Fund ($ in millions) Balance Proposition Discretionary Transit (95% of 40%) (1) $ 3.3 Discretionary Incentive (5% of 40%) 14.1 Rail (35%) (2) 10.1 Interest 7.4 Total Proposition $ 34.9 Proposition C Discretionary (40%) (1) $ Security (5%) (1) 21.4 Commuter Rail (10%) (2) - Streets & Highway (25%) 76.4 Interest 20.0 Total Proposition C $ Measure R dministration (1.5%) $ 25.1 Transit Capital - Metrolink (3%) 8.7 Transit Capital - Metro Rail (2%) - Transit Capital - New Rail (35%) - Highway Capital (20%) New Rail Operations (5%) 19.3 Bus Operations (20%) (1) 2.2 Total Measure R $ Transportation Development ct (tda) rticle 3 (1) $ 17.7 rticle 4 (1) 93.0 rticle 8 (1) 1.3 Total TD $ State Transit ssistance (sta) Revenue Share (1) $ 2.9 Population Share - Total ST $ 2.9 Total PTMISE (3) $ 82.4 Total SFE Fund (2) $ 13.5 Total Other Special Revenue Funds (1) $ 43.6 Notes (1) Previously allocated to Metro, Municipal Operators and cities. General Fund dministration - Prop, Prop C & TD $ - Mandatory Operating Reserve General Fund / Other (2) Total General Fund $ Total of Estimated FY17 Ending Fund Balances $ 1,084.9 (2) Committed to board approved projects and programs. (3) PTMISE stands for Public Transportation Modernization, Improvement and Service Enhancement ccount. Committed for capital projects. Totals may not add due to rounding.
47 45 SPeciL RevenUE FUND (1) GeneRL FUND GOVERNMenTL FUNDS FY16 FY17 FY16 FY17 FY16 FY17 ($ in millions) BUDGet DOPTeD BUDGET DOPTED BUDGET DOPTED Revenue Sales Tax (2) $ 2,809.2 $ 2,845.3 $ - $ - $ 2,809.2 $ 2,845.3 Intergovernmental Grants (3) Investment Income Lease & Rental Licenses & Fines Federal Fuel Credits & Other Total Revenues $ 2,914.4 $ 2,899.7 $ 87.7 $ 85.1 $ 3,002.1 $ 2,984.8 TOTL Governmental Funds: Statement of Revenues, Expenditure & Changes in Fund Balances for the Years Ending June 30, 2016 and 2017 Expenditures Subsidies $ 1,309.8 $ 1,239.0 $ 48.3 $ 52.2 $ 1,358.1 $ 1,291.1 Operating Expenditures Debt & Interest Expenditures Debt Principal Retirement Total Expenditures $ 1,621.6 $ 1,421.6 $ $ $ 1,816.4 $ 1,610.5 Transfers Transfers In $ 21.5 $ 31.5 $ 96.5 $ 90.4 $ $ Transfers (Out) (1,938.8) (1,750.8) (54.9) (126.8) (1,993.8) (1,877.5) Proceeds from Financing Total Transfers $ (1,811.1) $ (1,616.8) $ 41.5 $ (36.3) $ (1,769.5) $ (1,653.1) Net Change in Fund Balances $ (518.3) $ (138.7) $ (65.5) $ (140.0) $ (583.8) $ (278.7) Fund Balances - beginning of year (4) $ 1,103.5 $ $ $ $ 1,658.5 $ 1,363.7 Fund Balances - End of Year $ $ $ $ $ 1,074.7 $ 1,084.9 Notes (1) Special Revenue Fund includes Measure R fund, which is presented separately on pages (2) Includes TD and ST, in addition to Prop, Prop C and Measure R sales tax revenues. (3) Includes grant revenues from Federal, State and Local sources including tolls. (4) Beginning FY17 Fund Balances reflect anticipated unspent FY16 budgeted expenditures. Totals may not add due to rounding.
48 46 Measure R Measure R: Impact to the Region The Measure R sales tax revenue ordinance approved by voters in 2008 has rapidly become the single largest local funding source for the transit capital building boom currently underway in Los ngeles County. Metro s management is focused on carefully using this funding to ensure that the transit capital and highway projects outlined in the ordinance become a reality. The investment in public transit and highway infrastructure made possible through Measure R and other funding partners has benefited the region not just in terms of improved mobility, but also with increased economic activity and job creation. This is no small feat considering the worldwide economic downturn at the time when Measure R was approved. Metrolink is the sole recipient of funding from the Measure R 3% component, which is eligible for operations, maintenance and expansion of the commuter rail system. These funds have helped finance various safety and system improvements, including the installation of the much needed positive train control system. Local jurisdictions in the county receive funding through the Local Return subfund, which is allocated based on population. s specified in the Measure R ordinance, these funds must be spent on transportation projects and infrastructure improvements such as major street resurfacing and rehabilitation, pothole repair, left turn signals, bikeways, pedestrian improvements, signal synchronization and transit. In addition, the Bus Operations subfund is allocated to Metro and other transit providers in the region based on the Formula llocation Procedure in order to fund countywide bus service operations, maintenance and expansion. Measure R Sales Tax Revenue: $795.7 ($ in Millions) TRNSit CPiTL: NEW Rail / BRT $ % HiGHWy CapiTL $ % LoCL RETurn $ % Operations: Bus $ % TRNSit CPiTL: Metrolink $ % TRNSit CPiTL: METRo Rail $ % DMinistration $ % Operations: Rail $ %
49 47 FY17 Est FY17 FY17 Fy17 Est subfund expenditure % of Beginning Revenues ExpendiTURe ending ($ in millions) PROGRM sles Tax Fund Bal BUDGet BudgeT Fund Bal Transit Capital New Rail and/or Bus Rapid Transit Capital Projects (2) 35.0% $ (60.5) $ $ (1) $ - Measure R Ordinance: Summary of Sales Tax Revenues, Expenditures & Fund Balances (by Subfund) Highway Capital Carpool Lanes, Highways, Goods Movement, Grade Separations & Soundwalls 20.0% Operations Bus Operations - Countywide Bus Service (Operations, Maintenance & Expansion) 20.0% Local Return (3) 15.0% Operations Rail Operations - (New Transit Projects Operations & Maintenance) 5.0% Transit Capital Metrolink Capital Improvement Projects within L County (Operations, Maintenance & Expansion) 3.0% Transit Capital Metro Rail Capital - System Improvements, Rail Yards & Rail Cars (2) 20.0% (4.4) dministration dministration 1.5% Subtotal Measure R Projects Funding Plan from Sales Tax Revenues $ $ $ $ Measure R Transit Capital 2% Bond Proceeds (4) Measure R Transit Capital 35% Commercial Paper (4) Measure R Transit Capital 35% TIFI Loan Proceeds (4) Subtotal Measure R Projects Funding Plan from Bond Proceeds, Commercial Paper & TIFI Loan Proceeds $ - $ $ $ - Subtotal Measure R Projects Funding Plan from Measure R Sources $ $ 1,644.3 $ 1,650.8 $ Subtotal Measure R Projects Funding Plan from Non-Measure R Sources (5) $ - $ $ $ - Total Measure R Projects Funding Plan $ $ 2,394.0 $ 2,400.5 $ Notes (1) Excludes $2.3M amortization cost of bond premium to reflect the total Measure R funding. (2) The deficit in the Beginning Fund Balance of Measure R Transit Capital 35% and Measure R Metro Rail Capital 2% is due to cash flow issue. Metro will resolve the deficit in FY17. (3) To the incorporated Cities within Los ngeles County and to Los ngeles County for the Unincorporated rea on a per capita basis for major street resurfacing, rehabilitation and reconstruction; pothole repair; left turn signals; bikeways; pedestrian improvements; streetscapes; signal synchronization; and transit. (4) Metro plans to draw down $435.0M TIFI (Transportation Infrastructure Finance and Innovation ct) loan in FY17 to fund Measure R Transit Capital 35% activities (including $381.6M for Westside Subway Extension project, and $53.4M for Regional Connector). Metro plans to use Measure R Transit Capital - New Rail 35% Bond proceeds of $284.6M for Crenshaw project and $129.0M for Westside Subway Extension project. (5) Funding from non-measure R funding sources for Measure R projects: Federal Subsidies $382.6M; State Subsidies $33.5M; Local Subsidies $333.6M. Totals may not add due to rounding.
50 48 Measure R Measure R: Projects / Funding MeasURe R non- PROjects / Funding MeasURe R MESURE R TOTl ($ in millions) Funds (1) Funds (2) Expenses Measure R Transit Capital - New Rail (35%) Eastside Light Rail ccess $ 1.6 $ 3.7 $ 5.3 Green Line Ext Redondo Beach-South Bay Regional Connector Sepulveda Pass Transit Corridor Regional Clean Fuel Bus Capital irport Metro Connector Gold Line Foothill Westside Purple Line San Fernando Valley East North/South Rapidways West Santa na Branch Corridor Crenshaw Light Rail Vehicles for Service Expansion Expo Expo Eastside Extension Phase Measure R Transit Capital - New Rail (35%) Total $ 1,016.0 $ $ 1,644.2 Measure R Highway Capital (20%) Countywide Soundwall Projects $ 12.7 $ - $ 12.7 High Desert Corridor I-405, I-110, I-105, SR91 Ramp & Interchange SR-710 North Gap Closure I-710 South Early ction Projects Phase II lameda Corridor E Grade Separation SR-138 Capacity Enhancements I-605 Corridor Hot Spots Interchanges Highway Operating Improvements Las Virgenes/Malibu Highway Operating Improvements rroyo Verdugo I-5 South Capacity Enhancements I-5 North Carmenita Road Interchange Improvements I-710 South Environmental Impact Report & Statement I-605 Interchange Improvement I-5 Capacity Enhancement from I-605 to Orange County Line Measure R Highway Capital (20%) Total $ $ - $ Notes (1) Measure R funding sources include Measure R Bond Proceeds, Measure R cash and TIFI loan. (2) Funding from non-measure R funding sources for Measure R projects: Federal Subsidies $470.0M; State Subsidies $37.7M; Local Subsidies $285.5M. Local Subsidies sources include Prop 35 bond proceeds, Prop C 25 bond proceeds, Prop cash, Prop C cash, TD, and local grants from cities. Measure R Transit Capital - Metro Rail (2%) Blue Line $ - $ 0.7 $ 0.7 Eastside Quad Gate Study & Installation Light Rail Fleet Midlife Regional Connector Transit Oriented Development Westside Purple Line Crenshaw Fare Gate Project Totals may not add due to rounding.
51 49 MeasURe R non- PROjects / Funding MeasURe R MESURE R TOTl ($ in millions) Funds (1) Funds (2) Expenses Red/Purple Line Vehicle Midlife Expo Heavy Rail Vehicles for Fleet Replacement Measure R Transit Capital - Metro Rail (2%) Total $ 8.3 $ $ Measure R Transit Capital - Metrolink (3%) Metrolink Transit Capital $ 25.0 $ - $ 25.0 Vincent Grade/cton Station Bob Hope irport Southern California Regional Interconnector Project (SCRIP) Grade Crossing Improvement Van Nuys North Platform Project Brighton to Roxford Double Track L County Grade Crossing Lone Hill to Control Point White Second Track Soledad Speed Increase Project Other Projects Measure R Transit Capital - Metrolink (3%) Total $ 51.1 $ 11.8 $ 62.9 Measure R Operations - Bus (20%) Metro Bus Share $ $ - $ Metro Orange Line Measure R 20% Formula llocation to Muni Operators (4) Measure R Operations - Bus (20%) Total $ $ - $ Measure R Operations - New Rail (5%) $ 60.4 $ - $ 60.4 Measure R dministration (1.5%) $ 16.1 $ 0.4 $ 16.4 Measure R Local Return (15%) $ $ - $ Measure R Debt Service Expenses (3) $ 49.4 $ 8.1 $ 57.5 Total Measure R Project/Funding Expenses $ 1,650.8 $ $ 2,400.5 Notes (1) Measure R funding sources include Measure R Bond Proceeds, Measure R cash and TIFI loan. (2) Funding from non-measure R funding sources for Measure R projects: Federal Subsidies $382.6M; State Subsidies $33.5M; Local Subsidies $333.6M. Local Subsidies sources include Prop 35 bond proceeds, Prop C 25 bond proceeds, Prop cash, Prop C cash, TD, and local grants from cities. (3) $2.3M amortization cost of bond premium is included as non-measure R funding source. Current debt service expenses are funded by Measure R Transit Capital - New Rail 35% and Measure R Transit Capital - Metro Rail 2%. (4) This amount does not include Non-Measure R funding supplied by other operators towards their own operating costs. Totals may not add due to rounding.
52 50 Full-Time Equivalents (FTE) FTEs by FY16 FY17 DePRTMent DeTil BUDGet DOPTeD change Board of Directors Board of Directors Inspector General Board of Directors Total Non-Represented Total Board of Directors by Representation Chief Executive Office Chief Executive Office Chief Policy Office Labor/Employee Relations Risk/Safety & sset Management System Security & Law Enforcement Chief Executive Office Total Non-Represented Represented Total Chief Executive Office by Representation CoMMunications Community Relations Customer Programs & Services Customer Relations Executive Office, Communications Government Relations Marketing Public Relations Communications Total Non-Represented Represented Total Communications by Representation Congestion Reduction Congestion Reduction Demonstration Project Motorist Services Congestion Reduction Total Non-Represented Total Congestion Reduction by Representation Finance & Budget ccounting Executive Office, Finance Office of Management & Budget TP Operations Treasury Finance & Budget Total Non-Represented Represented Total Finance & Budget by Representation Information Technology Information Technology Services Information Technology Total Non-Represented Represented Total Information Technology by Representation
53 51 FTEs by FY16 FY17 DePRTMent DeTil BUDGet DOPTeD change Operations Maintenance 2,873 2, Rail Transportation Service Development (153) Strategic Planning Rail Transit Operations - Bus Transportation 4,054 4,036 (18) Vehicle Engineering & cquisition Operations Total 7,855 7,807 (48) Non-Represented Represented 7,580 7,532 (48) Total Operations by Representation 7,855 7,807 (48) Planning & Development Countywide Planning & Development Planning/Strategic Financial Planning/Grants Management Strategic Initiatives & Real Property Management Transit Corridors & Systemwide Planning Planning & Development Total Non-Represented Total Planning & Development by Representation Program Management Highway Project Delivery Program Control Program Management, Transit Regional Rail Program Management Total Non-Represented Total Program Management by Representation Vendor/Contract Management dministrative Services Contract Support/Client Services Diversity & Economic Opportunity Procurement Supply Chain Management Vendor/Contract Management Total Non-Represented Represented Total Vendor/Contract Management by Representation Total gencywide Non-Represented 1,483 1,483 - Total gencywide Represented 8,263 8, Total gency 9,746 9,776 30

54

55 ppendices
56 54 ppendix I: Service Statistics Bus Rail TOTl FY16 FY17 FY16 FY17 FY16 FY17 Statistics BUDGet DOPTed % Change BUDGet DOPTed % Change BUDGet DOPTed % Change Service Provided (000) Revenue Service Hours (RSH) 7,062 7, % 1,094 1, % 8,156 8, % Revenue Service Miles (RSM) 78,950 79, % 22,844 25, % 101, , % Service Consumed (000) Unlinked Boardings 326, , % 108, , % 435, , % Passenger Miles 1,351,395 1,340, % 614, , % 1,965,630 2,004, % Operating Revenue (000) (3) Fare Revenue $ 254,896 $ 252, % $ 85,016 $ 93, % $ 339,912 $ 346, % dvertising/other $ 24,130 $ 29, % $ 2,297 $ 3, % $ 26,427 $ 32, % Total $ 279,026 $ 282, % $ 87,313 $ 96, % $ 366,339 $ 379, % Operating Cost Data (000) Transportation $ 378,661 $ 395, % $ 61,081 $ 71, % $ 439,742 $ 467, % Maintenance $ 316,203 $ 329, % $ 183,714 $ 213, % $ 499,917 $ 542, % Other & Support Cost $ 366,951 $ 398, % $ 180,431 $ 170, % $ 547,382 $ 568, % Total $1,061,815 $1,122, % $ 425,226 $ 455, % $1,487,041 $1,578, % Subsidy Data (000) $ 782,789 $ 840, % $ 337,913 $ 359, % $ 1,120,702 $ 1,199, % Per Boarding StatisticS Fare Revenue $ 0.78 $ % $ 0.78 $ % $ 0.78 $ % Operating Cost $ 3.25 $ % $ 3.90 $ % $ 3.41 $ % Subsidy $ 2.40 $ % $ 3.10 $ % $ 2.57 $ % Passenger Miles % % % Fare Recovery % 24.0% 22.5% -6.2% 20.0% 20.5% 2.5% 22.9% 21.9% -4.2% Per RSH StatisticS Revenue $ $ % $ $ % $ $ % Boardings % % % Passenger Miles % % % Transportation Cost $ $ % $ $ % $ $ % Maintenance Cost $ $ % $ $ % $ $ % Other & Support Cost $ $ % $ $ % $ $ % Total Cost $ $ % $ $ % $ $ % Subsidy $ $ % $ $ % $ $ % Per Passenger Mile Statistics Revenue $ 0.21 $ % $ 0.14 $ % $ 0.19 $ % Revenue Mile % % % Transportation Cost $ 0.28 $ % $ 0.10 $ % $ 0.22 $ % Maintenance Cost $ 0.23 $ % $ 0.30 $ % $ 0.25 $ % Other & Support Cost $ 0.27 $ % $ 0.29 $ % $ 0.28 $ % Total Cost $ 0.79 $ % $ 0.69 $ % $ 0.76 $ % Subsidy $ 0.58 $ % $ 0.55 $ % $ 0.57 $ % Fte s per Hundred (1) Operators per RSH % % % Mechanics per RSM % % % Service ttendants RSM % % % Maintenance of Way (MOW) % % % Inspectors per RM (2) Transit Operations Supervisors per RSH % % %
57 55 Revenue FY16 FY17 Service Hours BUDGet DOPTeD change FY16 FY17 BORDings (000) BUDGet DOPTeD change Bus Local & Rapid 6,327,663 6,248,575 (79,088) Silver Line 84, ,368 30,988 Orange Line 130, ,516 - Purchased Trans 519, ,501 (7,675) subtotal Bus 7,061,735 7,005,960 (55,775) Rail Blue Line 294, ,622 (16,861) Green Line 93,589 93,589 - Gold Line 214, ,141 34,072 Expo Line 166, , ,031 Red Line 325, ,852 (10,658) subtotal Rail 1,094,499 1,263, ,584 Total 8,156,234 8,269, ,809 Bus Local & Rapid 298, ,414 (2,569) Silver Line 4,472 4, Orange Line 8,194 8,094 (100) Purchased Trans 15,141 15, Subtotal Bus 326, ,271 (2,519) Rail Blue Line 25,387 25,387 - Green Line 12,083 12,083 - Gold Line 14,933 18,251 3,318 Expo Line 9,833 17,150 7,317 Red Line 46,759 46,759 - subtotal Rail 108, ,630 10,635 Total 435, ,901 8,116 Revenue FY16 FY17 Service Miles BUDGet DOPTeD change FY16 FY17 Passenger Miles (000) BUDGet DOPTeD change Bus Local & Rapid 68,701,920 67,843,231 (858,689) Silver Line 1,831,046 2,849,590 1,018,544 Orange Line 2,140,454 2,140,454 - Purchased Trans 6,276,209 6,291,462 15,253 subtotal Bus 78,949,629 79,124, ,107 Rail Blue Line 5,427,387 5,116,635 (310,752) Green Line 2,730,794 2,730,794 - Gold Line 4,224,326 4,896, ,359 Expo Line 3,075,049 6,061,320 2,986,271 Red Line 7,386,643 7,144,785 (241,858) subtotal Rail 22,844,199 25,950,219 3,106,020 Total 101,793, ,074,955 3,281,127 Bus Local & Rapid 1,209,733 1,199,338 (10,395) Silver Line 17,618 18, Orange Line 51,999 51,364 (635) Purchased Trans 72,046 72, Subtotal Bus 1,351,395 1,340,998 (10,397) Rail Blue Line 181, ,725 - Green Line 77,850 77,850 - Gold Line 90, ,444 20,079 Expo Line 39,751 69,331 29,580 Red Line 224, ,542 - Subtotal Rail 614, ,893 49,658 Total 1,965,630 2,004,891 39,261 Notes (1) Does not include purchased transportation miles/hours. (2) Per route mile. (3) FY16 boardings, passenger miles and fare revenues reflect FY16 year-end projections. Totals may not add due to rounding.
58 56 ppendix II: ctivity Based Bus Cost Model FY16 BUDGet FY17 DOPTed INc / (Dec) ctivities $ 000 $ / Rsh $ 000 $ / Rsh $ 000 $ / Rsh Transportation Wages & Benefits $347,905 $ $ 362,047 $ $ 14,142 $ 2.57 Services (11) - Materials & Supplies (41) (0.01) Training 7, , Control Center 8, , Scheduling & Planning 4, , (54) - Field Supervision 10, , , Total Transportation $ 378,661 $ $ 395,366 $ $ 16,705 $ 3.00 Maintenance Division Maintenance Wages & Benefits $ 148,965 $ $ 149,343 $ $ 378 $ 0.23 Fuel 28, , , Materials & Supplies 39, , , Fueling Contractor Reimbursement (1,000) (0.15) (1,000) (0.15) - - Services (7) - subtotal Division Maintenance $ 216,473 $ $ 221,771 $ $ 5,298 $ 1.06 Central Maintenance Wages & Benefits $ 20,829 $ 3.18 $ 21,201 $ 3.26 $ 372 $ 0.08 Materials & Supplies 6, , , Maintenance Services subtotal Central Maintenance $ 27,254 $ 4.17 $ 33,093 $ 5.10 $ 5,839 $ 0.93 Other Maintenance Maintenance Support $ 19,836 $ 3.03 $ 15,983 $ 2.46 $ (3,854) $ (0.57) Non-Revenue Vehicles 8, , (577) (0.08) Facilities Maintenance 42, , , Training 2, , Subtotal Other Maintenance $ 72,475 $ $ 74,333 $ $ 1,858 $ 0.37 Total Maintenance $ 316,203 $ $ 329,197 $ $ 12,994 $ 2.36 Other Operating Transit Security $ 36,993 $ 5.65 $ 53,717 $ 8.27 $ 16,725 $ 2.62 Revenue 33, , (5,627) (0.83) Service Development 12, , Safety 3, , Casualty & Liability 46, , , Workers Comp 49, , , Transitional Duty Program 1, , (44) (0.01) Utilities 15, , , Other Metro Operations 12, , (1,935) (0.28) Building Costs 11, , (869) (0.12) Copy Services Total Other Operating $ 223,410 $ $ 244,349 $ $ 20,939 $ 3.48 Support Departments Note Totals may not add due to rounding.
59 57 FY16 BUDGet FY17 DOPTed INc / (Dec) ctivities $ 000 $ / Rsh $ 000 $ / Rsh $ 000 $ / Rsh Support Departments Board Oversight $ 2,047 $ 0.31 $ 736 $ 0.11 $ (1,312) $ (0.20) CEO 3, , , Management udit Services 1, , (39) (0.00) Procurement 22, , , Communications 14, , , Finance 13, , (3,914) (0.59) Human Resources 2, , , Real Estate 4, , (1,282) (0.19) ITS 21, , , dministration 5, , (3,482) (0.53) Construction , Total Support Departments $ 93,147 $ $ 99,916 $ $ 6,770 $ 1.15 Total Local & Rapid Bus Costs $ 1,011,421 $ $ 1,068,829 $ $ 57,408 $ 9.98 Directly Operated Rsh 6,543 6,494 (48) Purchased Transportation Contracted Service $ 46,980 $ $ 49,000 $ $ 2,020 $ 5.31 Security 2, , , dministration Total Purchased Transportation $ 50,394 $ $ 53,883 $ $ 3,489 $ 8.28 Purchased Transportation Rsh (8) Total Bus Costs $ 1,061,815 $ $ 1,122,712 $ $ 60,897 $ 9.89 Total Bus Rsh (in 000s) 7,062 7,006 (56) Note Totals may not add due to rounding.
60 58 ppendix III: ctivity Based Rail Cost Model FY16 BUDGet FY17 DOPTed INc / (Dec) ctivities $ 000 $ / Rsh $ 000 $ / Rsh $ 000 $ / Rsh Transportation Wages & Benefits $ 46,659 $ $ 56,501 $ $ 9,841 $ 2.10 Materials & Supplies (0.01) Other (5) 0.00 Control Center 12, , (838) (2.17) Training 1, , , Total Transportation $ 61,081 $ $ 71,660 $ $ 10,579 $ 0.93 Maintenance Vehicle Maintenance Wages & Benefits $ 45,376 $ $ 60,579 $ $ 15,202 $ 6.51 Materials & Supplies 12, , (1.19) Services (13) (0.02) Other Subtotal Vehicle Maintenance $ 58,111 $ $ 73,748 $ $ 15,637 $ 5.30 Wayside Maintenance Wages & Benefits $ 29,085 $ $ 37,968 $ $ 8,883 $ 3.49 Materials & Supplies 4, , (631) (1.04) Services 1, , Propulsion Power 36, , , Other (7) (0.02) Subtotal Wayside Maintenance $ 71,402 $ $ 93,254 $ $ 21,852 $ 8.60 Other Maintenance Maintenance Support $ 3,053 $ 2.79 $ 182 $ 0.14 $ (2,871) $ (2.65) Non-Revenue Vehicles 1, , , Facilities Maintenance 47, , (3,811) (8.78) Maintenance Training 1, (1,991) (1.82) Subtotal Other Maintenance $ 54,200 $ $ 46,704 $ $ (7,496) $ (12.54) Total Maintenance $ 183,714 $ $ 213,707 $ $ 29,993 $ 1.35 Other Operating Transit Security $ 82,245 $ $ 61,057 $ $ (21,188) $ (26.80) Revenue 18, , ,672 (0.14) Service Development Safety 5, , (0.60) Casualty & Liability 4, , (0.36) Workers Comp 8, , , Transitional Duty Program (0.01) Utilities 2, , Other Metro Operations 17, , (10,335) (10.30) Building Costs 4, , (69) (0.58) Copy Services (0.01) Total Other Operating $ 143,757 $ $ 118,147 $ $ (25,610) $ (37.80) Note Totals may not add due to rounding.
61 59 FY16 BUDGet FY17 DOPTed INc / (Dec) ctivities $ 000 $ / Rsh $ 000 $ / Rsh $ 000 $ / Rsh Support Departments Board Oversight $ 150 $ 0.14 $ 193 $ 0.15 $ 43 $ 0.02 CEO 2, , Management udit Services (0.07) Procurement 7, , , Communication 5, , , Real Estate 6, , (423) (1.10) Finance 4, , (2,031) (2.17) Human Resources 1, , ITS 6, , , dministration 2, , (688) (0.80) Construction , , Total Support Departments $ 36,675 $ $ 52,249 $ $ 15,575 $ 7.86 Grand Total Rail Costs $ 425,226 $ $ 455,763 $ $ 30,537 $ (27.65) Total Rail Rsh (in 000s) 1,094 1, Note Totals may not add due to rounding.
62 60 ppendix IV: Capital Program Project Listing Measure R Transit Capital Expansion Program FORecasted PROject DescriPTion expenditures FY17 life of ($ in thousands) ThRU FY16 DOPTed PROject Measure R Transit Construction Projects Rail crenshaw Crenshaw/LX Business Interruption Fund $ 400 $ 2,800 $ 3,200 Crenshaw/LX Insurance Betterment 5,276-5,534 Crenshaw/LX Light Rail Transit: Construction 994, ,993 2,058,000 Crenshaw/LX Light Rail Transit: Planning Phase 1 5, Crenshaw/LX Light Rail Transit: Planning Phase 2 20, Southwestern Maintenance Yard 53,539 40, ,000 Total Crenshaw $ 1,079,385 $ 388,282 $ 2,223,734 expo 1 Expo Blvd Light Rail Transit Phase 1: Expo uthority Incurred $ 847,943 $ 2,900 $ 978,900 Expo Blvd Light Rail Transit Phase 1: Metro Incurred 61, Light Rail Vehicles (1) 59,310 8,000 - Total Expo 1 $ 969,033 $ 11,352 $ 978,900 expo 2 Division 22 Paint & Body Shop $ 2,490 $ 3,412 $ 11,000 Expo Blvd Light Rail Transit Phase 2: Holdback 43, Expo Blvd Light Rail Transit Phase 2: Non-Holdback 122,399 30,792 - Expo Blvd Light Rail Transit Phase 2: Construction 879,239 75,534 1,500,158 Expo Blvd Light Rail Transit Phase 2: Planning Expo 2 Insurance Betterment 2,463-2,584 Expo Phase 2 Betterments 2,400 1,500 3,900 Light Rail Vehicles (1) 115,604 33,500 - Total Expo 2 $ 1,168,878 $ 145,394 $ 1,517,642 Gold Line Foothill Foothill Extension Insurance Betterment $ 2,080 $ - $ 2,182 Gold Line Foothill Extension to zusa: Construction 640,191 15, ,000 Gold Line Foothill Extension to zusa: Planning Gold Line Foothill Maintenance Facility - Metro 75% 206, ,437 Light Rail Vehicles (1) 36, Total Gold Line Foothill $ 885,683 $ 15,059 $ 950,619 Regional Connector Regional Connector: Business Interruption Fund $ 1,350 $ 1,850 $ 3,200 Regional Connector: Insurance Betterment 4,036-4,036 Regional Connector: Construction 608, ,391 1,551,817 Regional Connector: Construction - Non Full Funding Grant greement 29,251 10,740 39,991 Regional Connector: Planning 27, Total Regional Connector $ 671,217 $ 234,991 $ 1,599,044 Notes (1) Vehicle expenditures are expected to be adjusted. Totals may not add due to rounding.
63 61 FORecasted cpitl PROject CateGORY expenditures FY17 life of ($ in thousands) ThRU FY16 DOPTed PROject westside Purple Division 20 Portal Widening & Turnback Facility $ - $ 2,700 $ 3,500 Non-Revenue Vehicle for Transit Project Delivery Department Westside Extension 1 Business Interruption Fund 650 2,500 3,150 Westside Insurance Betterment 6,553-6,553 Westside Subway Extension Section 1 761, ,324 2,778,880 Westside Subway Extension Section 2 (2) 210, , ,917 Westside Subway Extension Section 3 (2) 17, , ,906 Westside Subway Extension: Planning Phase 1 8, Westside Subway Extension: Planning Phase 2 37, Total Westside Purple $ 1,043,938 $ 852,480 $ 3,500,856 Total Rail $ 5,818,135 $ 1,647,558 $ 10,770,795 Bus Zero/Super Low Emission Bus cquisition 30 Zero Emission/Super Low Emission $ 4,510 $ 6,663 $ 30,000 Total Bus $ 4,510 $ 6,663 $ 30,000 Bike expo 2 Expo Phase 2 Bikeway 15, ,102 Total Bike $ 15,836 $ 266 $ 16,102 Total Measure R Transit Construction Projects $ 5,838,480 $ 1,654,487 $ 10,816,898 Measure R Transit Planning irport Metro Connector (2) $ 13,922 $ 10,784 $ 24,706 Eastside Extension Phase 1 & 2 (2) 23,576 3,242 26,818 Eastside Light Rail ccess (2) 16,164 5,295 21,459 Gold Line Foothill Extension (3) Green Line Ext: Redondo to South Bay (2) 6, ,022 San Fernando Valley East N/S Rapidways (2) 10,562 1,362 11,924 Sepulveda Pass Corridor (2) 6,194 3,332 9,527 West Santa na Branch Corridor (2) (4) 3,872 1,569 5,442 Total Measure R Transit Planning $ 80,621 $ 26,277 $ 106,897 Total Measure R Transit Capital Expansion $ 5,919,101 $ 1,680,764 $ 10,923,795 Notes (2) No Board dopted Life of Project (LOP) during planning phase; project is funded on an annual basis. (3) FY17 budget of $8M is captured in subsidies. (4) Total FY17 budget is $1,799K; $230K is captured in subsidies. Totals may not add due to rounding.
64 62 ppendix IV: Capital Program Project Listing Operating Capital FORecasted PROject DescriPTion expenditures FY17 life of ($ in thousands) ThRU FY16 DOPTed PROject Safety / Security Rail Blue Line Metro Blue Line Pedestrian & Swing Gate Installations $ 3,730 $ - $ 7,700 Metro Blue Line Pedestrian Safety Enhancement at Grade Crossings 12,897 10,727 30,175 Metro Blue Line Signal System Rehabilitation 11,010 8,581 64,000 Metro Blue Line Traction Power Sub-Stations Rehabilitation 72,069-82,200 Total Blue Line $ 99,706 $ 19,309 $ 184,075 Green Line Metro Green Line Signal System Rehabilitation - Phase 2 $ 6,489 $ 770 $ 7,800 Total Green Line $ 6,489 $ 770 $ 7,800 Red/Purple Line Metro Red Line Electronic ccess Control/larm Monitoring System Replacement (1) $ - $ 455 $ 2,319 Metro Red Line Gas nalyzer Upgrade 1,514 1,471 4,000 Metro Red Line Operator Cab Camera Installation 5, ,380 Metro Red Line Tunnel Lighting Rehabilitation 3,713 1,049 9,000 Metro Red Line Universal City Pedestrian Bridge 26,861 2,723 29,585 Metro Red/Purple Lines Platform Gates Replacement 183 1,361 3,500 Total Red/Purple Line $ 38,120 $ 7,356 $ 54,784 Multiple Lines Metro Blue Line & Metro Green Line Transit Passenger Information System $ 9,464 $ 363 $ 9,830 Metro Security Kiosks at Rail Stations 4, ,150 Platform Track Intrusion Detection System 1, ,400 Supervisory Control & Data cquisition System (SCD) Security Enhancement 948-1,365 Union Station Smart High Definition Closed Circuit Television (CCTV) 1,252-1,849 Total Multiple Lines $ 17,974 $ 1,503 $ 20,594 Total Rail $ 162,290 $ 28,938 $ 267,252 Bus Compressed Natural Gas (CNG) Detection & larm Systems (1) $ - $ 112 $ 4,586 Emergency Operations Booth at Divisions Total Bus $ 25 $ 112 $ 5,038 Notes (1) New project in FY17. Separate Board approval of LOP budget is required for new project with a proposed LOP over $5M. Totals may not add due to rounding. Mixed Mode Fare Gate Project $ 7,568 $ 3,231 $ 14,987 Fire larm Panel Replacement Program (1) ,624 Metro Emergency Operations Center 9,547 5,875 16,103 Metro Red Line to Orange Line Underpass at North Hollywood Station 16,931 1,482 23,077 Reduce Risk of Catastrophic Events to Union Station Gateway Complex ,983 Universal Fare System (UFS) Fare Box Upgrade - 1,461 4,279 Total Mixed Mode $ 34,046 $ 12,203 $ 67,054 Other gency Information Security & Compliance Program $ 710 $ 1,230 $ 7,814
65 63 FORecasted cpitl PROject CateGORY expenditures FY17 life of ($ in thousands) ThRU FY16 DOPTed PROject utomated License Plate Recognition Network Phase 1 1, ,069 utomated License Plate Recognition Network Phase 2 1, ,602 Universal Fare System Security Upgrade 7,129 4,053 19,500 Union Station Fire Life Safety System, D Site Improvements & LED Lighting - 6,674 19,946 Total Other $ 10,897 $ 12,536 $ 50,931 Total Safety / Security $ 207,258 $ 53,789 $ 390,275 State of Good Repair Rail Blue Line Blue Line rtwork Renovations & Replacement $ - $ 293 $ 477 Division 11 Body Shop Ventilation 1, ,200 Light Rail Vehicle (P865/P2020) Midlife Overhaul 19,823 3,071 30,000 Long Beach Duct Bank Upgrade Phase 2 2,672 2,128 8,000 Metro Blue Line Communication & Signal Building Rehabilitation ,800 Metro Blue Line Overhead Catenary System Rehabilitation 3,370 1,604 13,000 Metro Blue Line Rail Replacement & Booting 3,922 4,122 13,000 Metro Blue Line Station Refurbishments 32, ,953 Metro Blue Line Turnout Replacement 3,000-3,000 Metro Blue Line Wheel True Machine 1, ,200 Metro Blue Line Yard Signal System Rehabilitation 1,517 2,315 4,600 Metro Blue Line High Density Storage Equipment (1) Total Blue Line $ 70,636 $ 15,961 $ 112,194 Gold Line Car Cleaning Platform Canopy $ 196 $ - $ 505 Division 21 Car Wash Improvement Division 21 Midway Yard Improvements ,024 P2550 Light Rail Vehicle Component Overhaul (1) - 2,775 20,008 Pasadena Gold Line Headway Improvements 1, ,400 Pasadena Gold Line Vehicle Loop Detector Replacement Pasadena Gold Line Yard Train Loop Detector Replacement Pasadena Gold Line South Pasadena Station Northbound Platform D Ramp Total Gold Line $ 2,278 $ 4,316 $ 25,507 Green Line Metro Green Line Uninterruptible Power Supply (UPS) for Train Control & Communication Building $ 556 $ 313 $ 1,200 Metro Green Line Emergency Trip System 1,290 1,144 5,500 Metro Green Line Negative Grounding Devices ,500 Metro Green Line Train Control Track Circuits & TWC Replacement (1) ,851 Total Green Line $ 2,229 $ 2,274 $ 37,051 Red/Purple Line Division 20 Wheel Press Machine $ 82 $ 1,362 $ 4,000 Division 20 Carwash & Cleaning Platform 14,578-15,400 Division 20 Switch Machine Replacement 179 1,721 1,900 Heavy Rail Vehicle Midlife Overhaul 5,934 9,906 52,000 Heavy Rail Vehicle Procurement 6,772 7, ,910 Metro Red Line 7th/Metro Station Turnback Upgrade Notes (1) New project in FY17. Separate Board approval of LOP budget is required for new project with a proposed LOP over $5M. Totals may not add due to rounding.
66 64 ppendix IV: Capital Program Project Listing FORecasted cpitl PROject CateGORY expenditures FY17 life of ($ in thousands) ThRU FY16 DOPTed PROject Metro Red Line Civic Center Station Escalator/ Elevator Modernization 7, ,000 Metro Red Line Escalator Replacement/Modernization 6,352 4,084 20,756 Metro Red Line North Hollywood Parking Lot Demo ,400 Metro Red Line Segment 1 Power Supply Replacement Metro Red Line Train-to-Wayside Communication Rehabilitation 204-1,800 Replacement of Uninterruptible Power Supplies/Batteries Red Line FY17-FY22 (1) - 2,391 3,684 Subway Railcar Component Replacement 22,813 3,532 30,000 Universal City Station North Entrance Knock-Out Panel Total Red/Purple Line $ 65,400 $ 31,513 $ 275,155 Multiple Lines utomatic Wheel Profile Measuring Device $ 1,150 $ - $ 4,000 Digital Rail Radio System 15,712 2,755 25,000 Fiber Optic Main Loop Upgrade 1,580 1,038 4,250 Fire Control Panel Upgrade 1, ,600 FY16-FY17 Rail Non-Revenue Vehicle & Equipment Replacement Heavy Rail SCD System Replacement 7,573 3,867 15,883 Light Rail Vehicle (P2000) Midlife Overhaul 10,906 29, ,800 Light Rail Vehicle Fleet Replacement 26,607 1, ,659 Metro Green & Red Line Rail Station Refurbishments 3,714-4,500 Maintenance of Way (MOW) Tools & Equipment Procurement thru FY ,637 2,000 Non-Revenue Vehicle & Equipment - Rail 6,591 3,733 11,803 P2000 Vehicle Component Replacement 15,512 4,335 26,360 Professional Services to Support P3010 LRV Procurement Project 12,779 5,200 30,000 Rail Facilities Lighting Retrofit 1,574 2,630 4,205 Regional Rail Signage System Improvements 1, ,231 Systemwide Corrosion Protection System Replacement 7,118 2,681 13,000 Systemwide Elevator Installations (Vertical Systems) 3, ,000 Warehouse Pallet Racking for Rail Total Multiple Lines $ 117,112 $ 60,616 $ 875,794 Total Rail $ 257,656 $ 114,680 $ 1,325,700 Notes (1) New project in FY17. Separate Board approval of LOP budget is required for new project with a proposed LOP over $5M. Totals may not add due to rounding. BUS 490 Bauchet Environmental Canopy Structure (1) $ - $ 108 $ 110 D Equipment Installation (1) - 1,199 10,868 rticulated Bus Replacement 197 5,311 5,507 Bus cquisition 550 & Foot 444,168 40, ,060 Bus Facilities Lighting Retrofit 3, ,250 Bus Facilities Maintenance & Improvement - Phase 3 1,425 1,970 21,650 Bus Facility Maintenance Improvements & Enhancements Phase 1 20, ,231 Bus Facility Maintenance Improvements & Enhancements Phase 2 18,675 1,254 20,896 Bus Midlife Program (1) 10,262 19,567 68,669 Central Maintenance Bus Engine Replacement Program 3,994 5,837 24,690 Central Maintenance Equipment cquisition (1) ,000 Central Maintenance Shop Engine Replacement Program thru FY14 27,385-32,112 Central Maintenance Shop Equipment Replacement 2,268-2,928 Central Maintenance Facility Building 5 Ventilation & ir Division 1 Improvements 2,933 2,260 20,866
67 65 FORecasted cpitl PROject CateGORY expenditures FY17 life of ($ in thousands) ThRU FY16 DOPTed PROject Division 13 Information Technology Services (ITS) Infrastructure Division 13 Tenant Improvement Division 3 Master Plan Phases , ,200 Division 4 Concrete Pavement DVR Equipment Refurbishment ,102 El Monte Busway ccess Road Repair ,426 Emergency Generators for Communications Network Facility Equipment & Upgrades 2,253-2,254 Fuel Storage Tank System Enhancements (FY15-FY17) 3,216 2,284 6,500 Metro rt Enhancement Metro Silver Line Improvements & Upgrades 6,386 1,460 7,845 Non-Revenue Vehicles & Equipment - Bus 5,867-6,923 Non-Revenue Vehicles & Equipment Replacement - Bus (FY17-FY18) (1) - 1,383 4,975 Patsaouras Bus Plaza Paver Retrofit 5,768 1,559 9,093 Patsaouras Plaza Bus Station Construction 21, ,793 Pavement Repairs at Central Maintenance Facility (CMF), Division 7 & Division ,815 4,249 Replacement 40 Buses (1) - 5, ,091 Revenue Collection Equipment Midlife Refurbishment 1,521-1,521 Sylmar Child Center Rehabilitation Terminals 47 & 48 Corrosion Total Bus $ 601,137 $ 96,980 $ 1,153,358 Mixed Mode utomated Storage & Retrieval System (SRS) Unit Upgrade for Mini-Load $ 1,337 $ - $ 1,659 Bulk Storage & Fire Sprinkler Enhancement Call Center Telephone Replacement 1, ,500 Cash Room Equipment Request (1) Customer Center Relocation Improvements HSTUS Transportation System Scheduling Software Upgrade & Enhancement 2,582 1,428 4,010 HSTUS Infrastructure Upgrade ,687 High Density Storage Equipment for Bus & Rail 1, ,288 Installation of Signage & Posters Non-Revenue Heavy Duty Non-Revenue Maintenance Shop Improvements 590 2,637 3,227 Non-Revenue Step Van Non-Revenue Vehicles Procurement for Rail thru FY15 1,504 1,850 5,643 Sustainability Implementation Plan - 2,000 2,000 System Projects - 9,506 9,506 Transit ccess Pass (TP) Customer Relationship Management System TP Mobile Phone Validators Total Mixed Mode $ 12,320 $ 19,748 $ 35,797 Other pplication Platform Systems Upgrade (FY15-FY16) $ 980 $ - $ 1,500 pplication Platform Systems Upgrades (FY17-FY18) (1) ,685 BIS Budget System Replacement 3,473-3,800 Contract Information Management System - Phase 2 7,561-7,561 Customer Relations Management utomation & Enhancements (1) ,400 Notes (1) New project in FY17. Separate Board approval of LOP budget is required for new project with a proposed LOP over $5M. Totals may not add due to rounding.
68 66 ppendix IV: Capital Program Project Listing FORecasted cpitl PROject CateGORY expenditures FY17 life of ($ in thousands) ThRU FY16 DOPTed PROject Digital Incident Management System ,064 E-Discovery & Legal Hold Management (1) ,800 Enterprise Telephone & Unified Messaging System (1) ,146 Financial & Budget Systems Integration 2, ,200 Financial Information System R12 Upgrade 8, ,900 Gateway Building Emergency Generator 1,863-1,895 Gateway Building Renovations 17,813 4,603 42,842 Gateway Building New LED Lighting 239 1,451 2,589 Interagency Transfer (IT) (1) Mobile & Tablet pplications Mobile Phone Validator (MPV) pplication/ Infrastructure Enhancements Parking - TP Integration (1) Tablet Regional Point of Sale Device 404 1,055 1,921 Technology Projects to Enhance Customer Experience (1) - 1,387 2,227 Ticket Vending Machine (TVM) Software Upgrade - Multiple Ticket & Language 486 1,068 1,750 Universal Fare System Disaster Recovery 2,095 1,912 8,085 Union Station Main Terminal HVC Upgrade 5,368-5,376 Union Station Renovations & Upgrades 14,349 2,962 17,311 Union Station Reroofing 7,056-7,080 Universal Fare Collection System 96,032-97,607 Web Infrastructure Upgrade 3,096-3,096 Workstation & Network Technology Refresh (FY15-FY16) 2,227-2,600 Workstation & Network Technology Refresh (FY17-FY18) (1) ,700 Total Other $ 175,556 $ 21,626 $ 249,347 Total State of Good Repair $ 1,046,669 $ 253,035 $ 2,764,202 Capital Infrastructure Rail Gold Line Gold Line Eastside Extension $ 888,792 $ 1,380 $ 898,814 Warehouse High Density Storage Equipment at Monrovia 1, ,874 Total Gold $ 890,247 $ 1,761 $ 900,688 Red/Purple Line 7th/Metro & The Bloc Connection $ 679 $ 668 $ 4,650 Metro Red Line Segment 2 Closeout 31, ,482 Metro Red Line Segment 3 North Hollywood Closeout 4, ,408 Wayside Energy Storage Substation (WESS) 4,659-5,166 Total Red/Purple Line $ 40,571 $ 1,343 $ 46,706 Notes (1) New project in FY17. Separate Board approval of LOP budget is required for new project with a proposed LOP over $5M. Totals may not add due to rounding. Multiple Lines Electric Vehicle Charging Stations at Metro Rail Maintenance Facilities $ 59 $ 117 $ 175 FY14-FY15 Rail Facility Sub-Metering Project - Division 11, 22, & Location FY14-FY15 Rail Facility Sub-Metering Project - Division 20 & LRT Freeway Stations Sound Enclosures 2, ,609 Public Plug-In Charge Station Total Multiple Lines $ 3,417 $ 993 $ 10,418 Total Rail $ 934,235 $ 4,097 $ 957,812
69 67 FORecasted cpitl PROject CateGORY expenditures FY17 life of ($ in thousands) ThRU FY16 DOPTed PROject Bus Bus Rapid Transit (BRT) Freeway Station Sound Enclosure $ 4,163 $ 1,207 $ 5,838 Bus Stop Information System Project 1, ,150 Cesar Chavez Bus Stop Improvements ,100 Countywide Signal Priority Module ,000 Division 13 Construction 119,183 1, ,342 El Monte Busway & Transit Center Expansion 59, ,106 FY14-FY15 Bus Facility Sub-Metering Project - Division 1, 2, 4, 9, & FY14-FY15 Bus Facility Sub-Metering Project - Division 3, 6, 8, & Metro Orange Line Reclaimed Water Project Total Bus $ 185,830 $ 4,056 $ 191,774 Mixed Mode Inglewood Station Bus Transfer Facility $ 260 $ 1,240 $ 2,200 Internet-based Customer Help Desk ,142 Nextrip Electronic Signage 162 1,640 4,400 Rosa Parks / Willowbrook Station (1) - 6,738 64,080 Ticket Vending Machine Installations 1,525 2,664 6,736 Total Mixed Mode $ 2,245 $ 12,817 $ 78,558 Bike Bicycle ccess Improvements - Rail $ 724 $ 966 $ 1,843 Bicycle Lockers & Racks for Metro Rail Stations 1, ,350 Bikeshare Phase 1 Implementation 3,979 1,820 5,800 Bikeshare Phase 2 Implementation (1) 0 2,620 2,620 Union Station Metro Bike Hub ,320 Total Bike $ 6,290 $ 6,489 $ 12,933 Other Parking Guidance System (at Metro Owned Park & Ride Properties) $ 162 $ 1,994 $ 3,025 TP Near-Field-Communication (NFC) Mobile pplication Development Union Station Gateway Building (USG) Domestic Hot Water System Modification Total Other $ 402 $ 2,452 $ 3,723 Total Capital Infrastructure $ 1,129,001 $ 29,912 $ 1,244,800 Total Operating Capital $ 2,382,927 $ 336,735 $ 4,399,277 Notes (1) New project in FY17. Separate Board approval of LOP budget is required for new project with a proposed LOP over $5M. Totals may not add due to rounding.
70 68 ppendix V: Regional Transit llocations Revenue Estimates FY17 Carry-oveR interest FY17 FY16 STTE ND LOCl estimted FY15 BUDGet FY15 TOTl Funds TOTl Funds ($ in thousands) Revenue vs ctul ctul vailble vailble Transportation Development ct Planning & dministration Planning - Metro $ 2,000 $ - $ - $ 2,000 $ 2,000 Planning - SCG 2, ,036 2,896 dministration - Metro 3,516 (52) - 3,464 3,604 subtotal $ 8,500 $ - $ - $ 8,500 $ 8,500 rticle 3 Pedestrian & Bikeways 2.0% 7, ,925 7,551 rticle 4 Bus Transit 91.6% 356,813 6,315 1, , ,794 rticle 8 Streets & Highways 6.4% 24, ,189 23,988 Total Planning & dministration (1) $ 397,850 $ 6,891 $ 1,540 $ 406,281 $ 387,834 Proposition dministration 5.0% 39, ,358 38,608 Local Return (2) 25.0% 188,979 n/a - 188, ,331 Rail Development 35.0% 264,570 3, , ,747 Bus Transit 40.0% 95% of 40% Capped at CPI (1.85%) (3) 234,828 n/a - 234, ,563 95% of 40% Over CPI (4) 52, ,420 45,061 sub-total $ 287,248 $ - $ - $ 287,248 $ 275,624 5% of 40% Incentive 15, ,336 14,671 Total Proposition (1) $ 795,700 $ 4,599 $ - $ 800,299 $ 766,981 Notes (1) The revenue estimate is 3.3% over the FY16 revenue estimate based on several economic forecasts evaluated by Metro. (2) Local Return Subfunds do not show carryover balances. These funds are distributed in the same period received. (3) CPI of 1.85% represents the average estimated growth rate provided by Beacon Economics applied to Prop Discretionary allocated to included operators. (4) Proposition 95% of 40% Bus Transit current year estimate will be used to fund eligible and Tier 2 operators. The carry-over is not shown since it has been converted into Proposition C 40% discretionary to fund various Board-approved discretionary programs. (5) ST Revenue estimate from the State Controller s office is reduced by $18 million for the revenue based share and $13 million for the population based share due to anticipated shortfall of FY16 revenue. Totals may not add due to rounding. Proposition C dministration 1.5% 11, ,107 11,584 Rail/Bus Security 5.0% 39, ,751 38,034 Commuter Rail 10.0% 78,376 1,126-79,503 76,068 Local Return (2) 20.0% 156,753 n/a - 156, ,410 Freeways & Highways 25.0% 195,941 2, , ,169 Discretionary 40.0% 313,506 4, , ,271 Total Proposition C (1) $ 795,700 $ 9,180 - $ 804,880 $ 770,536 State Transit ssistance Bus (PUC Revenue Base Share) (5) 24,595 4, ,277 54,516 Rail (PUC Population Share) 28,260 1, ,665 52,965 Total State Transit ssistance (1) $ 52,855 $ 5,923 $ 164 $ 58,942 $ 107,481 Measure R dministration 1.5% 11, ,402 11,683 Transit Capital - New Rail 35.0% 274,318 4, , ,249 Transit Capital - Metrolink 3.0% 23, ,204 25,063 23,668 Transit Capital - Metro Rail 2.0% 15, ,100 15,420 Highway Capital 20.0% 156,753 2,309 2, , ,621 New Rail Operations 5.0% 39, ,385 38,481 Bus Operations 20.0% 156,753 2,309 (103) 158, ,622 Local Return (2) 15.0% 117,565 n/a (10) 117, ,807 Total Measure R (1) $ 795,700 $ 9,987 $ 5,377 $ 811,064 $ 776,551 Total Funds vailable $ 2,837,805 $ 36,581 $ 7,080 $ 2,881,467 $ 2,809,382 Total Planning & dministration llocations $ 72,156 $ 920 $ 290 $ 73,366 $ 70,375
71 69 Metro is the transportation planning agency for Los ngeles County. In this capacity, Metro plans, programs and administers various local, state and federal funds for the operating and capital needs of the county s transit systems and various transportation improvement programs. In FY17, $1.3 billion in subsidies is going right back into Los ngeles County. Funds received by municipal transit operators, ccess Services and Metrolink are used by those agencies to provide transit services, ensuring mobility throughout the region. Funds received by the 88 cities and unincorporated areas of Los ngeles County are used to invest in transportation improvements at the local level, such as public transit, streets and roads, bikeways and pedestrian improvements in their areas. ccess Services ccess Services (ccess) fulfills the provision of the mericans With Disabilities ct of 1990 (D) mandated complementary paratransit services on behalf of Metro and 45 other transit agencies in Los ngeles County. ccess is predominantly funded with federal Regional Surface Transportation Program and Proposition C 40% Discretionary sales tax revenue funds allocated by Metro. s required by the D, ccess is available to individuals who are determined to be D eligible for trips within Los ngeles County that originate and terminate within three quarters of a mile of a fixed route bus line or rail station. ccess provides service during the same hours of operations as the fixed route bus operators in Los ngeles County. ccess is a shared ride service that uses a combined fleet of small buses, mini-vans and taxis. In FY 16, ccess provided more than 3.4 million trips to more than 175,000 qualified customers with disabilities in a service area of more than 1,950 square miles. dditionally, ccess has a Free Fare Program that provides eligible ccess customers with free boardings on most bus and rail systems within Los ngeles County. Metrolink Metrolink is the commuter rail system operated by the Southern California Regional Rail uthority (SCRR), a Joint Exercise of Powers uthority, on behalf of the transportation agencies in Los ngeles, Orange, Riverside, San Bernardino and Ventura counties the member agencies. Spanning 534 route miles over seven lines with 59 stations, Metrolink expects to operate 171 weekday trains and 90 trains on weekends in FY17. Downtown s Los ngeles Union Station represents the destination of over 67% of all Metrolink riders. In FY16, the Metrolink system became the first commuter rail agency in the nation to initiate the operation of a Positive Train Control system across all services and began new service on the Perris Valley extension of the Metro supported 91 Line to the Inland Empire. During FY17, Metrolink will begin receipt of its fleet of new Tier IV locomotives that, when fully deployed, will reduce emissions by up to 85% over the current fleet. Member agency contributions to Metrolink represent the net subsidy requirements of operating the system over and above all system generated revenues such as fare and freight railroad reimbursements. s the agency s largest partner, Metro provides approximately 51% of all Member gency operating contributions to the SCRR.
72 70 ppendix VI: Legally Separate Entities Public Transportation Services Corporation Public Transportation Services Corporation (PTSC) is a nonprofit public benefit corporation. PTSC was created in December 1996 in order to transfer certain functions performed by Metro and the employees related to those functions to this new corporation. The PTSC conducts essential public transportation activities including: planning, programming funds for transportation projects within Los ngeles County, construction, providing certain business services to the County s Service uthority for Freeway Emergencies (SFE) and the Southern California Regional Rail uthority (SCRR), and providing security services to the operation of the Metro bus and rail systems. PTSC allows the employees of the corporation to participate in the California Public Employees Retirement System (PERS). Statement of Revenues, Expenses and Changes in Retained Earnings for the Years Ending June 30, 2016 and 2017 PTsc FY16 FY17 ($ in millions) BUDGet DOPTed Revenues $ $ Expenses Increase (decrease) in retained earnings - - Retained earnings - beginning of year - - Retained earnings - end of year $ - $ - Exposition Metro Line Construction uthority The Exposition Metro Line Construction uthority (Expo) was created by the State Legislature under Public Utilities Code Section , et seq. for the purpose of awarding and overseeing final design and construction contracts for completion of the Los ngeles-exposition Metro Light Rail project from the Metro Rail Station at 7th Street and Flower Street in the City of Los ngeles to downtown Santa Monica. Statement of Revenues, Expenses and Changes in Fund Balances for the Years Ending June 30, 2016 and 2017 ExPOsition MeTRO Line ConsTRUction UThORiTY FY16 FY17 ($ in millions) BUDGet DOPTed Revenues $ $ Expenses Net change in fund balance - - Fund Balance - beginning of year - - Fund balance - end of year $ - $ - Note Totals may not add due to rounding.
73 71 Service uthority for Freeway Emergencies (SFE) The Los ngeles County Service uthority for Freeway Emergencies (SFE) was established in Los ngeles County in SFE is a separate legal authority created under state law and is responsible for providing motorist aid services in Los ngeles County. SFE currently operates, manages and/or funds: > The Los ngeles County Kenneth Hahn Call Box System > 511 Mobile Call Box program > The Metro Freeway Service Patrol > The Motorist id and Traveler Information System (MTIS) SFE receives its funding from a dedicated $1 surcharge assessed on each vehicle registered within Los ngeles County. Service UThoriTY For FreewY EmeRGencies FY16 FY17 ($ in millions) BUDGet DOPTed Revenues $ 7.6 $ 7.6 Expenditures Excess (deficiency) of revenue over expenditure (2.7) (5.4) Other financing & source (uses) - transfer out (2.0) (1.0) Fund balances - beginning of year Statement of Revenues, Expenses and Changes in Fund Balances for the Years Ending June 30, 2016 and 2017 Retained Earnings - End of Year $ 19.8 $ 13.5 Note Totals may not add due to rounding.

74

75 bbreviations
76 74 bbreviations BC CE D DB FscME QMD RR RTI SRS TC TMS TU Tvc VT BB BD BIS BNSF BOC BRT CP CCTV ceq CFP cis CMQ CMP CNG COG CP CPS CP&D CPI CPUC CR CRDP CTC CTS CY DBE Deis DHS DPW DR ctivity-based Costing lameda Corridor East mericans with Disabilities ct ll-door Boarding merican Federation of State, County and Municipal Employees ir Quality Management District merican Recovery and Reinvestment ct ccelerated Regional Transportation Improvements utomated Storage and Retrieval System utomatic Train Control dvanced Transportation Management System malgamated Transit Union dvanced Technology Vehicle Consortium ntelope Valley Transportation uthority Build merica Bonds Benefit ssessment District Budget Information nalysis System Burlington Northern Santa Fe Railway Company Bus Operations Control Bus Rapid Transit Cost llocation Plan Closed Circuit Television California Environmental Quality ct Call for Projects Customer Information System Congestion Mitigation and ir Quality Congestion Mitigation Project Compressed Natural Gas Councils of Governments Capital Program / Capital Project Capital Planning and nalysis System Countywide Planning & Development Consumer Price Index California Public Utilities Commission Community Redevelopment gency Congestion Relief Demonstration Project California Transportation Commission Consolidated Transportation Services gency Calendar Year Disadvantaged Business Enterprise Draft Environmental Impact Statement Department of Homeland Security Department of Public Works Demand Response EF Enterprise Fund eir Environmental Impact Report eis Environmental Impact Statement eltp Entry Level Training Program EOB/RTCR Emergency Operations Bureau / Real-Time nalysis & Critical Response EMS Environmental Management System expo Exposition Metro Line Construction uthority ERV Emergency Response Vehicle FP Formula llocation Procedure FSB Financial ccounting Standards Board FFG Full Funding Grant greement FFY Federal Fiscal Year (October 1 to September 30) FIS Financial Information System FSP Freeway Service Patrol FT Federal Transit dministration FTE Full Time Equivalent FY Fiscal Year GP Generally ccepted ccounting Principles GSB Governmental ccounting Standards Board GF General Fund GIRO Canadian Software Company GPS Global Positioning System HSTUS Transportation Scheduling Software Package HOT High-Occupancy Toll Lanes HOV High-Occupancy Vehicle HRV Heavy Rail Vehicle I Interstate IBT International Brotherhood of Teamsters IFB Invitation for Bids ITD Incurred to Date INTP Immediate Needs Transportation Program ITS Information Technology Services JRC Job ccess / Reverse Commute Grant Program JP Joint Powers uthority KPI Key Performance Indicator L Los ngeles LCMT L County Metropolitan Transportation uthority LDOT Los ngeles Department of Transportation LMPS L Metro Protective Services LSD Los ngeles Sheriffs Department LW Los ngeles World irports LX Los ngeles International irport LED Light-Emitting Diode LOP Life of Project
77 75 LRT Light Rail Transit LRTP Long Range Transportation Plan LRV Light Rail Vehicle M Million MP-21 Moving head for Progress in the 21st Century ct MTIS Motorist id and Traveler Information System MBL Metro Blue Line Metro LCMT s Transit Operations MGL Metro Green Line MGlee Metro Gold Line Eastside Extension MGMT Management MOL Metro Orange Line MOW Maintenance of Way MR Measure R MRL Metro Red Line MT Metropolitan Transportation uthority NC Non-Contract N/S North/South NTD National Transit Database OCM Operations Capital Maintenance OIG Office of Inspector General OMB Office of Management & Budget OPS Metro Operations P Proposition PC Proposition C PCI Payment Card Industry PEPR Public Employees Pension Reform ct of 2013 PERS California Public Employees Retirement System PGL Pasadena Gold Line PL/PD Public Liability/Property Damage Prop 1B State Proposition 1B Bonds Prop Proposition Prop C Proposition C PTMISE Public Transportation Modernization, Improvement, and Service Enhancement ccount PTSC Public Transportation Services Corporation RM Risk llocation Matrix RFP Request for Proposal RFS Rail Fleet Services RIITS Regional Integration of Intelligent Transportation Systems RM Revenue Mile ROC Rail Operations Control RRC Regional Rebuild Center RRTP Rider Relief Transportation Program RSH RSM Rvsh SFE SFETE-LU SBE scd scg scrip scrr SFV SHORE SGR SMRT SR SRF SRTP ST STIP T TP TBD TCU TD TE TDM TIFI TIP TOST TOD TPIS UFS UPS USDOT USG UTU wess wids Revenue Service Hours Revenue Service Miles Revenue Vehicle Service Hours Service uthority for Freeway Emergencies Safe, ccountable, Flexible, Efficient Transportation Equity ct: Legacy for Users State Board of Equalization Small Business Enterprise Supervisory Control and Data cquisition System Southern California ssociation of Governments Southern California Regional Inter-Connectivity Program Southern California Regional Rail uthority San Fernando Valley Support for Homeless Re-Entry Program State of Good Repair Sheet Metal, ir, Rail & Transportation workers, merger between United Transportation Union (UTU) and Sheet Metal Workers' International ssociation (SMWI) State Route Special Revenue Fund Short Range Transportation Plan State Transit ssistance Fund State Transportation Improvement Program Transit uthority Transit ccess Pass To Be Determined Transportation Communications Union Transportation Development ct Transportation Enhancement ct Transportation Demand Management Transportation Infrastructure Finance & Innovation ct Transportation Improvement Program Transit Operator ctivity Scheduling & Tracking System Transit Oriented Development Transit Passenger Information System Universal Fare System Uninterruptible Power Supply United States Department of Transportation Union Station Gateway Former United Transportation Union now SMRT, after merger with Sheet Metal Workers' International ssociation (SMWI) Wayside Energy Storage Substation Wayside Intrusion Detection System

78

79
metro.net/ridesafely TRANSIT SAFETY PROGRAMS
 metro.net/ridesafely TRANSIT SAFETY PROGRAMS 2017 calendar JANUARY S M T W T F S 1 2 3 4 5 6 7 8 9 10 11 12 13 14 15 16 17 18 19 20 21 22 23 24 25 26 27 28 29 30 31 #LAMetroSafety metro.net/ridesafely
Executive Summary. Draft Environmental Impact Statement/Environmental Impact Report ES-1
 Executive Summary Introduction The Eastside Transit Corridor Phase 2 Project is a vital public transit infrastructure investment that would provide a transit connection to the existing Metro Gold Line
Mobility Corridor Updates. Transit & Active Transportation Projects
 Mobility Corridor Updates Transit & Active Transportation Projects Manjeet Ranu, SEO East San Fernando Valley Transit Corridor Metro Board LPA selection: June 2018 Recently awarded $200 million in Senate
ATTACHMENT B NOW, THEREFORE, THE BOARD OF DIRECTORS OF METRO DOES RESOLVE AS FOLLOWS: Page 1
 A RESOLUTION OF THE METRO BOARD OF LOS ANGELES COUNTY METROPOLITAN TRANSPORTATION AUTHORITY ESTABLISHING PARKING RATES AND PERMIT FEES FOR ALL METRO PARKING FACILITIES AND RESOURCES WHEREAS, the Los Angeles
Project Scoping Report Appendix B Project Web Site. APPENDIX B Project Web Site
 Project Scoping Report Appendix B Project Web Site APPENDIX B Project Web Site WESTSIDE EXTENSION TRANSIT CORRIDOR STUDY February 4, 2008 News and Info of 1 http://metro.net/projects_programs/westside/news_info.htm#topofpage
Mobility Corridor Updates. Transit & Active Transportation Projects
 Mobility Corridor Updates Transit & Active Transportation Projects Laura Cornejo, DEO Regional Planner Regional Operator Metro is LA County s Regional Builder/Funder Rail Bus Service (Metro/Muni/Local)
Develop ground transportation improvements to make the Airport a multi-modal regional
 Project Overview TRANSPORTATION IMPROVEMENTS WHAT ARE THE PROJECT GOALS? Transportation transportation hub. Develop ground transportation improvements to make the Airport a multi-modal regional Land Use
FREQUENTLY ASKED QUESTIONS
 FREQUENTLY ASKED QUESTIONS 2018 What is the More MARTA Atlanta program? The More MARTA Atlanta program is a collaborative partnership between MARTA and the City of Atlanta to develop and implement a program
NOTICE OF PUBLIC HEARING Los Angeles County Metropolitan Transportation Authority
 NOTICE OF PUBLIC HEARING Los Angeles County Metropolitan Transportation Authority The Los Angeles County Metropolitan Transportation Authority will hold public hearings in February 2011 to receive community
TransNet Dollars Keep San Diego Moving
 TransNet Dollars Keep San Diego Moving In 1987, San Diego region voters approved the TransNet program a half-cent sales tax to fund a variety of important transportation projects throughout the region.
Metro. Board Report. B. PROGRAM AND AMEND the FY 17 budget to add $900,000 in Measure R Commuter Rail service funds to conduct this study; and
 Metro Board Report Los Angeles County Metropolitan Transportation Authority One Gateway Plaza 3rd Floor Board Room Los Angeles, CA File #:2016-0284, File Type:Motion / Motion Agenda Number:9. REVISED PLANNING
COMMUNITY REPORT FISCAL YEAR We are making progress, are you on board? GOLD COAST TRANSIT DISTRICT
 FISCAL YEAR 178 GOLD COAST TRANSIT DISTRICT COMMUNITY REPORT We are making progress, are you on board? OJAI OXNARD PORT HUENEME VENTURA COUNTY OF VENTURA GENERAL MANAGER S MESSAGE STEVEN P. BROWN DEAR
Balancing the Transportation Needs of a Growing City
 Balancing the Transportation Needs of a Growing City FY 2019 and FY 2020 Capital Budget SFMTA Board Meeting Ed Reiskin, Director of Transportation April 3, 2018 1 FY 2019-23 Capital Improvement Program
Transit Project Delivery Status Report. Significant Issues
 Item 1 Transit Project Delivery Status Report Significant Issues Presented By K.N. Murthy Executive Director Construction Committee 1 I-405 Sepulveda Pass Closure Construction Committee I-405 Sepulveda
Sales and Use Transportation Tax Implementation Plan
 Sales and Use Transportation Tax Implementation Plan Transportation is more than just a way of getting from here to there. Reliable, safe transportation is necessary for commerce, economic development,
CEDAR AVENUE TRANSITWAY Implementation Plan Update
 CEDAR AVENUE TRANSITWAY Implementation Plan Update EECUTIVE SUMMARY DECEMBER 2015 Executive Summary In 2013, the Twin Cities metropolitan area s first bus rapid transit (BRT) line, the METRO Red Line,
Proposed FY Capital Improvement Program (CIP) March 5, 2018 Capital Planning Committee 1
 March 5, 2018 Capital Planning Committee 1") Proposed FY 2019-2023 Capital Improvement Program (CIP) March 5, 2018 Capital Planning Committee 1 The Capital Improvement Program is: A fiscally constrained, 5-year program of capital projects An implementation
Proposed FY 2019-2023 Capital Improvement Program (CIP) March 5, 2018 Capital Planning Committee 1 The Capital Improvement Program is: A fiscally constrained, 5-year program of capital projects An implementation
Why coordinate the Van Nuys and Sepulveda Pass project studies together?
 Southern California's Leading Transit Advocacy Group P.O. Box 567 * San Fernando, CA 91341-0567 Voice: 818.362.7997 * Fax: 818.364.2508 www.transitcoalition.org The Transit Coalition (a project of LACBC)
US 29 Bus Rapid Transit Planning Board Briefing. February 16, 2017
 US 29 Bus Rapid Transit Planning Board Briefing February 16, 2017 Project Goals Improve the quality of transit service Improve mobility opportunities and choices Enhance quality of life Support master
SEPULVEDA PASS CORRIDOR
 SEPULVEDA PASS CORRIDOR PUBLIC PRIVATE PARTNERSHIP DELIVERY PRE-DEVELOPMENT AGREEMENT PDA Sepulveda Pass Mobility Issues Most congested highway segment in the U.S. 295,000 vehicles per day (2010) 430,000
Metropolitan Council Budget Overview SFY
 Metropolitan Council Budget Overview SFY 2016-2017 H T t ti C itt House Transportation Committee February 4, 2015 Transit connects us to the places that matter Transportation Needs Grow as the Region Grows
Blue Ribbon Committee
 Blue Ribbon Committee February 26, 2015 Kick-off Meeting Blue Ribbon Committee 1 2,228 Metro CNG Buses 170 Bus Routes 18 are Contract Lines Metro Statistics 2 Transitway Lines (Orange/Silver Lines) 20
CITY OF LONDON STRATEGIC MULTI-YEAR BUDGET ADDITIONAL INVESTMENTS BUSINESS CASE # 6
 2016 2019 CITY OF LONDON STRATEGIC MULTI-YEAR BUDGET ADDITIONAL INVESTMENTS BUSINESS CASE # 6 STRATEGIC AREA OF FOCUS: SUB-PRIORITY: STRATEGY: INITIATIVE: INITIATIVE LEAD(S): BUILDING A SUSTAINABLE CITY
Executive Summary. Treasure Valley High Capacity Transit Study Priority Corridor Phase 1 Alternatives Analysis October 13, 2009.
 Treasure Valley High Capacity Transit Study Priority Corridor Phase 1 Alternatives Analysis October 13, 2009 Background As the Treasure Valley continues to grow, high-quality transportation connections
Leadership NC. November 8, 2018
 v Leadership NC November 8, 2018 Planning for our region s growth The Triangle is one of the fastestgrowing regions in the nation. More than 2 million people are already part of the equation, and the
Charlotte-Mecklenburg Region Rapid Transit and Land-Use Integration
 Charlotte-Mecklenburg Region Rapid Transit and Land-Use Integration Legislative Committee on Urban Growth and Infrastructure Carolyn Flowers CEO Charlotte Area Transit System March 23, 2010 Charlotte Region
MARTA s blueprint for the future. COFFEE AND CONVERSATION Kyle Keahey, More MARTA Atlanta Dec. 5, 2018
 MARTA s blueprint for the future COFFEE AND CONVERSATION Kyle Keahey, More MARTA Atlanta Dec. 5, 2018 TODAY S AGENDA About MARTA Economic development/local impact More MARTA Atlanta program Program summary/timeline
Community Open Houses November 29 December 7, 2017
 Community Open Houses November 29 December 7, 2017 1 Community Open House Agenda 6:00 PM Open House 6:30-7:30 PM Presentation and Q&A 7:30-8:00 PM Open House Resumes after the presentation and Q&A Thank
REPORT CARD FOR CALIFORNIA S INFRASTRUCTURE WHAT YOU SHOULD KNOW ABOUT CALIFORNIA S TRANSIT FACILITIES
 TRANSIT GRADE: C- WHAT YOU SHOULD KNOW ABOUT TRANSIT FACILITIES California needs robust, flexible and reliable transit systems to reduce peak congestion on our highways, provide options for citizens who
Southern California - CHSRA
 CALIFORNIA HIGH-SPEED RAIL Michael Gillam, Deputy Program Director Southern California - CHSRA CMAA - Construction Management Association of America July 19, 2012 CALIFORNIA S HIGH-SPEED TRAIN SYSTEM Largest
Funding Scenario Descriptions & Performance
 Funding Scenario Descriptions & Performance These scenarios were developed based on direction set by the Task Force at previous meetings. They represent approaches for funding to further Task Force discussion
ROCHESTER, MINNESOTA
 ROCHESTER, MINNESOTA Rochester Public Works TRANSIT AND PARKING DIVISION Transit and Parking Manager Tony Knauer tknauer@rochestermn.gov SERVICE ATTITUDE CONSISTENCY - TEAMWORK ROCHESTER TRANSIT & PARKING
Sustainability SFMTA Path to Platinum
 Sustainability SFMTA Path to Platinum Ed Reiskin San Francisco Municipal Transportation Agency, Director of Transportation San Francisco, CA Timothy Papandreou Deputy Director Strategic Planning & Policy
Needs and Community Characteristics
 Needs and Community Characteristics Anticipate Population and Job Growth in the City Strongest density of population and jobs in Ann Arbor are within the Study Area Population expected to grow 8.4% by
Policy Note. Vanpools in the Puget Sound Region The case for expanding vanpool programs to move the most people for the least cost.
 Policy Note Vanpools in the Puget Sound Region The case for expanding vanpool programs to move the most people for the least cost Recommendations 1. Saturate vanpool market before expanding other intercity
Appendix C. Parking Strategies
 Appendix C. Parking Strategies Bremerton Parking Study Introduction & Project Scope Community concerns regarding parking impacts in Downtown Bremerton and the surrounding residential areas have existed
Strategic Plan
 2005-2015 Strategic Plan SUMMARY OF THE REVISED PLAN IN 2011 A decade focused on developing mass transit in the Outaouais A updated vision of mass transit in the region The STO is embracing the future
Community Meetings June 2018
 Community Meetings June 2018 1 Welcome and Agenda Thank you for joining us! 6:00 pm Open House 6:30 pm Welcome & Presentation 7:00 pm Q&A 7:15 pm Open House Resumes 8:00 pm Meeting Concludes 2 Purpose
Welcome and Agenda. Thank you for joining us! 6:00 pm Open House. 6:30 pm Welcome & Presentation. 7:00 pm Q&A. 7:15 pm Open House Resumes
 1 Welcome and Agenda Thank you for joining us! 6:00 pm Open House 6:30 pm Welcome & Presentation 7:00 pm Q&A 7:15 pm Open House Resumes 8:00 pm Meeting Concludes 2 Purpose of this Meeting Introduce project
Public Meeting. City of Chicago Department of Transportation & Department of Housing and Economic Development
 Public Meeting City of Chicago Department of Transportation & Department of Housing and Economic Development Funded by Regional Transportation Authority September 12, 2011 In partnership with Presentation
EASTSIDE PHASE 2 - PART 1 GREENWOOD AVE. STATION LOCATION PLAN PNR + TOD TOD BY OTHERS WASHINGTON BLVD. STATION FACILITIES + TOD
 PARKING STRUCTURE 120 x 180 FOOTPRINT 2 STORY STRUCTURE 200 CARS PNR + TOD OO DA VE. TOD BY OTHERS EE NW A2 06 270 GR x 23 WA S HIN PL AT F OR M GT ON BL VD. STATION FACILITIES + TOD S. SCHWARZKOPF S.
Study Area, Related Projects and Travel Markets
 Study Area, Related Projects and Travel Markets Study area and related projects Travel between Valley and Westside North San Fernando Valley BRT (Alignment TBD) East San Fernando Valley Transit Corridor
Pomona Rotary December 19, 2017
 Pomona Rotary December 19, 2017 Los Angeles County s population will grow by 5.9% to 10.7 million by 2024 During that same period, the San Gabriel Valley will grow by 7.6% to more than 1.5 million; taking
Orange Line Bus Rapid Transit (BRT) Improvements San Fernando Valley Service Council April 3, 2019
 Improvements San Fernando Valley Service Council April 3, 2019") Orange Line Bus Rapid Transit (BRT) Improvements San Fernando Valley Service Council April 3, 2019 1 Measure M Transit Projects in San Fernando Valley 2 1 2 Measure M Transit Projects Schedule Project
Orange Line Bus Rapid Transit (BRT) Improvements San Fernando Valley Service Council April 3, 2019 1 Measure M Transit Projects in San Fernando Valley 2 1 2 Measure M Transit Projects Schedule Project
2.4 Build Alternatives
 Table 2-1. Future Transit Network Changes between No Build and TSM Alternatives Operator Route Group No. Route ID and Description Peak Headway (min) No Build Off-peak Headway (min) Peak Headway (min) TSM
Transportation Sustainability Program
 Transportation Sustainability Program Photo: Sergio Ruiz San Francisco is a popular place to work, live and visit, straining the existing transportation network Roads and transit vehicles nearing capacity
Sepulveda Pass Corridor Systems Planning Study Update
 Los Angeles County Metropolitan Transportation Authority Sepulveda Pass Corridor Systems Planning Study Update June 20, 2012 Measure R Transit Corridors One of 12 Measure R Transit Corridors approved by
WASHINGTON STATE ROAD USAGE CHARGE ASSESSMENT
 1 WASHINGTON STATE ROAD USAGE CHARGE ASSESSMENT Anthony L. Buckley Director, Office of Innovative Partnerships Washington State Department of Transportation Overview: Washington State Infrastructure 2
Downtown Transit Connector. Making Transit Work for Rhode Island
 Downtown Transit Connector Making Transit Work for Rhode Island 3.17.17 Project Evolution Transit 2020 (Stakeholders identify need for better transit) Providence Core Connector Study (Streetcar project
Car Sharing at a. with great results.
 Car Sharing at a Denver tweaks its parking system with great results. By Robert Ferrin L aunched earlier this year, Denver s car sharing program is a fee-based service that provides a shared vehicle fleet
Preliminary Definition of Alternatives. 3.0 Preliminary Definition of Alternatives
 3.0 What preliminary alternatives are being evaluated? The alternatives for the East San Fernando Valley Transit Corridor project that were considered for screening include the No Build Alternative, Transportation
Construction Management Association of America (CMAA) Thursday, August 18, 2011 Frank Quon, PE Lan Saadatnejadi, PE
 Thursday, August 18, 2011 Frank Quon, PE Lan Saadatnejadi, PE") Metro s Highway Program Construction Management Association of America (CMAA) Thursday, August 18, 2011 Frank Quon, PE Lan Saadatnejadi, PE Los Angeles County Sources: Metro 2009 Long Range Transportation
Metro s Highway Program Construction Management Association of America (CMAA) Thursday, August 18, 2011 Frank Quon, PE Lan Saadatnejadi, PE Los Angeles County Sources: Metro 2009 Long Range Transportation
Sepulveda Pass Corridor Systems Planning Study
 Los Angeles County Metropolitan Transportation Authority Sepulveda Pass Corridor Systems Planning Study Streets and Freeways Subcommittee January 17, 2013 1 Sepulveda Pass Study Corridor Extends for 30
Bi-County Transitway/ Bethesda Station Access Demand Analysis
 Bi-County Transitway/ Bethesda Station Access Demand Analysis Prepared for: Washington Metropolitan Area Transit Authority Office of Planning and Project Development May 2005 Prepared by: in conjunction
ACT Canada Sustainable Mobility Summit Planning Innovations in Practice Session 6B Tuesday November 23, 2010
 ACT Canada Sustainable Mobility Summit Planning Innovations in Practice Session 6B Tuesday November 23, 2010 Presentation Outline Context t of Mississauga i City Centre Implementing Paid Parking and TDM
Connected Vehicle and Autonomous Vehicle (CV/AV) Mobility and Technology
 Mobility and Technology") Connected Vehicle and Autonomous Vehicle (CV/AV) Mobility and Technology Randy Iwasaki Executive Director Contra Costa Transportation Authority May13, 2016 WHO WE ARE The Contra Costa Transportation Authority
Connected Vehicle and Autonomous Vehicle (CV/AV) Mobility and Technology Randy Iwasaki Executive Director Contra Costa Transportation Authority May13, 2016 WHO WE ARE The Contra Costa Transportation Authority
3.0 TRANSPORTATION ISSUES AND ANALYSIS
 3.0 TRANSPORTATION ISSUES AND ANALYSIS 3.1 Transit Analysis The following sections address the anticipated transit service levels under each of the alternatives considered in the detailed screening as
More than $9 Million coming to Central Valley for transportation
 More than $9 Million coming to Central Valley for transportation From free bus service to electric buses Part of overall $97 Million awarded to public transportation projects A total of 152 local public
METRONext. Vision & Moving Forward Plans. Board Workshop. December 11, DRAFT For Preliminary Discussion Only
 METRONext Vision & Moving Forward Plans Board Workshop December 11, 2018 Disclaimer This presentation is being provided solely for discussion purposes by the Board of Directors of the Metropolitan Transit
5. OPPORTUNITIES AND NEXT STEPS
 5. OPPORTUNITIES AND NEXT STEPS When the METRO Green Line LRT begins operating in mid-2014, a strong emphasis will be placed on providing frequent connecting bus service with Green Line trains. Bus hours
Help shape your community investment in Wake Transit. Fiscal Year 2019 Draft Work Plan Summary
 Help shape your community investment in Wake Transit Fiscal Year 2019 Draft Work Plan Summary Wake County, growth and transit The Triangle is one of the fastest-growing regions in the nation. Wake County
Los Angeles County Metropolitan Transportation Authority. Paid Parking Pilot Program Parking Management
 Los Angeles County Metropolitan Transportation Authority Paid Parking Pilot Program Parking Management Overview Metro currently operates over 22,000 parking spaces at 48 stations. This number will increase
APPROVE PROPOSED CHANGES TO TIER I BUS SERVICE FOR DECEMBER 2010
 ~ Los Angeles County ~ M"'",poH',. T"",port,,;o. Auth..;" Metro 24 One Gateway Plaza Los Angeles, CA 90012-2952 REVISED OPERATIONS COMMITTEE SEPTEMBER 16, 2010 SUBJECT: ACTION: PROPOSED CHANGES TO TIER
The Case for. Business. investment. in Public Transportation
 The Case for Business investment in Public Transportation Introduction Public transportation is an enterprise with expenditure of $55 billion in the United States. There has been a steady growth trend
2013/2014 Strategic Priorities Fund Application Overview
 2013/2014 Strategic Priorities Fund Application Overview Bob Paddon, Executive Vice President Strategic Planning and Public Affairs TransLink 3 December 2013 Strategic Priorities Fund Application Context
Metro. Board Report. File #: , File Type: Informational Report Agenda Number: 24
 Metro Board Report Los Angeles County Metropolitan Transportation Authority One Gateway Plaza 3rd Floor Board Room Los Angeles, CA SYSTEM SAFETY, SECURITY AND OPERATIONS COMMITTEE APRIL 14, 2016 SUBJECT:
Rapid Transit and Land-Use Integration a Reality
 City of Charlotte Rapid Transit and Land-Use Integration a Reality Transportation Oversight Committee Carolyn Flowers CEO Charlotte Area Transit System April 29, 2010 Charlotte Region Statistics Mecklenburg
Redefining Mobility Ready or not: Autonomous and connected vehicle planning and policy, now and in the future
 Redefining Mobility Ready or not: Autonomous and connected vehicle planning and policy, now and in the future Randy Iwasaki November 30, 2017 WHO WE ARE The Contra Costa Transportation Authority (CCTA)
Feasibility Study. Community Meeting March, North-South Commuter Rail Feasibility Study
 Feasibility Study Community Meeting March, 2017 1 Agenda 1. Welcome / Introductions 2. Background / Meeting Purpose 3. Progress to Date Options Evaluated Capital/Operating Costs Ridership 4. Financial
Office of Transportation Bureau of Traffic Management Downtown Parking Meter District Rate Report
 Office of Transportation Bureau of Traffic Management 1997 Downtown Parking Meter District Rate Report Introduction The City operates approximately 5,600 parking meters in the core area of downtown. 1
THE WILSHIRE CORRIDOR: RAIL AND ITS ALTERNATIVES. Prepared By: Jacki Murdock Transportation and Environmental Planner
 THE WILSHIRE CORRIDOR: RAIL AND ITS ALTERNATIVES Prepared By: Jacki Murdock Transportation and Environmental Planner December 13 th, 2012 Overview Characteristics of Wilshire Boulevard Overview of the
Dear New Clean Cities Stakeholder:
 Dear New Clean Cities Stakeholder: I am writing to invite you to join the Florida Gold Coast Clean Cities Coalition. We are a voluntary public and private partnership, which is dedicated to reducing the
L. A. Metro s Parking Management Program Principles Applied. October 17, 2011 Rail-Volution, Washington D.C.
 Los Angeles County Metropolitan Transportation Authority L. A. Metro s Parking Management Program Principles Applied October 17, 2011 Rail-Volution, Washington D.C. What is Parking Management? Various
Comprehensive Regional Goods Movement Plan and Implementation Strategy Goods Movement in the 2012 RTP/SCS
 Comprehensive Regional Goods Movement Plan and Implementation Strategy Goods Movement in the 2012 RTP/SCS Annie Nam Southern California Association of Governments September 24, 2012 The Goods Movement
ALAMEDA CORRIDOR. A A Project of National Significance. TRB Summer Conference MTS as a Component of the Nation s Transportation System June 25, 2002
 ALAMEDA CORRIDOR A A Project of National Significance TRB Summer Conference MTS as a Component of the Nation s Transportation System June 25, 2002 Top U.S. Container Ports (2001) LOS ANGELES 5.18 LONG
Agenda. Utility Undergrounding Strategies & Laguna Canyon Road Master Plan
 Utility Undergrounding Strategies & Laguna Canyon Road Master Plan January 17, 2017 City Council Meeting 2 Agenda Progress since March 2016 Status of undergrounding and road widening between El Toro Rd.
STRATEGIC PRIORITIES AND POLICY COMMITTEE MAY 5, 2016
 STRATEGIC PRIORITIES AND POLICY COMMITTEE MAY 5, 2016 Shift Rapid Transit Initiative Largest infrastructure project in the city s history. Rapid Transit initiative will transform London s public transit
Community Meetings. January/February 2019
 Community Meetings January/February 2019 Purpose of Meeting Present evaluation of Valley- Westside concepts Present initial Westside- LAX concepts Gather community feedback 2 Study Process 3 Overview:
David Martin, Director of Planning and Community Development. Establishment of LAX FlyAway Stop in Santa Monica
 Information Item Date: January 31, 2014 To: From: Subject: Mayor and City Council David Martin, Director of Planning and Community Development Establishment of LAX FlyAway Stop in Santa Monica Introduction
East San Fernando Valley Transit Corridor. Information Session, October 10, 2017
 East San Fernando Valley Transit Corridor Information Session, October 10, 2017 1 Welcome and Meeting Purpose Introductions Metro Transit Corridors Planning Metro Real Estate Metro Community Relations
PASADENA. Altadena Dr. Allen Av. Lake Av. Hill Av. Mountain St. Orange Grove Bl. Villa St LAKE ALLEN SIERRA MADRE VILLA Walnut St.
 St Eastern Av ROUTE MAP Express Line 501 provides daily service from North Hollywood Station ( Orange & Red Lines) to the ( & Stations). For more information, go to metro.net LITTLE TOKYO/ ARTS DISTRICT
The Future of Transportation on the Caltrain Corridor
 The Future of Transportation on the Caltrain Corridor 11.30.16 1 2 Today What is happening Vision Recommendations What is costs How to pay for it 3 The Caltrain Corridor is home to the world s innovation
Delta Kappa Gamma January 22, 2018
 Delta Kappa Gamma January 22, 2018 Los Angeles County s population will grow by 5.9% to 10.7 million by 2024 During that same period, the San Gabriel Valley will grow by 7.6% to more than 1.5 million;
NET TOLL REVENUE REINVESTMENT GRANT PROGRAM. South Bay Service Council
 NET TOLL REVENUE REINVESTMENT GRANT PROGRAM South Bay Service Council MARCH 13, 2015 NET TOLL REVENUE REINVESTMENT PROGRAM Metro ExpressLanes toll revenues fund: Direct program expenses (Operations & Maintenance)
Chapter 7: Travel Demand Analysis. Chapter 8. Plan Scenarios. LaSalle Community Center. Image Credit: Town of LaSalle
 Chapter 7: Travel Demand Analysis Chapter 8 Plan Scenarios LaSalle Community Center. Image Credit: Town of LaSalle 164 Chapter 8: Plan Scenarios Moving Ahead for Progress in the 21 st Century Act (MAP
Tempe Streetcar. March 2, 2016
 Tempe Streetcar March 2, 2016 Tempe Profile 40 sq. miles, highest density in state University Town, center of region Imposed growth boundaries (density increase) Mixed use growth/intensifying land use
Capital Needs Assessment Riders Advisory Council July2, 2008
 Capital Needs Assessment 2011-2020 Riders Advisory Council July2, 2008 1 Outline I. Capital Improvement Plan History II. Capital Improvement Plan Update III. Capital Needs Assessment State of Good Repair
Valley Metro Overview. ITE/IMSA Spring Conference March 6, 2014
 Valley Metro Overview ITE/IMSA Spring Conference March 6, 2014 Valley Metro Who Are We? Operate Regional Transit Services Valley Metro and Phoenix are region s primary service providers Light Rail and
6/6/2018. June 7, Item #1 CITIZENS PARTICIPATION
 June 7, 2018 Item #1 CITIZENS PARTICIPATION 1 Item #2 APPROVAL OF MINUTES Item #3 TRAC GOALS, FRAMEWORK & AGENDA REVIEW 2 COMMITTEE GOALS Learn about Southern Nevada s mobility challenges, new developments
Transportation Electrification: Reducing Emissions, Driving Innovation. August 2017
 Transportation Electrification: Reducing Emissions, Driving Innovation August 2017 CA raising the bar in environmental policy and action Senate Bill 350 (DeLeon, 2015) established broad and ambitious clean
PEACHTREE CORRIDOR PARTNERSHIP. Current Status & Next Steps
 PEACHTREE CORRIDOR PARTNERSHIP Current Status & Next Steps PEACHTREE CORRIDOR PARTNERSHIP Why Peachtree? Why Now? I. THE CONTEXT High Level View of Phasing Discussion Potential Ridership Segment 3 Ease
Kenosha-Racine-Milwaukee (KRM)
") Kenosha-Racine-Milwaukee (KRM) Commuter Rail #147925 November 6, 2009 1 Guidance of KRM Commuter Rail Studies Intergovernmental Partnership Technical Steering Committee Temporary and Limited Authority
Kenosha-Racine-Milwaukee (KRM) Commuter Rail #147925 November 6, 2009 1 Guidance of KRM Commuter Rail Studies Intergovernmental Partnership Technical Steering Committee Temporary and Limited Authority
East San Fernando Valley Transit Corridor. TAC Briefing December 4, 2013
 East San Fernando Valley Transit Corridor TAC Briefing December 4, 2013 Overview Measure R Project Long Range Transportation Plan Reserves $170.1 Million 2018 Revenue Operations Date Coordination with
Redefining Mobility. Randy Iwasaki. Executive Director Contra Costa Transportation Authority January 18, 2018
 Redefining Mobility Randy Iwasaki Executive Director Contra Costa Transportation Authority January 18, 2018 Who We Are CCTA is a public agency formed by voters in 1988 to manage the county s transportation
Treasure Island Toll Policy, Affordability and Transit Pass Programs. TIMMA Board Meeting December 11, 2018
 Treasure Island Toll Policy, Affordability and Transit Pass Programs TIMMA Board Meeting December 11, 2018 Avoiding Island Gridlock 2 Island Mobility Goals Incentivize transit, walking, and biking Discourage
2.1 TRANSIT VISION 2040 FROM VISION TO ACTION. Expand regional rapid transit networks STRATEGIC DIRECTION
 TRANSIT VISION 2040 FROM VISION TO ACTION TRANSIT VISION 2040 defines a future in which public transit maximizes its contribution to quality of life with benefits that support a vibrant and equitable society,
Countdown to the Closure Extended 53-Hour Closure of I-405 Freeway Between U.S. 101 and I-10 Planned in Mid-July for Mulholland Bridge Demolition
 Countdown to the Closure Extended 3-Hour Closure of I-40 Freeway Between U.S. 0 and I-0 Planned in Mid-July for Mulholland Bridge Demolition Work Los Angeles, Calif. Plan Ahead, Avoid The Area, Or Stay
SamTrans Business Plan Update May 2018
 SamTrans Business Plan Update May 2018 SamTrans Business Plan Core Principles: 1. Sustain and enhance services for the transit-dependent 2. Expand and innovate mobility services 3. Promote programs that
TORONTO TRANSIT COMMISSION REPORT NO.
 Form Revised: February 2005 TORONTO TRANSIT COMMISSION REPORT NO. MEETING DATE: October 24, 2012 SUBJECT: DOWNTOWN RAPID TRANSIT EXPANSION STUDY (DRTES) PHASE 1 STRATEGIC PLAN ACTION ITEM RECOMMENDATIONS
STAFF REPORT CITY COUNCIL MEETING SEPTEMBER 15, 2015
 SHED BUSINESS a "making a positive difference now" TO: FROM: RE: STAFF REPORT CITY COUNCIL MEETING SEPTEMBER 15, 2015 Honorable Mayor and City Council Nancy Kerry, City Manager Discussion and Possible