Parking Strategy Nanaimo Regional General Hospital Area Final Report
|
|
|
- Sheila Nash
- 5 years ago
- Views:
Transcription


1 Parking Strategy Nanaimo Regional General Hospital Area Final Report City of Nanaimo April 2018 # Fort Street, Victoria, BC V8W 1G2 T: File: This report is prepared for the sole use of the City of Nanaimo. No representations of any kind are made by Urban Systems Ltd. or its employees to any party with whom Urban Systems Ltd. does not have a contract. Copyright 2018.
2 Table of Contents 1.0 Introduction Guiding Principles Methodology Data Interpretation Analysis Current Parking Restrictions Previously Completed Transportation and Parking Enhancements in the Hospital Area On-Street Parking Current Conditions On-Street Parking Occupancy On-Street Parking Turnover Summary On-Street Parking Off-Street Parking Current Condition Inventory of Parking Stalls Off-Street Parking Costs Off-Street Parking Occupancy NRGH Summary Public consultation Parking Management Strategies Implementation Phasing of Restrictions Short-term Long-term Coordination with the Hospital Area Plan and Hospital Area Transportation Plan Pay Parking Notice to Hospital Staff Parking Signage Transit Cycling and Walking Implementation Costs Signage Pay Parking Enforcement Summary APPENDIX A - Parking Supply and Demand Occupancy Summary Maps APPENDIX B - On-Street Turnover Summary Maps APPENDIX C - Off-Street Parking Survey Summary Maps APPENDIX D - Summary Community Engagement i
3 1.0 INTRODUCTION In the spring of 2017, the City of Nanaimo initiated a study evaluate current on-street parking in the area surrounding the Nanaimo Regional General Hospital (NRGH) and make recommendations for how to manage any parking issues identified. The main parking concerns evaluated through this process include the perceived lack of on-street parking, growth in parking demand (due to the simultaneous expansion of NRGH and the ongoing densification of surrounding residential areas) and the potential for these issues to create conflict between area residents and people visiting or working at NRGH. Further, it is intended that the findings of this study will support the larger Hospital Area Plan and neighbourhood transportation plan, which are currently being undertaken in a parallel process. The first step in developing a strategy for managing parking in the hospital area was to establish a baseline understanding of parking supply and demand in the area. Starting in early June 2017, several parking counts were undertaken to determine the occupancy and turnover of on-street parking near the hospital and NRGH off-street parking facilities. This report provides an overview of the study methodology, results from both on-street and off-street parking counts, and feedback received from initial public engagement sessions conducted by the City of Nanaimo; including: a public open house and stakeholder meeting held in July 2017, and feedback from an online survey conducted June August This report also summarizes previous data collections carried out by the City of Nanaimo. 1
4 2.0 GUIDING PRINCIPLES In order to guide the planning process five Guiding Principles have been developed to establish a framework for developing solutions for the parking issues within the hospital area. These will provide the foundation for how to approach parking issues in the hospital area and ensure planning action for the hospital area, including land use, transportation and parking are coordinated. 1. Maximize Benefits For All Users - Increase the flexibility and availability of on-street parking for all users groups in the Hospital Area through the efficient use of existing excess road space, with a focus on meeting the short and long term parking needs of both hospital staff and the broader community. 2. Fairness and Ongoing Customer Service - Make parking more accessible and easier to find by implementing payment options (as required), improving signage, and providing up-to-date information while ensuring fair parking practices. As parking needs are dynamic and highly responsive to local conditions, the City will continually update the parking strategy over time, and seek new innovative ways to improve on the status quo, streamline enforcement and balance the parking needs of local institutions, businesses and neighbourhoods. 3. Ongoing Partnerships - Parking policies will coordinate residential, business and institutional sectors to ensure the diverse parking and transportation needs of these users are addressed in an efficient and economical way. In particular, the City should work with the Nanaimo Regional General Hospital to identify solutions that lead to positive outcomes for both organizations and ensure that future changes to the Hospital campus do not negatively impact other user groups in the area. 4. A Balanced Transportation System - Parking management is used to encourage alternative modes of transportation, such as walking, cycling and public transportation. Parking supply should be strategically managed to meet the overall objectives for the neighbourhood, as well as the goals and objectives of the Nanaimo Transportation Master Plan. Making transit cost competitive to driving by linking parking costs to transit costs is essential. 5. A Self-funded Parking System - Fees collected from parking will be used to pay for the parking system (infrastructure, maintenance, equipment, enforcement, upgrades, customer service, land acquisition, management and more). Pricing levels will reflect relative demand while ensuring that parking in the Hospital Area of the City is self-funded by including the cost of future upgrades, land acquisition, and asset management in the cost of parking. This user pay system will aim to balance the needs of parking customers with the costs of managing parking. 2
5 3.0 METHODOLOGY To establish an understanding of the current parking supply and demand in the study area, shown in Figure 3.1, on-street and off-street parking areas were inventoried to verify the following: current number of parking spaces; their current level of utilization (occupancy); the average duration of vehicle parking (turnover); and time periods associated with peak utilization. Parking data was collected throughout the entire study area, and on the hospital site itself using an ArcGIS tablet application for inputting data. The data collected from this area included the approximate parking capacity (hypothetical maximum number of parked cars), occupancy and turnover of on-street parking. This overall survey also verified all parking restrictions and accessible parking stalls. Parking Supply The maximum number of vehicles able to park on each block was approximated since most on street parking has undefined stalls and it can be difficult to distinguish driveways in front of residential homes. These approximations aim to represent the maximum capacity based on the amount of space typically left between vehicles and the normal mix of vehicle sizes. However, it is possible to occasionally obtain an occupancy over 100 percent, if vehicles are parked very closely together or there is a higher proportion of smaller vehicles. Study Period This survey was conducted over various days and time periods: 1. Wednesday May 31 st Confirmed On-street Parking Supply Data 2. Wednesday June 7 th Off-street Hospital Parking Occupancy Data Collection (Full-day) - four time periods 7 am 10 am 11 am 2 pm 3 pm 5 pm 6 pm 8 pm 3. Thursday June 8 th On-street Parking Occupancy Data Collection (Full-day) - four time periods 7 am 10 am 11 am 2 pm 3 pm 5 pm 6 pm 8 pm 4. Thursday September 21 st On-street Parking Turnover Data Collection with Bylaw Services using ALRP (Full-day) - three time periods 8 am 12 pm 1:30 pm 3:30 pm 4:30 pm 6:30 pm It should be noted that turnover data was collected primarily for larger public streets and was not collected for the majority of smaller residential streets in the study area. Previous Data Collection Efforts This report also provides an overview of prior data collection efforts completed by the City of Nanaimo in the winter of 2017 during the following times: Wednesday January 11 th - On-street Parking Occupancy Two time periods 1 pm 7 pm Sunday January 22 nd - On-street Parking Occupancy One time period 1 pm Sunday January 29 th - On-street Parking Occupancy One time period 2 pm Wednesday February 22 nd - On-street Parking Occupancy Two time periods 2 pm 6:30 pm 3

6 Figure NRGH Parking Study Area 4
7 3.1 Data Interpretation The occupancy data collected for on-street parking areas includes the number of cars parked along each block segment, the parking restrictions, and hypothetical maximum parking spaces. Occupancy data for off-street parking areas includes the number of stalls in each parking lot, including occupancy for specialized stalls (i.e. physician parking, emergency call-back, contractors, etc.). The occupancy for both on-street and off-street parking areas was calculated using: Example: Occupancy = Parked Cars Maximum Parking Spaces Occupancy = 7 = 50% occupied 14 The data collected for turnover includes the license plate numbers and record time for a full-day period. The license plate recordings were compared from pass to pass to determine the number of cars that were the same, and the number of cars that were new. The total turnover was calculated using: Example: Total Turnover = (Pass 1 Parked Cars) + (Pass 2 New Cars) + (Pass 3 New Cars) Total Turnover = = 16 different cars parked The average parking duration was calculated using: Parking Duration (Pass 2 Parked Cars)(Pass 2 Time Pass 1 Time) + (Pass 3 Parked Cars)(Pass 3 Time Pass 2 Time) = Total Turnover Example: 12 (11: 30AM 10: 00AM) + 8 (12: 45PM 11: 30AM) Parking Duration = 16 parked cars = 2.0 hours = 2. 0 hours different cars parked This method for determining parking duration becomes more accurate the more passes that are recorded. Passes were made approximately every hour during the study day with exception of two break periods 12:00 pm - 1:30 pm and 3:30 pm 4:30 pm. Because passes were performed within a set study period over the day, the average parking duration does not account for the duration of vehicles parked prior to the counts being initiated or after they were completed. This could lead to an actual average parking duration that is higher. Further, as the turnover recording was only carried out every hour the exact time of each vehicles arrival and departure is not known, therefore, a buffer factor of 1 hour was applied for each recording. 5
8 Moving forward, when interpreting the findings of this analysis it is important to understand that on-street parking is a public amenity and not for the exclusive use of one group. Ideal occupancy is about 85%. This ensures the community resource of parking is being well used and residents and visitors should typically be able to find an available parking spot within the block. Therefore, high parking occupancy levels of 70-85% are considered optimal as it shows this public amenity is being well utilized while leaving 15-30% of spaces open for new parking customers. Parking occupancies greater than 85% should be considered high and reflective of a situation where demand for parking is beginning to exceed supply. In the determination of outputs from this study or implementation of potential parking management strategies it is important to recognize the challenges experienced by residents and visitors in some locations. However, any parking restrictions should look to assist residents and visitors with parking, but should not be created to guarantee parking availability. If parking immediately adjacent to a resident s home is essential they should plan to meet this need within their property. 6
9 4.0 ANALYSIS The analysis presented in Sections (below), contains a breakdown of the number of on-street parking spaces available during these times and a preliminary overview of the changing demand / supply of parking in the study area. The following analysis evaluates current parking demand and supply in the Hospital Area, including: Current parking restrictions Recently completed transportation and parking enhancements Existing parking supply On-Street parking conditions o Current parking supply and demand o Parking turnover Off-street parking conditions 4.1 Current Parking Restrictions As shown by Figure 4.1, there are currently three types of parking restrictions in the Study Area, including: 1-hour parking; 2-hour parking; Residential parking only. There are also several designated loading zones (i.e. 1 hour loading zone and 15 min loading zone) where parking is restricted, which have also been identified for the study area. Overall, the majority of streets or portions streets do not currently have parking restrictions. 7

10 Figure Current Parking Restrictions 8
11 4.2 Previously Completed Transportation and Parking Enhancements in the Hospital Area Over the past several years the City has made several efforts to improve the parking situation in the hospital area. These include the following changes: Added new 2 hour time restrictions to Boundary Crescent; In 2015 the City installed new cycling facilities, including dedicated bike lanes along Boundary Avenue, Boundary Crescent, Townsite Road, Bush Street and Pryde Avenue. Sidewalks have been completed on Boundary Crescent between Dufferin Crescent and Townsite Road, and on Strathmore Street between Boundary Avenue and Hallen Avenue. A new private five-storey above grade parking structure at 1515 Dufferin Crescent is under development in the area adding 203 parking spaces or 90 additional parking spaces beyond the 113 required. Various signage improvements and replacements made throughout the hospital area (ongoing). 4.3 On-Street Parking Current Conditions The following section provides an overview of on-street parking conditions in the Hospital Area, including occupancy and turnover On-Street Parking Occupancy The following observations for parking occupancy are based on on-street parking collected on Thursday June 8th as part of the parking study as well as data collected by City Staff in the winter of 2017 prior to the studies initiation. The existing inventory of on-street parking in the Study Area includes approximately 1812 spaces Morning The morning count was completed on Thursday, June 8 th, 2017 between 7:00 am and 10:00 am. The results of these counts are shown in Table 4.1 (below). During the morning time period 7 10 am 611 stalls (34%) were occupied of the 1812 stalls present. Time Table 4.1 Existing on-street Parking Inventory Daytime 7:00 am - 10:00 am Total Number of Stalls 1812 Total Number of Cars 611 Percent Occupied 34% In the morning the majority of streets adjacent to the hospital were beginning to see high occupancy levels with several sections exceeding 85%, several were at 100% capacity. Streets further from the study area generally remained fairly quiet. Streets with high occupancy (i.e. exceeding 85%), included: 9
12 Boundary Crescent between Dufferin Crescent and Graham Crescent Dufferin Crescent between Boundary Avenue and Grant Avenue Dufferin Crescent between Crescent View Drive and the main section of Dufferin Crescent Crescent View Drive between Forest Drive and Boundary Avenue Seafield Crescent A breakdown of occupancy by street and location can be found in Appendix A, Figure A Mid-day Mid-day parking counts were conducted Thursday, June 8 th, 2017 between 11:00 am and 2:00 pm. The results of these counts are shown in Table 4.2 (below). At Mid-day 665 stalls (37%) were occupied of the 1812 stalls present. Time Table 4.2 Existing on-street Parking Inventory Daytime 11:00 am 2:00 pm Total Number of Stalls 1812 Total Number of Cars 665 Percent Occupied 37% In general, mid-day was the busiest time for parking in the study area with the majority of streets adjacent to the hospital near or exceeding 85% occupancy. However, most of the surrounding residential streets remained relatively quiet throughout this period of the day. There was also a notable increase in parking on Dufferin Crescent, Townsite Road and Summerhill Place approaching Bowen Road, however, the highest occupancy areas generally correlate with areas directly adjacent to the hospital, including: Boundary Crescent between Graham Crescent and Dufferin Crescent Boundary Avenue between Dufferin Crescent and Strathmore Street Dufferin Crescent between Bowen Road and Boundary Avenue Dufferin Crescent between Boundary Avenue and Grant Avenue Dufferin Crescent between Crescent View Drive and the main section of Dufferin Crescent Crescent View Drive between Forest Drive and Boundary Avenue Seafield Crescent Grant Avenue between Dufferin Crescent and Nelson Street Nelson Street between Boundary Avenue and Grant Avenue A breakdown of occupancy by street and location can be found in Appendix A, Figure A2. 10
13 Afternoon Afternoon parking counts were conducted Tuesday, June 8 th, 2017 between 3:00 pm and 5:00 pm. The results of these counts are shown in Table 4.3 (below). In the afternoon counts 578 stalls (32%) were occupied of the 1812 stalls present. Time Table 4.3 Existing on-street Parking Inventory Daytime 3:00 pm 5:00 pm Total Number of Stalls 1812 Total Number of Cars 578 Percent Occupied 32% By the afternoon parking occupancy in the study area started to decrease as a whole though several streets adjacent to the hospital remained near or above 85% occupancy. Residential streets were shown to have ample parking into the evening. The streets that continued to have higher occupancy rates were directly adjacent to the hospital and included: Dufferin Crescent between Bowen Road and Boundary Avenue Dufferin Crescent between Boundary Avenue and Grant Avenue Seafield Crescent Grant Avenue between Dufferin Crescent and Nelson Street Nelson Street between Boundary Avenue and Grant Avenue A breakdown of occupancy by street and location can be found in Appendix A, Figure A Evening Evening parking counts were conducted Thursday June 8 th, The count was carried out between 6:00 pm and 8:00 pm. The results of these counts are shown in Table 4.4 (below). Between 6 pm and 8 pm 390 stalls (22%) were occupied of the 1812 stalls present. Time Table 4.4 Existing on-street Parking Inventory Daytime 6:00 pm 8:00 pm Total Number of Stalls 1812 Total Number of Cars 390 Percent Occupied 22% In the evening, parking was ample on every street in the study area. Some streets close to the hospital did have slightly higher occupancy rates, including: Boundary Avenue between Dufferin Crescent and Strathmore Street Dufferin Crescent between Boundary Avenue and Seafield Crescent Nelson Street between Hallen Avenue and Grant Avenue Dufferin Crescent between Crescent View Drive and the main section of Dufferin Crescent A breakdown of occupancy by street and location can be found in Appendix A, Figure A4 11
14 Previous Counts Conducted by the City of Nanaimo In the winter of 2017, the City of Nanaimo collected preliminary on-street parking data for streets immediately adjacent to the NRGH. These parking counts were conducted for both weekdays and weekends for afternoons and evenings. The follow section provides a brief overview of these counts and the occupancy rates observed. A complete summary is provided in Appendix A (Figures A5 A11). Wednesday January 11 th - On-street Parking Occupancy Two time periods 1 pm 7 pm 1:00 PM - The afternoon parking counts completed on Wednesday January 11 th at 1:00 pm covered the majority of the study area covered in counts conducted on June 8 th. The counts showed similar results to the June 8 th study, with parking occupancy rates in excess of 85% observed on many of the streets surrounding the hospital, including: Dufferin Crescent between Bowen Road and Boundary Avenue Dufferin Crescent between Boundary Avenue and Grant Avenue Seafield Crescent Nightingale Crescent Grant Avenue between Dufferin Crescent and Nelson Street Nelson Street between Boundary Avenue and Grant Avenue Crescent View Drive (80% Occupancy) 7:00 PM The evening counts completed on Wednesday January 11 th at 7:00 pm covered a similar area to the June 8 th study and showed very low parking occupancy for most streets in the study area. Only Townsite Road, Seafield Crescent and Dufferin Crescent has occupancy rates greater than 50%. This was fairly consistent with the findings for the study completed on June 8 th, where parking demand appears to drop off substantially by the later afternoon. Sunday January 22 nd - On-street Parking Occupancy One time period 1 pm 1:00 PM - The afternoon parking counts completed on Sunday January 22 nd at 1:00 pm covered the majority of the study area covered in counts conducted on June 8 th. In general, parking occupancy was substantially lower than the weekday counts collected on Wednesday January 11 th at 1:00 pm. During this time the busiest streets for parking were Dufferin Crescent between Boundary Avenue and Waddington Road, which had a parking occupancy of 76%. Higher occupancy rates between 51% and 71% were observed on: Nightingale Crescent Boundary Avenue between Dufferin Crescent and Nelson Street Nelson Street between Boundary Avenue and Hallen Avenue Townsite Road between Boundary Crescent and Bowen Road Sunday January 29 th - On-street Parking Occupancy One time period 2 pm 2:00 PM - The afternoon parking counts completed on Sunday January 29 th at 2:00 pm covered a smaller area then the study area covered in counts conducted on June 8 th. Counts were focused on roads immediately adjacent to the hospital. In general, parking occupancy was substantially lower than the weekday counts collected on Wednesday January 11 th at 1:00 pm and similar to counts collected on the previous Sunday (January 22 nd ). During this time the busiest streets section was Dufferin Crescent between Boundary Avenue and Seafield Crescent, which had a parking occupancy of 73%. Higher occupancy rates between 51% and 71% were observed on: 12
15 Boundary Avenue between Dufferin Crescent and Nightingale Crescent Nelson Street between Boundary Avenue and Hallen Avenue Wednesday February 22 nd - On-street Parking Occupancy Two time periods 2 pm 6:30 pm 2:00 PM - The afternoon parking counts completed on Wednesday February 22 nd at 2:00 pm covered a smaller area then the study area covered in counts conducted on January 11 th and June 8 th. Counts were focused on roads immediately adjacent to the hospital. However, the counts showed similar results as the parking surveys conducted on January 11 th and June 8 th. This survey showed parking occupancy rates in excess of 85% on many of the streets surrounding the hospital, including: Dufferin Crescent between Summerhill Place and Boundary Avenue Dufferin Crescent between Boundary Avenue and Grant Avenue Seafield Crescent Nightingale Crescent Grant Avenue between St. David Crescent and Nelson Street Boundary Avenue between Dufferin Crescent and Nightingale Crescent Crescent View Drive between Forest Drive and Boundary Avenue 7:00 PM The evening counts completed on Wednesday February 22 nd at 6:30 pm also covered a smaller area then the study area covered in counts conducted on January 11 th and June 8 th. Again, counts were focused on roads immediately adjacent to the hospital. Similar to the January 11 th and June 8 th surveys observations, the evening of February 22 nd showed very low parking occupancy for most streets in the study area. Only portions of Dufferin Crescent and Nelson Street had occupancy rates greater than 50%. This was fairly consistent with the findings for the surveys completed on January 11 th and June 8 th, where parking demand appears to drop off substantially by the late afternoon. Summary Previous Counts The counts conducted by City of Nanaimo staff in the winter 2017 reinforce the observations made in June. Both data sets generally show higher parking occupancy rates during the day into the early afternoon. Parking occupancy appears to peak mid-day then gradually fall-off in the latter half of the afternoon (3 pm), reaching much lower rates of occupancy by the early evening On-Street Parking Turnover Turnover data collection was conducted on Thursday September 21 st, 2017 by the City of Nanaimo Bylaw Services Utilizing an Automated Licence Plate Recognition (ALPR) system. The turnover study focused on a smaller sub-area of the total study area, which mostly included main roads and areas where parking occupancy was observed to be high. Turnover data was recorded for three time periods morning (8:00 am 12:00 pm), afternoon (1:30 pm 3:30 pm) and evening (4:30 pm 6:30 pm). The results of these counts are shown in Table 4.5 (below), the existing inventory of on-street parking in the turnover study sub-area includes approximately 786 spaces. 13
16 Time Period Morning Afternoon Evening Times 8:00 am 12:00 pm 1:30 pm 3:30 pm 4:30 pm 6:30 pm Number of Stalls Table Turnover Data Number of Overtime Observations 1 Percent Stalls Overtime Average Parking Duration % % % 2.77 Overall 918* 2.24 Averages 1 Overtime observation represents the first overtime observation of that vehicle in the series (i.e. recorded on at least 2 passes). *Some cars were present in more than one time period, which is why this number does not equal Morning + Afternoon + Evening. In the morning study 83% of parking stalls surveyed in the study area did not turnover, meaning 83% of onstreet parking spaces contained a car that was parked in the same spot for at least two passes. The average parking duration in the morning was 2.35 hrs. (2 hrs. 21 mins). The turnover data collected on the afternoon of Thursday September 21 st, 2017 had an average parking duration of 2.68 hrs. (2 hrs. 41 mins), which reflected an increase in duration as many cars remained parked since the morning collection period. In the afternoon period 39% of on-street parking spaces did not turnover, this was a significant decrease in the number of on-street parking spaces with cars that were parked in the same spot for at least two passes. The evening also saw an increase in parking duration from the morning period, but similar to the afternoon period also reflected decrease in the number of on-street parking spaces that contained a car that did not move between at least two passes. The average parking duration, in the evening period was 2.77 hrs. (2 hrs. 46 mins). A breakdown of turnover by street and location can be found in Appendix B, Figure B1 - B3. Turnover Summary Overall, the turnover data collected reflects a relatively low turnover rate on roads adjacent to the hospital with average parking times ranging from 2.35 hrs. to 2.77 hrs. on non-residential streets adjacent to the hospital. However, the data did also reflects a significant number of people parking for 2 hours or less meaning that a large number of on street parking spaces were turning over somewhat frequently. Though the degree of turnover varied significantly from street to street (see Appendix B, Figure B1 - B3), the majority of people parking in this area seemed to either park for a short period of time (i.e. < 2.0 hrs.) or stay in the same spot for most of the day, with few people in between. Importantly, it was observed that the number of vehicles that did not turnover between at least two passes decreased throughout the day, with the highest intersection of parking occupancy and low-turnover occurring in the morning period where the same vehicles were recorded in 83% on-street spaces on multiple passes Summary On-Street Parking On-street parking immediately adjacent to hospital can be characterized as well-utilized with high occupancy rates and low turnover throughout the day and into the early afternoon. Streets in the study area not immediately adjacent to the hospital were generally observed as having ample on-street parking. Several streets immediately adjacent to the hospital, such as Dufferin Crescent, Boundary Avenue, Seafield Crescent, Grant Avenue, Crescent View Drive and Nelson Street showed occupancy rates in excess of 85% during certain periods of the day. This was much higher than compared to the surrounding residential areas, which generally had ample parking throughout the day. Lower turnover rates were also observed on most of these busy streets, especially during the morning period where the same vehicles were recorded in 83% on-street spaces in multiple passes. 14
17 It should also be understood that although on-street parking areas adjacent to the hospital are busy, there is generally on-street parking available on most street. Further, though many cars remained parked in the same spot for multiple passes a large number of spaces appeared to turnover frequently. The data collected generally supports informal observations offered by residents and hospital staff, which suggested a large portion of on-street parking is occupied by hospital staff during the day, as well as hospital visitors attending clinics or visiting patients for shorter periods of time. Though the scale of this issue is still to be determined, it appears that the shortage of on-street parking is not severe and that a substantial amount of parking can still be found in close proximity (<400 m) to the hospital even during peak hours. 4.4 Off-Street Parking Current Condition In order to better understand parking conditions in the hospital area off-street parking lots belonging to the hospital were surveyed to determine their occupancy and level of utilization throughout the day. The following section provides an overview of the off-street parking occupancy survey conducted on June 7 th, 2017 between 7 am and 8 pm. Inventory of Parking Stalls Background information collected from the hospital provided a thorough inventory of the off-street parking facilities on the hospital site. Table 4.6 below outlines the number of parking spaces in each of NRGH s eleven parking areas (Parking Areas A H). For the purpose of interpreting the results of the off-street parking survey, parking spaces at NRGH have been divided into three categories: 1. Mixed Public and Staff 2. Staff 3. Other This will help determine the overall availability of parking space on the hospital site for these different hospital users. It should be noted, that parking at NRGH is divided into numerous categories with specialized parking areas for physicians, contractors, renal, electric vehicles and palliative care among others. Table Off-street Parking Supply NRGH Owned Lots Mixed Public and Staff Staff Other Total Spaces A. Lower A.Upper A.Staff B B.Renal C D E Receiving F G H TOTALS
, which also provides an overview of day and time restriction, as well as any special requirements for each parking area.")
18 The parking areas listed above in Table 4.6 can be identified and located on Figure 4.2 (below), which also provides an overview of day and time restriction, as well as any special requirements for each parking area. Figure NRGH Off-street Parking Overview Map 16
19 Off-Street Parking Costs The vast majority of off-street parking at the NRGH is paid parking during weekdays with free parking available on weekends. The cost of parking on site for non-hospital staff is $2.25 for first 2 hours, and $1.25 for each additional hour; weekly permits are available for $ Hospital staff are offered discounted parking permits, which are applied through payroll deductions. Hospital staff also have the option of purchasing one day scratch tickets for $10.50 (5 per pack). Reserved parking is provided to hospital staff at an additional cost. Table 4.7 provides a breakdown of public and staff parking rates for comparison. Table Monthly Off-street Parking Subscriptions NRGH Parking Type Public Staff Parking Payment Option Parking Cost per Hour Cost per Day (8 hours) Cost per Week (5 days) NRGH Public $2.25 for first 2 hours, $9.75 $48.75 Parking Lots and $1.25 for each additional hour Weekly Permit $0.67 $5.35 $26.75 Hospital $0.83 $4.16 $0.104 Employee Union Other employees $0.153 $1.22 $6.12 Staff Reserved $0.239 $1.91 $9.56 One day scratch $2.10 $10.50 $0.26 tickets Transit Pass Propass $1.75 $8.75 Bicycle Bike Locker $0.216 $1.08 Currently approximately 2,054 hospital staff members pay of monthly parking passes. A breakdown of staff parking permits is outlined in Table 4.8 below. Table Monthly Parking Subscriptions NRGH Staff Staff Description Count Auxiliary 15 Carpool 1 Employee ANNUAL (NRGH) 2 Employee Payroll Deductions (NRGH) 1,294 Family Caregiver 141 Family Practice 26 Midwife LV2 (NRGH) 5 Pastoral Care 68 PHSA Payroll Deductions (NRGH) 9 Physician Call-back 40 Physician Level 1 (NRGH) 74 Physician Level 2 (NRGH) 49 Renal (NRGH) 34 Reserved Payroll Deductions (NRGH) 51 Volunteer 245 Grand Total 2,054 17
20 4.4.3 Off-Street Parking Occupancy NRGH The following section provides an overview of off-street parking occupancy at NRGH. This analysis has been broken into four parts morning (7 am 10 am), mid-day (11:00 am 2:00 pm), afternoon (3:00 pm 5:00 pm) and evening (6:00 pm 8:00 pm) Morning (7:00 am 10:00 am) During the morning period of the NRGH off-street parking survey, occupancy was shown to increase steadily in all lots and in all three categories. As shown in Table 4.9 (below) dedicated staff parking is the first to fill-up in the morning exceeding 85% by 8:00 am and reaching 97% occupancy by 9:00 am. The public parking areas did not fill-up as quickly, however, by 9:00 am they are only 76% full. A breakdown of occupancy by parking lot and location can be found in Appendix C, Figure C1. Table Parking Occupancy NRGH Parking Lots Morning (7:00 am 10:00 am) 7:00 AM 8AM 9:00 AM Morning Other Other Other Public Staff Public Staff Public Staff (Restricted) (Restricted) (Restricted) A.Lower A.Upper A.Staff B B.Renal C D E F G H TOTALS Total Occupancy 23% 79% 14% 48% 87% 32% 76% 97% 47% Mid-day (11:00 am 2:00 pm) NRGH parking facilities reached peak utilization during the mid-day period of the NRGH off-street parking survey. During this time occupancy for all unrestricted lots exceeded 85% with staff dedicated lots nearing 100% occupancy during this time. As shown in Table 4.10 (below) dedicated staff parking is 99% full by 11:00 am in the morning. Public parking areas are also very busy reaching 91% occupancy by 1:00 pm. 18
21 A breakdown of occupancy by parking lot and location can be found in Appendix C, Figure C2. Table Parking Occupancy NRGH Parking Lots Mid-day (11:00 am 2:00 pm) 11:00 AM Noon 1:00 PM Mid-day Other Other Other Public Staff Public Staff Public Staff (Restricted) (Restricted) (Restricted) A.Lower A.Upper A.Staff B B.Renal C D E F G H TOTALS Total Occupancy 88% 99% 50% 85% 98% 50% 91% 95% 48% Afternoon (3:00 pm 5:00 pm) By the afternoon period occupancy levels of NRGH parking facilities remain busy, but are starting to decrease. Dedicated staff parking areas continue to exceed 85% occupancy until 4:00 pm. As shown in Table 4.11 (below), dedicated staff parking drops from 90% occupancy at 3:00 pm to 74% occupancy by 4:00 pm in the afternoon. Public parking areas also remain busy until 4:00 pm when they drop to about 50% occupancy. A breakdown of occupancy by parking lot and location can be found in Appendix C, Figure C3. Table Parking Occupancy NRGH Parking Lots - Afternoon (3:00 pm 5:00 pm) Afternoon Public 3:00 PM Staff Other (Restricted) Public 4:00 PM Staff Other (Restricted) A.Lower A.Upper A.Staff B B.Renal C D E F G H TOTALS Total Occupancy 81% 90% 45% 50% 74% 37% 19
22 Evening (6:00 pm 8:00 pm) By the evening period occupancy levels of NRGH parking facilities are reduce substantially. Occupancy levels for both staff and public parking areas are less than 50%. As shown in Table 4.12 (below), there is ample parking in every lot by 6:00 pm. A breakdown of occupancy by parking lot and location can be found in Appendix C, Figure C4. Table Parking Occupancy NRGH Parking Lots - Evening (6:00 pm 8:00 pm) 6:00 PM 7:00 PM Evening Other Other Public Staff (Restricted) Public Staff (Restricted) A.Lower A.Upper A.Staff B B.Renal C D E F G H TOTALS Total Occupancy 26% 44% 22% 24% 50% 23% Bicycle Parking The NRGH currently has 130 bicycle parking spaces onsite at the hospital. Bicycle parking at the hospital includes: 12 individual paid bike lockers 35 Wall Hanging mounts in the indoor bike storage room 23 Wall Hanging mounts in the secure outdoor bike storage room 3 2 bicycle racks 5 4 bicycle racks 1 6 bicycle rack 4 7 bicycle racks 20
23 Summary Table 4.13 (below) provides an overall occupancy summary for each of the NRGH parking lots for each time of the survey. This provides an overview of where parking is available at which times. In general, some lots were observed as having lower occupancy rates due to the presence of more restricted parking spaces (i.e. Lot D). Lots A, B, C, E and H were shown to have the highest occupancy rates throughout the day with all of these lots exceeding 85% occupancy in the mid-day period. Table Parking Occupancy NRGH Parking Lots Summary by Lot Lot ID 7:00 AM 8:00 AM 9:00 AM 11:00 AM 12:00 PM A. Lower 21% 59% 95% 96% 91% 100% 95% 60% 27% 21% A.Upper 29% 50% 87% 97% 93% 96% 91% 53% 23% 19% A.Staff 100% 100% 100% 100% 100% 100% 94% 84% 63% 56% B 39% 52% 59% 90% 85% 94% 85% 62% 39% 61% C 40% 57% 75% 88% 84% 94% 76% 57% 28% 27% D 18% 27% 41% 39% 53% 65% 53% 29% 8% 10% E 74% 96% 100% 100% 100% 94% 85% 47% 34% 34% F 0% 18% 46% 79% 86% 75% 36% 32% 21% 18% G 11% 27% 44% 67% 69% 64% 51% 29% 27% 24% H 33% 60% 87% 93% 93% 93% 63% 73% 47% 47% Overall 32% 54% 79% 89% 87% 92% 82% 54% 28% 27% 1:00 PM 3:00 PM 4:00 PM 6:00 PM 7:00 PM 21
24 5.0 PUBLIC CONSULTATION Three rounds of community engagement sessions were held over the development of the Hospital Area Parking Strategy to gather comments from stakeholders and the public on the Hospital Area Plan and Parking Strategy. Each round of engagement sessions involved meetings with residents, hospital staff and other key stakeholders, as well as three open houses for the general public. A summary of meetings and consultation events is listed below: Community Engagement Sessions #1 Community Stakeholder Meeting #1 June 20 th, 2017 Health Profession Stakeholder Meeting #1 June 22 nd, 2017 Hospital Area Neighbourhood Association (HANA) Community Meeting July 31 st, 2017 Online Survey #1 June 22 nd to August 25 th, 2017 Community Engagement Sessions Round #2 Community Stakeholder Meeting #2 (HANA and BC Transit) December 5 th, 2017 Health Profession Stakeholder Meeting #2 (RDN and Island Health) - December 7 th, 2017 Open House #1 - December 7 th, 2017 Online Survey #2 - December, 2017 (closed December 30 th ) Community Engagement Sessions #3 Community Stakeholder Meeting #3 April 10, 2018 Health Profession Stakeholder Meeting #3 April 11, 2018 Open House #2 April 11, 2018 Appendix D provides a detailed summary of feedback and opportunities discussed in relation to parking issues in the Hospital Area. 22
25 6.0 PARKING MANAGEMENT STRATEGIES Public input and parking occupancy / turnover data was used to develop the following potential parking management strategies focused on balancing the short-term parking needs of visitors to the area and the long-term parking needs of residents and people traveling to the area for work. Moving forward, it is recommended that the City consider implementing new parking restrictions in two phases. This will allow the City to gradually introduce restrictions and evaluate the impact of these changes before extending parking restrictions further. This will help the City to determine the impact of new the restrictions, in particular how displaced parking customers adapt and whether or not this results in more long-term parking customers shifting over to residential streets with no parking restrictions. This will also help to determine whether or not parking restrictions are maximizing on-street parking amenities by increasing turn over and maintaining occupancy levels between 75-85%. Overall, the logic behind the proposed parking restrictions can be broken down into four broad actions: 1. Implement Transportation Demand Management strategies and policies to reduce or redistribute travel demand to the hospital area. Critical to supporting this initiative is providing people traveling to and from the hospital area with viable alternatives to single occupancy vehicle travel, notably increasing transit frequency an efficiency to the areas, promoting ride sharing and carpooling and improving active transportation facilities to encourage more walking and cycling. 2. Keeping areas of unrestricted parking in areas where residents are less likely to be impacted. This includes on arterial streets near the hospital, adjacent to vacant spaces (i.e. open space and parkland), and space adjacent to underutilized institutional lands. 3. Implementing pay parking and two hour parking zones on arterial roads around the hospital (i.e. Boundary Avenue and Dufferin Crescent), particularly on the side of the street abutting the hospital property. This has been done to encourage more turnover and create space for short-term parking customers needing to use the hospital for appointments and visits. 4. Introducing two-hour resident exempt parking restrictions in residential areas close to the hospital, focusing on areas with high concentrations of single-family homes, particularly those areas with smaller single-family lots (i.e. Moyse Crescent, St. David Crescent, etc.). This has been done to create more short-term parking for people visiting the hospital for less than two- hours and to reduce parking conflicts between long-term parking customers travelling to the area for work and residents requiring on-street parking. These four broad action have been translated into a series of specific parking management strategies broken into two phases of implementation. Recommended parking management strategies are outlined below and shown on Figures 6.1 and 6.2. Consider opportunities for developing an active transportation corridor on Dufferin. This would encourage more active transportation use in the area and as Dufferin connects through this section of the City and to the E & N Rail Trail. This will complement the current bike facilities on Boundary Avenue / Crescent and improve East-West cycling travel in the study area. This will likely be at the cost of some parking, but would potentially reduce vehicle travel and parking demand. 23
26 Work with BC Transit to increase transit frequency and connectivity with the hospital area, importantly this initiative should account for the shift timing of hospital staff to ensure transit services line-up with staff schedules. For on-street parking areas on hospital frontages near key entrances consider implementing metered parking. Metered parking will enable the City to ensure parking turn-over and availability through pricing, which could actually eliminate the time limits, if the price is right. o In Phase 1.0 consider adding pay parking along the east side of Boundary Avenue between Nelson and Dufferin Crescent, and along north side of Dufferin Crescent between Boundary Avenue to the eastern intersection of Dufferin Crescent and Seafield Crescent. o In Phase 2.0, evaluate the occupancy and turnover levels for these sections of road with pay parking. If occupancy (85% +) levels remain high and turnover (2 hours +) levels remain low then consider increasing prices. If low turnover rates in the area continue to persist consider extending the pay parking area to the south side of Dufferin Crescent between Boundary Avenue to the eastern intersection of Dufferin Crescent and Seafield Crescent. If pay parking is not being utilized consider lowering parking costs or implementing further restriction in the surround area or a combination of both. In areas where pay parking is not established consider adding 2-hour maximum daily parking restrictions on non-residential sections of Dufferin Crescent and Boundary Avenue close to the hospital to encourage greater turnover. This should aim to provide additional short-term parking options near NRGH and the Emergency Department. o In Phase 1.0, focus 2-hour maximum daily parking restrictions on the south side of Dufferin Crescent between Boundary Avenue and eastern intersection of Dufferin Crescent and Seafield Crescent, across from the pay parking zone. o Consider adding some 2-hour maximum daily parking restrictions for small portions of the north side of Townsite Road between Bowen Road and Graham Crescent as visitor parking for new multi-family developments on this street. o In Phase 2.0, depending on how the parking circumstances have evolved consider converting the 2-hour zone on Dufferin into pay parking and adding two hour parking zones to nonresidential parking sections on Dufferin Crescent and Boundary Avenue / Crescent close to the hospital area (i.e. leading up the intersection of Dufferin Crescent and Boundary Avenue / Crescent). Introduce 2-hour restrictions during the day on busier residential streets close to the hospital (i.e. Crestview, Nightingale and Nelson), with resident permit holders exempt from the time restriction. This should ensure sufficient parking available for residents while maintaining the on-street parking as a community amenity rather than something for the exclusive use of residents. o In Phase 1.0, apply these restrictions to residential streets that are in close proximity to the hospital and currently most impacted, including: portions of Crescent View Drive; Seafield Crescent, Nelson Street, Summerhill Place, Nightingale Crescent, Thunderbird Drive, St David Crescent, and Moyse Crescent. o In Phase 2.0, evaluate the current parking conditions on residential streets to determine whether or not the restrictions have been effective in managing parking in these areas. Importantly, this review should determine whether or not these restrictions have pushed long-term parking customers further into residential neighbourhoods. If areas with 2-hour resident exempt restrictions are shown to be underutilized (<75% occupancy) consider 24
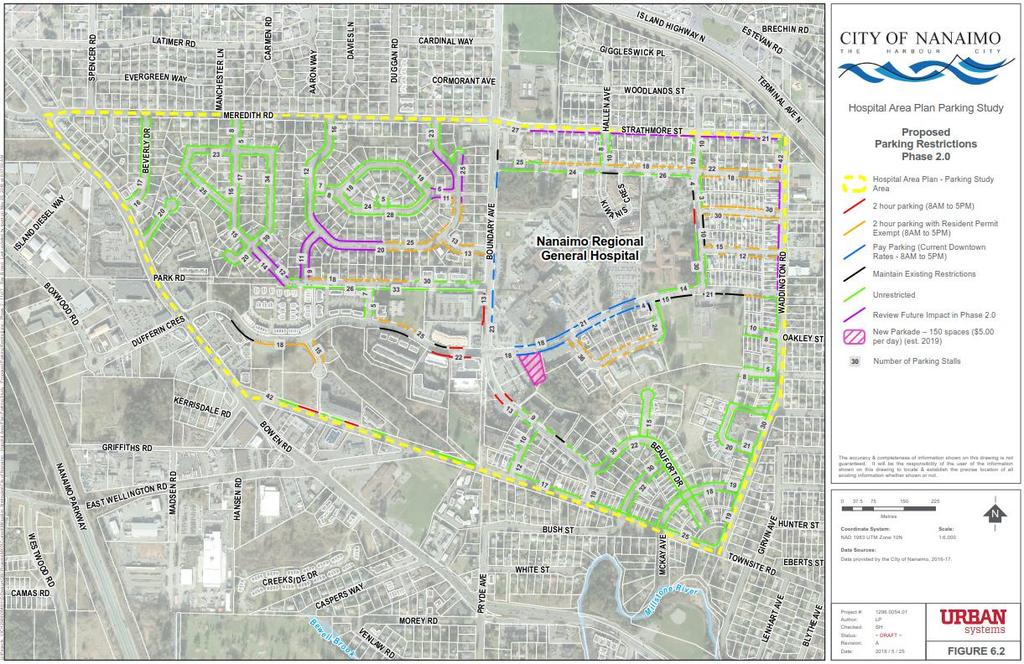
27 o increasing time limits or reducing the area covered by restrictions, especially if these restriction have be shown to be just shifting the problem further into the surrounding residential areas. If parking is shown to be optimized in the areas where these restrictions have been applied consider extending them into residential areas if parking in unrestricted residential areas is shown to be a problem. Key streets that should reviewed in the process of evaluating the need to implement further parking restrictions in residential areas surround the hospital include: Strathmore Street, Forest Drive, sections of Thunderbird Drive adjacent to areas where Phase 1.0 restriction have been implemented, and Waddington Road between Strathmore Street and Dufferin Crescent. Maintain existing unrestricted parking areas immediately around the hospital on non-residential streets and adjacent to vacant or open spaces. Residential areas further from NRGH should also be left as unrestricted in Phase 1.0. o In Phase 1.0, maintain unrestricted parking areas along the south side of Nelson Street between Boundary Avenue and Grant Avenue. Formalize unpaved parking areas on Grant Avenue between Dufferin Crescent and Strathmore Street to increase the efficient use of this spaces and leave this section as unrestricted. Leave Dufferin Crescent between Bowne Road and Boundary Avenue as unrestricted. Leave the west side of Boundary Avenue and both sides of Boundary Crescent as unrestricted. Leave the south side of Seafield Crescent as unrestricted. Coordinate parking management strategies with VIHA and explore options to increase parking supply on the NRGH site. Coordinate with VIHA to establish parking fees for NRGH that reflect the cost of on-street parking fees implemented by the City to encourage greater use of alternative modes of transportation. Encourage the hospital to provide free parking in evening hours, to encourage evening and late night staff to park on-site when the hospital parking lots are largely empty. Add additional enforcement patrols in daytime periods to ensure compliance. The option of introducing evening / overnight (4 pm 8 am) resident permit only parking for residential blocks closest to the hospital was also evaluated. Though this would ensure area residents with permits have access to parking in close proximity to their residences in the evening and overnight periods, it was not recommended for the following reasons: o In the evening occupancies are 70% or less, so there isn t a true shortage of on-street parking. o Some residents like resident only parking because they prefer to the parking in front of their house, however, other residents don t like it (especially when there is enough parking) since visitor permits would then be required to have guests to their homes. o Residents don t like paying for a resident permit and administering resident parking permits is can be a large administrative burden for the city and resource intensive. o Resident only Parking is ultimately for the benefit of the residents. o Evening resident parking would require evening bylaw enforcement staff to back it up. Figures 6.1 and 6.2 on the following page provide an overview of recommend parking restrictions in Phases 1.0 and

28 26
29 27
30 As previously discussed, there are approximately 1812 spaces in the hospital study area. The proposed parking management strategies will result in parking restrictions being applied to approximately 430 spaces (23.7%) in Phase 1 and at least 550 spaces (30.4%) in Phase 2 (possibly more depending on the results of the follow-up parking studies). Table 6.1 below provides a breakdown of the number of paid parking spaces, 2 hour spaces and 2 hour residential permit exempt spaces that will be created in each phase of this Parking Management Strategy. Table 6.1 Proposed Parking Restrictions by Number of Stalls (Phase 1 and 2) Phase Parking Restriction Type Number of Spaces Percent (%) of Total Inventory Pay Parking (8 am 5 pm) 62 spaces 3.4% Phase 1 Phase 2 2 Hour Parking (8 am 5 pm) 52 spaces 2.9% 2 Hour Parking Resident Permit Exempt (8 am 5 pm) 316 spaces 17.4% Total 430 spaces 23.7% Pay Parking (8 am 5 pm) 84 spaces 4.6% 2 Hour Parking (8 am 5 pm) 88 spaces 4.9% 2 Hour Parking Resident Permit Exempt (8 am 5 pm) 378 spaces 20.9% Total 550 spaces 30.4% 28
31 7.0 IMPLEMENTATION The following section provides some key considerations to support the implementation of this Parking Strategy and proposed parking restrictions outlined in Figures 6.1 and 6.2 (above). This following subsections make high-level recommendations for the phasing-in of new parking restrictions, coordinating actions with the Hospital Area Plan, pay-parking technology, notifying hospital staff of upcoming changes to on-street parking, and enhancing alternative modes of transportation (transit, walking, and cycling). 7.1 Phasing of Restrictions As discussed, in Section 6.0 (above) it is recommended that the City consider implementing new parking restrictions in two phases to allow the City to evaluate the impact of the proposed changes before extending parking restrictions further. As shown in Figures 6.1 and 6.2, an initial set of restriction will be implemented shortly after the adoption of this strategy followed by a second set of restrictions to be implemented at a later date and based on a future review of parking conditions at that time. Short-term In the short-term it is recommended that Phase 1.0 restriction shown in Figure 6.1 be implemented in 2018 after the adoption of this strategy. However, the City will be required to establish a resident permit parking system prior to implementing the resident permit exempt parking restrictions shown in Figure 6.1. The impacts of Phase restrictions should be reviewed after approximately 6-8 months to determine their level of effectiveness and impacts on parking conditions. This should include and review of the core hospital area and streets identified for further review in Figure 6.2, as well as public feedback on parking conditions in the area. Upon the completion of the 6 8 month review if it is determined that further action is required to manage parking in the Hospital Area (i.e. consistent 85% plus occupancy on residential streets and ongoing complaints) the City should look to implement the Phase 2.0 restrictions prescribed in Figure 6.2. Regardless of whether or not the City decides to proceed with the implementation of the Phase 2.0 restrictions it is recommended that a second post implementation review is carried out after a couple years to determine if those restriction implemented in Phase 1.0 are still working; and especially if public feedback continues to indicate a parking issue in the Hospital Area. Phase Interim Review (6 8 months) Phase (if required) Post Implementation Review (2 Years) Long-term In the long term (> 5 years) it is suggested that the parking strategy be revisited and reviewed to incorporate changes in land use and development in the Hospital Area. This should look to evaluate how the Hospital Area has evolved in coordination with the broader Hospital Area Plan; as well as new development on the NRGH site. As this area of the City is expected to continue to grow, evolve and densify, further parking restrictions may be required to manage the impacts of this anticipated growth. 7.2 Coordination with the Hospital Area Plan and Hospital Area Transportation Plan This is a standalone strategy, but should be coordinated with the Hospital Area Plan and Hospital Area Transportation Plan. As discussed, this area of the City is expected to continue to grow, evolve and densify in both the short-term and long-term. The population of the City of Nanaimo is 104,936 (2016 Census), an 29
32 increase of 7.1% since the 2011 Census (approximately 1.4% per annum). Nanaimo Regional General Hospital (NRGH) is the primary centre for health services in the Nanaimo region and beyond and is one of the City s largest employers. Surrounding the hospital campus is a mixed density residential neighbourhood and commercial development along the Bowen Road and Boundary Ave corridors. This strategy was developed alongside the broader Hospital Area Plan from 2017 to 2018, which identifies parking management as a key challenge for this area of Nanaimo. Further the Hospital Area plan provides strong direction for how growth in this area of the City should occur, and notably highlights several locations where significant densification could occur. Moving forward, the Hospital Area Plan should be referenced when making future decisions around the provision of parking and implementation of future parking restrictions. Reversely, the City s planning regime should also acknowledge this parking strategy and future parking studies in regards to the application of minimum parking requirement under the zoning bylaw and the provision of parking variances for new multi-family developments. In 2017, the City also developed a high level Transportation Plan for the Hospital Area. This plan outlined existing traffic conditions and provided a summary of pedestrian, cycling and transit facilities. This Hospital Area Transportation Plan also provided recommendations for how to improve transportation in this area Nanaimo, including the provision of more transit, cycling and walking infrastructure to encourage lower single occupancy vehicle use. The recommendations provided in the Hospital Area Transportation Plan should be considered in the implementation of the proposed parking restrictions in section 6.0 to ensure that as new parking restrictions are implemented they are coordinated with improvements to transit, pedestrian and cycling infrastructure. 7.3 Pay Parking There are many costs associated with parking: infrastructure, maintenance, equipment, enforcement, upgrades, customer service applications, replacement, land acquisition, management and more. In order to achieve a self-funded parking system in the Hospital Area several actions should be undertaken to ensure parking pays for itself in accordance with Guiding Principle #5. Some key suggestions include: A sustainable parking reserve fund should be maintained to allow for new investments in technology or infrastructure. Parking fees in pay parking zones must account for the cost of appropriate enforcement to ensure fairness for all users. Efficient revenue collection will help to support the transportation system, save for future needs and reduce tax impacts. Adjust public parking rates to maximize the utilization of pay parking in the Hospital Area using an 85% occupancy target. Ensure that the annual fee for on-street residential parking permits accounts for the administration costs to operate the program. Make parking rates more flexible so the City can respond to changing demand for parking and to keep up with changing operation costs. Increase enforcement and fine structure to be more assertive toward repeat or frequent offenders. Monies collected through fines should go into the aforementioned parking reserve fund. Another key consideration in the implementation of pay parking systems in the Hospital Area is the implementation of a convenient pay parking technology. Given the varied demands of parking customers in the hospital areas it is recommended that whatever pay parking technology that is implemented allows for a high degree of flexibility. Overall, it is recommended that the City consider multi-space meters and options for parking customers to pay by phone and online and add time remotely as needed. This will ideally eliminate the need for customers to return to their vehicle to add more time when required and reduce parking stress for people traveling to the hospital. There are a number of parking payment technologies that can be utilized to help streamline the payment process that are typically used in tandem with multi- 30
. Table 3.")


33 space meters, but are increasingly available on single space meters. Some examples of potential pay parking systems are shown in Table 3.1 (below). Table 3.1 Pay Parking Systems Technology Description Image Multi-Space Pay and Display Meters Multi-Space Pay by Space Meters Pay by Cell Phone Smart Cards In-Car Meters Pay and display meters allow drivers to purchase a certificate for paid parking time which can then be displayed on their dashboard to prove compliance. Since pay and display is typically done on a block or zone basis, this eliminates the need to paint individual stalls, which may increase the parking supply. This system could potentially be adapted to incorporate remote payment technologies (i.e. pay by cell phone see below), to replace pay and display, which can be less convenient than pay-by-space stations because the driver must return to the car to place the certificate in the vehicle and again when the time has expired. Pay by space meters allow drivers to pay for parking by entering their specific space number into the pay station when paying, rather than by providing a receipt for display on the dashboard. These stations allow customers to continue shopping or choose to stay for dinner without requiring drivers to return to their vehicle as time extensions can be paid remotely (i.e., another station, by cell phone, etc.). This technology is also available in a pay by license plate variant that is becoming increasingly common as it has inherent benefits for enforcement, as well as being user friendly. Paying for parking by cell phone is a strategy that allows customers to pay without cash while eliminating the need to install new credit-card capable revenue collection infrastructure on the street. The strategy allows people to receive text messages notifying them that their time is about to expire as well as extend legal parking time by paying remotely. Additionally, upon returning to their vehicle, a person may terminate the parking session and avoid paying for time that will not be used. Smart cards represent another alternative payment system for metered parking that eliminates the need to carry cash without using credit cards. Smart cards are stored-value cards that can be inserted in the meters to add time. Users insert the card when they first arrive at the meter and allow the meter to increase the time increment purchased in $0.25 steps; users remove the card when the amount of time displayed is adequate. Users are billed only for the time actually spent parking rounded to the nearest minute by swiping the card again when they leave the space. In-car meters are small devices which are loaded with pre-paid parking time. The user displays the meter in their car, often on the dashboard or hanging from the rear-view mirror, and activates the device when parked at a metered space. The digital display counts down the amount of paid parking time remaining, allowing a parking enforcement officer to see through the window that the car is legally paying for the parking time. Overall, the use of multi-space meters and any of the complementary payment options discussed above, increase the ease of payment from the user perspective which in turn increases the likelihood that users will pay for the time they spend using a given parking space rather than take their chances with the possibility of receiving a citation for non-payment. Further, from the enforcement perspective these 31
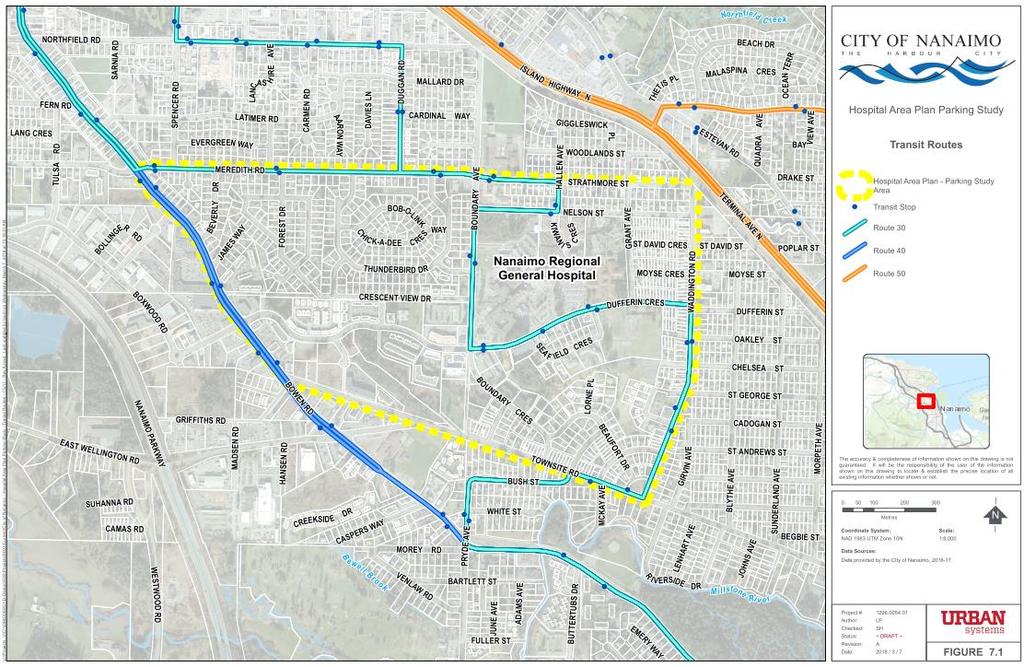
34 technologies are likely to increase monitoring efficiency by eliminating the need to physically check the meter at each individual parking space. Current on-street paid parking systems utilized by the City of Nanaimo in the downtown area have shown to be effective tools. Presently, one parking machine covers approximately 10 spaces in the downtown. If similar efficiencies were realized in the hospital area it is estimated that between 6 and 8 units would be required in Phase 1 and 8-10 units would be required in Phase 2. The approximate cost of each units is between $12,000 and $15,000. A breakdown of paid parking implementation costs are provided below in Section 7.8 Implementation Costs. 7.4 Notice to Hospital Staff Prior to the implementation of Phase 1.0 parking restrictions shown in Figure 6.1, it is recommended that hospital staff and residents are notified of the upcoming parking changes. This will allow parking customers to prepare for the upcoming changes to parking restrictions and possibly find alternative to on-street parking. Residents living near resident permit exempt parking areas should be notified of new par parking restrictions by mail at least one month in advance to allow them time to register permits for their vehicles. Hospital staff and other residents travelling to the area for work should also be given at least two weeks of notice prior to the implementation of Phase 1.0 parking restrictions. Notifications and information regarding the proposed parking restrictions should be provided to all businesses and employers in the study area, and should include the day and time the proposed restrictions will come into effect; it may also be helpful to include a map in this information package showing the location of proposed restrictions. In addition to notices sent directly to residents and employers notification signs should also be posted in the study area on streets for two weeks where parking restrictions are due to be imposed. These notification signs could be posted on newly installed sign poles that will eventually host the parking restriction signage. 7.5 Parking Signage Signage will be another key consideration for the implementation of the proposed parking restrictions. Signage will be required throughout the study area to notify the public of what restrictions apply and where. Based on sightlines and the spacing of parking restrictions it is estimated that between 65 and 75 signs will be required to implement Phase 1 with an additional signs required to implement Phase 2. The estimated cost of each sign is approximately $250, a proposed budget for signage is outlined below in Section 7.8 Implementation Costs. 7.6 Transit In general, focusing on parking restrictions alone will not achieve a balanced transportation system. It is critical to consider the role of other modes of transportation in reducing single occupancy vehicle travel and parking demand. The Hospital Area Transportation Plan completed in 2017 suggests increasing transit services to the Hospital Area will play an important role in reducing the demand for parking, both on and off street, as well as supporting future growth and development in this area of Nanaimo. There are currently two bus routes that operate within the study area (see Figure 7.1 below): Route 30 -NRGH local route, Route 40 -VIU Express, and Route 50 - Downtown /Woodgrove. Route 30 is a local route which uses a variety of local roads to travel between Woodgrove Centre and Prideaux Bus Exchange downtown via Nanaimo Regional General Hospital. It generally operates every 30 to 60 minutes. There are 3 to 4 stops along the hospital frontages on Dufferin Crescent and Boundary Avenue in each direction. Route 40 is a much more direct route also travelling between Woodgrove Centre 32
35 and Prideaux Bus Exchange. It is a frequent route with generally 15 to 30-minute service. It travels along the edge of the study area on Bowen Road. Currently, there is significant demand for enhanced transit services in this area of the City and BC Transit needs to play a role in this process. Public feedback through this process has suggested that there is currently lack of transit services in this area. As part of the online survey less than 20 percent of respondents indicated that transit met their transportation needs which suggests there are significant opportunities to make improvements and make transit a more appealing transportation option. The Hospital Area Transportation Plan provides several key recommendation for improving transit in the Hospital Area, including: Bus Schedule and Routing - Explore opportunities to provide more frequent and direct transit service to the Hospital and examine potential changes to the transit schedule that would better serve hospital staff. In particular, the frequency for Bus 30 should be increased to 15 minute intervals for peak hours (i.e. 7 am 9 am, 12 pm 1 pm, and 3 pm 5 pm). The schedule for Bus 30 should also be adjusted so this bus starts earlier from downtown at 6 am (currently starts at 7 am) as this will better align with hospital shift start times. Bus 50 on Island Highway is scheduled to become rapid bus route. The existing bus stop close to Oakley Street should be relocated closer to Nelson Street so it is closer to walk to NRGH. Bus Stops - Provide clean, safe and lit bus shelters with consideration to Crime Prevention Through Environmental Design (CPTED) principles at key stops such as those adjacent to the hospital. Add bus shelters to the Bus 30 stops both northbound and southbound at Boundary and Nightingale Crescent. On-Site Bus Stop at Hospital In the long-term examine the feasibility of locating a bus stop on the hospital site to encourage staff/patients to take transit for trips to/ from hospital. This would likely have to be undertaken during a renewal or redevelopment of the hospital drop-off loop off Dufferin Crescent as the current configuration has limited additional space to add a transit stop. Moving forward, the convenience to transit passengers boarding or alighting at the hospital should be weighed against the increased travel time for passengers who do not board or alight at the hospital. 33
36 34
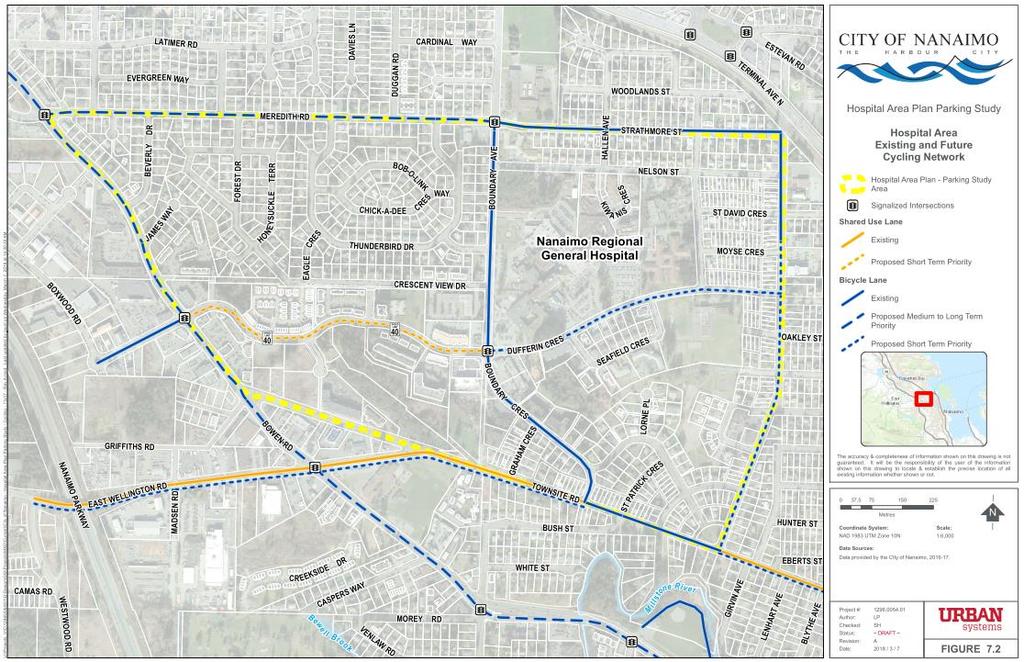
37 7.7 Cycling and Walking Improving cycling and walking infrastructure will also be an important step in managing parking demand in the Hospital Area, however, providing infrastructure is always a balance between modes in a constrained space. The Hospital Area Transportation Plan highlights a number of transportation and utility upgrades within the study area completed in The transportation upgrades consisted of pedestrian facility improvements and the addition of dedicated cycling facilities on Bush Street, Pryde Avenue, Townsite Road, Boundary Crescent and Boundary Avenue. Currently, most streets have a sidewalk on at least one side and marked crosswalks at intersections The City of Nanaimo Transportation Master Plan identifies a more extensive cycling network for the future with a combination of on-street bike lanes and shared use lanes. The City has expedited the plan to upgrade pedestrian facilities and add a sidewalk along Dufferin Crescent west of the intersection of Boundary Road and Dufferin Crescent to Bowen Road. Figure 7.2 (below), shows the existing and future cycling network planned for the study area based on the City of Nanaimo s Transportation Master Plan, as well as plans to add a bike lane on Dufferin Crescent east of the intersection of Boundary Avenue and Dufferin Crescent. The City will also be reducing speeds to 40 km /h and adding a bike sharrow to Dufferin Crescent to the west of the intersection of Boundary Avenue and Dufferin Crescent. These projects could substantially increase cycling access to Hospital Area and encourage greater uptake of cycling for people working in the area. Moving forward, despite recent improvements within the study area such as the bike lane on Boundary Avenue, feedback from public during engagement session has shown that there is still a lack of pedestrian and cycling infrastructure in the Hospital. Participants noted that the lack of curbs and sidewalks exacerbates on-street vehicle parking problems near driveways and intersections. Participants also stated that pedestrians have safety concerns because of congested streets, busy roads, and lack of pedestrian infrastructure in the Hospital Area. Therefore, the Hospital Area Transportation Plan has noted the following as suggestions to address safety issues with active transportation: Provide secure and convenient bicycle storage, showers, etc. in new hospital area developments to incentivize cycling and cycle-commuting in the Hospital Area. Evaluate the function of the Boundary Avenue cycling lane and in the long-term modify the design to make the cross section more uniform and enhance the perception of safety by making the route more consistent. Evaluate the existing infrastructure in the Hospital Area and develop and implement a plan to replace infrastructure as curbs and sidewalks are currently not constructed to accommodate walkers / disabled people. A plan should be developed to implement sidewalks and cycling facilities on neighborhood collectors streets and higher. Improve pedestrian safety at the intersection of Dufferin Crescent and Boundary Road. Two options were suggested: o Traffic lights should be programmed with longer walk-times, or o Traffic lights should be programmed with all-way vehicle stop to allow more pedestrian movements. Install lighted crosswalks to encourage pedestrian movements in the Hospital Area, especially along Dufferin Crescent 35
38 36
39 7.8 Implementation Costs The following section provides some high-level estimates for implementation costs for Phases 1 and 2. These costs are broken into three categories signage, pay parking and enforcement as outlined below Signage The cost of signage is based on the number of signs required in each phase. It estimated that between 65 and 75 sign will be required in phase 1. At an average cost of approximately $250 per sign between $16,250 and $18,750 will be required to implement phase 1 signage. It is estimated that and additional signs will be required to implement phase 2 at an additional cost of $5,000 - $6,250. The total estimate cost for signage for both phases is between $21,250 and $25, Pay Parking As discussed above, one parking machine covers approximately 10 spaces in the downtown. Therefore, it is estimated that between 6 and 8 units would be required in Phase 1 and 8-10 units would be required in Phase 2. Given the estimated cost of between $12,000 and $15,000 per unit (plus $1,500 for initial set-up costs) the implementation cost for pay parking will range between $73,500 and $121,500 in phase 1 with an additional two units required for phase 2 ($24,000 - $30,000). The total cost for pay parking infrastructure is between $97,500 and $151,500 for both phases. Further, it is anticipated that the costs of maintenance and collection for the machines will be about $1200 per year for each machine. This has been incorporated into the overall costs of implementing pay parking Enforcement The costs of enforcement is a little more challenging to estimate due to the effects of the proposed parking restriction not being fully known at this time. However, based on existing information and previous feedback from City of Nanaimo Bylaw staff it is estimated that it will take approximately of additional man hours per year (0.5 to 0.66 full -time employee) to enforce the proposed parking restrictions. This equates to a cost of approximately $40,000 - $53,000 annually based on an annual full-time employee cost of $80,000 for salary and benefits. The cost of enforcement also includes $35,000 to cover vehicle costs associated with enforcement around the hospital. This is based on estimates provided by the City s Bylaw Enforcement team. Parking Revenue and Payback The total parking revenue from phase 1 paid parking is estimated a $126,945 a year with 62 spaces operating at 70% occupancy for a cost of $1.25 per hour. In phase 2 this increases by 35% to $171,990 with 84 spaces. This assumes 70% occupancy for weekdays 8 am to 5 pm. Further, as there will be increased bylaw enforcement in this area it is anticipated that additional revenue will be collected through fines. This is estimated at $8,250 annually in phase 1 and $11,000 annually in phase 2 for pay parking areas, as well as $1,500 annually in the 2 hour and 2 hours resident only parking areas. The implementation costs for signage and pay parking infrastructure are between $118,750 and $176,500; the estimated increase in enforcement costs is $40,000 - $53,000 annually plus $35,000 in vehicle costs. Again, there is estimate annual maintenance and collection cost of $1,200 per machine. The total costs for implementing the Parking Strategy over the next four years is outlined in Table 7.2 below. These costs include signage, parking technology, maintenance and collection and enforcement, as well as costs for completing two follow-up parking occupancy / turn-over studies. 37
40 Table 7.2 Estimated Implementation Costs Phase Year Expense Estimated Cost Range ($) Phase Signage $16,250 - $18,750 Pay Parking Metres $73,500 - $121,500 Enforcement Vehicle $35,000 Interim Review 2020 Parking Study $20,000 -$30,000 Phase Signage $5,000 - $6,250 Pay Parking Metres $24,000 - $30,000 Post Implementation 2022 Parking Study Review $20,000 -$30,000 Enforcement Costs Enforcement Costs (4 $160,000 - $212,000 Total Implementation Costs years) $353,750 - $483,500 Given the proposed timelines for the implementation of this Parking Management Strategy this section outlines a high-level cash flow analysis for each phase over a five year period (see Table 7.3 below). Note this assumes parking cost remain the same at a $1.25 per hour. Table 7.3 Hospital Parking Estimated Cash Flow ( ) Year Costs Low Costs High Revenue Gain / Loss ($) Gain / Loss ($) (+/-) End ($) End ($) ($) (+/-) (Low End) (High End) Year 1 $171,950 $237,850 $136,695 -$35,255 -$101,155 Year 2 $67,200 $92,600 $136,695 $34,240 -$57,060 Year 3 $78,600 $101,250 $184,490 $140,130 $26,180 Year 4 $69,600 $95,000 $184,490 $255,020 $115,670 Year 5 $49,600 $65,000 $184,490 $389,910 $235,160 The cash flow analysis outlined in Table 7.3 shows that the estimated parking revenue will cover the cost of implementing the Hospital Area Parking Strategy and that after 5 years the City could be turning a profit of $119,490 to $134,890 a year - assuming no change in parking and enforcement costs. Moving forward, it is recommended that any surplus revenues resulting from the implementation of pay parking in the Hospital Area be allocated to a fund to improve other components of the transportation system in the area (i.e. cycling facilities, sidewalks and transit shelters). 38
41 8.0 SUMMARY The results of this analysis showed high parking occupancy levels for on-street parking areas immediately adjacent to the hospital during morning and afternoon time periods; streets not immediately adjacent to the hospital were generally shown to have ample parking. Off-street parking operated by the NRGH was also shown to have very high occupancy levels during late morning and early afternoon periods. This peak period (late morning and early afternoon) of parking demand where parking on both the hospital site and streets adjacent to the hospital frequently exceeds 85% occupancy begins to subside around 3:00 pm. The turnover analysis releveled that parking duration varied, with a significant number of people parking for the entire day and a large contingent parking for two hours or less. This pattern of parking demand generally supports informal observations offered by residents and hospital staff, which suggests a large portion of on-street parking is occupied by hospital staff during the day, as well as hospital visitors attending clinics or visiting patients. Parking management strategies presented in Section 6.0 (shown on Figure 6.1 and 6.2) highlight a range of solutions with a specific focus on managing periods of peak demand and implementing restrictions to encourage more turnover during the day and to encourage hospital staff to park in NRGH facilities after 3:00 pm when the hospital parking lots start to clear out. The parking management strategies presented in Section 6.0 are supported by the implementation plan outlined in Section 7.0 of this document. This suggests that prior to implementing the proposed parking management strategies shown on Figure 6.1 and 6.2 that consideration be given to improving transit, pedestrian and cycling facilities in the Hospital Area. Notably, increasing transit service and a frequency will be key to realizing parking management in this area. Further, the implementation outlines some key consideration for implementing new parking restrictions, such as notifying employer and residents of the changes, determining pay parking system option and creating and plan for the phasing and monitoring of parking management strategies in the area. Importantly, the high-level cost estimates for implementing this parking management strategy were shown to be between $193,750 and $271,500 for signage, parking meters, an enforcement vehicle, follow-up studies etc., plus between $40,000 and $53,000 more per year for enforcement. Given the projected revenue of $136,695 in phase 1 and $184,490 in phase 2 the costs of implementing the parking management strategy could be recovered within the first three years. 39
42 APPENDIX A Parking Supply and Demand Occupancy Summary maps
43 Off-Street Parking Survey Summary Maps This page is intentionally left blank.
44 HALLEN AVE 1 / 10 6 / 42 Existing Occupancy 0% - 50% 51% - 70% 6 / 15 4 / 12 71% - 85% 86% - 100% 18 / 18 / 23 3/ / 15 1/8 / / 3 / /8 BO AR Y 1/5 1 /1 9 3/ 32 2/1 7 ls MCKAY AVE PER CAS WHITE ST ve r E AY SW Ri CREE K S I D DR PRYDE AVE BUSH ST t o ne 0 5/ N Metres Coordinate System: NAD 1983 UTM Zone 10N 1 / 18 Data Sources: 180 Scale: 1:5,000 Data provided by the CIty of Nanaimo, E D The accuracy & completeness of information shown on this drawing is not guaranteed. It will be the responsibility of the user of the information shown on this drawing to locate & establish the precise location of all existing information whether shown or not. IN A V /3 0 1/ 10 2/ 2 DR TOW NSIT ER 0 /3 T OR NGTON R D 1 F AU BE LI EAS T W EL / / 2 5 / 22 5/3 0 EN 9 M il W 12 ES GIR V BO RD CR 2/ /1 9 CZ /4 4 E RD 5 / 15 U ND 2 / / / 18 Construction Zone Daytime Occupancy 5 / / 22 GRIFFITHS RD MADSEN RD S CRE BOUNDARY AVE 7/7 8 / 13 4/ / 1 8 SDAL 2/8 2 / / / 25 KERR I 4 / 30 WADDINGTON RD 9 Nanaimo Regional General Hospital 5 / / ES /1 E 24 / / 13 S ANI Legend 9 / 10 2 /1 14 / FF 3 / 20 0/ 1 4 /1 0 / /2 9/1 3 W 18 / 23 2 / 34 0 / / / 30 6 / 25 5 /1 DU 1 / 10 3 / 23 2 / 16 0/5 0 / 16 4 / 23 7 / 28 4 /2 0/6 On-street Parking Occupancy Thursday June 8th 7 am - 10 am 7 / 22 5 / 18 KI 2 0/5 8 / / 26 3/3 0/8 17 / 26 CR 17 / 24 Hospital Area Plan Parking Study 4 / 21 4/4 8 /1 0/7 0 RI N 11 / 25 0 /2 0 4 / 18 STRATHMORE ST 2 / 10 DUGGAN RD DAVIES LN 1/8 2 / 17 3 / 16 2 /1 2 U:\Projects_VIC\1296\0054\01\D-Design\GIS\Projects\MXD\Current\Parking - June 8th\City of Nanaimo - Hospital Area Plan Parking Study - On-street Occupancy June 8-7AM - 10AM - 11x17 - Rev B.mxd Last updated by lpunt on May 25, 2018 at 9:42:32 AM 3 N 4 / 39 1 / 27 E AV MEREDITH RD 5 / 25 WOODLAND S S T L NA MANCHESTER LN TE R CORMORANT AVE MI EVERGREEN WA Y GIGGLESWICK PL Project #: Author: LP Revision: Date: A 2018 / 5 / 25 Checked: Status: MB ~ DRAFT ~ FIGURE A1
45 This page is intentionally left blank.
46 HALLEN AVE / 2 / / Nanaimo Regional General Hospital VIEW DR 4 14 / 1 0 / 15 1 / / 25 1/ 30 D 1 / /3 Construction Zone Daytime Occupancy 3 / 30 ST GEORGE ST The accuracy & completeness of information shown on this drawing is not guaranteed. It will be the responsibility of the user of the information shown on this drawing to locate & establish the precise location of all existing information whether shown or not. 22 C AD OGAN ST / 3 / 18 ST ANDREWS ST Coordinate System: NAD 1983 UTM Zone 10N Data Sources: 180 N Metres DR TOW NSIT ER 5/ /1 9 86% - 100% CHELSEA ST 15 T OR N RD 5 71% - 85% OAKLEY ST F AU BE Scale: 1:5,000 Data provided by the CIty of Nanaimo, / E IN A V ERTS ST EB GIR V MCKAY AVE ls M il PER CAS WHITE ST ve r E AY SW Ri CREE K S I D DR t o ne 30 6/2 5 BUSH ST PRYDE AVE HANSEN RD ES G RA 1 HAM/ 1 0 3/ C 12 R EN MADSEN RD CR ES W RD TO EAS T W ELL IN G AR Y 0% - 50% DUFFERIN ST 2/1 9 2 BO GRIFFITHS RD / 21 4/ / 21 CZ /4 4 / 12 ES DUFFERI N CR 10 LORNE PL E RD 7 / 15 0 / 10 0/8 5/ /9 ND Existing Occupancy ST DAVID ST 51% - 70% 1/5 1/8 9 U3 1 B1O0 / SDAL 2 / 30 / / / / / 25 KERR I 4 / 30 6 / 42 S CRE BOUNDARY AVE S ANI Legend WADDINGTON RD 6 / 7 CRES DUFFERIN 4/5 0 / 11 0/9 2 R /1 D 1 T4 E1S/ 1 24 / 30 CRES CENT 32 / 33 9 / / / 10 R FO 10 / / 26 9 / / / 13 5 /1 PARK RD 5 / 25 3 / 20 NELSON ST GRANT AVE30 / 30 3 PL W 23 / 23 0 / 11 On-street Parking Occupancy Thursday June 8th 11 am - 2 pm 3 / 10 1 / 10 3 / 25 1 / 16 3 / 34 4 / 39 2 / 12 4 / 25 1 / 16 0/6 0/5 1 / / / 26 KI 0 / 17 0/7 18 / / 24 3/3 4/ / /2 23 1/ 5 / 18 Hospital Area Plan Parking Study 4 / 21 3/8 2 / 10 1/8 0/5 3 / 17 BEVERLY DR 4 / 16 6/ U:\Projects_VIC\1296\0054\01\D-Design\GIS\Projects\MXD\Current\Parking - June 8th\City of Nanaimo - Hospital Area Plan Parking Study - On-street Occupancy June 8-11AM - 2PM - 11x17 - Rev B.mxd Last updated by lpunt on May 25, 2018 at 9:54:12 AM N STRATHMORE ST 4 / 27 5 / 28 N 0 / PE Y TO 20 WOODLAND S S T E AV DUGGAN RD DAVIES LN CORMORANT AVE D L NA MANCHESTER LN TE R MEREDITH RD 0/8 ES TE VA NR GIGGLESWICK PL MI EVERGREEN WA Y AARON WAY LATIMER RD Project #: Author: LP Revision: Date: A 2018 / 5 / 25 Checked: Status: MB ~ DRAFT ~ FIGURE A2
47 This page is intentionally left blank.
48 HALLEN AVE / 2 / / Nanaimo Regional General Hospital VIEW DR 4 14 / 1 0 / 15 1 / / 25 3/ 30 D 4 / /3 Construction Zone Daytime Occupancy 7 / 30 ST GEORGE ST The accuracy & completeness of information shown on this drawing is not guaranteed. It will be the responsibility of the user of the information shown on this drawing to locate & establish the precise location of all existing information whether shown or not. 22 C AD OGAN ST / 2 / 18 ST ANDREWS ST Coordinate System: NAD 1983 UTM Zone 10N Data Sources: 180 N Metres DR TOW NSIT ER 5/ /1 9 86% - 100% CHELSEA ST 15 T OR N RD 5 71% - 85% OAKLEY ST F AU BE Scale: 1:5,000 Data provided by the CIty of Nanaimo, / E IN A V ERTS ST EB GIR V MCKAY AVE ls M il PER CAS WHITE ST ve r E AY SW Ri CREE K S I D DR t o ne 30 5/2 5 BUSH ST PRYDE AVE HANSEN RD ES G RA 2 HAM/ 1 0 1/ C 12 R EN MADSEN RD CR ES W RD TO EAS T W ELL IN G AR Y 0% - 50% DUFFERIN ST 2/1 9 2 BO GRIFFITHS RD / 21 3/ / 21 CZ /4 2 / 12 DUFFERI N CR9 ES LORNE PL E RD 5 / 15 0 / 10 0/8 3/ /9 ND Existing Occupancy ST DAVID ST 51% - 70% 0/5 0/8 4 U3 B4O/ 1 SDAL 1 / 30 / / / / / 25 KERR I 5 / 30 9 / 42 S CRE BOUNDARY AVE S ANI Legend WADDINGTON RD 2 / 7 CRES DUFFERIN 3/5 0 / 11 0/9 2 R /1 D 3 T4 E0S/ 1 11 / 30 CRES CENT 18 / / 22 8 / 18 6 / 10 R FO 2 / / 26 9 / 13 4 / 13 7 / 13 5 /1 PARK RD 3 / 25 4 / 20 NELSON ST GRANT AVE21 / 30 1 PL W 15 / 23 0 / 11 On-street Parking Occupancy Thursday June 8th 3 pm - 5 pm 4 / 10 5 / 10 3 / 25 3 / 16 3 / 34 5 / 39 3 / 12 8 / 25 1 / 16 0/6 0/5 3 / / / 26 KI 1 / 17 0/7 16 / / 24 4/3 4/ / /2 23 0/ 4 / 18 Hospital Area Plan Parking Study 3 / 21 4/8 1 / 10 2/8 0/5 5 / 17 BEVERLY DR 6 / 16 4/ U:\Projects_VIC\1296\0054\01\D-Design\GIS\Projects\MXD\Current\Parking - June 8th\City of Nanaimo - Hospital Area Plan Parking Study - On-street Occupancy June 8-3PM - 5PM - 11x17 - Rev B.mxd Last updated by lpunt on May 25, 2018 at 9:56:12 AM N STRATHMORE ST 4 / 27 5 / 28 N 0 / PE Y TO 20 WOODLAND S S T E AV DUGGAN RD DAVIES LN CORMORANT AVE D L NA MANCHESTER LN TE R MEREDITH RD 0/8 ES TE VA NR GIGGLESWICK PL MI EVERGREEN WA Y AARON WAY LATIMER RD Project #: Author: LP Revision: Date: A 2018 / 5 / 25 Checked: Status: MB ~ DRAFT ~ FIGURE A3
49 This page is intentionally left blank.
50 HALLEN AVE 2 8/2 2 8 /1 8/ Nanaimo Regional General Hospital VIEW DR 4 / 14 0 / / 30 The accuracy & completeness of information shown on this drawing is not guaranteed. It will be the responsibility of the user of the information shown on this drawing to locate & establish the precise location of all existing information whether shown or not. C AD OGAN ST 1 2 / / 0 / 18 ST ANDREWS ST Coordinate System: NAD 1983 UTM Zone 10N Data Sources: 180 N Metres 2/1 9 2/ 30 D 1 / 17 Construction Zone Daytime Occupancy ST GEORGE ST 22 DR TOW NSIT ER 3/ /1 9 71% - 85% CHELSEA ST 15 T OR N RD 8 0% - 50% OAKLEY ST F AU BE Scale: 1:5,000 Data provided by the CIty of Nanaimo, / E IN A V ERTS ST EB GIR V MCKAY AVE ls M il PER CAS WHITE ST ve r E AY SW Ri CREE K S I D DR t o ne 30 6/2 5 BUSH ST PRYDE AVE HANSEN RD ES G RA 1 HAM/ 1 0 1/ C 12 R EN MADSEN RD CR ES W RD TO EAS T W ELL IN G AR Y Existing Occupancy DUFFERIN ST 1/ / 21 2 BO GRIFFITHS RD / 21 LORNE PL CZ /4 DUFFERI N CR4 ES 1 / 10 1/8 2/ /9 E RD 4 / 12 1/5 1/8 ND ST DAVID ST 51% - 70% 5 / / 36 / / / 18 4 U3 B4O/ 1 SDAL 2 / 30 / / 4 / 25 KERR I 10 / 30 8 / 42 S CRE BOUNDARY AVE S ANI Legend WADDINGTON RD 4 / 7 CRES DUFFERIN 4/5 0 / 11 0/9 2 R /1 D 4 T4 E0S/ 1 11 / 30 CRES CENT 11 / 33 4 / 22 4 / 18 5 / 10 R FO 0 / 26 0 / 18 3 / 13 9 / 13 7 / 13 5 /1 PARK RD 1 / 25 5 / 20 NELSON ST GRANT AVE10 / 30 2 PL W 16 / 23 0 / 11 On-street Parking Occupancy Thursday June 8th 6 pm - 8 pm 0 / 10 0 / 10 4 / 25 2 / 16 3 / 34 5 / 39 3 / 12 7 / 25 2 / 16 0/6 0/5 1 / 24 6 / / 26 KI 0 / 17 0/7 6 / 25 7 / 24 0/3 0/ / /2 23 2/ 7 / 18 Hospital Area Plan Parking Study 5 / 21 2/8 2 / 10 3/8 0/5 3 / 17 BEVERLY DR 7 / 16 4/ U:\Projects_VIC\1296\0054\01\D-Design\GIS\Projects\MXD\Current\Parking - June 8th\City of Nanaimo - Hospital Area Plan Parking Study - On-street Occupancy June 8-6PM - 8PM - 11x17 - Rev B.mxd Last updated by lpunt on May 25, 2018 at 9:57:27 AM N STRATHMORE ST 6 / 27 6 / 28 N 0 / PE Y TO 20 WOODLAND S S T E AV DUGGAN RD DAVIES LN CORMORANT AVE D L NA MANCHESTER LN TE R MEREDITH RD 0/8 ES TE VA NR GIGGLESWICK PL MI EVERGREEN WA Y AARON WAY LATIMER RD Project #: Author: LP Revision: Date: A 2018 / 5 / 25 Checked: Status: MB ~ DRAFT ~ FIGURE A4
51 This page is intentionally left blank.
52 APPENDIX B On-Street Turnover Summary Maps
53 Off-Street Parking Survey Summary Maps This page is intentionally left blank.
54 EVERGREEN WAY MANCHESTER LN LATIMER RD DAVIES LN DUGGAN RD CORMORANT AVE GIGGLESWICK PL WOODLANDS ST ESTEVAN RD TERMINAL AVE N MEREDITH RD STRATHMORE ST Hospital Area Plan Parking Study U:\Projects_VIC\1296\0054\01\D-Design\GIS\Projects\MXD\Current\Turnover - Sept \City of Nanaimo - Hospital Area Plan Parking Study - Turnover Sept MORNING - 11x17 - Rev B.mxd Last updated by lpunt on October 23, 2017 at 11:22:23 AM BEVERLY DR JAMES WAY GRIFFITHS RD MADSEN RD BLUEBELL TERR KERRISDALE RD FOREST DR HONEYSUCKLE TERR BOWEN RD EAST WELLINGTON RD CREEKSIDE DR EAGLE CRES BOB-O-LINK WAY CHICK-A-DEE THUNDERBIRD DR CRESCENT VIEW DR CASPERS WAY CRES PRYDE AVE BOUNDARY AVE BOUNDARY CRES GRAHAM CRES Nanaimo Regional General Hospital TOWNSITE RD WHITE ST BUSH ST DUFFERIN CRES M i l lstone Ri ver NIS CRES KI W A NELSON ST SEAFIELD CRES LORNE PL ST PATRICK CRES MCKAY AVE BEAUFORT DR MCDONALD GRANT AVE CRES ST DAVID CRES MOYSE CRES ST GEORGE CRES GIRVIN AVE WADDINGTON RD EBERTS ST Legend Project #: Author: LP Checked: Status: Revision: Date: On-street Parking Turnover September 21, AM - 12 PM Average Length of Vehicle Stay (hours) Coordinate System: 2 Hours or Less 2 to 2.5 Hours 2.5 to 3 Hours NAD 1983 UTM Zone 10N Data Sources: Greater than 3 Hours The accuracy & completeness of information shown on this drawing is not guaranteed. It will be the responsibility of the user of the information shown on this drawing to locate & establish the precise location of all existing information whether shown or not Metres Data provided by the CIty of Nanaimo, SH ~ DRAFT ~ A 2017 / 10 / 23 Scale: 1:5,000 N FIGURE B1 2
55 This page is intentionally left blank.
56 EVERGREEN WAY MANCHESTER LN LATIMER RD DAVIES LN DUGGAN RD CORMORANT AVE GIGGLESWICK PL WOODLANDS ST ESTEVAN RD TERMINAL AVE N MEREDITH RD STRATHMORE ST Hospital Area Plan Parking Study U:\Projects_VIC\1296\0054\01\D-Design\GIS\Projects\MXD\Current\Turnover - Sept \City of Nanaimo - Hospital Area Plan Parking Study - Turnover Sept AFTERNOON - 11x17 - Rev B.mxd Last updated by lpunt on October 23, 2017 at 11:26:23 AM BEVERLY DR JAMES WAY GRIFFITHS RD MADSEN RD BLUEBELL TERR KERRISDALE RD FOREST DR HONEYSUCKLE TERR BOWEN RD EAST WELLINGTON RD CREEKSIDE DR EAGLE CRES BOB-O-LINK WAY CHICK-A-DEE THUNDERBIRD DR CRESCENT VIEW DR CASPERS WAY CRES PRYDE AVE BOUNDARY AVE BOUNDARY CRES GRAHAM CRES Nanaimo Regional General Hospital TOWNSITE RD WHITE ST BUSH ST DUFFERIN CRES M i l lstone Ri ver NIS CRES KI W A NELSON ST SEAFIELD CRES LORNE PL ST PATRICK CRES MCKAY AVE BEAUFORT DR MCDONALD GRANT AVE CRES ST DAVID CRES MOYSE CRES ST GEORGE CRES GIRVIN AVE WADDINGTON RD EBERTS ST Legend Project #: Author: LP Checked: Status: Revision: Date: On-street Parking Turnover September 21, :30 PM to 3:30 PM Average Length of Vehicle Stay (hours) Coordinate System: 2 Hours or Less 2 to 2.5 Hours 2.5 to 3 Hours NAD 1983 UTM Zone 10N Data Sources: Greater than 3 Hours The accuracy & completeness of information shown on this drawing is not guaranteed. It will be the responsibility of the user of the information shown on this drawing to locate & establish the precise location of all existing information whether shown or not Metres Data provided by the CIty of Nanaimo, SH ~ DRAFT ~ A 2017 / 10 / 23 Scale: 1:5,000 N FIGURE B2 3
57 This page is intentionally left blank.

58 EVERGREEN WAY MANCHESTER LN LATIMER RD DAVIES LN DUGGAN RD CORMORANT AVE GIGGLESWICK PL WOODLANDS ST ESTEVAN RD TERMINAL AVE N MEREDITH RD STRATHMORE ST Hospital Area Plan Parking Study U:\Projects_VIC\1296\0054\01\D-Design\GIS\Projects\MXD\Current\Turnover - Sept \City of Nanaimo - Hospital Area Plan Parking Study - Turnover Sept EVENING - 11x17 - Rev A.mxd Last updated by lpunt on October 23, 2017 at 11:31:03 AM BEVERLY DR JAMES WAY GRIFFITHS RD MADSEN RD BLUEBELL TERR KERRISDALE RD FOREST DR HONEYSUCKLE TERR BOWEN RD EAST WELLINGTON RD CREEKSIDE DR EAGLE CRES BOB-O-LINK WAY CHICK-A-DEE THUNDERBIRD DR CRESCENT VIEW DR CASPERS WAY CRES PRYDE AVE BOUNDARY AVE BOUNDARY CRES GRAHAM CRES Nanaimo Regional General Hospital TOWNSITE RD WHITE ST BUSH ST DUFFERIN CRES M i l lstone Ri ver NIS CRES KI W A NELSON ST SEAFIELD CRES LORNE PL ST PATRICK CRES MCKAY AVE BEAUFORT DR MCDONALD GRANT AVE CRES ST DAVID CRES MOYSE CRES ST GEORGE CRES GIRVIN AVE WADDINGTON RD EBERTS ST Legend Project #: Author: LP Checked: Status: Revision: Date: On-street Parking Turnover September 21, :30 PM to 6:30 PM Average Length of Vehicle Stay (hours) Coordinate System: 2 Hours or Less 2 to 2.5 Hours 2.5 to 3 Hours NAD 1983 UTM Zone 10N Data Sources: Greater than 3 Hours The accuracy & completeness of information shown on this drawing is not guaranteed. It will be the responsibility of the user of the information shown on this drawing to locate & establish the precise location of all existing information whether shown or not Metres Data provided by the CIty of Nanaimo, SH ~ DRAFT ~ A 2017 / 10 / 23 Scale: 1:5,000 N FIGURE B3 4
59 This page is intentionally left blank.
60 APPENDIX C Off-Street Parking Survey Summary Maps
61 Off-Street Parking Survey Summary Maps This page is intentionally left blank.
62 HALLEN AVE NELSON ST BOB-O-LINK WAY Hospital Area Plan Parking Study C:\Projects\VIC\ \Projects\MXD\Current\Parking - June 8th\City of Nanaimo - Hospital Area Plan Parking Study - Hospital Lot Occupancy June 8-7AM - 10AM - 11x17 - Rev A.mxd Last updated by lpunt on June 20, 2017 at 2:24:21 PM THUNDERBIRD DR NIGHTINGALE CRES CRESCENT VIEW DR BOUNDARY AVE BOUNDARY CRES 46 / 53 6 / / 57 Nanaimo Regional General Hospital 51 / / / / / 51 DUFFERIN CRES 32 / 32 KIWANIS CRES SEAFIELD CRES 124 / / 229 GRANT AVE ST DAVID CRES MOY SE CRES Hospital Parking Lot Occupancy Wednesday June 7th 7 am - 10 am Legend Existing Occupancy Project #: Author: LP Checked: Status: Revision: Date: 0% - 50% Coordinate System: 51% - 70% 71% - 85% 86% - 100% The accuracy & completeness of information shown on this drawing is not guaranteed. It will be the responsibility of the user of the information shown on this drawing to locate & establish the precise location of all existing information whether shown or not NAD 1983 UTM Zone 10N Data Sources: Metres Data provided by the CIty of Nanaimo, MB ~ DRAFT ~ A 2017 / 6 / 20 Scale: 1:2,000 N FIGURE C1 5
63 This page is intentionally left blank.
64 HALLEN AVE NELSON ST BOB-O-LINK WAY Hospital Area Plan Parking Study C:\Projects\VIC\ \Projects\MXD\Current\Parking - June 8th\City of Nanaimo - Hospital Area Plan Parking Study - Hospital Lot Occupancy June 8-11AM - 2PM - 11x17 - Rev A.mxd Last updated by lpunt on June 20, 2017 at 2:25:06 PM THUNDERBIRD DR NIGHTINGALE CRES CRESCENT VIEW DR BOUNDARY AVE BOUNDARY CRES 50 / / / 57 Nanaimo Regional General Hospital 91 / / / / / 51 DUFFERIN CRES 32 / 32 KIWANIS CRES SEAFIELD CRES 214 / / 229 GRANT AVE ST DAVID CRES MOY SE CRES Hospital Parking Lot Occupancy Wednesday June 7th 11 am - 2 pm Legend Existing Occupancy Project #: Author: LP Checked: Status: Revision: Date: 0% - 50% Coordinate System: 51% - 70% 71% - 85% 86% - 100% The accuracy & completeness of information shown on this drawing is not guaranteed. It will be the responsibility of the user of the information shown on this drawing to locate & establish the precise location of all existing information whether shown or not NAD 1983 UTM Zone 10N Data Sources: Metres Data provided by the CIty of Nanaimo, MB ~ DRAFT ~ A 2017 / 6 / 20 Scale: 1:2,000 N FIGURE C2 6
65 This page is intentionally left blank.
66 HALLEN AVE NELSON ST BOB-O-LINK WAY Hospital Area Plan Parking Study C:\Projects\VIC\ \Projects\MXD\Current\Parking - June 8th\City of Nanaimo - Hospital Area Plan Parking Study - Hospital Lot Occupancy June 8-3PM - 5PM - 11x17 - Rev A.mxd Last updated by lpunt on June 20, 2017 at 2:22:56 PM THUNDERBIRD DR NIGHTINGALE CRES CRESCENT VIEW DR BOUNDARY AVE BOUNDARY CRES 33 / / / 57 Nanaimo Regional General Hospital 76 / / / / / 51 DUFFERIN CRES 29 / 32 KIWANIS CRES SEAFIELD CRES 162 / / 229 GRANT AVE ST DAVID CRES MOY SE CRES Hospital Parking Lot Occupancy Wednesday June 7th 3 pm - 5 pm Legend Existing Occupancy Project #: Author: LP Checked: Status: Revision: Date: 0% - 50% Coordinate System: 51% - 70% 71% - 85% 86% - 100% The accuracy & completeness of information shown on this drawing is not guaranteed. It will be the responsibility of the user of the information shown on this drawing to locate & establish the precise location of all existing information whether shown or not NAD 1983 UTM Zone 10N Data Sources: Metres Data provided by the CIty of Nanaimo, MB ~ DRAFT ~ A 2017 / 6 / 20 Scale: 1:2,000 N FIGURE C3 7
67 This page is intentionally left blank.

68 HALLEN AVE NELSON ST BOB-O-LINK WAY Hospital Area Plan Parking Study C:\Projects\VIC\ \Projects\MXD\Current\Parking - June 8th\City of Nanaimo - Hospital Area Plan Parking Study - Hospital Lot Occupancy June 8-6PM - 8PM - 11x17 - Rev A.mxd Last updated by lpunt on June 20, 2017 at 2:23:44 PM THUNDERBIRD DR NIGHTINGALE CRES CRESCENT VIEW DR BOUNDARY AVE BOUNDARY CRES 16 / 53 6 / / 57 Nanaimo Regional General Hospital 50 / / / / / 51 DUFFERIN CRES 19 / 32 KIWANIS CRES SEAFIELD CRES 47 / / 229 GRANT AVE ST DAVID CRES MOY SE CRES Hospital Parking Lot Occupancy Wednesday June 7th 6 pm - 8 pm Legend Existing Occupancy Project #: Author: LP Checked: Status: Revision: Date: 0% - 50% Coordinate System: 51% - 70% 71% - 85% 86% - 100% The accuracy & completeness of information shown on this drawing is not guaranteed. It will be the responsibility of the user of the information shown on this drawing to locate & establish the precise location of all existing information whether shown or not NAD 1983 UTM Zone 10N Data Sources: Metres Data provided by the CIty of Nanaimo, MB ~ DRAFT ~ A 2017 / 6 / 20 Scale: 1:2,000 N FIGURE C4 8
EXECUTIVE SUMMARY. Introduction
 EXECUTIVE SUMMARY Introduction The purpose of this study is to ensure that the Village, in cooperation and coordination with the Downtown Management Corporation (DMC), is using best practices as they plan
Appendix C. Parking Strategies
 Appendix C. Parking Strategies Bremerton Parking Study Introduction & Project Scope Community concerns regarding parking impacts in Downtown Bremerton and the surrounding residential areas have existed
On-Street Parking Program
 On-Street Parking Program Williamsville Area - Public Information Session January 12, 2017 Project Timeline and Consultation Neighbourhood information session June 2016 Online survey August/September 2016
DOWNTOWN PARKING STUDY AND STRATEGIC PLAN
 INTRODUCTION This report includes a summary of several key components of the Rapid City Downtown Parking Study and Strategic Plan, including: Current Conditions Analysis (Inventory and Occupancy and Length
Mercer Island Town Center Parking Study Joint Commission Presentation March 16, 2016
 Mercer Island Town Center Parking Study Joint Commission Presentation March 16, 2016 Mercer Island Town Center Parking Study Study Area Town Center Bordered by Sunset Way, Island Crest Way, SE 32 nd Street,
Mercer Island Center for the Arts Parking Management Plan
 Parking Stalls Mercer Island Center for the Arts Parking Management Plan June 15, 2016 This Parking Management Plan (P) covers all tenants at the Mercer Island Center for the Arts (MICA) campus, including
On June 11, 2012, the Park Board approved the installation of three electric vehicle charging stations along Beach Avenue.
 January 8, 2017 TO: Park Board Chair and Commissioners FROM: General Manager Vancouver Board of Parks and Recreation SUBJECT: Electric Vehicle Charging Stations New Park Board Locations RECOMMENDATION
Plattsburgh Downtown Parking Study
 Plattsburgh Downtown Parking Study Study Update October 2017 Powered by Purpose of Study Engage Community in Parking Discussion Assess Current Conditions Parking Demand Patron Service Levels Administration
appendix 4: Parking Management Study, Phase II
 appendix 4: Parking Management Study, Phase II A4-1 A4-2 Eastlake Parking Management Study Final Phase 2 Report Future Parking Demand & Supply January 6, 2017 Submitted by Denver Corp Center III 7900 E.
WELCOME Open House on Parking
 WELCOME Open House on Parking Tonight we re presenting our policy responses for your input on how to best manage our public parking. Parking is a shared community resource. To best serve everyone in our
Car Sharing at a. with great results.
 Car Sharing at a Denver tweaks its parking system with great results. By Robert Ferrin L aunched earlier this year, Denver s car sharing program is a fee-based service that provides a shared vehicle fleet
DOWNTOWN DUNEDIN WALKER PARKING CONSULTANTS FEASIBILITY ANALYSIS FOR DOWNTOWN PAID PARKING
 JUNE 18,2015 PROJECT # 15-2047.00 EXECUTIVE SUMMARY Parking in Downtown Dunedin has been and continues to be a growing point of concern. In an effort to address the parking issues, the City retained Walker
UC Santa Cruz TAPS 3-Year Fee & Fare Proposal, through
 UC Santa Cruz TAPS 3-Year Fee & Fare Proposal, 2016-17 through 2018-19 Introduction Transportation and Parking Services (TAPS) proposes a three-year series of annual increases to most Parking fees and
Downtown Parking/Wayfinding Study. Review of Recommendations to City Council: January 16, 2018
 Downtown Parking/Wayfinding Study Review of Recommendations to City Council: January 16, 2018 Tonight s Focus Objectives & Timeline Recap Study Findings Present Staff Recommendations 2018 Action items
PARKING OCCUPANCY IN WINDSOR CENTER
 PARKING OCCUPANCY IN WINDSOR CENTER TOWN OF WINDSOR, CONNECTICUT REPORT JUNE 2017 CONTENTS Background... 3 Other Relevant Data... 3 Parking Survey Design... 6 Parking Supply Inventory... 6 Parking Demand
Parking Management Element
 Parking Management Element The State Transportation Planning Rule, adopted in 1991, requires that the Metropolitan Planning Organization (MPO) area implement, through its member jurisdictions, a parking
Birmingham Parking. City of Birmingham, Michigan. June 2018
 Birmingham Parking City of Birmingham, Michigan June 2018 1 OVERVIEW Supply Utilization Key Findings Stakeholder Feedback Strategies SUPPLY DOWNTOWN BIRMINGHAM PARKING SYSTEM SUPPLY On-Street 1,262 total
Final Recommendation on Parking Pilot Program. Transportation Commission Meeting April 23, 2018 Village Hall Council Chambers
 Final Recommendation on Parking Pilot Program Transportation Commission Meeting April 23, 2018 Village Hall Council Chambers 1 Add Meters Remove Meters On-Street Parking Meters/Pay-By-Plate or Space Add
Hoboken Citywide Parking Master Plan. 1 st Public Workshop June 11, 2014
 Hoboken Citywide Parking Master Plan 1 st Public Workshop June 11, 2014 Today s Agenda Open House 6:30-7:00 Presentation 7:00-7:30 - Why are we here today? - What is the Hoboken Citywide Parking Master
Trip Generation Study: Provo Assisted Living Facility Land Use Code: 254
 Trip Generation Study: Provo Assisted Living Facility Land Use Code: 254 Introduction The Brigham Young University Institute of Transportation Engineers (BYU ITE) student chapter completed a trip generation
U N I V E R S I T Y O F B R I T I S H C O L U M B I A. Fall 2008 Transportation Status Report
 U N I V E R S I T Y O F B R I T I S H C O L U M B I A Fall 2008 Transportation Status Report 6 February 2009 U N I V E R S I T Y O F B R I T I S H C O L U M B I A Fall 2008 Transportation Status Report
CITY OF LOS ANGELES INTER-DEPARTMENTAL MEMORANDUM
 CITY OF LOS ANGELES INTER-DEPARTMENTAL MEMORANDUM Date: April 11, 2018 To: The Honorable City Council c/o City Clerk, Room 395, City Hall Attention: Honorable Mike Bonin, Chair, Transportation Committee
Denver Car Share Program 2017 Program Summary
 Denver Car Share Program 2017 Program Summary Prepared for: Prepared by: Project Manager: Malinda Reese, PE Apex Design Reference No. P170271, Task Order #3 January 2018 Table of Contents 1. Introduction...
ACT Canada Sustainable Mobility Summit Planning Innovations in Practice Session 6B Tuesday November 23, 2010
 ACT Canada Sustainable Mobility Summit Planning Innovations in Practice Session 6B Tuesday November 23, 2010 Presentation Outline Context t of Mississauga i City Centre Implementing Paid Parking and TDM
Public Works and Infrastructure Committee. p:/2015/clusterb/tra/northyork/pw15086
 PW9.10 STAFF REPORT ACTION REQUIRED Car-Share Parking in Permit Parking Areas Date: October 22, 2015 To: From: Wards: Reference Number: Public Works and Infrastructure Committee General Manager, Transportation
Morning Parking Utilization Trends
 MEMORANDUM Date: November 6 th, 2015 Project #: 18130 To: From: Subject: Rebecca Houghtaling, Senior Planner, Oregon State University Lisa Scherf, Transportation Services Supervisor, City of Corvallis
Town of Newmarket. Parking Directions Report. Prepared for: Town of Newmarket
 Town of Newmarket Parking Directions Report Prepared for: Town of Newmarket April, 2010 TOWN OF NEWMARKET: PARKING DIRECTIONS APRIL, 2010 P:\73\28\01\Reports\APR 19 2010 - Parking Directions_ckc.doc TABLE
Revised Strategy for Downtown Parking
 Revised Strategy for Downtown Parking December 4, 2017 Council Workshop Presented by Jennifer McCoy, P.E., City Traffic Engineer City-Owned Parking Today 3,500 metered parking spaces Parking meters charge
Contact: Michael Parks, Manager, Traffic Engineering Services (905) Council has directed staff to report on implementing a site-specific
 Council has directed staff to report on implementing a site-specific") Flower City COMMITTEE DATE: OF COUNCIL Report Committee of Council Standing Committee of the Council of the Corporation of the City of Brampton Date: February 3, 2009 File: Subject: T00TRAF Resident Permit
Flower City COMMITTEE DATE: OF COUNCIL Report Committee of Council Standing Committee of the Council of the Corporation of the City of Brampton Date: February 3, 2009 File: Subject: T00TRAF Resident Permit
Paid Parking at Park & Ride Lots: Framing the Issues. Capital Programs Committee May 2014
 Paid Parking at Park & Ride Lots: Framing the Issues Capital Programs Committee May 2014 Outline Current Status Industry Review DART Case Study Issues Alternatives Mechanics 2 Current Status: All Lots
Click to edit Master title style
 Nelson/Nygaard Consulting Associates SERVICE IMPROVEMENT STRATEGIES September 22, 2015 1 PROJECT OVERVIEW & WORK TO DATE 1. Extensive stakeholder involvement Throughout 2. System and market assessment
Downtown Lee s Summit Parking Study
 Downtown Lee s Summit Parking Study As part of the Downtown Lee s Summit Master Plan, a downtown parking and traffic study was completed by TranSystems Corporation in November 2003. The parking analysis
5. OPPORTUNITIES AND NEXT STEPS
 5. OPPORTUNITIES AND NEXT STEPS When the METRO Green Line LRT begins operating in mid-2014, a strong emphasis will be placed on providing frequent connecting bus service with Green Line trains. Bus hours
Rate Review 2017 Off-Street Municipal Parking Facilities
 PA3.2 REPORT FOR ACTION Rate Review 2017 Off-Street Municipal Parking Facilities Date: August 31, 2017 To: Board of Directors, Toronto Parking Authority From: Acting President, Toronto Parking Authority
TRANSPORTATION REVIEW
 TRANSPORTATION REVIEW - PROPOSED MIX OF LAND USES IS CONSISTENT WITH THE CITY S UNDER THE GRANVILLE BRIDGE POLICIES THAT AIM TO MEET NEIGHBOURING RESIDENTS SHOPPING NEEDS AND REDUCE RELIANCE ON AUTOMOBILE
ON-STREET AND OFF-STREET PARKING SURVEY: METHODOLOGY AND RESULTS
 ON-STREET AND OFF-STREET PARKING SURVEY: METHODOLOGY AND RESULTS TOWN OF WINDSOR, CT REPORT JUNE 2016 CONTENTS Parking Survey Design... 3 Parking Supply Inventory... 3 Parking Demand Survey... 3 Surveyed
City of Wooster Downtown Parking
 City of Wooster Downtown Parking 1 Downtown Parking Leased/Permit & 3 Hour Space Availability 795 Total Spaces 433 Spaces On-Street 362 Parking Lot Spaces 122 Free 3-Hour 44 90-Minute Spaces 17 Accessible
Executive Summary EXECUTIVE SUMMARY Parking Issues Trenton Downtown Parking Policy and Sidewalk Design Standards E.S. Page 1 Final Report 2008
 EXECUTIVE SUMMARY A walkable environment that accommodates market demand while minimizing the negative impacts of growth is an important element in promoting the City s downtown revitalization. There are
Transportation Sustainability Program
 Transportation Sustainability Program Photo: Sergio Ruiz San Francisco 2016 Roads and public transit nearing capacity Increase in cycling and walking despite less than ideal conditions 2 San Francisco
City of Meridian - Limited Parking Supply and Demand Analysis
 City of Meridian - Limited Parking Supply and Demand Analysis Prepared for: City of Meridian, Idaho Planning and Zoning 660 East Watertower, Ste. 202 Meridian, ID 83642 Prepared by: Carl Walker, Inc. 4
2.0 Development Driveways. Movin Out June 2017
 Movin Out June 2017 1.0 Introduction The proposed Movin Out development is a mixed use development in the northeast quadrant of the intersection of West Broadway and Fayette Avenue in the City of Madison.
CORE AREA SPECIFIC PLAN
 only four (A, B, D, and F) extend past Eighth Street to the north, and only Richards Boulevard leaves the Core Area to the south. This street pattern, compounded by the fact that Richards Boulevard is
San Rafael Civic Center Station Area Plan May 2012 DRAFT FOR PUBLIC REVIEW
 CHAPTER 4. PARKING Parking has been identified as a key concern among neighbors and employers in the area, both in terms of increased demand from potential new development and from SMART passengers that
1 Downtown LRT Connector: Draft Concept
 Downtown LRT Connector: Draft Concept Plan November 2010 We re moving forward. Get involved. On June 21, 2010, City Council approved a street-level downtown LRT route, including a connector for the future
Maine Medical Center Campus-Wide Parking Study
 Overview Maine Medical Center (MMC) retained VHB to conduct a campus-wide parking study that includes an analysis of demand and supply for patient, visitor, and employee parking on MMC s Bramhall Campus.
What We Heard Report - Metro Line NW LRT
 What We Heard Report - Metro Line NW LRT by Metro Line NW LRT Project Team LRT Projects City of Edmonton April 11, 2018 Project / Initiative Background Name Date Location Metro Line Northwest Light Rail
Newmarket GO Station Mobility Hub Study. Open House #1 MAY 18, 2017
 Newmarket GO Station Mobility Hub Study Open House #1 Naren Garg Metrolinx Advisor, RER Project Planning Amy Shepherd IBI Group Associate, Manager, Planning INTRODUCTIONS - METROLINX Metrolinx is an agency
Final Administrative Decision
 Final Administrative Decision Date: August 30, 2018 By: David Martin, Director of Planning and Community Development Subject: Shared Mobility Device Pilot Program Operator Selection and Device Allocation
Transportation Demand Management Element
 Transportation Demand Management Element Over the years, our reliance on the private automobile as our primary mode of transportation has grown substantially. Our dependence on the automobile is evidenced
Address Land Use Approximate GSF
 M E M O R A N D U M To: Kara Brewton, From: Nelson\Nygaard Date: March 26, 2014 Subject: Brookline Place Shared Parking Analysis- Final Memo This memorandum presents a comparative analysis of expected
On-Street Parking Program Consultation Summary (Area F)
") On-Street Parking Program Consultation Summary (Area F) This document contains a summary of the consultation process, feedback, and information provided to residents, stakeholders, and other interested
On-Street Parking Program Consultation Summary (Area F) This document contains a summary of the consultation process, feedback, and information provided to residents, stakeholders, and other interested
Denver Car Share Permit Program
 Denver Car Share Permit Program Rocky Mountain Land Use Institute Conference 13 March 2014 Strategic Parking Plan (SPP) Vision & Framework Acknowledge a variety of land use patterns & contexts Manage parking
Key Findings and Recommendations Introduction and Overview Task 1 Existing Conditions Analysis Task 2 Parking Demand Analysis...
 Table of Contents Introduction and Overview... 1 Key Findings and Recommendations... 1 Task 1 Existing Conditions Analysis... 1 Task 2 Parking Demand Analysis... 1 Task 3 Facilities Cost Analysis... 2
BARRHAVEN FELLOWSHIP CRC 3058 JOCKVALE ROAD OTTAWA, ONTARIO TRANSPORTATION BRIEF. Prepared for:
 BARRHAVEN FELLOWSHIP CRC 3058 JOCKVALE ROAD OTTAWA, ONTARIO TRANSPORTATION BRIEF Prepared for: Barrhaven Fellowship CRC 3058 Jockvale Road Ottawa, ON K2J 2W7 December 7, 2016 116-649 Report_1.doc D. J.
CITY OF OMAHA OMAHA, NEBRASKA
 DOWNTOWN PARKING NEEDS ASSESSMENT UPDATE CITY OF OMAHA OMAHA, NEBRASKA Prepared for: City of Omaha Parking Division October 15, 2014 FINAL REPORT TABLE OF CONTENTS EXECUTIVE SUMMARY... 1 Study Purpose...
This letter summarizes our observations, anticipated traffic changes, and conclusions.
 Mr. David Jorschumb Project Manager Boulder Valley School District Re: Review of proposed school access improvements at the Foothills Elementary School in Boulder Dear Mr. Jorschumb, At your request, the
A Transit Plan for the Future. Draft Network Plan
 A Transit Plan for the Future Draft Network Plan Project Overview and Status Completed Market Analysis and Service Evaluation. Developed Plan Framework and Guiding Principles. Developed a draft Five Year
APPENDIX VMT Evaluation
 APPENDIX 2.7-2 VMT Evaluation MEMORANDUM To: From: Mr. Jonathan Frankel New Urban West, Incorporated Chris Mendiara LLG, Engineers Date: May 19, 2017 LLG Ref: 3-16-2614 Subject: Villages VMT Evaluation
Commuter Services Updates. Parking Coordinators Meeting July 2018
 2018 2019 Commuter Services Updates Parking Coordinators Meeting July 2018 Agenda Construction impacts Parking enhancements, renewal process Rate updates Parking application preview Q&A Raffle! Introductions
Updated Jan ) They may then choose to continue to appeal or not. Appeals will only be accepted via the on-line system.
 They may then choose to continue to appeal or not. Appeals will only be accepted via the on-line system.") DUNDALK INSTITUTE OF TECHNOLOGY CAR PARKING POLICY. FREQUENTLY ASKED QUESTION SHEET (FAQ). Updated Jan 2016. Q 1: What should I do when I am clamped? A: Please follow the instructions for the release of
DUNDALK INSTITUTE OF TECHNOLOGY CAR PARKING POLICY. FREQUENTLY ASKED QUESTION SHEET (FAQ). Updated Jan 2016. Q 1: What should I do when I am clamped? A: Please follow the instructions for the release of
Traffic and Toll Revenue Estimates
 The results of WSA s assessment of traffic and toll revenue characteristics of the proposed LBJ (MLs) are presented in this chapter. As discussed in Chapter 1, Alternatives 2 and 6 were selected as the
TECHNICAL MEMORANDUM. Part A: Introduction
 TECHNICAL MEMORANDUM To: David J. Decker Decker Properties, Inc. 5950 Seminole Centre Ct. Suite 200 Madison, Wisconsin 53711 608-663-1218 Fax: 608-663-1226 www.klengineering.com From: Mike Scarmon, P.E.,
Midtown Corridor Alternatives Analysis. Policy Advisory Committee Meeting February 12, 2014
 Midtown Corridor Alternatives Analysis Policy Advisory Committee Meeting February 12, 2014 Today s Agenda Introductions Outreach efforts and survey results Other updates since last meeting Evaluation results
Chapter 740, Street Vending One Year Bylaw Review
 Chapter 740, Street Vending One Year Bylaw Review Licensing and Standards Committee City Hall, 2 nd Floor, Committee Room 1 Tuesday April 21, 2015 Carleton Grant, Director, Policy and Strategic Support
Suggested Administrative Procedure to Deliver Supported Program Feature. Community- driven Program
 November 4, 2014 Tacoma Public Works is the City agency designated to address onstreet parking issues. Due to the growth and development of the City, the current program for managing parking congestion
DATE: March 21, 2017 REPORT NO. PW TYPE OF REPORT CONSENT ITEM [ ] ITEM FOR CONSIDERATION [ X ] 2.0 TOPIC
![DATE: March 21, 2017 REPORT NO. PW TYPE OF REPORT CONSENT ITEM [ ] ITEM FOR CONSIDERATION [ X ] 2.0 TOPIC](/thumbs/88/115267053.jpg "DATE: March 21, 2017 REPORT NO. PW TYPE OF REPORT CONSENT ITEM [ ] ITEM FOR CONSIDERATION [ X ] 2.0 TOPIC") PUBLIC WORKS COMMISSION PUBLIC WORKS COMMISSION DATE: March 21, 2017 REPORT NO. PW2017-022 TO: FROM: Chair and Members Committee of the Whole Operations and Administration E. (Beth) Goodger, General Manager
PUBLIC WORKS COMMISSION PUBLIC WORKS COMMISSION DATE: March 21, 2017 REPORT NO. PW2017-022 TO: FROM: Chair and Members Committee of the Whole Operations and Administration E. (Beth) Goodger, General Manager
2018 Long Range Development Plan Update Community Advisory Group- February 21, 2018
 Transportation @ UC San Diego 2018 Long Range Development Plan Update Community Advisory Group- February 21, 2018 Agenda UC San Diego Transportation Services Organizational Overview Current State Parking,
Citizens Committee for Facilities
 Citizens Committee for Facilities AGENDA Thursday, December 11, 2014 City Council Chambers 305 3 rd Avenue East -Twin Falls, Idaho 11:30 A.M. AGENDA ITEMS Purpose By 1. Discussion and possible action on
D. J. Halpenny & Associates Ltd. Consulting Transportation Engineers
 D. J. Halpenny & Associates Ltd. Consulting Transportation Engineers August 24, 2015 File: 115-622 Mr. R. Baumann, President The RGB Group 277 Kirchoffer Avenue Ottawa, ON K2A 1Y1 RE: RESIDENTIAL DEVELOPMENT
Attachment D Environmental Justice and Outreach
 Attachment D Environmental Justice and Outreach ATTACHMENT D Environmental Justice and Outreach Indicate whether the project will have disproportionately high and adverse impacts on minority or low income
BROWARD BOULEVARD CORRIDOR TRANSIT STUDY
 BROWARD BOULEVARD CORRIDOR TRANSIT STUDY FM # 42802411201 EXECUTIVE SUMMARY July 2012 GOBROWARD Broward Boulevard Corridor Transit Study FM # 42802411201 Executive Summary Prepared For: Ms. Khalilah Ffrench,
APPENDIX TR-1 PARKING AND QUEUING ASSESSMENT
 APPENDIX TR-1 PARKING AND QUEUING ASSESSMENT Overland Overland Traffic Consultants, Traffic Consultants, Inc. Inc. Overland Traffic Consultants 952 Manhattan Beach Boulevard, Suite #100 Manhattan Beach,
Office of Transportation Bureau of Traffic Management Downtown Parking Meter District Rate Report
 Office of Transportation Bureau of Traffic Management 1997 Downtown Parking Meter District Rate Report Introduction The City operates approximately 5,600 parking meters in the core area of downtown. 1
Evaluating Stakeholder Engagement
 Evaluating Stakeholder Engagement Peace River October 17, 2014 Stakeholder Engagement: The Panel recognizes that although significant stakeholder engagement initiatives have occurred, these efforts were
Bryn Mawr. Parking Study Update First Draft Report. February 3, Bryn Mawr, PA
 Bryn Mawr Bryn Mawr, PA Parking Study Update First Draft Report www.timhaahs.com 550 Township Line Road, Suite 100 Blue Bell, PA 19422 T: 484.342.0200 F: 484.342.0222 www.timhaahs.com TIMOTHY HAAHS & ASSOCIATES,
Letter EL652 City of Mercer Island. Page 1. No comments n/a
 Letter EL652 City of Mercer Island Page 1 No comments n/a Page 2 Response to comment EL652 1 Section 4.5.3 of the Final EIS presents the range of potential impacts of the project. This project also lists
Santa Rosa Downtown Progressive Parking Strategy & Railroad Square Parking Plan. Presented by: Lauren Mattern
 Santa Rosa Downtown Progressive Parking Strategy & Railroad Square Parking Plan Presented by: Lauren Mattern October 2016 Today s Agenda Project Overview Current System Highlights Community Outreach Feedback
Mansion Neighborhood Parking Study
 Capital District Transportation Committee Mansion Neighborhood Parking Study Albany, New York Prepared For: Albany Local Development Corporation, and The Capital District Transportation Committee By: Wilbur
Stoughton Center Parking
 Stoughton Center Parking Existing Conditions and Observations October 4, 2017 Agenda Introduction Metropolitan Area Planning Council Project Team Parking Studies Background Scope of Work Study Area Survey
AND THAT Bylaw No , being Amendment No. 27 to Traffic Bylaw No. 8120, be forwarded for reading consideration.
 Report to Council Date: File: 1862-01 To: From: Subject: D. Duncan, Manager, Parking Services Parking Rate, Fine and Fee Adjustments Recommendation: THAT Council receives, for information, the report from
71, 75 MONTREAL STREET PARKING STUDY
 71, 75 MONTREAL STREET PARKING STUDY Prepared for: Prepared by: Urban Core Ventures Boulevard Transportation, a division of Watt Consulting Group Our File: 1975 Date: June 20 2016 CONTENTS 1.0 INTRODUCTION...
DRAFT Evaluation Scores. Transit
 DRAFT Evaluation s The criteria for evaluating applications for new funding commitments are used to measure how well they advance the six goals identified for the MTP. Through transportation: Reduce per
Welcome. Green Line in Your Community
 Welcome Green Line in Your Community Today's session will provide you with information about Administration's recommendation for connecting the Green Line in the Beltline to Victoria Park and Inglewood/Ramsay
CITY OF ANN ARBOR, MICHIGAN 301 E. Huron St., P.O. Box 8647 Ann Arbor, Michigan
 Date: Wednesday, June 18, 2014 Location: Ann Arbor District Library Attendees: 14 citizen attendees Ann Arbor Station Environmental Review Citizen Working Group Meeting Notes Meeting #3 The third meeting
TRAFFIC PARKING ANALYSIS
 TRAFFIC PARKING ANALYSIS NAPA FLEA MARKET COUNTY OF NAPA Prepared for: Tom Harding Napa-Vallejo Flea Market 33 Kelly Road American Canyon, CA 9453 Prepared by: 166 Olympic Boulevard, Suite 21 Walnut Creek,
REPORT TO THE CHIEF ADMINISTRATIVE OFFICER FROM THE DEVELOPMENT AND ENGINEERING SERVICES DEPARTMENT
 REPORT TO THE CHIEF ADMINISTRATIVE OFFICER FROM THE DEVELOPMENT AND ENGINEERING SERVICES DEPARTMENT ON April 3, 2014 ZONING BYLAW AMENDMENT APPLICATION NO. ZBA00079 CHANGES TO THE ZONING AND BUSINESS LICENCE
EUGENE-SPRINGFIELD, OREGON EAST WEST PILOT BRT LANE TRANSIT DISTRICT
 EUGENE-SPRINGFIELD, OREGON EAST WEST PILOT BRT LANE TRANSIT DISTRICT (BRIEF) Table of Contents EUGENE-SPRINGFIELD, OREGON (USA)... 1 COUNTY CONTEXT AND SYSTEM DESCRIPTION... 1 SYSTEM OVERVIEW... 1 PLANNING
MEMORANDUM TO: Oak Park and River Forest High School District 200. Kenig, Lindgren, O Hara, Aboona, Inc.
 9575 West Higgins Road, Suite 400 Rosemont, Illinois 60018 p: 847-518-9990 f: 847-518-9987 MEMORANDUM TO: Oak Park and River Forest High School District 200 FROM: Kenig, Lindgren, O Hara, Aboona, Inc.
RE: A Traffic Impact Statement for a proposed development on Quinpool Road
 James J. Copeland, P.Eng. GRIFFIN transportation group inc. 30 Bonny View Drive Fall River, NS B2T 1R2 May 31, 2018 Ellen O Hara, P.Eng. Project Engineer DesignPoint Engineering & Surveying Ltd. 200 Waterfront
Transit Hub Case Study: Owings Mills Metro Station. By: Kathleen Cary Rose, J. Luke Byrne and Catherine Buhler
 Executive Summary Transit Hub Case Study: Owings Mills Metro Station By: Kathleen Cary Rose, J. Luke Byrne and Catherine Buhler The purpose of the Transit Hub Case Study is to identify and evaluate the
Transportation Demand Management January 25, 2017 Waterfront Plan Transportation Working Group. Date & Location
 Transportation Demand Management January 25, 2017 Waterfront Plan Transportation Working Group Date & Location TDM Opportunities: Port Uses Visitor-serving uses Port tenants Future development Many TDM
CITY OF ANN ARBOR, MICHIGAN 301 E. Huron St., P.O. Box 8647 Ann Arbor, Michigan
 Date: Wednesday, June 24, 2014 Location: Ann Arbor District Library Attendees: 40 citizen attendees Ann Arbor Station Environmental Review Public Meeting Meeting Notes Meeting #2 The second public meeting
NEW HAVEN HARTFORD SPRINGFIELD RAIL PROGRAM
 NEW HAVEN HARTFORD SPRINGFIELD RAIL PROGRAM Hartford Rail Alternatives Analysis www.nhhsrail.com What Is This Study About? The Connecticut Department of Transportation (CTDOT) conducted an Alternatives
Bay Campus Operations
 Travel to the Bay Campus The opening of the Bay Campus means that there are likely to be more staff and students than ever travelling across Swansea to the Bay Campus, to the Singleton Park Campus, and
Sustainable Transportation At Stony Brook University Friday, September 21, 2012 SUNY Sustainability Conference Syracuse Center of Excellence
 Sustainable Transportation At Stony Brook University Friday, September 21, 2012 SUNY Sustainability Conference Syracuse Center of Excellence James O Connor, Director of Sustainability & Transportation
STRATEGIC PRIORITIES AND POLICY COMMITTEE MAY 5, 2016
 STRATEGIC PRIORITIES AND POLICY COMMITTEE MAY 5, 2016 Shift Rapid Transit Initiative Largest infrastructure project in the city s history. Rapid Transit initiative will transform London s public transit
IV. ENVIRONMENTAL IMPACT ANALYSIS K.2. PARKING
 IV. ENVIRONMENTAL IMPACT ANALYSIS K.2. PARKING ENVIRONMENTAL SETTING The following analysis summarizes the findings and conclusions of the Traffic Analysis (Traffic Study), prepared by The Mobility Group,
Operations Center FAQs
 RICHARDSON INDEPENDENT SCHOOL DISTRICT Where all students learn, grow and succeed Operations Center FAQs Richardson ISD is constructing an operations center on vacant district land between Greenville Avenue
DRIVER SPEED COMPLIANCE WITHIN SCHOOL ZONES AND EFFECTS OF 40 PAINTED SPEED LIMIT ON DRIVER SPEED BEHAVIOURS Tony Radalj Main Roads Western Australia
 DRIVER SPEED COMPLIANCE WITHIN SCHOOL ZONES AND EFFECTS OF 4 PAINTED SPEED LIMIT ON DRIVER SPEED BEHAVIOURS Tony Radalj Main Roads Western Australia ABSTRACT Two speed surveys were conducted on nineteen
2016 PARKING STUDY & REPORTS
 Attachment 7.5A 2016 PARKING STUDY & REPORTS Prepared for: Town of Banff, Engineering Department Dated: September 12, 2016 Prepared by: Indigo Park Canada Inc. TABLE OF CONTENTS EXECUTIVE SUMMARY 3 Introduction