Introduction & Executive Summary
|
|
|
- Rose Oliver
- 6 years ago
- Views:
Transcription


1
2
3 Introduction & Executive Summary Table of Contents Introduction 2009 Executive Summary 6-7 Mission and Strategic Plan of the National Recreational Boating Safety Program 8 Overview of Statistics 8 Changes to the Publication 8-9 Accident Reporting as Required by Federal Law 9-10 Casualty and Accident Reporting Guidelines 10 Reportable Boating Accidents 10 Non-Reportable Boating Accidents Use of Statistics 13 Accident Causes and Conditions Tables with Explanation Table 4 Percent of Accidents that are Fatal by Month 17 Figure 1 Percent of Accidents that are Fatal by Month (graph) 17 Table 5 Primary Contributing Factor of Accidents & Casualties 18 Table 6 Machinery & Equipment Primary Contributing Factor of Accidents & Casualties 19 Figure 2 Primary Contributing Factor of Accidents (graph) 20 Figure 3 Primary Contributing Factor of Deaths (graph) 21 Figure 4 Primary Contributing Factor of Injuries (graph) 22 Table 7 Number of Vessels in Accidents by Vessel Type & Primary Contributing Factor 23 Table 8 Alcohol Use as a Contributing Factor in Accidents & Casualties by State Table 9 Vessel Operation at the Time of Accident 25 Table 10 Vessel Activity at the Time of Accident 25 Table 11 Weather & Water Conditions 26 Table 12 Time Related Data 27 Table 13 Vessel Information 28 Table 14 Rental Status of Vessels Involved in Accidents 29 Table 15 Number & Percentage of Deaths by Vessel Length 30 Figure 5 Number of Deaths by Vessel Length (graph) 30 Accident Types Tables with Explanation Table 16 Accident, Vessel & Casualty Numbers by Primary Accident Type 34 Table 17 Frequency of Accident Types in Accidents & Casualties Nationwide Table 18 Number of Vessels in Accidents by Vessel Length & Primary Accident Type 39 Table 19 Number of Vessels in Accidents by Vessel Type & Primary Accident Type 40 Table 20 Number of Vessels in Accidents by Primary Accident Type & Propulsion Type 41 Table 21 Number of Vessels in Accidents by Primary Accident Type & Engine Type 41 Operator/Passenger Information Tables with Explanation 43 Table 22 Operator Information 44 Table 23 Number of Deaths by Type of Operator Boating Instruction 45 Figure 6 Number of Deaths by Known Operator Instruction (graph) 45 Table 24 Number of Deaths by Vessel Type 46 Figure 7 Number of Deaths by Vessel Type (graph) 46 Table 25 Number of Deceased Victims by Age & Vessel Type 47 Table 26 Number of Injured Victims by Age & Vessel Type 48 Table 27 Nature of Primary Injury Type by Area of Injury 49 Casualty Summary Data Tables with Explanation 51 Figure 8 Deaths, Injuries & Accidents by Year, (graph) 52 Table 28 Deaths, Injuries & Accidents by Year, Table 29 Accident, Casualty & Damage Data by State 53 Figure 9 Distribution of 2008 Deaths by State Expressed as a Percentage 54 Figure 10 Annual Recreational Boating Fatality Rates Table 30 Annual Recreational Boating Fatality Rates Recreational Boating Statistics
4 Introduction & Executive Summary Figure 11 States Coded by their 2009 Fatality Rate 56 Table 31 Five-year Summary of Selected Accident Data by State 57 Table 32 Number of Accidents by Primary Accident Type & State Table 33 Number of Injured Victims by Primary Injury & Vessel Type 60 Table 34 Number of Fatal Victims by Life Jacket Wear, Cause of Death, & Vessel Type 60 Registration Data Tables with Explanation 62 Table 35 Recreational Vessels Registered by Year, Figure 12 Recreational Vessels Registered by Year, (graph) 63 Table 36 Recreational Vessel Registration by Length & Means of Propulsion 64 Table 37 Recreational Vessel Registration Data by State 65 Figure 13 Distribution of 2009 Recreational Vessel Registration by State 66 Boating Accident Report Form Glossary of Terms Glossary of State Codes 77 Recreational Boating Statistics
5 Introduction & Executive Summary List of Tables Table Executive Summary 7 Table 2 News Media Accidents and Casualties 8 Table 3 Non-Reportable Scenarios with their Casualty Count 12 Table 4 Percent of Accidents that are Fatal by Month 17 Table 5 Primary Contributing Factor of Accidents & Casualties 18 Table 6 Machinery & Equipment Primary Contributing Factor of Accidents & Casualties 19 Table 7 Number of Vessels in Accidents by Vessel Type & Primary Contributing Factor 23 Table 8 Alcohol Use as a Contributing Factor in Accidents & Casualties by State Table 9 Vessel Operation at the Time of Accident 25 Table 10 Vessel Activity at the Time of Accident 25 Table 11 Weather & Water Conditions 26 Table 12 Time Related Data 27 Table 13 Vessel Information 28 Table 14 Rental Status of Vessels Involved in Accidents 29 Table 15 Number and Percentage of Deaths by Vessel Length 30 Table 16 Accident, Vessel & Casualty Numbers by Primary Accident Type 34 Table 17 Frequency of Accident Types in Accidents & Casualties Nationwide Table 18 Number of Vessels in Accidents by Vessel Length & Primary Accident Type 39 Table 19 Number of Vessels in Accidents by Vessel Type & Primary Accident Type 40 Table 20 Number of Vessels in Accidents by Primary Accident Type & Propulsion Type 41 Table 21 Number of Vessels in Accidents by Primary Accident Type & Engine Type 41 Table 22 Operator Information 44 Table 23 Number of Deaths by Type of Operator Boating Instruction 45 Table 24 Number of Deaths by Vessel Type 46 Table 25 Number of Deceased Victims by Age & Vessel Type 47 Table 26 Number of Injured Victims by Age & Vessel Type 48 Table 27 Nature of Primary Injury Type by Area of Injury 49 Table 28 Deaths, Injuries & Accidents by Year, Table 29 Accident, Casualty & Damage Data by State 53 Table 30 Annual Recreational Boating Fatality Rates Table 31 Five-year Summary of Selected Accident Data by State 57 Table 32 Number of Accidents by Primary Accident Type & State Table 33 Number of Injured Victims by Primary Injury & Vessel Type 60 Table 34 Number of Fatal Victims by Life Jacket Wear, Cause of Death & Vessel Type 60 Table 35 Recreational Vessels Registered by Year, Table 36 Recreational Vessel Registration by Length & Means of Propulsion 64 Table 37 Recreational Vessel Registration Data by State 65 List of Figures Figure 1 Percent of Accidents that are Fatal by Month 17 Figure 2 Primary Contributing Factor of Accidents 20 Figure 3 Primary Contributing Factor of Deaths 21 Figure 4 Primary Contributing Factor of Injuries 22 Figure 5 Number of Deaths by Vessel Length 30 Figure 6 Percent of Deaths by Known Operator Instruction 45 Figure 7 Number of Deaths by Vessel Type 46 Figure 8 Deaths, Injuries & Accidents by Year, Figure 9 Distribution of 2009 Deaths by State Expressed as a Percentage 54 Figure 10 Annual Recreational Boating Fatality Rates Figure 11 States Coded by their 2009 Fatality Rate 56 Figure 12 Recreational Vessels Registered by Year, Figure 13 Distribution of 2009 Recreational Vessel Registration by State 66 Recreational Boating Statistics
6 Introduction & Executive Summary 2009 EXECUTIVE SUMMARY In 2009, the Coast Guard counted 4730 accidents that involved 736 deaths, 3358 injuries and approximately $36 million dollars of damage to property as a result of recreational boating accidents. The fatality rate was 5.8 deaths per 100,000 registered recreational vessels. This rate represents a 3.6% increase from last year s fatality rate of 5.6 deaths per 100,000 registered recreational vessels. Compared to 2008, the number of accidents decreased 1.23%, the number of deaths increased 3.81% and the number of injuries increased 0.81%. Almost three-fourths of all fatal boating accident victims drowned, and of those, eighty-four (84) percent were not reported as wearing a life jacket. Only fourteen percent of deaths occurred on boats where the operator had received boating safety instruction. Seven out of every ten boaters who drowned were using boats less than 21 feet in length. Operator inattention, operator inexperience, excessive speed, improper lookout and alcohol rank as the top five primary contributing factors in accidents. Alcohol use is the leading contributing factor in fatal boating accidents; it was listed as the leading factor in 16% of the deaths. Eighteen children under age thirteen lost their lives while boating in % of the children who died in 2009 died from drowning. 44% of those who drowned were wearing a life jacket as required to do so by state law. The most common types of vessels involved in reported accidents were open motorboats (46%), personal watercraft (22%), and cabin motorboats (14%). The 12,721,541 boats registered by the states in 2009 represent a 0.23% increase from last year when 12,692,892 boats were registered. Recreational Boating Statistics
7 Introduction & Executive Summary Table EXECUTIVE SUMMARY TOP FIVE PRIMARY ACCIDENT TYPES Accident Rank Accident Type Number of Accidents Number of Deaths 1 Collision with Recreational Vessel Number of Injuries 2 Skier Mishap Collision with Fixed Object Flooding/swamping Capsizing VESSEL TYPES WITH THE TOP CASUALTY NUMBERS Casualty Rank Type of Boat Drownings Other Total Deaths Deaths Total Injuries Total Casualties 1 Open Motorboat Personal Watercraft Cabin Motorboat Canoe/Kayak Pontoon LIFE JACKET WEAR BY TOP FIVE KNOWN CAUSES OF DEATH Known Cause of Death Rank Cause of Death Number of Deaths Life Jacket Worn Not Worn Unknown if worn 1 Drowning Trauma Cardiac Arrest Hypothermia Carbon Monoxide Poisoning TOP TEN KNOWN PRIMARY CONTRIBUTING FACTORS OF ACCIDENTS Accident Rank Contributing Factor Number of Accidents Number of Number of Deaths Injuries 1 Operator Inattention Operator Inexperience Excessive Speed Improper Lookout Alcohol Machinery Failure Weather Hazardous Waters Force of Wave/wake Rules of the Road Recreational Boating Statistics
8 Introduction & Executive Summary Mission and Strategic Plan of the National Recreational Boating Safety Program The mission of the National RBS Program is to ensure the public has a safe, secure, and enjoyable recreational boating experience by implementing programs that minimize the loss of life, personal injury, and property damage while cooperating with environmental and national security efforts. The Strategic Plan of the National Recreational Boating Safety Program delineates the Program s eleven objectives to reduce casualties which include 1) tracking and increasing the number of educated boaters; 2) increasing boating safety messages to target audiences; 3) increasing on-the-water boating instruction; 4) studying and increasing life jacket wear rates; 5) increasing knowledge of and compliance with navigation rules; 6) decreasing boating under the influence; 7) decreasing the number of defective vessels; 8) increasing boater compliance with vessel carriage requirements; 9) increasing the accuracy and reporting rates of reportable accidents; 10) conducting research and development of boating safety initiatives; and 11) measuring the effectiveness of state and non-profit organization grants. To view the Strategic Plan of the Program, please visit the Office s website at Overview of Statistics This report contains statistics on registered recreational vessels and boating accidents during calendar year Data used to compile the recreational boating accident statistics come from three sources: Boating Accident Report data forwarded to the Coast Guard by states with an approved casualty reporting system; and Reports of Coast Guard investigations of fatal boating accidents that occurred on waters under Federal jurisdiction. Recreational boating accident investigation data are used if submitted to the Coast Guard and are relied on as much as possible to provide accurate accident statistics. In the absence of investigation data, information is collected from the accident reports filed by boat operators; and. Reports received from news media sources that the Coast Guard did not receive investigative data on by the state. The following table reflects the number of accidents, deaths, injuries, and losses of vessels that were captured in news media sources that met reporting requirements for which the Coast Guard did not receive a report: Table 2 NEWS MEDIA ACCIDENTS AND CASUALTIES Accidents Deaths Injuries Losses of vessels Nationally Damages $2,082,545 Changes to the Publication Some of the tables in this edition of the Statistics have changed because of alterations to the content on the Coast Guard s Boating Accident Report (BAR) form. One of the most dramatic changes lies in the cause categories. Passenger/skier behavior and careless/reckless operation were removed from the latest BAR form because it was believed that the public would not report a negative behavior about themselves. Since these categories were removed from the Coast Guard form, they will not be reported in the national publication. For those jurisdictions that did not use the Coast Guard form to collect information and still used passenger/skier behavior and careless/reckless operation as a cause, the Coast Guard coded their cause according to the choices on the Coast Guard BAR form. An example of a case where the Coast Guard was able to code one of these causes to one available on the Coast Guard form is as follows: if a jurisdiction had selected passenger/skier behavior to describe an accident where an occupant stood up in a canoe which led to the capsizing of the vessel, the Coast Guard coded this cause as improper loading instead of passenger/skier behavior. An example of a case where the Coast Guard was not able to code one of these causes to a cause available on the Coast Guard form is as follows: Recreational Boating Statistics
9 Introduction & Executive Summary a passenger on a vessel became injured while jumping out of a vessel while it was in motion. In this case, the Coast Guard coded the accident as other and captured passenger/skier behavior in the other accident cause category. Careless/reckless operation was likewise coded such that when applicable, it was coded as Rules of the Road. In other cases, the cause was coded as other. The second change to the tables is the removal of Table 24, Life Jacket Information. Part of this table was removed because the Coast Guard no longer collects life jacket carriage equipment information in the same manner. The remaining part of this table was removed because the information in it was already presented in another table (Table 34). The third change to the tables in this edition is the merger of Tables 17 and 18, which address the series of events of accidents. An accident can be coded with up to three standardized fields that describe the order in which events occurred in an accident. Table 17 provided a snapshot of accident types with a casualty count for the latest five years of data whereas Table 18 provided a snapshot of the frequency of events in accidents with a resulting casualty count. Because the Coast Guard considers all events in a regulatory study, the Office decided that it would be important to present this information for public use. Thus, Table 17 now provides the frequency of accident events with a casualty count for the latest five years of data. The final major change was the addition of a table to describe injuries. With the implementation of the latest Coast Guard BAR form, the injury section was reorganized to focus on two fields, the nature of most serious injury and the body part of the most serious injury. Thus, a crosstab table (Table 27 - Nature of Primary Injury Type by Area of Injury ) was created to present the types of injuries by area of injury. Accident Reporting as Required by Federal Law Under federal regulations (33 CFR Part 173; Subpart C Casualty and Accident Reporting) the operator of any numbered vessel that was not required to be inspected or a vessel that was used for recreational purposes is required to file a BAR when, as a result of an occurrence that involves the vessel or its equipment: 1. A person dies; or 2. A person disappears from the vessel under circumstances that indicate death or injury; or 3. A person is injured and requires medical treatment beyond first aid; or 4. Damage to vessels and other property totals $2,000 or more; or 5. There is a complete loss of any vessel. If the above conditions are met, the federal regulations state that the operator or owner must report their accident to a state reporting authority, abbreviated in this publication as state. The reporting authority can be either the state where the accident occurred, the state in which the vessel was numbered, or, if the vessel does not have a number, the state where the vessel was principally used. The owner must submit the report if the operator is deceased or unable to make the report. The regulations also state the acceptable length of time in which the accident report must be submitted to the reporting authority. Boat operators or owners must submit: 1. Accident reports within 48 hours of an occurrence if: a. A person dies within 24 hours of the occurrence; or b. A person requires medical treatment beyond first aid; or c. A person disappears from the vessel. 2. Accident reports within 10 days of an occurrence if there is damage to the vessel/property only. The minimum reporting requirements are set by Federal regulation, but states are allowed to have more stringent requirements. For example, some states have a lower threshold for reporting damage to vessels and other property. Recreational Boating Statistics
10 Introduction & Executive Summary Federal Regulations (33 CFR ) require accident report data to be forwarded to Coast Guard Headquarters within 30 days of receipt by a state. The statistics in this publication cover boating accidents reported on waters of joint federal and state jurisdiction and exclusive state jurisdiction. Most states use Boating Accident Report forms that are similar to the Coast Guard form. A copy of the Coast Guard BAR form used for this report is on pages This Coast Guard form was approved by the Office of Management and Budget in the summer of was the first year that the form was used for data collection on a national basis. Casualty and Accident Reporting Guidelines Casualty and accident reporting applies to each vessel used by its operator for recreational purposes or vessels that are required to be numbered and are not subject to inspection. The term vessel includes every description of watercraft or other artificial contrivance used, or capable of being used, as a means of transportation on the water. Terms used to describe the various types of watercraft are: airboats, auxiliary sailboats, cabin motorboat, canoe, houseboat, inflatable boat, kayak, open motorboat, personal watercraft, pontoon boat, raft, rowboat, and sailboat. Unmodified inner tubes have not been determined to be vessels to date and thus any accident that only involves an unmodified inner tube has not been included in the statistics in the main body of this report. Reportable Boating Accidents A vessel is considered to be involved in a boating accident whenever a death, missing person, personal injury, property damage, or total vessel loss results from the vessel's operation, construction, seaworthiness, equipment, or machinery. The following are examples of accident types that are used in this report: Grounding, capsizing, sinking, or flooding/swamping Falls in or overboard a vessel Persons ejected from a vessel Fire or explosions that occur while underway and while anchored, moored or docked if the fire resulted from the vessel or vessel equipment. Water-skiing or other mishap involving a towable device Collision with another vessel or object Striking a submerged object A person struck by a vessel, propeller, propulsion unit, or steering machinery Carbon monoxide exposure Electrocution due to stray current related to a vessel Casualties while swimming from a vessel that is not anchored, moored or docked. Casualties where natural causes served as a contributing factor in the death of an individual but the determined cause of death was drowning. Casualties from natural phenomena such as interaction with marine life (i.e. leaping sturgeon causes casualty to person) and interaction with nature (i.e. mountain side falls onto vessel causing casualties). Casualties where a person falls off an anchored vessel. Recreational Boating Statistics
11 Introduction & Executive Summary Non-Reportable Boating Accidents Not every occurrence involving a vessel is considered within the scope of the National Recreational Boating Safety Program. The following occurrences involving a vessel may be required to be reported to the state, but for statistical purposes are excluded from this report and are considered non-reportable boating accidents: A person dies, is injured, or is missing as a result of self-inflicted wounds, alcohol poisoning, gunshot wounds, or the ingestion of drugs, controlled substances or poison. A person dies, is injured, or is missing as a result of assault by another person or persons while aboard a vessel. A person dies or is injured from natural causes while aboard a vessel. A person dies, is injured, or is missing as a result of jumping, diving, or swimming for pleasure from an anchored, moored or docked vessel. A person dies, is injured, or is missing as a result of swimming to retrieve an object or a vessel that is adrift from its mooring or dock, having departed from a place of inherent safety, such as the shore or pier. Property damage occurs or a person dies, is injured, or is missing while preparing a vessel for launching or retrieving and the vessel is not on the water and capable / ready for its intended use. Property damage occurs or a person dies, is injured, or is missing as a result of a fire on shore or a pier that spreads to a vessel or vessels. Property damage occurs to a docked or moored vessel or a person dies, is injured, or is missing from such a vessel as a result of storms, or unusual tidal or sea conditions; or when a vessel gets underway in those conditions in an attempt to rescue persons or vessels. Property damage occurs to a docked or moored vessel due to lack of maintenance on the vessel. Property damage occurs to a docked or moored vessel due to theft or vandalism. Property damage occurs to, a person dies or is injured on, or a person is missing from a non -propelled houseboat or other vessel used primarily as a residence when such a vessel is not underway. Casualties that result from falls from or on docked vessels or vessels that are moored to a permanent structure. Casualties that result from a person climbing aboard an anchored vessel from the water or swimming near an anchored vessel. Fire or explosions on anchored, docked or moored boats where the cause of the fire was not attributed to the vessel or vessel equipment. Casualty or damage that results when the vehicle used for trailering the vessel fails. Casualties or damage that occur during accidents that only involve unmodified inner tubes. Casualties or damage that occur when the only vessel(s) involved are being used solely for governmental, commercial or criminal activity. Casualties or damage that occur when the only vessel(s) involved are not numbered and are being used exclusively for racing. Casualties or damage that occur when the only vessel(s) involved are foreign vessels and thus not subject to U.S. federal reporting requirements. Recreational Boating Statistics
12 Introduction & Executive Summary Table 3 Non-Reportable Scenarios with their Casualty Count Does not meet Coast Guard Policy Accidents Deaths Injuries Vessels Vessels Lost Damages Swimming for pleasure from an anchored, moored or docked vessel $0.00 Swimming to retrieve an object or a vessel that is adrift from its mooring or dock, having departed from a place of inherent safety such as a shore or pier $0.00 Unmodified inner tubes $0.00 Vessels involved are being used solely for governmental, commercial, or criminal activity Climbing aboard an anchored vessel from the water or swimming near an anchored boat $1,593, $0.00 Falls from or on a docked vessel or vessel $0.00 that is moored to a permanent struc- ture Vehicle used for trailering the vessel fails $ Vessel exclusively for racing $150, Fire or explosion on anchored, docked or $60, moored boats where the cause of the fire was not attributed to the vessel or vessel equipment Foreign vessel $3,000, A person dies or is injured from natural causes while aboard a vessel $0.00 Property damage occurs to a docked or $386, moored vessel due to lack of maintenance on the vessel Property damage occurs to a docked or $302, moored vessel or a person dies, is injured, or is missing from such a vessel as a result of storms, or unusual tidal or sea conditions; or when a vessel gets underway in those conditions in an attempt to rescue person Property damage occurs to, a person dies $64, or is injured on, or a person is missing from a non-propelled houseboat or other vessel used primarily as a residence when such a vessel is not underway Does not meet federal reporting $491, requirements Total $6,047, Recreational Boating Statistics
13 Introduction & Executive Summary Use of Statistics Following are some important points that users of these statistics need to be aware of: 1. An approved casualty reporting system does not include every accident involving a vessel that is being used for recreational purposes. Some accidents are not in the system because they are not required to be reported. Many accidents are not reported because boaters are not aware of the accident reporting regulations or fail to comply with such regulations. In an attempt to make sure all fatal boating accidents are captured by the casualty reporting system and required data are input into the Boating Accident Report Database (BARD) System, the Coast Guard notifies and provides information from its Marine Information for Safety and Law Enforcement (MISLE) system to state Boating Law Administrators (BLAs) of fatal accidents that occurred in their state. The Coast Guard also sends news media stories to state BLAs on fatal and non-fatal boating accidents that occur in their state to capture accidents that may have been missed. 2. Federal regulations do not require the reporting of accidents on private waters where states have no jurisdiction. Reports of accidents on such waters are included in this report when received by the Coast Guard if they satisfy the other requirements for inclusion. 3. Non-fatal accidents cannot be assumed to have occurred in numbers proportional to the reported statistics because the act of reporting an accident is not a random sampling of accidents in the statistical sense. Rather, selection is based on the ability and willingness of those involved to file a report. 4. The fluctuations in non-fatal accident statistics from year to year may be caused by factors other than the change in the total number of recreational boating accidents. A small change in the low reporting rate may cause a relatively large change in the statistics. The statistics in this publication are based on accident data submitted by reporting states as of March 5, 2010 with subsequent updates as information is reviewed and standardized. This publication covers only accidents meeting the aforementioned reporting requirements. Recreational Boating Statistics
14
15 Accident Causes & Conditions Explanation of Accident Causes and Conditions Section The following seventeen tables and figures focus on the causes of accidents with a special focus on alcohol use, the operation and activity at the time of accident, weather and water conditions, vessel information, and the time of accidents. Percent of Accidents that are Fatal by Month (Table 4 & Figure 1, Page 17) This table provides information about total accidents, fatal accidents, non-fatal accidents, and deaths. The figure focuses on the percent of fatal accidents by month. As a background note, fatal accidents are accidents that involve at least one death. For example, a fatal accident could be a capsizing that resulted in three deaths. It was an accident that had at least one death. Primary Contributing Factor of Accidents & Casualties (Table 5, Page 18) The "contributing factors" of an accident are the causes of the accident. In the Coast Guard's national accident reporting database, there are allowances for up to four causes. This table reflects the first cause listed for all accidents, deaths and injuries nationwide. For the purposes of displaying information in a simplified manner, the Coast Guard divided the contributing factor categories into five larger categories: operation of vessel, loading of passengers or gear, environment, failure of vessel or vessel equipment, and miscellaneous. These five categories are situated in the leftmost column of the table and have the total number of accidents, deaths, and injuries associated with each category under the category name. Machinery & Equipment Primary Contributing Factor of Accidents & Casualties (Table 6, Page 19) This table reflects the number of accidents, deaths, and injuries where machinery or equipment failure was listed as a first cause of the accident. The table also delineates the different types of failure that were listed. Primary Contributing Factor of Accidents (Figure 2, Page 20) This figure reflects the first cause of accidents for all accidents nationwide. Primary Contributing Factor of Deaths (Figure 3, Page 21) This table reflects the first cause listed for all deaths. Primary Contributing Factor of Injuries (Figure 4, Page 22) This table reflects the first cause listed for all injuries. Number of Vessels in Accidents by Vessel Type & Primary Contributing Factor (Table 7, Page 23) This table looks at the number of vessels involved in accidents by vessel type and the primary cause of the accident. Alcohol Use as a Contributing Factor in Accidents & Casualties by State (Table 8, Page 24) This table reflects a tally of all four causes of accidents listed for all national accidents, deaths and injuries. This table lists accidents where alcohol use by the vessel s occupants was listed as a direct or indirect cause of the accident. There are other cases in the national database where alcohol use is listed as being involved in the accident but it was not determined to be a cause of the accident. Vessel Operation at the Time of Accident (Table 9, Page 25) This table focuses on the vessel and victim operation at the time of the accident. The table lists information about the number of vessels involved, the resulting number of deaths and the resulting number of Recreational Boating Statistics
16 Accident Causes & Conditions injuries. Vessel Activity at the Time of Accident (Table 10, Page 25) This table examines the vessel and victim activity at the time of the accident. The table provides information about the number of vessels involved, the resulting number of deaths, and the resulting number of injuries. Weather & Water Conditions (Table 11, Page 26) This table documents some of the environmental characteristics of national accidents. It focuses on accidents, deaths and injuries by type of body of water, water conditions, wind level, visibility, and water temperature. Time Related Data (Table 12, Page 27) These three sections independently examine time-related information for national accidents, deaths and injuries. The top section documents the number of accidents, deaths and injuries that occurred during a time frame. The middle section documents the number of accidents, deaths and injuries that occurred during a given month. Finally, the bottom section documents the number of accidents, deaths and injuries that occurred during a given day of the week. These sections each examine the national data separately and should not be combined to draw conclusions. For instance, one cannot use them to deduce that the majority of accidents occur from 2:31 pm- 4:30 pm in July on the weekends. However, you could deduce that 2:31 pm-4:30 pm was the time frame that accidents occurred during calendar year Furthermore, the month with the highest number of accidents was July. Finally, the two days of the week with the greatest number of accidents were Saturday and Sunday. Vessel Information (Table 13, Page 28) This table documents some of the characteristics of vessels involved in accidents nationwide. It provides information about the number of accidents, deaths and injuries by speed, horsepower, year built, length, and hull material. Rental Status of Vessels Involved in Accidents (Table 14, Page 29) This table examines whether a vessel involved in an accident was rented. It also provides information on whether deaths and injuries occurred on rented vessels. Number & Percentage of Deaths by Vessel Length (Figure 5 & Table 15, Page 30) This table focuses on the number of deaths by vessel length. Deaths are categorized into drownings and non-drownings. The table also provides a percentage of all deaths that were caused by drowning. Recreational Boating Statistics
17 Accident Causes & Conditions 30% 25% 20% 15% 10% 5% 0% Figure 1 PERCENT OF ACCIDENTS THAT ARE FATAL BY MONTH 2009 Table 4 PERCENT OF ACCIDENTS THAT ARE FATAL BY MONTH 2009 Month Fatal Accidents Non-Fatal Accidents Total Accidents Accidents Resulting in Deaths Total Deaths January % 17 February % 28 March % 31 April % 63 May % 97 June % 109 July % 124 August % 108 September % 54 October % 52 November % 30 December % 23 Total % 736 Recreational Boating Statistics
18 Accident Causes & Conditions Accidents Deaths Injuries Operation of Vessel Alcohol Use ,556 Accidents 269 Deaths 2,124 Injuries Drug Use Excessive Speed Failure to Ventilate Improper Lookout Inadequate On-board Navigation Lights Operator Inattention Operator Inexperience Restricted Vision Rules of the Road Infraction Sharp Turn Starting in Gear Loading of Passengers or Gear Improper Anchoring Accidents 88 Deaths 86 Injuries Table 5 PRIMARY CONTRIBUTING FACTOR OF ACCIDENTS & CASUALTIES 2009 Improper Loading/Weight Distribution Overloading People on Gunwale, Bow or Transom Failure of Boat or Boat Equipment Equipment Failure Accidents 14 Deaths Hull Failure Injuries Machinery Failure Environment Congested Waters Accidents 187 Deaths Dam/Lock Injuries Force of Wave/Wake Hazardous Waters Missing or Inadequate Navigation Aids Weather Miscellaneous 828 Accidents 178 Deaths 550 Injuries Ignition of Spilled Fuel or Vapor Carbon Monoxide Sudden Medical Condition Other Unknown All Categories Combined Recreational Boating Statistics
19 Accident Causes & Conditions Table 6 MACHINERY & EQUIPMENT PRIMARY CONTRIBUTING FACTOR OF ACCIDENTS & CASUALTIES 2009 Accidents Deaths Injuries Electrical System Failure Engine Failure Exhaust System Failure Fuel System Failure Machinery Failure Shift Failure Steering System Failure Throttle Failure Ventilation System Failure Other Not Specified Auxiliary Equipment Failure Fire Extinguisher Failure Equipment Failure Sail Dismasting Seat Broke Loose Other Not specified Recreational Boating Statistics
20 Accident Causes & Conditions Figure 2 PRIMARY CONTRIBUTING FACTOR OF ACCIDENTS Operation of Vessel Loading of Passengers or Gear Failure of Boat or Boat Equipment Environment Miscellaneous Operator Inattention Operator Inexperience Excessive Speed Improper Lookout Alcohol Use Rules of the Road Infraction Restricted Vision Sharp Turn Failure to Ventilate Inadequate On board Navigation Lights Starting in Gear Drug Use Improper Loading/Weight Distribution Overloading People on Gunwale, Bow or Transom Improper Anchoring Machinery Failure Equipment Failure Hull Failure Weather Hazardous Waters Force of Wave/Wake Missing or Inadequate Navigation Aids Congested Waters Dam/Lock Other Unknown Ignition of Spilled Fuel or Vapor Sudden Medical Condition Carbon Monoxide Recreational Boating Statistics
21 Accident Causes & Conditions Figure 3 PRIMARY CONTRIBUTING FACTOR OF DEATHS Operation of Vessel Loading of Passengers or Gear Failure of Boat or Boat Equipment Environment Miscellaneous Alcohol Use Operator Inattention Operator Inexperience Excessive Speed Improper Lookout Rules of the Road Infraction Sharp Turn Restricted Vision Drug Use Inadequate On board Navigation Lights Starting in Gear Failure to Ventilate Improper Loading/Weight Distribution Overloading People on Gunwale, Bow or Transom Improper Anchoring Machinery Failure Equipment Failure Hull Failure Hazardous Waters Weather Force of Wave/Wake Dam/Lock Congested Waters Missing or Inadequate Navigation Aids Unknown Other Sudden Medical Condition Ignition of Spilled Fuel or Vapor Carbon Monoxide Recreational Boating Statistics
22 Accident Causes & Conditions Figure 4 PRIMARY CONTRIBUTING FACTOR OF INJURIES Operation of Vessel Loading of Passengers or Gear Failure of Boat or Boat Equipment Environment Miscellaneous Operator Inattention Excessive Speed Alcohol Use Operator Inexperience Improper Lookout Rules of the Road Infraction Restricted Vision Sharp Turn Failure to Ventilate Inadequate on board navigation lights Drug Use Starting in Gear Improper Loading/Weight Distribution People on gunwale, bow or transom Overloading Improper Anchoring Machinery Failure Equipment Failure Hull Failure Force of Wave/Wake Weather Hazardous Waters Congested Waters Missing or inadequate navigation aid Dam/Lock Other Ignition of Spilled Fuel or Vapor Unknown Carbon Monoxide Sudden Medical Condition Recreational Boating Statistics
23 Accident Causes & Conditions Table 7 NUMBER OF VESSELS IN ACCIDENTS BY VESSEL TYPE & PRIMARY CONTRIBUTING FACTOR 2009 Unknown Other Weather Sudden Medical Condition Starting in Gear Sharp Turn Rules of the Road Infraction Restricted Vision People on Gunwale, Bow or Transom Overloading Operator Inexperience Operator Inattention Missing or Inadequate Navigation Aids Machinery Failure Inadequate On board Navigation Lights Improper Lookout Improper Loading Improper Anchoring Ignition of Fuel or Vapor Hull Failure Hazardous Waters Force of Wave/Wake Failure to Ventilate Excessive Speed Equipment Failure Drug Use Dam/lock Congested Waters Carbon Monoxide Exposure Alcohol Use All Contributing Factors All Vessels Airboat Auxiliary Sailboat Cabin Motorboat Canoe Houseboat Inflatable Kayak Open Motorboat Personal Watercraft Pontoon Boat Rowboat Sailboat Only Sailboat (unknown) Other Unknown Recreational Boating Statistics
24 Accident Causes & Conditions Table 8 ALCOHOL USE AS A CONTRIBUTING FACTOR IN ACCIDENTS & CASUALTIES BY STATE Accidents Deaths Injuries USA AL AK AZ AR CA CO CT DE DC FL GA HI ID IL IN IA KS KY LA ME MD MA MI MN MS MO MT NE NV NH NJ NM NY NC ND OH OK OR PA RI SC SD TN TX UT VT VA WA WV WI WY GU PR VI AS CNMI AT GL PC Recreational Boating Statistics
25 Accident Causes & Conditions Table 9 VESSEL OPERATION AT THE TIME OF ACCIDENT 2009 Vessels Involved Deaths Injuries Totals At Anchor Being Towed Changing Direction Changing Speed Cruising Docking/Undocking Drifting Idling Launching/Loading Rowing/Paddling Sailing Tied to Dock/Moored Towing Trolling Other Unknown Table 10 VESSEL ACTIVITY AT THE TIME OF ACCIDENT 2009 Vessels Involved Deaths Injuries Totals Boating/Relaxation Commercial Fishing Fueling Hunting Racing Repairs Starting Engine Swimming/Snorkeling Towed Watersports Towing Whitewater Other None; not in operation Unknown Recreational Boating Statistics
26 Accident Causes & Conditions TYPE OF BODY OF WATER WATER CONDITIONS WIND VISIBILITY WATER TEMPERATURE Table 11 WEATHER AND WATER CONDITIONS 2009 Accidents Deaths Injuries Lakes, Ponds, Reservoirs, Dams, Gravel Pits Rivers, Streams, Creeks, Swamps, Bayous Bays, Inlets, Marinas, Sounds, Harbors, Channels, Canals, Sloughs, Coves Ocean/Gulf Great Lakes (not tributaries) Unknown Calm (waves less than 6") Choppy (waves 6" to 2') Rough (waves 2' to 6') Strong Current Very Rough (waves larger than 6') Unknown None Light (0-6 mph) Moderate (7-14 mph) Strong (15-25 mph) Storm (over 25 mph) Unknown Poor - Day Poor - Night Poor - Unknown if day or night Fair - Day Fair - Night Good - Day Good - Night Good- Unknown if day or night Unknown - Day Unknown - Night Unknown - Unknown if day or night degrees F and below degrees F degrees F degrees F degrees F degrees F degrees F and above Unknown Recreational Boating Statistics
27 Accident Causes & Conditions Time of Day Month of Year Day of Week Table 12 TIME RELATED DATA 2009 Accidents Deaths Injuries :00 am to 2:30 am :31 am to 4:30 am :31 am to 6:30 am :31 am to 8:30 am :31 am to 10:30 am :31 am 12:30 pm :31 pm to 2:30 pm :31 pm to 4:30 pm :31 pm to 6:30 pm :31 pm to 8:30 pm :31 pm to 10:30 pm :31 pm to 11:59 pm Unknown January February March April May June July August September October November December Sunday Monday Tuesday Wednesday Thursday Friday Saturday Recreational Boating Statistics
28 Accident Causes & Conditions Hull Material Speed Horsepower Year Built Length Table 13 VESSEL INFORMATION 2009 Vessels Involved Deaths Injuries Aluminum Fiberglass Plastic Rubber/Vinyl/Canvas Steel Wood Other Unknown Not Moving Under 10 mph to 20 mph to 40 mph Over 40 mph Unknown No Engine hp or less hp hp hp hp Over 250 hp Unknown Prior to Unknown Less than 16 feet feet to <26 feet feet to<40 feet feet to 65 feet More than 65 feet Unknown Recreational Boating Statistics
29 Accident Causes & Conditions # of Vessels Rented Table 14 RENTAL STATUS OF VESSELS INVOLVED IN ACCIDENTS Vessels Deaths Injuries Not Rented Unknown if rented # of Deaths Rented Not rented Unknown if rented # of Injuries Rented Not rented All Vessels Airboat Auxiliary Sailboat Cabin Motorboat Canoe Houseboat Inflatable Kayak Open Motorboat Personal Watercraft Pontoon Boat Rowboat Sailboat (only) Sailboat (unknown) Other Unknown Unknown if rented Recreational Boating Statistics
30 Accident Causes & Conditions Figure 5 NUMBER OF DEATHS BY VESSEL LENGTH 2009 Deaths by Causes other than Drowning Drownings <16' 16-<26' 26-<40' 40-<65' >65' Unknown Table 15 NUMBER & PERCENTAGE OF DEATHS BY VESSEL LENGTH Length Drownings Deaths by Causes other than Drowning Total Deaths Percent of Deaths from Drowning <16' % 16-<26' % 26-<40' % 40-<65' % >65' % Unknown % Total % Recreational Boating Statistics
31
32 Accident Types Explanation of Accident Types Section The following section contains six tables that examine data related to the events, called accident types, in accidents. The tables focus on these events and break down information by state, vessel type, vessel length, engine type, and propulsion. In the Coast Guard's national database, there are four fields that can be used to define the series of events in an accident. By events, we mean the series of occurrences that passed during an accident. If a wave broke over a vessel causing it to take on water, capsize, and eject its occupant, the Coast Guard would categorize this accident by three events. First, there was a flooding/swamping. Then, there was a capsizing. Third, there was an "ejected from vessel." With the exception of one table, the tables and figures in this report focus only on the first event in the sequence. The rationale for providing only the first accident type is to keep the tables simplistic; if we added the second, third, and fourth events in the boating sequence, our accident, casualty, and damage totals would not match up because they would be double-counting the accidents, casualties, and damages for cases that had more than one event. Accident, Vessel & Casualty Numbers by Primary Accident Type (Table 16, Page 34) This table focuses on the first event in a boating accident and provides information on the number of accidents, vessels, and casualties attributed to that first event. The deaths section is also separated by the categories drownings and non-drownings. Five-year Summary of Frequency of Events in Accidents & Casualties Nationwide (Table 17, Pages 35-38) As mentioned in the introductory paragraph, there are four fields that can be used to define the series of events in an accident. This table focuses on the first three events in an accident and the number of casualties associated with each event. The Coast Guard leaves out the fourth because it is not a standardized field. Using the example in the opening paragraphs, the flooding/swamping would fall under the intersection of the column "First Event in an Accident" and the row "Flooding/swamping. The capsizing would be marked under the column "Second Event in an Accident" and the row "Capsizing". Finally, the ejection would be marked under the column "Third Event in an Accident" and the row "Ejected from Vessel. This table focuses on the frequency that these events occurred nationally and the total number of deaths that were associated with each accident type. If we turn back to our example and focus on deaths as a result of flooding/swamping, we see that there were 436 accidents where flooding/swamping was the first event in the boating accident. There were 99 deaths associated with this first event type. However, there were other accidents that involved a flooding/swamping as a second or third occurrence. There were 151 accidents and 19 deaths associated with flooding/swamping as a second event and 30 accidents and 4 deaths associated with flooding/swamping as a third event. All combined, you get the sixth column of the table that looks at how many deaths were associated with an event that occurred either as the first, second, or third occurrence in an accident. In the example, there were 617 accidents and 122 deaths associated with flooding/swamping as a first, second, or third event. This table can be difficult to understand, especially when the reader is under the expectation that the tallies of the casualty columns will equal the numbers published at the front of this report that reference the number of reportable accidents and deaths. Number of Vessels in Accidents by Vessel Length & Primary Accident Type (Table 18, Page 39) This table displays the types of accidents by the length of vessel. The table lists vessel length by foot for vessels of lengths 4 ft-39 ft. After 39 ft, information is categorized in ranges. This table also provides information about the number of casualties and vessels associated by length of vessel. Recreational Boating Statistics
33 Accident Types Number of Vessels in Accidents by Vessel Type & Primary Accident Type (Table 19, Page 40) This table examines the first event of a boating accident for all vessels involved in an accident. It also provides information about the casualties associated with each vessel type. Number of Vessels in Accidents by Primary Accident Type & Propulsion Type (Table 20, Page 41) This table provides information about the number of vessels involved in accidents by primary accident type, propulsion, and engine type. Number of Vessels in Accidents by Primary Accident Type & Engine Type (Table 21, Page 41) This table provides information about the number of casualties and vessels associated by propulsion, engine and primary accident type. Recreational Boating Statistics
34 Accident Types Table 16 ACCIDENT, VESSEL & CASUALTY NUMBERS BY PRIMARY ACCIDENT TYPE 2009 Accidents Vessels Involved Drowning Deaths Other Deaths Total Deaths Total Injuries Damages All Accident Types $35,903, Capsizing $1,153, Carbon Monoxide Exposure $0 Collision with Fixed Object $4,391, Collision with Floating Object $562, Collision with Commercial Vessel $309, Collision with Governmental Vessel $7, Collision with Recreational Vessel $6,975, Collision with Submerged Object $1,469, Departed Vessel $40, Ejected from Vessel $405, Electrocution $0 Fall in Vessel $15, Falls Overboard $57, Fire/Explosion (fuel) $4,641, Fire/Explosion (non-fuel) $6,269, Fire/Explosion (unknown origin) $1,646, Flooding/Swamping $4,178, Grounding $3,623, Person Struck by Propeller $2, Person Struck by Vessel $6, Sinking $34, Skier Mishap $3, Other $107, Unknown $2, Recreational Boating Statistics

35 Accident Types Table 17 FREQUENCY OF EVENTS IN ACCIDENTS & CASUALTIES NATIONWIDE 2009 First Event in an Accident Second Event in an Accident Third Event in an Accident Total Times Event Occurred in all Accidents Deaths Associated with Event in all Accidents Injuries Associated with Event in all Accidents Damages Associated with Event in all Accidents Capsizing $2,694, Carbon Monoxide Poisoning $0 Collision with Fixed Object $5,331, Collision with Floating Object $579, Collision with Commercial Vessel $315, Collision with Governmental Vessel $7, Collision with Recreational Vessel $7,490, Collision with Submerged Object $1,573, Departure from Vessel $843, Ejected from Vessel $3,717, Electrocution $40, Fall in Vessel $1,692, Falls Overboard $144, Fire/Explosion (fuel) $5,692, Fire/Explosion (non fuel) $6,917, Fire/Explosion (unknown origin) $1,646, Flooding $7,493, Grounding $4,533, Person Struck by Propeller $58, Person Struck by Vessel $619, Sinking $7,221, Skier Mishap $5, Other $120, Unknown $1,648, Capsizing $3,215, Carbon Monoxide Poisoning $0 Collision with Fixed Object $5,394, Collision with Floating Object $801, Collision with Vessel $9,000, Departed Vessel $914, Ejected from Vessel $4,029, Electrocution $0 Recreational Boating Statistics
36 Accident Types Table 17 Continued FREQUENCY OF EVENTS IN ACCIDENTS & CASUALTIES NATIONWIDE 2008 Continued 2007 First Event in an Accident Second Event in an Accident Third Event in an Accident Total Times Event Occurred in all Accidents Deaths Associated with Event in all Accidents Injuries Associated with Event in all Accidents Damages Associated with Event in all Accidents Fall in Boat $1,280, Fall on Boat $45, Falls Overboard $583, Fire/Explosion (fuel) $4,548, Fire/Explosion (non fuel) $3,800, fire/explosion (unknown origin) $15,980, Flooding/Swamping $10,378, Grounding $5,323, Sinking $6,725, Skier mishap $121, Struck by Vessel $800, Struck by Propeller $89, Struck Submerged Object $4,094, Other $350, Unknown $ Capsizing $2,392, Carbon Monoxide Poisoning $0 Collision with Fixed Object $9,501, Collision with Floating Object $2,680, Collision with Vessel $11,938, Departure from vessel $460,600 Ejected from vessel $2,283,453,55 Electrocution $0 Falls in Vessel $771, Falls on Vessel $85, Falls Overboard $1,637, Fire/Explosion (fuel) $3,027, Fire/Explosion (non fuel) $7,207, fire/explosion (unknown origin) $340, Flooding/Swamping $9,562, Recreational Boating Statistics
37 Accident Types Table 17 Continued FREQUENCY OF EVENTS IN ACCIDENTS & CASUALTIES NATIONWIDE 2007 continued First Event in an Accident Second Event in an Accident Third Event in an Accident Total Times Event Occurred in all Accidents Deaths Associated with Event in all Accidents Injuries Associated with Event in all Accidents Damages Associated with Event in all Accidents Grounding $7,466, Sinking $10,170, Skier mishap $28, Struck by Vessel $398, Struck by Motor/Propeller $75, Struck Submerged Object $7,392, Other $255, Unknown $68, Capsizing $1,845, Carbon Monoxide Poisoning $99, Collision with Fixed Object $5,099, Collision with Floating Object $1,274, Collision with Vessel $9,812, Departure from vessel $32, Ejected from vessel $572, Electrocution $0 Falls in Vessel $567, Falls on Vessel $9, Falls Overboard $1,673, Fire/Explosion (fuel) $6,094, Fire/Explosion (non fuel) $13,391, Flooding/Swamping $4,148, Grounding $3,992, Sinking $6,948, Skier Mishap $3, Struck by Vessel $774, Struck by Motor/propeller $176, Struck Submerged Object $2,361, Other $14,237, Unknown $21, Recreational Boating Statistics
38 Accident Types Table 17 Continued FREQUENCY OF EVENTS IN ACCIDENTS & CASUALTIES NATIONWIDE 2005 First Event in an Accident Second Event in an Accident Third Event in an Accident Total Times Event Occurred in all Accidents Deaths Associated with Event in all Accidents Injuries Associated with Event in all Accidents Damages Associated with Event in all Accidents Capsizing $3,400, Carbon Monoxide Poisoning $0 Collision with Fixed Object $5,065, Collision with Floating Object $1,172, Collision with Vessel $10,624, Departure from vessel $ Ejected from vessel $97, Falls in Vessel $690, Falls on Vessel $31, Falls Overboard $1,668, Fire/Explosion (fuel) $3,854, Fire/Explosion (non fuel) $2,115, Flooding $3,638, Grounding $4,340, Sinking $5,279, Skier Mishap $28, Struck by Vessel $870, Struck by Motor/Propeller $246, Struck Submerged Object $1,817, Other $2,476, Unknown $623, Recreational Boating Statistics
39 Accident Types Table 18 NUMBER OF VESSELS IN ACCIDENTS BY VESSEL LENGTH & PRIMARY ACCIDENT TYPE Injuries Total Deaths Other Deaths Drownings Unknown Other Skier Mishap Sinking Person Struck by Vessel Person Struck by Propeller Grounding Flooding/ Swamping Fire/Explosion (unknown) Fire/Explosion (non-fuel) Fire/Explosion (fuel) Falls Overboard Fall in Boat Electrocution Ejected from Vessel Departed Vessel Collision with Submerged Object Collision with Recreational Vessel Collision with Governmental Vessel Collision with Commercial Vessel Collision with Floating Object Collision with Fixed Object Carbon Monoxide Capsizing Total Vessels Involved All lengths feet feet feet feet feet feet feet feet feet feet feet feet Under 16 ft feet feet feet feet feet feet feet feet feet feet ft to less than 26 ft feet feet feet feet feet feet feet feet feet feet feet feet feet feet ft to less than 40 ft ft to 65 ft Over 65 ft Unknown Recreational Boating Statistics
 Fire/Explosion")
40 Accident Types Table 19 NUMBER OF VESSELS IN ACCIDENTS BY VESSEL TYPE & PRIMARY ACCIDENT TYPE WITH NUMBER OF CASUALTIES BY CASUALTY TYPE & VESSEL TYPE 2009 Injuries Total Deaths Deaths by Causes other than Drowning Drownings Unknown Other Skier Mishap Sinking Person Struck by Vessel Person Struck by Propeller Grounding Flooding/Swamping Fire/Explosion (unknown origin) Fire/Explosion (non-fuel) Fire/Explosion (fuel) Falls Overboard Fall in Vessel Electrocution Ejected from Vessel Departed Vessel Collision with Submerged Object Collision with Recreational Vessel Collision with Governmental Vessel Collision with Commercial Vessel Collision with Floating Object Collision with Fixed Object Carbon Monoxide Exposure Capsizing All Accident Types All boats Airboat Auxiliary Sailboat Cabin Motorboat Canoe Houseboat Inflatable Kayak Open Motorboat Personal Watercraft Pontoon Boat Rowboat Sail (only) Sailboat (unknown) Other Unknown Recreational Boating Statistics
41 Accident Types Table 20 NUMBER OF VESSELS IN ACCIDENTS BY PRIMARY ACCIDENT TYPE & PROPULSION TYPE Injuries Total Deaths Other Deaths Drownings Unknown Other Skier Mishap Sinking Person Struck by Vessel Person Struck by Propeller Grounding Flooding/Swamping Fire or Explosion (unknown origin) Fire or Explosion (non-fuel) Fire or Explosion (fuel) Falls Overboard Fall in Vessel Electrocution Ejected from Vessel Departed Vessel Collision with Submerged Object Collision with Recreational Vessel Collision with Governmental Vessel Collision with Commercial Vessel Collision with Floating Object Collision with Fixed Object Carbon Monoxide Capsizing Total Vessels Involved All Types Air Thrust Manual Propeller Sail Water Jet No Propulsion Unknown Table 21 NUMBER OF VESSELS IN ACCIDENTS BY PRIMARY ACCIDENT TYPE & ENGINE TYPE Injuries Total Deaths Other Deaths Drownings Unknown Other Skier Mishap Sinking Person Struck by Vessel Person Struck by Propeller Grounding Flooding/ Swamping Fire or Explosion (unknown origin) Fire or Explosion (non-fuel) Fire or Explosion (fuel) Falls Overboard Fall in Vessel Electrocution Ejected from Vessel Departed Vessel Collision with Submerged Object Collision with Recreational Vessel Collision with Governmental Vessel Collision with Commercial Vessel Collision with Floating Object Collision with Fixed Object Carbon Monoxide Capsizing Total Vessels Involved Engine Type Inboard Outboard Sterndrive Unknown Recreational Boating Statistics
42
43 Operator/Passenger Information Explanation of Operator/Passenger Information Section The following section contains eight tables and figures that examine data relating to the operators and passengers in accidents. Information is displayed by age, boating safety instruction, type of injury, and cause of death. Operator Information (Table 22, Page 44) This table provides information about the operator. Information covers a variety of topics including age, boating operation hours experience, number of people onboard the vessel, and the boating safety instruction level of the operator. Number of Deaths by Type of Operator Boating Instruction (Table 23 & Figure 6, Page 45) This table and accompanying figure focus on boating safety instruction for those operators who had a person die on their vessel. The table and figure both focus on instruction provided by the U.S. Coast Guard Auxiliary, U.S. Power Squadrons, American Red Cross, and State sources. The figure examines only deaths where the operator instruction was known. Number of Deaths by Vessel Type (Table 24 & Figure 7, Page 46) This table documents deaths by vessel type with a focus on drownings. It also provides the percentage of deaths by drowning by type of vessel. Number of Deceased Victims by Age & Vessel Type (Table 25, Page 47) This table documents the age of fatal victims by vessel type. It also delineates the number of drownings, non-drownings, and total deaths by age. Number of Injured Victims by Age & Vessel Type (Table 26, Page 48) This table documents the age of injured victims by vessel type. Nature of Primary Injury Type by Area of Injury 2009 (Table 27, Page 49) This table focuses on the nature and area of the primary injury of injured victims. Recreational Boating Statistics
44 Operator/Passenger Information Age of Operator Operator's Experience Number of Persons on Board Table 22 OPERATOR INFORMATION 2009 Vessels Involved Deaths Injuries years and under to 18 years to 25 years to 35 years to 55 years Over 55 years Unknown No Experience Under 10 hours to 100 hours to 500 hours Over 500 Hours Unknown No Operator None One Two Three Four Five Six Seven Eight Nine Ten More than Unknown American Red Cross Informal Internet Course State Course US Power Squadrons Education of Operator USCG Auxiliary Other No Education Unknown No Operator Recreational Boating Statistics

45 Operator/Passenger Information BOATING SAFETY INSTRUCTION Table 23 NUMBER OF DEATHS BY TYPE OF OPERATOR BOATING INSTRUCTION 2009 Type of Boating Instruction Deaths American Red Cross 1 Informal 18 Internet Course 2 State 27 U.S. Coast Guard Auxiliary 15 U.S. Power Squadron 1 Other 41 No Education 326 Total Deaths - Known Operator Instruction 431 Total Deaths - Unknown Operator Instruction 298 Total Deaths - No Operator 7 Total Deaths - Known & Unknown Operator Instruction 736 Figure 6 PERCENT OF DEATHS BY KNOWN OPERATOR INSTRUCTION 20 Informal/Internet/ Other 14% No Instruction 76% USCG Auxiliary, US Power Squadrons, American Red Cross 4% State 6% Recreational Boating Statistics
46 Operator/Passenger Information Table 24 NUMBER OF DEATHS BY VESSEL TYPE 2009 Percentage of Boat Type Drownings Deaths by Causes other than Drowning Total Deaths Deaths from Drowning Airboat % Auxiliary Sailboat % Cabin Motorboat % Canoe % Houseboat % Inflatable % Kayak % Open Motorboat % Personal Watercraft % Pontoon % Rowboat % Sailboat (only) % Sailboat (unknown) % Other % Unknown % Total % Figure 7 NUMBER OF DEATHS BY VESSEL TYPE 2009 Deaths by Causes other than Drowning Drownings Recreational Boating Statistics
47 Operator/Passenger Information Table 25 NUMBER OF DECEASED VICTIMS BY AGE AND VESSEL TYPE 2009 Airboat Auxiliary Sailboat Cabin Motorboat Canoe Houseboat Inflatable Type of Vessel Kayak Open Motorboat Age of Deceased Victim Total and Over Unknown Personal Watercraft Pontoon Boat Rowboat Sailboat (only) Sailboat (unknown) Other Unknown Drownings Other Deaths Total Deaths Recreational Boating Statistics
 Sailboat (unknown) Other Unknown Total 3358 18 42 298 80 22 22 43 1780 878 100 24 23 0 10 18 0 2 0 0 0 0 0 0 0")
48 Operator/Passenger Information Table 26 NUMBER OF INJURED VICTIMS BY AGE AND VESSEL TYPE 2009 Age of Injured Victim Total Injuries Airboat Auxiliary Sailboat Cabin Motorboat Canoe Houseboat Inflatable Kayak Open Motorboat Personal Watercraft Pontoon Boat Rowboat Sailboat (only) Sailboat (unknown) Other Unknown Total and Over Unknown Recreational Boating Statistics
49 Operator/Passenger Information Table 27 NATURE OF PRIMARY INJURY TYPE BY AREA OF INJURY 2009 All Areas Arm Body Foot Hand Head Leg Neck Trunk Unknown All Primary Injury Types Amputation Broken Bone Burn Carbon Monoxide Concussion Dislocation Hypothermia Internal organ injury Laceration Scrape/Bruise Spinal Cord Injury Sprain/Strain Other Unknown Recreational Boating Statistics
50
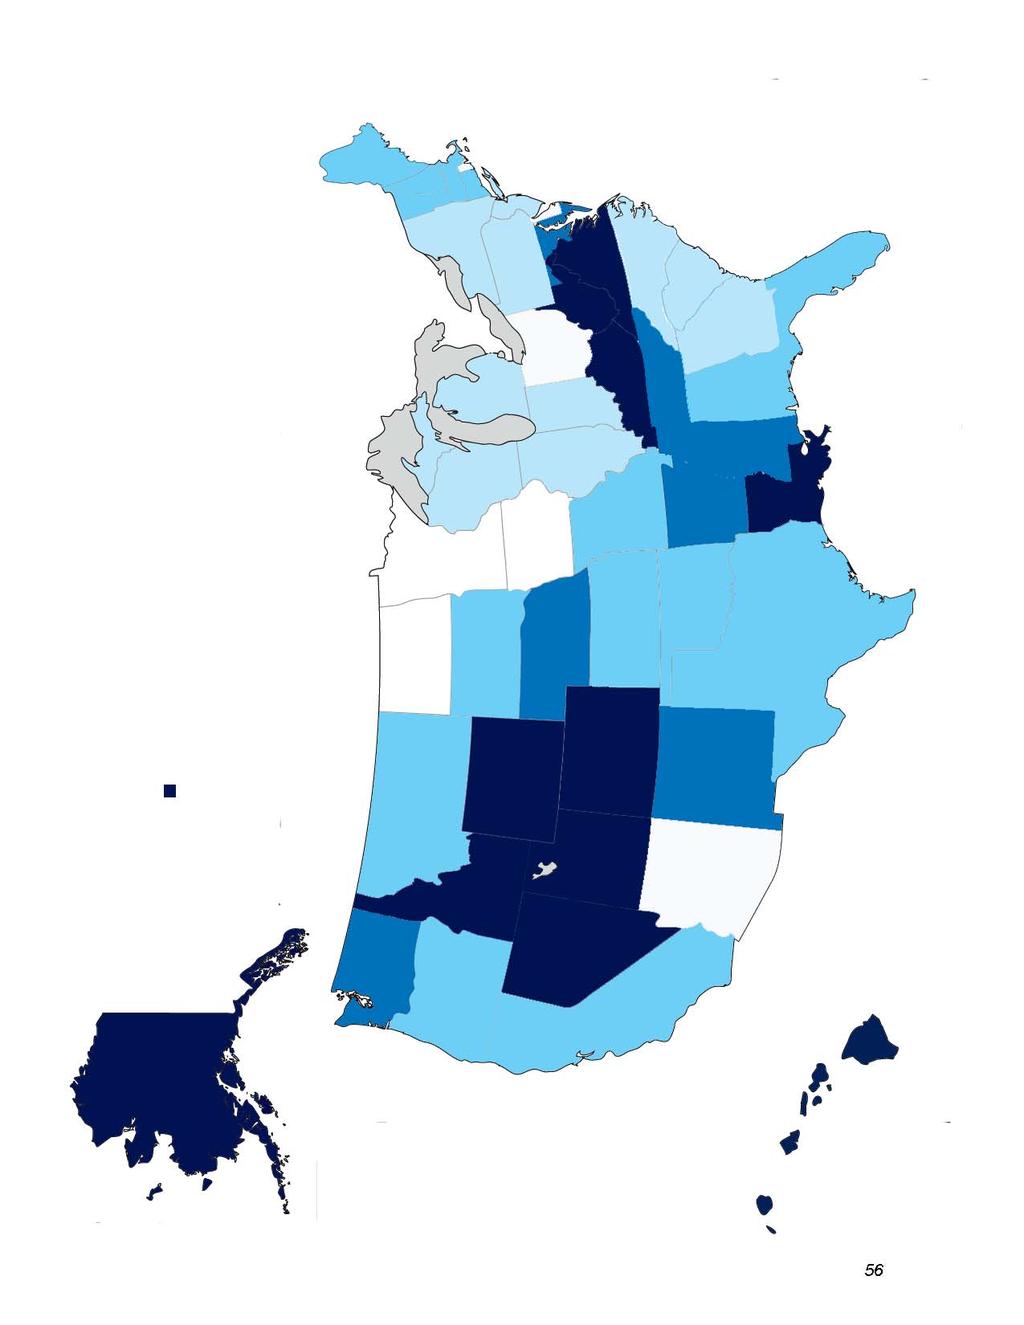
51 Casualty Data Explanation of Casualty Data Section This section contains eleven tables and figures that examine data relating to the victims in boating accidents. The following pages focus on historical casualty information, casualty-vessel information, and state-specific casualty information. Accidents & Casualties by Year, (Figure 8 & Table 28, Page 52) This figure and table document the number of accidents and casualties from Accident, Casualty & Damage Data by State (Table 29, Page 53) This table provides accident, casualty, and damage information by state for the year Accidents are broken down into three levels of severity fatal accidents, non-fatal injury accidents, and property damage only accidents. This table also provides the number of casualties and property damage by state. Distribution of Recreational Boating Deaths by State (Figure 9, Page 54) This figure provides the percentage that each state contributed to the national death count. So, for instance, Michigan had 36 deaths. Out of the total national death count of 736, Michigan contributed 4.9% ((36/736) * 100) of deaths to the national count. Annual Recreational Boating Fatality Rates (Figure 10 & Table 30, Page 55) This table provides the fatality rates from The fatality rate is calculated by dividing the number of fatalities by the total national vessel registration. The Coast Guard then multiplied by a factor of 100,000 to arrive at the number of deaths per 100,000 registered vessels. The accompanying figure shows the trend of fatality rates from States Coded by their 2009 Fatality Rate (Figure 11, Page 56) This figure displays states that are color-coded depending on their fatality rate which is expressed as the number of deaths that occurred in that state per 100,000 vessels that that state registered. It is important to note that not all states register the same types of vessels which could skew the fatality rates provided. Please see Table 38, Recreational Registration Data by State to view the Scope of each state s registration system. Five-year Summary of Selected Accident Data by State (Table 31, Page 57) This table examines the number of accidents, fatal accidents, and fatalities by state for years Number of Accidents by Primary Accident Type & State (Table 32, Page 58-59) This table documents the first accident event by state. It also provides information about the total number of accidents and casualties by state. Number of Injured Victims by Primary Injury & Vessel Type (Table 33, Page 60) This table displays the number of injured victims by primary injury and vessel type. Number of Fatal Victims by Life Jacket Wear, Cause of Death, & Vessel Type (Table 34, Page 60) This table displays the number of fatal victims by vessel type and cause of death. The table also provides information on whether the deceased victim was wearing a life jacket. Recreational Boating Statistics
52 Casualty Data Figure 8 DEATHS, INJURIES & ACCIDENTS BY YEAR, Deaths Injuries Accidents Table 28 DEATHS, INJURIES & ACCIDENTS BY YEAR, Year Deaths Injuries Accidents * On July 2, 2001, the Federal threshold of property damage for reports of accidents involving recreational vessels changed from $500 to $2000. Recreational Boating Statistics
53 Casualty Data Table 29 ACCIDENT, CASUALTY & DAMAGE DATA BY STATE 2009 Number of Accidents Persons Involved Total Fatal Non-Fatal Property Damage Deaths Injured Damages Totals $35,903, AK $34, AL $846, AR $272, AZ $453, CA $3,892, CO $73, CT $608, DE $383, DC $0 FL $9,686, GA $337, HI $169, IA $194, ID $542, IL $178, IN $247, KS $59, KY $291, LA $445, MA $527, MD $844, ME $84, MI $679, MN $334, MO $1,577, MS $247, MT $53, NC $664, ND $16, NE $207, NH $185, NJ $185, NM $47, NV $230, NY $1,148, OH $495, OK $449, OR $469, PA $198, RI $833, SC $405, SD $75, TN $1,079, TX $1,006, UT $171, VA $923, VT $4, WA $1,203, WI $464, WV $120, WY $62, GU $50, CNMI $8, PR $130, VI $0.00 Federal Jurisdiction* $0.00 Atlantic Ocean* $217, Gulf of Mexico* $8, Pacific Ocean* $1,777, *1997 was the first year statistics were compiled for accidents that occurred three or more miles offshore in the Atlantic Ocean and Pacific Ocean and nine or more miles in the Gulf of Mexico. NJ did not submit property damage estimates to boats in However, NJ noted that accidents submitted to the Coast Guard that did not have an injury or death were considered to have $2000 or more in damages. The Coast Guard adjusted NJ's property damages to boats such that each accident without an injury or death had $2000 damages. Recreational Boating Statistics
54
55 Casualty Data Figure 10 Annual Recreational Boating Fatality Rates Number of Deaths per 100,000 Recreational Registered Vessel Table 30 ANNUAL RECREATIONAL BOATING FATALITY RATES Total Number of Deaths Per Total Year Registered 100,000 Registered Vessels Deaths Vessels ,877, ,312, ,565, ,738, ,782, ,876, ,854, ,794, ,781, ,942, ,746, ,875, ,692, ,721, Recreational Boating Statistics
56
57 Casualty Data Table 31 FIVE YEAR SUMMARY OF SELECTED ACCIDENT DATA BY STATE Total Number of Accidents Fatal Accidents Deaths Totals Alabama Alaska Arizona Arkansas California Colorado Connecticut Delaware DC Florida Georgia Hawaii Idaho Illinois Indiana Iowa Kansas Kentucky Louisiana Maine Maryland Massachusetts Michigan Minnesota Mississippi Missouri Montana Nebraska Nevada New Hampshire New Jersey New Mexico New York North Carolina North Dakota Ohio Oklahoma Oregon Pennsylvania Rhode Island South Carolina South Dakota Tennessee Texas Utah Vermont Virginia Washington West Virginia Wisconsin Wyoming Guam Puerto Rico Virgin Islands AS CNMI Federal Jurisdiction *AT *GL *PC *1997 was the first year statistics were compiled for accidents that occurred three or more miles offshore in the Atlantic Ocean and Pacific Ocean and nine or more miles in the Gulf of Mexico. Recreational Boating Statistics
58 Table 32 NUMBER OF ACCIDENTS BY PRIMARY ACCIDENT TYPE & STATE 2009 Casualty Data Injuries Total Deaths Other Deaths Drownings Unknown Other Skier Mishap Sinking Person Struck by Vessel Person Struck by Propeller Grounding Flooding/Swamping Fire/Explosion (unknown origin) Fire/Explosion (non-fuel) Fire/Explosion (fuel) Falls Overboard Fall in Vessel Electrocution Ejected From Vessel Departed Vessel Collision with Submerged Object Collision with Recreational Vessel Collision with Governmental Vessel Collision with Commercial Vessel Collision with Floating Object Collision with Fixed Object Carbon Monoxide Capsizing Total Accidents Totals AL AK AZ AR CA CO CT DE DC FL GA HI ID IL IN IA KS KY LA ME MD MA MI MN MS MO MT NE NV Recreational Boating Statistics
59 Casualty Data Table 32 Continued NUMBER OF ACCIDENTS BY PRIMARY ACCIDENT TYPE & STATE 2009 Injuries Total Deaths Other Deaths Drownings Unknown Other Skier Mishap Sinking Person Struck by Vessel Person Struck by Propeller Grounding Flooding/Swamping Fire/Explosion (unknown origin) Fire/Explosion (non-fuel) Fire/Explosion (fuel) Falls Overboard Fall in Vessel Electrocution Ejected From Vessel Departed Vessel Collision with Submerged Object Collision with Recreational Vessel Collision with Governmental Vessel Collision with Commercial Vessel Collision with Floating Object Collision with Fixed Object Carbon Monoxide Capsizing Total Accidents NH NJ NM NY NC ND OH OK OR PA RI SC SD TN TX UT VT VA WA WV WI WY GU PR VI AS CNMI Federal AT GL PC Recreational Boating Statistics
60 Casualty Data Table 33 NUMBER OF INJURED VICTIMS BY PRIMARY INJURY & VESSEL TYPE # of Injuries Cabin Motorboat Auxiliary Sailboat Airboat Canoe Houseboat Primary Injury Amputation Broken Bone Burns Carbon Monoxide Concussion Dislocation Hypothermia Internal organ injury Laceration Scrape/bruise Spinal cord injury Sprain/Strain Other Unknown All Injuries Inflatable Personal Watercraft Open Motorboat Kayak Pontoon Boat Rowboat Sailboat (unknown) Sailboat Other Unknown Table 34 NUMBER OF FATAL VICTIMS BY LIFE JACKET WEAR, CAUSE OF DEATH & VESSEL TYPE 2009 Life Jacket Worn? Number of Deaths Airboat Auxiliary Sailboat Cabin Motorboat Houseboat Canoe Cause of Death Carbon Monoxide No Cardiac Arrest Yes Cardiac Arrest No Drowning Yes Drowning No Drowning Unknown Hypothermia Yes Hypothermia No Hypothermia Unknown Other No Trauma Yes Trauma No Trauma Unknown Unknown Yes Unknown No Unknown Unk All Causes Inflatable Kayak Open Motorboat Personal Watercraft Pontoon Boat Rowboat Sailboat Sailboat (unknown) Other Unknown Recreational Boating Statistics

61
62 Registration Data Explanation of Registration Data Section The following section contains fives tables and figures that examine boat registration information. Registered vessels are those vessels that are required to be recorded by a state, which includes numbered vessels and other forms of registration. Without a record, a vessel cannot be legally operated. Not all states have the same registration requirements. While some states may only register vessels with a motor, others may register sailboats, canoes, kayaks, and rowboats in addition to those vessels with a motor. Recreational Vessel Registration by Year, (Table 35 & Figure 12, Page 63) This table provides information about recreational vessel registration for each year from The accompanying figure displays a trend line from Recreational Vessel Registration by Length & Means of Propulsion (Table 36, Page 64) The top section of the table provides tallies for the number of mechanically-propelled vessels, the number of manually-propelled vessels, and a summation of these two categories. The middle section of the table documents mechanically-propelled vessel registration by length category and engine type. The bottom section of the table focuses on mechanically propelled vessels. Registration Data by State (Table 37, Page 65) This table examines recreational vessel registration by state. It provides a ranking of states by vessel registration, specifies the scope of the state s registration program, and provides a two-year comparison of registration information. Distribution of 2009 Recreational Vessel Registration by State (Figure 13, Page 66) This figure provides the percentage that each state contributed to national registration. So, for instance, California registered 906,988 vessels. Out of the total national registration of 12,692,892, California contributed 7.1% ((906,988/12,721,154) * 100) of registered vessels to the national count. Recreational Boating Statistics
63 Registration Data ,000,000 12,000,000 10,000,000 8,000,000 6,000,000 4,000,000 2,000,000 0 Figure 12 Recreational Vessels Registered by Year, Table 35 RECREATIONAL VESSELS REGISTERED BY YEAR, Registered Boats Year ,577, ,905, ,073, ,165, ,420, ,589, ,876, ,963, ,362, ,777, ,996, ,068, ,132, ,282, ,429, ,734, ,877, ,312, ,565, ,738, ,782, ,876, ,854, ,794, ,781, ,942, ,746, ,873, ,692, ,721,541 Recreational Boating Statistics
64 Registration Data Table 36 RECREATIONAL VESSEL REGISTRATION BY LENGTH AND MEANS OF PROPULSION 2009 Mechanically Propelled Not Mechanically Propelled Total 11,834, ,669 12,721,541 STATE REGISTERED BOATS THAT ARE MECHANICALLY PROPELLED Means of Mechanical Propulsion Auxiliary Sail Inboard Outboard Sterndrive Inboard Outboard Total Under 16 feet 1,365,494 3,388, ,695 9,900 17,727 4,950, to less than 26 feet 758,023 4,210,687 1,278,506 14,736 40,289 6,302, to less than 40 feet 171, , ,011 39,976 11, , to 65 feet 43,508 7,401 12,890 5, ,207 Over 65 feet 5,899 2,444 2, ,442 Total 2,344,485 7,724,132 1,626,087 70,347 69,821 11,834,872 STATE REGISTERED BOATS NOT MECHANICALLY PROPELLED Rowboats Sailboats Canoes/Kayaks Other Boats Total 105, , , , ,669 Recreational Boating Statistics
65 Registration Data Table 37 RECREATIONAL VESSEL REGISTRATION DATA BY STATE Ran Scope of Current Boat Registration System Nationally 12,721,541 12,692,892 AL , ,558 All motorboats, sailboats and rental boats AK 46 48,892 47,534 All undocumented powerboats AS All watercraft AZ , ,291 All watercraft, except inflatables 12 feet in length or less AR , ,104 All motorboats and sailboats CA 2 906, ,853 All motorboats; sailboats over 8 feet in length CO 33 95,822 95,330 All watercraft powered by motor or sail - sailboards exempt CT , ,650 All motorboats; sailboats 19.5 feet or more in length DE 40 61,523 56,669 All motorboats DC 54 2,798 2,922 All watercraft FL 1 949, ,553 All motorboats GA , ,479 All motorboats; sailboats 12 feet or more in length GU 53 3,197 3,277 All watercraft (estimated) HI 51 15,709 15,404 All motorboats; sailboats over 8 feet in length ID 36 90,501 89,026 All motorboats and sailboats IL , ,208 All watercraft, except non-profit org. owned canoes and kayaks IN , ,532 All motorboats IA , ,333 All watercraft with exceptions (a) KS 35 90,522 91,067 All motorboats and sailboats KY , ,981 All motorboats, except electric motors 1 hp or less LA , ,753 All motorboats; sailboats more than 12 feet in length ME , ,657 All motorboats MD , ,087 All motorboats MA , ,113 All motorboats MI 4 811, ,752 All watercraft with exceptions (b) MN 3 811, ,446 All motorboats with exceptions (c) MS , ,312 All motorboats and sailboats MO , ,253 All motorboats; sailboats over 12 feet in length MT 37 83,394 84,988 All motorboats; sailboats 12 feet or more in length NE 38 80,089 83,280 All motorboats NV 44 56,053 57,519 All motorboats, sailboats, rowboats NH 34 95,402 96,205 All motorboats; sailboats 20 feet or more in length NJ , ,359 All watercraft with exceptions (d) NM 48 36,544 33,304 All motorboats and sailboats NY 7 479, ,541 All motorboats NC , ,879 All motorboats; sailboats more than 14 feet in length ND 45 51,609 46,067 All watercraft CNMI All motorboats OH 9 424, ,586 All watercraft; *5576 livery vessels included in '08; 5522 livery vessels not included in '07 OK , ,052 All watercraft OR , ,063 All motorboats; sailboats 12 feet or more in length PA , ,316 All motorboats and certain non-powered craft (e) PR 41 60,627 59,580 All motorboats; vessels adapted to hold a motor RI 47 42,519 42,524 All watercraft except canoes, kayaks & rowboats < 12 feet SC 8 435, ,844 All watercraft SD 42 60,094 56,604 All motorboats; all other boats over 12 feet in length TN , ,475 All motorboats and sailboats TX 6 622, ,428 All motorboats and sailboats 14 feet or more in length UT 39 72,419 73,009 All motorboats and sailboats VT 49 30,480 30,429 All motorboats VI * 52 5,765 6,915 All watercraft VA , ,312 All motorboats WA , ,393 All motorboats with exceptions (f); sailboats >16 ft in length WV 43 57,415 49,930 All motorboats WI 5 626, ,546 All motorboats; sailboats over 12 feet in length WY 50 27,955 27,243 All motorboats and sailboats (a) Iowa excludes inflatables under 7 feet in length and canoes/kayaks under 13 feet in length. (b) Michigan excludes manually propelled boats 16 feet or less in length, and nonmotorized rafts, canoes, and kayaks. (c) Minnesota excludes nonmotorized boats nine feet or less in length, duckboats during duckhunting season, and riceboats during harvest season and seaplanes. (d) New Jersey excludes non-motorized boats 12 feet or less in length and canoes, kayaks, racing shells and rowing sculls. (e) Pennsylvania registers non-powered craft using lakes or access areas owned by the State Fish & Boat Commission. (f) Washington excludes motorboats < 16 feet with motors 10 horsepower or less used solely on exclusive state waters. *VI reported only numbered watercraft (as opposed to all watercraft the previous year). Recreational Boating Statistics
66

67

68

69
70

71

72
73 Glossaries Glossary Airboat - A boat propelled by an engine producing air thrust. This type of boat does not include ground effect vessels or air cushion vehicles (hovercraft). At Anchor - Held in place in the water by an anchor; includes moored to a buoy or anchored vessel and dragging anchor. Auxiliary Sailboat - A sailboat also equipped with an engine. Cabin Motorboat - A motorboat equipped with accommodation spaces, i.e., bunks or berths. Canoe - A small narrow boat, propelled by paddles. Canoes usually are pointed at both bow and stern and are normally open on top, but can be covered. Capsizing - Overturning of a vessel. Carbon Monoxide Poisoning - Death or injury resulting from an odorless, colorless gas generated from auxiliary boat equipment (stoves, heaters, refrigerators, generators, hot water heaters, etc.), another boat s exhaust, or the exhaust of the vessel on which persons were either aboard or in close proximity. Collision with Fixed Object - The striking of any fixed object, above or below the surface of the water. Collision with Floating Object - Collision with any waterborne object above or below the surface that is free to move with the tide, current, or wind, except another vessel. Collision with Commercial/Governmental/Recreational Vessel - Any striking together of two or more vessels, regardless of operation at time of the accident, is a collision. Collision with Submerged Object - A boat s collision with any waterborne or fixed object that is below the surface of the water. Congested Waters - Where the body of water is either too small or narrow to safely accommodate the number of boats on it. Cruising - Proceeding normally, unrestricted, with an absence of drastic rudder or engine changes. Documented Vessel - A vessel of five or more net tons owned by a citizen of the United States and used exclusively for pleasure with a valid marine document issued by the Coast Guard. Documented vessels are not numbered. Drifting - Underway, but proceeding over the bottom without use of engines, oars or sails; being carried along only by the tide, current, or wind. Electrocution - Death or injury resulting from an electrical current that comes in contact with water causing electrocution of the victim. Excessive Speed - Speed above that which a reasonable and prudent person would have operated under the conditions that existed. It is not necessarily a speed in excess of a posted limit. Failure to Vent - Prior to starting the engine, failure to turn on the powered ventilation system that brings in fresh air and expels gasoline vapors from the engine compartment. Fall in Vessel - Any operator or passenger who slips, trips, or falls on board or within the vessel. Recreational Boating Statistics
74 Glossaries Falls Overboard - Any operator or passenger who falls off of the vessel. Fiberglass (plastic) hull - Hulls of fiber-reinforced plastic. The laminate consists of two basic components, the reinforcing material (glass filaments) and the plastic or resin in which it is embedded. Fire/Explosion (fuel) - Accidental combustion of vessel fuel, liquids, including their vapors, or other substances such as wood. Fire/Explosion (other) - Accidental burning or explosion of any material onboard except vessel fuels or their vapors. Flooding/Swamping - Filling with water, regardless of method of ingress, but retaining sufficient buoyancy to remain on the surface. Force of Wave/Wake - The track in the water of a moving boat; commonly used for the disturbance of the water (waves) resulting from the passage of the boat s hull. Fueling - Any stage of the fueling operation; primarily concerned with introduction of explosive or combustible vapors or liquids on board. Grounding - Running aground of a vessel, striking or pounding on rocks, reefs, or shoals; stranding. Hazardous Waters - Rapid tidal flows (the vertical movement of water) and/or currents (the horizontal flow of water) resulting in hazardous conditions in which to operate a boat. Houseboat - A motorized vessel designed primarily with accommodation spaces with little or no foredeck or cockpit, with low freeboard and with a low length to beam ratio. Hull Failure - Defect or failure of the structural body of a vessel (i.e., hull material, design, or construction) not including superstructure, masts, or rigging. Ignition of Spilled Fuel or Vapor - Accidental combustion of vessel fuel, liquids, and/or their vapors. Improper Anchoring - Where a boat is either in the process of being anchored incorrectly or incorrectly held in place in the water by an anchor. Improper Loading - Loading, including weight shifting, of the vessel causing instability, limited maneuverability, or dangerously reduced freeboard. Improper Lookout - No proper watch; the failure of the operator to perceive danger because no one was serving as lookout, or the person so serving failed in that regard. Every vessel shall at all times maintain a proper look-out by sight and hearing as well as by all available means appropriate in the prevailing circumstances and conditions so as to make a full appraisal of the situation and of the risk of collision. Inflatable - A vessel constructed with its sides and bow made of flexible tubes containing pressurized gas. On smaller inflatables, the floor and hull beneath it is often flexible. On larger inflatables, the boat often has a rigid floor and solid hull capable of supporting a more powerful transom mounted outboard engine or even an inboard engine. Kayak - A small boat with a cockpit that is propelled by a double-bladed paddle by a sitting paddler. Inadequate On-board Navigation Lights - Insufficient and/or improper lights shown by a boat that indicate course, position, and occupation, such as fishing or towing. Recreational Boating Statistics
75 Glossaries Machinery Failure - Defect and/or failure in the machinery or material, design or construction, or components installed by the manufacturer involved in the mechanical propulsion of the boat (e.g., engine, transmission, fuel system, electric system, and steering system). Missing or Inadequate Navigation Aids - The absence of or ineffective presence of navigation aids. Motorboat - Any vessel equipped with propulsion machinery. Numbered vessel - An undocumented vessel numbered by a state with an approved numbering system under Chapter 123 of title 46, U.S.C. Open Motorboat - Craft of open construction specifically built for operating with a motor, including boats canopied or fitted with temporary partial shelters. Operator Inattention - Failure on the part of the operator to pay attention to the vessel, its occupants, or the environment in which the vessel is operating. Operator Inexperience - Lack of practical experience or knowledge in operating a vessel or, more particularly, the vessel involved in the accident. Outboard - An engine not permanently affixed to the structure of the craft, regardless of the method or location used to mount the engine, e.g., motor wells, kicker pits, motor pockets, etc. Overloading - Excessive loading of the vessel causing instability, limited maneuverability, dangerously reduced freeboard, etc. People on Gunwale, Bow or Transom - Standing/Sitting on the upper edge of the side of a boat, usually on a small projection above the deck; and/or standing/sitting on the most forward part of the boat; and/or standing/sitting on the back of the boat. Person Struck by Vessel - A person is struck by a boat. Person Struck by Propeller - A person is struck by the propeller, propulsion unit, or steering machinery. Personal Watercraft - Craft designed to be operated by a person or persons sitting, standing or kneeling on the craft rather than within the confines of a hull. Pontoon Boat - A boat consisting of a rigid structure connecting at least two parallel fore (front) and aft (back) rigid sealed buoyancy chambers. Restricted Vision - A vessel operator's vision is said to be restricted when it is limited by a vessel's bow high trim, or by glare, sunlight, bright lights, a dirty windshield, spray, a canopy top, etc. Rowboat - A open boat propelled by one or more persons using oars. Rules of the Road Infraction - Violation of the statutory and regulatory rules governing the navigation of vessels. Sailboat (only) - Any boat whose sole source of propulsion is the natural element (i.e., wind) or a boat designed or intended to be propelled primarily by sail, regardless of size or type. Sharp Turn - An immediate or abrupt change in the boat s course of direction. Sinking - Losing enough buoyancy to settle below the surface of the water. Recreational Boating Statistics
76 Glossaries Skier Mishap - Skier mishap is defined by persons (1) falling off their water-skis, (2) striking a fixed or submerged object, or by (3) becoming entangled or struck by the tow line. Also includes mishaps involving inner-tubes and other devices on which a person can be towed behind a boat. Starting in Gear - The boat s engine is started with the transmission in forward or reverse. Steel hull - Hulls of sheet steel or steel alloy, not those with steel ribs and wood, canvas, or plastic hull coverings. Sterndrive - An inboard/outboard engine system, with the engine inside the hull connected to an external lower unit containing a propeller. Steering is achieved by turning the lower unit. Sudden Medical Condition - An incident where a person on a vessel experiences an unexpected medical condition. Towing - Engaged in towing any vessel or object, other than a person. Weather - As a contributing factor of an accident, Weather is supposed to signify a stormy or windy condition, usually connoting rough or high seas and dangerous operating conditions. Wood Hull - Hulls of plywood, molded plywood, wood planking, or any other wood fiber in its natural consistency, including those of wooden construction that have been sheathed with fiberglass or sheet metal. Recreational Boating Statistics
77 Glossaries Glossary of State Codes AL Alabama NJ New Jersey AK Alaska NM New Mexico AZ Arizona NY New York AR Arkansas NC North Carolina CA California ND North Dakota CO Colorado OH Ohio CT Connecticut OK Oklahoma DE Delaware OR Oregon DC District of Columbia PA Pennsylvania FL Florida RI Rhode Island GA Georgia SC South Carolina HI Hawaii SD South Dakota ID Idaho TN Tennessee IL Illinois TX Texas IN Indiana UT Utah IA Iowa VT Vermont KS Kansas VA Virginia KY Kentucky WA Washington LA Louisiana WV West Virginia ME Maine WI Wisconsin MD Maryland WY Wyoming MA Massachusetts GU Guam MI Michigan PR Puerto Rico MN Minnesota VI Virgin Islands MS Mississippi AS American Samoa MO Missouri CNMI Northern Mariana Islands MT Montana AT Atlantic Ocean NE Nebraska GL Gulf of Mexico NV Nevada PC Pacific Ocean NH New Hampshire Recreational Boating Statistics


78
Introduction & Executive Summary
 Introduction & Executive Summary Table of Contents Introduction 2010 Executive Summary 6-7 Mission and Strategic Plan of the National Recreational Boating Safety Program 8 Overview of Statistics 8 Changes
Introduction & Executive Summary. Table of Contents
 RECREATIONAL BOATING STATISTICS 2007 COMDTPUB P16754.21 U.S. Department of Homeland Security U.S. Coast Guard Office of Auxiliary and Boating Safety Introduction & Executive Summary Table of Contents
COMDTPUB P U.S. Department of Homeland Security U.S. Coast Guard Office of Auxiliary and Boating Safety
 COMDTPUB P16754.27 U.S. Department of Homeland Security U.S. Coast Guard Office of Auxiliary and Boating Safety Introduction & Executive Summary U.S. Department o~ Homeland Security United States Coast
JOB LOSSES BY STATE, State Industry US total AK AL AR AZ CA CO CT Agriculture, forestry, fisheries -15, ,
 State US total AK AL AR AZ CA CO CT -15,597-35 -272-248 -232-3,163-132 -46-3,858-68 4-19 -291-303 -116-11 -3,318-9 -55-32 -73-314 -66-35 -554,750-194 -14,113-7,789-4,781-55,255-4,453-6,836-9,326-13 -190-282
The Economic Downturn Lessons on the Correlation between Economic Growth and Energy
 The Economic Downturn Lessons on the Correlation between Economic Growth and Energy Demand presented to Indiana State Bar Association Utility Law Spring Seminar April 9, 2010 presented by Doug Gotham State
Traffic Safety Facts 2002
 DOT HS 89 616 U.S. Department of Transportation National Highway Traffic Safety Administration Traffic Safety Facts 22 A Public Information Fact Sheet on Motor Vehicle and Traffic Safety Published by the
National Routing Number Administration p-ani Activity and Projected Exhaust Report
 National Routing Number Administration 2016 p-ani Activity and Projected Exhaust Report The ATIS Industry Numbering Committee developed the P-ANI Administration Guidelines, which contain the following
Semiannual Report Of UST Performance Measures End Of Fiscal Year 2018 (October 1, 2017 September 30, 2018)
") Semiannual Report Of UST Performance Measures End Of Fiscal Year 208 (October, 207 September 30, 208) Where does EPA get the performance data? Twice each year, EPA collects data from states and territories
Semiannual Report Of UST Performance Measures End Of Fiscal Year 208 (October, 207 September 30, 208) Where does EPA get the performance data? Twice each year, EPA collects data from states and territories
Effects of all-offender alcohol ignition interlock laws on recidivism and alcohol-related crashes
 Effects of all-offender alcohol ignition interlock laws on recidivism and alcohol-related crashes 20 th International Council on Alcohol, Drugs and Traffic Safety Conference Brisbane, Australia August
FY 2002 AWA INSPECTIONS
 FY 22 AWA INSPECTIONS number of Number of inspections Number of inspections facilities and (sites) category category Inspections for Compliance Other Types of Inspections Dealers 3,893 4,846 Prelicensing
Traffic Safety Facts 1995
 U.S. Department of Transportation National Highway Traffic Safety Administration Traffic Safety Facts 1995 exceeding the posted speed limit or driving too fast for conditions is one of the most prevalent
Effects of all-offender alcohol ignition interlock laws on recidivism and alcohol-related crashes
 Effects of all-offender alcohol ignition interlock laws on recidivism and alcohol-related crashes Lifesavers National Conference on Highway Safety Priorities Chicago, IL March 16, 2015 Anne T. McCartt
Highway Safety Countermeasures
 Highway Safety Countermeasures National Conference of State Legislatures May 14, 2009 Stephen Oesch Intersections Intersection crashes More than 2.4 million in 2007 5 crashes per minute 1 serious injury
IIHS activities on alcohol-impaired driving
 IIHS activities on alcohol-impaired driving The National Academies Committee on Accelerating Progress to Reduce Alcohol-Impaired Driving Fatalities March 22, 2017 Jessica B. Cicchino iihs.org IIHS is an
Reducing deaths, injuries, and loss from motor vehicle crashes
 Reducing deaths, injuries, and loss from motor vehicle crashes Northeast Transportation Safety Conference Cromwell, CT October 24, 2017 David G. Kidd, Ph.D. Senior Research Scientist iihs.org U.S. motor
The owner notification will commence in late July, 2006, approximately one week after the dealer notification.
 TO: SUBJECT: ALL TOYOTA DEALER PRINCIPALS, SERVICE MANAGERS, PARTS MANAGERS SPECIAL SERVICE CAMPAIGN (SSC) 60F (SAFETY RECALL) 2004 THROUGH 2005 HIGHLANDER AND EARLY 2006 HIGHLANDER HV CENTER CONSOLE (FLOOR
Policy considerations for driving automation technology
 Policy considerations for driving automation technology Northeast Autonomous Vehicle Summit Mystic, CT March 30, 2017 David G. Kidd, Ph.D. Senior Research Scientist iihs.org Status of automated vehicle
Owner letters will be mailed based upon part number and production date, starting with earlier production vehicles.
 TO: ALL TOYOTA DEALER PRINCIPALS, SERVICE MANAGERS, PARTS MANAGERS SUBJECT: SPECIAL SERVICE CAMPAIGN (SSC) 50J PHASE 1 (FRONT SUSPENSION LOWER BALL JOINT) As announced in May, 2005, Toyota will initiate
2015 INJURY DATA TOTAL INJURIES RECORDED TYPES OF INJURY. Boating Accidents Statistical Report. Registered vessels 915,713
 20 202 20 20 205 205 INJURY DATA TOTAL INJURIES RECORDED 20-205 Registered vessels 95,7 Injury rate 8 Number of injuries 8 Registered vessels 899,65 Injury rate Number of injuries 65 Registered vessels
, NAS!?r-s~~if.{" WOQi2AN PIGS: FINAt:. EST'IHATES (STATISTICAL,,,", BULLETIN.) NATIONAL ' AGRICULTURAL STATISTICS SERVICE,, ':-'-"'-'-,,
 NATIONAL ' AGRICULTURAL STATISTICS SERVICE,, ':-'-'-'-,,") , NAS!?r-s~~if.{" WOQi2AN PIGS: FINAt:. EST'IHATES 1988-92. (STATISTICAL,,,", BULLETIN.) NATIONAL ' AGRICULTURAL STATISTICS SERVICE,, ':-'-"'-'-,, WASHINGTOH, DC. DEC 9 57P' ~ alii Association for Informat
, NAS!?r-s~~if.{" WOQi2AN PIGS: FINAt:. EST'IHATES 1988-92. (STATISTICAL,,,", BULLETIN.) NATIONAL ' AGRICULTURAL STATISTICS SERVICE,, ':-'-"'-'-,, WASHINGTOH, DC. DEC 9 57P' ~ alii Association for Informat
Acknowledgements. n Research team: Dr. Bingham (PI), Dr. Carter, Dr. Flannagan, Mr. Bowman, Ms. Almani
, Dr. Carter, Dr. Flannagan, Mr. Bowman, Ms. Almani") Evaluation of crash-related fatalities and serious injuries associated with the Michigan Motorcycle Helmet Law Repeal Utilizing Linked Crash and Hospital-Level Data Dr. Lisa Buckley Acknowledgements n
Evaluation of crash-related fatalities and serious injuries associated with the Michigan Motorcycle Helmet Law Repeal Utilizing Linked Crash and Hospital-Level Data Dr. Lisa Buckley Acknowledgements n
Lives Saved through Vehicle Design: Regulation, Consumer Information and the Future
 Lives Saved through Vehicle Design: Regulation, Consumer Information and the Future Transport Research Board January 8, 2018 Adrian Lund iihs.org Crashworthiness in 1959 and 2009 Actual vs. potential car/ltv
UPDATE OF THE SURVEY OF SULFUR LEVELS IN COMMERCIAL JET FUEL. Final Report. November 2012
 CRC Project AV-1-10 UPDATE OF THE SURVEY OF SULFUR LEVELS IN COMMERCIAL JET FUEL Final Report November 2012 COORDINATING RESEARCH COUNCIL, INC. 3650 MANSELL ROAD SUITE 140 ALPHARETTA, GA 30022 The Coordinating
Finding List by Question by State *
 Finding List by Question by State * I. What are the elements of a claim for tortious interference in the context of recruiting or hiring an employee with a restrictive covenant (e.g., noncompete, nonsolicitation,
North Carolina. Joel Sheltrown VP of Governmental Affairs Elio Motors, Inc
 North Carolina Joel Sheltrown VP of Governmental Affairs Elio Motors, Inc. jsheltrown@eliomotors.com 989.387.7551 Elio Motors Autocycle Elio Motors www.eliomotors.com is manufacturing a two passenger with
PlugShare Quarterly 2015-Q3 Census, US Electric Vehicle Infrastructure Exhibits
 PlugShare Quarterly 205-Q3 Census, US Electric Vehicle Infrastructure Exhibits PlugShare 05 Abbot Kinney Blvd Venice, CA 9029 company.plugshare.com (30) 50-3333 Prepared on October, 205 Overview PlugShare
Richard Carrier Trucking, Inc. P.O. Box 718, Skowhegan, ME
 Richard Carrier Trucking, Inc. P.O. Box 718, Skowhegan, ME 04976 207.474.6293 http://www.carriertrucking.com APPLICATION FOR EMPLOYMENT In compliance with Federal and State equal employment opportunity
CustomerServicesDivision
 CustomerServicesDivision Toyota Motor Sales, U.S.A., Inc. 19001 South Western Avenue P.O. Box 2991 Torrance, CA 90509-2991 TO: SUBJECT: ALL TOYOTA DEALER PRINCIPALS, SERVICE MANAGERS, PARTS MANAGERS SPECIAL
Solar Power. Michael Arnold, LEED AP. ACI-NA Environmental Committee Meetings June 27, 2011
 Solar Power Michael Arnold, LEED AP ACI-NA Environmental Committee Meetings June 27, 2011 Some Reasons for Considering Solar Financial Benefit Airport Uses Energy Airport Sells Energy and/or credits Energy
GOVERNMENT RELATIONS BULLETIN
 GOVERNMENT RELATIONS BULLETIN September 2, 2015 GRB 15-008 Contact: Kathy Van Kleeck Summary of State Laws Governing Mopeds September 2015 This chart summarizes the laws governing "limited displacement/speed"
An Overview of Solar Energy and Opportunities for Growth in the Midwest and Kansas
 An Overview of Solar Energy and Opportunities for Growth in the Midwest and Kansas Alan Claus Anderson Energy Practice Group Vice Chair Polsinelli Shughart PC 913-234-7464 aanderson@polsinelli.com What
Welcome Performance and Registration Information Systems Management (PRISM)
") Welcome Performance and Registration Information Systems Management (PRISM) IRP Annual Meeting May 15, 2014 Monique Riddick, PRISM Program Technical Manager Federal Motor Carrier Safety Administration
Welcome Performance and Registration Information Systems Management (PRISM) IRP Annual Meeting May 15, 2014 Monique Riddick, PRISM Program Technical Manager Federal Motor Carrier Safety Administration
Alaska (AK) Passenger vehicles, motorcycles 1959 and newer require a title ATV s, boats and snowmobiles do not require a title
 Passenger vehicles, motorcycles 1959 and newer require a title ATV s, boats and snowmobiles do not require a title") Alabama (AL) Passenger vehicles 1975 and newer require a Motorcycles, mopeds and trailers 1975 and newer require a ATVs, snowmobiles and boats do not require a Alaska (AK) Passenger vehicles, motorcycles
Alabama (AL) Passenger vehicles 1975 and newer require a Motorcycles, mopeds and trailers 1975 and newer require a ATVs, snowmobiles and boats do not require a Alaska (AK) Passenger vehicles, motorcycles
2015 Community Report Grants
 5 Grants Produced for the New Mexico Department of Transportation, Traffic Safety Division, Traffic Records Bureau, Under Contract 58 by the University of New Mexico, Geospatial and Population Studies,
2016 Community Report De Baca County
 6 De Baca County Produced for the New Mexico Department of Transportation, Traffic Safety Division, Traffic Records Bureau, Under Contract 58 by the University of New Mexico, Geospatial and Population
2015 Community Report Las Vegas
 5 Las Vegas Produced for the New Mexico Department of Transportation, Traffic Safety Division, Traffic Records Bureau, Under Contract 58 by the University of New Mexico, Geospatial and Population Studies,
EPA REGULATORY UPDATE PEI Convention at the NACS Show October 8, 2018 Las Vegas, NV
 EPA REGULATORY UPDATE 2018 PEI Convention at the NACS Show October 8, 2018 Las Vegas, NV 1 Periodic Operations and Maintenance Walkthrough Inspections - beginning no later than October 13, 2018 (40 CFR
Five Star Dealer INTERNATIONAL.
 Five Star Dealer INTERNATIONAL http://dealer.leviton.com The 2016 Five Star Dealer Program Apply Today! International application deadline: Through March 31st, 2016 at http://dealer.leviton.com The 2016
2015 Community Report White Rock
 5 White Rock Produced for the New Mexico Department of Transportation, Traffic Safety Division, Traffic Records Bureau, Under Contract 58 by the University of New Mexico, Geospatial and Population Studies,
2016 Community Report New Mexico
 216 Produced for the Department of Transportation, Traffic Safety Division, Traffic Records Bureau, Under Contract 581 by the University of, Geospatial and Population Studies, Traffic Research Unit Distributed
2015 Community Report Chaparral
 5 Chaparral Produced for the New Mexico Department of Transportation, Traffic Safety Division, Traffic Records Bureau, Under Contract 58 by the University of New Mexico, Geospatial and Population Studies,
Wyoming electricity use is growing
 Wyoming electricity use is growing 12,000 $40 gigawatt-hours 11,000 10,000 9,000 8,000 7,000 6,000 5,000 $38 $36 $34 $32 $30 $28 $26 $24 $22 gross state product (economic growth) ($ billions) 4,000 2004
2016 Community Report Los Alamos County
 6 Los Alamos County Produced for the New Mexico Department of Transportation, Traffic Safety Division, Traffic Records Bureau, Under Contract 58 by the University of New Mexico, Geospatial and Population
2015 Community Report Doña Ana County
 25 Doña Ana County Produced for the New Mexico Department of Transportation, Traffic Safety Division, Traffic Records Bureau, Under Contract 58 by the University of New Mexico, Geospatial and Population
Remedy Procedure Phase 2 ( model year)
") To: Subject: All Toyota Dealer Principals, Service Managers, Parts Managers Safety Recall A0J Certain 2005 through 2008 Toyota Corolla and Corolla Matrix Vehicles Equipped with 1ZZ-FE Electronic Control
To: Subject: All Toyota Dealer Principals, Service Managers, Parts Managers Safety Recall A0J Certain 2005 through 2008 Toyota Corolla and Corolla Matrix Vehicles Equipped with 1ZZ-FE Electronic Control
2016 Community Report Portales
 6 Portales Produced for the New Mexico Department of Transportation, Traffic Safety Division, Traffic Records Bureau, Under Contract 58 by the University of New Mexico, Geospatial and Population Studies,
CHART A Interstate ICS Rates
 State Company CHART A Interstate ICS Rates Rates (2012 2013) Cost of 15 Minute Call Collect Pre Paid Debit Collect Pre Paid Debit AL Embarq (CenturyLink) * $3.95 +.89/min. $3.95 +.89/min. $3.95 +.89/min.
Alberta Speeding Convictions and Collisions Involving Unsafe Speed
 Alberta Speeding Convictions and Collisions Involving Unsafe Speed 2004-2008 Overview This document was prepared under the Alberta Traffic Safety Plan, Strategic Research Plan for 2008-2010, with the objective
2016 Community Report Torrance County
 6 Torrance County Produced for the New Mexico Department of Transportation, Traffic Safety Division, Traffic Records Bureau, Under Contract 58 by the University of New Mexico, Geospatial and Population
2015 Community Report Torrance County
 5 Torrance County Produced for the New Mexico Department of Transportation, Traffic Safety Division, Traffic Records Bureau, Under Contract 58 by the University of New Mexico, Geospatial and Population
2015 Community Report Tularosa
 5 Tularosa Produced for the New Mexico Department of Transportation, Traffic Safety Division, Traffic Records Bureau, Under Contract 58 by the University of New Mexico, Geospatial and Population Studies,
U.S. PRODUCTION GROWTH
 U.S. PRODUCTION GROWTH U.S. Production has increased by more than 78 percent since 2011, as Nissan Group continues to localize core-model production. Nissan built a record number of vehicles in the U.S.
Speeding and Speed Enforcement: Turning Knowledge Into Action
 Speeding and Speed Enforcement: Turning Knowledge Into Action Lifesavers Annual Conference Lake Buena Vista, FL June 16, 2012 Anne T. McCartt Some myths about speeds and speed limits Speed variation not
2014 Community Report Las Vegas
 4 Las Vegas Produced for the New Mexico Department of Transportation, Traffic Safety Division, Traffic Records Bureau, Under Contract 58 by the University of New Mexico, Geospatial and Population Studies,
2016 Community Report Santa Fe County
 26 Santa Fe County Produced for the New Mexico Department of Transportation, Traffic Safety Division, Traffic Records Bureau, Under Contract 58 by the University of New Mexico, Geospatial and Population
EP 724 US RAIL SERVICE ISSUES DATA COLLECTION
 EP 724 US RAIL SERVICE ISSUES DATA COLLECTION Railroad: BNSF Year: 2016 1. System Average Train Speed by Train Type for the Reporting Week (MPH) Intermodal 39.3 Grain unit 26.6 Coal unit 25.9 Automotive
Charles Hernick Director of Policy and Advocacy
 Charles Hernick Director of Policy and Advocacy Presentation to National Association of State Energy Officials on Energy Storage, Renewable Power, and Demand Response: Have we Arrived at a 100% Solution?
2016 Community Report Aztec
 Aztec Produced for the New Mexico Department of Transportation, Traffic Safety Division, Traffic Records Bureau, Under Contract 58 by the University of New Mexico, Geospatial and Population Studies, Traffic
2015 Community Report Aztec
 25 Aztec Produced for the New Mexico Department of Transportation, Traffic Safety Division, Traffic Records Bureau, Under Contract 58 by the University of New Mexico, Geospatial and Population Studies,
2016 Community Report San Juan County
 26 San Juan County Produced for the New Mexico Department of Transportation, Traffic Safety Division, Traffic Records Bureau, Under Contract 58 by the University of New Mexico, Geospatial and Population
2015 Community Report San Juan County
 25 San Juan County Produced for the New Mexico Department of Transportation, Traffic Safety Division, Traffic Records Bureau, Under Contract 58 by the University of New Mexico, Geospatial and Population
All Toyota Dealer Principals, Service Managers, Parts Managers. Certain 2010 Model Year Tacoma 4WD Vehicles Front Propeller Shaft
 To: Subject: All Toyota Dealer Principals, Service Managers, Parts Managers Safety Recall A0D Certain 2010 Model Year Tacoma 4WD Vehicles Front Propeller Shaft On February 11, 2010, Toyota filed a Defect
2015 Community Report Los Lunas
 25 Los Lunas Produced for the New Mexico Department of Transportation, Traffic Safety Division, Traffic Records Bureau, Under Contract 58 by the University of New Mexico, Geospatial and Population Studies,
2014 Community Report Portales
 4 Portales Produced for the New Mexico Department of Transportation, Traffic Safety Division, Traffic Records Bureau, Under Contract 58 by the University of New Mexico, Geospatial and Population Studies,
RhodeWorks Initiative
 RhodeWorks Initiative Accent image here Fixing Rhode Island s bridges and getting Rhode Islanders back to work Rhode Island Department of Transportation Primary Image here International Bridge, Tunnel
2014 Community Report Luna County
 4 Luna County Produced for the New Mexico Department of Transportation, Traffic Safety Division, Traffic Records Bureau, Under Contract 58 by the University of New Mexico, Geospatial and Population Studies,
2014 Community Report Truth or Consequences
 4 Truth or Consequences Produced for the New Mexico Department of Transportation, Traffic Safety Division, Traffic Records Bureau, Under Contract 58 by the University of New Mexico, Geospatial and Population
2014 Community Report Tularosa
 4 Tularosa Produced for the New Mexico Department of Transportation, Traffic Safety Division, Traffic Records Bureau, Under Contract 8 by the University of New Mexico, Geospatial and Population Studies,
NISSAN GROUP. More than 34 Years of Manufacturing in America IS INVESTING IN AMERICA FUTURE IN AMERICA JOBS IN AMERICA SOURCED IN AMERICA
 NISSAN GROUP IS INVESTING U.S. SALES GROWTH In 2017, Nissan Group set an all-time U.S. record in 2017 with total sales of 1,593,464 units, up 2 percent over the prior year. Nissan continues to grow sales
2014 Community Report Aztec
 Aztec Produced for the New Mexico Department of Transportation, Traffic Safety Division, Traffic Records Bureau, Under Contract 58 by the University of New Mexico, Geospatial and Population Studies, Traffic
2014 Community Report Los Lunas
 4 Los Lunas Produced for the New Mexico Department of Transportation, Traffic Safety Division, Traffic Records Bureau, Under Contract 58 by the University of New Mexico, Geospatial and Population Studies,
Strategies That Work to Reduce Alcohol-Impaired Driving
 Strategies That Work to Reduce Alcohol-Impaired Driving Committee on Accelerating Progress to Reduce Alcohol-Impaired Driving Fatalities National Academy of Sciences, Engineering and Medicine James C.
NATIONAL CONFERENCE of STATE LEGISLATURES. October 9 th, 2009 Ervan Hancock
 NATIONAL CONFERENCE of STATE LEGISLATURES October 9 th, 2009 Ervan Hancock Georgia Power Overview Georgia Power Largest of four Southern Company electric utilities $7.2 billion in revenue 2.3M+ customers
EPA Emissions Standards for Switch and Line-Haul Locomotives
 EPA Emissions s for Switch and Line-Haul Locomotives Spring 2018 EPA Line-Haul Locomotive Emission s Tier Level Year of Manufacture NOx PM HC CO Effective Date 0 1973-1992 8.0 38 0.22 31 1.00 0 5.0 0 1998
Green Bus Technology Plan
 2018-2040 Green Bus Technology Plan November 2017 Rick Leary, Deputy CEO Bem Case, Head of Vehicle Programs Agenda 1. Evolution of Bus Technology 2. City / TTC Emissions Targets 3. Current Bus Technology
Weekly Statistical Bulletin
 API 1220 L Street, NW Washington, DC 20005 Weekly Statistical Bulletin STATISTICS DEPARTMENT Volume: 93 Number: 35 Week Ending: August 31, 2012 SUMMARY (In thousands of 42-gallon barrels per day, except
Net Metering in the world
 Net Metering in the world Jan Knaack, Senior Project Manager Buenos Aires, Dec. 15th, 2015 Bundesverband Solarwirtschaft e.v. (BSW-Solar) Basic problem of PV electricity generation Demand and supply do
The Impact of Primary Enforcement Laws on Seat Belt Use. NCSL Injury Prevention Meeting
 The Impact of Primary Enforcement Laws on Seat Belt Use NCSL Injury Prevention Meeting Phil Haseltine Alliance of Automobile Manufacturers May 14, 2009 Overall Effectiveness of Seat Belts Fatality Reductions
Please refer to the Frame Inspection Technical Instructions for the inspection procedure.
 To: Subject: All Toyota Dealer Principals, Service Manager, and Parts Managers (located in AK, AL, AR, AZ, CA, CO, FL, GA, HI, IA, ID, KS, LA, MO, MS, MT, NC, ND, NE, NM, NV, OK, OR, SC, SD, TN, TX, UT,
RETURN ON INVESTMENT LIQUIFIED NATURAL GAS PIVOTAL LNG TRUCK MARKET LNG TO DIESEL COMPARISON
 RETURN ON INVESTMENT LIQUIFIED NATURAL GAS PIVOTAL LNG TRUCK MARKET LNG TO DIESEL COMPARISON Year 1 Year 2 Year 3 Year 4 Year 5 Year 6 Year 7 Year 8 Year 9 Year 10 RETAIL BREAK EVEN AND IRR EXAMPLE FOR
I-95 Corridor-wide safety data analysis and identification of existing successful safety programs. Traffic Injury Research Foundation April 22, 2010
 I-95 Corridor-wide safety data analysis and identification of existing successful safety programs Traffic Injury Research Foundation April 22, 2010 Overview Background Methodology Purpose Crash analysis
Five Star Dealer USA.
 Five Star Dealer USA http://dealer.leviton.com The 2016 Five Star Dealer Program Apply Today! USA application deadline: Through December 31st, 2016 at http://dealer.leviton.com The 2016 Five Star Dealer
Thru-The-Wall TTWC-R Series Condensing Unit Catalog 1-1/2 To 2-1/2 Ton Capacity
 Thru-The-Wall TTWC-R Series Condensing Unit Catalog 1-1/2 To 2-1/2 Ton Capacity ALL UNITS MT 2010 DO STANDARDS / ARI 210/240 CONDITIONS With Multi-Family housing on the rise, today s projects require more
CSA State of the Union
 CSA State of the Union June 5, 2014 Steve Bryan s.bryan@vigillo.com About Vigillo Founded in 2007 by a team of statisticians and software engineers with a talent for deciphering complex information and
Mitsubishi Motors EV Commitment. David N. Patterson, PE Chief Engineer Mitsubishi Motors North America
 Mitsubishi Motors EV Commitment David N. Patterson, PE Chief Engineer Mitsubishi Motors North America Environmental Vision 2020 Vehicle-produced CO 2 Gasoline & Diesel Fuel Efficiency Improvement Increase
TOYOTA IMPORTANT UPDATE
 TOYOTA IMPORTANT UPDATE Product Support Division The attached Dealer Letter has been updated, refer to the details below. DATE February 11, 2016 TOPIC Remedy is now available for Phase 2, New York Region.
Route truck by fuel stops? Spread gap by historical proration of fleet/of truck? Spread gap based on current travel history of truck? Other?
 Truck 302 GPS Vendor 3 and Traditional Fuel receipts GPS Vendor 3 reports chronologically as truck travels the distance by state with odometer readings at the entry and exit of every state and the lat/lon
the Ministry of Transport is attributed as the source of the material images contained in the material are not copied
 Speed 2017 Disclaimer All reasonable endeavours are made to ensure the accuracy of the information in this report. However, the information is provided without warranties of any kind including accuracy,
se 1:13-cv TDS-JEP Document Filed 05/19/14 Page 1 of
 se 1:13-cv-00660-TDS-JEP Document 118-2 Filed 05/19/14 Page 1 of Figure 2-5. Vehicle Miles Traveled on Public Roads by Vehicle Type, 1970 2006 The amount of use of different types of vehicles varies from
U.S. Heat Pump Water Heater Market Transformation: Where We ve Been and Where to Go Next
 U.S. Heat Pump Water Heater Market Transformation: Where We ve Been and Where to Go Next JOSH BUTZBAUGH LINDA SANDAHL MICHAEL BAECHLER SEPTEMBER 14, 2017 1 Agenda Agenda Background Technology Considerations
1. Owner Notification Letter Mailing Date
 TO: SUBJECT: ALL TOYOTA DEALER PRINCIPALS, SERVICE MANAGERS, PARTS MANAGERS SPECIAL SERVICE CAMPAIGN (SAFETY RECALL) 60H (2005 THROUGH LATE 2006 MODEL YEAR SCION tc SIDE IMPACT AIRBAG SENSORS) Toyota will
Customer Frequently Asked Questions
 Safety Recall DSF - UPDATE Certain 2003-2008 Model Year Corolla and Corolla Vehicles Certain 2003-2006 Model Year Tundra Vehicles Certain 2002-2007 Model Year Sequoia Vehicles Front Passenger Airbag Inflator
BAF Overview. Barry P. Carr Northeast Regional Sales Manager November 2012
 BAF Overview Barry P. Carr Northeast Regional Sales Manager November 2012 Founded in 1992 by industry veterans is the leading provider of natural gas vehicle conversions in the United States More than
Evaluating the impact of feedstock quality on delivered cost: Two case studies from the US Southeast region
 Evaluating the impact of feedstock quality on delivered cost: Two case studies from the US Southeast region Laurence Eaton*, Matthew Langholtz, Craig Brandt, Erin Webb, Mark Downing Oak Ridge National
Percentage of crashes with driving too fast for the conditions cited as a contributing factor ( ) 0% 5% 10% 15% 20% 25% 30% 35% Percentage
 0% 5% 10% 15% 20% 25% 30% 35% Percentage") Speeding CRASH FACTSHEET November 2013 CRASH STATISTICS FOR THE YEAR ENDED 31 DECEMBER 2012 Prepared by the Ministry of Transport In this fact sheet speeding is defined as driving too fast for the conditions.
Speeding CRASH FACTSHEET November 2013 CRASH STATISTICS FOR THE YEAR ENDED 31 DECEMBER 2012 Prepared by the Ministry of Transport In this fact sheet speeding is defined as driving too fast for the conditions.
EA Closing Report Page 1 of 9
 EA06-002 Closing Report Page 1 of 9 SUBJECT: Rear coil spring fracture ENGINEERING ANALYSIS CLOSING REPORT EA No: EA06-002 DATE OPENED: 24-Jan-2006 DATE CLOSED: 05-Feb-2007 SUBJECT VEHICLES: Model Year
All Toyota Dealer Principals, Service Managers, and Parts Managers
 To: All Toyota Dealer Principals, Service Managers, and Parts Managers Subject: Safety Recall C0U Remedy Parts Available 2004 to Certain 2009 Model Year Prius Vehicles Hybrid Electric Water Pump As previously
Executive Summary: U.S. Residential Solar Economic Outlook :
 Executive Summary: U.S. Residential Solar Economic Outlook 2016-2020: Grid Parity, Rate Design and Net Metering Risk Cory Honeyman Senior Analyst, Solar Markets honeyman@gtmresearch.com February 2016 Table
Up to Spec! American Coalition for Ethanol Annual Conference, August 17, Kristy Moore KMoore Consulting LLC
 Up to Spec! American Coalition for Ethanol Annual Conference, August 17, 2017 Kristy Moore KMoore Consulting LLC Today s Presentation Topics International Fuel Market Development Domestic Market Development
Weather Shield Thermal Performance Criteria
 Weather Shield Thermal Perfmance Criteria As a proud ENERGY STAR partner, we ensure our products are rated, certifi ed and labeled f and by the National Fenestration Council (NFRC). The 2010 ENERGY STAR