Doc t ju kompetences Eiropas augst k s izgl t bas telp
|
|
|
- Beverly Doyle
- 6 years ago
- Views:
Transcription
1 Doc t ju kompetences Eiropas augst k s izgl t bas telp Prof. Andrejs Rauhvargers, Eiropas Universitāšu asociācijas vecākais padomnieks Tel , e-pasts: andrejs.rauhvargers@l u.lv rp@lanet.lv
2 Prof. Andrejs Rauhvargers, Eiropas Universitāšu asociācijas vecākais padomnieks Tel , e-pasts: u.lv

3 Izmai as jaunu cilv ku skait Eirop Eurostat, 2011
4 Jaun s ES valstis: Izmai as vecuma grup s 0-9, un gadi no l dz gadam Jaunaj s ES valst s gad 0-9 g. v. skaits 72% no g. (ES15 valst s 85%) Millions

5 Jaunu cilv ku patsvars da dos Eiropas re ionos 2008

6 Paredzam s 5-9 gadu vecu b rnu patsvara izmai as, Eurostst, 2011

7 Paredzam s gadu vecu skol nu patsvara izmai as Eurostat,

8 Paredzam s gadu cilv ku patsvara izmai as: starp un gadu un starp un gadu
9 Vai taisnība, ka Eiropa ir ļoti izglītota?
 Mācās = no sākumskolas līdz ISCED 6 līmenim visas formālās izglītības programmas + pieaugušo izglītība, kurai ir līdzīgs saturs kā formālajām programm ām Rekordi: IS (32%), UK (29%), >")
10 Cik liela daļa no katras nācijas mācās? Grafiks parāda iedzīvotāju, kuri mācās īpatsvaru kopējā iedzīvotāju skaitā(2001/2002. gada dati) Mācās = no sākumskolas līdz ISCED 6 līmenim visas formālās izglītības programmas + pieaugušo izglītība, kurai ir līdzīgs saturs kā formālajām programm ām Rekordi: IS (32%), UK (29%), > 25%+ SE, NO, BE, EE, IE, FI, LT (LV 24% ) < 20%- BG (18,7), IT (18,9) EL (19,3)

11 Cik gadus izgl t b pavad s pa reiz jais piecgad gais?

12 Skolnieku un stud jo o patsvars 3-19 un 3-29 gadu vecuma grup s
13 ISCED līm. Angliskais nosauk. ISCED klasifik cija Vecums, gadi Latviskais nosauk. 0 Pre-primary education 3-6 Pirmsskolas izglītība 1 Primary education or first stage of basic education 2 Lower secondary or second stage of basic education 7-10 Sākumskolas izglītība vai pamatizglītības 1.pakāpe Pamatizglītības 2.pakāpe 3 A B (Upper) Secondary education Vidējā izglītība 4A B Post- secondary non-tertiary education 5 A B First stage of tertiary education 6 Second stage of tertiary education Izglītība pēc vidējās izglītības, kas neskaitās pie terciārās Terciārās izglītības 1.pakāpe Terciārās izglītības 2.pakāpe

14 Iedz vot ju pastvars, kuri nav ieguvu i vismaz vid jo izgl t bu (ISCED 3), dati no Key data 2005 jaunākās paaudzes ir labāk izglītotas vidusskol
15 2002. gad ES vid jais (20-24.g n ko aj ) vecuma grup g. 25,1% (2000. gad 29%) bez vid. izgl NO, CZ, SK, zem 10%, EE 10,5%, LT 11,8%, LV 14,5% ESP, IT virs 40%, rekords - PT 64,3% vecuma grup gadi 49,5% (2000.gad 54%) bez vid.izgl. ESP, IT, EL, virs 70%, MT PT virs 90%! DK, DE, CZ, SK, SI, S, NO 25-35%

16 Jaunie i ir izgl tot ki: Vid jo izgl t bu ieguvu ie g.v., (skolā ) dati no Key data 2005 par 2002.g. CZ,SK, SI, NO p ri par 90%, BE, FR, FI, IE,HU, AT, PL, SE > 80% MT 39%, PT - 44%, IS 51% Baltija: EE 80%, LT 79%, LV 73,2 % Latvija ar DE un NL dala vietu no 29
17 Cik daudz cilvēku turpina mācīties pēc 15 gadu vecuma?

18 Jauni cilv ki (15 l dz 24 gadiem) izgl t b un profes. izgl t b, ES valstis gads Eirop skol nu un studentu skaits sast da gandr z ceturto da u no visiem iedz vot jiem
 Eirop skol nu un studentu skaits sast da gandr z ceturto da u no visiem iedz")
19 Skolnieku un stud jo o patsvars gadu vecuma grup, 2001/2002 m c bu gads (Key2005) Eirop skol nu un studentu skaits sast da gandr z ceturto da u no visiem iedz vot jiem

20 Vidusskol nu iesaiste visp r j un aroda izgl t b

21 Vidusskol nu iesaiste visp r j un aroda izgl t b Key data 2012
 vecum 30-64 gadi, Key data")
22 Iedz vot ji ar augst k s izgl t bas kvalifik cij m (ISCED 5-6) vecum gadi, Key data 2012

23 Sievietes stud vair k nek v rie i Sievie u skaits (ISCED 5-6) uz 100 v rie u augst k s izgl t bas kvalifik ciju ieguv ju vid 2001/2002.m.g. Rekordistes Latvija un Igaunija, Polija (virs 200) t l k seko, Lietuva, Portug le, Islande, Norv ija (virs 150) Vistuv k pie 1:1 ir Austrija, V cija un Malta)

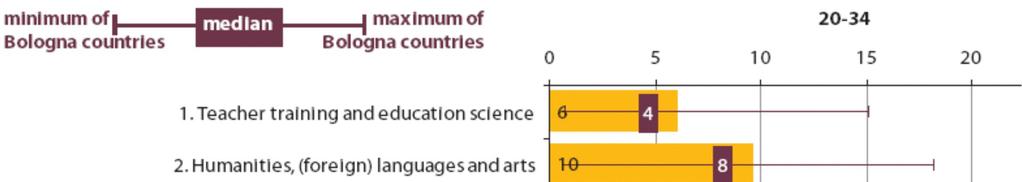
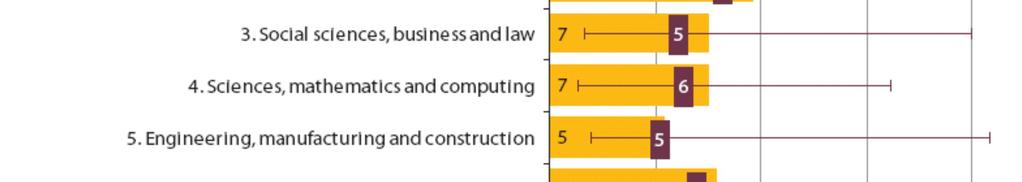
24 Sievie u ieg to gr du patsvars Eurydice 2012 Izgl t ba Humanit.zin Soc.zin Dabaszin In enierzin Lauksaimn. Vesel.,labkl. Pakalpojumi

25 Annual expenditure in public institutions per pupil/student Key data 2012

26 Augst ka izgl t ba = lab ka nodarbin t ba Eurydice 2012

27 Bezdarbnieki atkar b no izgl t bas un dzimuma, Eurostat, 2011

28 P rejas laiks no izgl t bas uz darbu Key data 2012

29 Pagaidu darbaviet as atkar b no izglītības līmeņa Eurostat, 2011

30 Studentu sadal jums pa studiju jom m (%) Avots: Eurydice, KeyData 2012 (dati uz gada jūliju)

31 Stud jo o sadal jums pa studi ju jom m,

32 Unemployment rate of HE graduates Eurostat, EU-LFS
33 Izgl t bas finans ana
34 Euroatat 2012 IKP uz vienu iedzīvotāju (PPS) gadā EU27= Luxembourg Norway Switzerland United States Netherlands Austria Ireland Sweden Denmark Germany Belgium Finland Iceland United Kingdom France Japan Italy EU (27 countries) Spain Cyprus Slovenia Malta Greece Czech Republic Portugal Slovakia Estonia Hungary Poland Lithuania Croatia Latvia Turkey Romania Bulgaria Montenegro Macedonia Serbia Albania Bosnia and
35 Valsts izdevumi gadā uz vienu studentu (EUR PPS)
36 100,0 Gada izdevumi uz vienu studentu valsts izglītības iestādēs kā procents no IKP uz vienu iedzīvotāju (2009. gads) 90,0 88,6 80,0 70,0 60,0 50,0 40,0 30,0 54,8 52,5 49,1 48,9 48,3 48,2 46,2 45,5 44,8 43,9 43,2 43,1 42,0 42,0 41,6 41,1 41,1 40,0 38,3 37,1 36,3 35,5 34,4 29,5 29,4 29,1 22,9 20,0 10,0 0,0
37 3,00 Valsts izdevumi augstākajai izglītībai kā % no iekšzemes kopprodukta (2009. gads) 2,50 2,41 1,63 1,60 1,57 1,54 1,47 1,39 1,38 1,34 1,34 1,34 1,27 1,22 1,20 1,19 1,14 1,14 1,13 1,07 1,07 1,02 0,95 0,86 0,82 0,81 0,81 0,79 2,23 2,16 2,06 2,04 2,00 1,50 1,00 0,50 0,00
38 Valsts izdevumi augstākajai izglītībai kā % no iekšzemes kopprodukta 2,50 Finland; 2,16 2,00 Sweden; 2,04 1,50 1,00 Ireland; 1,54 Germany; 1,34 Estonia; 1,34 EU27; 1,22 United States; 1,24 Lithuania; 1,14 Latvia; 0,79 0,50 0,
39 Valsts izdevumi gadā uz vienu studentu pret izdevumiem uz vienu skolēnu gadā (ISCED 5-6) / (ISCED2-4) 2,50 2,34 2,27 2,21 2,00 2,05 1,97 1,85 1,81 1,80 1,50 1,69 1,67 1,62 1,58 1,54 1,52 1,52 1,48 1,46 1,42 1,42 1,39 1,34 1,34 1,26 1,22 1,20 1,19 1,17 0,77 1,04 1,00 0,50 0,00

40 Valsts izdevumi uz skol nu/ studentu pa izgl t bas l me iem, EUR, pps (Eurydice, 2009)
41 Valsts izdevumi gadā uz vienu studentu (EUR PPS) United States Sweden Ireland EU Estonia Lithuania Latvia
42 70 Valstī plānotais iedzīvotāju % ar augstāko izglītību vecuma grupā ,3 26,

43 Priv tie maks jumi augst kaj izgl t b (ISCED 5)
December 2011 compared with November 2011 Industrial producer prices down by 0.2% in both euro area and EU27
 18/2012-2 February 2012 December 2011 compared with November 2011 Industrial producer prices down by 0.2% in both euro area and EU27 In December 2011, compared with November 2011, the industrial producer
September 2011 compared with August 2011 Industrial producer prices up by 0.3% in euro area Up by 0.4% in EU27
 161/2011-4 November 2011 September 2011 compared with August 2011 Industrial producer prices up by 0.3% in euro area Up by 0.4% in EU27 In September 2011 compared with August 2011, the industrial producer
February 2014 Euro area unemployment rate at 11.9% EU28 at 10.6%
 STAT/14/52 1 April 2014 February 2014 Euro area unemployment rate at 11.9% EU28 at 10.6% The euro area 1 (EA18) seasonally-adjusted 2 unemployment rate 3 was 11.9% in February 2014, stable since October
June 2014 Euro area unemployment rate at 11.5% EU28 at 10.2%
 STAT/14/121 31 July 2014 June 2014 Euro area unemployment rate at 11.5% EU28 at 10.2% The euro area 1 (EA18) seasonally-adjusted 2 unemployment rate 3 was 11.5% in June 2014, down from 11.6% in May 2014
May 2014 Euro area unemployment rate at 11.6% EU28 at 10.3%
 STAT/14/103-1 July 2014 May 2014 Euro area unemployment rate at 11.6% EU28 at 10.3% The euro area 1 (EA18) seasonally-adjusted 2 unemployment rate 3 was 11.6% in May 2014, stable compared with April 2014
1. INTERNATIONAL OVERVIEW. 1.0 Area and population. population (1,000) area
 area") 1.0 Area and population area population (1,000) km 2 2000 2010 2018 1 inhabitants per km 2 Belgium 30,530 10,251 10,920 11,443 375 Germany 357,380 82,212 81,777 82,952 232 Estonia 45,230 1,397 1,331 1,315
1.0 Area and population area population (1,000) km 2 2000 2010 2018 1 inhabitants per km 2 Belgium 30,530 10,251 10,920 11,443 375 Germany 357,380 82,212 81,777 82,952 232 Estonia 45,230 1,397 1,331 1,315
March 2013 Euro area unemployment rate at 12.1% EU27 at 10.9%
 STAT/13/70 30 April 2013 March 2013 Euro area unemployment rate at 12.1% at 10.9% The euro area 1 (EA17) seasonally-adjusted 2 unemployment rate 3 was 12.1% in March 2013, up from 12.0% in February 4.
Emissions per capita and GDP
 Emissions per capita and GDP (1990 -) CEIP Centre on Emission Inventories and Projections Emissions per capita and emissions per GDP were calculated for all years from 1990 to where data was available
AUSTRIA. Table 1. FDI flows in the host economy, by geographical origin. (Millions of US dollars)
") Table 1. FDI flows in the host economy, by geographical origin World 5 690 138 6 195 3 184 10 784 7 933 31 154 6 858 9 303 840 10 618 5 760 Developed economies 5 740 13 5 341 2 689 10 137 6 291 29 721
Table 1. FDI flows in the host economy, by geographical origin World 5 690 138 6 195 3 184 10 784 7 933 31 154 6 858 9 303 840 10 618 5 760 Developed economies 5 740 13 5 341 2 689 10 137 6 291 29 721
ACEA Report. Vehicles in use Europe 2017
 ACEA Report Vehicles in use Europe 2017 TABLE OF CONTENTS Summary... 2 Vehicles in use in Europe... 3 Passenger cars... 3 Light commercial vehicles... 4 Medium and heavy commercial vehicles... 5 Buses...
First Trends H2020 vs FP7: winners and losers
 First Trends H2020 vs FP7: winners and losers Special focus on EU13 countries by Christian Saublens for EURADA INTRODUCTION Based on data available on the Cordis website on 3 December 2015, it is possible
NEW ALTERNATIVE FUEL VEHICLE REGISTRATIONS IN THE EUROPEAN UNION 1 Q1 2015
 NEW ALTERNATIVE FUEL VEHICLE REGISTRATIONS IN THE Q1 2015 ALTERNATIVE FUEL VEHICLE registrations: +28.8% in in first quarter In the first quarter of 2015, total alternative fuel vehicle (AFV) registrations
NEW ALTERNATIVE FUEL VEHICLE REGISTRATIONS IN THE EUROPEAN UNION 1 Q2 2015
 NEW ALTERNATIVE FUEL VEHICLE REGISTRATIONS IN THE Q2 2015 New alternative fuel vehicle (AFV) registrations in the EU by engine type Q2 2014 Q2 2015 Thousand units 70 60 50 40 30 20 10 0 EVs HEVs AFVs other
THE EUROPEAN MARKETS AND STRATEGIES TO WATCH FOR MAXIMUM OPPORTUNITY
 THE EUROPEAN MARKETS AND STRATEGIES TO WATCH FOR MAXIMUM OPPORTUNITY BRIAN MADSEN ONLINE AUCTIONS IT SOLUTIONS SMART DATA 1 THE SPEED OF CHANGE IS FASTER THAN EVER 2 THE NEW NORMAL 3 CHANGE OF OWMERSHIP
NEW PASSENGER CAR REGISTRATIONS BY ALTERNATIVE FUEL TYPE IN THE EUROPEAN UNION 1 Quarter
 PRESS EMBARGO: NEW PASSENGER CAR REGISTRATIONS BY ALTERNATIVE FUEL TYPE IN THE EUROPEAN UNION 1 Quarter 3 2017 Alternative fuel vehicle registrations: +51.4% in third quarter of 2017 In the third quarter
NEW COMMERCIAL VEHICLE REGISTRATIONS EUROPEAN UNION 1 February 2018
 PRESS EMBARGO: NEW COMMERCIAL VEHICLE REGISTRATIONS EUROPEAN UNION 1 February 2018 Next press release: Tuesday 24 April 2018 1 Malta not available Page 1 of 7 Commercial vehicle registrations: +6.5% first
NEW COMMERCIAL VEHICLE REGISTRATIONS EUROPEAN UNION 1. December 2018
 PRESS EMBARGO: NEW COMMERCIAL VEHICLE REGISTRATIONS EUROPEAN UNION 1 December 2018 Commercial vehicle registrations: +3.2% in 2018; 4.0% in December Total new commercial vehicles In December 2018, commercial
NEW COMMERCIAL VEHICLE REGISTRATIONS EUROPEAN UNION 1. October 2016
 PRESS EMBARGO: NEW COMMERCIAL VEHICLE REGISTRATIONS EUROPEAN UNION 1 October 2016 Next press release: Thursday 22 December 2016 1 Data for Malta unavailable Page 1 of 7 Commercial vehicle registrations:
NEW PASSENGER CARS BY FUEL TYPE IN THE EUROPEAN UNION 1 Quarter
 PRESS EMBARGO: NEW PASSENGER CARS BY FUEL TYPE IN THE EUROPEAN UNION 1 Quarter 1 2018 Next press release: Thursday 6 September 2018 1 Data for Croatia, Cyprus, Luxembourg and Malta is not available Page
September 2003 Industrial producer prices stable in euro-zone and EU15
 STAT/03/123 31 October 2003 September 2003 Industrial producer prices stable in euro-zone and EU15 The euro-zone 1 industrial producer price index 2 remained unchanged in September 2003 compared with the
NEW PASSENGER CAR REGISTRATIONS BY ALTERNATIVE FUEL TYPE IN THE EUROPEAN UNION 1 Quarter
 PRESS EMBARGO: NEW PASSENGER CAR REGISTRATIONS BY ALTERNATIVE FUEL TYPE IN THE EUROPEAN UNION 1 Quarter 2 2016 Alternative fuel vehicle registrations: +0.6% in second quarter of 2016 In the second quarter
NEW PASSENGER CAR REGISTRATIONS BY ALTERNATIVE FUEL TYPE IN THE EUROPEAN UNION 1 Quarter
 PRESS EMBARGO: NEW PASSENGER CAR REGISTRATIONS BY ALTERNATIVE FUEL TYPE IN THE EUROPEAN UNION 1 Quarter 2 2017 Alternative fuel vehicle registrations: +38.0% in second quarter of 2017 In the second quarter
NEW PASSENGER CARS BY FUEL TYPE IN THE EUROPEAN UNION 1 Quarter
 PRESS EMBARGO: NEW PASSENGER CARS BY FUEL TYPE IN THE EUROPEAN UNION 1 Quarter 1 2018 Next press release: Thursday 6 September 2018 1 Data for Croatia, Cyprus, Luxembourg and Malta is not available Page
NEW COMMERCIAL VEHICLE REGISTRATIONS EUROPEAN UNION 1. April 2017
 PRESS EMBARGO: NEW COMMERCIAL VEHICLE REGISTRATIONS EUROPEAN UNION 1 April 2017 Next press release: Friday 23 June 2017 1 Data for Malta unavailable Page 1 of 7 Commercial vehicle registrations: +3.8%
Euro area unemployment rate at 10.5%
 3/2016-7 January 2016 November 2015 Euro area unemployment rate at 10.5% EU28 at 9.1% The euro area (EA19) seasonally-adjusted unemployment rate was 10.5% in November 2015, down from 10.6% in October 2015,
DRINK-DRIVING IN THE EUROPEAN UNION
 DRINK-DRIVING IN THE EUROPEAN UNION Safe and Sober Talk Switzerland Bern, 17 th of October 2017 Frank Mütze Policy & Project Officer ETSC ETSC A science based approach to road safety Secretariat in Brussels
NEW PASSENGER CAR REGISTRATIONS BY FUEL TYPE IN THE EUROPEAN UNION 1
 PRESS EMBARGO: NEW PASSENGER CAR REGISTRATIONS BY FUEL TYPE IN THE EUROPEAN UNION 1 Quarter 3 2018 Fuel types of new cars: diesel 18.2%, petrol +15.2%, electric +30.0% in third quarter of 2018 In the third
NEW COMMERCIAL VEHICLE REGISTRATIONS EUROPEAN UNION* September 2014
 PRESS EMBARGO: 8.00 A.M. (7.00 A.M GMT), October 28, 2014 NEW COMMERCIAL VEHICLE REGISTRATIONS EUROPEAN UNION* September 2014 Next Press Release: November 27, 2014 *Data for Malta unavailable Page 1 of
Production of heat by type Terajoules
 Production of heat by type Table Notes geo represents heat used directly for district heating, agriculture etc. without a commercial transaction taking place. Please refer to the Definitions Section on
NEW COMMERCIAL VEHICLE REGISTRATIONS EUROPEAN UNION 1. November 2018
 PRESS EMBARGO: NEW COMMERCIAL VEHICLE REGISTRATIONS EUROPEAN UNION 1 November 2018 Commercial vehicle registrations: +3.8% 11 months into 2018; +2.7% in November Total new commercial vehicles In November
June EU Countries NEW COMMERCIAL VEHICLE REGISTRATIONS. PRESS EMBARGO FOR ALL DATA: July 26, 2013, 8.00 A.M. (6.00 A.M. GMT)
") PRESS EMBARGO FOR ALL DATA: y 26, 213, 8. A.M. (6. A.M. GMT) Press s Release e e NEW COMMERCIAL VEHICLE REGISTRATIONS e 213 EU Countries 15, LCVs up to 3.5t 2, Heavy Trucks of 16t and over ons New Registrati
PRESS EMBARGO FOR ALL DATA: y 26, 213, 8. A.M. (6. A.M. GMT) Press s Release e e NEW COMMERCIAL VEHICLE REGISTRATIONS e 213 EU Countries 15, LCVs up to 3.5t 2, Heavy Trucks of 16t and over ons New Registrati
5-door FRS-ID: Year of production Legend. Version 4.3b / Opel Automobile GmbH. High strength zone
 Ampera-e 5-door Legend Airbag Stored gas inflator Seat belt pretensioner Gas strut / Preloaded spring High strength zone High voltage power cable / component High voltage disconnect SRS control unit Battery
NEW PASSENGER CAR REGISTRATIONS EUROPEAN UNION 1
 PRESS EMBARGO: 8.00 AM (6.00 AM GMT), 19 September 2018 NEW PASSENGER CAR REGISTRATIONS EUROPEAN UNION 1 Passenger car registrations: +6.1% eight months into 2018; +10.5% in July and +31.2% in August In
Inflation Differentials in Europe. Balázs Égert Economics Department, OECD
 Inflation Differentials in Europe Balázs Égert Economics Department, OECD Objectives of the presentation Different factors driving inflation rates in Europe Differences between mature and catching-up countries
Labour Market Latest Trends- 1st quarter 2008 data 1
 Population and social conditions Author: Fabrice ROMANS Data in focus 34/2008 Labour Market Latest Trends- 1st quarter 2008 data 1 Chart 1: Employment rate 2 (15-64 years) for from 2000Q1 to 2008Q1 % 66.5
ACEA Report. Vehicles in use Europe 2018
 ACEA Report Vehicles in use Europe 2018 TABLE OF CONTENTS Summary... 2 Vehicles in use in Europe... 3 Passenger cars... 3 Light commercial vehicles... 4 Medium and heavy commercial vehicles... 5 Buses...
DRIVERS FOR THE ECONOMICS OF GERMAN PV HOME STORAGE SYSTEMS A RAW MODEL TO BE USED IN OTHER EUROPEAN COUNTRIES?
 DRIVERS FOR THE ECONOMICS OF GERMAN PV HOME STORAGE SYSTEMS A RAW MODEL TO BE USED IN OTHER EUROPEAN COUNTRIES? Verena Jülch Fraunhofer Institute for Solar Energy Systems ISE IRES 2018 Düsseldorf, March
June EU Countries NEW COMMERCIAL VEHICLE REGISTRATIONS. PRESS EMBARGO FOR ALL DATA: July 26, 2012, 8.00 A.M. (6.00 A.M. GMT) LCVs up to 3.
 LCVs up to 3.") PRESS EMBARGO FOR ALL DATA: y 26, 212, 8. A.M. (6. A.M. GMT) Press s Release e e NEW COMMERCIAL VEHICLE REGISTRATIONS e 212 EU Countries 15, LCVs up to 3.5t 2, Heavy Trucks over 16t New Regis strations
PRESS EMBARGO FOR ALL DATA: y 26, 212, 8. A.M. (6. A.M. GMT) Press s Release e e NEW COMMERCIAL VEHICLE REGISTRATIONS e 212 EU Countries 15, LCVs up to 3.5t 2, Heavy Trucks over 16t New Regis strations
Production of heat by type Terajoules
 Production of heat by type Table Notes geo represents heat used directly for district heating, agriculture etc. without a commercial transaction taking place. represents heat used for the production of
Civil Dialogue Group on WINE Thursday April 19th, 2018
 COMMISSION EUROPÉENNE DIRECTION GÉNÉRALE DE L'AGRICULTURE ET DU DÉVELOPPEMENT RURAL Directorate G. Markets and Observatories G.2. Wine, spirits and horticultural products Bruxelles, le G.2/GD(2017) Civil
Sectoral Profile - Services
 Sectoral Profile - Services Energy consumption Changes in energy consumption and value added in services Since 2008 strong contraction of total energy consumption (-0.3%/year) although electricity consumption
TAXATION N 322 JC/ 49 /14 LC/ 39 /14 BARS/ 25 /14 WG-TX/ 2 /14 WG-CO2/ 23 /14 WG-EV/ 4 /14 WG-CSG/ 10 /14
 Brussels, 3 April 2014 TAXATION N 322 JC/ 49 /14 LC/ 39 /14 BARS/ 25 /14 WG-TX/ 2 /14 WG-CO2/ 23 /14 WG-EV/ 4 /14 WG-CSG/ 10 /14 Subject: Overview of C2 taxes and incentives for EVs Dear colleagues, Please
COMMISSION IMPLEMENTING DECISION
 L 188/50 Official Journal of the European Union 19.7.2011 COMMISSION IMPLEMENTING DECISION of 11 July 2011 on a Union financial contribution towards Member States fisheries control, inspection and surveillance
REPORT FROM THE COMMISSION TO THE EUROPEAN PARLIAMENT AND THE COUNCIL
 EUROPEAN COMMISSION Brussels, 23.3.2012 COM(2012) 127 final REPORT FROM THE COMMISSION TO THE EUROPEAN PARLIAMENT AND THE COUNCIL Quality of petrol and diesel fuel used for road transport in the European
BREXIT AND THE AUTO INDUSTRY: FACTS AND FIGURES
 BREXIT AND THE AUTO INDUSTRY: FACTS AND FIGURES GLOBAL TRADE European Union EU vehicle imports: Total value: 45,693 million Quantity: 3,395,419 units EU vehicle exports: Total value: 135,398 million Quantity:
BREXIT AND THE AUTO INDUSTRY: FACTS AND FIGURES
 BREXIT AND THE AUTO INDUSTRY: FACTS AND FIGURES GLOBAL TRADE European Union EU vehicle imports: Total value: 48,019 million Quantity: 3,640,975 units EU vehicle exports: Total value: 138,536 million Quantity:
Please find attached a copy of JAR-VLR Amendment 2 dated February 2007.
 oint Aviation Authorities Postal Address: P.O. Box 3000 2130 KA Hoofddorp Visiting Address: Saturnusstraat 50 The Netherlands Tel.: 31 (0)23-5679700 Fax: 31 (0)23-5621714 Our reference number: 01606evd
Winners & Losers by Market - January 2019 vs January 2018
 Countries 19/18 % Chg LITHUANIA +49,0 ROMANIA +18,8 HUNGARY +9,2 PORTUGAL +8,3 DENMARK +7,0 GREECE +3,7 LATVIA +0,7 POLAND -0,3 FRANCE -1,1 GERMANY -1,4 UNITED KINGDOM -1,6 NORWAY -2,2 LUXEMBOURG -3,4
Greening transport taxation
 Greening transport taxation Jos Dings GBE conference, Budapest, 8 July 2010 www.transportenvironment.org A ranking of transport tax anomalies 1 Tax free aviation 2 Private benefits of company cars 3 Europe
Single vehicle accidents
 Traffic Safety Basic Facts 2013 - Main Figures Traffic Safety Basic Facts 2015 Traffic Safety Single vehicle accidents Basic Facts 2015 Single vehicle accidents General In this Basic Fact Sheet, single
APPENDIX II AREA OF TERRITORY
 APPENDIX II AREA OF TERRITORY Date November 19, 2017 Operator Annex Type: 3 1 / 6 Annex (a) Broadband Type I Country Partner Name 2G 3G 4G Albania Vodafone Albania TRUE TRUE FALSE Austria T-Mobile TRUE
Please find attached a copy of JAR-27 Amendment 6 dated December 2007.
 oint Aviation Authorities Postal Address: P.O. Box 3000 2130 KA Hoofddorp Visiting Address: Saturnusstraat 40-44 The Netherlands Tel.: 31 (0)23-5679790 Fax: 31 (0)23 5657731 www.jaa.nl January 2008 JAR-27
Infographics on Electromobility (January 2019)
") Infographics on Electromobility (January 2019) Publisher: BMW Group Corporate Communications Electromobility Last Update: 04.01.2019 Contact: presse@bmw.de ELECTROMOBILITY IN GERMANY. SHARE IN NEW REGISTRATIONS
Infographics on Electromobility (January 2019) Publisher: BMW Group Corporate Communications Electromobility Last Update: 04.01.2019 Contact: presse@bmw.de ELECTROMOBILITY IN GERMANY. SHARE IN NEW REGISTRATIONS
Tackling the Three Main Killers on the roads - A priority for the forthcoming EU Road Safety Action Programme Klaus Machata Austrian Road Safety
 Tackling the Three Main Killers on the roads - A priority for the forthcoming EU Road Safety Action Programme Klaus Machata Austrian Road Safety Board Tackling the Three Main Killers... Speed, drink driving
DEMOGRAPHIC PERSPECTIVES AND IMPLICATIONS FOR VOCATIONAL EDUCATION AND TRAINING IN THE EUROPEAN UNION FINAL REPORT
 DEMOGRAPHIC PERSPECTIVES AND IMPLICATIONS FOR VOCATIONAL EDUCATION AND TRAINING IN THE EUROPEAN UNION FINAL REPORT Peter Ekamper Netherlands Interdisciplinary Demographic Institute Lange Houtstraat 19
Road safety in Europe. Graziella Jost, ETSC, PIN Programme Manager
 Road safety in Europe Graziella Jost, ETSC, PIN Programme Manager ETSC PIN Programme 1 Compare country performance in road safety Include the 27 EU Member States (+ Israel, Norway and Switzerland) A PIN
Survey on passengers satisfaction with rail services. Analytical report. Flash Eurobarometer 326 The Gallup Organization
 Flash Eurobarometer 326 The Gallup Organization Flash Eurobarometer European Commission Survey on passengers satisfaction with rail services Analytical report Fieldwork: March 2011 Publication: June 2011
211 STATISTICAL APPENDIX
 211 STATISTICAL APPENDIX For the user s convenience, as well as to lighten the text, the Economic Survey of Europe includes a set of appendix tables showing time series for the main economic indicators
Winners & Losers by Market - July 2018 vs July 2017
 Countries July 18/17 % Chg LITHUANIA +56,5 CROATIA +43,7 ROMANIA +34,2 HUNGARY +29,0 POLAND +25,7 SPAIN +19,3 FRANCE +18,9 SLOVENIA +17,6 BELGIUM +16,8 PORTUGAL +13,6 AUSTRIA +13,5 GERMANY +12,3 NETHERLANDS
NEW PASSENGER CAR REGISTRATIONS EUROPEAN UNION 1
 PRESS EMBARGO: 8.00 AM (6.00 AM GMT), 17 May 2018 NEW PASSENGER CAR REGISTRATIONS EUROPEAN UNION 1 Passenger car registrations: +2.7% four months into 2018; +9.6% in In 2018, the EU passenger car market
External and intra-european Union trade
 ISSN 1606-3481 External and intra-european Union trade Data 2004 09 2010 edition Pocketbooks External and intra-european Union trade Data 2004 09 2010 edition Europe Direct is a service to help you find
Imports of seed for sowing by country Calendar year 2011 Source: ISF compilation based on official statistics and international seed trade reports
 USA 157,432 15,562 464 173,458 523 318 67 908 Germany 195,159 5,913 520 201,592 595 97 22 714 France 125,701 4,389 277 130,367 522 150 11 683 Netherlands 140,899 12,253 796 153,948 250 330 48 628 Italy
Alcohol Interlocks and the fight against Drink-Driving
 Alcohol Interlocks and the fight against Drink-Driving Safe and Sober Seminar Portuguese Parliament - Assembleia da República Lisbon, Portugal Wednesday 22 nd April 2015 Ilyas Daoud Project Manager Ilyas.Daoud@etsc.eu
NEW PASSENGER CAR REGISTRATIONS EUROPEAN UNION 1
 PRESS EMBARGO: 8.00 AM (6.00 AM GMT), 17 July 2018 NEW PASSENGER CAR REGISTRATIONS EUROPEAN UNION 1 Passenger car registrations: +2.9% during first half of 2018; +5.2% in In 2018, passenger car registrations
NEW PASSENGER CAR REGISTRATIONS EUROPEAN UNION 1
 PRESS EMBARGO: 8.00 AM (7.00 AM GMT), 15 February 2019 NEW PASSENGER CAR REGISTRATIONS EUROPEAN UNION 1 Passenger car registrations: 4.6% in 2019 In 2019, the European passenger car market saw a slow start
Winners & Losers by Market - December 2018 vs December 2017
 Countries December 18/17 % Chg LITHUANIA +24,8 CROATIA +16,1 NETHERLANDS +15,3 ROMANIA +12,3 ITALY +2,0 GREECE -1,1 SPAIN -3,5 PORTUGAL -5,3 CYPRUS -5,3 POLAND -5,5 UNITED KINGDOM -5,5 GERMANY -6,7 LUXEMBOURG
NEW PASSENGER CAR REGISTRATIONS EUROPEAN UNION *
 PRESS EMBARGO: 8.00 AM (6.00 AM GMT), 16 April 2015 NEW PASSENGER CAR REGISTRATIONS EUROPEAN UNION * PASSENGER CAR registrations: +8.6% in first quarter; +10.6% in In 2015, demand for new passenger cars
NEW PASSENGER CAR REGISTRATIONS EUROPEAN UNION *
 PRESS EMBARGO: 8.00 AM (7.00 AM GMT), 17 November 2015 NEW PASSENGER CAR REGISTRATIONS EUROPEAN UNION * Passenger car registrations: +8.2% over ten months; +2.9% in In 2015, the EU passenger car market
Winners & Losers by Market - September 2018 vs September 2017
 Countries September 18/17 % Chg BULGARIA +8,5 CROATIA +3,3 SLOVENIA -7,3 HUNGARY -7,4 LITHUANIA -8,3 CYPRUS -9,9 LATVIA -11,0 FRANCE -12,8 PORTUGAL -14,0 DENMARK -16,0 NETHERLANDS -16,7 SWITZERLAND -16,8
NEW PASSENGER CAR REGISTRATIONS EUROPEAN UNION 1
 PRESS EMBARGO: 8.00 AM (6.00 AM GMT), 17 October 2017 NEW PASSENGER CAR REGISTRATIONS EUROPEAN UNION 1 Passenger car registrations: +3.7% over nine months; 2.0% in In 2017, passenger car registrations
NEW PASSENGER CAR REGISTRATIONS EUROPEAN UNION 1
 PRESS EMBARGO: 8.00 AM (7.00 AM GMT), 14 December 2017 NEW PASSENGER CAR REGISTRATIONS EUROPEAN UNION 1 Passenger car registrations: +4.1% over 11 months; +5.9% in In 2017, registrations of new passenger
Single vehicle accidents
 Traffic Safety Basic Facts 2013 - Main Figures Traffic Safety Basic Facts 2016 Traffic Safety Single vehicle accidents Basic Facts 2016 Single vehicle accidents A significant decrease of 44% in single
C-eight QUICK START GUIDE & REGULATORY
 Head Office 185 avenue Archimède 13857 Aix-en-Provence Cedex 3 France Tel. +33(0)4 42 65 25 65 Fax +33(0)4 42 51 57 32 SAS au Capital de 100 000 Euros RCS AIX 509 059 572 SIRET: 509 059 572 00016 APE 6201Z
Winners & Losers by Market - April 2017 vs April 2016
 Countries April 17/16 % Chg CROATIA +29,6 1 PORTUGAL +17,8 2 POLAND +14,4 BULGARIA +14,1 LITHUANIA +10,7 SLOVENIA +9,7 HUNGARY +7,7 ROMANIA +7,5 NETHERLANDS +6,3 ESTONIA +4,3 SPAIN +1,1 SLOVAKIA -0,1 CZECH
Winners & Losers by Market - June 2017 vs June 2016
 Countries June 17/16 % Chg ROMANIA +47,0 1 CYPRUS +46,0 2 LITHUANIA +40,6 ESTONIA +33,7 BULGARIA +31,4 SLOVENIA +16,4 SLOVAKIA +14,5 GREECE +14,4 ITALY +12,9 HUNGARY +11,6 ICELAND +10,2 CROATIA +8,8 POLAND
NEW PASSENGER CAR REGISTRATIONS EUROPEAN UNION 1
 PRESS EMBARGO: 8.00 AM (6.00 AM GMT), 16 June 2017 NEW PASSENGER CAR REGISTRATIONS EUROPEAN UNION 1 Passenger car registrations: +5.3% five months into 2017; +7.6% in In 2017, passenger car registrations
NEW PASSENGER CAR REGISTRATIONS EUROPEAN UNION 1
 PRESS EMBARGO: 8.00 AM (7.00 AM GMT), 15 February 2018 NEW PASSENGER CAR REGISTRATIONS EUROPEAN UNION 1 Passenger car registrations: +7.1% in 2018 In 2018, demand for passenger cars in the European Union
NEW PASSENGER CAR REGISTRATIONS EUROPEAN UNION 1
 PRESS EMBARGO: 8.00 AM (6.00 AM GMT), 16 May 2017 NEW PASSENGER CAR REGISTRATIONS EUROPEAN UNION 1 Passenger car registrations: +4.7% four months into 2017; 6.6% in In 2017, the number of passenger cars
NEW PASSENGER CAR REGISTRATIONS EUROPEAN UNION 1
 PRESS EMBARGO: 8.00 AM (6.00 AM GMT), 17 October 2018 NEW PASSENGER CAR REGISTRATIONS EUROPEAN UNION 1 Passenger car registrations: +2.5% nine months into 2018; 23.5% in In 2018, registrations of new passenger
NEW PASSENGER CAR REGISTRATIONS EUROPEAN UNION 1
 PRESS EMBARGO: 8.00 AM (6.00 AM GMT), 19 April 2017 NEW PASSENGER CAR REGISTRATIONS EUROPEAN UNION 1 Passenger car registrations: +8.4% first three months of 2017; +11.2% in In 2017, EU passenger car registrations
2016 PRODUCTS PRICE LIST AND SHIPPING SHIPPING AND HANDLING FOR CONTINENTAL U.S.A.
 BIOBELT / PILLOW QUANTUM ENERGY PAD / QUANTUM ENERGY COMFORTER ALKAL-LIFE 7000SL/ DETOXI SALT REJUVENA PREMIUM/ SHIPPING AND HANDLING FOR CONTINENTAL U.S.A. Richway & Fuji Bio Inc. 1314 South King Street,
Photo courtesy of NZTA
 international comparisons for road deaths Photo courtesy of NZTA 14 Motor Vehicle Crashes in New Zealand international comparisons for road deaths 141 Contents TABLES Table 1 International comparison of
NEW PASSENGER CAR REGISTRATIONS EUROPEAN UNION 1
 PRESS EMBARGO: 8.00 AM (6.00 AM GMT), 15 June 2018 NEW PASSENGER CAR REGISTRATIONS EUROPEAN UNION 1 Passenger car registrations: +2.4% five months into 2018; +0.8% in In 2018, the EU passenger car market
Winners & Losers by Market - May 2015 vs May 2014
 Countries PORTUGAL +33,1 GREECE +21,6 ICELAND +21,3 CZECH REPUBLIC +17,6 SPAIN +14,0 SLOVENIA +13,7 POLAND +11,0 ITALY +10,8 BULGARIA +10,7 IRELAND +10,3 LITHUANIA +9,6 CYPRUS +7,4 SWEDEN +6,5 SWITZERLAND
NEW PASSENGER CAR REGISTRATIONS EUROPEAN UNION 1
 PRESS EMBARGO: 8.00 AM (6.00 AM GMT), 19 September 2018 NEW PASSENGER CAR REGISTRATIONS EUROPEAN UNION 1 Passenger car registrations: +6.1% eight months into 2018; +10.5% in July and +31.2% in August In
Drink Driving in Europe
 Safe & Sober: Reducing deaths and injuries from drink driving Paris, 2nd December 2008 Drink Driving in Europe Ellen Townsend Introduction to ETSC A science-based approach to road safety policy Bringing
NEW PASSENGER CAR REGISTRATIONS EUROPEAN UNION 1
 PRESS EMBARGO: 8.00 AM (7.00 AM GMT), 14 December 2018 NEW PASSENGER CAR REGISTRATIONS EUROPEAN UNION 1 Passenger car registrations: +0.8% 11 months into 2018; 8.0% in In 2018, passenger car demand fell
42/ March GDP growth in the euro area and EU28. GDP growth rates % change over the previous quarter, based on seasonally adjusted data
 2007Q1 2007Q2 2007Q3 2007Q4 2008Q1 2008Q2 2008Q3 2008Q4 2009Q1 2009Q2 2009Q3 2009Q4 2010Q1 2010Q2 2010Q3 2010Q4 2011Q1 2011Q2 2011Q3 2011Q4 2012Q1 2012Q2 2012Q3 2012Q4 2013Q1 2013Q2 2013Q3 2013Q4 2014Q1
NEW PASSENGER CAR REGISTRATIONS EUROPEAN UNION 1
 PRESS EMBARGO: 8.00 AM (7.00 AM GMT), 16 January 2019 NEW PASSENGER CAR REGISTRATIONS EUROPEAN UNION 1 Passenger car registrations: +0.1% in 2018; 8.4% in In 2018, the EU passenger car market declined
Traffic Safety Basic Facts 2008
 In 2006, powered two wheelers make up 22% of the total number of road accident fatalities in the EU-14. In 2006,moped rider fatalities make up 5,7% of the total number of road accident fatalities in the
Market Information Database. Databook
 Market Information Database Databook Garage Structure in the European Car Aftermarket 2017 IMPRINT RESPONSIBLE: HELMUT WOLK, ZORAN NIKOLIC, TATYANA SERGEYCHIK, DAVID BRUDER, SYBILLE MENDE COPYRIGHT: WOLK
NEW PASSENGER CAR REGISTRATIONS EUROPEAN UNION 1
 PRESS EMBARGO: 8.00 AM (6.00 AM GMT), 14 September 2017 NEW PASSENGER CAR REGISTRATIONS EUROPEAN UNION 1 Passenger car registrations: +4.5% over eight months; +5.6% in August In August 2017, passenger
P r e s s R e l e a s e. June 2007
 PRESS EMBARGO FOR ALL DATA: 26 July 27, 8. A.M. (6. A.M. GMT) P r e s s NEW COMMERCIAL VEHICLE REGISTRATIONS June 27 European Union + EFTA Countries LCVs up to 3.5t Heavy Trucks over 16t 25, 3, 2, 15,
RISK DASHBOARD ANNEX CREDIT RISK PARAMETERS Q2 2017
 RISK DASHBOARD ANNEX CREDIT RISK PARAMETERS Q2 2017 Corporates 4 0.57% 0.81% 0.84% 0.81% 4 8.75% 17.51% 26.12% 22.73% 57 0.23% 0.45% 1.66% 1.64% 58 33.81% 42.41% 45.00% 29.97% Corporates - Of Which: Specialised
RISK DASHBOARD ANNEX CREDIT RISK PARAMETERS Q4 2017
 RISK DASHBOARD ANNEX CREDIT RISK PARAMETERS Q4 2017 Corporates 10 1.22% 4.02% 26.81% 1.95% 9 15.68% 32.84% 36.64% 31.60% 51 0.20% 1.00% 4.08% 2.02% 54 34.12% 43.96% 45.10% 29.73% Corporates - Of Which:
GWL/Power Sales Report. May GWL/Power. i4wifi a.s.
 GWL/Power 2014 Sales Report May 2015 GWL/Power i4wifi a.s. Content 1. About company 3 2. i4wifi as value added distributor 5 3. Customers 8 4. Importatnt Milestones 13 5. Kind of distribution business
NEW PASSENGER CAR REGISTRATIONS EUROPEAN UNION 1
 PRESS EMBARGO: 8.00 AM (7.00 AM GMT), 17 January 2018 NEW PASSENGER CAR REGISTRATIONS EUROPEAN UNION 1 Passenger car registrations: +3.4% in 2017; 4.9% in In 2017, new passenger car registrations in the
Improved timeliness of employment data
 2007Q1 2007Q2 2007Q3 2007Q4 2008Q1 2008Q2 2008Q3 2008Q4 2009Q1 2009Q2 2009Q3 2009Q4 2010Q1 2010Q2 2010Q3 2010Q4 2011Q1 2011Q2 2011Q3 2011Q4 2012Q1 2012Q2 2012Q3 2012Q4 2013Q1 2013Q2 2013Q3 2013Q4 2014Q1
Jan. 13/12. Countries. % Chg Winners & Losers by Market - Jan vs Jan. 2012
 Countries Jan. 13/12 ICELAND +43,8 ESTONIA +28,4 DENMARK +14,5 BELGIUM +13,3 UNITED KINGDOM +11,5 POLAND +8,8 NORWAY +7,4 AUSTRIA +3,5 PORTUGAL +0,7 LITHUANIA -1,3 CZECH REPUBLIC -6,6 LUXEMBURG -7,5 EU27*+EFTA
Stolen Vehicle Tracking and Monitoring Services
 Stolen Vehicle Tracking and Monitoring Services Stolen Vehicle Tracking and Monitoring Services The ultimate protection for your vehicle with European coverage as standard* With more than 300,000 vehicles