2008 Metro Vancouver Dangerous Goods and Truck Classification Survey
|
|
|
- Evan Copeland
- 5 years ago
- Views:
Transcription
1 Metro Vancouver angerous Goods and Truck Classification Survey November Produced by: British Columbia Ministry of Transportation TransLink In association with: Creative Transportation Solutions
2
3 TABLE OF CONTENTS Preface i Executive Summary iii. Introduction. Methodology angerous Goods Truck Count Classification 5 Truck Count Stations 7. angerous Goods Summary Results 5 Multiple Placards 5 Hazard Classes 6 UN Number angerous Goods Vehicles 9 Sub-Regional Travel 4. Truck Classes Summary Results 5 Trucks Crossing Screenlines 5 Trucks Crossing Screenlines by Class 7 Light Trucks - Stations 9 Trucks - Stations 5. Screenline and Station Summaries 9 Appendices 95 Appendix A Transportation of angerous Goods: The Marks of Safety 96 Appendix B Sample angerous Goods Survey Form Appendix C ata Processing, Cleaning, Logic Checks and atabase Structure Appendix Analysis of Stations Sampled Twice 6 Appendix E Summaries for Stations Sampled Twice Appendix F angerous Goods Maps & Tables 4 Appendix G Truck Classification Maps & Tables 4
4 LIST OF EXHIBITS Exhibit ES. angerous Goods Summary Observations iii Exhibit ES. Survey Locations iv Exhibit ES. Observed Hazard Class Placards v Exhibit ES.4 Hazard Classes for Light Trucks v Exhibit ES.5 Hazard Classes for Trucks vi Exhibit ES.6 Top angerous Goods Stations vi Exhibit ES.7 Top angerous Goods Locations vii Exhibit ES. Hazard Class Ranks for Top G Stations _ viii Exhibit ES.9 Examples of Light and Trucks ix Exhibit ES. Summary Truck Class Observations ix Exhibit ES. Truck Class Observations x Exhibit ES. Top Truck Stations x Exhibit ES. Top Truck Locations xi Exhibit ES.4 Class Ranks Top Truck Stations xii Exhibit. Truck with angerous Goods Placard Exhibit. angerous Goods Placard Example Exhibit. Hazard Classes Exhibit.4 anger Placard Example 4 Exhibit.5 Light Truck Examples 5 Exhibit.6 Truck Examples 5 Exhibit.7 Truck Classification Examples 6 Exhibit. Truck Count Stations by Group 7 Exhibit.9 Stations Sampled Twice 7 Exhibit. Regular Regional Screenlines Not Sampled Exhibit. Regional Screenlines 9 Exhibit. NFPR and SFPR Corridor Count Stations Exhibit. List of Truck Count Stations by Grouping Exhibit. angerous Goods Summary Observations 5 Exhibit. Combinations of Multiple Placards 5 Exhibit. Observed Hazard Class Placards 6 Exhibit.4 etailed Breakdown of Class 7 Exhibit.5 etailed Breakdown of Class 7 Exhibit.6 Observed angerous Goods by UN Numbers _ Exhibit.7 Other angerous Goods by UN Number Exhibit. angerous Goods Vehicle Types 9 Exhibit.9 Hazard Classes for Light Trucks 9 Exhibit. Hazard Classes for Trucks Exhibit. Temporal istribution of angerous Goods Exhibit. angerous Goods Across Screenlines Exhibit. angerous Goods Trucks Across Screenlines Exhibit.4 Top angerous Goods Stations Exhibit.6 Top G Stations ranks by Hazard Class_ Exhibit.5 Top angerous Goods Locations 4
5 Exhibit 4. Summary Truck Class Observations 5 Exhibit 4. Screenline Truck Summary 5 Exhibit 4. Light and Trucks Across Screenlines 6 Exhibit 4.4 Truck Classes Across Screenlines Exhibit 4.5 Top Light Truck Stations 9 Exhibit 4.7 Top Non-Freeway Light Truck Stations 9 Exhibit 4.6 Top Light Truck Locations Exhibit 4. Truck Class Observations Exhibit 4.9 Top Truck Stations Exhibit 4. Top Truck Locations Exhibit 4. Top Tractor-Trailer Stations Exhibit 4. Construction Vehicle Stations Exhibit 4. Top Marine Container Stations 4 Exhibit 4.4 Top Single Unit / Other Stations 4 Exhibit 4.5 Top Flatbed Stations 5 Exhibit 4.6 Top Tractor Only Stations 5 Exhibit 4.7 Top Tanker Stations 6 Exhibit 4. Station Rankings by Truck Class 7 Exhibit 4.9 Rankings by Light and Trucks Exhibit F. Top Class Stations 4 Exhibit F. Top Class Stations 4 Exhibit F. Top Class Locations 4 Exhibit F.4 Top Class Locations 4 Exhibit F.5 Hazardous Goods Rankings for All Stations 44 Exhibit G. Truck Classification Rankings for All Stations 49 Exhibit G. Top Tractor Only Locations 5 Exhibit G. Top Marine Container & Chassis Locations 5 Exhibit G.4 Top Flatbed with Commodity Locations 54 Exhibit G.5 Top Tractor-Trailer Locations 55 Exhibit G.6 Top Tanker Locations 56 Exhibit G.7 Top Construction Vehicle Locations 57 Exhibit G. Top Single Unit / Other Locations 5 Exhibit. Stations Sampled Twice 6 Exhibit. Variation in Placards - Total 7 Exhibit. Variation Among Hazard Classes Exhibit.4 Variation Among Truck Classes
6
7 , British Columbia Ministry of Transportation, TransLink PREFACE This report and the associated database are the product of a partnership between, the British Columbia Ministry of Transportation and TransLink. The study partners appreciate the efforts of Creative Transportation Solutions in the collection of the data and production of this report. The following are specifically acknowledged for their contributions: John Mills Mimi Sukhdeo oug Kittle Geoff Anderson Alina Cheng Anna Grahn Chris Hoff AITIONAL COPIES Additional copies of this report can be purchased from: Brock Reidy Coordination and Policy # Burrard Street Vancouver, BC V6Z J TransLink Ken Tseng Strategic Planning #6 47 Kingsway Burnaby, BC V5H 4N British Columbia Ministry of Transportation Lisa Gow Linda Rogers TransLink Gary Vlieg Brian Mills Ken Tseng Creative Transportation Solutions Bernard Tung Jeannine McCullagh avid Bodor angerous Goods and Truck Classification Survey i
8 , British Columbia Ministry of Transportation, TransLink ii angerous Goods and Truck Classification Survey
9 , British Columbia Ministry of Transportation, TransLink EXECUTIVE SUMMARY Commercial vehicle surveys were undertaken throughout Metro Vancouver in Spring in an effort to better understand the movement of dangerous goods and heavy trucks in the region. It is anticipated that the data collected will support planning for initiatives such as the Olympics, Asia-Pacific Gateway and Trade Corridors, evaluation of goods movement in Greater Vancouver, and truck and dangerous goods route designations. angerous goods and truck count classification surveys were conducted on typical weekdays from 7: AM to 5: PM at a total of 7 stations, as displayed in Exhibit ES.. In addition to regional count stations, nine locations along the planned South Fraser Perimeter Road and North Fraser Perimeter Road trade corridors and four special interest locations were also surveyed. The results of this report should be considered a snapshot of typical truck movements in Metro Vancouver at the time the surveys were conducted, as traffic counts would vary if the counts were carried out on different days, periods, or seasons. However, analysis of thirteen stations that were counted twice showed a strong consistency between counts. This suggests day-to-day variation is not material to the summary results of the survey, and that the summary results are hence representative of typical conditions. Note also that the number of observations is not equivalent to the number of truck trips in the region, as a truck may effectively be observed at multiple count stations in a single trip.,5 SURVEYOR HOURS A team of surveyors counted over a period of 9 days and,5 surveyor hours. On average there were 4 dangerous goods vehicles per count station throughout the survey period. ANGEROUS GOOS SURVEYS The dangerous goods surveys entailed observing and recording information on dangerous goods placards affixed to vehicles carrying such goods. The diamond shaped placards convey the nature and dangers of the goods by means of their colour, hazard symbol, hazard class, and United Nation (UN) number. The vehicle type, such as van, light truck, tanker or trailer, was also recorded. Exhibit ES. shows summary statistics of the dangerous goods surveys. Overall, vehicles conveying dangerous goods represented approximately.9 percent of close to 65, trucks observed. Given that some trucks display more than one placard, there was a ratio of. placards per truck. The orange cells summarize observations at locations that have historically been used to monitor regional traffic trends in Metro Vancouver. Because they are generally considered to be representative of regional traffic movements, all subsequent analysis is based only on this subset of observations. The other traffic counts will be used for more specific analyses. Exhibit ES. angerous Goods Summary Observations angerous Goods Observation Regional Screenline Trade Corridor Special Locations Total G Trucks,56 7 5, Placards,9 4 6,49 Placards per G Truck Total Trucks,9 7,6 6,5 64,69 Percent G Trucks.%.4%.4%.9% Approximately 7 percent of trucks displaying more than one placard were light trucks (vans, pickup trucks and single unit two-axle trucks). angerous Goods and Truck Classification Survey iii
10 , British Columbia Ministry of Transportation, TransLink Exhibit ES. Survey Locations NORTH VANCOUVER VANCOUVER COQUITLAM BURNABY MAPLE RIGE RICHMON SURREY ELTA LANGLEY ABBOTSFOR iv angerous Goods and Truck Classification Survey
11 , British Columbia Ministry of Transportation, TransLink Exhibit ES. shows the breakdown of the classes of dangerous goods being transported, as indicated by observed placards. Close to half of the placards indicated flammable liquids and almost one quarter of the placards indicated liquefied or compressed gases. The majority of these liquids and gases were fuels and petroleum products. Approximately 4% of the placards observed simply listed anger. This is permitted in situations where multiple placards would otherwise be required, or when the total mass of a mixed load of dangerous goods exceeds 5 kg. Two-thirds of the vehicles displaying this placard were light trucks. Toxic / Infectious Substances % Oxidizing Substances % Exhibit ES. Observed Hazard Class Placards Miscellaneous Substances % Radioactive Substances % Corrosive Substances % Flammable Solids % anger 4% Missed % Explosives % Gases - Liquefied or Compressed 4% Flam m able Liquids 49% The vehicle types recorded during the dangerous goods surveys consisted of light trucks (two axle trucks, or vans/pickup trucks carrying dangerous goods) and heavy trucks (three or more axle including tankers). Light and heavy trucks accounted for and 7 percent of the dangerous goods observations, respectively. Tankers constituted 57 percent of the total dangerous goods observations. Exhibit ES.4 illustrates the types of dangerous goods carried by light trucks. Liquefied and compressed gases were indicated on 4 percent of the placards displayed on light trucks, followed by flammable liquids at 9 percent and corrosive substances at 7 percent. The anger placards comprised 7 percent of the observed placards on light trucks. The remaining types of dangerous goods collectively accounted for only 7 percent of the placards observed. Exhibit ES.4 Hazard Classes for Light Trucks Miscellaneous Substances % Radioactive Substances % Toxic / Infectious Substances % Oxidizing Substances % Corrosive Substances 7% Flam m able Solids % anger 7% Flam m able Liquids 9% Missed 4% Explosives % Gases - Liquefied or Compressed 4% angerous Goods and Truck Classification Survey v
12 , British Columbia Ministry of Transportation, TransLink Exhibit ES.5 illustrates the types of dangerous goods carried by heavy trucks. trucks transporting dangerous goods predominantly carried flammable liquids (64 percent), followed by liquefied and compressed gases at 5 percent and corrosive substances at percent. The anger placard comprised percent of the observed placards on heavy trucks. The remaining types of dangerous goods collectively accounted for only 5 percent of the placards observed. Of interest, ten light trucks were observed to be carrying radioactive substances versus none for heavy trucks. As well, sixteen light trucks displayed the Explosives placard compared to only 4 on heavy trucks. Exhibit ES.5 Hazard Classes for Trucks Radioactive Substances % Toxic / Infectious Substances % Miscellaneous Substances % Oxidizing Substances % Flam m able Solids % Explosives % Missed % anger % Corrosive Substances % Gases - Liquefied or Compressed 5% Flam m able Liquids 64% Exhibits ES.6 and ES.7 show the top twenty locations where dangerous goods vehicles were observed (from a total of 7 locations). At 7 trucks, Highway at North Road ranked first, with dangerous goods trucks comprising 4.% of all trucks observed at that location. It is notable that of the top locations were along freeways or regional bridges. The highest ranked location on an arterial road was at Brunette Avenue just south of Highway, with dangerous goods trucks observed. Exhibit ES.6 Top angerous Goods Stations G Truck Rank Stn # Location and escription Total G Trucks % of Total Trucks.6 Highway, at North Road 7 4.%. Port Mann Bridge.% 9. Alex Fraser Bridge.% 4 6. Highway, west of th Street 5.7% 5. Highway 9 [Mid-Richmond] 4.% 6 7. Highway, FVR/GVR Boundary 4.% Queensborough Bridge.9%. Brunette Avenue, south of Highway.% 9. Second Narrows Bridge.% 4. Highway 5, north of Border 7.5%. Pitt River Bridge.4%. River Road, west of Highway 9 7.% 7. Airport Connector / Moray Bridge 7 4.% 4 6. Knight Street Bridge 7.% 5. Highway, at Hope 7.% th Avenue, west of th Street 6.% Highway west of th Street 5.%. Pattullo Bridge 4.% Marine Way, west of Boundary Road.4% 9. Hwy 99, south of Squamish 6.5% vi angerous Goods and Truck Classification Survey
13 , British Columbia Ministry of Transportation, TransLink Exhibit ES.7 Top angerous Goods Locations angerous Goods and Truck Classification Survey vii
14 , British Columbia Ministry of Transportation, TransLink Collectively, the liquefied and compressed gases, flammable liquids, corrosive substances and anger hazard classes represent 94 percent of all observed placards. Exhibit ES. lists the top twenty dangerous goods locations for these substances, and provides their ranks in terms of the number of placards observed. The cells highlighted in orange represent the top 5 locations for each hazard class. The top three stations all had top 5 rankings in each of these classes. Exhibit ES. Major Hazard Class Ranks for Top angerous Goods Stations G Truck Rank Stn # Location and escription Gases Hazard Class Rank Flam Liq Corro Subs anger.6 Highway, at North Road 4 4. Port Mann Bridge 5 9. Alex Fraser Bridge Highway, west of th Street Highway 9 [Mid-Richmond] Highway, FVR/GVR Boundary Queensborough Bridge 5. Brunette Avenue, south of Highway Second Narrows Bridge Highway 5, north of Border 7 -. Pitt River Bridge. River Road, west of Highway Airport Connector / Moray Bridge Knight Street Bridge 4-5. Highway, at Hope th Avenue, west of th Street Highway west of th Street 5 9. Pattullo Bridge Marine Way, west of Boundary Road Hwy 99, south of Squamish TRUCK CLASSIFICATION SURVEYS The truck count classification surveys involved tallying and classifying trucks as either light trucks or one of eight types of heavy trucks. Light trucks were considered to be trucks with only two axles and included panel vans. trucks were identified as trucks with three or more axles, and were further classified into the following eight categories: Tractor only Tractor with marine container chassis Tractor with marine container Tractor with flatbed and commodity Tractor with trailer Tractor with tanker Construction vehicle Single unit axle and other Examples of different types of light and heavy trucks are shown in Exhibit ES.9. Emergency Vehicles Emergency vehicles were also counted during the truck classification surveys. Ambulances were included under light trucks, while fire trucks were included under single unit axle and other heavy trucks. viii angerous Goods and Truck Classification Survey


15 , British Columbia Ministry of Transportation, TransLink Exhibit ES.9 Examples of Light and Trucks LIGHT TRUCKS As shown in Exhibit ES., close to 65, trucks were observed, with approximately 6 percent being classified as heavy trucks. It is notable that higher percentages of heavy trucks were observed at the trade corridor and special locations, likely due to their selection in connection with Asia-Pacific trade. HEAVY TRUCKS TRACTOR WITH MARINE TRACTOR WITH MARINE CONTAINER CHASSIS CONTAINER The orange cells in Exhibit ES. summarize observations at locations that have historically been used to monitor regional traffic trends in Metro Vancouver. Because they are generally considered to be representative of regional traffic movements, all subsequent analysis is based only on this subset of observations, consistent with the analysis of the dangerous goods survey results. Exhibit ES. Summary Truck Class Observations TRACTOR WITH FLATBE AN COMMOITY TRACTOR WITH TRAILER Truck Types Regional Screenline Trade Corridor Special Locations Total Total,9 7,6 6,5 64,69 Light Observed 5,4 7,, 6,9 Trucks Percent 4% 6% 9% % Trucks Observed 77,4, 4,54,7 Percent 59% 74% 7% 6% TRACTOR WITH TANKER CONSTRUCTION VEHICLE Exhibit ES. shows the breakdown of the heavy truck classifications. At around percent, the top 4 classes of heavy trucks have almost an equal proportion of observations. This includes trucks with marine containers and marine container chassis, tractor-trailers, construction vehicles and other heavy vehicles. At percent, the proportion of construction vehicle observations is notable. TRACTOR ONLY SINGLE UNIT AXLE / OTHER A truck observation does not equal a truck trip, as a truck may effectively be observed at multiple stations during a single trip through Metro Vancouver.. angerous Goods and Truck Classification Survey ix
16 , British Columbia Ministry of Transportation, TransLink Tanker % Exhibit ES. Truck Class Observations Trailer % Construction % Flatbed w ith commodity % Other 9% Marine Container 5% Tractor only 6% Marine Container Chassis 5% Exhibits ES. and ES. show the top twenty locations where heavy trucks were observed. Highway at the FVR/GVR boundary ranked first with over 4,5 heavy trucks observed, comprising 7 percent of the total trucks observed at that location. Although it ranked th in terms of absolute numbers, Highway west of Hope had the highest proportion of heavy trucks at 9 percent. It is notable that 4 of the top heavy truck observation locations were on freeways or regional water crossings, with approximately 57% of all heavy truck observations being made on freeways and water crossings. Similar to the dangerous goods observations, Brunette Avenue south of Highway was the highest ranked heavy truck location on an arterial road, with over,7 observations. Exhibit ES. Top Truck Stations Rank Stn # Location and escription Total Trucks Trucks Abs. % 7. Highway, FVR/GVR boundary 6, 4,56 7%. Port Mann Bridge 6,9 4, 6% 9. Alex Fraser Bridge 6,5,95 6% 4.6 Highway, at North Road 6,7,9 5% 5 9. George Massey Tunnel 5,,9 7% 6 6. Knight Street Bridge 6,5, 6% 7 6. Highway, west of th St 5,66,7 6%. Brunette Ave, south of Hwy 5,,7 7% Queensborough Bridge 5,96,5 6%. River Road, west of Nordel 4,,5 74%. Highway 9, mid-richmond 4,9,7 5%. Second Narrows 4,4,4 55%. Pattullo Bridge,6, 66% 4. Westminster Hwy, mid-richmond,74,95 7% 5. Pitt River Bridge,9,9 6% th Avenue, west of th,7,9 4% 7. Knight St, north of 4st Ave,9,5 64%. Highway, at Hope BC,77,57 9% 9. Highway 99, west of 4th,,57 74% 5. McGill Street, west of Hwy,,5 7% Light Trucks High percentages of light trucks were observed entering downtown Vancouver, the Vancouver International Airport and the University of British Columbia. x angerous Goods and Truck Classification Survey
17 , British Columbia Ministry of Transportation, TransLink Exhibit ES. Top Truck Locations angerous Goods and Truck Classification Survey xi
18 , British Columbia Ministry of Transportation, TransLink Exhibit ES.4 lists the top twenty heavy truck locations and provides their ranks for each of the heavy truck classifications, with the top five ranks highlighted for each category. Truck Rank Exhibit ES.4 Classification Ranks for Top Truck Stations Stn # Location and escription Truck Classification Rank 7. Highway, FVR/GVR boundary 7 9. Port Mann Bridge Alex Fraser Bridge Highway, at North Road George Massey Tunnel Knight Street Bridge Highway, west of th St Brunette Ave, south of Hwy Queensborough Bridge 6 6. River Road, west of Nordel 4 -. Highway 9, mid-richmond Second Narrows Pattullo Bridge Westminster Hwy, mid-richmond Pitt River Bridge th Avenue, west of th Knight St, north of 4st Ave Highway, at Hope BC Highway 99, west of 4th McGill Street, west of Hwy Tractor- Trailer Construction Container & Chassis Single Unit / Other Flatbed / Commodity Tractor Only Tanker Much information can be extracted from the rankings provided in Exhibit ES.4. The following locations are of particular interest: In a relative sense, stations along Highway do not rank high in the marine container/empty chassis class Alex Fraser Bridge ranks third overall, despite not ranking in the top for construction vehicles George Massey Tunnel and Alex Fraser Bridge have similar absolute volumes, but have a very different distribution of classes Brunette Avenue south of Highway is the highest ranking arterial road and ranks first overall in the marine container class River Road, west of Nordel Way ranks high in the marine container and tractor only classes, reflecting the nature of the industry in the area supporting Asia-Pacific trade Pitt River Bridge ranks in the top largely due to the number of construction vehicles. It remains to be seen if the rank in Top would be sustained once bridge reconstruction is complete Knight Street at 4 st Avenue ranks in the top because of the large number of marine container vehicles, even though it does not rank in the top for any other class 6 th Avenue at th Street ranks number one for construction vehicles, but barley registers for other truck classes. It is anticipated that nearby gravel pits contribute to this. Overall, it is anticipated that the dangerous goods and truck classification surveys will provide a better understanding of truck movements in the region and that the data collected will support the planning of the Olympics, Asia-Pacific Gateway and Trade Corridors, the evaluation of goods movement in Greater Vancouver and truck and dangerous goods route designations. xii angerous Goods and Truck Classification Survey
19 , British Columbia Ministry of Transportation, TransLink. INTROUCTION This report describes the results of commercial vehicle surveys undertaken in Metro Vancouver in Spring. The primary objective of this project was to collect and describe data regarding: transport of dangerous goods detailed classification of trucks, with an emphasis on heavy trucks. This summary report and accompanying database are expected to support ongoing planning and monitoring of goods movement in Metro Vancouver. Specifically, the surveys were designed to inform the following initiatives: Olympics Security and Venue Planning Asia-Pacific Gateway and Trade Corridors Evaluation of goods movement in Greater Vancouver Truck and dangerous goods route designation planning. COMPLEX SYSTEM The transport of dangerous goods is driven by many factors such as regular scheduling of gasoline station refilling, variable demands for movement of other dangerous goods such as batteries or explosives, preferences for time-of-day of travel and road network time-of-day restrictions. Likewise, the movement of heavy trucks in support of local industry and the Asia-Pacific Gateway is dynamic and driven by a variety of factors such as private industry logistics strategies, steamship line vessel rotation and earliest receiving dates at marine terminals, location and stage of construction projects, truck dispatch systems etc. A SNAPSHOT In this context of a complex system, the challenge of securing a dataset that is fully representative of a very complex, fluid and dynamic trucking industry is acknowledged. Most of the traffic counts were undertaken on one or two weekdays. Traffic counts of longer duration, or on different days of the week, or for longer periods, or for different seasons would produce variations in the observed data. In an effort to address this, Appendix contains the The results in this report should be considered a snapshot of truck movements in Metro Vancouver. 65, TRUCKS Over the course of this traffic count survey close to 65, trucks were observed. results of analysis of dayto-day variation for some traffic count locations that were counted twice. In summary, the analysis shows that day-to-day variation is limited, where this gives confidence that within a reasonable tolerance level the summary observations and station summaries are representative of typical conditions. = Truck Observation Truck Trip This report describes observations of trucks throughout Metro Vancouver. As some trips may be effectively observed at more than one location, this is not equal to the number of truck trips. A complete overview of truck trips in Metro Vancouver could include other companion efforts such as marine terminal surveys, cross-border truck traffic, internal surveys for truck trips that do not participate in movement of a commodity outside Metro Vancouver and surveys of specialized services such as integrator/courier. Ultimately robust estimation of truck trips would require development of a truck trip generation model. angerous Goods and Truck Classification Survey
20 , British Columbia Ministry of Transportation, TransLink angerous Goods and Truck Classification Survey
.")
21 , British Columbia Ministry of Transportation, TransLink. METHOOLOGY ANGEROUS GOOS Special precautions that promote safe transportation of dangerous goods are legislated in the federal Transportation of angerous Goods Act (99). Associated regulations require those transporting dangerous goods, which meet certain criteria, to display safety marks. By definition a safety mark means a label, placard that is used to identify dangerous goods and the nature of the danger posed by them. A square on point (diamond) placard attached to the truck seen in Exhibit. identifies it as carrying a specific class of dangerous goods. The colour/pattern of the placard, the symbol and numbers on the placard convey the nature of the danger to handlers and incident responders. An example placard is shown in Exhibit., followed by a summary description. A more comprehensive description of placards and hazard classes is provided in Appendix A. Exhibit. Truck with angerous Goods Placard Exhibit. angerous Goods Placard Example angerous Goods Hazard Classes The Transportation of angerous Goods Act (99) defines a dangerous good as a product, substance or organism that fits into the hazard classes listed in Exhibit.. The placard colour/pattern and symbol also relate to the hazard class and divisions for easy recognition in case of an incident. Hazard Class Exhibit. Hazard Classes Hazard Class escription Hazard Symbol UN Number Hazard Class Explosives e.g. dynamite or nitroglycerine Gases liquefied, compressed or poisonous e.g. propane, or chlorine Flammable or combustible liquids e.g. diesel fuel, or acetone 4 Flammable solids e.g. matches or alkyls 5 Oxidizing substances and organic peroxides e.g. hydrogen peroxide 6 Toxic or infectious substances e.g. sodium cyanide, or Hepatitis B virus 7 Radioactive substances e.g. uranium hexafluoride Corrosive substances e.g. hydrochloric acid 9 Misc. substances e.g. polychlorinated biphenyls PCBs, or asbestos angerous Goods and Truck Classification Survey
22 , British Columbia Ministry of Transportation, TransLink anger Placard In addition to the nine hazard classes, regulations allow for a unique placard simply marked ANGER, illustrated in Exhibit.4. A danger placard is permitted in situations where multiple placards would otherwise be required. Pursuant to Part 4 of the angerous Goods regulations, this includes situations where: two or more primary class placards are required for Class gases; or depending upon the specific dangerous goods and circumstances, the collective mass of a mixed load exceeds 5 kg of dangerous goods. Exhibit.4 anger Placard Example United Nation (UN) Numbers UN numbers or Product Information Numbers (PINs) are four-digit numbers that identify hazardous substances and articles (such as explosives, flammable liquids, toxic substances, etc.) in the framework of international transport. Some hazardous substances have their own UN numbers (e.g. gasoline has UN), while sometimes groups of chemicals or products with similar properties receive a common UN number (e.g. Flammable Liquids Not Otherwise Specified (NOS) have UN99). A chemical in its solid state may receive a different UN number than the liquid phase if their hazardous properties differ significantly; substances with different levels of purity (or concentration in solution) may also receive different UN numbers. UN numbers presently range from UN to about UN5 and are assigned by the United Nations Committee of Experts on the Transport of angerous Goods. They are published as part of their Recommendations on the Transport of angerous Goods, Eleventh Revised Edition, 999. These recommendations have been adopted by as part of the transportation of dangerous goods regulations. angerous Goods ata Collection ANGER!!! Over 5 danger placards were observed. This constitutes approximately 4 percent of all observed placards. The majority of trucks observed with danger placards were lights trucks such as vans, pickup trucks and single unit two-axle trucks. The primary focus of this data collection effort was transport of dangerous goods. In general, this constitutes a minority of truck traffic and hence precludes the need for advanced methods of data collection using electronic boards etc. For this survey, each dangerous goods observation was recorded using the survey form provided in Appendix B. 4 angerous Goods and Truck Classification Survey
, where trucks with a GVW under, kg were considered to be light, and trucks over a GVW of, kg were considered to be heavy.")


23 , British Columbia Ministry of Transportation, TransLink TRUCK COUNT CLASSIFICATION Trucks were divided into two basic types: light and heavy trucks. The definition of a truck was generally based upon gross vehicle weight (GVW), where trucks with a GVW under, kg were considered to be light, and trucks over a GVW of, kg were considered to be heavy. As GVW can be difficult to observe during the manual counts in the field the number of axles on a truck was used to distinguish between light and heavy truck. Trucks with only two axles such as cube vans or panel vans were considered to be light trucks. Exhibit.5 illustrates two examples of light trucks. Exhibit.5 Light Truck Examples Truck Classification trucks were further classified into eight categories, and each class is illustrated in Exhibit.7. To some degree these categories enable monitoring of truck traffic related to Asia-Pacific trade. For example, it is reasonable to assume that trucks carrying a marine container, or with an empty marine container chassis, are related to supporting trade within the Asia-Pacific Gateway. This breakout of truck traffic also helps explain variation in truck traffic over time. For example, a comparison to 4 truck counts may show a growth or reduction in heavy truck trips that would be difficult to explain if all that is known are total heavy trucks. Hence, this classification of heavy truck types will aid interpretation of station data and overall trends e.g. it may be related to construction activity on the area. angerous Goods Vehicle Classification The classification of heavy trucks in this report is generally based upon the categories illustrated on Exhibit.7. However, the classification of the dangerous goods has some important nuances: Trucks with three or more axles were considered to be heavy trucks. This included tractors, single unit trucks (with dual rear axles) and combination vehicles. Exhibit.6 illustrates two examples of heavy trucks. Exhibit.6 Truck Examples Vans and pickup trucks were not counted in the regular truck count classification. However, as these vehicles may carry dangerous goods e.g. a pickup truck carrying batteries, these types of vehicles were recorded separately for the dangerous goods surveys trucks were also separately classified for each dangerous goods vehicle using a different system, including tankers with round or flat ends. This breakout was used primarily for logic checks on the placard identification and is illustrated in Appendix B Sample angerous Goods Survey Form. angerous Goods and Truck Classification Survey 5


24 , British Columbia Ministry of Transportation, TransLink Exhibit.7 Truck Classification Examples TRACTOR ONLY TRACTOR WITH FLATBE AN COMMOITY CONSTRUCTION VEHICLES TRACTOR WITH MARINE CONTAINER CHASSIS * - empty flatbeds included in other heavy trucks TRACTOR WITH TRAILER TRACTOR WITH MARINE CONTAINER TRACTOR WITH TANKER * - dump trucks, cement trucks, cranes etc. SINGLE UNIT AXLE AN OTHER * - not all tankers carry dangerous goods - includes empty flatbeds and axle flatbeds both empty and loaded 6 angerous Goods and Truck Classification Survey
25 , British Columbia Ministry of Transportation, TransLink TRUCK COUNT STATIONS Truck counts were conducted between 7: AM and 5: PM at a total of 5 stations. The count program was divided into three general groups and the total number of stations by group is provided in Exhibit.: Regular Regional Screenlines making every effort to remain consistent with the historic definition of screenline traffic count programs Supplemental Asia-Pacific Trade Corridors truck traffic data was collected along the planned North Fraser Perimeter Road (NFPR) and South Fraser Perimeter Road (SFPR) corridors Special Locations selected to support specific initiatives. Exhibit. Truck Count Stations by Group Truck Count Station Group # of Stations Regular Regional Screenlines 7 Supplemental Asia-Pacific Trade Corridors 9 Special Location 4 Total Stations 5 More Info on ata Methods A detailed discussion of data collection, cleaning, logic checks and the structure of the database can be found in Appendix C. Stations Sampled Twice A number of stations along major truck routes in Metro Vancouver were counted twice, and these stations are listed in Exhibit.9. These counts enhance confidence in the data at these major points in the transport system; and a review of day-to-day variation at these points enables interpretation of the overall results. In summary: 7 stations were sampled once stations were sampled twice 9 traffic counts were conducted in total. Exhibit.9 Stations Sampled Twice Screenline Number and escription Station Burrard Inlet Second Narrows Bridge 6 9 Middle Arm of Fraser River Mid-Richmond South Arm of Fraser River Main Arm of Fraser River Knight Street Bridge Queensborough Bridge Hwy 9, west of No. Rd Westminster Hwy, west of No. Rd Alex Fraser Bridge George Massey Tunnel Port Mann Bridge Pattullo Bridge North Road Brunette, south of Hwy Pitt Meadows / Port Coquitlam Pitt River Bridge elta River Road, west of Nordel Way Mid-Vancouver Knight Street, north of 4st Ave,5 SURVEYOR HOURS A team of surveyors counted over a period of 9 days and,5 surveyor hours. On average there were 4 dangerous goods vehicles per count station throughout the survey period. angerous Goods and Truck Classification Survey 7
26 , British Columbia Ministry of Transportation, TransLink Regular Regional Screenlines A screenline demarcates Metro Vancouver into specific zones or sub-areas and can be defined by natural features such as rivers, political boundaries such as municipal boundaries, or other criteria suitable for planning purposes. Truck count stations along these screenlines enable monitoring and evaluation of traffic between sub-areas i.e. into downtown Vancouver, or between Vancouver and Burnaby. Furthermore, many of these stations along screenlines are often points of interest for major infrastructure planning i.e. Port Mann Bridge. The screenlines targeted in this count program are illustrated in Exhibit. on the following page. While filling out the regular roster of screenlines consistent with historic traffic count programs was desirable, the screenlines enumerated in Exhibit. were not sampled in this program. Of the screenlines established in the 999 Lower Mainland Truck Freight Study, only screenlines and 6 were sampled. Exhibit. Regular Regional Screenlines Not Sampled Screenline # Screenline Name Taylor Way 4 Hwy 99 - th Street 9 Albion / Hwy Hwy 9 - Agassiz 5 Point Roberts - US Border 6 Tsawwassen Ferry Terminal 7 Vancouver International Airport Horseshoe Bay Ferry Terminal Highway - Abbotsford Abbotsford East Highway 9 - Chilliwack Asia-Pacific Trade Corridors An objective of this truck traffic count program is, to the degree possible, to track the movement of Asia-Pacific trade throughout Metro Vancouver and to identify/confirm key Asia-Pacific trade corridors within Metro Vancouver. This was accomplished through traffic counts on trade corridors such as Highway, Highway 99 and Knight Street. In addition, the North Fraser Perimeter Road (NFPR) and the planned South Fraser Perimeter Road (SFPR) remain active priorities for transportation authorities in Metro Vancouver. Some regular screenline stations are effectively on these corridors e.g. Brunette (south of Highway ) or River Road (west of Nordel Way). However, as the regular screenline locations do not give a complete view of these corridors, a number of supplemental counts were also identified and these stations are illustrated in Exhibit.. Special Locations In support of specific planning initiatives, the following stations that are neither on screenlines nor Asia-Pacific Trade Corridors were sampled: Richmond: Steveston Hwy, west of Hwy 99 Surrey: th Avenue between Hwy 5 and Hwy 99 Surrey: nd Avenue west of 4th Street Vancouver: Commissioner Street, north of McGill. List of Traffic Count Stations A complete list of stations counted by group is provided in Exhibit.. The date and day of week of the count(s) is also supplied. angerous Goods and Truck Classification Survey

27 , British Columbia Ministry of Transportation, TransLink Exhibit. Regional Screenlines NORTH VANCOUVER VANCOUVER COQUITLAM BURNABY MAPLE RIGE RICHMON SURREY ELTA LANGLEY ABBOTSFOR angerous Goods and Truck Classification Survey 9

28 , British Columbia Ministry of Transportation, TransLink Exhibit. NFPR and SFPR Corridor Count Stations VANCOUVER COQUITLAM BURNABY RICHMON SURREY ELTA angerous Goods and Truck Classification Survey
29 , British Columbia Ministry of Transportation, TransLink Exhibit. Comprehensive List of Truck Count Stations by Grouping Screenline Screenline escription Station I Suppl. I Station Survey ate(s) Regional Screenline Suppl. Trade Corridor Special Location Burrard Inlet False Creek / owntown Vancouver 4 West of Main Street / owntown Vancouver 5 Vancouver/Burnaby Municipal Boundary 6 Richmond / Vancouver 7 Middle Arm Richmond. Lions Gate Bridge 6-May- (Tue) Y. Second Narrows 5-Feb- (Mon) Y 6-Feb- (Tue). Burrard Street Bridge 4-Mar- (Tue) Y. Granville Street Bridge 4-Mar- (Tue) Y. Cambie Street Bridge 4-Mar- (Tue) Y 4.. Waterfront Street 7-Mar- (Mon) Y 4. Powell Street -Mar- (Tue) Y 4. Cordova Street -Mar- (Tue) Y 4.4 Hastings Street -Mar- (Tue) Y 4. unsmuir Street 4-Mar- (Tue) Y 4.9 Georgia Street 4-Mar- (Tue) Y 4. Quebec Street, north of Terminal Avenue -Mar- (Tue) Y 5. McGill Street 5-Feb- (Mon) Y 5. Hastings Street 6-Feb- (Tue) Y 5.5 st Avenue 6-Feb- (Tue) Y 5.6 Highway 7 7-Feb- (Wed) Y 5.7 Grandview Highway 7-Feb- (Wed) Y 5.9 9th Avenue 7-Feb- (Wed) Y 5. Kingsway 7-Feb- (Wed) Y 5. 49th Avenue -Feb- (Thu) Y 5.6 NFPR Marine Way -Feb- (Thu) Y Y 6. Arthur Laing Bridge 6-Mar- (Thu) Y 6. Oak Street Bridge 6-Mar- (Thu) Y 6. Knight Street Bridge -Feb- (Thu) Y 6.4 NFPR Queensborough Bridge 4-Apr- (Thu) 6-Mar- (Thu) Y Y 4-Apr- (Thu) 7. insmore Bridge 6-May- (Tue) Y 7. Airport Connector / Moray Bridge -Apr- (Wed) Y 7. No. Road Bridge 6-May- (Tue) Y. Highway 9 9-Feb- (Fri) Y. Westminster Highway -Apr- (Wed) 7-Mar- (Fri) Y -Apr- (Wed) Y angerous Goods and Truck Classification Survey
30 , British Columbia Ministry of Transportation, TransLink Exhibit. Comprehensive List of Truck Count Stations by Grouping ( of ) Screenline Screenline escription Station I Suppl. I Station Survey ate(s) Regional Screenline Suppl. Trade Corridor Special Location 9 Richmond / Vancouver / elta Surrey / New Westminster / Coquitlam Burnaby/Coquitlam Municipal Boundary (west of North Road) Pitt Meadows / Port Coquitlam elta (west of Highway 9) 5 Langley/Surrey (south of Highway ) 6 Surrey/Langley (west of th Street) 7 FVR/GVR south of Fraser FVR/GVR - north of Fraser 9-Feb- (Fri) 9. George Massey Tunnel Y 9-Mar- (Wed) 5-Mar- (Wed) 9. Alex Fraser Bridge Y 7-Mar- (Fri) 5-Mar- (Wed). Pattullo Bridge Y 6-Mar- (Thu) -Mar- (Tue). Port Mann Bridge Y -Mar- (Wed). Highway 7a -Mar- (Thu) Y.4 Highway 7 -Mar- (Tue) Y.6 Highway -Mar- (Wed) Y.7 North Road -Mar- (Tue) Y 7-Mar- (Mon). NFPR4 Brunette Avenue, south of Highway Y Y -Apr- (Tue) -Mar- (Thu). NFPR6 Pitt River Bridge Y Y -Apr- (Tue) 7-Mar- (Fri). SFPR River Road Y Y 7-May- (Wed). Ladner Trunk / Highway 5-Mar- (Wed) Y. Highway 99 -Mar- (Mon) Y 5. King George Highway -May- (Thu) Y 5. 5nd Street -May- (Thu) Y 5.4 Highway 5 4-Mar- (Fri) Y 5.6 9nd Street -May- (Thu) Y 5.7 th Street -May- (Thu) Y 6. 96th Avenue -Mar- (Mon) Y 6. Highway -Mar- (Mon) Y th Avenue -May- (Thu) Y 6.7 Langley Bypass (Highway ) -Mar- (Mon) Y 6. Fraser Highway (Highway A) -May- (Thu) Y th Avenue 5-May- (Thu) Y 7. Highway -May- (Tue) Y 7. Fraser Highway -May- (Tue) Y. ewdney Trunk Road -Apr- (Wed) Y. Highway 7 -Apr- (Wed) Y angerous Goods and Truck Classification Survey
31 , British Columbia Ministry of Transportation, TransLink Exhibit. Comprehensive List of Truck Count Stations by Grouping ( of ) Screenline Screenline escription Station I Suppl. I Station Survey ate(s) Regional Screenline Suppl. Trade Corridor Special Location Entering Fraser Valley (west of Hope). Highway 7 -Mar- (Thu) Y Entering Fraser Valley (west of Hope). Highway -Mar- (Thu) Y North of Border, entering BC. Highway 4-Mar- (Fri) Y North of Border, entering BC. Highway 4-Mar- (Fri) Y 4 North of Border, entering BC 4. Highway 5 4-Mar- (Fri) Y 9 Highway 99 Sea-to-Sky Highway 9.. South of Squamish -Mar- (Thu) Y. Granville Street, north of 4st Avenue -Mar- (Mon) Y. Oak Street, north of 4st Avenue 7-Mar- (Fri) Y Mid-Vancouver. Knight Street, north of 4st Avenue -Mar- (Mon) Y 6-May- (Tue).4 Main Street, north of 4st Avenue 7-Mar- (Mon) Y.5 Boundary Road, north of Kingsway -Mar- (Mon) Y 6. University Boulevard 9-Mar- (Wed) Y 6 UBC West of Blanca 6.4 W. 6th Avenue 9-Mar- (Wed) Y 6.5 SW Marine rive 9-Mar- (Wed) Y North Fraser Perimeter Road - NFPR Front Street between 4th St. & 6th St., New West. 7-Mar- (Mon) Y - NFPR5 Maryhill Bypass, east of United Blvd. -May- (Tue) Y - SFPR Highway 7, south of Ladner Trunk Road -Apr- (Tue) Y - SFPR River Rd / 6B, north of Hwy 99 7-May- (Wed) Y - SFPR4 River Road, east of Nordel Way 7-May- (Wed) Y South Fraser Perimeter Road - SFPR5 Nordel Way, east of Hwy 9 -May- (Wed) Y - SFPR6 th Street, north of Tannery Rd. -May- (Wed) Y - SFPR7 South Fraser Way, south of Tannery Rd. -May- (Wed) Y - SFPR 76 th Street north of Highway 5-May- (Thu) Y - SPEC nd Avenue west of 4 th Street 5-May- (Thu) Y Special - SPEC th Avenue between Highway 99 & Highway 5 5-May- (Thu) Y - SPEC No. 5 Road & Steveston Highway -Apr- (Wed) Y - SPEC4 Commissioner Street, north of McGill 5-Feb- (Mon) Y angerous Goods and Truck Classification Survey
32 , British Columbia Ministry of Transportation, TransLink 4 angerous Goods and Truck Classification Survey
33 , British Columbia Ministry of Transportation, TransLink. ANGEROUS GOOS SUMMARY RESULTS Overall summary statistics regarding transport of dangerous goods are presented in Exhibit.. uring the course of the survey, dangerous goods (G) trucks were observed at all stations in the program (light blue cell). Given that some trucks display more than one placard, the total number of observed placards was,49 (green cell), creating a ratio of placards per truck of. (purple cell). Overall, dangerous goods represent.9 percent of total observed trucks (pink cell) and the distribution among groups of stations is also given in Exhibit.. Exhibit. angerous Goods Summary Observations angerous Goods Observation Regional Screenline Trade Corridor Special Locations Total G Trucks,56 7 5, Placards,9 4 6,49 Placards per G Truck Total Trucks,9 7,6 6,5 64,69 Percent G Trucks.%.4%.4%.9% The orange cells highlight the summary observations for the regional screenline locations that have historically been used to monitor regional traffic trends in Metro Vancouver and may be considered generally representative of regional traffic. Conversely the trade corridor and special locations were targeted specifically for other purposes and inclusion of these stations may bias summary results. Consequently the summary results reported in the following sections represent the screenline observations only. The average of stations sampled twice is reported in the summary observations. MULTIPLE PLACARS Approximately percent of dangerous goods trucks displayed more than one placard, or a combination of primary and anger placards. The majority of these were two placards, and the most prominent combinations of placards provided in Exhibit.. Close to 7 percent of multi-placarded trucks were vans, pickups and light trucks. Exhibit. Combinations of Multiple Placards Rank Hazard Class anger anger 4 anger 5 The combination of primary and the anger placard indicates that there is likely insufficient quantity of the primary placard commodity to warrant a placard all the time; and the anger placard The Class and anger placards may indicate a collection of welding gases such as acetylene and argon that does not require filing an emergency response assistance plan (ERAP). indicates that there are likely other unspecified dangerous goods commodities that push it above the 5kg threshold. Multiple placards would be required if the other unspecified commodities were high hazard. The combination of two primary placards of the same hazard class A truck with two different Class indicates placards and different UN Numbers may different be cylinders of propane (red) and nitrogen (green) destined to a college. subclasses, as identified by the UN Number, and where the quantity of each dangerous good met the criteria to warrant a placard. angerous Goods and Truck Classification Survey 5


34 , British Columbia Ministry of Transportation, TransLink HAZAR CLASSES Toxic / Infectious Substances % Oxidizing Substances % A breakdown of the observed hazard class placards, including anger, is illustrated in Exhibit.. Exhibit. Observed Hazard Class Placards Miscellaneous Substances % Radioactive Substances % Corrosive Substances % Flammable Solids % anger 4% Missed % Explosives % Flam m able Liquids 49% trucks displayed 6 percent of the observed flammable liquids placards and 4 percent of the liquefied or compressed gases placards. Gases - Liquefied or Compressed 4% Radioactive Substances There were a total of observations of radioactive materials, or.% of the observed dangerous goods placards across regional screenlines. Radioactive material could be the likes of medical isotopes or instruments to measure density of solid objects such as concrete. All observed radioactive material was carried in vans, pickups and light trucks. Of the observations, six were along Highway including Port Mann and Second Narrows Bridges, three were on Knight Street, and the remaining observation was on River Road in elta. Of particular interest: Close to half of the observed dangerous goods placards were flammable liquids (Class ) Liquefied or compressed gases (Class ) contributed to approximately one quarter of the observed placards Close to percent of the placards indicated corrosives (Class ), such as hydrochloric acid and batteries Collectively explosives, flammable solids, oxidizing substances, toxic and infectious substances, radioactive substances and miscellaneous substances (Classes, 4, 5, 6, 7, and 9) contributed approximately percent of all observed placards. 6 angerous Goods and Truck Classification Survey
35 , British Columbia Ministry of Transportation, TransLink Class Liquefied or Compressed Gases Approximately 4 percent of the observed placards were for primary Class. Based upon identified UN Numbers, the breakdown of Hazard Class is provided in Exhibit.4. Exhibit.4 etailed Breakdown of Class Class Flammable or Combustible Liquids Approximately 49 percent of the observed placards were for primary Class. Based upon identified UN Numbers, the breakdown of Hazard Class is provided in Exhibit.5. Exhibit.5 etailed Breakdown of Class Refrigerated Liquid Oxygen 4% Propane % Other 5% Liquid Tars % Flammable Liquid % Other % Refrigerated Liquid Carbon ioxide 6% Re frige rated Liquid Nitrogen % Aviation Fuel 9% Gasoline or Motor Spirit 9% Liquefied Petroleum Gases 75% iesel Fuel, Fuel Oils or Heating Fuel 7% Of particular interest: Liquefied petroleum gases accounted for 75 percent of all Class placards observed, 6 percent of which were displayed by heavy trucks Light trucks displayed 7 out of observed propane placards. Of particular interest: Fuels accounted for 95 percent of all Class placards observed, 7 percent of which were displayed by heavy trucks Light trucks displayed out of observed placards for liquid tars, such as road asphalt. angerous Goods and Truck Classification Survey 7
36 , British Columbia Ministry of Transportation, TransLink UN NUMBER Approximately 6 percent of the placards displayed UN numbers identifying specific types of dangerous goods. Based upon this subset of placards, Exhibit.6 breaks down the distribution for the top categories of dangerous goods. Approximately percent in Exhibit.6 were identified as Other, and these further broken down in Exhibit.7. Fuels accounted for percent of all identifiable UN numbers. A total of 6 unique UN numbers were observed. Exhibit.6 Observed angerous Goods by UN Numbers iesel Fuel % Aviation Fuel 4% Liquefied Petroleum Gases, including Propane % Hydrochloric Acid % Sodium Hydroxide % Other % Liquid Nitrogen % Liquid Carbon ioxide % Unspecified Flammable Liquids % Liquid Oxygen % Batte ries % Corrosive Liquid % Exhibit.7 Other angerous Goods as Identified by UN Number UN Number and escription % of Placards Environmentally Hazardous Liquid.5% 79 Hypochlorite Solution.5% 66 Flammable Resin Solution.4% 999 Liquid Asphalt & Tars.4% 77 Environmentally Hazardous Solid.4% 495 Sodium Chlorate.4% 6 Paint.% Sulphuric Acid.% 57 Elevated Temperature Liquid.% 6 Unspecified Petroleum Products.% 96 Unspecified Toxic Flammable Alcohols.% 59 White Asbestos.% 94 Toluene.% 7 Xylenes.% 76 Unspecified Corrosive Liquid.% 95 Argon, Refrigerated Liquid.% 97 Unspecified Alcohols.% 99 Unspecified Toxic Flammable Liquid.% 66 Unspecified Basic Inorganic Corrosive Liquid.% - remainder with UN Number.% Gasoline % The other 4 percent of placards indicate a mixed load of dangerous goods that will not have the same distribution of UN numbers as the 6 percent that displayed a placard. Hence, these exhibits should not be considered representative of all dangerous goods. angerous Goods and Truck Classification Survey
37 , British Columbia Ministry of Transportation, TransLink ANGEROUS GOOS VEHICLES Using a simplified vehicle classification illustrated in the dangerous goods survey form in Appendix B, a breakdown of dangerous goods vehicle types is given in Exhibit.. Exhibit. angerous Goods Vehicle Types ouble Tanker % Construction % Hazard Classes for Light Trucks Exhibit.9 illustrates the types of dangerous goods carried by light trucks that include cars, vans, pickup trucks and two axle single unit trucks. Exhibit.9 Hazard Classes for Light Trucks anger 7% Missed 4% Explosives % Single Tanker 5% Tractor with & without Trailer 9% Sm all Truck 5% Other 4% Van / Pickup 5% Miscellaneous Substances % Radioactive Substances % Toxic / Infectious Substances % Oxidizing Substances % Corrosive Substances 7% Flammable Solids % Flammable Liquids 9% Gases - Liquefied or Compressed 4% Summary observations of particular interest include: approximately 7 percent of the observed dangerous goods trucks are classified as heavy trucks, with the remaining percent light trucks tanker trucks constituted 57 percent of all observed dangerous goods trucks approximately percent of all observed dangerous goods trucks were double tankers approximately 5 percent of placarded vehicles were vans and pickup trucks. Summary observations of particular interest include: approximately 4 percent of the observed light trucks were Class, liquefied gases such as liquefied petroleum gases and refrigerated liquid nitrogen flammable or combustible liquids constituted approximately 9 percent of light trucks the anger placard was displayed on 7 percent of the observed light trucks corrosive material was carried by approximately 7 percent of dangerous goods light trucks. angerous Goods and Truck Classification Survey 9
38 , British Columbia Ministry of Transportation, TransLink Hazard Classes for Trucks Exhibit. illustrates the types of dangerous goods carried by trucks with three or more axles including tankers, single unit trucks and tractors hauling a trailer. Exhibit. Hazard Classes for Trucks Radioactive Substances % Toxic / Infectious Substances % Miscellaneous Substances % Oxidizing Substances % Flam m able Solids % Explos ive s % Missed % anger % Corrosive Substances % Gases - Liquefied or Compressed 5% Flammable Liquids 64% Summary observations of particular interest include: the majority of observed heavy trucks, 64 percent, carried Class goods fuels liquefied gases constituted approximately 5 percent of heavy trucks 7% of light trucks displayed anger placards, compared to % for heavy trucks. corrosive material was carried by approximately percent of dangerous goods heavy trucks, which is a similar proportion as light trucks. Time of ay for angerous Goods Travel Each traffic station was surveyed continuously from 7: AM to 5: PM. The distribution of dangerous goods travel throughout the survey period is given in Exhibit.. Again, this is based upon observed placards at regional screenline locations. Placards Observed per Hour Exhibit. Temporal istribution of angerous Goods (7: AM to 5: PM) 7: : 9: : : : : 4: 5: 6: 7: Hour Beginning The temporal distribution of the dangerous goods placards follows a similar pattern to regular truck traffic as observed in previous surveys. The peak for dangerous goods truck traffic is generally during later morning through early afternoon, where truck traffic begins to taper off at approximately : PM. Specifically: the daily peak hour starts at :45 AM, with approximately 44 observed placards another distinct peak occurs midday for the hour starting at :5 AM with an hourly average of 4 using a threshold of 5 placards / hour, dangerous goods movement decreases gradually after the hour beginning at : PM. angerous Goods and Truck Classification Survey
39 , British Columbia Ministry of Transportation, TransLink SUB-REGIONAL TRAVEL Summary observations of trucks crossing regional screenlines enable a high level view of movements of dangerous goods trucks in Metro Vancouver. Exhibit. provides the total observed trucks as well as dangerous goods trucks at regional screenlines, and this is further illustrated in Exhibit.. For example, the cells highlighted in blue in Exhibit. show that, on a typical weekday between 7: AM and 5: PM, approximately, trucks cross between Vancouver and Burnaby, or screenline 5. Of these trucks approximately carry dangerous goods, or. percent of the total truck traffic. Notable summary observations include: Green cell - with close to 6, trucks per day, the largest magnitude of trucks was witnessed crossing screenline 6, the Richmond / Vancouver / Burnaby boundary consisting of the Arthur Laing, Oak Street, Knight Street and Queensborough Bridges Purple cell - the largest magnitude of dangerous goods trucks was witnessed crossing screenline (purple cell), the Burnaby/Coquitlam/New Westminster boundary Pink cell - on a screenline basis, the highest percent of dangerous goods was observed at the Pacific Highway Border Crossing between Surrey and Blaine, Washington..7 percent of trucks entering downtown Vancouver carry dangerous goods. 5. percent of trucks crossing the border between the Lower Mainland and Washington State carry dangerous goods. Exhibit. Transport of angerous Goods Across Regional Screenlines Screenline Number and escription Total Trucks angerous Goods Trucks Percent angerous Goods Trucks Burrard Inlet 4,.% False Creek / owntown Vancouver,7.5% 4 West of Main Street,7.9% 5 Vancouver / Burnaby Boundary,.% 6 Richmond / Vancouver 5,97.4% 7 Middle Arm of Fraser River,4.% Mid-Richmond 7,67 6.% 9 Richmond / Vancouver / elta, 9.6% Surrey / New Westminster / Coquitlam,4 7.6% Burnaby / Coquitlam Boundary,7 4.9% Pitt Meadows / Port Coquitlam,9.4% elta (west of Highway 9) 6,97 9.% 5 Langley / Surrey (south of Hwy ) 5, 9.7% 6 Surrey / Langley (west of th S.),67.% 7 FVR / GVR - south of Fraser River 7, 5.% FVR / GVR - north of Fraser River,57.% Fraser Valley (west of Hope), 7.% Hwy - North of BC / WA Border 5.6% Hwy - North of BC / WA Border.% 4 Hwy 5 - North of BC / WA Border,7 7.5% 9 Highway 99 Sea-to-Sky Highway % Mid-Vancouver 6, 6.9% 6 UBC West of Blanca 66.4% Total Observations.,9,56.95% Section 5 contains detailed information on screenlines and screenline stations. angerous Goods and Truck Classification Survey

40 , British Columbia Ministry of Transportation, TransLink Exhibit. Observed angerous Goods Trucks Across Regional Screenlines NORTH VANCOUVER VANCOUVER COQUITLAM BURNABY MAPLE RIGE RICHMON SURREY ELTA LANGLEY ABBOTSFOR angerous Goods and Truck Classification Survey
41 , British Columbia Ministry of Transportation, TransLink Top angerous Goods Stations The top truck count stations as defined by number of observed dangerous good trucks are listed in Exhibit.4. For reference, the percent of total trucks at each station is also provided. These stations are mapped in Exhibit.5. The colour scheme in Exhibit.4 is intended to enable spatial reference for the stations as mapped in Exhibit.5. For example, stations shown in dark red in Exhibits.4 and.5 are the top 5 dangerous goods locations. Rankings of Top Stations Hazard class placards for gases, flammable liquids, corrosive substances and anger constitute 94% of all observed placards. Based on the top dangerous goods truck stations, the rank of each station for each of these hazard classes is provided in Exhibit.6. For example, Highway at North Road (blue cells) ranked fourth, first, second and fourth in these classes. The orange cells highlight the top five rankings for each class. Appendix F contains comprehensive ranking tables. Exhibit.4 Top angerous Goods Stations G Truck Rank Stn # Location and escription Total G Trucks % of Total Trucks.6 Highway, at North Road 7 4.%. Port Mann Bridge.% 9. Alex Fraser Bridge.% 4 6. Highway, west of th Street 5.7% 5. Highway 9 [Mid-Richmond] 4.% 6 7. Highway, FVR/GVR Boundary 4.% Queensborough Bridge.9%. Brunette Avenue, south of Highway.% 9. Second Narrows Bridge.% 4. Highway 5, north of Border 7.5%. Pitt River Bridge.4%. River Road, west of Highway 9 7.% 7. Airport Connector / Moray Bridge 7 4.% 4 6. Knight Street Bridge 7.% 5. Highway, at Hope 7.% th Avenue, west of th Street 6.% Highway west of th Street 5.%. Pattullo Bridge 4.% Marine Way, west of Boundary Road.4% 9. Hwy 99, south of Squamish 6.5% Exhibit.6 Top angerous Goods Stations ranks for Major Hazard Classes angerous Goods and Truck Classification Survey G Truck Rank Stn # Location and escription Gases Hazard Class Rank Flam Liq Corro Subs anger.6 Highway, at North Road 4 4. Port Mann Bridge 5 9. Alex Fraser Bridge Highway, west of th Street Highway 9 [Mid-Richmond] Highway, FVR/GVR Boundary Queensborough Bridge 5. Brunette Avenue, south of Highway Second Narrows Bridge Highway 5, north of Border 7 -. Pitt River Bridge. River Road, west of Highway Airport Connector / Moray Bridge Knight Street Bridge 4-5. Highway, at Hope th Avenue, west of th Street Highway west of th Street 5 9. Pattullo Bridge Marine Way, west of Boundary Road Hwy 99, south of Squamish 9 6 -
42 , British Columbia Ministry of Transportation, TransLink Exhibit.5 Top angerous Goods Locations 4 angerous Goods and Truck Classification Survey
43 , British Columbia Ministry of Transportation, TransLink 4. TRUCK CLASSES SUMMARY RESULTS Close to 65, trucks were recorded over the course of the survey, and a breakdown by count station grouping is provided in Exhibit 4.. The green cells indicate that 6,9 light trucks were observed, or percent of all observed trucks. Likewise, the blue cells indicate that,7 heavy trucks were observed, where this constitutes 6 percent of the truck observations. Exhibit 4. Summary Truck Class Observations Light Trucks Trucks Truck Types Regional Screenline A truck observation does not equal a truck trip. Evaluation of truck trips must consider double counting of trips, trip length, and spatial distribution of stations throughout Metro Vancouver etc. Trade Corridor Special Locations Total Total,9 7,6 6,5 64,69 Observed 5,4 7,, 6,9 Percent 4% 6% 9% % Observed 77,4, 4,54,7 Percent 59% 74% 7% 6% Consistent with the dangerous goods section of this report, the summary results reported in the following sections represent the screenline observations only. Section 4 provides an overall scan of the truck class observations. Further detailed analysis specific to a project or study may be undertaken using the database described in Appendix C. The average of stations sampled twice is reported in the summary observations. TRUCKS CROSSING SCREENLINES A summary of light and heavy trucks crossing regional screenlines is presented in Exhibit 4. and illustrated in Exhibit 4.. Exhibit 4. also provides the percent of trucks that are heavy at each screenline: Orange cells heavy trucks dominate entry points into the Lower Mainland Green cells light trucks dominate trips into downtown Vancouver and the Vancouver International Airport. Exhibit 4. Screenline Truck Summary Screenline Number & escription Truck Type Light Total % Burrard Inlet,4,4 4, 5% False Creek / owntown Vancouver,5 49,7 4% 4 West of Main Street,,7,7 % 5 Vancouver / Burnaby Boundary 5,4 4,76, 47% 6 Richmond / Vancouver 7,,76 5,97 55% 7 Middle Arm of Fraser / Airport,54 6,4 6% Mid-Richmond,5 4, 7,67 6% 9 Richmond / Vancouver / elta,95 7,5, 67% Surrey / New Westminster / Coquitlam,9 6,46,5 6% Burnaby / Coquitlam Boundary 5,5,7, 6% Pitt Meadows / Port Coquitlam,6,9,9 6% elta (west of Highway 9),9 5,5 6,97 7% 5 Langley / Surrey (south of Highway ),47,9 5,9 54% 6 Surrey / Langley (west of th Street) 4,,46,67 67% 7 FVR / GVR - south of Fraser River, 4,9 7, 69% FVR / GVR - north of Fraser River 47,,57 7% Fraser Valley (west of Hope) 4,95,9 9% -4 North of BC-Washingon Border 5,74,9 % 9 Highway 99 Sea-to-Sky Highway % Mid-Vancouver,7,46 6, 55% 6 UBC West of Blanca % angerous Goods and Truck Classification Survey 5
44 , British Columbia Ministry of Transportation, TransLink Exhibit 4. Observed Light and Trucks Across Regional Screenlines NORTH VANCOUVER VANCOUVER MAPLE RIGE RICHMON SURREY ELTA LANGLEY ABBOTSFOR 6 angerous Goods and Truck Classification Survey

45 , British Columbia Ministry of Transportation, TransLink HEAVY TRUCKS CROSSING SCREENLINES BY CLASS Examination of truck traffic observed crossing screenlines serves to identify general patterns and concentrations of types of truck activity within Metro Vancouver. This section provides an overview that could be supplemented with detailed analysis of screenlines and routes crossing screenlines, tailored to a specific predefined purpose. Screenline and station summaries provided in Section 5 give detail for each station by truck class and time of day. Section 5 contains screenline summaries that list the detailed observations for each station along each screenline. Ranking of all individual stations for light and heavy trucks by class can be found in Appendix G. A breakdown of heavy trucks crossing screenlines by class is presented in Exhibit 4.4. The highlighted cells serve to guide review of the truck classes, based upon the contribution of each class to total heavy trucks that meet a threshold defined at the bottom of the table. For example, the purple cells highlight screenlines where there are concentrations of over 5 observed tractor only trucks. CONSTRUCTION ZONE Over 6, construction vehicles were observed during the survey, or over percent of all heavy vehicle observations. Truck Classes Few tractor only observations were made on the North Shore, downtown Vancouver screenlines as well as at entry points into the Lower Mainland such as the eastern Fraser Valley, border crossings and Highway 99 Tankers are most prominent on screenlines that include Highway, with the exception of screenline 6 (Richmond / Vancouver) Construction Vehicles are perhaps the most transient class of heavy trucks, as they are often related to specific projects or major developments that have defined completion dates. For example, construction vehicles were prominent on screenlines near major ongoing transportation projects such as the Canada Line, Pitt River Bridge and Golden Ears Bridge Single Unit / Other of all the classes, single unit heavy trucks are proportionately distributed among screenlines, with no obvious areas of low or high concentration. Screenlines Richmond / Vancouver High volumes of all heavy truck types were observed False Creek / owntown Vancouver, Main Street and UBC are dominated by construction vehicles and single unit / other trucks Mid-Vancouver close to 4 percent of heavy trucks crossing north/south over 4 st Avenue (e.g. Knight or Oak Street) are directly related to marine containers, as defined by hauling a container or empty marine container chassis Surrey / Langley west of th Street High volumes of all heavy truck types were observed except those directly related to marine containers British Columbia Washington State border close to half of the heavy trucks are tractor-trailers, and less than percent are directly related to marine containers. angerous Goods and Truck Classification Survey 7
46 , British Columbia Ministry of Transportation, TransLink Exhibit 4.4 Observed Truck Classes Across Regional Screenlines Truck Classification Screenline Number & escription Total Tractor only Tractor / Marine Container / Chassis Flatbed / Commodity Tractor - Trailer Tanker Construction Single Unit / Other Burrard Inlet, False Creek / owntown Vancouver 49 4 West of Main Street, Vancouver / Burnaby Boundary 4,76,7 67,, 6 Richmond / Vancouver,76 54,94 5,76,,65 7 Middle Arm of Fraser / Airport Mid-Richmond 4, 54, 7, Richmond / Vancouver / elta 7,5 65,6 5,6 9,4, Surrey / New Westminster / Coquitlam 6,46 49,49 5,54 94,4 Burnaby / Coquitlam Boundary,7 5, 47,6 4,6,54 Pitt Meadows / Port Coquitlam, elta (west of Highway 9) 5,5 4, Langley / Surrey (south of Highway ), Surrey / Langley (west of th Street), ,4,7,66 7 FVR / GVR - south of Fraser River 4, ,9,, FVR / GVR - north of Fraser River, 55 Fraser Valley (west of Hope), North of BC-Washingon Border, Highway 99 Sea-to-Sky Highway Mid-Vancouver,46 9, UBC West of Blanca Highlighted class meets threshold. >5 >5 >5 >5 > >5 >5 angerous Goods and Truck Classification Survey
47 , British Columbia Ministry of Transportation, TransLink LIGHT TRUCKS - STATIONS The top stations where light trucks were observed are given in Exhibits 4.5 and 4.6. Freeways or major regional bridges dominate the top stations in absolute terms, with over,5 light trucks observed at the top 4 stations in blue. The green cells indicate the most dominant light truck stations in the top by percentage, which are near the Vancouver Airport and the courier/integrator industry (e.g. UPS, FedEx). Exhibit 4.5 Top Light Truck Stations Stn # Location and escription Total Light Trucks Trucks Abs. %.6 Highway, at North Road 6,7,6 4%. Port Mann Bridge 6,9,75 9% 6. Knight Street Bridge 6,5,6 4% 9. Alex Fraser Bridge 6,5,55 9% 6.4 Queensborough Bridge 5,96,7 4%. Highway 9, mid-richmond 4,9,5 4%. Second Narrows 4,4,94 45% 6. Highway, west of th St 5,66,79 % 7. Highway, FVR/GVR boundary 6,,76 %. Brunette Ave, south of Hwy 5,,44 % 9. George Massey Tunnel 5,,4 7% 6. Arthur Laing Bridge,5, % 5.6 Marine Way, w. of Boundary,,6 5%. Pitt River Bridge,9,6 %. Pattullo Bridge,6,4 4%. Knight St, north of 4st Ave,9,5 6%. River Road 4,,5 6% 7. Airport Connector,7, 59% 6. Oak Street Bridge,9 9 47%.5 Boundary Rd, n. of Kingsway, 9 49% Top Non-Freeway Light Truck Stations Exhibit 4.7 provides the top stations for light trucks excluding freeways and regional bridges such as the Knight Street Bridge. Close to,5 light trucks were observed at Brunette Ave, south of Highway, and over, light trucks were observed at the 5 stations in blue. Light trucks composed over percent of trucks at the stations in green and over 5 percent of the trucks accessing downtown Vancouver via False Creek bridges. Exhibit 4.7 Top Non-Freeway Light Truck Stations Stn # Location and escription Total Light Trucks Trucks Abs. %. Brunette Ave, south of Hwy 5,,44 % 5.6 Marine Way, w. of Boundary Rd,,6 5%. Knight Street, n of 4st Ave,9,5 6%. River Road 4,,5 6% 7. Airport Connector,7, 59%.5 Boundary Rd, n. of Kingsway, 9 49% 6. 96th Avenue, w. of th St,9 4%. Westminster Hwy, mid-richmond,74 9%. Granville Street Bridge 75 9% 5.7 Grandview Highway, 7 59% 6.7 Hwy, west of Hwy 5,9 67 % 5.5 st Ave, w. of Skeena St 67 % 5.6 Hwy 7, w. of Boundary Rd, 67 66% 5. Hastings St, W. of Cassiar St, %. Burrard Street Bridge %.4 Highway 7, E. of Gaglardi 5 6 7% 5.7 th Street, south of Hwy % 5. McGill Street, west of Hwy, 5 % 5.6 9nd Street, south of Hwy,4 57 5% 5. 5nd Street, south of Hwy, 55 4% angerous Goods and Truck Classification Survey 9
48 , British Columbia Ministry of Transportation, TransLink Exhibit 4.6 Top Light Truck Locations angerous Goods and Truck Classification Survey
49 , British Columbia Ministry of Transportation, TransLink HEAVY TRUCKS - STATIONS A breakdown of the approximately 7, heavy trucks observed throughout the survey is illustrated in Exhibit 4.. Each truck class is discussed in turn in the following sections. Of particular note: Construction vehicles constituted percent of the observed heavy trucks Over percent of observed heavy trucks were tankers Together, trucks hauling a marine container or an empty marine container chassis constituted percent of the heavy truck observations. Exhibit 4. Truck Class Observations Top Truck Locations The top stations as ranked by total heavy trucks are shown in Exhibits 4.9 and 4.. trucks constitute over 55% of the truck traffic at all of these stations. Notably: Orange cells six stations along Highway from Hope to Second Narrows Bridge ranked in the top, including the top station at the FVR/GVR boundary Green cells heavy trucks constitute more than 7 percent of the truck traffic at each of these stations. Exhibit 4.9 Top Truck Stations Rank Stn # Location and escription Total Trucks Trucks Abs. % Tanker % Trailer % Construction % Flatbed w ith commodity % Other 9% Marine Container 5% Tractor only 6% Marine Container Chassis 5% Exhibit 4. shows the breakdown of heavy truck observations at regional screenlines, and should not be interpreted as heavy truck trips. 7. Highway, FVR/GVR boundary 6, 4,56 7%. Port Mann Bridge 6,9 4, 6% 9. Alex Fraser Bridge 6,5,95 6% 4.6 Highway, at North Road 6,7,9 5% 5 9. George Massey Tunnel 5,,9 7% 6 6. Knight Street Bridge 6,5, 6% 7 6. Highway, west of th St 5,66,7 6%. Brunette Ave, south of Hwy 5,,7 7% Queensborough Bridge 5,96,5 6%. River Road, west of Nordel 4,,5 74%. Highway 9, mid-richmond 4,9,7 5%. Second Narrows 4,4,4 55%. Pattullo Bridge,6, 66% 4. Westminster Hwy, mid-richmond,74,95 7% 5. Pitt River Bridge,9,9 6% th Avenue, west of th,7,9 4% 7. Knight St, north of 4st Ave,9,5 64%. Highway, at Hope BC,77,57 9% 9. Highway 99, west of 4th,,57 74% 5. McGill Street, west of Hwy,,5 7% angerous Goods and Truck Classification Survey
50 , British Columbia Ministry of Transportation, TransLink Exhibit 4. Top Truck Locations angerous Goods and Truck Classification Survey
51 , British Columbia Ministry of Transportation, TransLink Tractor and Trailer Combinations (%) The top stations as ranked by tractor-trailer combinations are listed in Exhibit 4.. Of particular note: Orange cells these stations that did not rank in the top for total heavy trucks, but appear here at the expense of, among others, Pitt River Bridge Green cells tractor-trailer combinations comprise over 5 percent of heavy trucks at main entry points to the Lower Mainland. Exhibit 4. Top Tractor-Trailer Stations Rank Stn # Location and escription Trucks Tractor - Trailers Abs. % 9. Alex Fraser Bridge,95,4 6% 6. Highway, west of th St,7,6 5% 7. Highway, FVR/GVR boundary 4,56,5 % 4. Port Mann Bridge 4,, 9% 5. Brunette Ave, south of Hwy,7,9 9% Queensborough Bridge,5,5 9% 7. Highway 9, mid-richmond,7 96 %. Highway, at Hope BC, % 9.6 Highway, at North Road,9 5 % 9. George Massey Tunnel,9 65 7% 4. Hwy 5, Pacific Border Crossing,6 64 6%. River Road, west of Nordel,5 6 %. Westminster Hwy, mid-richmond, % 4 6. Knight Street Bridge, 5 % Highway, west of th St,4 4 % 6. Pattullo Bridge, 5% Marine Way, west of Boundary, 9 6%. Second Narrows,4 % th Avenue, west of th St, 7 4% 6.5 6th Avenue, west of th,9 5 % Construction Vehicles (%) The top stations as ranked by construction vehicles are listed in Exhibit 4.. Of particular note: Orange cell with over, construction vehicles, 6 th Avenue west of th Street ranks as the top station The absence of Alex Fraser Bridge is noted, as is the presence of Oak Street Bridge Green cells stations relatively dominated by construction trucks, as a proportion of total heavy trucks. Exhibit 4. Construction Vehicle Stations Rank Stn # Location and escription Trucks Construction Abs. % 6.5 6th Avenue, west of th,9,4 6% 6. Knight Street Bridge,, 9% 7. Highway, FVR/GVR boundary 4,56, % 4 9. George Massey Tunnel,9 9 5% 5. Second Narrows,4 79 % 6.6 Highway, at North Road,9 7 % 7. Pitt River Bridge,9 6 %. Highway 7, FVR/GVR boundary,6 5 5% 9. Port Mann Bridge 4, 5 % 6. Highway, west of th St,7 5 % 6. Oak Street Bridge, 46 45% 6.4 Queensborough Bridge,5 45 %. Pattullo Bridge, 4 % 4. River Road, west of Nordel,5 % 5. Highway 9, mid-richmond,7 7 % 6. Highway 99, west of 4th,57 9% 7. Brunette Ave, south of Hwy,7 % 5.4 Highway 5, south of Hwy % 9 5. McGill Street, west of Hwy,5 % 6.7 Highway, west of th St,4 7 9% angerous Goods and Truck Classification Survey
52 , British Columbia Ministry of Transportation, TransLink Marine Containers and Empty Chasses (%) The top stations as ranked by marine containers and empty chasses are listed in Exhibit 4.. Of particular note: Orange cells three of the top four stations are arterial roads and none of these stations are within 5 km of a marine terminal Green cells Close to 6 percent of heavy trucks observed on Knight Street and McGill Street haul marine containers or empty marine container chasses. Exhibit 4. Top Marine Container Stations Single Unit and Other (9%) The top stations as ranked by single unit and other heavy trucks are listed in Exhibit 4.4. Of particular note: Orange cells Highway ranks in five of the top six stations, with Knight Street Bridge as the interloper. Highway at the FVR/GVR boundary ranks first Green cells the proportion of single unit heavy truck trips along River Road and Westminster Highway is relatively low. Exhibit 4.4 Top Single Unit / Other Stations Rank Stn # Location and escription Trucks Marine Container Abs. % Rank Stn # Location and escription Trucks Single Unit / Other Abs. %. Brunette Ave, south of Hwy,7, % 9. George Massey Tunnel,9,5 9%. River Road, west of Nordel,5, 7% 4. Knight St, north of 4st Ave,5, 5% 5 6. Knight Street Bridge,,5 7% 6 5. McGill Street, west of Hwy,5 9 59% 7.6 Highway, at North Road,9 6 % 6.4 Queensborough Bridge,5 4 % 9. Pattullo Bridge, 75 4%. Port Mann Bridge 4, 74 7% 9. Alex Fraser Bridge,95 7 %. Highway 9, mid-richmond,7 56 %. Pitt River Bridge,9 49 5% 4. Highway 99, west of 4th,57 4 % 5. Westminster Hwy, mid-richmond, % 6 6. Highway, west of th St,7 9 % 7 7. Highway, FVR/GVR boundary 4,56 7%. Second Narrows,4 % 9.5 Boundary Rd, n. of Kingsway 9 % 6. 96th Avenue, west of th St, % 7. Highway, FVR/GVR boundary 4,56, %. Port Mann Bridge 4, 9 % 6. Knight Street Bridge, 77 % 4 6. Highway, west of th St,7 77 % 5. Second Narrows,4 7 % 6.6 Highway, at North Road,9 7 % 7 9. George Massey Tunnel,9 67 7% 9. Alex Fraser Bridge, % 9. Brunette Ave, south of Hwy,7 64 7% 6.4 Queensborough Bridge,5 5 6%. Highway 9, mid-richmond,7 44 5%. Pattullo Bridge, 4 5%. River Road, west of Nordel,5 4 % Marine Way, west of Boundary, 9% Highway, west of th St,4 % th Avenue, west of th St, 9 6% 7. Pitt River Bridge,9 9 5%. Highway 99, west of 4th,57 7 7% 9. Westminster Hwy, mid-richmond,95 5 %.5 Boundary Rd, n. of Kingsway 9 5 7% 4 angerous Goods and Truck Classification Survey
53 , British Columbia Ministry of Transportation, TransLink Flatbed with Commodity (%) The top stations as ranked by flatbed with commodity trucks are listed in Exhibit 4.5. Of particular note: Orange cells with the top three ranking stations, Highway dominates this heavy truck class Green cells access points to Metro Vancouver show a relatively high proportion of flatbeds. The Highway 5 border crossing is ranked # ( flatbeds), and Highway 7 at the GVR/FVR Boundary is ranked #. Exhibit 4.5 Top Flatbed Stations Tractor Only (6%) The top stations as ranked by tractor only heavy trucks are listed in Exhibit 4.6. Of particular interest: Orange cells the Alex Fraser and Queensborough Bridges rank in the top, due in part to serving the industrial area along River Road (#) Green cells conversely, the George Massey / Knight Street combination serve a similar elta sub-area, but do not attract a similar magnitude of tractor only trips. Exhibit 4.6 Top Tractor Only Stations Rank Stn # Location and escription Trucks Flatbed/Commod. Abs. % Rank Stn # Location and escription Trucks Single Unit / Other Abs. % 7. Highway, FVR/GVR boundary 4,56 47 % 6. Highway, west of th St,7 4 %. Port Mann Bridge 4, 6 9% 4 9. Alex Fraser Bridge,95 9 7% 5.6 Highway, at North Road,9 7 7% Queensborough Bridge,5 7 % 7 9. George Massey Tunnel,9 4 6%. Second Narrows,4 4 % 9. Highway, at Hope BC,57 5%. Highway 9, mid-richmond,7 7% 6. Knight Street Bridge, 5%. River Road, west of Nordel,5 6% 6.7 Highway, west of th St,4 % 4. Highway 99, west of 4th,57 7 % 5. Brunette Ave, south of Hwy,7 7 4% 6. Pattullo Bridge, 6 7% 7. Hwy Border Crossing 9 %. Pitt River Bridge,9 6% th Avenue, west of th,9 6%. Highway 7, at Hope BC 9% 9. Alex Fraser Bridge,95 5 %. River Road, west of Nordel,5 5 % 6.4 Queensborough Bridge,5 9% 4. Port Mann Bridge 4, % 5. Brunette Ave, south of Hwy,7 % 6. Westminster Hwy, mid-richmond,95 4% 7 6. Highway, west of th St,7 6 7%. Highway 9, mid-richmond,7 6 9% 9 7. Highway, FVR/GVR boundary 4,56 5%.6 Highway, at North Road,9 6%. Pattullo Bridge, % 6. Knight Street Bridge, 7 4% 6. 96th Avenue, west of th St, 7 5% 4 9. George Massey Tunnel,9 5 4% Highway, west of th St,4 9% 6. Pitt River Bridge,9 7% Marine Way, west of Boundary, 7 6%. Second Narrows,4 6 % 9 7. Airport Connector 7 6 % 6.5 6th Avenue, west of th,9 6 % angerous Goods and Truck Classification Survey 5
54 , British Columbia Ministry of Transportation, TransLink Tanker (%) Overall tankers contributed percent of all heavy truck observations, or approximately,6 observations at regional screenline locations. A tanker truck does not by definition imply a dangerous goods truck, as tankers could be carrying benign goods such as water or milk. The top stations as ranked by tanker class are listed in Exhibit 4.7. Of particular note, Highway at North Road (orange highlight) dominates other count stations for this truck class in both absolute and percent terms. Exhibit 4.7 Top Tanker Stations Rank Stn # Location and escription Trucks Tanker Abs. %.6 Highway, at North Road,9 %. Port Mann Bridge 4, 9 4% 7. Highway, FVR/GVR boundary 4,56 4% 4 6. Highway, west of th St,7 7 4% 5 9. Alex Fraser Bridge,95 % 6. Highway 9, mid-richmond,7 9 % 7. Second Narrows,4 9 4% 6.4 Queensborough Bridge,5 % 9. Brunette Ave, south of Hwy,7 % 6. Knight Street Bridge, 7 %. Highway 99, west of 4th,57 7 4% 6.5 6th Avenue, west of th,9 7 4% 4. Hwy 5, Pacific Border Crossing,6 6 6% 4 9. George Massey Tunnel,9 6 % 5. Westminster Hwy, mid-richmond,95 6 % 6. Pitt River Bridge,9 6 % 7 7. Airport Connector 7 5 7%. Highway, at Hope BC,57 5 % Highway, west of th St,4 5 4%. River Road, west of Nordel,5 5 % Overall Truck Station Ranking The overall rankings in Exhibit 4. help characterize the type of trucks on the top heavy truck locations. For example, the top station VIOLATORS!!! heavy trucks were observed crossing Lions Gate Bridge, where they are prohibited. Highway at the FVR/GVR boundary ranks # for tractor-trailer, # for construction vehicles, #7 for marine container, # for single unit/other etc. The cells highlighted in blue identify the top five stations in the four truck classes that comprise over percent of the total observations and are roughly equivalent. The cells highlighted in yellow represent the top five stations for the remaining classes. epending upon a specific interest, there is much to be gleaned from this table. Of particular note with a primary focus on the subset of classes highlighted in blue: Highway in a relative sense Highway stations do not rank high for the marine container class. For example, Highway at the FVR/GVR boundary ranks # overall, but just #7 in marine containers Alex Fraser Bridge ranks # overall despite not ranking in the top for construction vehicles Queensborough Bridge ranks in the top, due in part to serving the industrial area along River Road (#) Knight Street Bridge has a strong mix of trucks in all categories, and could be # overall if this route was more attractive to tractor-trailers Knight Street at 4 st Ave conversely, Knight Street at 4 st Ave is sustained in the top almost entirely by the marine container class, and does not rank in the top for any other class Brunette Avenue, south of Hwy is an arterial that ranks # in the marine container truck class. 6 angerous Goods and Truck Classification Survey
55 , British Columbia Ministry of Transportation, TransLink Exhibit 4. Station Rankings by Truck Classification Truck Classification Rank Truck Rank Stn # Location and escription Total Trucks Tractor- Trailer Construction Marine Container Single Unit / Other Flatbed / Commodity Tractor Only Tanker 7. Highway, FVR/GVR boundary 4, Port Mann Bridge 4, Alex Fraser Bridge, Highway, at North Road, George Massey Tunnel, Knight Street Bridge, Highway, west of th St, Brunette Ave, south of Hwy, Queensborough Bridge, River Road, west of Nordel, Highway 9, mid-richmond, Second Narrows, Pattullo Bridge, Westminster Hwy, mid-richmond, Pitt River Bridge, th Avenue, west of th, Knight St, north of 4st Ave, Highway, at Hope BC, Highway 99, west of 4th, McGill Street, west of Hwy, angerous Goods and Truck Classification Survey 7
56 , British Columbia Ministry of Transportation, TransLink More Overall Truck Station Ranking George Massey Tunnel and Alex Fraser Bridge carried effectively 4, heavy trucks each during the survey period, but the distribution among the classes is quite different River Road, west of Nordel Way ranks high in marine container and tractor only, but does not rank in the top for single unit / other. This reflects the nature of the industry in the sub-area, in support of Asia-Pacific trade Second Narrows the rank of # overall is sustained by construction vehicles perhaps in part related to Sea-to-Sky Highway construction and single unit / other trucks Pattullo Bridge has a cross-section of truck classes near its overall rank of #, with the notable exception that it did not rank in the top for tanker trucks Pitt River Bridge the rank of Pitt River Bridge is sustained in large part by construction vehicles. It remains to be seen if this bridge would remain in the top overall after its reconstruction is complete 6 th Avenue, west of th Street is # in the construction class, but barely registers if at all for the other classes. It is expected that nearby gravel pits are a substantial contributor to this Highway at Hope BC Hope is the main entry between Metro Vancouver and the rest of BC and Canada. Rankings in classifications other than tractortrailer, flatbed/commodity and tanker would not be expected Highway 99, west of 4 th (mid-elta) this station shows a very different volume and cross-section than George Massey Tunnel. This demonstrates the influence of the intervening interchanges, Highway and Highway 7, which link to the Tilbury Island industrial area and the Roberts Bank container terminal. Overall Ranking of Light and Trucks Total light and heavy trucks and their respective ranking are listed in Exhibit 4.9. Of particular interest: Port Mann Bridge ranked # for both light and heavy trucks, and # overall Top light truck stations that do not rank in the overall top include the Airport Connector, the Arthur Laing and Oak Street Bridges and Boundary Road, north of Kingsway. Exhibit 4.9 Rankings by Light and Trucks Truck Classification Overall Location and escription Rank Total Light Trucks Trucks Trucks Abs. Rank Abs. Rank Port Mann Bridge 6,9,75 4, Highway, at North Road 6,7,6,9 4 Alex Fraser Bridge 6,5,55 4,95 4 Knight Street Bridge 6,5,6, 6 5 Highway, FVR/GVR boundary 6,,76 9 4,56 6 Queensborough Bridge 5,96,7 5,5 9 7 Highway, west of th St 5,66,79,7 7 George Massey Tunnel 5,,4,9 5 9 Brunette Ave, south of Hwy 5,,44,7 Highway 9, mid-richmond 4,9,5 6,7 Second Narrows 4,4,94 7,4 River Road, west of Nordel 4,,5 7,5 Pattullo Bridge,6,4 5, 4 Pitt River Bridge,9,6 4,9 5 5 Knight St, north of 4st Ave,9,5 6,5 7 6 Westminster Hwy, mid-richmond,74 -, Marine Way, west of Boundary,,6, - 6th Avenue, west of th,7 7 -,9 6 9 Highway 99, west of 4th, 56 -,57 9 McGill Street, west of Hwy, 5 -,5 angerous Goods and Truck Classification Survey
57 , British Columbia Ministry of Transportation, TransLink 5. SCREENLINE AN STATION SUMMARIES Screenline Number and escription Page Burrard Inlet 4 False Creek / owntown Vancouver 46 4 West of Main Street 5 5 Vancouver / Burnaby Boundary 6 6 Richmond / Vancouver 7 Middle Arm of Fraser River 94 Mid-Richmond 9 Richmond / Vancouver / elta 4 Surrey / New Westminster / Coquitlam 4 Burnaby / Coquitlam Boundary Pitt Meadows / Coquitlam 6 elta (west of Highway 9) 5 Langley / Surrey (south of Highway ) 6 Surrey / Langley (west of th Street) 7 FVR / GVR south of Fraser River 46 FVR / GVR north of Fraser River 5 Fraser Valley (west of Hope) 6 Highway North of BC / WA Border 54 Highway North of BC / WA Border 56 4 Highway 5 North of BC / WA Border 5 9 Highway 99 (south of Squamish) 6 Mid-Vancouver 74 6 UBC (west of Blanca) NFPR North Fraser Perimeter Road 7 SFPR South Fraser Perimeter Road SPEC Special Locations 9 angerous Goods and Truck Classification Survey 9
58 , British Columbia Ministry of Transportation, TransLink 4 angerous Goods and Truck Classification Survey

59 , British Columbia Ministry of Transportation, TransLink VANCOUVER SCREENLINES NORTH VANCOUVER VANCOUVER BURNABY angerous Goods and Truck Classification Survey 4
60 , British Columbia Ministry of Transportation, TransLink Screenline : Burrard Inlet angerous Goods Summary Screenline / Total Hazard Class Station Screenline escription Placards Class Class Class Class 4 Class 5 Class 6 Class 7 Class Class 9 ANGER Burrard Inlet Lions Gate Bridge. Second Narrows Truck Classification Summary Truck Classification Screenline / Station Screenline escription TOTAL TRUCKS LIGHT TRUCKS HEAVY TRUCKS Tractor Only Tractor with Marine Container Chassis Tractor with Marine Container Flatbed / Commodity Tractor with Trailer Tanker Construction Single Unit / Other Burrard Inlet Lions Gate Bridge Second Narrows Table Burrard Inlet 4 angerous Goods and Truck Classification Survey
61 Screenline Comments: Burrard Inlet Summary Screenline Report Commercial Truck Volume - Non-angerous and angerous Goods All Trucks (veh./ min.) : : 9: : : : : 4: 5: 6: 7: Time Beginning Non-G G Non-G G Non-G G TOTAL 7: : : : : : : : : : : : : : : : 5: : : : : TOTAL 4 4 (.%) 44 5 (.%) (.%) 45 angerous Goods Placards - Hazard Classes TOTAL by Hazard Class Class Class Class Class 4 Class 5 Class 6 Class 7 Class Class 9 ANGER TOTAL 7:-7: 7:-7: 7:-7: %.%.% 9.4% 7.%.% 5.% 4.% 47.%.%.%.5%.%.% 4.%.%.%.%.%.%.% 5.%.% 6.7%.% 5.% 4.%.%.% 5.6% Please note: The total number of placards may differ from the total number of vehicles due to vehicles having more than one placard. Placards where the class number could not be determined are not included in the Hazard Class total Commercial Truck Volume - Truck Classification LIGHT TRUCK HEAVY TRUCK TOTALS A B C E F G H X Single rear-axle Tractor Tractor w. Tractor w. Flatbed w. Tractor w. Tanker only chassis container commodity trailer (any) Construction Other HEAVY vs. ALL % HEAVY AM (7:-:) of % M (:-4:) of % PM (4:-7:) of 9 5.5% 7:-7: %.%.%.%.% 5.%.5% 7.5%.% 76 of 7 5.% AM (7:-:) of 7 55.% M (:-4:) of 67 5.% PM (4:-7:) of % 7:-7: %.%.5%.% 6.% 6.4%.4% 5.5%.% of % AM (7:-:) of % M (:-4:) of 5.% PM (4:-7:) of 47 4.% 7:-7: %.%.5%.% 5.% 5.%.9% 6.5% 4.9% 4 of 45 5.% TOTAL by Vehicle Class Light (A) (B to X) B C E F G H TOTAL by Time of ay % % 4% 6% % % X Creative Transportation Solutions Ltd. Project #6- Commercial Vehicle Screenline Surveys
62 Summary Station Report Station I MONTH/YEAR: May AY OF WEEK: Tuesday. Comments: Lions Gate Bridge Burrard Inlet Screenline Commercial Truck Volume - Non-angerous and angerous Goods All Trucks (veh./ min.) : : 9: : : : : 4: 5: 6: 7: Time Beginning Non-G G Non-G G Non-G G TOTAL 7: 7: : 7 : : 9 9: 6 : : : 6 5 : 7 : : 4 6 : 5 : : 7 4: : : 6: : : 9 TOTAL 9 (.9%) 6 (.%) 465 (.4%) 467 angerous Goods Placards - Hazard Classes TOTAL by Hazard Class Class Class Class Class 4 Class 5 Class 6 Class 7 Class Class 9 ANGER TOTAL 7:-7: 7:-7: 7:-7:.%.%.%.%.%.%.%.%.%.%.%.%.%.%.%.%.%.%.%.%.%.%.%.%.%.%.%.%.%.% Please note: The total number of placards may differ from the total number of vehicles due to vehicles having more than one placard. Placards where the class number could not be determined are not included in the Hazard Class total. Commercial Truck Volume - Truck Classification TOTAL by Vehicle Class LIGHT TRUCK HEAVY TRUCK TOTALS A B C E F G H X Single rear-axle Tractor Tractor w. Tractor w. Flatbed w. Tractor w. Tanker only chassis container commodity trailer (any) Construction Other HEAVY vs. ALL % HEAVY AM (7:-:) 4 of 4.% M (:-4:) 94 of 97.% PM (4:-7:) 5 of 5.% 7:-7: 9.7%.4%.%.%.%.4%.%.%.4% of.% AM (7:-:) 7 of.5% M (:-4:) 5 of 6.% PM (4:-7:) 64 6 of 7.6% 7:-7: %.4%.%.%.7%.4%.%.%.% 9 of 6.% AM (7:-:) 6 of 64.% M (:-4:) 79 4 of.% PM (4:-7:) 4 6 of 5.% 7:-7: %.4%.%.%.9%.4%.%.%.9% of 467.6% Light (A) TOTAL by Time of ay B (B to X) % % 4% 6% % % E F X Creative Transportation Solutions Ltd. Project #6- Commercial Vehicle Screenline Surveys
63 Station I. Comments: Second Narrows Burrard Inlet Screenline Summary Station Report -AY AVERAGE Commercial Truck Volume - Non-angerous and angerous Goods All Trucks (veh./ min.) : : 9: : : : : 4: 5: 6: 7: Time Beginning Non-G G Non-G G Non-G G TOTAL 7: : : : : : 5 6 : : : : : : : : : : : : : 4 5 6: : TOTAL (.%) 4 5 (.%) (.%) 4 angerous Goods Placards - Hazard Classes TOTAL by Hazard Class Class Class Class Class 4 Class 5 Class 6 Class 7 Class Class 9 ANGER TOTAL 7:-7: 7:-7: 4.%.% 5.%.%.%.%.% 6.%.%.% % 7.% 4.%.%.%.%.%.% 5.%.% :-7:.%.6% 45.9%.5% 4.%.%.% 7.% 4.% 5.7% Please note: The total number of placards may differ from the total number of vehicles due to vehicles having more than one placard. Placards where the class number could not be determined are not included in the Hazard Class total Commercial Truck Volume - Truck Classification LIGHT TRUCK HEAVY TRUCK TOTALS A B C E F G H X Single rear-axle Tractor Tractor w. Tractor w. Flatbed w. Tractor w. Tanker only chassis container commodity trailer (any) Construction Other HEAVY vs. ALL % HEAVY AM (7:-:) of % M (:-4:) of 56.% PM (4:-7:) of % 7:-7: %.%.%.6% 4.% 5.9%.7% 9.5% 9.% 7 of % AM (7:-:) of 6 6.5% M (:-4:) of 9 55.% PM (4:-7:) of % 7:-7: %.4%.%.6% 6.6% 7.%.5% 7.%.% of 9 5.% AM (7:-:) of 49 6.% M (:-4:) of % PM (4:-7:) of 7 4.% 7:-7: %.4%.7%.6% 5.5% 6.5%.%.% 6.4% 96 of 4 55.% TOTAL by Vehicle Class Light (A) (B to X) B C E F G TOTAL by Time of ay % % 4% 6% % % H X Creative Transportation Solutions Ltd. Project #6- Commercial Vehicle Screenline Surveys
64 , British Columbia Ministry of Transportation, TransLink Screenline : False Creek / owntown Vancouver angerous Goods Summary Screenline / Total Hazard Class Station Screenline escription Placards Class Class Class Class 4 Class 5 Class 6 Class 7 Class Class 9 ANGER False Creek / owntown Vancouver Burrard Street Bridge 7. Granville Street Bridge 4. Cambie Street Bridge Truck Classification Summary Truck Classification Screenline / Station Screenline escription TOTAL TRUCKS LIGHT TRUCKS HEAVY TRUCKS Tractor Only Tractor with Marine Container Chassis Tractor with Marine Container Flatbed / Commodity Tractor with Trailer Tanker Construction Single Unit / Other False Creek / owntown Vancouver Burrard Street Bridge Granville Street Bridge Cambie Street Bridge Table False Creek / owntown Vancouver 46 angerous Goods and Truck Classification Survey
65 Screenline Comments: False Creek / owntown Vancouver Summary Screenline Report Commercial Truck Volume - Non-angerous and angerous Goods All Trucks (veh./ min.) : : 9: : : : : 4: 5: 6: 7: Time Beginning Non-G G Non-G G Non-G G TOTAL 7: : : 7 99 : 5 9: : : : : 6 57 : : : : : : : : : : : : TOTAL 59 4 (.%) 96 6 (.7%) 55 (.5%) 65 angerous Goods Placards - Hazard Classes TOTAL by Hazard Class Class Class Class Class 4 Class 5 Class 6 Class 7 Class Class 9 ANGER TOTAL 7:-7:.% 5.% 6.7%.%.%.%.%.%.%.% 6 7:-7: 6.% 75.%.%.%.%.%.%.%.% 5.% 9 4 7:-7:.% 64.% 7.%.%.%.%.%.%.%.6% Please note: The total number of placards may differ from the total number of vehicles due to vehicles having more than one placard. Placards where the class number could not be determined are not included in the Hazard Class total. 4 Commercial Truck Volume - Truck Classification LIGHT TRUCK HEAVY TRUCK TOTALS A B C E F G H X Single rear-axle Tractor Tractor w. Tractor w. Flatbed w. Tractor w. Tanker only chassis container commodity trailer (any) Construction Other HEAVY vs. ALL % HEAVY AM (7:-:) of 45.% M (:-4:) of 47.5% PM (4:-7:) of 7 9.4% 7:-7: %.7%.%.%.4%.7%.5%.%.7% 49 of 6.% AM (7:-:) of 65.% M (:-4:) of 5 7.6% PM (4:-7:) of 9.6% 7:-7: %.%.6%.%.%.%.% 5.% 6.% 6 of 9 5.% AM (7:-:) of 7 7.7% M (:-4:) of % PM (4:-7:) of 5 4.% 7:-7: %.5%.7%.%.6%.%.4% 5.% 5.% 45 of 65.5% TOTAL by Vehicle Class Light (A) (B to X) B C E F G TOTAL by Time of ay % % 4% 6% % % H X Creative Transportation Solutions Ltd. Project #6- Commercial Vehicle Screenline Surveys
66 Summary Station Report Station I MONTH/YEAR: March AY OF WEEK: Tuesday. Comments: Burrard Street Bridge False Creek / owntown Vancouver Screenline Commercial Truck Volume - Non-angerous and angerous Goods All Trucks (veh./ min.) : : 9: : : : : 4: 5: 6: 7: Time Beginning Non-G G Non-G G Non-G G TOTAL 7: : 7 6 : 6 5 : 7 9: 4 4 9: : : : 5 5 : 5 5 : : : 4 4 : : : : : 5 7 6: : 4 7: TOTAL 46 (.6%) 95 5 (.%) 74 7 (.9%) 74 angerous Goods Placards - Hazard Classes TOTAL by Hazard Class Class Class Class Class 4 Class 5 Class 6 Class 7 Class Class 9 ANGER TOTAL 7:-7: 7:-7:.% 66.7%.%.%.%.%.%.%.%.% 5.% 7.4%.%.%.%.%.%.%.%.6% 7 7 7:-7:.% 7.%.%.%.%.%.%.%.%.% Please note: The total number of placards may differ from the total number of vehicles due to vehicles having more than one placard. Placards where the class number could not be determined are not included in the Hazard Class total. Commercial Truck Volume - Truck Classification TOTAL by Vehicle Class LIGHT TRUCK HEAVY TRUCK TOTALS A B C E F G H X Single rear-axle Tractor Tractor w. Tractor w. Flatbed w. Tractor w. Tanker only chassis container commodity trailer (any) Construction Other HEAVY vs. ALL % HEAVY AM (7:-:) of 5.% M (:-4:) 9 7 of 4 5.% PM (4:-7:) 9 9 of.7% 7:-7: %.9%.%.6%.%.6%.6%.% 4.% 5 of 4 4.9% AM (7:-:) 6 4 of 4.% M (:-4:) 5 5 of 77 4.% PM (4:-7:) 95 4 of 9.% 7:-7: %.%.%.%.%.%.%.% 4.% 5 of 4.% AM (7:-:) of 9 5.% M (:-4:) 7 46 of 7 4.5% PM (4:-7:) 6 6 of.% 7:-7: %.5%.%.%.%.7%.%.% 4.% 5 of 74 4.% Light (A) (B to X) FG TOTAL by Time of ay % % 4% 6% % % B H X Creative Transportation Solutions Ltd. Project #6- Commercial Vehicle Screenline Surveys
67 Summary Station Report Station I MONTH/YEAR: March AY OF WEEK: Tuesday. Comments: Granville Street Bridge False Creek / owntown Vancouver Screenline Commercial Truck Volume - Non-angerous and angerous Goods All Trucks (veh./ min.) : : 9: : : : : 4: 5: 6: 7: Time Beginning Non-G G Non-G G Non-G G TOTAL 7: : : : : : : : : : : 6 4 : 7 5 : : : 6 6 4: 4 4 5: : : : : 4 4 TOTAL 49 (.5%) 77 (.%) 6 (.4%) 9 angerous Goods Placards - Hazard Classes TOTAL by Hazard Class Class Class Class Class 4 Class 5 Class 6 Class 7 Class Class 9 ANGER TOTAL 7:-7:.%.%.%.%.%.%.%.%.%.% 7:-7:.%.%.%.%.%.%.%.%.%.% 7:-7:.% 5.% 5.%.%.%.%.%.%.% 5.% Please note: The total number of placards may differ from the total number of vehicles due to vehicles having more than one placard. Placards where the class number could not be determined are not included in the Hazard Class total. 4 Commercial Truck Volume - Truck Classification TOTAL by Vehicle Class LIGHT TRUCK HEAVY TRUCK TOTALS A B C E F G H X Single rear-axle Tractor Tractor w. Tractor w. Flatbed w. Tractor w. Tanker only chassis container commodity trailer (any) Construction Other HEAVY vs. ALL % HEAVY AM (7:-:) 76 6 of.% M (:-4:) of 4.% PM (4:-7:) of 5.6% 7:-7: %.7%.%.%.%.%.5%.5%.% of 4 4.6% AM (7:-:) 7 6 of 5.5% M (:-4:) of 7 5.9% PM (4:-7:) of 6 4.% 7:-7: %.%.%.%.%.%.5%.% 6.9% 4 of 7.6% AM (7:-:) 6 4 of 5 7.7% M (:-4:) 4 7 of 4.6% PM (4:-7:) 7 7 of.5% 7:-7: %.5%.4%.%.6%.4%.5%.4% 4.7% 6 of 9 7.4% Light (A) (B to X) B C E F G H TOTAL by Time of ay % % 4% 6% % % X Creative Transportation Solutions Ltd. Project #6- Commercial Vehicle Screenline Surveys
68 Summary Station Report Station I MONTH/YEAR: March AY OF WEEK: Tuesday. Comments: Cambie Street Bridge False Creek / owntown Vancouver Screenline Commercial Truck Volume - Non-angerous and angerous Goods All Trucks (veh./ min.) : : 9: : : : : 4: 5: 6: 7: Time Beginning Non-G G Non-G G Non-G G TOTAL 7: 7 6 7: 6 : 4 4 : 5 9: : 6 6 : 4 6 : 5 : 4 : : 6 : 6 : : 5 5 4: 4: 6 6 5: 6 6 5: : 6: 5 5 7: TOTAL 4 (.%) 4 (.%) 5 (.%) 5 angerous Goods Placards - Hazard Classes TOTAL by Hazard Class Class Class Class Class 4 Class 5 Class 6 Class 7 Class Class 9 ANGER TOTAL 7:-7: No placards observed. 7:-7: 7:-7: Please note: The total number of placards may differ from the total number of vehicles due to vehicles having more than one placard. Placards where the class number could not be determined are not included in the Hazard Class total. Commercial Truck Volume - Truck Classification LIGHT TRUCK HEAVY TRUCK TOTALS A B C E F G H X Single rear-axle Tractor Tractor w. Tractor w. Flatbed w. Tractor w. Tanker only chassis container commodity trailer (any) Construction Other HEAVY vs. ALL % HEAVY AM (7:-:) of 7 74.% M (:-4:) of 5 7.5% PM (4:-7:) 6 9 of 6 65.% 7:-7: %.5%.%.%.%.6%.5% 6.% 4.% 77 of 4 7.% AM (7:-:) 7 6 of 4 7.5% M (:-4:) of 5.% PM (4:-7:) 7 4 of 5.% 7:-7: 5 65.%.%.6%.%.4%.4%.%.% 4.5% 4 of 4 4.7% AM (7:-:) of 9 66.% M (:-4:) of 4 6.7% PM (4:-7:) of 5 55.% 7:-7: %.6%.%.%.4%.%.6% 49.% 6.7% of 5 6.% TOTAL by Vehicle Class Light (A) (B to X) FG B C E TOTAL by Time of ay % % 4% 6% % % H X Creative Transportation Solutions Ltd. Project #6- Commercial Vehicle Screenline Surveys
69 , British Columbia Ministry of Transportation, TransLink angerous Goods and Truck Classification Survey 5
70 , British Columbia Ministry of Transportation, TransLink Screenline 4: West of Main Street / owntown Vancouver angerous Goods Summary Screenline / Total Hazard Class Station Screenline escription Placards Class Class Class Class 4 Class 5 Class 6 Class 7 Class Class 9 ANGER 4 West of Main Street / owntown Vancouver Waterfront Street 4. Powell Street 4. Cordova Street Hastings Street unsmuir Street 4.9 Georgia Street 4. Quebec Street, north of Terminal Avenue 7 Truck Classification Summary Truck Classification Screenline / Station Screenline escription TOTAL TRUCKS LIGHT TRUCKS HEAVY TRUCKS Tractor Only Tractor with Marine Container Chassis Tractor with Marine Container Flatbed / Commodity Tractor with Trailer Tanker Construction Single Unit / Other 4 West of Main Street / owntown Vancouver Waterfront Street Powell Street Cordova Street Hastings Street unsmuir Street Georgia Street Quebec Street, north of Terminal Avenue Table West of Main St 5 angerous Goods and Truck Classification Survey
71 Screenline 4 Comments: Summary Screenline Report West of Main Street / owntown Vancouver Commercial Truck Volume - Non-angerous and angerous Goods All Trucks (veh./ min.) : : 9: : : : : 4: 5: 6: 7: Time Beginning Non-G G Non-G G Non-G G TOTAL 7: 5 5 7: : : : : : : : : : 7 9 : : : : : : : 7 4 6: : : TOTAL (.7%) 57 (.%) 7 (.9%) 6 angerous Goods Placards - Hazard Classes TOTAL by Hazard Class Class Class Class Class 4 Class 5 Class 6 Class 7 Class Class 9 ANGER TOTAL 4 7:-7: 5.% 66.7% 6.7%.%.%.%.%.%.% 6.7% 7:-7: 7 6.% 45.% 9.%.%.%.%.%.%.% 5.% 4 7 7:-7:.% 5.%.%.%.%.%.%.%.% 7.9% Please note: The total number of placards may differ from the total number of vehicles due to vehicles having more than one placard. Placards where the class number could not be determined are not included in the Hazard Class total. 9 Commercial Truck Volume - Truck Classification LIGHT TRUCK HEAVY TRUCK TOTALS A B C E F G H X Single rear-axle Tractor Tractor w. Tractor w. Flatbed w. Tractor w. Tanker only chassis container commodity trailer (any) Construction Other HEAVY vs. ALL % HEAVY AM (7:-:) of 5 45.% M (:-4:) of 5.4% PM (4:-7:) of % 7:-7: %.7%.5%.%.5%.5%.9% 4.%.6% 65 of 4.6% AM (7:-:) of 6.4% M (:-4:) of % PM (4:-7:) 9 67 of 76 4.% 7:-7: %.%.%.6% 4.%.%.5%.6% 7.9% 44 of 55.% AM (7:-:) of 7.7% M (:-4:) of 9.4% PM (4:-7:) of % 7:-7: %.5%.4%.4%.7%.%.7%.%.% 69 of 6.7% TOTAL by Vehicle Class Light (A) (B to X) B C E F G TOTAL by Time of ay % % 4% 6% % % H X Creative Transportation Solutions Ltd. Project #6- Commercial Vehicle Screenline Surveys
72 Summary Station Report Station I MONTH/YEAR: March AY OF WEEK: Monday 4.. Comments: Waterfront Street West of Main Street / owntown Vancouver Screenline Commercial Truck Volume - Non-angerous and angerous Goods All Trucks (veh./ min.) : : 9: : : : : 4: 5: 6: 7: Time Beginning Non-G G Non-G G Non-G G TOTAL 7: 4 4 7: 4 9 : : 5 9: 4 6 9: 5 : 5 5 : : : : : : : 6 6 4: 5 5 4: 4 4 5: 6 9 5: 6: : : TOTAL 96 (.%) 9 (.%) 6 (.%) angerous Goods Placards - Hazard Classes TOTAL by Hazard Class Class Class Class Class 4 Class 5 Class 6 Class 7 Class Class 9 ANGER TOTAL 7:-7: 7:-7: 7:-7:.%.%.%.%.%.%.%.%.%.%.%.%.%.%.%.%.%.%.%.%.%.%.%.%.%.%.%.%.%.% Please note: The total number of placards may differ from the total number of vehicles due to vehicles having more than one placard. Placards where the class number could not be determined are not included in the Hazard Class total. Commercial Truck Volume - Truck Classification TOTAL by Vehicle Class LIGHT TRUCK HEAVY TRUCK TOTALS A B C E F G H X Single rear-axle Tractor Tractor w. Tractor w. Flatbed w. Tractor w. Tanker only chassis container commodity trailer (any) Construction Other HEAVY vs. ALL % HEAVY AM (7:-:) 7 5 of 6 4.7% M (:-4:) 4 6 of 4 5.% PM (4:-7:) 4 7 of.% 7:-7: %.%.%.%.%.% 4.% 5.%.4% of 97.9% AM (7:-:) of 4 5.% M (:-4:) 6 of.% PM (4:-7:) of.% 7:-7: %.%.%.% 7.7%.%.%.%.% 5 of 9 7.5% AM (7:-:) of 76.% M (:-4:) of 7 7.9% PM (4:-7:) 4 4 of 4 9.4% 7:-7: %.6%.%.5% 4.%.%.7% 4.%.% 5 of.% Light (A) (B to X) TOTAL by Time of ay B E F G H % % 4% 6% % % X Creative Transportation Solutions Ltd. Project #6- Commercial Vehicle Screenline Surveys
73 Summary Station Report Station I MONTH/YEAR: March 4. Powell Street West of Main Street / owntown Vancouver Screenline Comments: only. AY OF WEEK: Tuesday Commercial Truck Volume - Non-angerous and angerous Goods All Trucks (veh./ min.) : : 9: : : : : 4: 5: 6: 7: Time Beginning Non-G G Non-G G Non-G G TOTAL 7: 7: : 7 7 : : 9: : : : : : : : : 4: 4: 5: : 6: : : TOTAL (.%) (.%) angerous Goods Placards - Hazard Classes TOTAL by Hazard Class Class Class Class Class 4 Class 5 Class 6 Class 7 Class Class 9 ANGER TOTAL 7:-7: 7:-7:.%.% 66.7%.%.%.%.%.%.%.% 7:-7:.%.% 66.7%.%.%.%.%.%.%.% Please note: The total number of placards may differ from the total number of vehicles due to vehicles having more than one placard. Placards where the class number could not be determined are not included in the Hazard Class total. Commercial Truck Volume - Truck Classification TOTAL by Vehicle Class LIGHT TRUCK HEAVY TRUCK A B C E F G H X Tractor Tractor w. Tractor w. Flatbed w. Tractor w. Tanker Single rear-axle Construction Other only chassis container commodity trailer (any) AM (7:-:) M (:-4:) PM (4:-7:) 7:-7: HEAVY vs. ALL TOTALS % HEAVY Light (A) (B to X) B F G H X AM (7:-:) of.% M (:-4:) of.7% PM (4:-7:) of 5.4% 7:-7: %.%.%.%.%.%.%.%.% 96 of.7% AM (7:-:) of.% M (:-4:) of.7% PM (4:-7:) of 5.4% 7:-7: %.%.%.%.%.%.%.%.% 96 of.7% TOTAL by Time of ay % % 4% 6% % % Creative Transportation Solutions Ltd. Project #6- Commercial Vehicle Screenline Surveys
74 Summary Station Report Station I MONTH/YEAR: March 4. Cordova Street West of Main Street / owntown Vancouver Screenline Comments: only. AY OF WEEK: Tuesday All Trucks (veh./ min.) Commercial Truck Volume - Non-angerous and angerous Goods Time 5 Beginning Non-G G Non-G G Non-G G TOTAL 7: 7: : : : : 9 : : : : : : : : : : : 9 5: 6: 6: : TOTAL 7 6 (.6%) 7 6 (.6%) 7 7: : 9: : : : : 4: 5: 6: 7: angerous Goods Placards - Hazard Classes TOTAL by Hazard Class Class Class Class Class 4 Class 5 Class 6 Class 7 Class Class 9 ANGER TOTAL 7:-7: 7:-7: 4.% 66.7%.%.%.%.%.%.%.%.% 6 4 7:-7:.% 66.7%.%.%.%.%.%.%.%.% Please note: The total number of placards may differ from the total number of vehicles due to vehicles having more than one placard. Placards where the class number could not be determined are not included in the Hazard Class total. 6 Commercial Truck Volume - Truck Classification LIGHT TRUCK HEAVY TRUCK TOTALS A B C E F G H X Single rear-axle Tractor Tractor w. Tractor w. Flatbed w. Tractor w. Tanker only chassis container commodity trailer (any) Construction Other HEAVY vs. ALL % HEAVY AM (7:-:) 7 4 of 4.5% M (:-4:) of 6.% PM (4:-7:) 6 of 4.% 7:-7: %.%.%.%.5%.4%.%.6%.9% 9 of 7.% AM (7:-:) M (:-4:) PM (4:-7:) 7:-7: AM (7:-:) 7 4 of 4.5% M (:-4:) of 6.% PM (4:-7:) 6 of 4.% 7:-7: %.%.%.%.5%.4%.%.6%.9% 9 of 7.% TOTAL by Vehicle Class Light (A) (B to X) B C E F G TOTAL by Time of ay % % 4% 6% % % H X Creative Transportation Solutions Ltd. Project #6- Commercial Vehicle Screenline Surveys
75 Summary Station Report Station I MONTH/YEAR: March AY OF WEEK: Tuesday 4.4 Comments: Hastings Street West of Main Street / owntown Vancouver Screenline All Trucks (veh./ min.) Commercial Truck Volume - Non-angerous and angerous Goods Time Beginning Non-G G Non-G G Non-G G TOTAL 7: 9 7: : : 6 9 9: : : : 7 : 6 7 : : : 5 9 : : 6 4 4: : 4 4 5: : 9 6: : 65 7: TOTAL (.9%) (.%) 5 (.9%) 5 7: : 9: : : : : 4: 5: 6: 7: angerous Goods Placards - Hazard Classes TOTAL by Hazard Class Class Class Class Class 4 Class 5 Class 6 Class 7 Class Class 9 ANGER TOTAL 7:-7:.% 5.% 5.%.%.%.%.%.%.%.% 7:-7: 4.% 4.%.%.%.%.%.%.%.%.% 5 4 7:-7:.% 4.7%.%.%.%.%.%.%.% 5.% Please note: The total number of placards may differ from the total number of vehicles due to vehicles having more than one placard. Placards where the class number could not be determined are not included in the Hazard Class total. Commercial Truck Volume - Truck Classification LIGHT TRUCK HEAVY TRUCK TOTALS A B C E F G H X Single rear-axle Tractor Tractor w. Tractor w. Flatbed w. Tractor w. Tanker only chassis container commodity trailer (any) Construction Other HEAVY vs. ALL % HEAVY AM (7:-:) of 59.% M (:-4:) of 7.% PM (4:-7:) 7 7 of 77 9.% 7:-7: %.9%.%.%.9%.%.% 4.5% 7.% 4 of 4.% AM (7:-:) of 59.% M (:-4:) 66 9 of 7 4.% PM (4:-7:) 5 4 of 4.6% 7:-7: %.%.%.%.4%.4%.%.% 9.% 7 of 9 7.% AM (7:-:) of.% M (:-4:) of 75.6% PM (4:-7:) of.5% 7:-7: %.4%.%.%.%.7%.4% 9.4%.% 9 of 5.% TOTAL by Vehicle Class Light (A) (B to X) E F G TOTAL by Time of ay % % 4% 6% % % B H X Creative Transportation Solutions Ltd. Project #6- Commercial Vehicle Screenline Surveys
76 Summary Station Report Station I MONTH/YEAR: March 4. unsmuir Street West of Main Street / owntown Vancouver Screenline Comments: only. AY OF WEEK: Tuesday All Trucks (veh./ min.) Time 45 Beginning Non-G G Non-G G Non-G G TOTAL 7: : : : : : 5 : : : : : : 9 9 : : : : 5: 5: : : 65 7: TOTAL 4 (.4%) 4 (.4%) 44 7: : 9: : : : : 4: Commercial Truck Volume - Non-angerous and angerous Goods 5: 6: 7: angerous Goods Placards - Hazard Classes TOTAL by Hazard Class Class Class Class Class 4 Class 5 Class 6 Class 7 Class Class 9 ANGER TOTAL 7:-7: 7:-7: 7:-7:.%.%.%.%.%.%.%.%.%.%.%.%.%.%.%.%.%.%.%.% Please note: The total number of placards may differ from the total number of vehicles due to vehicles having more than one placard. Placards where the class number could not be determined are not included in the Hazard Class total. LIGHT TRUCK Commercial Truck Volume - Truck Classification HEAVY TRUCK A B C E F G H X Tractor Tractor w. Tractor w. Flatbed w. Tractor w. Tanker Single rear-axle Construction Other only chassis container commodity trailer (any) AM (7:-:) M (:-4:) PM (4:-7:) 7:-7: HEAVY vs. ALL AM (7:-:) of 9 4.4% M (:-4:) of % PM (4:-7:) 7 7 of % 7:-7: %.%.%.% 4.5%.4%.%.% 4.5% 6 of 44 4.% AM (7:-:) of 9 4.4% M (:-4:) of % PM (4:-7:) 7 7 of % 7:-7: %.%.%.% 4.5%.4%.%.% 4.5% 6 of 44 4.% TOTALS % HEAVY TOTAL by Vehicle Class Light (A) (B to X) B C E F G TOTAL by Time of ay % % 4% 6% % % H X Creative Transportation Solutions Ltd. Project #6- Commercial Vehicle Screenline Surveys
77 Summary Station Report Station I MONTH/YEAR: March 4.9 Georgia Street West of Main Street / owntown Vancouver Screenline Comments: only. AY OF WEEK: Tuesday All Trucks (veh./ min.) Time Beginning Non-G G Non-G G Non-G G TOTAL 7: : : : 9: : : : : : : : : 4: : 4: 5: : : : 65 7: TOTAL 796 (.%) 796 (.%) 797 7: : 9: : : : : 4: Commercial Truck Volume - Non-angerous and angerous Goods 5: 6: 7: angerous Goods Placards - Hazard Classes TOTAL by Hazard Class Class Class Class Class 4 Class 5 Class 6 Class 7 Class Class 9 ANGER TOTAL 7:-7:.%.%.%.%.%.%.%.%.%.% 7:-7: 7:-7:.%.%.%.%.%.%.%.%.%.% Please note: The total number of placards may differ from the total number of vehicles due to vehicles having more than one placard. Placards where the class number could not be determined are not included in the Hazard Class total. Commercial Truck Volume - Truck Classification TOTAL by Vehicle Class LIGHT TRUCK HEAVY TRUCK TOTALS A B C E F G H X Single rear-axle Tractor Tractor w. Tractor w. Flatbed w. Tractor w. Tanker only chassis container commodity trailer (any) Construction Other HEAVY vs. ALL % HEAVY AM (7:-:) of 5.4% M (:-4:) of % PM (4:-7:) of 9 5.% 7:-7: %.6%.%.%.%.5%.% 9.9% 7.6% 7 of % AM (7:-:) M (:-4:) PM (4:-7:) 7:-7: AM (7:-:) of 5.4% M (:-4:) of % PM (4:-7:) of 9 5.% 7:-7: %.6%.%.%.%.5%.% 9.9% 7.6% 7 of % Light (A) (B to X) B E F TOTAL by Time of ay % % 4% 6% % % H X Creative Transportation Solutions Ltd. Project #6- Commercial Vehicle Screenline Surveys
78 Summary Station Report Station I MONTH/YEAR: March AY OF WEEK: Tuesday 4. Comments: Quebec Street, north of Terminal Avenue West of Main Street / owntown Vancouver Screenline All Trucks (veh./ min.) Commercial Truck Volume - Non-angerous and angerous Goods Time 5 Beginning Non-G G Non-G G Non-G G TOTAL 7: 7: : 4 4 : 9 5 9: : : 9 4 : : : 9 7 : : 4 5 : : 4 7 4: : : 5: 6 6: 6 6 6: 65 7: 6 7 TOTAL 64 4 (.%) 4 (.9%) 69 7 (.%) 75 7: : 9: : : : : 4: 5: 6: 7: angerous Goods Placards - Hazard Classes TOTAL by Hazard Class Class Class Class Class 4 Class 5 Class 6 Class 7 Class Class 9 ANGER TOTAL 7:-7: 5.% 7.4% 4.%.%.%.%.%.%.% 4.% 7 7:-7: 7:-7: 7.%.% 5.% 6.6% 5.%.%.%.%.%.%.%.%.%.%.%.%.%.% 5.%.% Please note: The total number of placards may differ from the total number of vehicles due to vehicles having more than one placard. Placards where the class number could not be determined are not included in the Hazard Class total. 4 Commercial Truck Volume - Truck Classification LIGHT TRUCK HEAVY TRUCK TOTALS A B C E F G H X Single rear-axle Tractor Tractor w. Tractor w. Flatbed w. Tractor w. Tanker only chassis container commodity trailer (any) Construction Other HEAVY vs. ALL % HEAVY AM (7:-:) of % M (:-4:) of 7 4.% PM (4:-7:) of 74.% 7:-7: %.%.%.%.%.%.5%.% 7.9% 9 of 6.% AM (7:-:) of 7 5.6% M (:-4:) of 5.5% PM (4:-7:) of 99.% 7:-7: %.%.6%.% 4.% 4.5%.% 6.9%.4% of 7.6% AM (7:-:) 47 9 of % M (:-4:) of.% PM (4:-7:) 5 of 7.6% 7:-7: %.%.4%.% 6.%.7%.% 4.5% 9.% 49 of 75 5.% TOTAL by Vehicle Class Light (A) (B to X) B C E F G TOTAL by Time of ay % % 4% 6% % % H X Creative Transportation Solutions Ltd. Project #6- Commercial Vehicle Screenline Surveys
79 , British Columbia Ministry of Transportation, TransLink angerous Goods and Truck Classification Survey 6
80 , British Columbia Ministry of Transportation, TransLink Screenline 5: Vancouver/Burnaby Municipal Boundary angerous Goods Summary Screenline / Total Hazard Class Station Screenline escription Placards Class Class Class Class 4 Class 5 Class 6 Class 7 Class Class 9 ANGER 5 Vancouver/Burnaby Municipal Boundary McGill Street 7 5. Hastings Street st Avenue Highway Grandview Highway 5.9 9th Avenue 7 5. Kingsway th Avenue 5.6 Marine Way, west of Boundary Road 4 9 Truck Classification Summary Truck Classification Screenline / Station Screenline escription TOTAL TRUCKS LIGHT TRUCKS HEAVY TRUCKS Tractor Only Tractor with Marine Container Chassis Tractor with Marine Container Flatbed / Commodity Tractor with Trailer Tanker Construction Single Unit / Other 5 Vancouver/Burnaby Municipal Boundary McGill Street Hastings Street st Avenue Highway Grandview Highway th Avenue Kingsway th Avenue Marine Way, west of Boundary Road Table 4 Vancouver / Burnaby Boundary 6 angerous Goods and Truck Classification Survey
81 Screenline 5 Comments: Summary Screenline Report Vancouver/Burnaby Municipal Boundary Commercial Truck Volume - Non-angerous and angerous Goods All Trucks (veh./ min.) : : 9: : : : : 4: 5: 6: 7: Time Beginning Non-G G Non-G G Non-G G TOTAL 7: : : : : : : : : : : : : : : : : : : : : TOTAL (.%) (.%) 74 9 (.%) angerous Goods Placards - Hazard Classes TOTAL by Hazard Class Class Class Class Class 4 Class 5 Class 6 Class 7 Class Class 9 ANGER TOTAL 7:-7: 7:-7: % 5.9% 6.%.%.%.%.% 5.%.7% 6.9% %.6% 4.5%.%.%.%.% 6.5%.6% 6.% :-7:.%.% 5.7%.%.%.%.% 5.%.7%.7% Please note: The total number of placards may differ from the total number of vehicles due to vehicles having more than one placard. Placards where the class number could not be determined are not included in the Hazard Class total. Commercial Truck Volume - Truck Classification TOTAL by Vehicle Class LIGHT TRUCK HEAVY TRUCK TOTALS A B C E F G H X Single rear-axle Tractor Tractor w. Tractor w. Flatbed w. Tractor w. Tanker only chassis container commodity trailer (any) Construction Other HEAVY vs. ALL % HEAVY AM (7:-:) of % M (:-4:) of 47.% PM (4:-7:) of % 7:-7: %.%.4% 9.9%.6% 6.6%.%.4%.% 557 of % AM (7:-:) of % M (:-4:) of % PM (4:-7:) of 99 4.% 7:-7: %.6%.%.5%.6% 6.7%.%.% 7.% of 4 45.% AM (7:-:) of % M (:-4:) of 79 4.% PM (4:-7:) of 7 45.% 7:-7: %.9%.%.%.% 6.6%.%.6% 9.9% 4759 of 46.7% Light (A) (B to X) B C E F G H TOTAL by Time of ay % % 4% 6% % % X Creative Transportation Solutions Ltd. Project #6- Commercial Vehicle Screenline Surveys
82 Summary Station Report Station I MONTH/YEAR: February 5. McGill Street Vancouver/Burnaby Municipal Boundary Screenline Comments: Replacement for Wall Street count. AY OF WEEK: Monday Commercial Truck Volume - Non-angerous and angerous Goods All Trucks (veh./ min.) : : 9: : : : : 4: 5: 6: 7: Time Beginning Non-G G Non-G G Non-G G TOTAL 7: : : : : : : : 75 5 : 6 6 : : : : 66 7 : : : : : : : : TOTAL 9 7 (.6%) 99 9 (.9%) 6 (.%) 96 angerous Goods Placards - Hazard Classes TOTAL by Hazard Class Class Class Class Class 4 Class 5 Class 6 Class 7 Class Class 9 ANGER TOTAL 7:-7: 7:-7: 5.% 4.% 7.4%.%.%.%.% 4.%.%.% 6.%.% 6.%.%.%.%.%.%.%.% 7 7:-7:.%.% 64.7%.%.%.%.% 7.6%.% 5.9% Please note: The total number of placards may differ from the total number of vehicles due to vehicles having more than one placard. Placards where the class number could not be determined are not included in the Hazard Class total. 7 Commercial Truck Volume - Truck Classification LIGHT TRUCK HEAVY TRUCK TOTALS A B C E F G H X Single rear-axle Tractor Tractor w. Tractor w. Flatbed w. Tractor w. Tanker only chassis container commodity trailer (any) Construction Other HEAVY vs. ALL % HEAVY AM (7:-:) of % M (:-4:) of 44 7.% PM (4:-7:) of % 7:-7: %.%.%.7%.6%.%.%.% 9.% 756 of % AM (7:-:) of % M (:-4:) of % PM (4:-7:) of 4 7.% 7:-7: %.%.7% 7.9%.5%.%.5%.% 6.9% 76 of % AM (7:-:) of % M (:-4:) of 5 74.% PM (4:-7:) of % 7:-7: %.% 6.% 5.7%.%.5%.%.%.% 57 of % TOTAL by Vehicle Class Light (A) (B to X) B C TOTAL by Time of ay E F G H X % % 4% 6% % % Creative Transportation Solutions Ltd. Project #6- Commercial Vehicle Screenline Surveys
83 Summary Station Report Station I MONTH/YEAR: February AY OF WEEK: Tuesday 5. Comments: Hastings Street Vancouver/Burnaby Municipal Boundary Screenline Commercial Truck Volume - Non-angerous and angerous Goods All Trucks (veh./ min.) : : 9: : : : : 4: 5: 6: 7: Time Beginning Non-G G Non-G G Non-G G TOTAL 7: : : 5 5 : : : : : : : : : 5 5 : : 5 5 4: : : 5 5 5: 4 4 6: : : TOTAL 555 (.5%) 55 (.5%) (.%) 9 angerous Goods Placards - Hazard Classes TOTAL by Hazard Class Class Class Class Class 4 Class 5 Class 6 Class 7 Class Class 9 ANGER TOTAL 7:-7: 7:-7: 7:-7: %.%.%.% 45.5% 4.9% 66.7% 45.5% 5.%.%.%.%.%.%.%.%.%.%.%.%.%.%.%.%.%.%.%.% 9.% 7.% Please note: The total number of placards may differ from the total number of vehicles due to vehicles having more than one placard. Placards where the class number could not be determined are not included in the Hazard Class total. Commercial Truck Volume - Truck Classification 4 TOTAL by Vehicle Class LIGHT TRUCK HEAVY TRUCK TOTALS A B C E F G H X Single rear-axle Tractor Tractor w. Tractor w. Flatbed w. Tractor w. Tanker only chassis container commodity trailer (any) Construction Other HEAVY vs. ALL % HEAVY AM (7:-:) of 79 4.% M (:-4:) of 4.% PM (4:-7:) of % 7:-7: %.7%.% 7.%.% 5.7%.%.%.6% 45 of % AM (7:-:) of 4 6.% M (:-4:) of 4.% PM (4:-7:) 65 7 of 9.7% 7:-7: %.%.% 7.% 5.%.6%.7%.7% 5.4% of 5 7.9% AM (7:-:) of 4.% M (:-4:) of 4 4.% PM (4:-7:) of % 7:-7: %.5%.% 7.% 4.5% 4.7%.4%.%.6% 447 of 9 4.% Light (A) (B to X) B C E TOTAL by Time of ay F G H % % 4% 6% % % X Creative Transportation Solutions Ltd. Project #6- Commercial Vehicle Screenline Surveys
84 Summary Station Report Station I MONTH/YEAR: February AY OF WEEK: Tuesday 5.5 Comments: st Avenue Vancouver/Burnaby Municipal Boundary Screenline Commercial Truck Volume - Non-angerous and angerous Goods All Trucks (veh./ min.) : : 9: : : : : 4: 5: 6: 7: Time Beginning Non-G G Non-G G Non-G G TOTAL 7: 4 7 7: 4 6 : : : 4 4 9: : : 4 4 : : : : 4 4 : 4 4 : : : : : 4 7 6: 9 6: 7: TOTAL 5 5 (.%) 7 (.%) 79 (.%) 6 angerous Goods Placards - Hazard Classes TOTAL by Hazard Class 7:-7: Class Class Class Class 4 Class 5 Class 6 Class 7 Class Class 9.% 4.% 4.%.%.%.%.%.%.%.% ANGER TOTAL 5 7:-7: 7:-7: 5.%.%.% 6.5%.% 5.%.%.%.%.%.%.%.%.%.%.5%.%.%.%.% Please note: The total number of placards may differ from the total number of vehicles due to vehicles having more than one placard. Placards where the class number could not be determined are not included in the Hazard Class total. Commercial Truck Volume - Truck Classification LIGHT TRUCK HEAVY TRUCK TOTALS A B C E F G H X Single rear-axle Tractor Tractor w. Tractor w. Flatbed w. Tractor w. Tanker only chassis container commodity trailer (any) Construction Other HEAVY vs. ALL % HEAVY AM (7:-:) 6 6 of 46 9.% M (:-4:) of 4.% PM (4:-7:) of % 7:-7: %.7%.%.6%.%.9%.6% 5.5% 6.5% 4 of 55 9.% AM (7:-:) of 9 7.% M (:-4:) 5 of 9 5.4% PM (4:-7:) 44 5 of 49.% 7:-7: %.%.7%.7%.4%.%.% 4.6%.% 4 of.% AM (7:-:) of 5.% M (:-4:) of % PM (4:-7:) of 4 5.% 7:-7: %.5%.7%.6%.4%.5%.4% 5.% 4.% of 6 7.% TOTAL by Vehicle Class Light (A) (B to X) B C E TOTAL by Time of ay F G H % % 4% 6% % % X Creative Transportation Solutions Ltd. Project #6- Commercial Vehicle Screenline Surveys
85 Summary Station Report Station I MONTH/YEAR: February AY OF WEEK: Wednesday 5.6 Comments: Highway 7 Vancouver/Burnaby Municipal Boundary Screenline Commercial Truck Volume - Non-angerous and angerous Goods All Trucks (veh./ min.) : : 9: : : : : 4: 5: 6: 7: Time Beginning Non-G G Non-G G Non-G G TOTAL 7: : : 4 5 : : : : : 4 7 : : : : : : : : : : : : 7 9 7: 5 6 TOTAL (.%) 56 9 (.7%) 5 5 (.5%) angerous Goods Placards - Hazard Classes TOTAL by Hazard Class Class Class Class Class 4 Class 5 Class 6 Class 7 Class Class 9 ANGER TOTAL 7:-7: 5.% 6.7%.%.%.%.%.%.%.%.% 6 7:-7: 5.%.% 5.%.%.%.%.%.%.%.% 7:-7: 6.%.% 6.5%.%.%.%.% 6.%.% 6.% Please note: The total number of placards may differ from the total number of vehicles due to vehicles having more than one placard. Placards where the class number could not be determined are not included in the Hazard Class total. 6 Commercial Truck Volume - Truck Classification LIGHT TRUCK HEAVY TRUCK TOTALS A B C E F G H X Single rear-axle Tractor Tractor w. Tractor w. Flatbed w. Tractor w. Tanker only chassis container commodity trailer (any) Construction Other HEAVY vs. ALL % HEAVY AM (7:-:) of % M (:-4:) of 9 6.% PM (4:-7:) of 5.4% 7:-7: % 6.9%.4%.%.4% 4.%.6%.4% 6.6% 6 of 55 6.% AM (7:-:) of 9.5% M (:-4:) of 7 5.% PM (4:-7:) of 9 4.7% 7:-7: %.%.4%.4% 7.4% 9.%.%.9% 7.% 6 of 55.6% AM (7:-:) of 9 4.9% M (:-4:) of 4.4% PM (4:-7:) of.5% 7:-7: % 4.5%.4%.%.9% 7.%.%.6%.9% 54 of 4.7% TOTAL by Vehicle Class Light (A) (B to X) B C E TOTAL by Time of ay F G H % % 4% 6% % % X Creative Transportation Solutions Ltd. Project #6- Commercial Vehicle Screenline Surveys
86 Summary Station Report Station I MONTH/YEAR: February 5.7 Grandview Highway Vancouver/Burnaby Municipal Boundary Screenline Comments: traffic very slow at 6:. AY OF WEEK: Wednesday Commercial Truck Volume - Non-angerous and angerous Goods All Trucks (veh./ min.) : : 9: : : : : 4: 5: 6: 7: Time Beginning Non-G G Non-G G Non-G G TOTAL 7: : : : 6 6 9: : : : : : : : 45 6 : : : : : : : : : TOTAL (.%) (.%) (.9%) 4 angerous Goods Placards - Hazard Classes TOTAL by Hazard Class Class Class Class Class 4 Class 5 Class 6 Class 7 Class Class 9 ANGER TOTAL 7:-7: 7:-7: 7:-7: 4 4.%.%.%.%.% 7.% 66.7%.% 7.7%.%.%.%.%.%.%.%.%.%.%.%.%.%.%.%.%.%.%.%.%.% Please note: The total number of placards may differ from the total number of vehicles due to vehicles having more than one placard. Placards where the class number could not be determined are not included in the Hazard Class total. Commercial Truck Volume - Truck Classification 6 5 TOTAL by Vehicle Class LIGHT TRUCK HEAVY TRUCK TOTALS A B C E F G H X Single rear-axle Tractor Tractor w. Tractor w. Flatbed w. Tractor w. Tanker only chassis container commodity trailer (any) Construction Other HEAVY vs. ALL % HEAVY AM (7:-:) 5 9 of 79 5.% M (:-4:) of % PM (4:-7:) of 5 9.9% 7:-7: %.7%.5%.9%.6% 6.%.% 5.4%.9% of 5 4.% AM (7:-:) of 99.4% M (:-4:) of 4 45.% PM (4:-7:) of.% 7:-7: %.%.% 5.4% 4.5% 5.4%.% 6.9%.% of 65 5.% AM (7:-:) of 47.7% M (:-4:) of 4 4.5% PM (4:-7:) of 76 4.% 7:-7: %.4%.4% 7.% 4.% 5.7%.6%.9%.5% 54 of 4 4.7% Light (A) (B to X) B C E TOTAL by Time of ay F G H % % 4% 6% % % X Creative Transportation Solutions Ltd. Project #6- Commercial Vehicle Screenline Surveys
87 Summary Station Report Station I MONTH/YEAR: February AY OF WEEK: Wednesday 5.9 Comments: 9th Avenue Vancouver/Burnaby Municipal Boundary Screenline Commercial Truck Volume - Non-angerous and angerous Goods All Trucks (veh./ min.) : : 9: : : : : 4: 5: 6: 7: Time Beginning Non-G G Non-G G Non-G G TOTAL 7: : 9 : : : : : : : 4 4 : : : : : : 4 4: : : 6: : 4 7: TOTAL 9 5 (.7%) 74 5 (.%) 666 (.5%) 676 angerous Goods Placards - Hazard Classes TOTAL by Hazard Class Class Class Class Class 4 Class 5 Class 6 Class 7 Class Class 9 ANGER TOTAL 7:-7: 7:-7: 4.%.% 66.7%.%.%.%.%.% 6.7% 6.7%.%.% 6.%.%.%.%.%.%.%.% :-7:.% 9.% 6.6%.%.%.%.%.% 9.%.% Please note: The total number of placards may differ from the total number of vehicles due to vehicles having more than one placard. Placards where the class number could not be determined are not included in the Hazard Class total. Commercial Truck Volume - Truck Classification LIGHT TRUCK HEAVY TRUCK TOTALS A B C E F G H X Single rear-axle Tractor Tractor w. Tractor w. Flatbed w. Tractor w. Tanker only chassis container commodity trailer (any) Construction Other HEAVY vs. ALL % HEAVY AM (7:-:) of % M (:-4:) of 4.% PM (4:-7:) of 4.% 7:-7: %.7%.7% 7.%.4% 5.7%.% 5.%.4% 65 of % AM (7:-:) of % M (:-4:) of 4 65.% PM (4:-7:) of % 7:-7: %.6%.% 4.%.4% 7.7%.% 6.7%.4% of 79 6.% AM (7:-:) of 6.% M (:-4:) of 4 5.6% PM (4:-7:) of 5 56.% 7:-7: %.6%.4% 5.%.4% 6.%.%.7% 9.% 4 of % TOTAL by Vehicle Class Light (A) (B to X) B C E F G TOTAL by Time of ay % % 4% 6% % % H X Creative Transportation Solutions Ltd. Project #6- Commercial Vehicle Screenline Surveys
88 Summary Station Report Station I MONTH/YEAR: February Kingsway AY OF WEEK: Wednesday 5. Vancouver/Burnaby Municipal Boundary Screenline Comments: Commercial Truck Volume - Non-angerous and angerous Goods All Trucks (veh./ min.) : : 9: : : : : 4: 5: 6: 7: Time Beginning Non-G G Non-G G Non-G G TOTAL 7: : : 9 : : 9 9: : : 7 : 4 6 : : : : : 9 4: 4: 6 5: : : 6: 7 7: TOTAL (.7%) (.%) 54 5 (.9%) 59 angerous Goods Placards - Hazard Classes TOTAL by Hazard Class Class Class Class Class 4 Class 5 Class 6 Class 7 Class Class 9 ANGER TOTAL 7:-7: 7:-7: 7:-7:.%.%.%.%.% 4.%.%.% 6.%.%.%.%.%.%.%.%.%.%.%.%.%.%.%.%.%.%.%.%.%.% Please note: The total number of placards may differ from the total number of vehicles due to vehicles having more than one placard. Placards where the class number could not be determined are not included in the Hazard Class total. Commercial Truck Volume - Truck Classification 5 TOTAL by Vehicle Class LIGHT TRUCK HEAVY TRUCK TOTALS A B C E F G H X Single rear-axle Tractor Tractor w. Tractor w. Flatbed w. Tractor w. Tanker only chassis container commodity trailer (any) Construction Other HEAVY vs. ALL % HEAVY AM (7:-:) of 74.% M (:-4:) of.% PM (4:-7:) of 97 7.% 7:-7: 4 75.%.7%.%.%.% 7.6%.% 6.6% 7.9% 76 of 4 5.% AM (7:-:) of 9.7% M (:-4:) of % PM (4:-7:) of 74.4% 7:-7: %.%.%.9%.%.%.% 7.7% 7.7% 79 of 5.6% AM (7:-:) of 75.4% M (:-4:) of 9 6.9% PM (4:-7:) of 7.% 7:-7: %.9%.%.6%.9%.7%.9% 7.% 7.% 55 of 59.% Light (A) (B to X) TOTAL by Time of ay B E F G H % % 4% 6% % % X Creative Transportation Solutions Ltd. Project #6- Commercial Vehicle Screenline Surveys
89 Summary Station Report Station I MONTH/YEAR: February AY OF WEEK: Thursday 5. Comments: 49th Avenue Vancouver/Burnaby Municipal Boundary Screenline Commercial Truck Volume - Non-angerous and angerous Goods All Trucks (veh./ min.) : : 9: : : : : 4: 5: 6: 7: Time Beginning Non-G G Non-G G Non-G G TOTAL 7: : : : 5 9: : 5 : 5 : : 6 6 : 9 4 : : : 5 6 : : 4: 6 4 5: : 9 9 6: 9 9 6: : TOTAL 47 (.%) 96 (.%) 44 (.%) 44 angerous Goods Placards - Hazard Classes TOTAL by Hazard Class Class Class Class Class 4 Class 5 Class 6 Class 7 Class Class 9 ANGER TOTAL 7:-7: 7:-7: No placards observed. 7:-7: Please note: The total number of placards may differ from the total number of vehicles due to vehicles having more than one placard. Placards where the class number could not be determined are not included in the Hazard Class total. Commercial Truck Volume - Truck Classification LIGHT TRUCK HEAVY TRUCK TOTALS A B C E F G H X Single rear-axle Tractor Tractor w. Tractor w. Flatbed w. Tractor w. Tanker only chassis container commodity trailer (any) Construction Other HEAVY vs. ALL % HEAVY AM (7:-:) 47 7 of 7.9% M (:-4:) 6 4 of 77.% PM (4:-7:) of 4.% 7:-7: %.%.4%.4%.6%.4%.%.7% 4.% 7 of 47.7% AM (7:-:) of 5.% M (:-4:) of 4.9% PM (4:-7:) of 6 4.7% 7:-7: %.5%.%.%.6%.5%.%.% 6.6% 46 of 96.5% AM (7:-:) of 55.% M (:-4:) 97 6 of 9.% PM (4:-7:) of 6 6.% 7:-7: %.%.%.7%.%.5%.%.%.% 7 of % TOTAL by Vehicle Class Light (A) (B to X) B C E F TOTAL by Time of ay % % 4% 6% % % H X Creative Transportation Solutions Ltd. Project #6- Commercial Vehicle Screenline Surveys
90 Summary Station Report Station I MONTH/YEAR: February AY OF WEEK: Thursday 5.6 Comments: Marine Way, west of Boundary Road Vancouver/Burnaby Municipal Boundary Screenline Commercial Truck Volume - Non-angerous and angerous Goods All Trucks (veh./ min.) : : 9: : : : : 4: 5: 6: 7: Time Beginning Non-G G Non-G G Non-G G TOTAL 7: : : 4 5 : : : : 76 5 : : : : : 7 5 : : : 7 5 4: : : : : : TOTAL (.%) (.%) 45 (.4%) 7 angerous Goods Placards - Hazard Classes TOTAL by Hazard Class Class Class Class Class 4 Class 5 Class 6 Class 7 Class Class 9 ANGER TOTAL 7:-7: 6.% 6.% 56.5%.%.%.%.% 4.%.%.% 7:-7: 7:-7: %.% 4.%.6% 6.7% 6.%.%.%.%.%.%.%.%.% 6.7% 5.% 6.7%.6% 4.%.7% Please note: The total number of placards may differ from the total number of vehicles due to vehicles having more than one placard. Placards where the class number could not be determined are not included in the Hazard Class total. 5 9 Commercial Truck Volume - Truck Classification LIGHT TRUCK HEAVY TRUCK TOTALS A B C E F G H X Single rear-axle Tractor Tractor w. Tractor w. Flatbed w. Tractor w. Tanker only chassis container commodity trailer (any) Construction Other HEAVY vs. ALL % HEAVY AM (7:-:) of % M (:-4:) of % PM (4:-7:) of 5.% 7:-7: %.%.5%.%.6%.%.4%.%.% 67 of % AM (7:-:) of 6 4.7% M (:-4:) of % PM (4:-7:) of 4.% 7:-7: %.6%.7%.4%.%.4%.4%.5% 9.% 44 of 4.% AM (7:-:) of 5 5.% M (:-4:) of 4 4.4% PM (4:-7:) of % 7:-7: %.9%.%.9%.%.7%.9%.% 4.% 4 of 7 4.9% TOTAL by Vehicle Class Light (A) (B to X) B C E TOTAL by Time of ay F G H % % 4% 6% % % X Creative Transportation Solutions Ltd. Project #6- Commercial Vehicle Screenline Surveys
91 , British Columbia Ministry of Transportation, TransLink angerous Goods and Truck Classification Survey 7
92 , British Columbia Ministry of Transportation, TransLink Screenline : Mid-Vancouver angerous Goods Summary Screenline / Total Hazard Class Station Screenline escription Placards Class Class Class Class 4 Class 5 Class 6 Class 7 Class Class 9 ANGER Mid-Vancouver Granville Street, north of 4st Avenue. Oak Street, north of 4st Avenue 4. Knight Street, north of 4st Avenue Main Street, north of 4st Avenue 7.5 Boundary Road, north of Kingsway Truck Classification Summary Truck Classification Screenline / Station Screenline escription TOTAL TRUCKS LIGHT TRUCKS HEAVY TRUCKS Tractor Only Tractor with Marine Container Chassis Tractor with Marine Container Flatbed / Commodity Tractor with Trailer Tanker Construction Single Unit / Other Mid-Vancouver Granville Street, north of 4st Avenue Oak Street, north of 4st Avenue Knight Street, north of 4st Avenue Main Street, north of 4st Avenue Boundary Road, north of Kingsway Table 5 Mid Vancouver 74 angerous Goods and Truck Classification Survey
93 Screenline Comments: Mid-Vancouver Summary Screenline Report Commercial Truck Volume - Non-angerous and angerous Goods All Trucks (veh./ min.) : : 9: : : : : 4: 5: 6: 7: Time Beginning Non-G G Non-G G Non-G G TOTAL 7: : : : 9 9: : : : : : : : : : : : 79 5: : 79 6: : : TOTAL 5 9 (.9%) 4 9 (.9%) (.9%) 64 angerous Goods Placards - Hazard Classes TOTAL by Hazard Class Class Class Class Class 4 Class 5 Class 6 Class 7 Class Class 9 ANGER TOTAL 7:-7: 7:-7:.%.% 9.6%.4%.%.%.4% 7.% 7.% 9.6% 4.% 7.4% 7.4%.%.4%.%.%.%.7%.% :-7:.4% 4.%.5%.7%.7%.%.7% 9.% 4.9% 9.9% Please note: The total number of placards may differ from the total number of vehicles due to vehicles having more than one placard. Placards where the class number could not be determined are not included in the Hazard Class total Commercial Truck Volume - Truck Classification LIGHT TRUCK HEAVY TRUCK TOTALS A B C E F G H X Single rear-axle Tractor Tractor w. Tractor w. Flatbed w. Tractor w. Tanker only chassis container commodity trailer (any) Construction Other HEAVY vs. ALL % HEAVY AM (7:-:) of 7 55.% M (:-4:) of 9 54.% PM (4:-7:) of 6 4.9% 7:-7: %.5% 6.%.9%.5%.%.%.% 9.% 757 of 6 5.% AM (7:-:) of 6 6.% M (:-4:) of % PM (4:-7:) of 9 5.7% 7:-7: %.4% 7.7% 4.%.% 9.%.5%.9% 7.6% 77 of % AM (7:-:) of 79 5.% M (:-4:) of 5 54.% PM (4:-7:) of 67 5.% 7:-7: %.4% 7.%.5%.9%.9%.%.9%.4% 464 of % TOTAL by Vehicle Class Light (A) (B to X) B C E F G H TOTAL by Time of ay % % 4% 6% % % X Creative Transportation Solutions Ltd. Project #6- Commercial Vehicle Screenline Surveys
94 Summary Station Report Station I MONTH/YEAR: March. Granville Street, north of 4st Avenue Mid-Vancouver Screenline Comments: Construction work on north side of Granville St. AY OF WEEK: Monday Commercial Truck Volume - Non-angerous and angerous Goods All Trucks (veh./ min.) : : 9: : : : : 4: 5: 6: 7: Time Beginning Non-G G Non-G G Non-G G TOTAL 7: 4 7: : : 9 4 9: : : : : : : : : : : : : : 4 6: 7 6: 4 4 7: TOTAL 57 (.%) 7 (.%) 574 (.%) 574 angerous Goods Placards - Hazard Classes TOTAL by Hazard Class Class Class Class Class 4 Class 5 Class 6 Class 7 Class Class 9 ANGER TOTAL 7:-7: No placards observed. 7:-7: 7:-7: Please note: The total number of placards may differ from the total number of vehicles due to vehicles having more than one placard. Placards where the class number could not be determined are not included in the Hazard Class total. Commercial Truck Volume - Truck Classification LIGHT TRUCK HEAVY TRUCK TOTALS A B C E F G H X Single rear-axle Tractor Tractor w. Tractor w. Flatbed w. Tractor w. Tanker only chassis container commodity trailer (any) Construction Other HEAVY vs. ALL % HEAVY AM (7:-:) of 9.% M (:-4:) of 9 6.7% PM (4:-7:) 5 of 7.5% 7:-7: 4 4.5%.%.4%.%.4%.6%.%.9% 5.4% 45 of % AM (7:-:) 4 6 of 5 7.% M (:-4:) 7 of 4 5.% PM (4:-7:) of 5.% 7:-7: %.%.%.%.%.9%.6%.4% 6.% 64 of 7.% AM (7:-:) 5 5 of.6% M (:-4:) of.% PM (4:-7:) 6 6 of 4 4.9% 7:-7: %.%.%.%.%.%.%.% 5.7% 9 of % TOTAL by Vehicle Class Light (A) (B to X) B C E F G TOTAL by Time of ay % % 4% 6% % % H X Creative Transportation Solutions Ltd. Project #6- Commercial Vehicle Screenline Surveys
95 Summary Station Report Station I MONTH/YEAR: March AY OF WEEK: Friday. Comments: Oak Street, north of 4st Avenue Mid-Vancouver Screenline Commercial Truck Volume - Non-angerous and angerous Goods All Trucks (veh./ min.) : : 9: : : : : 4: 5: 6: 7: Time Beginning Non-G G Non-G G Non-G G TOTAL 7: 5 5 7: : : 9: 5 7 9: : 9 9 : 4 4 : : : : 6 9 : 7 : : 4 4: 7 4 5: 7 4 5: 7 4 6: 6 6 6: 7: 5 6 TOTAL 59 (.%) 54 4 (.5%) 4 7 (.7%) 4 angerous Goods Placards - Hazard Classes TOTAL by Hazard Class Class Class Class Class 4 Class 5 Class 6 Class 7 Class Class 9 ANGER TOTAL 7:-7: 7:-7:.% 4.% 4.%.%.%.%.%.%.%.%.% 4.%.%.%.%.%.%.%.% 4.% :-7:.% 4.%.%.%.%.%.%.%.%.% Please note: The total number of placards may differ from the total number of vehicles due to vehicles having more than one placard. Placards where the class number could not be determined are not included in the Hazard Class total. Commercial Truck Volume - Truck Classification LIGHT TRUCK HEAVY TRUCK TOTALS A B C E F G H X Single rear-axle Tractor Tractor w. Tractor w. Flatbed w. Tractor w. Tanker only chassis container commodity trailer (any) Construction Other HEAVY vs. ALL % HEAVY AM (7:-:) of 54.9% M (:-4:) of 44.% PM (4:-7:) 4 of 4.% 7:-7: %.% 5.7%.4%.%.5%.4%.%.% 9 of % AM (7:-:) of % M (:-4:) of % PM (4:-7:) of 4 6.6% 7:-7: %.%.9%.% 6.%.%.% 9.%.% of 5 5.9% AM (7:-:) of 6 6.% M (:-4:) of % PM (4:-7:) of.4% 7:-7: %.5% 4.%.% 4.%.% 5.%.6%.6% of % TOTAL by Vehicle Class Light (A) (B to X) B C E TOTAL by Time of ay % % 4% 6% % % F G H X Creative Transportation Solutions Ltd. Project #6- Commercial Vehicle Screenline Surveys
96 Station I. Comments: Knight Street, north of 4st Avenue Mid-Vancouver Screenline Summary Station Report -AY AVERAGE Commercial Truck Volume - Non-angerous and angerous Goods All Trucks (veh./ min.) 6 4 7: : 9: : : : : 4: 5: 6: 7: Time Beginning Non-G G Non-G G Non-G G TOTAL 7: : 66 5 : : : : : : 5 6 : 9 9 : 5 96 : : : : : : : : 7 9 6: 69 6: : TOTAL 49 9 (.6%) 47 6 (.%) 4.5 (.%) 95 angerous Goods Placards - Hazard Classes TOTAL by Hazard Class Class Class Class Class 4 Class 5 Class 6 Class 7 Class Class 9 ANGER TOTAL 7:-7: 7:-7: 7:-7: %.%.% 6.7%.5% 9.% 5.6% 4.% 5.% 5.6%.%.5%.%.%.5%.%.%.% 5.%.%.5% 5.6%.% 9.4% 5.6% 6.6% 6.5% 6.% 9.9% 4.% Please note: The total number of placards may differ from the total number of vehicles due to vehicles having more than one placard. Placards where the class number could not be determined are not included in the Hazard Class total Commercial Truck Volume - Truck Classification LIGHT TRUCK HEAVY TRUCK TOTALS A B C E F G H X Single rear-axle Tractor Tractor w. Tractor w. Flatbed w. Tractor w. Tanker only chassis container commodity trailer (any) Construction Other HEAVY vs. ALL % HEAVY AM (7:-:) of 54 6.% M (:-4:) of 59 6.% PM (4:-7:) of 95 5.% 7:-7: %.6%.9%.5%.% 7.%.%.% 7.% 56 of % AM (7:-:) of 4 7.6% M (:-4:) of % PM (4:-7:) of 4 64.% 7:-7: %.6% 4.6% 5.%.7%.%.4%.% 6.% 995 of 4 66.% AM (7:-:) of % M (:-4:) of 64 6.% PM (4:-7:) of % 7:-7: %.6%.%.%.%.%.%.% 6.9% 5 of % TOTAL by Vehicle Class Light (A) (B to X) B C TOTAL by Time of ay E F G H X % % 4% 6% % % Creative Transportation Solutions Ltd. Project #6- Commercial Vehicle Screenline Surveys
97 Summary Station Report Station I MONTH/YEAR: March AY OF WEEK: Monday.4 Comments: Main Street, north of 4st Avenue Mid-Vancouver Screenline Commercial Truck Volume - Non-angerous and angerous Goods All Trucks (veh./ min.) : : 9: : : : : 4: 5: 6: 7: Time Beginning Non-G G Non-G G Non-G G TOTAL 7: 7 5 7: 6 6 : 9 : 6 6 9: : : : 6 6 : : : 7 : : : : 9 9 4: 6 9 5: 4 5: 9 6: 6 4 6: : TOTAL (.9%) 4 (.%) 64 4 (.6%) 6 angerous Goods Placards - Hazard Classes TOTAL by Hazard Class Class Class Class Class 4 Class 5 Class 6 Class 7 Class Class 9 ANGER TOTAL 7:-7:.%.% 4.%.%.%.%.%.%.% 4.% 5 7:-7:.% 5.%.%.%.%.%.%.%.% 5.% 7:-7:.%.6%.6%.%.%.%.%.%.% 4.9% Please note: The total number of placards may differ from the total number of vehicles due to vehicles having more than one placard. Placards where the class number could not be determined are not included in the Hazard Class total. 7 Commercial Truck Volume - Truck Classification LIGHT TRUCK HEAVY TRUCK TOTALS A B C E F G H X Single rear-axle Tractor Tractor w. Tractor w. Flatbed w. Tractor w. Tanker only chassis container commodity trailer (any) Construction Other HEAVY vs. ALL % HEAVY AM (7:-:) of 6.% M (:-4:) of 4 6.7% PM (4:-7:) 4 of % 7:-7: %.%.9%.%.5% 7.7%.5% 4.% 6.% 99 of 6.6% AM (7:-:) of 6.% M (:-4:) of 4 7.% PM (4:-7:) of 49.5% 7:-7: %.%.%.%.% 7.%.%.%.5% 9 of 5 6.% AM (7:-:) of 6.% M (:-4:) of % PM (4:-7:) of 5 5.% 7:-7: %.%.9%.6%.4%.%.4% 5.% 7.% 9 of 6 6.9% TOTAL by Vehicle Class Light (A) (B to X) B C E TOTAL by Time of ay % % 4% 6% % % F G H X Creative Transportation Solutions Ltd. Project #6- Commercial Vehicle Screenline Surveys
98 Summary Station Report Station I MONTH/YEAR: March AY OF WEEK: Monday.5 Comments: Boundary Road, north of Kingsway Mid-Vancouver Screenline Commercial Truck Volume - Non-angerous and angerous Goods All Trucks (veh./ min.) : : 9: : : : : 4: 5: 6: 7: Time Beginning Non-G G Non-G G Non-G G TOTAL 7: : : : : : : : 4 : 5 5 : : : : : : : : : : : : TOTAL 99 4 (.4%) 795 (.%) 75 (.%) 7 angerous Goods Placards - Hazard Classes TOTAL by Hazard Class Class Class Class Class 4 Class 5 Class 6 Class 7 Class Class 9 ANGER TOTAL 7:-7: 7:-7: %.5%.%.%.%.%.%.5%.5% 5.% 4 5.%.%.%.%.%.%.% 6.7%.% 4.7% :-7:.6%.4%.4%.%.%.%.% 4.% 7.%.% Please note: The total number of placards may differ from the total number of vehicles due to vehicles having more than one placard. Placards where the class number could not be determined are not included in the Hazard Class total. 9 Commercial Truck Volume - Truck Classification LIGHT TRUCK HEAVY TRUCK TOTALS A B C E F G H X Single rear-axle Tractor Tractor w. Tractor w. Flatbed w. Tractor w. Tanker only chassis container commodity trailer (any) Construction Other HEAVY vs. ALL % HEAVY AM (7:-:) of 4 5.4% M (:-4:) of 5.6% PM (4:-7:) of % 7:-7: %.%.6%.% 4.6% 9.7%.% 6.4% 6.% 5 of 4 5.6% AM (7:-:) of 54 5.% M (:-4:) of % PM (4:-7:) of % 7:-7: %.4%.% 7.%.6%.%.5%.6%.5% 76 of 46.% AM (7:-:) of % M (:-4:) of 69 5.% PM (4:-7:) of % 7:-7: %.%.4% 9.9%.%.%.7%.%.7% 94 of 7 5.6% TOTAL by Vehicle Class Light (A) (B to X) B C E TOTAL by Time of ay F G H % % 4% 6% % % X Creative Transportation Solutions Ltd. Project #6- Commercial Vehicle Screenline Surveys
99 , British Columbia Ministry of Transportation, TransLink angerous Goods and Truck Classification Survey
100 , British Columbia Ministry of Transportation, TransLink Screenline 6: UBC West of Blanca angerous Goods Summary Screenline / Total Hazard Class Station Screenline escription Placards Class Class Class Class 4 Class 5 Class 6 Class 7 Class Class 9 ANGER 6 UBC West of Blanca University Boulevard W. 6th Avenue Southwest Marine rive Truck Classification Summary Truck Classification Screenline / Station Screenline escription TOTAL TRUCKS LIGHT TRUCKS HEAVY TRUCKS Tractor Only Tractor with Marine Container Chassis Tractor with Marine Container Flatbed / Commodity Tractor with Trailer Tanker Construction Single Unit / Other 6 UBC West of Blanca University Boulevard W. 6th Avenue Southwest Marine rive Table 6 West of Blanca angerous Goods and Truck Classification Survey
101 Screenline 6 Comments: UBC West of Blanca Summary Screenline Report Commercial Truck Volume - Non-angerous and angerous Goods All Trucks (veh./ min.) : : 9: : : : : 4: 5: 6: 7: Time Beginning Non-G G Non-G G Non-G G TOTAL 7: : 5 6 : 6 9 : : : : : : : : : : 4 4 : : 5 9 4: : 6 7 5: 7 9 6: : 5 6 7: 4 4 TOTAL (.4%) 5 6 (.7%) 64 6 (.4%) 657 angerous Goods Placards - Hazard Classes TOTAL by Hazard Class 7:-7: Class Class Class Class 4 Class 5 Class 6 Class 7 Class Class 9 ANGER 4.% 57.%.6%.%.%.%.%.%.% 4.% TOTAL 4 7:-7: 5.% 55.6%.%.%.%.%.%.%.%.% :-7:.% 56.5% 6.%.%.%.%.%.%.% 7.4% Please note: The total number of placards may differ from the total number of vehicles due to vehicles having more than one placard. Placards where the class number could not be determined are not included in the Hazard Class total. Commercial Truck Volume - Truck Classification LIGHT TRUCK HEAVY TRUCK TOTALS A B C E F G H X Single rear-axle Tractor Tractor w. Tractor w. Flatbed w. Tractor w. Tanker only chassis container commodity trailer (any) Construction Other HEAVY vs. ALL % HEAVY AM (7:-:) of 9 45.% M (:-4:) of 45.5% PM (4:-7:) of.% 7:-7: %.7%.%.%.%.%.%.% 5.% of 9 4.6% AM (7:-:) 7 55 of 66.% M (:-4:) 55 of 4.5% PM (4:-7:) 4 9 of 5.% 7:-7: %.%.6%.%.9%.%.6%.6%.4% 9 of % AM (7:-:) of % M (:-4:) of % PM (4:-7:) of.% 7:-7: %.%.5%.%.7%.9%.5%.%.% 5 of 657.% TOTAL by Vehicle Class Light (A) (B to X) FG B C E TOTAL by Time of ay % % 4% 6% % % H X Creative Transportation Solutions Ltd. Project #6- Commercial Vehicle Screenline Surveys
102 Summary Station Report Station I MONTH/YEAR: March AY OF WEEK: Wednesday 6. Comments: University Boulevard UBC West of Blanca Screenline Commercial Truck Volume - Non-angerous and angerous Goods All Trucks (veh./ min.) : : 9: : : : : 4: 5: 6: 7: Time Beginning Non-G G Non-G G Non-G G TOTAL 7: 7: : : : 5 9: 7 : : : 7 : 7 : : : : : : 6 5: 5 5 5: : 6: 7: TOTAL 4 (7.%) 7 (.%) 7 (.%) angerous Goods Placards - Hazard Classes TOTAL by Hazard Class Class Class Class Class 4 Class 5 Class 6 Class 7 Class Class 9 ANGER TOTAL 7:-7: 7:-7: 7:-7:.%.%.% 5.%.% 5.% 5.%.% 5.%.%.%.%.%.%.%.%.%.%.%.%.%.%.%.%.%.%.%.%.%.% Please note: The total number of placards may differ from the total number of vehicles due to vehicles having more than one placard. Placards where the class number could not be determined are not included in the Hazard Class total. Commercial Truck Volume - Truck Classification 4 4 TOTAL by Vehicle Class LIGHT TRUCK HEAVY TRUCK TOTALS A B C E F G H X Single rear-axle Tractor Tractor w. Tractor w. Flatbed w. Tractor w. Tanker only chassis container commodity trailer (any) Construction Other HEAVY vs. ALL % HEAVY AM (7:-:) 4 of 5 6.7% M (:-4:) 9 of 9.% PM (4:-7:) 9 of 9.% 7:-7: 9 9.7%.%.%.%.%.%.%.% 7.% 4 of 4 9.% AM (7:-:) 7 6 of.% M (:-4:) 6 of 9 7.7% PM (4:-7:) 4 of 5 6.7% 7:-7: 77.5%.%.%.%.%.%.%.4%.% of 7.5% AM (7:-:) 5 of 4.% M (:-4:) 45 of 4 6.% PM (4:-7:) of 4.9% 7:-7: %.%.5%.%.%.5%.%.%.% 4 of.% Light (A) (B to X) C E F G H TOTAL by Time of ay % % 4% 6% % % X Creative Transportation Solutions Ltd. Project #6- Commercial Vehicle Screenline Surveys
103 Summary Station Report Station I MONTH/YEAR: March AY OF WEEK: Wednesday 6.4 Comments: W. 6th Avenue UBC West of Blanca Screenline Commercial Truck Volume - Non-angerous and angerous Goods All Trucks (veh./ min.) : : 9: : : : : 4: 5: 6: 7: Time Beginning Non-G G Non-G G Non-G G TOTAL 7: : : 4 4 : 6 9: : 4 4 : : 6 7 : : 5 : 5 7 : : : : : 4 4 5: 5: 6: 6: 7: 4 4 TOTAL 6 (.6%) 7 (.4%) (.5%) angerous Goods Placards - Hazard Classes TOTAL by Hazard Class Class Class Class Class 4 Class 5 Class 6 Class 7 Class Class 9 ANGER TOTAL 7:-7: 7:-7: 7:-7:.%.%.% 5.% 5.% 5.%.%.%.%.%.%.%.%.%.%.%.%.%.%.%.%.%.%.%.%.%.% 5.% 5.% 5.% Please note: The total number of placards may differ from the total number of vehicles due to vehicles having more than one placard. Placards where the class number could not be determined are not included in the Hazard Class total. Commercial Truck Volume - Truck Classification 4 TOTAL by Vehicle Class LIGHT TRUCK HEAVY TRUCK TOTALS A B C E F G H X Single rear-axle Tractor Tractor w. Tractor w. Flatbed w. Tractor w. Tanker only chassis container commodity trailer (any) Construction Other HEAVY vs. ALL % HEAVY AM (7:-:) 7 6 of 46.% M (:-4:) 6 of 5 4.% PM (4:-7:) 4 of 4.6% 7:-7: %.6%.6%.% 6.5%.%.% 6.% 9.7% of 6 5.5% AM (7:-:) 4 7 of 5.% M (:-4:) 4 of 4 5.% PM (4:-7:) of 4.7% 7:-7: %.%.%.%.%.%.%.5%.5% 4 of 7.% AM (7:-:) of 4.% M (:-4:) of 69 4.% PM (4:-7:) of 6 4.6% 7:-7: %.%.%.% 4.5%.%.% 9.5% 9.% 46 of 4.6% Light (A) (B to X) B C TOTAL by Time of ay % % 4% 6% % % E G H X Creative Transportation Solutions Ltd. Project #6- Commercial Vehicle Screenline Surveys
104 Summary Station Report Station I MONTH/YEAR: March AY OF WEEK: Wednesday 6.5 Comments: Southwest Marine rive UBC West of Blanca Screenline Commercial Truck Volume - Non-angerous and angerous Goods All Trucks (veh./ min.) : : 9: : : : : 4: 5: 6: 7: Time Beginning Non-G G Non-G G Non-G G TOTAL 7: : 6 6 : : 9 9: 9 9: 4 5 : : : 7 9 : 9 9 : : 5 : : : 7 7 4: 5 5 5: 9 5: 7 9 6: 6: 5 5 7: TOTAL 7 6 (.%) 96 5 (.5%) (.%) 94 angerous Goods Placards - Hazard Classes TOTAL by Hazard Class Class Class Class Class 4 Class 5 Class 6 Class 7 Class Class 9 ANGER TOTAL 7:-7: 5.% 6.5% 5.%.%.%.%.%.%.%.5% 7:-7: 7:-7: %.% 57.% 6.%.6% 6.7%.%.%.%.%.%.%.%.%.%.%.%.% 4.%.% Please note: The total number of placards may differ from the total number of vehicles due to vehicles having more than one placard. Placards where the class number could not be determined are not included in the Hazard Class total. 7 5 Commercial Truck Volume - Truck Classification LIGHT TRUCK HEAVY TRUCK TOTALS A B C E F G H X Single rear-axle Tractor Tractor w. Tractor w. Flatbed w. Tractor w. Tanker only chassis container commodity trailer (any) Construction Other HEAVY vs. ALL % HEAVY AM (7:-:) 6 5 of % M (:-4:) of % PM (4:-7:) 6 9 of 49.% 7:-7: %.5%.%.%.%.6%.5%.%.7% 95 of 9 49.% AM (7:-:) of.9% M (:-4:) 6 4 of 7 57.% PM (4:-7:) 7 4 of 56.5% 7:-7: %.%.%.%.5%.5%.5% 7.4% 6.4% 95 of 47.% AM (7:-:) of 7 4.% M (:-4:) of % PM (4:-7:) 4 9 of % 7:-7: %.%.%.%.%.%.5% 7.7% 7.5% 9 of 94 4.% TOTAL by Vehicle Class Light (A) (B to X) E F G TOTAL by Time of ay % % 4% 6% % % B H X Creative Transportation Solutions Ltd. Project #6- Commercial Vehicle Screenline Surveys

105 , British Columbia Ministry of Transportation, TransLink RICHMON & ELTA SCREENLINES VANCOUVER INT L AIRPORT RICHMON ELTA angerous Goods and Truck Classification Survey 7
106 , British Columbia Ministry of Transportation, TransLink Screenline 6: Richmond / Vancouver angerous Goods Summary Screenline / Total Hazard Class Station Screenline escription Placards Class Class Class Class 4 Class 5 Class 6 Class 7 Class Class 9 ANGER 6 Richmond / Vancouver Arthur Laing Bridge Oak Street Bridge Knight Street Bridge Queensborough Bridge Truck Classification Summary Truck Classification Screenline / Station Screenline escription TOTAL TRUCKS LIGHT TRUCKS HEAVY TRUCKS Tractor Only Tractor with Marine Container Chassis Tractor with Marine Container Flatbed / Commodity Tractor with Trailer Tanker Construction Single Unit / Other 6 Richmond / Vancouver Arthur Laing Bridge Oak Street Bridge Knight Street Bridge Queensborough Bridge Table 7 Richmond / Vancouver angerous Goods and Truck Classification Survey
107 Screenline 6 Comments: Richmond / Vancouver Summary Screenline Report Commercial Truck Volume - Non-angerous and angerous Goods All Trucks (veh./ min.) : : 9: : : : : 4: 5: 6: 7: Time Beginning Non-G G Non-G G Non-G G TOTAL 7: : : : : : : : : : : : : : : : : : : : : TOTAL 77 (.4%) (.%) (.4%) 5967 angerous Goods Placards - Hazard Classes TOTAL by Hazard Class Class Class Class Class 4 Class 5 Class 6 Class 7 Class Class 9 ANGER TOTAL 7:-7: % 9.% 7.9%.4%.%.%.4%.5%.%.6% 4 7:-7: 7:-7: %.%.5%.% 7.4% 7.%.4%.4%.%.%.%.%.4%.4% 5.% 7.%.6%.%.%.5% Please note: The total number of placards may differ from the total number of vehicles due to vehicles having more than one placard. Placards where the class number could not be determined are not included in the Hazard Class total Commercial Truck Volume - Truck Classification LIGHT TRUCK HEAVY TRUCK TOTALS A B C E F G H X Single rear-axle Tractor Tractor w. Tractor w. Flatbed w. Tractor w. Tanker only chassis container commodity trailer (any) Construction Other HEAVY vs. ALL % HEAVY AM (7:-:) of 56 5.% M (:-4:) of 6 6.5% PM (4:-7:) of 49.4% 7:-7: %.%.5%.%.4%.7%.%.6%.5% 455 of % AM (7:-:) of 6.6% M (:-4:) of 99 5.% PM (4:-7:) of % 7:-7: %.6% 4.% 9.6%.%.%.4%.%.% 474 of % AM (7:-:) of % M (:-4:) of % PM (4:-7:) of % 7:-7: %.4%.%.9%.%.%.4%.%.% 759 of % TOTAL by Vehicle Class Light (A) (B to X) B C E TOTAL by Time of ay F G H % % 4% 6% % % X Creative Transportation Solutions Ltd. Project #6- Commercial Vehicle Screenline Surveys
108 Summary Station Report Station I MONTH/YEAR: March 6. Arthur Laing Bridge Richmond / Vancouver Screenline Comments: Access to or from No. Road in Richmond was temporarity blocked by construction. AY OF WEEK: Thursday Commercial Truck Volume - Non-angerous and angerous Goods All Trucks (veh./ min.) : : 9: : : : : 4: 5: 6: 7: Time Beginning Non-G G Non-G G Non-G G TOTAL 7: : : : : : : : 4 4 : : 4 7 : : : : : : : : : : : 4 7 TOTAL 69 9 (.%) 69 (.%) (.%) 54 angerous Goods Placards - Hazard Classes TOTAL by Hazard Class Class Class Class Class 4 Class 5 Class 6 Class 7 Class Class 9 ANGER TOTAL 7:-7: 4 5.% 4.% 5.%.%.%.%.%.%.%.% 7:-7: 7.%.% 77.%.%.%.%.%.%.%.% 9 5 7:-7:.% 6.% 6.%.%.%.%.% 5.%.% 5.% Please note: The total number of placards may differ from the total number of vehicles due to vehicles having more than one placard. Placards where the class number could not be determined are not included in the Hazard Class total. 9 Commercial Truck Volume - Truck Classification LIGHT TRUCK HEAVY TRUCK TOTALS A B C E F G H X Single rear-axle Tractor Tractor w. Tractor w. Flatbed w. Tractor w. Tanker only chassis container commodity trailer (any) Construction Other HEAVY vs. ALL % HEAVY AM (7:-:) of % M (:-4:) of 7.4% PM (4:-7:) of.4% 7:-7: %.%.%.%.9%.%.5%.% 4.% 5 of 7 7.% AM (7:-:) of 5 4.% M (:-4:) of 75.9% PM (4:-7:) 49 5 of % 7:-7: %.7%.%.%.7%.%.7% 5.5% 4.% of 76 7.% AM (7:-:) of 6 7.6% M (:-4:) of 46.6% PM (4:-7:) of 6.% 7:-7: %.%.%.%.%.4%.% 6.9% 4.% 7 of 54 7.% TOTAL by Vehicle Class Light (A) (B to X) B C E F TOTAL by Time of ay % % 4% 6% % % G H X Creative Transportation Solutions Ltd. Project #6- Commercial Vehicle Screenline Surveys
109 Summary Station Report Station I MONTH/YEAR: March AY OF WEEK: Thursday 6. Comments: Oak Street Bridge Richmond / Vancouver Screenline Commercial Truck Volume - Non-angerous and angerous Goods All Trucks (veh./ min.) : : 9: : : : : 4: 5: 6: 7: Time Beginning Non-G G Non-G G Non-G G TOTAL 7: 59 7: : : : 7 4 9: 7 4 : : 5 6 : 6 5 : 59 6 : : 67 5 : 44 : : : 4 6 5: : : : 7: TOTAL 965 (.%) 946 (.%) 9 (.%) 9 angerous Goods Placards - Hazard Classes TOTAL by Hazard Class 7:-7: 7:-7: Class Class Class Class 4 Class % 4.% 7.5%.%.%.%.% 6.%.%.5%.% 6.5%.%.%.%.%.%.%.% 5.4% Class 6 Class 7 Class Class 9 ANGER TOTAL :-7:.% 5.7%.%.%.%.%.%.4%.%.% Please note: The total number of placards may differ from the total number of vehicles due to vehicles having more than one placard. Placards where the class number could not be determined are not included in the Hazard Class total. 9 Commercial Truck Volume - Truck Classification LIGHT TRUCK HEAVY TRUCK TOTALS A B C E F G H X Single rear-axle Tractor Tractor w. Tractor w. Flatbed w. Tractor w. Tanker only chassis container commodity trailer (any) Construction Other HEAVY vs. ALL % HEAVY AM (7:-:) of % M (:-4:) of % PM (4:-7:) 7 5 of 7 4.5% 7:-7: %.4%.%.%.% 9.%.%.7%.% 5 of % AM (7:-:) of % M (:-4:) of % PM (4:-7:) of 9 49.% 7:-7: %.%.4%.%.4% 6.4%.% 7.%.6% 5 of % AM (7:-:) of % M (:-4:) of % PM (4:-7:) of % 7:-7: %.9%.4%.5%.% 7.9%.7%.%.% of 9 5.% TOTAL by Vehicle Class Light (A) (B to X) B C E F G TOTAL by Time of ay % % 4% 6% % % H X Creative Transportation Solutions Ltd. Project #6- Commercial Vehicle Screenline Surveys
110 Station I 6. Comments: Knight Street Bridge Richmond / Vancouver Screenline Summary Station Report -AY AVERAGE Commercial Truck Volume - Non-angerous and angerous Goods All Trucks (veh./ min.) : : 9: : : : : 4: 5: 6: 7: Time Beginning Non-G G Non-G G Non-G G TOTAL 7: : : : : : 95 5 : : : : : : : : : : : : : : : TOTAL 4 (.%) 9 5 (.%) (.%) 6496 angerous Goods Placards - Hazard Classes TOTAL by Hazard Class Class Class Class Class 4 Class 5 Class 6 Class 7 Class Class 9 ANGER TOTAL 7:-7: 9.%.5% 5.%.%.%.%.%.6%.6%.% 7 7:-7: 7:-7: %.%.4% 4.5% 9.5% 45.%.%.%.%.%.%.%.%.% 4.%.4%.%.9%.%.% Please note: The total number of placards may differ from the total number of vehicles due to vehicles having more than one placard. Placards where the class number could not be determined are not included in the Hazard Class total Commercial Truck Volume - Truck Classification LIGHT TRUCK HEAVY TRUCK TOTALS A B C E F G H X Single rear-axle Tractor Tractor w. Tractor w. Flatbed w. Tractor w. Tanker only chassis container commodity trailer (any) Construction Other HEAVY vs. ALL % HEAVY AM (7:-:) of 59.5% M (:-4:) of 6 64.% PM (4:-7:) of % 7:-7: %.%.%.4%.% 7.5%.% 9.%.% 947 of 6.4% AM (7:-:) of 64.9% M (:-4:) of 7 59.% PM (4:-7:) of 99 5.% 7:-7: %.% 7.% 9.7%.%.4%.% 4.%.% 99 of % AM (7:-:) of 7 6.9% M (:-4:) of % PM (4:-7:) of 5 5.6% 7:-7: %.6% 5.6%.5%.%.%.% 7.%.9% 76 of % TOTAL by Vehicle Class Light (A) (B to X) B C E F G H TOTAL by Time of ay % % 4% 6% % % X Creative Transportation Solutions Ltd. Project #6- Commercial Vehicle Screenline Surveys
111 Station I 6.4 Comments: Queensborough Bridge Richmond / Vancouver Screenline Summary Station Report -AY AVERAGE Commercial Truck Volume - Non-angerous and angerous Goods All Trucks (veh./ min.) : : 9: : : : : 4: 5: 6: 7: Time Beginning Non-G G Non-G G Non-G G TOTAL 7: : : : : : : : : : : : : : : : : : : : : TOTAL (.9%) (.%) 54 (.9%) 5956 angerous Goods Placards - Hazard Classes TOTAL by Hazard Class Class Class Class Class 4 Class 5 Class 6 Class 7 Class Class 9 ANGER TOTAL 7:-7: 4 4.6% 9.9% 9.9%.7%.%.%.%.4%.6% 6.% 79 7:-7: 7:-7: %.4%.5%.%.%.6%.%.%.%.%.%.%.%.% 6.%.%.%.% 6.% 5.9% Please note: The total number of placards may differ from the total number of vehicles due to vehicles having more than one placard. Placards where the class number could not be determined are not included in the Hazard Class total. 6 4 Commercial Truck Volume - Truck Classification LIGHT TRUCK HEAVY TRUCK TOTALS A B C E F G H X Single rear-axle Tractor Tractor w. Tractor w. Flatbed w. Tractor w. Tanker only chassis container commodity trailer (any) Construction Other HEAVY vs. ALL % HEAVY AM (7:-:) of % M (:-4:) of % PM (4:-7:) of % 7:-7: % 5.5%.4% 9.% 4.5% 9.%.% 7.4%.% 9 of % AM (7:-:) of 6 6.% M (:-4:) of 7 6.% PM (4:-7:) of % 7:-7: % 5.4%.5% 4.% 4.5% 5.7%.4% 7.%.% 65 of 67 6.% AM (7:-:) of % M (:-4:) of 4 6.% PM (4:-7:) of % 7:-7: % 5.5%.5%.6% 4.5% 7.6%.% 7.5% 9.7% 54 of % TOTAL by Vehicle Class Light (A) (B to X) B C E TOTAL by Time of ay F G H X % % 4% 6% % % Creative Transportation Solutions Ltd. Project #6- Commercial Vehicle Screenline Surveys
112 , British Columbia Ministry of Transportation, TransLink Screenline 7: Middle Arm angerous Goods Summary Screenline / Total Hazard Class Station Screenline escription Placards Class Class Class Class 4 Class 5 Class 6 Class 7 Class Class 9 ANGER 7 Middle Arm insmore Bridge 7. Airport Connector / Moray Bridge No. Road Bridge 9 5 Truck Classification Summary Truck Classification Screenline / Station Screenline escription TOTAL TRUCKS LIGHT TRUCKS HEAVY TRUCKS Tractor Only Tractor with Marine Container Chassis Tractor with Marine Container Flatbed / Commodity Tractor with Trailer Tanker Construction Single Unit / Other 7 Middle Arm insmore Bridge Airport Connector / Moray Bridge No. Road Bridge Table Middle Arm 94 angerous Goods and Truck Classification Survey
113 Screenline 7 Comments: Middle Arm Summary Screenline Report Commercial Truck Volume - Non-angerous and angerous Goods All Trucks (veh./ min.) : : 9: : : : : 4: 5: 6: 7: Time Beginning Non-G G Non-G G Non-G G TOTAL 7: : : 5 5 : : : : : : : : : 5 5 : : : : : : : : : TOTAL 5 4 (.%) 6 (.%) 7 (.%) 9 angerous Goods Placards - Hazard Classes TOTAL by Hazard Class Class Class Class Class 4 Class 5 Class 6 Class 7 Class Class 9 ANGER TOTAL 7:-7: 7:-7: 7:-7: %.%.% 6.7%.5% 4.6% 7.6% 5.%.7%.%.%.%.%.%.%.%.%.%.%.%.%.%.%.%.%.%.% 4.%.5%.7% 4 4 Please note: The total number of placards may differ from the total number of vehicles due to vehicles having more than one placard. Placards where the class number could not be determined are not included in the Hazard Class total. Commercial Truck Volume - Truck Classification TOTAL by Vehicle Class LIGHT TRUCK HEAVY TRUCK TOTALS A B C E F G H X Single rear-axle Tractor Tractor w. Tractor w. Flatbed w. Tractor w. Tanker only chassis container commodity trailer (any) Construction Other HEAVY vs. ALL % HEAVY AM (7:-:) of % M (:-4:) of % PM (4:-7:) of 5.9% 7:-7: %.%.%.7%.4% 9.%.%.% 5.9% 445 of 9 7.% AM (7:-:) of % M (:-4:) of % PM (4:-7:) of 67.% 7:-7: %.7%.7%.7%.% 6.6%.5%.% 6.% 4 of 4.% AM (7:-:) of % M (:-4:) of 9 4.% PM (4:-7:) of % 7:-7: %.%.4%.%.%.%.6%.% 6.% 55 of 9 5.7% Light (A) (B to X) B C E TOTAL by Time of ay % % 4% 6% % % F G H X Creative Transportation Solutions Ltd. Project #6- Commercial Vehicle Screenline Surveys
114 Summary Station Report Station I MONTH/YEAR: May AY OF WEEK: Tuesday 7. Comments: insmore Bridge Middle Arm Screenline Commercial Truck Volume - Non-angerous and angerous Goods All Trucks (veh./ min.) : : 9: : : : : 4: 5: 6: 7: Time Beginning Non-G G Non-G G Non-G G TOTAL 7: : : : : 5 9: 6 6 : 4 7 : : : 7 5 : 5 6 : 4 7 : : 4: : 5: 5: 6 4 6: 9 6: : TOTAL (.%) 59 (.6%) 79 (.7%) angerous Goods Placards - Hazard Classes TOTAL by Hazard Class Class Class Class Class 4 Class 5 Class 6 Class 7 Class Class 9 ANGER TOTAL 7:-7: 7:-7: 7:-7:.%.%.%.%.%.%.%.%.%.%.%.%.%.%.%.%.%.%.%.%.%.%.%.%.%.%.%.%.%.% Please note: The total number of placards may differ from the total number of vehicles due to vehicles having more than one placard. Placards where the class number could not be determined are not included in the Hazard Class total. Commercial Truck Volume - Truck Classification TOTAL by Vehicle Class LIGHT TRUCK HEAVY TRUCK TOTALS A B C E F G H X Single rear-axle Tractor Tractor w. Tractor w. Flatbed w. Tractor w. Tanker only chassis container commodity trailer (any) Construction Other HEAVY vs. ALL % HEAVY AM (7:-:) of 4.6% M (:-4:) 4 4 of.5% PM (4:-7:) of 49 4.% 7:-7: %.7%.%.%.% 4.%.%.% 5.% of 4.9% AM (7:-:) 47 6 of 5.% M (:-4:) of % PM (4:-7:) 4 5 of 5.9% 7:-7: %.%.%.%.%.%.9%.6% 5.% 5 of 6 5.6% AM (7:-:) 74 7 of 7 4.9% M (:-4:) 79 of 9 4.% PM (4:-7:) of 6.7% 7:-7: %.5%.4%.7%.4%.9%.4%.7% 5.% 4 of 5.% Light (A) (B to X) B C E TOTAL by Time of ay F G H % % 4% 6% % % X Creative Transportation Solutions Ltd. Project #6- Commercial Vehicle Screenline Surveys
115 Summary Station Report Station I MONTH/YEAR: April AY OF WEEK: Wednesday 7. Comments: Airport Connector / Moray Bridge Middle Arm Screenline Commercial Truck Volume - Non-angerous and angerous Goods All Trucks (veh./ min.) : : 9: : : : : 4: 5: 6: 7: Time Beginning Non-G G Non-G G Non-G G TOTAL 7: : 4 7 : : : : : : : : 45 6 : : 64 6 : : : : : : : : : TOTAL 7 5 (4.%) 5 6 (4.%) 64 7 (4.%) 7 angerous Goods Placards - Hazard Classes TOTAL by Hazard Class Class Class Class Class 4 Class 5 Class 6 Class 7 Class Class 9 ANGER TOTAL 7:-7: 7:-7: 7:-7: 5 65.%.%.% 5.7%.% 7.% 94.%.9% 9.5%.%.%.%.%.%.%.%.%.%.%.%.%.%.%.%.%.%.%.%.%.4% Please note: The total number of placards may differ from the total number of vehicles due to vehicles having more than one placard. Placards where the class number could not be determined are not included in the Hazard Class total. Commercial Truck Volume - Truck Classification TOTAL by Vehicle Class LIGHT TRUCK HEAVY TRUCK TOTALS A B C E F G H X Single rear-axle Tractor Tractor w. Tractor w. Flatbed w. Tractor w. Tanker only chassis container commodity trailer (any) Construction Other HEAVY vs. ALL % HEAVY AM (7:-:) of.% M (:-4:) of 9 4.% PM (4:-7:) of 5 7.5% 7:-7: % 4.6%.%.5%.9% 7.4%.% 4.% 5.6% of 4.% AM (7:-:) of 47.6% M (:-4:) of 4 5.% PM (4:-7:) of % 7:-7: %.%.%.%.%.%.% 7.% 5.4% 74 of 9 4.% AM (7:-:) of % M (:-4:) of % PM (4:-7:) of 55.4% 7:-7: %.%.5%.7%.9% 9.%.% 5.7% 5.5% 75 of 7 4.% Light (A) (B to X) B C E TOTAL by Time of ay % % 4% 6% % % F G H X Creative Transportation Solutions Ltd. Project #6- Commercial Vehicle Screenline Surveys
116 Summary Station Report Station I MONTH/YEAR: May AY OF WEEK: Tuesday 7. Comments: No. Road Bridge Middle Arm Screenline Commercial Truck Volume - Non-angerous and angerous Goods All Trucks (veh./ min.) : : 9: : : : : 4: 5: 6: 7: Time Beginning Non-G G Non-G G Non-G G TOTAL 7: 5 7 7: : 5 5 : 5 7 9: 4 9: 5 7 : 6 4 : 5 5 : 4 7 : : : : : : 9 9 4: : 9 5: 5 5 6: 9 9 6: : TOTAL 5 (.6%) 5 (.9%) 4 5 (.%) 45 angerous Goods Placards - Hazard Classes TOTAL by Hazard Class Class Class Class Class 4 Class 5 Class 6 Class 7 Class Class 9 ANGER TOTAL 7:-7:.% 6.%.%.%.%.%.%.%.%.% 5 7:-7:.% 5.% 5.%.%.%.%.%.%.% 5.% 4 5 7:-7:.% 55.6%.%.%.%.%.%.%.%.% Please note: The total number of placards may differ from the total number of vehicles due to vehicles having more than one placard. Placards where the class number could not be determined are not included in the Hazard Class total. 9 Commercial Truck Volume - Truck Classification LIGHT TRUCK HEAVY TRUCK TOTALS A B C E F G H X Single rear-axle Tractor Tractor w. Tractor w. Flatbed w. Tractor w. Tanker only chassis container commodity trailer (any) Construction Other HEAVY vs. ALL % HEAVY AM (7:-:) of 5 4.6% M (:-4:) of 74.% PM (4:-7:) 5 6 of 6 6.% 7:-7: %.%.%.%.7% 7.4%.6%.7%.5% 5 of.% AM (7:-:) of 7.5% M (:-4:) 55 5 of.7% PM (4:-7:) 5 4 of 6 5.9% 7:-7: %.5%.%.5%.9% 5.5%.9% 7.4% 9.% 54 of 7 4.9% AM (7:-:) of 7.6% M (:-4:) of 57.% PM (4:-7:) of 5 6.% 7:-7: %.7%.%.7%.% 6.4%.% 5.%.9% 7 of % TOTAL by Vehicle Class Light (A) (B to X) TOTAL by Time of ay B E F G H % % 4% 6% % % X Creative Transportation Solutions Ltd. Project #6- Commercial Vehicle Screenline Surveys
117 , British Columbia Ministry of Transportation, TransLink angerous Goods and Truck Classification Survey 99
118 , British Columbia Ministry of Transportation, TransLink Screenline : Mid-Richmond angerous Goods Summary Screenline / Total Hazard Class Station Screenline escription Placards Class Class Class Class 4 Class 5 Class 6 Class 7 Class Class 9 ANGER Mid-Richmond Highway Westminster Highway 5 Truck Classification Summary Truck Classification Screenline / Station Screenline escription TOTAL TRUCKS LIGHT TRUCKS HEAVY TRUCKS Tractor Only Tractor with Marine Container Chassis Tractor with Marine Container Flatbed / Commodity Tractor with Trailer Tanker Construction Single Unit / Other Mid-Richmond Highway Westminster Highway Table 9 Richmond angerous Goods and Truck Classification Survey
119 Screenline Comments: Richmond Summary Screenline Report Commercial Truck Volume - Non-angerous and angerous Goods All Trucks (veh./ min.) : : 9: : : : : 4: 5: 6: 7: Time Beginning Non-G G Non-G G Non-G G TOTAL 7: : : : : : : : : : : : : : : : : : : : : 96 4 TOTAL 7 (.%) (.%) 75 6 (.%) 767 angerous Goods Placards - Hazard Classes TOTAL by Hazard Class Class Class Class Class 4 Class 5 Class 6 Class 7 Class Class 9 ANGER TOTAL 7:-7: 7:-7: 7:-7: %.%.%.% 6.6% 4.9% 5.% 54.% 5.%.6%.%.%.%.6%.9%.6%.%.%.%.%.%.7% 4.% 6.%.6%.%.9% 4.%.%.5% Please note: The total number of placards may differ from the total number of vehicles due to vehicles having more than one placard. Placards where the class number could not be determined are not included in the Hazard Class total Commercial Truck Volume - Truck Classification LIGHT TRUCK HEAVY TRUCK TOTALS A B C E F G H X Single rear-axle Tractor Tractor w. Tractor w. Flatbed w. Tractor w. Tanker only chassis container commodity trailer (any) Construction Other HEAVY vs. ALL % HEAVY AM (7:-:) of 6.% M (:-4:) of 5 6.% PM (4:-7:) of 6 6.5% 7:-7: % 7.5%.% 9.5%.%.%.%.4%.% of 79 6.% AM (7:-:) of % M (:-4:) of % PM (4:-7:) of 96 6.% 7:-7: % 6.5%.%.% 5.%.4%.% 7.6% 7.7% 54 of 64.5% AM (7:-:) of % M (:-4:) of % PM (4:-7:) of 46 6.% 7:-7: % 7.%.6%.%.6% 9.9%.%.% 9.% 44 of % TOTAL by Vehicle Class Light (A) (B to X) B C E TOTAL by Time of ay F G H X % % 4% 6% % % Creative Transportation Solutions Ltd. Project #6- Commercial Vehicle Screenline Surveys
120 Station I. Comments: Highway 9 Richmond Screenline Summary Station Report -AY AVERAGE Commercial Truck Volume - Non-angerous and angerous Goods All Trucks (veh./ min.) : : 9: : : : : 4: 5: 6: 7: Time Beginning Non-G G Non-G G Non-G G TOTAL 7: : : : : : : : : : : : : : : : : : : : : TOTAL 7 (.%) (.6%) (.%) 49 angerous Goods Placards - Hazard Classes TOTAL by Hazard Class Class Class Class Class 4 Class 5 Class 6 Class 7 Class Class 9 ANGER TOTAL 7:-7: 7:-7: 7:-7: %.%.%.%.9%.% 5.% 5.% 54.7%.6%.%.%.%.7%.%.6%.%.%.%.%.% 9.6% 4.9% 7.%.%.7%.% 4.7%.5%.7% Please note: The total number of placards may differ from the total number of vehicles due to vehicles having more than one placard. Placards where the class number could not be determined are not included in the Hazard Class total Commercial Truck Volume - Truck Classification LIGHT TRUCK HEAVY TRUCK TOTALS A B C E F G H X Single rear-axle Tractor Tractor w. Tractor w. Flatbed w. Tractor w. Tanker only chassis container commodity trailer (any) Construction Other HEAVY vs. ALL % HEAVY AM (7:-:) of 7 6.9% M (:-4:) of % PM (4:-7:) of 7 55.% 7:-7: % 5.4%.4% 7.%.6%.6%.% 7.7%.% 54 of % AM (7:-:) of % M (:-4:) of 7 6.% PM (4:-7:) of 6 56.% 7:-7: % 5.%.%.% 6.4%.%.9% 7.% 6.9% 5 of % AM (7:-:) of 6 6.6% M (:-4:) of % PM (4:-7:) of % 7:-7: % 5.%.%.7% 4.% 9.4%.9% 7.4%.% 75 of % TOTAL by Vehicle Class Light (A) (B to X) B C E TOTAL by Time of ay F G H X % % 4% 6% % % Creative Transportation Solutions Ltd. Project #6- Commercial Vehicle Screenline Surveys
121 Station I. Comments: Westminster Highway Richmond Screenline Summary Station Report -AY AVERAGE Commercial Truck Volume - Non-angerous and angerous Goods All Trucks (veh./ min.) : : 9: : : : : 4: 5: 6: 7: Time Beginning Non-G G Non-G G Non-G G TOTAL 7: : : : : : : : 69 6 : : : : : : : : : : : : : TOTAL 94 9 (.6%) 5 (.%) 7 (.%) 745 angerous Goods Placards - Hazard Classes TOTAL by Hazard Class Class Class Class Class 4 Class 5 Class 6 Class 7 Class Class 9 ANGER TOTAL 7:-7: 4.% 4.% 46.7%.%.%.%.%.%.% 5.% 9 7:-7: 7 7.% 4.5% 9.%.%.%.%.%.%.% 5.% 7 7:-7:.% 4.% 4.%.%.%.%.%.% 4.5%.% Please note: The total number of placards may differ from the total number of vehicles due to vehicles having more than one placard. Placards where the class number could not be determined are not included in the Hazard Class total. 5 Commercial Truck Volume - Truck Classification LIGHT TRUCK HEAVY TRUCK TOTALS A B C E F G H X Single rear-axle Tractor Tractor w. Tractor w. Flatbed w. Tractor w. Tanker only chassis container commodity trailer (any) Construction Other HEAVY vs. ALL % HEAVY AM (7:-:) of % M (:-4:) of 5 7.7% PM (4:-7:) of 45 6.% 7:-7: %.%.6%.%.9% 7.9%.% 9.5% 9.4% 967 of 4 6.% AM (7:-:) of 5 7.4% M (:-4:) of % PM (4:-7:) of % 7:-7: % 9.%.% 5.%.%.%.%.6% 9.% 9 of 4 7.% AM (7:-:) of % M (:-4:) of 7.% PM (4:-7:) of 9 7.% 7:-7: %.%.% 4.6%.6%.7%.% 9.% 9.% 95 of % TOTAL by Vehicle Class Light (A) (B to X) B C E TOTAL by Time of ay F G H X % % 4% 6% % % Creative Transportation Solutions Ltd. Project #6- Commercial Vehicle Screenline Surveys
122 , British Columbia Ministry of Transportation, TransLink Screenline 9: Richmond / Vancouver / elta angerous Goods Summary Screenline / Total Hazard Class Station Screenline escription Placards Class Class Class Class 4 Class 5 Class 6 Class 7 Class Class 9 ANGER 9 Richmond / Vancouver / elta George Massey Tunnel Alex Fraser Bridge Truck Classification Summary Truck Classification Screenline / Station Screenline escription TOTAL TRUCKS LIGHT TRUCKS HEAVY TRUCKS Tractor Only Tractor with Marine Container Chassis Tractor with Marine Container Flatbed / Commodity Tractor with Trailer Tanker Construction Single Unit / Other 9 Richmond / Vancouver / elta George Massey Tunnel Alex Fraser Bridge Table Richmond / Vancouver / elta 4 angerous Goods and Truck Classification Survey
123 Screenline 9 Comments: Richmond / Vancouver / elta Summary Screenline Report Commercial Truck Volume - Non-angerous and angerous Goods All Trucks (veh./ min.) : : 9: : : : : 4: 5: 6: 7: Time Beginning Non-G G Non-G G Non-G G TOTAL 7: : : : : : : : : : : : : : : : : : : : : TOTAL 5975 (.6%) 564 (.5%) 66 (.6%) angerous Goods Placards - Hazard Classes TOTAL by Hazard Class Class Class Class Class 4 Class 5 Class 6 Class 7 Class Class 9 ANGER TOTAL :-7:.% 7.% 6.5%.%.7%.4%.%.%.9% 9.5% 7:-7: 7:-7: %.% 6.7%.5% 6.% 6.4%.5%.%.%.9%.%.%.%.%.6% 9.%.9%.4% 6.%.% Please note: The total number of placards may differ from the total number of vehicles due to vehicles having more than one placard. Placards where the class number could not be determined are not included in the Hazard Class total Commercial Truck Volume - Truck Classification LIGHT TRUCK HEAVY TRUCK TOTALS A B C E F G H X Single rear-axle Tractor Tractor w. Tractor w. Flatbed w. Tractor w. Tanker only chassis container commodity trailer (any) Construction Other HEAVY vs. ALL % HEAVY AM (7:-:) of % M (:-4:) of % PM (4:-7:) of % 7:-7: % 5.% 4.%.7% 5.%.%.%.%.7% 46 of % AM (7:-:) of % M (:-4:) of 9 66.% PM (4:-7:) of % 7:-7: % 6.%.%.%.6% 6.%.4%.9%.9% 79 of % AM (7:-:) of % M (:-4:) of % PM (4:-7:) of 6.% 7:-7: % 5.5%.%.% 4.5% 7.5%.6%.5%.% 75 of 66.5% TOTAL by Vehicle Class Light (A) (B to X) B C E TOTAL by Time of ay F G H X % % 4% 6% % % Creative Transportation Solutions Ltd. Project #6- Commercial Vehicle Screenline Surveys
124 Station I 9. Comments: George Massey Tunnel Richmond / Vancouver / elta Screenline Summary Station Report -AY AVERAGE Commercial Truck Volume - Non-angerous and angerous Goods All Trucks (veh./ min.) : : 9: : : : : 4: 5: 6: 7: Time Beginning Non-G G Non-G G Non-G G TOTAL 7: 5 7 7: 4 99 : : : : : : : : 67 7 : 4 77 : 7 7 : 5 4 : : : : : : : 7 7: 57 TOTAL 559 (.%) 74 5 (.%) 599 (.%) 57 angerous Goods Placards - Hazard Classes TOTAL by Hazard Class Class Class Class Class 4 Class 5 Class 6 Class 7 Class Class 9 ANGER TOTAL 9 7:-7:.%.%.%.%.%.%.%.%.%.% 7:-7:.% 69.% 7.7%.%.%.%.% 5.4% 7.7%.% :-7:.% 65.% 7.9%.%.%.%.%.% 5.%.% Please note: The total number of placards may differ from the total number of vehicles due to vehicles having more than one placard. Placards where the class number could not be determined are not included in the Hazard Class total. Commercial Truck Volume - Truck Classification LIGHT TRUCK HEAVY TRUCK TOTALS A B C E F G H X Single rear-axle Tractor Tractor w. Tractor w. Flatbed w. Tractor w. Tanker only chassis container commodity trailer (any) Construction Other HEAVY vs. ALL % HEAVY AM (7:-:) of 6 7.% M (:-4:) of % PM (4:-7:) of % 7:-7: %.7% 5.% 6.% 4.6%.%.%.%.% 6 of % AM (7:-:) of % M (:-4:) of % PM (4:-7:) of % 7:-7: %.%.6% 7.9% 4.4%.%.5%.7%.9% of % AM (7:-:) of % M (:-4:) of 75.4% PM (4:-7:) of % 7:-7: %.9% 4.7% 7.% 4.5%.%.%.4%.7% 9 of % TOTAL by Vehicle Class Light (A) (B to X) B C E F G H TOTAL by Time of ay % % 4% 6% % % X Creative Transportation Solutions Ltd. Project #6- Commercial Vehicle Screenline Surveys
125 Station I 9. Comments: Alex Fraser Bridge Richmond / Vancouver / elta Screenline Summary Station Report -AY AVERAGE Commercial Truck Volume - Non-angerous and angerous Goods All Trucks (veh./ min.) : : 9: : : : : 4: 5: 6: 7: Time Beginning Non-G G Non-G G Non-G G TOTAL 7: : : : : : : : : : : : : : : : : : : : : TOTAL (.%) 9 (.%) (.%) 6497 angerous Goods Placards - Hazard Classes TOTAL by Hazard Class Class Class Class Class 4 Class 5 Class 6 Class 7 Class Class 9 ANGER TOTAL 7:-7: % 7.% 7.%.%.7%.4%.%.6%.%.% 7:-7: 7:-7: %.% 6.%.%.% 7.4%.5%.%.%.9%.%.%.%.% 7.%.%.%.% 7.%.7% Please note: The total number of placards may differ from the total number of vehicles due to vehicles having more than one placard. Placards where the class number could not be determined are not included in the Hazard Class total Commercial Truck Volume - Truck Classification LIGHT TRUCK HEAVY TRUCK TOTALS A B C E F G H X Single rear-axle Tractor Tractor w. Tractor w. Flatbed w. Tractor w. Tanker only chassis container commodity trailer (any) Construction Other HEAVY vs. ALL % HEAVY AM (7:-:) of 64.9% M (:-4:) of 6.% PM (4:-7:) of 9 6.% 7:-7: % 6.7%.%.7% 5.7%.%.7% 4.%.% 99 of 5 6.6% AM (7:-:) of 6 5.% M (:-4:) of 57.% PM (4:-7:) of 9 6.7% 7:-7: %.%.% 6.9%.9%.%.%.6%.% 75 of % AM (7:-:) of 4 6.% M (:-4:) of 59.% PM (4:-7:) of 6.4% 7:-7: % 7.6%.% 7.9% 4.4%.7%.%.9%.% 95 of % TOTAL by Vehicle Class Light (A) (B to X) B C E TOTAL by Time of ay F G H X % % 4% 6% % % Creative Transportation Solutions Ltd. Project #6- Commercial Vehicle Screenline Surveys
126 , British Columbia Ministry of Transportation, TransLink Screenline : elta (west of Highway 9) angerous Goods Summary Screenline / Total Hazard Class Station Screenline escription Placards Class Class Class Class 4 Class 5 Class 6 Class 7 Class Class 9 ANGER elta (west of Highway 9) River Road, west of Nordel Way Ladner Trunk / Highway 6 5. Highway 99 9 Truck Classification Summary Truck Classification Screenline / Station Screenline escription TOTAL TRUCKS LIGHT TRUCKS HEAVY TRUCKS Tractor Only Tractor with Marine Container Chassis Tractor with Marine Container Flatbed / Commodity Tractor with Trailer Tanker Construction Single Unit / Other elta (west of Highway 9) River Road, west of Nordel Way Ladner Trunk / Highway Highway Table elta (w of Hwy 9) angerous Goods and Truck Classification Survey
127 Screenline Comments: elta (west of Highway 9) Summary Screenline Report Commercial Truck Volume - Non-angerous and angerous Goods All Trucks (veh./ min.) : : 9: : : : : 4: 5: 6: 7: Time Beginning Non-G G Non-G G Non-G G TOTAL 7: 6 5 7: : : : : : : : : : : : : : : : : : : : TOTAL (.%) 47 (.4%) 6 9 (.%) 697 angerous Goods Placards - Hazard Classes TOTAL by Hazard Class Class Class Class Class 4 Class 5 Class 6 Class 7 Class Class 9 ANGER TOTAL 7:-7: 4 4.%.%.7%.%.%.%.%.4%.% 7.% 44 7:-7: 7:-7: %.5% 5.% 7.9% 6.%.%.9%.5%.9%.5%.%.%.%.5% 7.% 5.9%.6%.5% 6.7% 7.% Please note: The total number of placards may differ from the total number of vehicles due to vehicles having more than one placard. Placards where the class number could not be determined are not included in the Hazard Class total Commercial Truck Volume - Truck Classification LIGHT TRUCK HEAVY TRUCK TOTALS A B C E F G H X Single rear-axle Tractor Tractor w. Tractor w. Flatbed w. Tractor w. Tanker only chassis container commodity trailer (any) Construction Other HEAVY vs. ALL % HEAVY AM (7:-:) of % M (:-4:) of % PM (4:-7:) of % 7:-7: % 6.%.7% 7.% 5.6%.%.%.6% 9.9% 76 of % AM (7:-:) of 47 7.% M (:-4:) of % PM (4:-7:) of % 7:-7: % 5.5% 4.9% 7.% 5.9%.5%.9%.%.% of % AM (7:-:) of % M (:-4:) of % PM (4:-7:) of % 7:-7: % 5.% 6.9% 7.4% 5.%.%.9%.%.% 547 of % TOTAL by Vehicle Class Light (A) (B to X) B C E TOTAL by Time of ay F G H X % % 4% 6% % % Creative Transportation Solutions Ltd. Project #6- Commercial Vehicle Screenline Surveys
128 Station I. Comments: River Road, west of Nordel Way elta (west of Highway 9) Screenline Summary Station Report -AY AVERAGE Commercial Truck Volume - Non-angerous and angerous Goods All Trucks (veh./ min.) : : 9: : : : : 4: 5: 6: 7: Time Beginning Non-G G Non-G G Non-G G TOTAL 7: : : : 9 7 9: : : : : : : 4 5 : 5 : : : : : : : : : TOTAL 4 (.6%) 4 (.%) (.%) 4 angerous Goods Placards - Hazard Classes TOTAL by Hazard Class Class Class Class Class 4 Class 5 Class 6 Class 7 Class Class 9 ANGER TOTAL 7:-7: 7:-7: 4.% 6.% 9.7%.%.6%.%.%.9%.6%.6% 5 6.% 4.5% 7.7%.%.%.%.% 9.6%.%.% :-7:.6%.% 4.%.6%.%.%.6% 7.%.9%.4% Please note: The total number of placards may differ from the total number of vehicles due to vehicles having more than one placard. Placards where the class number could not be determined are not included in the Hazard Class total Commercial Truck Volume - Truck Classification LIGHT TRUCK HEAVY TRUCK TOTALS A B C E F G H X Single rear-axle Tractor Tractor w. Tractor w. Flatbed w. Tractor w. Tanker only chassis container commodity trailer (any) Construction Other HEAVY vs. ALL % HEAVY AM (7:-:) of % M (:-4:) of 76 7.% PM (4:-7:) of 6 76.% 7:-7: % 9.%.5% 6.9% 4.6% 5.4%.%.% 7.9% 57 of % AM (7:-:) of % M (:-4:) of % PM (4:-7:) of 5 7.4% 7:-7: % 7.6% 6.5%.% 4.% 5.%.5%.7%.6% 4 of 5 7.% AM (7:-:) of % M (:-4:) of % PM (4:-7:) of 75.% 7:-7: %.4% 9.%.5% 4.4% 5.%.% 9.%.% 54 of 4 74.% TOTAL by Vehicle Class Light (A) (B to X) B C E TOTAL by Time of ay F G H X % % 4% 6% % % Creative Transportation Solutions Ltd. Project #6- Commercial Vehicle Screenline Surveys
129 Summary Station Report Station I MONTH/YEAR: March AY OF WEEK: Wednesday. Comments: Ladner Trunk / Highway elta (west of Highway 9) Screenline Commercial Truck Volume - Non-angerous and angerous Goods All Trucks (veh./ min.) : : 9: : : : : 4: 5: 6: 7: Time Beginning Non-G G Non-G G Non-G G TOTAL 7: : 5 5 : 9 4 : : : : : 4 7 : : : : 9 : : 4 4: : : 4 4 5: : : : 6 6 TOTAL 6 (.%) 66 (.%) 79 6 (.%) 75 angerous Goods Placards - Hazard Classes TOTAL by Hazard Class Class Class Class Class 4 Class 5 Class 6 Class 7 Class Class 9 ANGER TOTAL 7:-7: 7:-7: 7:-7: 5.%.%.%.%.% 6.7%.% 66.7%.%.%.%.%.%.%.%.%.%.%.%.%.%.%.%.%.%.%.%.%.%.% Please note: The total number of placards may differ from the total number of vehicles due to vehicles having more than one placard. Placards where the class number could not be determined are not included in the Hazard Class total. Commercial Truck Volume - Truck Classification 6 TOTAL by Vehicle Class LIGHT TRUCK HEAVY TRUCK TOTALS A B C E F G H X Single rear-axle Tractor Tractor w. Tractor w. Flatbed w. Tractor w. Tanker only chassis container commodity trailer (any) Construction Other HEAVY vs. ALL % HEAVY AM (7:-:) of 5 5.6% M (:-4:) of 6 6.% PM (4:-7:) of 5 6.% 7:-7: %.6% 6.% 7.4% 4.6% 9.6%.5% 5.%.5% 6 of % AM (7:-:) of 5 5.% M (:-4:) 4 4 of 67.% PM (4:-7:) of % 7:-7: %.6%.5% 9.%.4%.7%.6%.%.% 9 of % AM (7:-:) of 7 5.% M (:-4:) of 4 65.% PM (4:-7:) of % 7:-7: %.6%.7%.% 6.5%.%.%.7%.% 45 of % Light (A) (B to X) B C E TOTAL by Time of ay F G H % % 4% 6% % % X Creative Transportation Solutions Ltd. Project #6- Commercial Vehicle Screenline Surveys
130 Summary Station Report Station I MONTH/YEAR: March AY OF WEEK: Monday. Comments: Highway 99 elta (west of Highway 9) Screenline Commercial Truck Volume - Non-angerous and angerous Goods All Trucks (veh./ min.) : : 9: : : : : 4: 5: 6: 7: Time Beginning Non-G G Non-G G Non-G G TOTAL 7: : 45 6 : 45 4 : : : 5 4 : : 65 7 : : : 4 6 : 4 7 : : : : 7 5: : : : : TOTAL 5 (.4%) 65 9 (.7%) 5 (.6%) 7 angerous Goods Placards - Hazard Classes TOTAL by Hazard Class Class Class Class Class 4 Class 5 Class 6 Class 7 Class Class 9 ANGER TOTAL 7:-7: 7:-7: 7:-7: 6 9.%.%.%.% 5.%.%.% 75.%.%.%.%.%.%.%.%.%.%.%.%.%.%.%.%.%.%.%.%.%.%.% Please note: The total number of placards may differ from the total number of vehicles due to vehicles having more than one placard. Placards where the class number could not be determined are not included in the Hazard Class total. Commercial Truck Volume - Truck Classification TOTAL by Vehicle Class LIGHT TRUCK HEAVY TRUCK TOTALS A B C E F G H X Single rear-axle Tractor Tractor w. Tractor w. Flatbed w. Tractor w. Tanker only chassis container commodity trailer (any) Construction Other HEAVY vs. ALL % HEAVY AM (7:-:) of % M (:-4:) of 5 6.% PM (4:-7:) of 7.6% 7:-7: %.%.9% 5.6% 9.%.6%.% 5.9%.4% 69 of 5 7.6% AM (7:-:) of 5.% M (:-4:) of 4 66.% PM (4:-7:) of % 7:-7: %.4% 4.7%.% 7.5%.5%.4%.%.6% 949 of % AM (7:-:) of % M (:-4:) of 7 66.% PM (4:-7:) of 6 77.% 7:-7: %.% 4.%.4%.%.5%.% 4.%.9% 56 of 7 7.7% Light (A) (B to X) B C E TOTAL by Time of ay F G H % % 4% 6% % % X Creative Transportation Solutions Ltd. Project #6- Commercial Vehicle Screenline Surveys

131 , British Columbia Ministry of Transportation, TransLink COQUITLAM SCREENLINES PORT COQUITLAM COQUITLAM PITT MEAOWS SURREY angerous Goods and Truck Classification Survey
132 , British Columbia Ministry of Transportation, TransLink Screenline : Surrey / New Westminster / Coquitlam angerous Goods Summary Screenline / Total Hazard Class Station Screenline escription Placards Class Class Class Class 4 Class 5 Class 6 Class 7 Class Class 9 ANGER Surrey / New Westminster / Coquitlam Pattullo Bridge Port Mann Bridge Truck Classification Summary Truck Classification Screenline / Station Screenline escription TOTAL TRUCKS LIGHT TRUCKS HEAVY TRUCKS Tractor Only Tractor with Marine Container Chassis Tractor with Marine Container Flatbed / Commodity Tractor with Trailer Tanker Construction Single Unit / Other Surrey / New Westminster / Coquitlam Pattullo Bridge Port Mann Bridge Table Surrey / New West / Coquitlam 4 angerous Goods and Truck Classification Survey
133 Screenline Comments: Summary Screenline Report Surrey / New Westminster / Coquitlam Commercial Truck Volume - Non-angerous and angerous Goods All Trucks (veh./ min.) : : 9: : : : : 4: 5: 6: 7: Time Beginning Non-G G Non-G G Non-G G TOTAL 7: : : : : : : : : : : : : : : : : : : : : TOTAL 564 (.%) 44 4 (.%) 74 7 (.6%) 44 angerous Goods Placards - Hazard Classes TOTAL by Hazard Class Class Class Class Class 4 Class 5 Class 6 Class 7 Class Class 9 ANGER TOTAL 7:-7: 7:-7: 7:-7: %.%.%.6%.% 9.% 66.5% 5.9% 6.%.%.%.%.4%.%.%.%.%.%.4%.%.%.% 7.% 7.6%.%.5%.%.% 7.7% 9.% Please note: The total number of placards may differ from the total number of vehicles due to vehicles having more than one placard. Placards where the class number could not be determined are not included in the Hazard Class total Commercial Truck Volume - Truck Classification LIGHT TRUCK HEAVY TRUCK TOTALS A B C E F G H X Single rear-axle Tractor Tractor w. Tractor w. Flatbed w. Tractor w. Tanker only chassis container commodity trailer (any) Construction Other HEAVY vs. ALL % HEAVY AM (7:-:) of 6 6.9% M (:-4:) of % PM (4:-7:) of % 7:-7: % 4.9% 4.5%.% 5.% 4.%.% 9.5%.% 69 of % AM (7:-:) of % M (:-4:) of % PM (4:-7:) of 57.9% 7:-7: % 4.6%.%.7% 4.% 6.%.4%.6%.9% 76 of % AM (7:-:) of % M (:-4:) of % PM (4:-7:) of 9 6.% 7:-7: % 4.%.5%.9% 5.% 4.9%.% 9.%.% 645 of % TOTAL by Vehicle Class Light (A) (B to X) B C E F TOTAL by Time of ay G H X % % 4% 6% % % Creative Transportation Solutions Ltd. Project #6- Commercial Vehicle Screenline Surveys
134 Station I. Comments: Pattullo Bridge Surrey / New Westminster / Coquitlam Screenline Summary Station Report -AY AVERAGE Commercial Truck Volume - Non-angerous and angerous Goods All Trucks (veh./ min.) : : 9: : : : : 4: 5: 6: 7: Time Beginning Non-G G Non-G G Non-G G TOTAL 7: : : : 4 9: : : : 4 : : : : : : : : : : : : : TOTAL (.%) 77 (.%) (.%) 64 angerous Goods Placards - Hazard Classes TOTAL by Hazard Class Class Class Class Class 4 Class 5 Class 6 Class 7 Class Class 9 ANGER TOTAL 7:-7: 7:-7:.% 6.7% 7.%.%.%.%.%.%.9% 5.9% 7 4.% 7.5% 5.%.%.%.%.%.9%.% 5.6% :-7:.%.5% 59.%.%.%.%.%.5%.4%.4% Please note: The total number of placards may differ from the total number of vehicles due to vehicles having more than one placard. Placards where the class number could not be determined are not included in the Hazard Class total. 4 Commercial Truck Volume - Truck Classification LIGHT TRUCK HEAVY TRUCK TOTALS A B C E F G H X Single rear-axle Tractor Tractor w. Tractor w. Flatbed w. Tractor w. Tanker only chassis container commodity trailer (any) Construction Other HEAVY vs. ALL % HEAVY AM (7:-:) of 7 6.9% M (:-4:) of % PM (4:-7:) of 6.% 7:-7: % 4.7% 4.% 6.% 4.9% 9.%.4%.5%.7% of % AM (7:-:) of % M (:-4:) of % PM (4:-7:) of % 7:-7: % 5.%.5% 5.% 4.9%.4%.%.7% 9.% 4 of % AM (7:-:) of 6 6.% M (:-4:) of 9 7.% PM (4:-7:) of 7 6.% 7:-7: % 5.% 6.5% 5.9% 4.9% 9.%.%.%.% 4 of % TOTAL by Vehicle Class Light (A) (B to X) B C E TOTAL by Time of ay F G H X % % 4% 6% % % Creative Transportation Solutions Ltd. Project #6- Commercial Vehicle Screenline Surveys
135 Station I. Comments: Port Mann Bridge Surrey / New Westminster / Coquitlam Screenline Summary Station Report -AY AVERAGE Commercial Truck Volume - Non-angerous and angerous Goods All Trucks (veh./ min.) : : 9: : : : : 4: 5: 6: 7: Time Beginning Non-G G Non-G G Non-G G TOTAL 7: : : : : : : : : : : : : : : : : : : : : TOTAL 7 6 (.7%) 76 7 (4.%) (.%) 69 angerous Goods Placards - Hazard Classes TOTAL by Hazard Class Class Class Class Class 4 Class 5 Class 6 Class 7 Class Class 9 ANGER TOTAL 7:-7: 7:-7: 7:-7: %.%.%.%.%.% 65.9% 6.4% 6.7%.%.%.%.5%.%.4%.%.%.%.4%.4%.4% 9.4% 7.7%.5%.4%.4%.%.7% 6.%.7% Please note: The total number of placards may differ from the total number of vehicles due to vehicles having more than one placard. Placards where the class number could not be determined are not included in the Hazard Class total Commercial Truck Volume - Truck Classification LIGHT TRUCK HEAVY TRUCK TOTALS A B C E F G H X Single rear-axle Tractor Tractor w. Tractor w. Flatbed w. Tractor w. Tanker only chassis container commodity trailer (any) Construction Other HEAVY vs. ALL % HEAVY AM (7:-:) of 7 6.5% M (:-4:) of % PM (4:-7:) of 6.7% 7:-7: % 4.5%.6% 9.% 6.% 5.6%.5%.%.5% 466 of % AM (7:-:) of % M (:-4:) of 46 6.% PM (4:-7:) of % 7:-7: % 4.6%.%.%.% 9.5%.9% 7.%.9% 76 of 5.9% AM (7:-:) of % M (:-4:) of 6 6.4% PM (4:-7:) of 59.9% 7:-7: % 4.5%.%.6% 5.% 7.%.7% 7.6%.% 44 of % TOTAL by Vehicle Class Light (A) (B to X) B C E TOTAL by Time of ay F G H X % % 4% 6% % % Creative Transportation Solutions Ltd. Project #6- Commercial Vehicle Screenline Surveys
136 , British Columbia Ministry of Transportation, TransLink Screenline : Burnaby/Coquitlam Municipal Boundary (west of North Road) angerous Goods Summary Screenline / Total Hazard Class Station Screenline escription Placards Class Class Class Class 4 Class 5 Class 6 Class 7 Class Class 9 ANGER Burnaby/Coquitlam Municipal Boundary Highway 7a Highway Highway North Road 5 4. Brunette Avenue, south of Highway Truck Classification Summary Truck Classification Screenline / Station Screenline escription TOTAL TRUCKS LIGHT TRUCKS HEAVY TRUCKS Tractor Only Tractor with Marine Container Chassis Tractor with Marine Container Flatbed / Commodity Tractor with Trailer Tanker Construction Single Unit / Other Burnaby/Coquitlam Municipal Boundary Highway 7a Highway Highway North Road Brunette Avenue, south of Highway Table Burnaby / Coquitlam Boundary angerous Goods and Truck Classification Survey
137 Screenline Comments: Summary Screenline Report Burnaby/Coquitlam Municipal Boundary (west of North Road) Commercial Truck Volume - Non-angerous and angerous Goods All Trucks (veh./ min.) : : 9: : : : : 4: 5: 6: 7: Time Beginning Non-G G Non-G G Non-G G TOTAL 7: : : : : : : : : : : : : : : : : : : : : TOTAL (.%) 65 7 (.9%) (.9%) 7 angerous Goods Placards - Hazard Classes TOTAL by Hazard Class Class Class Class Class 4 Class 5 Class 6 Class 7 Class Class 9 ANGER TOTAL 7:-7: 7:-7: 7:-7: %.5%.% 7.6% 6.5% 7.% 6.4% 65.% 6.5%.6%.%.4%.6%.%.5%.%.%.%.6%.%.4% 6.9% 7.% 7.%.%.%.%.4% 9.7%.% Please note: The total number of placards may differ from the total number of vehicles due to vehicles having more than one placard. Placards where the class number could not be determined are not included in the Hazard Class total Commercial Truck Volume - Truck Classification LIGHT TRUCK HEAVY TRUCK TOTALS A B C E F G H X Single rear-axle Tractor Tractor w. Tractor w. Flatbed w. Tractor w. Tanker only chassis container commodity trailer (any) Construction Other HEAVY vs. ALL % HEAVY AM (7:-:) of 4 6.% M (:-4:) of 4 6.% PM (4:-7:) of 6 56.% 7:-7: % 4.%.%.7%.% 4.5%.% 7.%.5% 469 of % AM (7:-:) of 59.5% M (:-4:) of % PM (4:-7:) of 55.% 7:-7: % 4.%.%.4%.7% 5.%.9% 9.%.% 757 of 6 6.% AM (7:-:) of % M (:-4:) of % PM (4:-7:) of % 7:-7: % 4.%.5%.9%.4% 4.9%.%.4%.% 65 of 7 6.% TOTAL by Vehicle Class Light (A) (B to X) B C E TOTAL by Time of ay F G H X % % 4% 6% % % Creative Transportation Solutions Ltd. Project #6- Commercial Vehicle Screenline Surveys
138 Summary Station Report Station I MONTH/YEAR: March AY OF WEEK: Thursday. Comments: Highway 7a Burnaby/Coquitlam Municipal Boundary (west of North Road) Screenline Commercial Truck Volume - Non-angerous and angerous Goods All Trucks (veh./ min.) : : 9: : : : : 4: 5: 6: 7: Time Beginning Non-G G Non-G G Non-G G TOTAL 7: 4 7: 4 9 : 5 6 : 5 9: 6 9: : : : 9 4 : 9 : 7 6 : 5 6 : 4 : 4 4 4: 4: 5 5: : : 6 7 6: 7: TOTAL 9 (.5%) 6 (.%) 9 9 (.7%) angerous Goods Placards - Hazard Classes TOTAL by Hazard Class Class Class Class Class 4 Class 5 Class 6 Class 7 Class Class 9 ANGER TOTAL 7:-7:.%.% 66.7%.%.%.%.%.%.%.% 7:-7: 4 6.7%.% 66.7%.%.%.%.% 6.7%.%.% 6 6 7:-7:.%.% 66.7%.%.%.%.%.%.%.% Please note: The total number of placards may differ from the total number of vehicles due to vehicles having more than one placard. Placards where the class number could not be determined are not included in the Hazard Class total. 9 Commercial Truck Volume - Truck Classification LIGHT TRUCK HEAVY TRUCK TOTALS A B C E F G H X Single rear-axle Tractor Tractor w. Tractor w. Flatbed w. Tractor w. Tanker only chassis container commodity trailer (any) Construction Other HEAVY vs. ALL % HEAVY AM (7:-:) of 9.% M (:-4:) 7 of 6 5.6% PM (4:-7:) 4 4 of 6.5% 7:-7: %.%.%.% 5.7%.6% 5.7% 9.5% 7.4% 6 of 5.6% AM (7:-:) of 96.5% M (:-4:) of % PM (4:-7:) of 6.% 7:-7: %.5%.5%.%.9%.% 5.6%.6% 5.% 9 of 6 4.7% AM (7:-:) of 4.7% M (:-4:) of 9 5.% PM (4:-7:) of % 7:-7: %.%.6%.%.%.% 5.6% 5.7% 5.9% 5 of 45.% TOTAL by Vehicle Class Light (A) (B to X) B C E F G TOTAL by Time of ay % % 4% 6% % % H X Creative Transportation Solutions Ltd. Project #6- Commercial Vehicle Screenline Surveys
139 Summary Station Report Station I MONTH/YEAR: March AY OF WEEK: Tuesday.4 Comments: Highway 7 Burnaby/Coquitlam Municipal Boundary (west of North Road) Screenline Commercial Truck Volume - Non-angerous and angerous Goods All Trucks (veh./ min.) : : 9: : : : : 4: 5: 6: 7: Time Beginning Non-G G Non-G G Non-G G TOTAL 7: 5 7 7: : : : : : : : 4 4 : 5 5 : : : : 9 4: : : 5 5: 5 6 6: : 7: 4 4 TOTAL 49 (.7%) 4 (.%) 5 (.%) 46 angerous Goods Placards - Hazard Classes TOTAL by Hazard Class Class Class Class Class 4 Class 5 Class 6 Class 7 Class Class 9 ANGER TOTAL 7:-7:.%.% 66.7%.%.%.%.%.%.%.% 7:-7: 5 6.%.5% 46.%.%.%.%.% 7.7%.% 7.7% 6 7:-7:.% 7.5% 5.%.%.%.%.% 6.%.% 6.% Please note: The total number of placards may differ from the total number of vehicles due to vehicles having more than one placard. Placards where the class number could not be determined are not included in the Hazard Class total. 6 Commercial Truck Volume - Truck Classification LIGHT TRUCK HEAVY TRUCK TOTALS A B C E F G H X Single rear-axle Tractor Tractor w. Tractor w. Flatbed w. Tractor w. Tanker only chassis container commodity trailer (any) Construction Other HEAVY vs. ALL % HEAVY AM (7:-:) of 4.6% M (:-4:) of 5.4% PM (4:-7:) 4 of 5 5.% 7:-7: %.%.%.7%.7% 9.5%.7%.6%.5% 4 of 4 7.% AM (7:-:) of 6 7.4% M (:-4:) of % PM (4:-7:) 5 9 of 7 6.4% 7:-7: %.%.% 5.4%.% 4.5%.4%.%.% 6 of 44.% AM (7:-:) 4 54 of 4 4.7% M (:-4:) of 4 6.4% PM (4:-7:) of 5.7% 7:-7: %.%.%.%.% 7.%.%.% 9.% 5 of % TOTAL by Vehicle Class Light (A) (B to X) B C E TOTAL by Time of ay F G H % % 4% 6% % % X Creative Transportation Solutions Ltd. Project #6- Commercial Vehicle Screenline Surveys
140 Summary Station Report Station I MONTH/YEAR: March AY OF WEEK: Wednesday.6 Comments: Highway Burnaby/Coquitlam Municipal Boundary (west of North Road) Screenline Commercial Truck Volume - Non-angerous and angerous Goods All Trucks (veh./ min.) : : 9: : : : : 4: 5: 6: 7: Time Beginning Non-G G Non-G G Non-G G TOTAL 7: : : : : : : : : : : : : : : : : : : : : TOTAL 6 6 (4.%) 95 (.7%) 65 7 (4.%) 6776 angerous Goods Placards - Hazard Classes TOTAL by Hazard Class Class Class Class Class 4 Class 5 Class 6 Class 7 Class Class 9 ANGER TOTAL 7:-7: 7:-7: 7:-7: %.%.%.7%.6%.% 69.7% 74.% 7.5%.6%.%.4%.6%.%.4%.%.%.%.6%.%.4% 6.% 6.% 6.%.%.%.7%.5%.%.% Please note: The total number of placards may differ from the total number of vehicles due to vehicles having more than one placard. Placards where the class number could not be determined are not included in the Hazard Class total Commercial Truck Volume - Truck Classification LIGHT TRUCK HEAVY TRUCK TOTALS A B C E F G H X Single rear-axle Tractor Tractor w. Tractor w. Flatbed w. Tractor w. Tanker only chassis container commodity trailer (any) Construction Other HEAVY vs. ALL % HEAVY AM (7:-:) of % M (:-4:) of 5 6.4% PM (4:-7:) of 5.% 7:-7: %.%.4% 7.7%.%.5% 4.9%.%.% 55 of % AM (7:-:) of 57.7% M (:-4:) of % PM (4:-7:) of 6 54.% 7:-7: %.% 4.%.5% 4.%.7% 4.%.% 7.% 76 of 5 5.7% AM (7:-:) of 5 5.7% M (:-4:) of % PM (4:-7:) of % 7:-7: %.%.% 9.4%.9%.5% 4.5%.5%.5% 9 of % TOTAL by Vehicle Class Light (A) (B to X) B C E TOTAL by Time of ay F G H X % % 4% 6% % % Creative Transportation Solutions Ltd. Project #6- Commercial Vehicle Screenline Surveys
141 Summary Station Report Station I MONTH/YEAR: March AY OF WEEK: Tuesday.7 Comments: North Road Burnaby/Coquitlam Municipal Boundary (west of North Road) Screenline Commercial Truck Volume - Non-angerous and angerous Goods All Trucks (veh./ min.) : : 9: : : : : 4: 5: 6: 7: Time Beginning Non-G G Non-G G Non-G G TOTAL 7: : : : : 5 6 9: : 4 44 : : 6 : 5 : 6 5 : : : : : 7 7 5: : : 6 6 6: 5 5 7: TOTAL 49 7 (.%) 4 4 (.%) 67 (.6%) 64 angerous Goods Placards - Hazard Classes TOTAL by Hazard Class Class Class Class Class 4 Class 5 Class 6 Class 7 Class Class 9 ANGER TOTAL 7:-7: 4.% 44.4%.%.%.%.%.%.%.%.% 9 7:-7: 7:-7: 5 4.%.% 5.%.5% 5.%.%.%.%.%.%.%.%.%.%.% 7.7%.%.% 5.%.% Please note: The total number of placards may differ from the total number of vehicles due to vehicles having more than one placard. Placards where the class number could not be determined are not included in the Hazard Class total. 4 Commercial Truck Volume - Truck Classification LIGHT TRUCK HEAVY TRUCK TOTALS A B C E F G H X Single rear-axle Tractor Tractor w. Tractor w. Flatbed w. Tractor w. Tanker only chassis container commodity trailer (any) Construction Other HEAVY vs. ALL % HEAVY AM (7:-:) of 4 4.9% M (:-4:) of 4 4.5% PM (4:-7:) of 74.% 7:-7: %.%.% 6.7%.% 9.%.% 5.%.% 45 of % AM (7:-:) of 9.7% M (:-4:) of 5.4% PM (4:-7:) of 94.7% 7:-7: %.7%.% 5.%.%.%.9% 4.%.5% 5 of 5.% AM (7:-:) of 69 4.% M (:-4:) of 47 9.% PM (4:-7:) of 6 9.% 7:-7: %.%.% 6.%.6% 9.%.% 4.7%.9% 6 of 64.% TOTAL by Vehicle Class Light (A) (B to X) TOTAL by Time of ay B E F G H % % 4% 6% % % X Creative Transportation Solutions Ltd. Project #6- Commercial Vehicle Screenline Surveys
142 Station I. Comments: Summary Station Report Brunette Avenue, south of Highway Burnaby/Coquitlam Municipal Boundary (west of North Road) Screenline -AY AVERAGE Commercial Truck Volume - Non-angerous and angerous Goods All Trucks (veh./ min.) : : 9: : : : : 4: 5: 6: 7: Time Beginning Non-G G Non-G G Non-G G TOTAL 7: : : : : : : : : : : : : : : : 9 5: : : : : 7 9 TOTAL 9 5 (.7%) 46 (.%) (.%) 5 angerous Goods Placards - Hazard Classes TOTAL by Hazard Class Class Class Class Class 4 Class 5 Class 6 Class 7 Class Class 9 ANGER TOTAL 7:-7: % 7.4% 9.%.9%.9%.%.9% 7.7%.%.% 59 7:-7: 7:-7: %.%.% 5.% 5.% 44.7%.%.5%.%.9%.%.%.%.5%.% 7.%.%.4% 4.%.9% Please note: The total number of placards may differ from the total number of vehicles due to vehicles having more than one placard. Placards where the class number could not be determined are not included in the Hazard Class total Commercial Truck Volume - Truck Classification LIGHT TRUCK HEAVY TRUCK TOTALS A B C E F G H X Single rear-axle Tractor Tractor w. Tractor w. Flatbed w. Tractor w. Tanker only chassis container commodity trailer (any) Construction Other HEAVY vs. ALL % HEAVY AM (7:-:) of 5 6.% M (:-4:) of 7 7.% PM (4:-7:) of % 7:-7: % 6.% 5.% 6.6%.7%.%.% 4.9% 4.% of % AM (7:-:) of % M (:-4:) of % PM (4:-7:) of % 7:-7: % 6.% 4.7% 9.%.9%.7%.6% 7.%.7% 65 of % AM (7:-:) of 7.% M (:-4:) of % PM (4:-7:) of 6 7.6% 7:-7: % 6.% 5.%.%.%.%.4% 5.%.% 74 of 5 7.4% TOTAL by Vehicle Class Light (A) (B to X) B C E TOTAL by Time of ay F G H X % % 4% 6% % % Creative Transportation Solutions Ltd. Project #6- Commercial Vehicle Screenline Surveys
143 , British Columbia Ministry of Transportation, TransLink angerous Goods and Truck Classification Survey 5
144 , British Columbia Ministry of Transportation, TransLink Screenline : Pitt Meadows / Port Coquitlam angerous Goods Summary Screenline / Total Hazard Class Station Screenline escription Placards Class Class Class Class 4 Class 5 Class 6 Class 7 Class Class 9 ANGER Pitt Meadows / Port Coquitlam Pitt River Bridge Truck Classification Summary Truck Classification Screenline / Station Screenline escription TOTAL TRUCKS LIGHT TRUCKS HEAVY TRUCKS Tractor Only Tractor with Marine Container Chassis Tractor with Marine Container Flatbed / Commodity Tractor with Trailer Tanker Construction Single Unit / Other Pitt Meadows / Port Coquitlam Pitt River Bridge Table 4 Pitt Meadows / Port Coquitlam 6 angerous Goods and Truck Classification Survey
145 Screenline Comments: Pitt Meadows / Port Coquitlam Summary Screenline Report Commercial Truck Volume - Non-angerous and angerous Goods All Trucks (veh./ min.) 6 4 7: : 9: : : : : 4: 5: 6: 7: Time Beginning Non-G G Non-G G Non-G G TOTAL 7: : 4 7 : : : : : : : : 4 5 : : : : : : : : : 5 4 6: : TOTAL (.6%) 47 4 (.%) (.4%) 9 angerous Goods Placards - Hazard Classes TOTAL by Hazard Class Class Class Class Class 4 Class 5 Class 6 Class 7 Class Class 9 ANGER TOTAL 7:-7: 7:-7: %.% 5.5%.%.%.%.% 5.%.%.% % 7.% 59.6%.%.%.%.% 9.4%.%.7% :-7:.5%.7% 55.5%.%.%.%.% 6.%.6%.6% Please note: The total number of placards may differ from the total number of vehicles due to vehicles having more than one placard. Placards where the class number could not be determined are not included in the Hazard Class total. 7 Commercial Truck Volume - Truck Classification LIGHT TRUCK HEAVY TRUCK TOTALS A B C E F G H X Single rear-axle Tractor Tractor w. Tractor w. Flatbed w. Tractor w. Tanker only chassis container commodity trailer (any) Construction Other HEAVY vs. ALL % HEAVY AM (7:-:) of % M (:-4:) of % PM (4:-7:) of 4 57.% 7:-7: %.%.9%.9% 4.% 7.%.%.% 9.6% 97 of 5 6.4% AM (7:-:) of 49 6.% M (:-4:) of 6 66.% PM (4:-7:) of 6 6.% 7:-7: % 5.% 4.%.9%.%.4%.% 9.%.9% 957 of % AM (7:-:) of % M (:-4:) of 5 64.% PM (4:-7:) of 9 59.% 7:-7: % 4.%.%.9%.4% 7.7%.9%.% 9.% 99 of 9 6.6% TOTAL by Vehicle Class Light (A) (B to X) B C E F G H TOTAL by Time of ay % % 4% 6% % % X Creative Transportation Solutions Ltd. Project #6- Commercial Vehicle Screenline Surveys
146 Station I. Comments: Pitt River Bridge Pitt Meadows / Port Coquitlam Screenline Summary Station Report -AY AVERAGE Commercial Truck Volume - Non-angerous and angerous Goods All Trucks (veh./ min.) 6 4 7: : 9: : : : : 4: 5: 6: 7: Time Beginning Non-G G Non-G G Non-G G TOTAL 7: : 4 7 : : : : : : : : 4 5 : : : : : : : : : 5 4 6: : TOTAL (.6%) 47 4 (.%) (.4%) 9 angerous Goods Placards - Hazard Classes TOTAL by Hazard Class Class Class Class Class 4 Class 5 Class 6 Class 7 Class Class 9 ANGER TOTAL 7:-7: 7:-7: %.% 5.5%.%.%.%.% 5.%.%.% % 7.% 59.6%.%.%.%.% 9.4%.%.7% :-7:.5%.7% 55.5%.%.%.%.% 6.%.6%.6% Please note: The total number of placards may differ from the total number of vehicles due to vehicles having more than one placard. Placards where the class number could not be determined are not included in the Hazard Class total. 7 Commercial Truck Volume - Truck Classification LIGHT TRUCK HEAVY TRUCK TOTALS A B C E F G H X Single rear-axle Tractor Tractor w. Tractor w. Flatbed w. Tractor w. Tanker only chassis container commodity trailer (any) Construction Other HEAVY vs. ALL % HEAVY AM (7:-:) of % M (:-4:) of % PM (4:-7:) of 4 57.% 7:-7: %.%.9%.9% 4.% 7.%.%.% 9.6% 97 of 5 6.4% AM (7:-:) of 49 6.% M (:-4:) of 6 66.% PM (4:-7:) of 6 6.% 7:-7: % 5.% 4.%.9%.%.4%.% 9.%.9% 957 of % AM (7:-:) of % M (:-4:) of 5 64.% PM (4:-7:) of 9 59.% 7:-7: % 4.%.%.9%.4% 7.7%.9%.% 9.% 99 of 9 6.6% TOTAL by Vehicle Class Light (A) (B to X) B C E F G H TOTAL by Time of ay % % 4% 6% % % X Creative Transportation Solutions Ltd. Project #6- Commercial Vehicle Screenline Surveys

147 , British Columbia Ministry of Transportation, TransLink SURREY, LANGLEY & FRASER VALLEY SCREENLINES MAPLE RIGE MISSION LANGLEY SURREY ABBOTSFOR angerous Goods and Truck Classification Survey 9
148 , British Columbia Ministry of Transportation, TransLink Screenline 5: Langley/Surrey (south of Highway ) angerous Goods Summary Screenline / Total Hazard Class Station Screenline escription Placards Class Class Class Class 4 Class 5 Class 6 Class 7 Class Class 9 ANGER 5 Langley/Surrey (south of Highway ) King George Highway 5. 5nd Street Highway nd Street th Street 5 5 Truck Classification Summary Truck Classification Screenline / Station Screenline escription TOTAL TRUCKS LIGHT TRUCKS HEAVY TRUCKS Tractor Only Tractor with Marine Container Chassis Tractor with Marine Container Flatbed / Commodity Tractor with Trailer Tanker Construction Single Unit / Other 5 Langley/Surrey (south of Highway ) King George Highway nd Street Highway nd Street th Street Table 5Langley/Surrey (s of Hwy ) angerous Goods and Truck Classification Survey
149 Screenline 5 Comments: Summary Screenline Report Langley/Surrey (south of Highway ) Commercial Truck Volume - Non-angerous and angerous Goods All Trucks (veh./ min.) : : 9: : : : : 4: 5: 6: 7: Time Beginning Non-G G Non-G G Non-G G TOTAL 7: : : : : : : : : : : : : : : : : : 4 5 6: : : TOTAL 69 4 (.7%) (.6%) (.7%) 54 angerous Goods Placards - Hazard Classes TOTAL by Hazard Class Class Class Class Class 4 Class 5 Class 6 Class 7 Class Class 9 ANGER TOTAL 7:-7: 4.%.% 6.4%.%.%.%.% 7.%.%.% 55 7:-7: 7:-7: %.%.9% 5.%.9% 4.%.%.%.%.%.%.%.%.% 9.%.7%.%.% 4.9% 6.7% Please note: The total number of placards may differ from the total number of vehicles due to vehicles having more than one placard. Placards where the class number could not be determined are not included in the Hazard Class total. 47 Commercial Truck Volume - Truck Classification LIGHT TRUCK HEAVY TRUCK TOTALS A B C E F G H X Single rear-axle Tractor Tractor w. Tractor w. Flatbed w. Tractor w. Tanker only chassis container commodity trailer (any) Construction Other HEAVY vs. ALL % HEAVY AM (7:-:) of 6 55.% M (:-4:) of 5.% PM (4:-7:) of 7 5.% 7:-7: %.9%.%.5% 5.%.4%.% 7.4%.% 466 of % AM (7:-:) of % M (:-4:) of % PM (4:-7:) of 7 5.9% 7:-7: %.9%.%.% 4.7%.%.5% 6.4%.% 45 of 6 55.% AM (7:-:) of 54.7% M (:-4:) of 9 55.% PM (4:-7:) of 5 5.4% 7:-7: %.9%.%.% 4.%.9%.% 6.9%.% 96 of % TOTAL by Vehicle Class Light (A) (B to X) B C E TOTAL by Time of ay F G H % % 4% 6% % % X Creative Transportation Solutions Ltd. Project #6- Commercial Vehicle Screenline Surveys
150 Summary Station Report Station I MONTH/YEAR: May 5. King George Highway Langley/Surrey (south of Highway ) Screenline Comments: Colebrook Road was heavily used by truck traffic to bypass King George and Highway intersection. AY OF WEEK: Thursday Commercial Truck Volume - Non-angerous and angerous Goods All Trucks (veh./ min.) : : 9: : : : : 4: 5: 6: 7: Time Beginning Non-G G Non-G G Non-G G TOTAL 7: 4 6 7: : 4 5 : 5 5 9: 9 9: : 7 4 : : : : 4 : : : 7 9 4: : : 5 5 5: : : : 4 4 TOTAL 49 7 (.4%) 65 6 (.6%) 55 (.5%) 6 angerous Goods Placards - Hazard Classes TOTAL by Hazard Class Class Class Class Class 4 Class 5 Class 6 Class 7 Class Class 9 ANGER TOTAL 7:-7: 5.%.6% 7.4%.%.%.%.%.%.%.% 7 7:-7:.% 6.7% 5.%.%.%.%.%.%.%.% 6 7:-7:.%.% 6.5%.%.%.%.% 5.4%.%.% Please note: The total number of placards may differ from the total number of vehicles due to vehicles having more than one placard. Placards where the class number could not be determined are not included in the Hazard Class total. Commercial Truck Volume - Truck Classification LIGHT TRUCK HEAVY TRUCK TOTALS A B C E F G H X Single rear-axle Tractor Tractor w. Tractor w. Flatbed w. Tractor w. Tanker only chassis container commodity trailer (any) Construction Other HEAVY vs. ALL % HEAVY AM (7:-:) of 47.% M (:-4:) of 47 5.% PM (4:-7:) of 49.% 7:-7: %.%.%.% 6.% 7.%.% 4.5% 7.% 44 of % AM (7:-:) of % M (:-4:) of 5.6% PM (4:-7:) of 96 5.% 7:-7: %.%.%.% 7.%.5%.7%.5% 9.% 9 of 7 5.% AM (7:-:) of % M (:-4:) of % PM (4:-7:) of 5.9% 7:-7: %.9%.%.% 6.9% 9.%.7%.% 7.9% 46 of 6 5.% TOTAL by Vehicle Class Light (A) (B to X) B C E F G TOTAL by Time of ay % % 4% 6% % % H X Creative Transportation Solutions Ltd. Project #6- Commercial Vehicle Screenline Surveys
151 Summary Station Report Station I MONTH/YEAR: May AY OF WEEK: Thursday 5. Comments: 5nd Street Langley/Surrey (south of Highway ) Screenline Commercial Truck Volume - Non-angerous and angerous Goods All Trucks (veh./ min.) : : 9: : : : : 4: 5: 6: 7: Time Beginning Non-G G Non-G G Non-G G TOTAL 7: : : : : : 6 64 : : : 6 6 : : : : : : : 44 5: : : 5 5 6: : TOTAL (.%) (.9%) 69 (.9%) angerous Goods Placards - Hazard Classes TOTAL by Hazard Class Class Class Class Class 4 Class 5 Class 6 Class 7 Class Class 9 ANGER TOTAL 7:-7:.%.% 6.7%.%.%.%.% 6.7%.%.% 6 7:-7:.%.% 5.%.%.%.%.% 6.7%.%.% :-7:.%.% 66.7%.%.%.%.%.%.% 66.7% Please note: The total number of placards may differ from the total number of vehicles due to vehicles having more than one placard. Placards where the class number could not be determined are not included in the Hazard Class total. 6 Commercial Truck Volume - Truck Classification LIGHT TRUCK HEAVY TRUCK TOTALS A B C E F G H X Single rear-axle Tractor Tractor w. Tractor w. Flatbed w. Tractor w. Tanker only chassis container commodity trailer (any) Construction Other HEAVY vs. ALL % HEAVY AM (7:-:) of 7 5.% M (:-4:) of 5.% PM (4:-7:) of 5.4% 7:-7: % 4.%.% 5.%.7%.%.7% 5.%.% of 6 55.% AM (7:-:) of 6 5.% M (:-4:) of 64.% PM (4:-7:) of 9 5.% 7:-7: %.%.% 7.% 4.% 5.%.6% 4.%.7% 97 of 6 5.% AM (7:-:) of 4 5.4% M (:-4:) of % PM (4:-7:) of % 7:-7: %.7%.% 6.5%.% 4.%.% 5.%.% 79 of 56.9% TOTAL by Vehicle Class Light (A) (B to X) B C E TOTAL by Time of ay F G H % % 4% 6% % % X Creative Transportation Solutions Ltd. Project #6- Commercial Vehicle Screenline Surveys
152 Summary Station Report Station I MONTH/YEAR: March AY OF WEEK: Friday 5.4 Comments: Highway 5 Langley/Surrey (south of Highway ) Screenline Commercial Truck Volume - Non-angerous and angerous Goods All Trucks (veh./ min.) : : 9: : : : : 4: 5: 6: 7: Time Beginning Non-G G Non-G G Non-G G TOTAL 7: : 6 6 : : : : : : : : : 5 59 : : : : : : : 4 4 6: : : 9 4 TOTAL 579 (.4%) 5 7 (.%) 5 (.%) 7 angerous Goods Placards - Hazard Classes TOTAL by Hazard Class 7:-7: Class Class Class Class 4 Class 5 4.%.% 44.4%.%.%.%.%.%.%.% Class 6 Class 7 Class Class 9 ANGER TOTAL 9 7:-7: 4.%.5% 5.%.%.%.%.% 5.%.%.5% 6 7 7:-7:.%.% 5.%.%.%.%.% 4.%.%.% Please note: The total number of placards may differ from the total number of vehicles due to vehicles having more than one placard. Placards where the class number could not be determined are not included in the Hazard Class total. 7 Commercial Truck Volume - Truck Classification LIGHT TRUCK HEAVY TRUCK TOTALS A B C E F G H X Single rear-axle Tractor Tractor w. Tractor w. Flatbed w. Tractor w. Tanker only chassis container commodity trailer (any) Construction Other HEAVY vs. ALL % HEAVY AM (7:-:) of 9 77.% M (:-4:) of 7.% PM (4:-7:) of 77 6.% 7:-7: %.%.4% 6.% 4.%.%.4% 5.9% 9.% 49 of % AM (7:-:) of 67.6% M (:-4:) of 74.% PM (4:-7:) of 4 64.% 7:-7: %.%.7%.5%.%.%.9% 5.7% 9.6% 66 of 5 69.% AM (7:-:) of 4 7.4% M (:-4:) of 44 7.% PM (4:-7:) of 6.% 7:-7: %.%.5% 4.%.7%.%.6% 5.% 9.4% 75 of 7 7.% TOTAL by Vehicle Class Light (A) (B to X) B C E TOTAL by Time of ay % % 4% 6% % % F G H X Creative Transportation Solutions Ltd. Project #6- Commercial Vehicle Screenline Surveys
153 Summary Station Report Station I MONTH/YEAR: May AY OF WEEK: Thursday 5.6 Comments: 9nd Street Langley/Surrey (south of Highway ) Screenline Commercial Truck Volume - Non-angerous and angerous Goods All Trucks (veh./ min.) : : 9: : : : : 4: 5: 6: 7: Time Beginning Non-G G Non-G G Non-G G TOTAL 7: : : : 6 7 9: : 5 5 : : : : : : : : : : : : : 5 6: 6 7: 5 5 TOTAL 564 (.9%) 555 (.9%) 9 (.9%) 4 angerous Goods Placards - Hazard Classes TOTAL by Hazard Class Class Class Class Class 4 Class 5 Class 6 Class 7 Class Class 9 ANGER TOTAL 7:-7: 7:-7: 7:-7: %.%.% 5.% 46.7% 5.%.%.% 5.%.%.%.%.%.%.%.%.%.%.%.%.%.% 6.7%.6%.%.%.% 5.4% 6.7%.4% 5 Please note: The total number of placards may differ from the total number of vehicles due to vehicles having more than one placard. Placards where the class number could not be determined are not included in the Hazard Class total. Commercial Truck Volume - Truck Classification LIGHT TRUCK HEAVY TRUCK TOTALS A B C E F G H X Single rear-axle Tractor Tractor w. Tractor w. Flatbed w. Tractor w. Tanker only chassis container commodity trailer (any) Construction Other HEAVY vs. ALL % HEAVY AM (7:-:) of % M (:-4:) of 5.% PM (4:-7:) of % 7:-7: %.%.9%.4% 6.4% 5.7%.6% 4.% 4.% of % AM (7:-:) of % M (:-4:) of 7 55.% PM (4:-7:) of 7 4.% 7:-7: %.%.5%.% 5.% 6.4%.% 6.% 5.4% 9 of % AM (7:-:) of 47.4% M (:-4:) of % PM (4:-7:) of % 7:-7: %.5%.%.% 5.9% 6.%.% 5.% 4.% 57 of 4 5.% TOTAL by Vehicle Class Light (A) (B to X) B C E F G H TOTAL by Time of ay % % 4% 6% % % X Creative Transportation Solutions Ltd. Project #6- Commercial Vehicle Screenline Surveys
154 Summary Station Report Station I MONTH/YEAR: May AY OF WEEK: Thursday 5.7 Comments: th Street Langley/Surrey (south of Highway ) Screenline Commercial Truck Volume - Non-angerous and angerous Goods All Trucks (veh./ min.) : : 9: : : : : 4: 5: 6: 7: Time Beginning Non-G G Non-G G Non-G G TOTAL 7: 5 7: 5 5 : : 4 4 9: : : : 66 6 : : : 5 54 : : : : : : : 6 7 6: : : 9 4 TOTAL 47 6 (.%) 479 (.%) 95 7 (.%) 977 angerous Goods Placards - Hazard Classes TOTAL by Hazard Class Class Class Class Class 4 Class 5 Class 6 Class 7 7:-7: % 45.%.%.%.%.%.%.%.% 5.% 7:-7: 6 4.% 5.%.%.%.%.%.%.%.%.% Class Class 9 ANGER TOTAL 5 5 7:-7:.% 46.9%.%.%.%.%.%.%.% 5.6% Please note: The total number of placards may differ from the total number of vehicles due to vehicles having more than one placard. Placards where the class number could not be determined are not included in the Hazard Class total. Commercial Truck Volume - Truck Classification LIGHT TRUCK HEAVY TRUCK TOTALS A B C E F G H X Single rear-axle Tractor Tractor w. Tractor w. Flatbed w. Tractor w. Tanker only chassis container commodity trailer (any) Construction Other HEAVY vs. ALL % HEAVY AM (7:-:) 94 7 of % M (:-4:) of 9 4.9% PM (4:-7:) of 9.% 7:-7: %.7%.4%.% 6.%.%.6% 6.%.% 9 of 47 9.% AM (7:-:) of % M (:-4:) of 99 5.% PM (4:-7:) of 4 44.% 7:-7: %.7%.%.%.% 7.%.6% 5.9%.% of % AM (7:-:) of 5 45.% M (:-4:) of 9 5.% PM (4:-7:) of 7 4.% 7:-7: %.7%.%.9% 4.5%.%.6% 6.% 6.% 9 of % TOTAL by Vehicle Class Light (A) (B to X) B C E TOTAL by Time of ay F G H % % 4% 6% % % X Creative Transportation Solutions Ltd. Project #6- Commercial Vehicle Screenline Surveys
155 , British Columbia Ministry of Transportation, TransLink angerous Goods and Truck Classification Survey 7
156 , British Columbia Ministry of Transportation, TransLink Screenline 6: Surrey/Langley (west of th Street) angerous Goods Summary Screenline / Total Hazard Class Station Screenline escription Placards Class Class Class Class 4 Class 5 Class 6 Class 7 Class Class 9 ANGER 6 Surrey/Langley (west of th Street) th Avenue Highway th Avenue Highway Fraser Highway th Avenue 4 7 Truck Classification Summary Truck Classification Screenline / Station Screenline escription TOTAL TRUCKS LIGHT TRUCKS HEAVY TRUCKS Tractor Only Tractor with Marine Container Chassis Tractor with Marine Container Flatbed / Commodity Tractor with Trailer Tanker Construction Single Unit / Other 6 Surrey/Langley (west of th Street) th Avenue Highway th Avenue Highway Fraser Highway th Avenue Table 6 Surrey/Langley (w of St) angerous Goods and Truck Classification Survey
157 Screenline 6 Comments: Surrey/Langley (west of th Street) Summary Screenline Report Commercial Truck Volume - Non-angerous and angerous Goods All Trucks (veh./ min.) : : 9: : : : : 4: 5: 6: 7: Time Beginning Non-G G Non-G G Non-G G TOTAL 7: : : : : : : : : : : : : : : : : : : : : TOTAL (.4%) 59 6 (.%) 9 (.%) 67 angerous Goods Placards - Hazard Classes TOTAL by Hazard Class Class Class Class Class 4 Class 5 Class 6 Class 7 Class Class 9 ANGER TOTAL 7:-7: 7:-7: 7:-7: %.5%.7%.7% 4.%.4% 4.% 56.% 5.%.%.%.%.%.%.7%.6%.%.%.%.%.% 7.6% 5.% 6.6%.%.%.% 9.%.4% 6.% 7 4 Please note: The total number of placards may differ from the total number of vehicles due to vehicles having more than one placard. Placards where the class number could not be determined are not included in the Hazard Class total Commercial Truck Volume - Truck Classification LIGHT TRUCK HEAVY TRUCK TOTALS A B C E F G H X Single rear-axle Tractor Tractor w. Tractor w. Flatbed w. Tractor w. Tanker only chassis container commodity trailer (any) Construction Other HEAVY vs. ALL % HEAVY AM (7:-:) of 65.9% M (:-4:) of % PM (4:-7:) of % 7:-7: % 5.%.7% 4.% 5.4% 7.7%.7% 6.%.6% 479 of % AM (7:-:) of 6 7.% M (:-4:) of % PM (4:-7:) of % 7:-7: % 4.7%.%.% 7.% 9.%.5% 6.5%.5% 4 of % AM (7:-:) of 49 6.% M (:-4:) of % PM (4:-7:) of 6 64.% 7:-7: % 4.9%.% 4.% 6.%.5%.6% 6.%.% 46 of % TOTAL by Vehicle Class Light (A) (B to X) B C E TOTAL by Time of ay F G H % % 4% 6% % % X Creative Transportation Solutions Ltd. Project #6- Commercial Vehicle Screenline Surveys
158 Summary Station Report Station I MONTH/YEAR: March AY OF WEEK: Monday 6. Comments: 96th Avenue Surrey/Langley (west of th Street) Screenline Commercial Truck Volume - Non-angerous and angerous Goods All Trucks (veh./ min.) : : 9: : : : : 4: 5: 6: 7: Time Beginning Non-G G Non-G G Non-G G TOTAL 7: : : : : : : : 6 6 : : : : : : : : : : : : : TOTAL (.9%) 6 4 (.%) (.%) 99 angerous Goods Placards - Hazard Classes TOTAL by Hazard Class Class Class Class Class 4 Class 5 Class 6 Class 7 Class Class 9 ANGER TOTAL 7:-7: 6 6.%.6% 6.7%.%.%.%.% 6.7%.% 6.% 6 7:-7: %.6% 9.5%.%.%.%.% 5.%.%.% 7:-7:.%.%.4%.%.%.%.% 6.%.% 4.% Please note: The total number of placards may differ from the total number of vehicles due to vehicles having more than one placard. Placards where the class number could not be determined are not included in the Hazard Class total. 74 Commercial Truck Volume - Truck Classification LIGHT TRUCK HEAVY TRUCK TOTALS A B C E F G H X Single rear-axle Tractor Tractor w. Tractor w. Flatbed w. Tractor w. Tanker only chassis container commodity trailer (any) Construction Other HEAVY vs. ALL % HEAVY AM (7:-:) of % M (:-4:) of % PM (4:-7:) of % 7:-7: % 9.%.% 7.%.9%.9%.4% 6.6% 4.% 59 of 57.9% AM (7:-:) of 6.% M (:-4:) of 5.% PM (4:-7:) of 5.% 7:-7: %.%.6%.9% 4.% 7.%.% 5.9% 5.9% 57 of % AM (7:-:) of % M (:-4:) of % PM (4:-7:) of % 7:-7: %.7%.9% 5.% 4.% 4.%.% 6.% 5.% 5 of % TOTAL by Vehicle Class Light (A) (B to X) B C E TOTAL by Time of ay F G H % % 4% 6% % % X Creative Transportation Solutions Ltd. Project #6- Commercial Vehicle Screenline Surveys
159 Summary Station Report Station I MONTH/YEAR: March AY OF WEEK: Monday 6. Comments: Highway Surrey/Langley (west of th Street) Screenline Commercial Truck Volume - Non-angerous and angerous Goods All Trucks (veh./ min.) : : 9: : : : : 4: 5: 6: 7: Time Beginning Non-G G Non-G G Non-G G TOTAL 7: : : : : : : : : 96 9 : : : : : : : : : : : : TOTAL 5 (.9%) (.5%) 55 5 (.7%) 5659 angerous Goods Placards - Hazard Classes TOTAL by Hazard Class Class Class Class Class 4 Class 5 Class 6 Class 7 Class Class 9 ANGER TOTAL 7:-7: % 7.% 6.6%.%.%.%.% 5.7%.%.4% 6 5 7:-7: 9 5.6% 4.%.%.%.%.%.%.%.%.% :-7:.7% 5.% 7.%.%.7%.7%.%.%.% 7.9% Please note: The total number of placards may differ from the total number of vehicles due to vehicles having more than one placard. Placards where the class number could not be determined are not included in the Hazard Class total. 5 Commercial Truck Volume - Truck Classification LIGHT TRUCK HEAVY TRUCK TOTALS A B C E F G H X Single rear-axle Tractor Tractor w. Tractor w. Flatbed w. Tractor w. Tanker only chassis container commodity trailer (any) Construction Other HEAVY vs. ALL % HEAVY AM (7:-:) of % M (:-4:) of 97 7.% PM (4:-7:) of 5 67.% 7:-7: % 4.4%.% 6.5% 7.%.7%.%.%.% 4 of 96 6.% AM (7:-:) of % M (:-4:) of % PM (4:-7:) of 66.% 7:-7: % 4.7%.6% 4.5% 7.% 4.%.9%.% 6.% 4 of % AM (7:-:) of 6 6.5% M (:-4:) of 69.5% PM (4:-7:) of % 7:-7: % 4.6%.% 5.5% 7.%.9%.9% 9.%.6% 66 of % TOTAL by Vehicle Class Light (A) (B to X) B C E TOTAL by Time of ay F G H X % % 4% 6% % % Creative Transportation Solutions Ltd. Project #6- Commercial Vehicle Screenline Surveys
160 Summary Station Report Station I MONTH/YEAR: May AY OF WEEK: Thursday 6.6 Comments: 64th Avenue Surrey/Langley (west of th Street) Screenline Commercial Truck Volume - Non-angerous and angerous Goods All Trucks (veh./ min.) : : 9: : : : : 4: 5: 6: 7: Time Beginning Non-G G Non-G G Non-G G TOTAL 7: 7 7: : : : : 7 : 6 7 : 9 9 : 6 6 : 9 : : : 9 4 : 4 7 4: 4 4: 5 7 5: 9 5: 6 6: 7 6: : TOTAL 97 (.%) (.%) 4 (.%) 4 angerous Goods Placards - Hazard Classes TOTAL by Hazard Class Class Class Class Class 4 Class 5 Class 6 Class 7 Class Class 9 ANGER TOTAL 7:-7: 7:-7: 7:-7:.%.%.%.% 5.% 4.%.% 5.% 4.%.%.%.%.%.%.%.%.%.%.%.%.%.%.%.%.%.%.%.%.%.% 5 Please note: The total number of placards may differ from the total number of vehicles due to vehicles having more than one placard. Placards where the class number could not be determined are not included in the Hazard Class total. Commercial Truck Volume - Truck Classification LIGHT TRUCK HEAVY TRUCK TOTALS A B C E F G H X Single rear-axle Tractor Tractor w. Tractor w. Flatbed w. Tractor w. Tanker only chassis container commodity trailer (any) Construction Other HEAVY vs. ALL % HEAVY AM (7:-:) of 75 6.% M (:-4:) 46 7 of % PM (4:-7:) of 6.5% 7:-7: 6 4.9%.5%.%.%.% 4.%.5%.%.% of 99 9.% AM (7:-:) 4 9 of 6.6% M (:-4:) 49 5 of 6 9.7% PM (4:-7:) 49 5 of 6.% 7:-7: %.%.5%.%.7% 4.%.5%.%.4% 44 of 5.% AM (7:-:) of 7.6% M (:-4:) 95 4 of 7.% PM (4:-7:) of.% 7:-7: %.%.%.5%.% 4.%.5%.%.% of 4.4% TOTAL by Vehicle Class Light (A) (B to X) B C E TOTAL by Time of ay F G H % % 4% 6% % % X Creative Transportation Solutions Ltd. Project #6- Commercial Vehicle Screenline Surveys
161 Summary Station Report Station I MONTH/YEAR: March AY OF WEEK: Monday 6.7 Comments: Highway Surrey/Langley (west of th Street) Screenline Commercial Truck Volume - Non-angerous and angerous Goods All Trucks (veh./ min.) : : 9: : : : : 4: 5: 6: 7: Time Beginning Non-G G Non-G G Non-G G TOTAL 7: : : : : : : : : 79 5 : : 6 66 : : : : : : : 5 6 6: : : TOTAL 77 9 (.6%) 967 (.%) (.%) 9 angerous Goods Placards - Hazard Classes TOTAL by Hazard Class Class Class Class Class 4 Class 5 Class 6 Class 7 Class Class 9 ANGER TOTAL 7:-7: % 7.% 4.4%.%.%.%.% 6.%.%.% 7:-7: 7:-7: %.%.% 9.%.7% 4.5%.%.%.%.%.%.%.%.% 4.5% 5.5% 4.5%.% 6.4% 7.% Please note: The total number of placards may differ from the total number of vehicles due to vehicles having more than one placard. Placards where the class number could not be determined are not included in the Hazard Class total Commercial Truck Volume - Truck Classification LIGHT TRUCK HEAVY TRUCK TOTALS A B C E F G H X Single rear-axle Tractor Tractor w. Tractor w. Flatbed w. Tractor w. Tanker only chassis container commodity trailer (any) Construction Other HEAVY vs. ALL % HEAVY AM (7:-:) of % M (:-4:) of % PM (4:-7:) of 5 6.% 7:-7: % 6.5%.%.% 5.%.5%.5%.% 7.6% 76 of % AM (7:-:) of 64 7.% M (:-4:) of 5 69.% PM (4:-7:) of 7 69.% 7:-7: % 5.6%.%.4%.%.9%.5% 4.9%.% 694 of % AM (7:-:) of 7 7.7% M (:-4:) of % PM (4:-7:) of % 7:-7: % 6.%.6%.%.5%.7%.5%.9% 4.9% 4 of % TOTAL by Vehicle Class Light (A) (B to X) B C E TOTAL by Time of ay F G H % % 4% 6% % % X Creative Transportation Solutions Ltd. Project #6- Commercial Vehicle Screenline Surveys
162 Summary Station Report Station I MONTH/YEAR: May AY OF WEEK: Thursday 6. Comments: Fraser Highway Surrey/Langley (west of th Street) Screenline Commercial Truck Volume - Non-angerous and angerous Goods All Trucks (veh./ min.) : : 9: : : : : 4: 5: 6: 7: Time Beginning Non-G G Non-G G Non-G G TOTAL 7: 6 9 7: 4 4 : 7 5 : : : 7 9 : : : : 4 9 : 7 9 : 7 5 : : : 4: 7 6 5: : 6: 5 5 6: 6 4 7: TOTAL 7 (.6%) 44 (.7%) 4 (.%) 5 angerous Goods Placards - Hazard Classes TOTAL by Hazard Class Class Class Class Class 4 Class 5 Class 6 Class 7 Class Class 9 ANGER TOTAL 7:-7:.% 5.% 5.%.%.%.%.%.%.% 5.% 4 7:-7:.%.%.%.%.%.%.%.%.%.% 7:-7:.% 4.%.%.%.%.%.%.%.%.% Please note: The total number of placards may differ from the total number of vehicles due to vehicles having more than one placard. Placards where the class number could not be determined are not included in the Hazard Class total. 5 Commercial Truck Volume - Truck Classification LIGHT TRUCK HEAVY TRUCK TOTALS A B C E F G H X Single rear-axle Tractor Tractor w. Tractor w. Flatbed w. Tractor w. Tanker only chassis container commodity trailer (any) Construction Other HEAVY vs. ALL % HEAVY AM (7:-:) 4 6 of 69.4% M (:-4:) of % PM (4:-7:) of 56 5.% 7:-7: % 4.%.%.6%.% 4.7%.5%.6%.% 5 of 9 6.% AM (7:-:) 7 of 5.9% M (:-4:) of 5.4% PM (4:-7:) of 5 7.% 7:-7: %.7%.%.7%.7% 6.9%.%.4%.% of 45.7% AM (7:-:) 75 9 of 4 7.9% M (:-4:) of.6% PM (4:-7:) 5 5 of.% 7:-7: %.7%.%.%.9% 5.7%.%.%.4% of 5 4.% TOTAL by Vehicle Class Light (A) (B to X) TOTAL by Time of ay B E F G H % % 4% 6% % % X Creative Transportation Solutions Ltd. Project #6- Commercial Vehicle Screenline Surveys
163 Summary Station Report Station I MONTH/YEAR: May AY OF WEEK: Thursday 6.5 Comments: 6th Avenue Surrey/Langley (west of th Street) Screenline Commercial Truck Volume - Non-angerous and angerous Goods All Trucks (veh./ min.) : : 9: : : : : 4: 5: 6: 7: Time Beginning Non-G G Non-G G Non-G G TOTAL 7: 54 7: : : : : : : : : 59 5 : : : 6 6 : : 6 6 4: : : : : : TOTAL 7 (.6%) 5 5 (.4%) 6 (.5%) 7 angerous Goods Placards - Hazard Classes TOTAL by Hazard Class Class Class Class Class 4 Class 5 Class 6 Class 7 Class Class 9 ANGER TOTAL 7:-7: 5.%.5% 6.5%.%.%.%.%.%.% 5.% 7:-7:.% 6.% 4.%.%.%.%.%.%.%.% :-7:.%.% 5.%.%.%.%.%.%.% 5.4% Please note: The total number of placards may differ from the total number of vehicles due to vehicles having more than one placard. Placards where the class number could not be determined are not included in the Hazard Class total. Commercial Truck Volume - Truck Classification LIGHT TRUCK HEAVY TRUCK TOTALS A B C E F G H X Single rear-axle Tractor Tractor w. Tractor w. Flatbed w. Tractor w. Tanker only chassis container commodity trailer (any) Construction Other HEAVY vs. ALL % HEAVY AM (7:-:) of 4 9.% M (:-4:) of 49 4.% PM (4:-7:) of % 7:-7: %.%.7%.%.% 9.9%.% 5.9%.6% 94 of 4.% AM (7:-:) of 47.6% M (:-4:) of 4 7.7% PM (4:-7:) of 6.% 7:-7: %.%.%.% 6.%.6%.% 49.4% 7.% 966 of 55.6% AM (7:-:) of 6 5.% M (:-4:) of 6.% PM (4:-7:) of % 7:-7: %.5%.5%.4% 4.7%.%.9% 5.% 9.% 9 of 7.9% TOTAL by Vehicle Class Light (A) (B to X) B C E F G TOTAL by Time of ay % % 4% 6% % % H X Creative Transportation Solutions Ltd. Project #6- Commercial Vehicle Screenline Surveys
164 , British Columbia Ministry of Transportation, TransLink Screenline 7: FVR/GVR - south of Fraser angerous Goods Summary Screenline / Total Hazard Class Station Screenline escription Placards Class Class Class Class 4 Class 5 Class 6 Class 7 Class Class 9 ANGER 7 FVR/GVR - south of Fraser Highway Fraser Highway 6 4 Truck Classification Summary Truck Classification Screenline / Station Screenline escription TOTAL TRUCKS LIGHT TRUCKS HEAVY TRUCKS Tractor Only Tractor with Marine Container Chassis Tractor with Marine Container Flatbed / Commodity Tractor with Trailer Tanker Construction Single Unit / Other 7 FVR/GVR - south of Fraser Highway Fraser Highway Table 7 FVR/GVR - south of Fraser 46 angerous Goods and Truck Classification Survey
165 Screenline 7 Comments: FVR/GVR - south of Fraser Summary Screenline Report Commercial Truck Volume - Non-angerous and angerous Goods All Trucks (veh./ min.) : : 9: : : : : 4: 5: 6: 7: Time Beginning Non-G G Non-G G Non-G G TOTAL 7: : : : : : : : : : : : : : : : : : : : : TOTAL (.%) 9 (.%) (.%) 779 angerous Goods Placards - Hazard Classes TOTAL by Hazard Class Class Class Class Class 4 Class 5 Class 6 Class 7 Class Class 9 ANGER TOTAL 7:-7: 7:-7: 7:-7: %.%.%.9%.9%.9% 56.7% 5.% 5.9%.% 5.%.%.%.%.%.%.%.%.%.%.% 6.%.% 7.%.5%.%.7% 4.9% 5.% 5.% Please note: The total number of placards may differ from the total number of vehicles due to vehicles having more than one placard. Placards where the class number could not be determined are not included in the Hazard Class total Commercial Truck Volume - Truck Classification LIGHT TRUCK HEAVY TRUCK TOTALS A B C E F G H X Single rear-axle Tractor Tractor w. Tractor w. Flatbed w. Tractor w. Tanker only chassis container commodity trailer (any) Construction Other HEAVY vs. ALL % HEAVY AM (7:-:) of 69.% M (:-4:) of % PM (4:-7:) of 6.% 7:-7: %.%.% 4.6% 7.5% 9.5%.9% 5.5% 6.% 56 of 67 7.% AM (7:-:) of % M (:-4:) of 57 7.% PM (4:-7:) of % 7:-7: % 4.%.5%.% 6.% 9.%.9% 5.% 5.% 64 of 47 6.% AM (7:-:) of 55 6.% M (:-4:) of % PM (4:-7:) of % 7:-7: %.5%.9%.9% 7.% 9.7%.9% 5.% 5.9% 49 of % TOTAL by Vehicle Class Light (A) (B to X) B C E TOTAL by Time of ay F G H % % 4% 6% % % X Creative Transportation Solutions Ltd. Project #6- Commercial Vehicle Screenline Surveys
166 Summary Station Report Station I MONTH/YEAR: May AY OF WEEK: Tuesday 7. Comments: Highway FVR/GVR - south of Fraser Screenline Commercial Truck Volume - Non-angerous and angerous Goods All Trucks (veh./ min.) : : 9: : : : : 4: 5: 6: 7: Time Beginning Non-G G Non-G G Non-G G TOTAL 7: : : : : : : : : : : : : : : : : : : : : TOTAL 6 6 (.9%) 9 74 (.4%) 6 5 (.%) 66 angerous Goods Placards - Hazard Classes TOTAL by Hazard Class Class Class Class Class 4 Class 5 Class 6 Class 7 Class Class 9 ANGER TOTAL 7:-7: % 9.4% 5.%.%.%.%.% 6.5%.6% 4.5% 6 9 7:-7: 7:-7: %.% 7.9%.6% 5.6% 55.% 6.4%.6%.%.%.%.%.%.% 9.% 7.9%.%.7% 4.% 4.% Please note: The total number of placards may differ from the total number of vehicles due to vehicles having more than one placard. Placards where the class number could not be determined are not included in the Hazard Class total Commercial Truck Volume - Truck Classification LIGHT TRUCK HEAVY TRUCK TOTALS A B C E F G H X Single rear-axle Tractor Tractor w. Tractor w. Flatbed w. Tractor w. Tanker only chassis container commodity trailer (any) Construction Other HEAVY vs. ALL % HEAVY AM (7:-:) of % M (:-4:) of % PM (4:-7:) of % 7:-7: %.%.4% 5.% 7.9%.%.% 5.9% 5.% 6 of 7.5% AM (7:-:) of 9 69.% M (:-4:) of 7 7.9% PM (4:-7:) of 6 7.% 7:-7: % 4.%.%.6% 6.9%.7%.% 5.% 5.7% 9 of 9 7.% AM (7:-:) of 75 7.% M (:-4:) of % PM (4:-7:) of % 7:-7: %.6%.9% 4.4% 7.4%.4%.9% 5.9% 5.% 455 of 66 7.% TOTAL by Vehicle Class Light (A) (B to X) B C E TOTAL by Time of ay F G H % % 4% 6% % % X Creative Transportation Solutions Ltd. Project #6- Commercial Vehicle Screenline Surveys
167 Summary Station Report Station I MONTH/YEAR: May AY OF WEEK: Tuesday 7. Comments: Fraser Highway FVR/GVR - south of Fraser Screenline Commercial Truck Volume - Non-angerous and angerous Goods All Trucks (veh./ min.) : : 9: : : : : 4: 5: 6: 7: Time Beginning Non-G G Non-G G Non-G G TOTAL 7: 7: : 4 9 : : 4 4 9: : : : 4 4 : : : : : 4 7 4: : : 4 7 5: : 6: : TOTAL 4 (.%) 7 6 (.6%) 75 (.%) 76 angerous Goods Placards - Hazard Classes TOTAL by Hazard Class Class Class Class Class 4 Class 5 Class 6 Class 7 Class Class 9 ANGER TOTAL 7:-7:.% 4.% 4.%.%.%.%.%.%.%.% 5 7:-7: 4.% 5.% 5.%.%.%.%.%.%.% 5.% 6 4 7:-7:.% 46.%.%.%.%.%.%.%.%.% Please note: The total number of placards may differ from the total number of vehicles due to vehicles having more than one placard. Placards where the class number could not be determined are not included in the Hazard Class total. Commercial Truck Volume - Truck Classification TOTAL by Vehicle Class LIGHT TRUCK HEAVY TRUCK TOTALS A B C E F G H X Single rear-axle Tractor Tractor w. Tractor w. Flatbed w. Tractor w. Tanker only chassis container commodity trailer (any) Construction Other HEAVY vs. ALL % HEAVY AM (7:-:) of 4.% M (:-4:) of 46.9% PM (4:-7:) of 5 4.4% 7:-7: %.6%.%.%.4% 6.%.6%.%.% 6 of 4 4.% AM (7:-:) of 49 5.% M (:-4:) of 45.4% PM (4:-7:) of 7.% 7:-7: % 4.%.%.5% 6.% 5.%.%.4% 6.6% 74 of % AM (7:-:) of 47.5% M (:-4:) of 5 46.% PM (4:-7:) of 5 4.% 7:-7: %.9%.%.% 4.7% 5.5%.9%.% 7.% 4 of % Light (A) (B to X) B C E F G H TOTAL by Time of ay % % 4% 6% % % X Creative Transportation Solutions Ltd. Project #6- Commercial Vehicle Screenline Surveys
168 , British Columbia Ministry of Transportation, TransLink Screenline : FVR/GVR - north of Fraser angerous Goods Summary Screenline / Total Hazard Class Station Screenline escription Placards Class Class Class Class 4 Class 5 Class 6 Class 7 Class Class 9 ANGER FVR/GVR - north of Fraser 6 4. ewdney Trunk Road 7. Highway Truck Classification Summary Truck Classification Screenline / Station Screenline escription TOTAL TRUCKS LIGHT TRUCKS HEAVY TRUCKS Tractor Only Tractor with Marine Container Chassis Tractor with Marine Container Flatbed / Commodity Tractor with Trailer Tanker Construction Single Unit / Other FVR/GVR - north of Fraser ewdney Trunk Road Highway Table FVR/GVR - north of Fraser 5 angerous Goods and Truck Classification Survey
169 Screenline Comments: FVR/GVR - north of Fraser Summary Screenline Report Commercial Truck Volume - Non-angerous and angerous Goods All Trucks (veh./ min.) : : 9: : : : : 4: 5: 6: 7: Time Beginning Non-G G Non-G G Non-G G TOTAL 7: : : : : : : : : : : : : : : : : : : : : TOTAL (.%) 75 (.7%) 5 (.%) 569 angerous Goods Placards - Hazard Classes TOTAL by Hazard Class Class Class Class Class 4 Class 5 Class 6 Class 7 Class Class 9 ANGER TOTAL 7:-7: 7:-7: 4.%.% 6.%.%.%.%.% 5.%.% 5.%.% 6.7% 66.7%.%.%.%.%.%.%.% 6 4 7:-7:.%.% 6.5%.%.%.%.% 6.%.%.5% Please note: The total number of placards may differ from the total number of vehicles due to vehicles having more than one placard. Placards where the class number could not be determined are not included in the Hazard Class total. Commercial Truck Volume - Truck Classification LIGHT TRUCK HEAVY TRUCK TOTALS A B C E F G H X Single rear-axle Tractor Tractor w. Tractor w. Flatbed w. Tractor w. Tanker only chassis container commodity trailer (any) Construction Other HEAVY vs. ALL % HEAVY AM (7:-:) of 7 75.% M (:-4:) of 67.9% PM (4:-7:) of 6.% 7:-7: %.%.% 4.%.6% 6.%.% 4.% 6.7% 56 of 6.6% AM (7:-:) of 6 7.% M (:-4:) of % PM (4:-7:) of % 7:-7: %.9%.9%.5%.%.%.5% 5.% 9.% 54 of 74 7.% AM (7:-:) of % M (:-4:) of % PM (4:-7:) of % 7:-7: %.%.%.9% 6.5% 7.%.% 4.7%.4% 4 of % TOTAL by Vehicle Class Light (A) (B to X) B C E F G TOTAL by Time of ay % % 4% 6% % % H X Creative Transportation Solutions Ltd. Project #6- Commercial Vehicle Screenline Surveys
170 Summary Station Report Station I MONTH/YEAR: April AY OF WEEK: Wednesday. Comments: ewdney Trunk Road FVR/GVR - north of Fraser Screenline Commercial Truck Volume - Non-angerous and angerous Goods All Trucks (veh./ min.) : : 9: : : : : 4: 5: 6: 7: Time Beginning Non-G G Non-G G Non-G G TOTAL 7: : : : 9: : 4 : 5 : : : 4 7 : 4 : : : 4: 4: 4 4 5: 5 6 5: : 6: : TOTAL 4 5 (9.4%) 47 (6.%) 95 (7.%) angerous Goods Placards - Hazard Classes TOTAL by Hazard Class Class Class Class Class 4 Class 5 Class 6 Class 7 Class Class 9 ANGER TOTAL 7:-7: 7:-7: 7:-7: 5 7.%.%.%.%.%.5%.% 66.7% 7.5%.%.%.%.%.%.%.%.%.%.%.%.%.%.%.%.%.%.%.%.%.% 5 Please note: The total number of placards may differ from the total number of vehicles due to vehicles having more than one placard. Placards where the class number could not be determined are not included in the Hazard Class total. Commercial Truck Volume - Truck Classification TOTAL by Vehicle Class LIGHT TRUCK HEAVY TRUCK TOTALS A B C E F G H X Single rear-axle Tractor Tractor w. Tractor w. Flatbed w. Tractor w. Tanker only chassis container commodity trailer (any) Construction Other HEAVY vs. ALL % HEAVY AM (7:-:) 4 5 of 7 9.4% M (:-4:) of.4% PM (4:-7:) 5 of.5% 7:-7: %.%.%.%.%.%.% 7.% 5.% 7 of 5.% AM (7:-:) 7 of 5.% M (:-4:) 4 4 of 4.6% PM (4:-7:) 5 5 of 6 6.% 7:-7: %.%.%.% 4.%.%.%.%.% 5 of 5 5.% AM (7:-:) 5 of 7 4.5% M (:-4:) of 7 9.7% PM (4:-7:) of 9 55.% 7:-7: %.%.%.%.9%.%.%.6%.% 4 of 4.% Light (A) (B to X) B C E F TOTAL by Time of ay % % 4% 6% % % H X Creative Transportation Solutions Ltd. Project #6- Commercial Vehicle Screenline Surveys
171 Summary Station Report Station I MONTH/YEAR: April AY OF WEEK: Wednesday. Comments: Highway 7 FVR/GVR - north of Fraser Screenline Commercial Truck Volume - Non-angerous and angerous Goods All Trucks (veh./ min.) : : 9: : : : : 4: 5: 6: 7: Time Beginning Non-G G Non-G G Non-G G TOTAL 7: : : 4 : 47 9: : : : : 4 9 : : : : : : : : : : : : TOTAL 755 (.7%) 6 (.4%) 44 (.6%) 466 angerous Goods Placards - Hazard Classes TOTAL by Hazard Class Class Class Class Class 4 Class 5 Class 6 Class 7 Class Class 9 ANGER TOTAL 7:-7: 7:-7: 7:-7: %.%.% 6.7%.%.% 46.7% 66.7% 54.%.%.%.%.%.%.%.%.%.%.%.%.% 6.7%.%.%.%.%.%.%.% 6.7% Please note: The total number of placards may differ from the total number of vehicles due to vehicles having more than one placard. Placards where the class number could not be determined are not included in the Hazard Class total. Commercial Truck Volume - Truck Classification LIGHT TRUCK HEAVY TRUCK TOTALS A B C E F G H X Single rear-axle Tractor Tractor w. Tractor w. Flatbed w. Tractor w. Tanker only chassis container commodity trailer (any) Construction Other HEAVY vs. ALL % HEAVY AM (7:-:) of 5 7.% M (:-4:) of 95 7.% PM (4:-7:) of 6.% 7:-7: %.5%.% 4.6%.7% 6.4%.% 5.5% 6.% 546 of 76 7.% AM (7:-:) of 66.% M (:-4:) of 5 69.% PM (4:-7:) of 7.6% 7:-7: %.9%.%.7%.% 9.%.6% 7.%.% 56 of % AM (7:-:) of % M (:-4:) of % PM (4:-7:) of % 7:-7: %.%.% 4.% 6.% 7.%.4% 6.%.7% 6 of % TOTAL by Vehicle Class Light (A) (B to X) B C E F G TOTAL by Time of ay % % 4% 6% % % H X Creative Transportation Solutions Ltd. Project #6- Commercial Vehicle Screenline Surveys
172 , British Columbia Ministry of Transportation, TransLink Screenline : North of Border, entering BC angerous Goods Summary Screenline / Total Hazard Class Station Screenline escription Placards Class Class Class Class 4 Class 5 Class 6 Class 7 Class Class 9 ANGER North of Border, entering BC. Highway Truck Classification Summary Truck Classification Screenline / Station Screenline escription TOTAL TRUCKS LIGHT TRUCKS HEAVY TRUCKS Tractor Only Tractor with Marine Container Chassis Tractor with Marine Container Flatbed / Commodity Tractor with Trailer Tanker Construction Single Unit / Other North of Border, entering BC Highway Table 9 Hwy, north of border 54 angerous Goods and Truck Classification Survey
173 Summary Station Report Station I MONTH/YEAR: March AY OF WEEK: Friday. Comments: Highway North of Border, entering BC Screenline Commercial Truck Volume - Non-angerous and angerous Goods All Trucks (veh./ min.) : : 9: : : : : 4: 5: 6: 7: Time Beginning Non-G G Non-G G Non-G G TOTAL 7: 4 7 7: : 6 4 : 5 5 9: : : : 5 6 : : 6 7 : 9 : 7 : 4 4 : : : 5 5 5: 6 6 5: 9 6: 6 6: 4 7: TOTAL 45 (.4%) 47 (.%) 49 (.6%) 495 angerous Goods Placards - Hazard Classes TOTAL by Hazard Class Class Class Class Class 4 Class 5 Class 6 Class 7 Class Class 9 ANGER TOTAL 7:-7: 7:-7: 7:-7:.%.%.%.%.%.%.%.%.%.%.%.%.%.%.%.%.%.%.%.%.%.% 5.%.%.% 5.% 66.7%.%.%.% Please note: The total number of placards may differ from the total number of vehicles due to vehicles having more than one placard. Placards where the class number could not be determined are not included in the Hazard Class total. Commercial Truck Volume - Truck Classification 9 TOTAL by Vehicle Class LIGHT TRUCK HEAVY TRUCK TOTALS A B C E F G H X Single rear-axle Tractor Tractor w. Tractor w. Flatbed w. Tractor w. Tanker only chassis container commodity trailer (any) Construction Other HEAVY vs. ALL % HEAVY AM (7:-:) of 4.% M (:-4:) of 7.5% PM (4:-7:) of % 7:-7: %.6%.6% 6.%.% 7.9%.%.%.% 9 of % AM (7:-:) of 5 7.6% M (:-4:) 6 7 of 4 4.5% PM (4:-7:) of 6 6.% 7:-7: %.6%.% 7.6%.7% 6.5%.% 4.%.7% of 49.7% AM (7:-:) of 6 6.% M (:-4:) of 64 6.% PM (4:-7:) of % 7:-7: %.6%.% 6.9%.%.%.%.4%.% 94 of % Light (A) (B to X) B C E TOTAL by Time of ay F G H X % % 4% 6% % % Creative Transportation Solutions Ltd. Project #6- Commercial Vehicle Screenline Surveys
174 , British Columbia Ministry of Transportation, TransLink Screenline : North of Border, entering BC angerous Goods Summary Screenline / Total Hazard Class Station Screenline escription Placards Class Class Class Class 4 Class 5 Class 6 Class 7 Class Class 9 ANGER North of Border, entering BC 5 4. Highway 5 4 Truck Classification Summary Truck Classification Screenline / Station Screenline escription TOTAL TRUCKS LIGHT TRUCKS HEAVY TRUCKS Tractor Only Tractor with Marine Container Chassis Tractor with Marine Container Flatbed / Commodity Tractor with Trailer Tanker Construction Single Unit / Other North of Border, entering BC Highway Table Hwy, north of border 56 angerous Goods and Truck Classification Survey
175 Summary Station Report Station I MONTH/YEAR: March. Highway North of Border, entering BC Screenline Comments: Border crossing did not open until :. AY OF WEEK: Friday Commercial Truck Volume - Non-angerous and angerous Goods All Trucks (veh./ min.) : : 9: : : : : 4: 5: 6: 7: Time Beginning Non-G G Non-G G Non-G G TOTAL 7: 7: : 9 : : : 4 4 : : 7 9 : 6 7 : 5 : 6 7 : 9 : 6 : 4 4: : 6 7 5: : 4 4 6: : 7: TOTAL (.%) 5 7 (4.9%) 7 9 (.%) 6 angerous Goods Placards - Hazard Classes TOTAL by Hazard Class Class Class Class Class 4 Class 5 Class 6 Class 7 Class Class 9 ANGER TOTAL 9 7:-7: 7:-7: 7:-7: %.%.% 5.% 5.% 5.%.% 5.% 4.%.%.%.%.%.%.%.%.%.%.%.%.%.%.%.% 5.%.%.%.%.%.% Please note: The total number of placards may differ from the total number of vehicles due to vehicles having more than one placard. Placards where the class number could not be determined are not included in the Hazard Class total. Commercial Truck Volume - Truck Classification TOTAL by Vehicle Class LIGHT TRUCK HEAVY TRUCK TOTALS A B C E F G H X Single rear-axle Tractor Tractor w. Tractor w. Flatbed w. Tractor w. Tanker only chassis container commodity trailer (any) Construction Other HEAVY vs. ALL % HEAVY AM (7:-:) 6 46 of 4 95.% M (:-4:) of 7 9.% PM (4:-7:) of 6 7.% 7:-7: %.6%.5%.% 7.%.% 9.% 6.%.% 6 of 4 9.% AM (7:-:) of 6 5.% M (:-4:) of 5.4% PM (4:-7:) of.% 7:-7: %.%.% 4.% 4.9%.%.% 5.6% 4.% of 4.% AM (7:-:) of 9 9.9% M (:-4:) of 4 7.9% PM (4:-7:) of 9 4.9% 7:-7: %.%.5%.6% 7.5%.5%.4% 5.%.5% 6 of 6 7.7% Light (A) (B to X) B C E TOTAL by Time of ay F G H X % % 4% 6% % % Creative Transportation Solutions Ltd. Project #6- Commercial Vehicle Screenline Surveys
176 , British Columbia Ministry of Transportation, TransLink Screenline 4: North of Border, entering BC angerous Goods Summary Screenline / Total Hazard Class Station Screenline escription Placards Class Class Class Class 4 Class 5 Class 6 Class 7 Class Class 9 ANGER 4 North of Border, entering BC Highway Truck Classification Summary Truck Classification Screenline / Station Screenline escription TOTAL TRUCKS LIGHT TRUCKS HEAVY TRUCKS Tractor Only Tractor with Marine Container Chassis Tractor with Marine Container Flatbed / Commodity Tractor with Trailer Tanker Construction Single Unit / Other 4 North of Border, entering BC Highway Table Hwy 5, north of border 5 angerous Goods and Truck Classification Survey
177 Summary Station Report Station I MONTH/YEAR: March AY OF WEEK: Friday 4. Comments: Highway 5 North of Border, entering BC Screenline Commercial Truck Volume - Non-angerous and angerous Goods All Trucks (veh./ min.) : : 9: : : : : 4: 5: 6: 7: Time Beginning Non-G G Non-G G Non-G G TOTAL 7: : : : : : : : : : : : : : : : : : : : : TOTAL 6 49 (7.%) (7.9%) (7.5%) 7 angerous Goods Placards - Hazard Classes TOTAL by Hazard Class Class Class Class Class 4 Class 5 Class 6 Class 7 Class Class 9 ANGER TOTAL 9 7:-7: 7:-7: 4.% 4.% 64.%.%.%.%.%.%.%.% 7.% 6.% 6.%.%.%.%.% 4.%.%.% :-7:.%.% 6.6%.%.%.%.%.%.%.% Please note: The total number of placards may differ from the total number of vehicles due to vehicles having more than one placard. Placards where the class number could not be determined are not included in the Hazard Class total. 99 Commercial Truck Volume - Truck Classification LIGHT TRUCK HEAVY TRUCK TOTALS A B C E F G H X Single rear-axle Tractor Tractor w. Tractor w. Flatbed w. Tractor w. Tanker only chassis container commodity trailer (any) Construction Other HEAVY vs. ALL % HEAVY AM (7:-:) of 6.% M (:-4:) of.% PM (4:-7:) of % 7:-7: %.5%.9% 5.4%.6% 47.5% 6.%.5% 7.5% 565 of 6.% AM (7:-:) of 5 4.% M (:-4:) of 9.% PM (4:-7:) 5 5 of 65 7.% 7:-7: %.9%.% 4.4% 5.% 54.%.4%.5%.5% 49 of 59 4.% AM (7:-:) of 47 6.% M (:-4:) of 4 5.4% PM (4:-7:) of 9 7.% 7:-7: %.7%.% 4.9%.% 5.5% 4.9%.5%.9% 6 of 7.5% TOTAL by Vehicle Class Light (A) (B to X) B C E TOTAL by Time of ay F G H X % % 4% 6% % % Creative Transportation Solutions Ltd. Project #6- Commercial Vehicle Screenline Surveys
178 Summary Screenline Report Canada / U.S. Border (Screenlines, and 4) Comments: Commercial Truck Volume - Non-angerous and angerous Goods All Trucks (veh./ min.) : : 9: : : : : 4: 5: 6: 7: Time Beginning Non-G G Non-G G Non-G G TOTAL 7: : : : : : : : : : : 57 4 : : : : : : : : : : TOTAL 5 5 (4.7%) 9 56 (5.7%) 96 (5.%) 94 angerous Goods Placards - Hazard Classes TOTAL by Hazard Class Class Class Class Class 4 Class 5 Class 6 Class 7 Class Class 9 ANGER TOTAL 9 7:-7: 7:-7: 7:-7: %.%.% 4.5%.%.% 6.4% 57.6% 5.9%.%.7%.9%.%.7%.9%.%.%.%.%.%.% 7.5%.6%.7% 5.7%.4% 4.5%.9%.7%.% 5 59 Please note: The total number of placards may differ from the total number of vehicles due to vehicles having more than one placard. Placards where the class number could not be determined are not included in the Hazard Class total. 5 4 Commercial Truck Volume - Truck Classification LIGHT TRUCK HEAVY TRUCK TOTALS A B C E F G H X Single rear-axle Tractor Tractor w. Tractor w. Flatbed w. Tractor w. Tanker only chassis container commodity trailer (any) Construction Other HEAVY vs. ALL % HEAVY AM (7:-:) of 65.% M (:-4:) of 7 5.7% PM (4:-7:) of % 7:-7: %.%.% 6.7% 6.% 6.6% 6.%.%.% 96 of.4% AM (7:-:) of 4 5.% M (:-4:) of 6.% PM (4:-7:) of % 7:-7: %.4%.% 5.% 9.9% 44.7% 4.4%.4%.% 7 of 94.% AM (7:-:) of % M (:-4:) of % PM (4:-7:) of % 7:-7: %.%.% 6.%.% 4.4% 5.%.%.% 74 of 94.% TOTAL by Vehicle Class Light (A) (B to X) B C E TOTAL by Time of ay F G H X % % 4% 6% % % Creative Transportation Solutions Ltd. Project #6- Commercial Vehicle Screenline Surveys

179 , British Columbia Ministry of Transportation, TransLink HOPE SCREENLINE HARRISON LAKE angerous Goods and Truck Classification Survey 6
180 , British Columbia Ministry of Transportation, TransLink Screenline : Entering Fraser Valley (west of Hope) angerous Goods Summary Screenline / Total Hazard Class Station Screenline escription Placards Class Class Class Class 4 Class 5 Class 6 Class 7 Class Class 9 ANGER Entering Fraser Valley (west of Hope) Highway 7. Highway Truck Classification Summary Truck Classification Screenline / Station Screenline escription TOTAL TRUCKS LIGHT TRUCKS HEAVY TRUCKS Tractor Only Tractor with Marine Container Chassis Tractor with Marine Container Flatbed / Commodity Tractor with Trailer Tanker Construction Single Unit / Other Entering Fraser Valley (west of Hope) Highway Highway Table West of Hope 6 angerous Goods and Truck Classification Survey
181 Screenline Comments: Entering Fraser Valley (west of Hope) Summary Screenline Report Commercial Truck Volume - Non-angerous and angerous Goods All Trucks (veh./ min.) : : 9: : : : : 4: 5: 6: 7: Time Beginning Non-G G Non-G G Non-G G TOTAL 7: : : : : : : : : : : : : : : : : : : : : TOTAL 57 (.%) 7 (.4%) 7 69 (.%) 96 angerous Goods Placards - Hazard Classes TOTAL by Hazard Class Class Class Class Class 4 Class 5 Class 6 Class 7 Class Class 9 ANGER TOTAL 7:-7: 7:-7: 7:-7: %.%.% 9.7%.6% 5.% 7.% 55.% 6.%.%.6%.4%.%.%.%.%.%.%.%.%.% 6.%.% 4.5%.%.%.4%.% 6.% 4.5% Please note: The total number of placards may differ from the total number of vehicles due to vehicles having more than one placard. Placards where the class number could not be determined are not included in the Hazard Class total Commercial Truck Volume - Truck Classification LIGHT TRUCK HEAVY TRUCK TOTALS A B C E F G H X Single rear-axle Tractor Tractor w. Tractor w. Flatbed w. Tractor w. Tanker only chassis container commodity trailer (any) Construction Other HEAVY vs. ALL % HEAVY AM (7:-:) of % M (:-4:) of 9 9.7% PM (4:-7:) of 4 9.% 7:-7: %.%.9% 4.7%.% 6.9%.9%.6% 5.% 97 of 9.% AM (7:-:) of 45.% M (:-4:) of 4.6% PM (4:-7:) of 5.9% 7:-7: %.5%.%.4% 7.% 5.%.%.% 9.9% 9 of.5% AM (7:-:) of 6 7.% M (:-4:) of 9.7% PM (4:-7:) of % 7:-7: %.%.5%.% 5.4% 45.%.6%.4% 7.5% 95 of 96.9% TOTAL by Vehicle Class Light (A) (B to X) B C E TOTAL by Time of ay F G H X % % 4% 6% % % Creative Transportation Solutions Ltd. Project #6- Commercial Vehicle Screenline Surveys
182 Summary Station Report Station I MONTH/YEAR: March AY OF WEEK: Thursday. Comments: Highway 7 Entering Fraser Valley (west of Hope) Screenline Commercial Truck Volume - Non-angerous and angerous Goods All Trucks (veh./ min.) : : 9: : : : : 4: 5: 6: 7: Time Beginning Non-G G Non-G G Non-G G TOTAL 7: : 6 9 : : 6 7 9: 6 6 9: : 9 9 : : 9 : 7 : : : : : 4 4 4: 5 5: 4 6 5: : 6: 7: 4 TOTAL (.9%) 4 (.%) 47 (.5%) 49 angerous Goods Placards - Hazard Classes TOTAL by Hazard Class Class Class Class Class 4 Class 5 Class 6 Class 7 Class Class 9 ANGER TOTAL 7:-7:.%.%.%.%.%.%.%.%.%.% 7:-7: 7:-7:.%.%.%.%.%.%.%.%.%.% Please note: The total number of placards may differ from the total number of vehicles due to vehicles having more than one placard. Placards where the class number could not be determined are not included in the Hazard Class total. Commercial Truck Volume - Truck Classification TOTAL by Vehicle Class LIGHT TRUCK HEAVY TRUCK TOTALS A B C E F G H X Single rear-axle Tractor Tractor w. Tractor w. Flatbed w. Tractor w. Tanker only chassis container commodity trailer (any) Construction Other HEAVY vs. ALL % HEAVY AM (7:-:) of 54.9% M (:-4:) of 7 9.4% PM (4:-7:) 5 6 of 9.9% 7:-7: %.%.%.4% 5.%.%.5%.% 47.% 94 of 5 9.% AM (7:-:) of 7.6% M (:-4:) 6 of 5.% PM (4:-7:) of 6 95.% 7:-7: %.5%.%.5% 4.% 5.7%.4%.9%.4% 7 of 4 7.4% AM (7:-:) of 7 5.% M (:-4:) of 5 7.6% PM (4:-7:) of % 7:-7: %.%.%.9% 4.7% 4.5%.9%.% 5.% of 49.% Light (A) (B to X) TOTAL by Time of ay B E F G H % % 4% 6% % % X Creative Transportation Solutions Ltd. Project #6- Commercial Vehicle Screenline Surveys
183 Summary Station Report Station I MONTH/YEAR: March AY OF WEEK: Thursday. Comments: Highway Entering Fraser Valley (west of Hope) Screenline Commercial Truck Volume - Non-angerous and angerous Goods All Trucks (veh./ min.) : : 9: : : : : 4: 5: 6: 7: Time Beginning Non-G G Non-G G Non-G G TOTAL 7: : : : : : 5 45 : : : : 7 44 : : : : : : : : : : : TOTAL 44 9 (.%) 56 (4.%) 7 67 (.%) 767 angerous Goods Placards - Hazard Classes TOTAL by Hazard Class Class Class Class Class 4 Class 5 Class 6 Class 7 Class Class 9 ANGER TOTAL 7:-7: 7:-7: 7:-7: %.%.%.%.6% 6.% 69.% 55.% 6.%.%.6%.5%.%.%.%.%.%.%.%.%.% 7.%.% 4.9%.4%.%.5%.% 6.% 4.9% Please note: The total number of placards may differ from the total number of vehicles due to vehicles having more than one placard. Placards where the class number could not be determined are not included in the Hazard Class total Commercial Truck Volume - Truck Classification LIGHT TRUCK HEAVY TRUCK TOTALS A B C E F G H X Single rear-axle Tractor Tractor w. Tractor w. Flatbed w. Tractor w. Tanker only chassis container commodity trailer (any) Construction Other HEAVY vs. ALL % HEAVY AM (7:-:) of 5.% M (:-4:) of 6 9.% PM (4:-7:) of 4 9.% 7:-7: %.5%.7% 5.5%.5% 4.%.6%.% 9.% 777 of 7 9.% AM (7:-:) of 7 9.% M (:-4:) of 9.5% PM (4:-7:) of 9 7.5% 7:-7: %.4%.%.7%.9% 6.%.6%.6% 6.7% 794 of 94.% AM (7:-:) of % M (:-4:) of % PM (4:-7:) of 6.% 7:-7: %.5%.%.6%.% 5.%.%.4%.% 57 of 767.9% TOTAL by Vehicle Class Light (A) (B to X) B C E TOTAL by Time of ay F G H X % % 4% 6% % % Creative Transportation Solutions Ltd. Project #6- Commercial Vehicle Screenline Surveys
184 , British Columbia Ministry of Transportation, TransLink 66 angerous Goods and Truck Classification Survey

185 , British Columbia Ministry of Transportation, TransLink SEA TO SKY HIGHWAY SCREENLINE HORSESHOE BAY WEST VANCOUVER angerous Goods and Truck Classification Survey 67
186 , British Columbia Ministry of Transportation, TransLink Screenline 9: Highway 99 Sea-to-Sky Highway angerous Goods Summary Screenline / Total Hazard Class Station Screenline escription Placards Class Class Class Class 4 Class 5 Class 6 Class 7 Class Class 9 ANGER 9 Highway 99 Sea-to-Sky Highway South of Squamish Truck Classification Summary Truck Classification Screenline / Station Screenline escription TOTAL TRUCKS LIGHT TRUCKS HEAVY TRUCKS Tractor Only Tractor with Marine Container Chassis Tractor with Marine Container Flatbed / Commodity Tractor with Trailer Tanker Construction Single Unit / Other 9 Highway 99 Sea-to-Sky Highway South of Squamish Table Sea to Sky Hwy 6 angerous Goods and Truck Classification Survey
187 Summary Station Report Station I MONTH/YEAR: March AY OF WEEK: Thursday 9. Comments: South of Squamish Highway 99 Sea-to-Sky Highway Screenline Commercial Truck Volume - Non-angerous and angerous Goods All Trucks (veh./ min.) : : 9: : : : : 4: 5: 6: 7: Time Beginning Non-G G Non-G G Non-G G TOTAL 7: 5 7: 5 : 5 7 : : 7 5 9: 6 : : 6 4 : 7 9 : 4 6 : : 9 7 : 9 : : 4 4: : 5 6 5: 6: 4 6: 7 7: 7 5 TOTAL 9 (5.9%) 7 (7.%) 4 (6.5%) 46 angerous Goods Placards - Hazard Classes TOTAL by Hazard Class Class Class Class Class 4 Class 5 Class 6 Class 7 Class Class 9 ANGER TOTAL 7:-7: % 5.7% 4.9%.%.%.%.% 7.%.% 7.% 4 7:-7: 6.%.% 5.%.%.%.%.% 5.%.% 5.% 6 4 7:-7:.9%.4% 47.%.%.%.%.%.%.% 5.9% Please note: The total number of placards may differ from the total number of vehicles due to vehicles having more than one placard. Placards where the class number could not be determined are not included in the Hazard Class total. 4 Commercial Truck Volume - Truck Classification LIGHT TRUCK HEAVY TRUCK TOTALS A B C E F G H X Single rear-axle Tractor Tractor w. Tractor w. Flatbed w. Tractor w. Tanker only chassis container commodity trailer (any) Construction Other HEAVY vs. ALL % HEAVY AM (7:-:) of % M (:-4:) of 7 5.% PM (4:-7:) of 54 7.% 7:-7: %.%.5%.9% 4.5% 6.% 4.% 4.% 6.7% 9 of 49.% AM (7:-:) of 67 6.% M (:-4:) of 9 6.7% PM (4:-7:) of 4.9% 7:-7: %.%.%.%.%.% 5.%.5%.5% 5 of 4 56.% AM (7:-:) of 6 56.% M (:-4:) of % PM (4:-7:) of 6 4.% 7:-7: %.%.%.9% 4.%.4% 5.%.% 9.7% 44 of 46 5.% TOTAL by Vehicle Class Light (A) (B to X) B C E TOTAL by Time of ay F G H % % 4% 6% % % X Creative Transportation Solutions Ltd. Project #6- Commercial Vehicle Screenline Surveys
188 , British Columbia Ministry of Transportation, TransLink 7 angerous Goods and Truck Classification Survey

189 , British Columbia Ministry of Transportation, TransLink SUPPLEMENTARY COUNT STATIONS VANCOUVER COQUITLAM BURNABY MAPLE RIGE RICHMON SURREY ELTA LANGLEY angerous Goods and Truck Classification Survey 7
190 , British Columbia Ministry of Transportation, TransLink NFPR Stations: North Fraser Perimeter Road angerous Goods Summary Station Station escription Total Hazard Class Placards Class Class Class Class 4 Class 5 Class 6 Class 7 Class Class 9 ANGER NFPR Marine Way, west of Boundary Road 4 9 NFPR Queensborough Bridge NFPR Front Street, between 4th Street and 6th Street NFPR 4 Brunette Avenue, south of Highway NFPR 5 Mary Hill Bypass, east of United Boulevard NFPR 6 Pitt River Bridge Truck Classification Summary Truck Classification Station Station escription TOTAL TRUCKS LIGHT TRUCKS HEAVY TRUCKS Tractor Only Tractor with Marine Container Chassis Tractor with Marine Container Flatbed / Commodity Tractor with Trailer Tanker Construction Single Unit / Other NFPR Marine Way, west of Boundary Road NFPR Queensborough Bridge NFPR Front Street, between 4th Street and 6th Street NFPR 4 Brunette Avenue, south of Highway NFPR 5 Mary Hill Bypass, east of United Boulevard NFPR 6 Pitt River Bridge Table 4 NFPR 7 angerous Goods and Truck Classification Survey
191 Summary Station Report Station I MONTH/YEAR: February AY OF WEEK: Thursday NFPR Comments: Marine Way, west of Boundary Road North Fraser Perimeter Road Commercial Truck Volume - Non-angerous and angerous Goods : : 9: : : : : 4: 5: 6: 7: Time Beginning Non-G G Non-G G Non-G G TOTAL 7: : : 4 5 : : : : 76 5 : : : : : 7 5 : : : 7 5 4: : : : : : TOTAL (.%) (.%) 45 (.4%) 7 angerous Goods Placards - Hazard Classes TOTAL by Hazard Class Class Class Class Class 4 Class 5 Class 6 Class 7 Class Class 9 ANGER TOTAL 7:-7: 6.% 6.% 56.5%.%.%.%.% 4.%.%.% 7:-7: 7:-7: %.% 4.%.6% 6.7% 6.%.%.%.%.%.%.%.%.% 6.7% 5.% 6.7%.6% 4.%.7% Please note: The total number of placards may differ from the total number of vehicles due to vehicles having more than one placard. Placards where the class number could not be determined are not included in the Hazard Class total. 5 9 Commercial Truck Volume - Truck Classification LIGHT TRUCK HEAVY TRUCK TOTALS A B C E F G H X Single rear-axle Tractor Tractor w. Tractor w. Flatbed w. Tractor w. Tanker only chassis container commodity trailer (any) Construction Other HEAVY vs. ALL % HEAVY AM (7:-:) of % M (:-4:) of % PM (4:-7:) of 5.% 7:-7: %.%.5%.%.6%.%.4%.%.% 67 of % AM (7:-:) of 6 4.7% M (:-4:) of % PM (4:-7:) of 4.% 7:-7: %.6%.7%.4%.%.4%.4%.5% 9.% 44 of 4.% AM (7:-:) of 5 5.% M (:-4:) of 4 4.4% PM (4:-7:) of % 7:-7: %.9%.%.9%.%.7%.9%.% 4.% 4 of 7 4.9% TOTAL by Vehicle Class Light (A) (B to X) B C E TOTAL by Time of ay F G H % % 4% 6% % % X Creative Transportation Solutions Ltd. Project #6- Commercial Vehicle Screenline Surveys
192 Station I NFPR Comments: Queensborough Bridge North Fraser Perimeter Road Summary Station Report -AY AVERAGE Commercial Truck Volume - Non-angerous and angerous Goods : : 9: : : : : 4: 5: 6: 7: Time Beginning Non-G G Non-G G Non-G G TOTAL 7: : : : : : : : : : : : : : : : : : : : : TOTAL (.9%) (.%) 54 (.9%) 5956 angerous Goods Placards - Hazard Classes TOTAL by Hazard Class Class Class Class Class 4 Class 5 Class 6 Class 7 Class Class 9 ANGER TOTAL 7:-7: 4 4.6% 9.9% 9.9%.6%.%.%.%.7%.6% 5.5% 79 7:-7: 7:-7: %.4%.5%.%.%.4%.%.7%.%.%.%.%.%.% 6.7%.%.%.7% 5.% 5.6% Please note: The total number of placards may differ from the total number of vehicles due to vehicles having more than one placard. Placards where the class number could not be determined are not included in the Hazard Class total Commercial Truck Volume - Truck Classification LIGHT TRUCK HEAVY TRUCK TOTALS A B C E F G H X Single rear-axle Tractor Tractor w. Tractor w. Flatbed w. Tractor w. Tanker only chassis container commodity trailer (any) Construction Other HEAVY vs. ALL % HEAVY AM (7:-:) of % M (:-4:) of % PM (4:-7:) of % 7:-7: % 5.5%.4% 9.% 4.5% 9.%.% 7.4%.% 9 of % AM (7:-:) of 6 6.% M (:-4:) of 7 6.% PM (4:-7:) of % 7:-7: % 5.4%.5% 4.% 4.5% 5.7%.4% 7.%.% 65 of 67 6.% AM (7:-:) of % M (:-4:) of 4 6.% PM (4:-7:) of % 7:-7: % 5.5%.5%.6% 4.5% 7.6%.% 7.5% 9.7% 54 of % TOTAL by Vehicle Class Light (A) (B to X) B C E TOTAL by Time of ay F G H X % % 4% 6% % % Creative Transportation Solutions Ltd. Project #6- Commercial Vehicle Screenline Surveys
193 Summary Station Report Front Street, between 4th Street and 6th Street NFPR North Fraser Perimeter Road Station I MONTH/YEAR: March Comments: angerous goods were not surveyed at this location. Commercial Truck Volume AY OF WEEK: Monday All Trucks (veh./ min.) : : 9: : : : : 4: 5: 6: 7: Time Beginning 7: : : : : : : : : : 76 6 : 6 5 : : : 6 6 4: : : : : : : TOTAL TOTAL Commercial Truck Volume - Truck Classification TOTAL by Vehicle Class LIGHT TRUCK HEAVY TRUCK A B C E F G H X Tractor Tractor w. Tractor w. Flatbed w. Tractor w. Tanker Single rear-axle Construction Other only chassis container commodity trailer (any) HEAVY vs. ALL TOTALS % HEAVY B C E AM (7:-:) of % M (:-4:) of % PM (4:-7:) of 4.6% 7:-7: % 7.%.6%.%.9%.5%.6% 5.4%.% 9 of % AM (7:-:) of % M (:-4:) of % PM (4:-7:) of 4 76.% 7:-7: % 7.%.%.% 4.% 9.7%.% 4.%.4% of % AM (7:-:) of % M (:-4:) of 6 7.5% PM (4:-7:) of % 7:-7: % 7.%.%.7%.%.6%.9% 5.%.% 5 of % Light (A) (B to X) TOTAL by Time of ay F G H X % % 4% 6% % % Creative Transportation Solutions Ltd. Project #6- Commercial Vehicle Screenline Surveys
194 Station I NFPR 4 Comments: Brunette Avenue, south of Highway North Fraser Perimeter Road Summary Station Report -AY AVERAGE Commercial Truck Volume - Non-angerous and angerous Goods : : 9: : : : : 4: 5: 6: 7: Time Beginning Non-G G Non-G G Non-G G TOTAL 7: : : : : : : : : : : : : : : : 9 5: : : : : 7 9 TOTAL 9 5 (.7%) 46 (.%) (.%) 5 angerous Goods Placards - Hazard Classes TOTAL by Hazard Class Class Class Class Class 4 Class 5 Class 6 Class 7 Class Class 9 ANGER TOTAL 7:-7: % 7.4% 9.%.9%.9%.%.9% 7.7%.%.% 59 7:-7: 7:-7: %.%.% 5.% 5.% 44.7%.%.5%.%.9%.%.%.%.5%.% 7.%.%.4% 4.%.9% Please note: The total number of placards may differ from the total number of vehicles due to vehicles having more than one placard. Placards where the class number could not be determined are not included in the Hazard Class total Commercial Truck Volume - Truck Classification LIGHT TRUCK HEAVY TRUCK TOTALS A B C E F G H X Single rear-axle Tractor Tractor w. Tractor w. Flatbed w. Tractor w. Tanker only chassis container commodity trailer (any) Construction Other HEAVY vs. ALL % HEAVY AM (7:-:) of 5 6.% M (:-4:) of 7 7.% PM (4:-7:) of % 7:-7: % 6.% 5.% 6.6%.7%.%.% 4.9% 4.% of % AM (7:-:) of % M (:-4:) of % PM (4:-7:) of % 7:-7: % 6.% 4.7% 9.%.9%.7%.6% 7.%.7% 65 of % AM (7:-:) of 7.% M (:-4:) of % PM (4:-7:) of 6 7.6% 7:-7: % 6.% 5.%.%.%.%.4% 5.%.% 74 of 5 7.4% TOTAL by Vehicle Class Light (A) (B to X) B C E TOTAL by Time of ay F G H X % % 4% 6% % % Creative Transportation Solutions Ltd. Project #6- Commercial Vehicle Screenline Surveys
195 Summary Station Report Station I MONTH/YEAR: May AY OF WEEK: Tuesday NFPR 5 Comments: Mary Hill Bypass, east of United Boulevard North Fraser Perimeter Road Commercial Truck Volume - Non-angerous and angerous Goods All Trucks (veh./ min.) : : 9: : : : : 4: 5: 6: 7: Time Beginning Non-G G Non-G G Non-G G TOTAL 7: : : : : : : : : : : : : : : : : : : : : TOTAL 9 54 (.5%) 4 5 (.4%) 4 5 (.4%) 47 angerous Goods Placards - Hazard Classes TOTAL by Hazard Class Class Class Class Class 4 Class 5 Class 6 Class 7 Class Class 9 ANGER TOTAL 7:-7: 7:-7: 7:-7: %.%.%.%.%.9% 65.5% 56.% 6.9%.7%.%.9%.%.%.%.%.%.%.%.%.% 5.%.5% 7.%.%.%.%.% 5.% 9.6% Please note: The total number of placards may differ from the total number of vehicles due to vehicles having more than one placard. Placards where the class number could not be determined are not included in the Hazard Class total. Commercial Truck Volume - Truck Classification 4 TOTAL by Vehicle Class LIGHT TRUCK HEAVY TRUCK TOTALS A B C E F G H X Single rear-axle Tractor Tractor w. Tractor w. Flatbed w. Tractor w. Tanker only chassis container commodity trailer (any) Construction Other HEAVY vs. ALL % HEAVY AM (7:-:) of % M (:-4:) of % PM (4:-7:) of % 7:-7: % 6.%.7%.% 5.4%.4%.4%.% 5.9% 4 of 5 65.% AM (7:-:) of 77 6.% M (:-4:) of % PM (4:-7:) of % 7:-7: % 4.4%.9%.%.6% 5.%.5%.% 4.4% 5 of 5 6.% AM (7:-:) of % M (:-4:) of % PM (4:-7:) of 4 6.4% 7:-7: % 5.%.% 5.7% 4.5% 6.%.9%.5% 5.% 76 of % Light (A) (B to X) B C TOTAL by Time of ay E F G H X % % 4% 6% % % Creative Transportation Solutions Ltd. Project #6- Commercial Vehicle Screenline Surveys
196 Station I NFPR 6 Comments: Pitt River Bridge North Fraser Perimeter Road Summary Station Report -AY AVERAGE Commercial Truck Volume - Non-angerous and angerous Goods 6 4 7: : 9: : : : : 4: 5: 6: 7: Time Beginning Non-G G Non-G G Non-G G TOTAL 7: : 4 7 : : : : : : : : 4 5 : : : : : : : : : 5 4 6: : TOTAL (.6%) 47 4 (.%) (.4%) 9 angerous Goods Placards - Hazard Classes TOTAL by Hazard Class Class Class Class Class 4 Class 5 Class 6 Class 7 Class Class 9 ANGER TOTAL 7:-7: 7:-7: %.% 5.%.%.%.%.% 5.%.%.% % 7.6% 59.5%.%.%.%.% 9.5%.%.5% :-7:.6%.6% 55.%.%.%.%.% 6.9%.6%.% Please note: The total number of placards may differ from the total number of vehicles due to vehicles having more than one placard. Placards where the class number could not be determined are not included in the Hazard Class total. 7 Commercial Truck Volume - Truck Classification LIGHT TRUCK HEAVY TRUCK TOTALS A B C E F G H X Single rear-axle Tractor Tractor w. Tractor w. Flatbed w. Tractor w. Tanker only chassis container commodity trailer (any) Construction Other HEAVY vs. ALL % HEAVY AM (7:-:) of % M (:-4:) of % PM (4:-7:) of 4 57.% 7:-7: %.%.9%.9% 4.% 7.%.%.% 9.6% 97 of 5 6.4% AM (7:-:) of 49 6.% M (:-4:) of 6 66.% PM (4:-7:) of 6 6.% 7:-7: % 5.% 4.%.9%.%.4%.% 9.%.9% 957 of % AM (7:-:) of % M (:-4:) of 5 64.% PM (4:-7:) of 9 59.% 7:-7: % 4.%.%.9%.4% 7.7%.9%.% 9.% 99 of 9 6.6% TOTAL by Vehicle Class Light (A) (B to X) B C E F G H TOTAL by Time of ay % % 4% 6% % % X Creative Transportation Solutions Ltd. Project #6- Commercial Vehicle Screenline Surveys
197 , British Columbia Ministry of Transportation, TransLink angerous Goods and Truck Classification Survey 79
198 , British Columbia Ministry of Transportation, TransLink SFPR Stations: South Fraser Perimeter Road angerous Goods Summary Station Station escription Total Hazard Class Placards Class Class Class Class 4 Class 5 Class 6 Class 7 Class Class 9 ANGER SFPR Highway 7, south of Ladner Trunk Road 5 9 SFPR River Road / 6B Street, north of Highway SFPR River Road, west of Nordel Way SFPR 4 River Road, east of Nordel Way 5 9 SFPR 5 Nordel Way, east of Highway SFPR 6 th Street, north of Tannery Road SFPR 7 South Fraser Way, south of Tannery Road 46 9 SFPR 76th Street, north of Highway 9 4 Truck Classification Summary Truck Classification Station Station escription TOTAL TRUCKS LIGHT TRUCKS HEAVY TRUCKS Tractor Only Tractor with Marine Container Chassis Tractor with Marine Container Flatbed / Commodity Tractor with Trailer Tanker Construction Single Unit / Other SFPR Highway 7, south of Ladner Trunk Road SFPR River Road / 6B Street, north of Highway SFPR River Road, west of Nordel Way SFPR 4 River Road, east of Nordel Way SFPR 5 Nordel Way, east of Highway SFPR 6 th Street, north of Tannery Road SFPR 7 South Fraser Way, south of Tannery Road SFPR 76th Street, north of Highway Table 5 SFPR angerous Goods and Truck Classification Survey
199 Summary Station Report Station I MONTH/YEAR: April AY OF WEEK: Tuesday SFPR Comments: Highway 7, south of Ladner Trunk Road South Fraser Perimeter Road Commercial Truck Volume - Non-angerous and angerous Goods All Trucks (veh./ min.) : : 9: : : : : 4: 5: 6: 7: Time Beginning Non-G G Non-G G Non-G G TOTAL 7: : 5 : : : : : : : 9 9 : : 5 4 : : : : : : : : : : 6 6 TOTAL 45 7 (.%) (.4%) 7 4 (.%) 4 angerous Goods Placards - Hazard Classes TOTAL by Hazard Class Class Class Class Class 4 Class 5 Class 6 Class 7 Class Class 9 ANGER TOTAL 7:-7: 7:-7: 7:-7: %.%.%.% 57.% 4.%.% 4.9% 6.%.%.%.% 5.6%.% 4.%.%.%.%.%.%.%.%.%.%.%.%.% 6.7%.%.% 7 5 Please note: The total number of placards may differ from the total number of vehicles due to vehicles having more than one placard. Placards where the class number could not be determined are not included in the Hazard Class total. 9 5 Commercial Truck Volume - Truck Classification LIGHT TRUCK HEAVY TRUCK TOTALS A B C E F G H X Single rear-axle Tractor Tractor w. Tractor w. Flatbed w. Tractor w. Tanker only chassis container commodity trailer (any) Construction Other HEAVY vs. ALL % HEAVY AM (7:-:) of 447.7% M (:-4:) of 554.7% PM (4:-7:) of 46 4.% 7:-7: %.% 7.6%.6%.4% 7.%.4% 6.% 4.% 5 of 469.7% AM (7:-:) of % M (:-4:) of % PM (4:-7:) of 7 79.% 7:-7: %.% 5.6% 5.7% 4.% 5.%.4% 4.%.% of 57.4% AM (7:-:) of 4.% M (:-4:) of.% PM (4:-7:) of 795.% 7:-7: %.% 6.6% 4.7%.% 6.%.9% 5.%.9% 495 of 4.% Light (A) TOTAL by Vehicle Class (B to X) B C TOTAL by Time of ay E F G H X % % 4% 6% % % Creative Transportation Solutions Ltd. Project #6- Commercial Vehicle Screenline Surveys
200 Summary Station Report Station I MONTH/YEAR: May AY OF WEEK: Wednesday SFPR Comments: River Road / 6B Street, north of Highway 99 South Fraser Perimeter Road Commercial Truck Volume - Non-angerous and angerous Goods All Trucks (veh./ min.) : : 9: : : : : 4: 5: 6: 7: Time Beginning Non-G G Non-G G Non-G G TOTAL 7: : : 4 4 : : : : 5 7 : : : : 6 6 : : : 5 6 4: : 4 5 5: : : : : TOTAL 6 (.9%) (.%) 4 4 (.%) 46 angerous Goods Placards - Hazard Classes TOTAL by Hazard Class Class Class Class Class 4 Class 5 Class 6 Class 7 Class Class 9 ANGER TOTAL :-7: 4.%.4%.%.%.% 6.%.%.%.7% 7.4% 7:-7: 7:-7: %.7%.%.5% 5.%.4%.%.9%.%.9%.%.%.%.% 9.7% 5.6%.% 5.6% 9.4%.5% Please note: The total number of placards may differ from the total number of vehicles due to vehicles having more than one placard. Placards where the class number could not be determined are not included in the Hazard Class total Commercial Truck Volume - Truck Classification LIGHT TRUCK HEAVY TRUCK TOTALS A B C E F G H X Single rear-axle Tractor Tractor w. Tractor w. Flatbed w. Tractor w. Tanker only chassis container commodity trailer (any) Construction Other HEAVY vs. ALL % HEAVY AM (7:-:) of 647.% M (:-4:) of % PM (4:-7:) of % 7:-7: % 4.%.4%.%.4% 9.5%.%.% 6.% 66 of 6 7.9% AM (7:-:) of 7.% M (:-4:) of 7.4% PM (4:-7:) of % 7:-7: %.7%.5%.6%.5%.4%.9% 5.4%.% 66 of 7.% AM (7:-:) of % M (:-4:) of % PM (4:-7:) of 7.% 7:-7: %.4%.%.5%.9%.4%.5%.%.% of % Light (A) TOTAL by Vehicle Class (B to X) B C TOTAL by Time of ay E F G H % % 4% 6% % % X Creative Transportation Solutions Ltd. Project #6- Commercial Vehicle Screenline Surveys
201 Station I SFPR Comments: River Road, west of Nordel Way South Fraser Perimeter Road Summary Station Report -AY AVERAGE Commercial Truck Volume - Non-angerous and angerous Goods All Trucks (veh./ min.) : : 9: : : : : 4: 5: 6: 7: Time Beginning Non-G G Non-G G Non-G G TOTAL 7: : : : 9 7 9: : : : : : : 4 5 : 5 : : : : : : : : : TOTAL 4 (.6%) 4 (.%) (.%) 4 angerous Goods Placards - Hazard Classes TOTAL by Hazard Class Class Class Class Class 4 Class 5 Class 6 Class 7 Class Class 9 ANGER TOTAL 7:-7: 7:-7: 4.% 6.% 9.7%.%.6%.%.%.9%.6%.6% 5 6.% 4.5% 7.7%.%.%.%.% 9.6%.%.% :-7:.6%.% 4.%.6%.%.%.6% 7.%.9%.4% Please note: The total number of placards may differ from the total number of vehicles due to vehicles having more than one placard. Placards where the class number could not be determined are not included in the Hazard Class total Commercial Truck Volume - Truck Classification LIGHT TRUCK HEAVY TRUCK TOTALS A B C E F G H X Single rear-axle Tractor Tractor w. Tractor w. Flatbed w. Tractor w. Tanker only chassis container commodity trailer (any) Construction Other HEAVY vs. ALL % HEAVY AM (7:-:) of % M (:-4:) of 76 7.% PM (4:-7:) of 6 76.% 7:-7: % 9.%.5% 6.9% 4.6% 5.4%.%.% 7.9% 57 of % AM (7:-:) of % M (:-4:) of % PM (4:-7:) of 5 7.4% 7:-7: % 7.6% 6.5%.% 4.% 5.%.5%.7%.6% 4 of 5 7.% AM (7:-:) of % M (:-4:) of % PM (4:-7:) of 75.% 7:-7: %.4% 9.%.5% 4.4% 5.%.% 9.%.% 54 of 4 74.% TOTAL by Vehicle Class Light (A) (B to X) B C E TOTAL by Time of ay F G H X % % 4% 6% % % Creative Transportation Solutions Ltd. Project #6- Commercial Vehicle Screenline Surveys
202 Summary Station Report Station I MONTH/YEAR: May AY OF WEEK: Wednesday SFPR 4 Comments: River Road, east of Nordel Way South Fraser Perimeter Road Commercial Truck Volume - Non-angerous and angerous Goods 6 4 7: : 9: : : : : 4: 5: 6: 7: Time Beginning Non-G G Non-G G Non-G G TOTAL 7: 5 6 7: : : : : : : : : : : : : : : : : : : : TOTAL 54 (.%) 5 7 (.7%) 4 45 (.5%) 7 angerous Goods Placards - Hazard Classes TOTAL by Hazard Class Class Class Class Class 4 Class 5 Class 6 Class 7 Class Class 9 ANGER TOTAL 7:-7: 7:-7: 7:-7: %.%.% 4.9% 4.4% 7.7%.% 4.6% 9.6%.%.%.%.%.%.%.%.%.%.%.%.% 4.% 6.% 5.7%.%.%.% 4.%.% 7.% 5 Please note: The total number of placards may differ from the total number of vehicles due to vehicles having more than one placard. Placards where the class number could not be determined are not included in the Hazard Class total. Commercial Truck Volume - Truck Classification LIGHT TRUCK HEAVY TRUCK TOTALS A B C E F G H X Single rear-axle Tractor Tractor w. Tractor w. Flatbed w. Tractor w. Tanker only chassis container commodity trailer (any) Construction Other HEAVY vs. ALL % HEAVY AM (7:-:) of 4 7.% M (:-4:) of % PM (4:-7:) of 445.4% 7:-7: % 9.% 4.5%.7% 4.7% 5.5%.% 7.%.% 9 of 54 4.% AM (7:-:) of % M (:-4:) of 56.9% PM (4:-7:) of 4.% 7:-7: % 5.9% 7.% 4.4% 5.%.9%.% 6.9% 9.% 96 of 545.9% AM (7:-:) of 7 5.7% M (:-4:) of 75.7% PM (4:-7:) of 5.% 7:-7: % 7.5%.9%.% 4.9% 4.7%.% 7.4% 9.6% 594 of 7 4.% Light (A) TOTAL by Vehicle Class (B to X) TOTAL by Time of ay B C E F G H % % 4% 6% % % X Creative Transportation Solutions Ltd. Project #6- Commercial Vehicle Screenline Surveys
203 Summary Station Report Station I MONTH/YEAR: May AY OF WEEK: Wednesday SFPR 5 Comments: Nordel Way, east of Highway 9 South Fraser Perimeter Road Commercial Truck Volume - Non-angerous and angerous Goods 6 4 7: : 9: : : : : 4: 5: 6: 7: Time Beginning Non-G G Non-G G Non-G G TOTAL 7: : : 5 5 : : : : : : : : 59 7 : : : : : : : : : : TOTAL 5 4 (.%) 566 (.%) 6 (.%) 7 angerous Goods Placards - Hazard Classes TOTAL by Hazard Class Class Class Class Class 4 Class 5 Class 6 Class 7 Class Class 9 ANGER TOTAL 7:-7: 7:-7: 7:-7: %.%.% 7.%.%.% 6.7% 9.5%.%.%.%.% 5.6% 4.% 5.%.%.%.%.%.%.%.% 9.% 5.4%.%.%.%.9%.% 5.9% 9 Please note: The total number of placards may differ from the total number of vehicles due to vehicles having more than one placard. Placards where the class number could not be determined are not included in the Hazard Class total. 5 Commercial Truck Volume - Truck Classification LIGHT TRUCK HEAVY TRUCK TOTALS A B C E F G H X Single rear-axle Tractor Tractor w. Tractor w. Flatbed w. Tractor w. Tanker only chassis container commodity trailer (any) Construction Other HEAVY vs. ALL % HEAVY AM (7:-:) of 7 9.% M (:-4:) of 99 5.% PM (4:-7:) of % 7:-7: %.7%.5%.7%.9%.4%.% 6.5% 9.% 5 of % AM (7:-:) of % M (:-4:) of 5 6.% PM (4:-7:) of 7 5.% 7:-7: %.%.% 9.7% 7.% 4.%.5% 4.7% 9.6% 95 of % AM (7:-:) of % M (:-4:) of 9 57.% PM (4:-7:) of % 7:-7: %.%.% 7.% 5.%.%.4% 5.4% 9.4% 45 of 7 5.5% Light (A) TOTAL by Vehicle Class (B to X) B C E TOTAL by Time of ay F G H X % % 4% 6% % % Creative Transportation Solutions Ltd. Project #6- Commercial Vehicle Screenline Surveys
204 Summary Station Report Station I MONTH/YEAR: May AY OF WEEK: Wednesday SFPR 6 Comments: th Street, north of Tannery Road South Fraser Perimeter Road Commercial Truck Volume - Non-angerous and angerous Goods 6 4 7: : 9: : : : : 4: 5: 6: 7: Time Beginning Non-G G Non-G G Non-G G TOTAL 7: : : : : : : : : : : : : : : : : : : : : TOTAL 44 5 (.%) 5 47 (.%) (.%) 7 angerous Goods Placards - Hazard Classes TOTAL by Hazard Class Class Class Class Class 4 Class 5 Class 6 Class 7 Class Class 9 ANGER TOTAL 9 7:-7: 7:-7: 7:-7: %.%.%.%.9%.9% 56.% 5.% 57.%.%.%.% 6.%.%.6%.%.%.%.%.%.%.5%.5%.5%.%.%.6% 6.% 4.% 4.7% Please note: The total number of placards may differ from the total number of vehicles due to vehicles having more than one placard. Placards where the class number could not be determined are not included in the Hazard Class total. 5 Commercial Truck Volume - Truck Classification LIGHT TRUCK HEAVY TRUCK TOTALS A B C E F G H X Single rear-axle Tractor Tractor w. Tractor w. Flatbed w. Tractor w. Tanker only chassis container commodity trailer (any) Construction Other HEAVY vs. ALL % HEAVY AM (7:-:) of % M (:-4:) of 55.% PM (4:-7:) of 7.9% 7:-7: %.4% 6.% 7.% 4.6%.%.%.%.6% 9 of % AM (7:-:) of 5 7.6% M (:-4:) of % PM (4:-7:) of % 7:-7: % 7.4% 5.% 9.7%.4%.%.%.6%.% of 57 7.% AM (7:-:) of 6 7.6% M (:-4:) of 77.% PM (4:-7:) of % 7:-7: %.9% 5.6%.%.5%.%.%.9%.7% 6 of 7 7.% Light (A) TOTAL by Vehicle Class (B to X) B C E TOTAL by Time of ay F G H % % 4% 6% % % X Creative Transportation Solutions Ltd. Project #6- Commercial Vehicle Screenline Surveys
205 Summary Station Report Station I MONTH/YEAR: May AY OF WEEK: Wednesday SFPR 7 Comments: South Fraser Way, south of Tannery Road South Fraser Perimeter Road Commercial Truck Volume - Non-angerous and angerous Goods 6 4 7: : 9: : : : : 4: 5: 6: 7: Time Beginning Non-G G Non-G G Non-G G TOTAL 7: 7 7: : : : : : : : : 9 7 : : : : : : : 7 4 5: : : : TOTAL 45 9 (.%) 45 (.4%) 9 (.%) 9 angerous Goods Placards - Hazard Classes TOTAL by Hazard Class Class Class Class Class 4 Class 5 Class 6 Class 7 Class Class 9 ANGER TOTAL 7:-7: 7:-7: 7:-7: %.%.% 6.%.% 9.6% 47.% 47.% 47.%.%.%.%.%.%.% 4.%.%.%.%.%.% 4.% 4.% 4.%.% 4.%.% 7.4%.4%.9% 46 Please note: The total number of placards may differ from the total number of vehicles due to vehicles having more than one placard. Placards where the class number could not be determined are not included in the Hazard Class total. 9 6 Commercial Truck Volume - Truck Classification LIGHT TRUCK HEAVY TRUCK TOTALS A B C E F G H X Single rear-axle Tractor Tractor w. Tractor w. Flatbed w. Tractor w. Tanker only chassis container commodity trailer (any) Construction Other HEAVY vs. ALL % HEAVY AM (7:-:) of 44.9% M (:-4:) of 5 7.% PM (4:-7:) of 4 4.% 7:-7: % 7.5%.4% 6.9% 7.%.%.%.%.4% 55 of % AM (7:-:) of % M (:-4:) of 5 6.4% PM (4:-7:) of.% 7:-7: % 7.% 7.%.%.5%.7%.7%.% 9.9% 59 of 47 5.% AM (7:-:) of 7.% M (:-4:) of 6 6.% PM (4:-7:) of 75.% 7:-7: % 7.4%.%.5% 5.%.5%.%.% 9.% 54 of 9 6.% Light (A) TOTAL by Vehicle Class (B to X) B C TOTAL by Time of ay E F G H X % % 4% 6% % % Creative Transportation Solutions Ltd. Project #6- Commercial Vehicle Screenline Surveys
206 Summary Station Report Station I MONTH/YEAR: May AY OF WEEK: Thursday SFPR Comments: 76th Street, north of Highway South Fraser Perimeter Road Commercial Truck Volume - Non-angerous and angerous Goods : : 9: : : : : 4: 5: 6: 7: Time Beginning Non-G G Non-G G Non-G G TOTAL 7: : : 5 5 : : : : : 5 5 : : 56 5 : : : : : : 5 5 5: : 5 5 6: : 7 4 7: TOTAL 6 9 (.5%) 56 (.6%) 6 7 (.5%) angerous Goods Placards - Hazard Classes TOTAL by Hazard Class Class Class Class Class 4 Class 5 Class 6 Class 7 Class Class 9 ANGER TOTAL 4 7:-7:.% 6.4% 9.%.%.%.%.% 7.%.% 9.% 7:-7: 7:-7: %.% 5.% 4.9%.% 9.5%.%.%.% 4.%.%.%.%.%.% 4.%.% 9.5%.% 9.% Please note: The total number of placards may differ from the total number of vehicles due to vehicles having more than one placard. Placards where the class number could not be determined are not included in the Hazard Class total. 9 5 Commercial Truck Volume - Truck Classification LIGHT TRUCK HEAVY TRUCK TOTALS A B C E F G H X Single rear-axle Tractor Tractor w. Tractor w. Flatbed w. Tractor w. Tanker only chassis container commodity trailer (any) Construction Other HEAVY vs. ALL % HEAVY AM (7:-:) of % M (:-4:) of 7.% PM (4:-7:) of.9% 7:-7: %.4%.% 4.%.% 4.%.5% 6.6%.% 45 of % AM (7:-:) of 65 9.% M (:-4:) of.7% PM (4:-7:) of 69 5.% 7:-7: % 7.%.5% 4.9% 5.6% 4.9%.4% 7.% 7.% 49 of % AM (7:-:) of 59 7.% M (:-4:) of 4 76.% PM (4:-7:) of 5.% 7:-7: % 5.% 6.%.%.7% 4.%.4% 7.%.7% 9 of 79.% Light (A) TOTAL by Vehicle Class (B to X) B C TOTAL by Time of ay E F G H X % % 4% 6% % % Creative Transportation Solutions Ltd. Project #6- Commercial Vehicle Screenline Surveys
207 , British Columbia Ministry of Transportation, TransLink angerous Goods and Truck Classification Survey 9
208 , British Columbia Ministry of Transportation, TransLink SPEC Stations: Special Locations angerous Goods Summary Station Station escription Total Hazard Class Placards Class Class Class Class 4 Class 5 Class 6 Class 7 Class Class 9 ANGER SPEC nd Avenue, west of 4th Street 6 SPEC th Avenue, between Highway 99 & Highway SPEC No. 5 Road & Steveston Highway SPEC 4 Commissioner Street, west of Rupert Street Truck Classification Summary Truck Classification Station Station escription TOTAL TRUCKS LIGHT TRUCKS HEAVY TRUCKS Tractor Only Tractor with Marine Container Chassis Tractor with Marine Container Flatbed / Commodity Tractor with Trailer Tanker Construction Single Unit / Other SPEC nd Avenue, west of 4th Street SPEC th Avenue, between Highway 99 & Highway SPEC No. 5 Road & Steveston Highway SPEC 4 Commissioner Street, west of Rupert Street Table 6 SPEC 9 angerous Goods and Truck Classification Survey
209 Summary Station Report Station I MONTH/YEAR: May AY OF WEEK: Thursday SPEC Comments: nd Avenue, west of 4th Street Special Location Commercial Truck Volume - Non-angerous and angerous Goods All Trucks (veh./ min.) : : 9: : : : : 4: 5: 6: 7: Time Beginning Non-G G Non-G G Non-G G TOTAL 7: : : : : : 5 5 : : 5 5 : : : : : : : : : : : : : TOTAL 5 6 (.%) (.7%) 77 (.9%) 7 angerous Goods Placards - Hazard Classes TOTAL by Hazard Class Class Class Class Class 4 Class 5 Class 6 Class 7 Class Class 9 ANGER TOTAL 7:-7:.% 5.% 7.5%.%.%.%.%.5%.% 5.% 7:-7: 7:-7: 6.%.%.%.% 6.% 46.%.%.%.%.%.%.%.%.%.% 7.7%.%.%.%.% Please note: The total number of placards may differ from the total number of vehicles due to vehicles having more than one placard. Placards where the class number could not be determined are not included in the Hazard Class total. 5 Commercial Truck Volume - Truck Classification LIGHT TRUCK HEAVY TRUCK TOTALS A B C E F G H X Single rear-axle Tractor Tractor w. Tractor w. Flatbed w. Tractor w. Tanker only chassis container commodity trailer (any) Construction Other HEAVY vs. ALL % HEAVY AM (7:-:) of % M (:-4:) of 74 6.% PM (4:-7:) of 9 6.% 7:-7: %.%.4%.%.9%.5%.% 4.%.% of % AM (7:-:) 9 9 of 57.% M (:-4:) of % PM (4:-7:) of 75.4% 7:-7: %.9%.%.% 4.6% 7.7%.7% 44.7%.% 7 of % AM (7:-:) of % M (:-4:) of 7 6.4% PM (4:-7:) of % 7:-7: %.6%.%.% 4.%.%.5% 4.% 9.4% 77 of 7 65.% Light (A) TOTAL by Vehicle Class (B to X) B C E TOTAL by Time of ay F G % % 4% 6% % % H X Creative Transportation Solutions Ltd. Project #6- Commercial Vehicle Screenline Surveys
210 Summary Station Report Station I MONTH/YEAR: May AY OF WEEK: Thursday SPEC Comments: th Avenue, between Highway 99 & Highway 5 Special Location Commercial Truck Volume - Non-angerous and angerous Goods : : 9: : : : : 4: 5: 6: 7: Time Beginning Non-G G Non-G G Non-G G TOTAL 7: : 44 5 : : : : : : : : : : : : 5 6 4: : 4 4 5: : : 4 7 6: : TOTAL (5.6%) (4.%) (5.%) 75 angerous Goods Placards - Hazard Classes TOTAL by Hazard Class Class Class Class Class 4 Class 5 Class 6 Class 7 Class Class 9 ANGER TOTAL 9 7:-7: 7:-7: 7:-7: %.%.% 9.6% 9.% 4.5% 76.% 6.5% 69.%.%.%.%.%.%.%.%.%.%.%.%.%.% 4.%.%.% 4.%.%.%.%.% Please note: The total number of placards may differ from the total number of vehicles due to vehicles having more than one placard. Placards where the class number could not be determined are not included in the Hazard Class total. Commercial Truck Volume - Truck Classification TOTAL by Vehicle Class LIGHT TRUCK HEAVY TRUCK TOTALS A B C E F G H X Single rear-axle Tractor Tractor w. Tractor w. Flatbed w. Tractor w. Tanker only chassis container commodity trailer (any) Construction Other HEAVY vs. ALL % HEAVY AM (7:-:) of 6 4.6% M (:-4:) of % PM (4:-7:) of % 7:-7: %.5%.4% 6.% 6.6% 7.% 6.9%.% 9.% 69 of % AM (7:-:) of 55.6% M (:-4:) of 4.% PM (4:-7:) of 94 5.% 7:-7: %.6%.7% 6.7%.6% 6.% 5.%.5%.% 6 of 97.% AM (7:-:) of 65.% M (:-4:) of % PM (4:-7:) of 555.4% 7:-7: %.6%.6% 6.4% 9.4% 6.9% 6.%.6%.6% 45 of 75.% Light (A) (B to X) B C E TOTAL by Time of ay F G H X % % 4% 6% % % Creative Transportation Solutions Ltd. Project #6- Commercial Vehicle Screenline Surveys
211 Summary Station Report Station I MONTH/YEAR: April SPEC No. 5 Road & Steveston Highway Special Location Comments: Work being conducted on traffic lights resulted in them being turned off at times throughout the day. AY OF WEEK: Wednesday Commercial Truck Volume - Non-angerous and angerous Goods 6 4 7: : 9: : : : : 4: 5: 6: 7: Time Beginning Non-G G Non-G G Non-G G TOTAL 7: : : : : : : : 4 76 : : : : : : : : : : : : : 6 4 TOTAL 54 4 (.%) 67 5 (.%) 9 (.%) 4 angerous Goods Placards - Hazard Classes TOTAL by Hazard Class Class Class Class Class 4 Class 5 Class 6 Class 7 Class Class 9 ANGER TOTAL 7:-7: 4.% 57.% 4.%.%.%.%.% 4.%.% 4.% 7 7:-7: 5 7.% 5.% 5.% 5.%.%.% 5.% 5.%.% 5.% :-7:.%.% 4.%.7%.%.%.7% 9.6%.% 4.% Please note: The total number of placards may differ from the total number of vehicles due to vehicles having more than one placard. Placards where the class number could not be determined are not included in the Hazard Class total Commercial Truck Volume - Truck Classification LIGHT TRUCK HEAVY TRUCK TOTALS A B C E F G H X Single rear-axle Tractor Tractor w. Tractor w. Flatbed w. Tractor w. Tanker only chassis container commodity trailer (any) Construction Other HEAVY vs. ALL % HEAVY AM (7:-:) of 6.5% M (:-4:) of 4 57.% PM (4:-7:) of % 7:-7: % 4.6%.6%.%.% 6.9%.%.5% 9.4% 649 of 5 56.% AM (7:-:) of % M (:-4:) of % PM (4:-7:) of % 7:-7: % 4.4%.6% 4.%.7% 5.5%.6%.% 7.7% 657 of 55.6% AM (7:-:) of 54 5.% M (:-4:) of % PM (4:-7:) of 5 5.% 7:-7: % 4.5%.6% 4.%.% 6.%.7% 9.4%.5% 6 of 4 55.% Light (A) TOTAL by Vehicle Class (B to X) B C E TOTAL by Time of ay % % 4% 6% % % F G H X Creative Transportation Solutions Ltd. Project #6- Commercial Vehicle Screenline Surveys
212 Summary Station Report Station I MONTH/YEAR: February AY OF WEEK: Monday SPEC 4 Comments: Commissioner Street, west of Rupert Street Special Location Commercial Truck Volume - Non-angerous and angerous Goods All Trucks (veh./ min.) : : 9: : : : : 4: 5: 6: 7: Time Beginning Non-G G Non-G G Non-G G TOTAL 7: 5 4 7: 4 7 : : : : 6 9 : : : : : : : : : : : : : : : TOTAL 547 (.%) 69 (.%) 56 (.%) 6 angerous Goods Placards - Hazard Classes TOTAL by Hazard Class Class Class Class Class 4 Class 5 Class 6 Class 7 Class Class 9 ANGER TOTAL 7:-7: 7:-7: 7:-7:.%.%.%.% 9.%.%.%.% 5.%.%.%.%.% 7.7% 66.7%.%.%.%.%.%.%.%.%.%.%.%.%.%.%.% Please note: The total number of placards may differ from the total number of vehicles due to vehicles having more than one placard. Placards where the class number could not be determined are not included in the Hazard Class total. Commercial Truck Volume - Truck Classification 5 TOTAL by Vehicle Class LIGHT TRUCK HEAVY TRUCK TOTALS A B C E F G H X Single rear-axle Tractor Tractor w. Tractor w. Flatbed w. Tractor w. Tanker only chassis container commodity trailer (any) Construction Other HEAVY vs. ALL % HEAVY AM (7:-:) of 6 9.9% M (:-4:) of 7 94.% PM (4:-7:) 5 97 of 5 96.% 7:-7: %.9% 5.5% 7.%.%.%.%.9%.% 5 of % AM (7:-:) of 9.% M (:-4:) of 5 94.% PM (4:-7:) of % 7:-7: %.%.5% 67.%.%.%.6%.%.7% 57 of % AM (7:-:) of 47 9.% M (:-4:) of % PM (4:-7:) of 5 96.% 7:-7: %.9% 7.% 69.%.%.%.%.%.4% 5 of % Light (A) (B to X) B C TOTAL by Time of ay F G H X % % 4% 6% % % Creative Transportation Solutions Ltd. Project #6- Commercial Vehicle Screenline Surveys
213 , British Columbia Ministry of Transportation, TransLink APPENICES A TRANSPORTATION OF ANGEROUS GOOS: THE MARKS OF SAFETY B SAMPLE ANGEROUS GOOS SURVEY FORM C ATA PROCESSING, CLEANING, LOGIC CHECKS AN ATABASE STRUCTURE ANALYSIS OF STATIONS SAMPLE TWICE E AY BY AY STATION SUMMARIES FOR STATIONS SAMPLE TWICE F AITIONAL ANGEROUS GOOS MAPS AN TABLES G AITIONAL TRUCK CLASSIFICATION MAPS AN TABLES angerous Goods and Truck Classification Survey 95
214 , British Columbia Ministry of Transportation, TransLink APPENIX A TRANSPORTATION OF ANGEROUS GOOS: THE MARKS OF SAFETY 96 angerous Goods and Truck Classification Survey
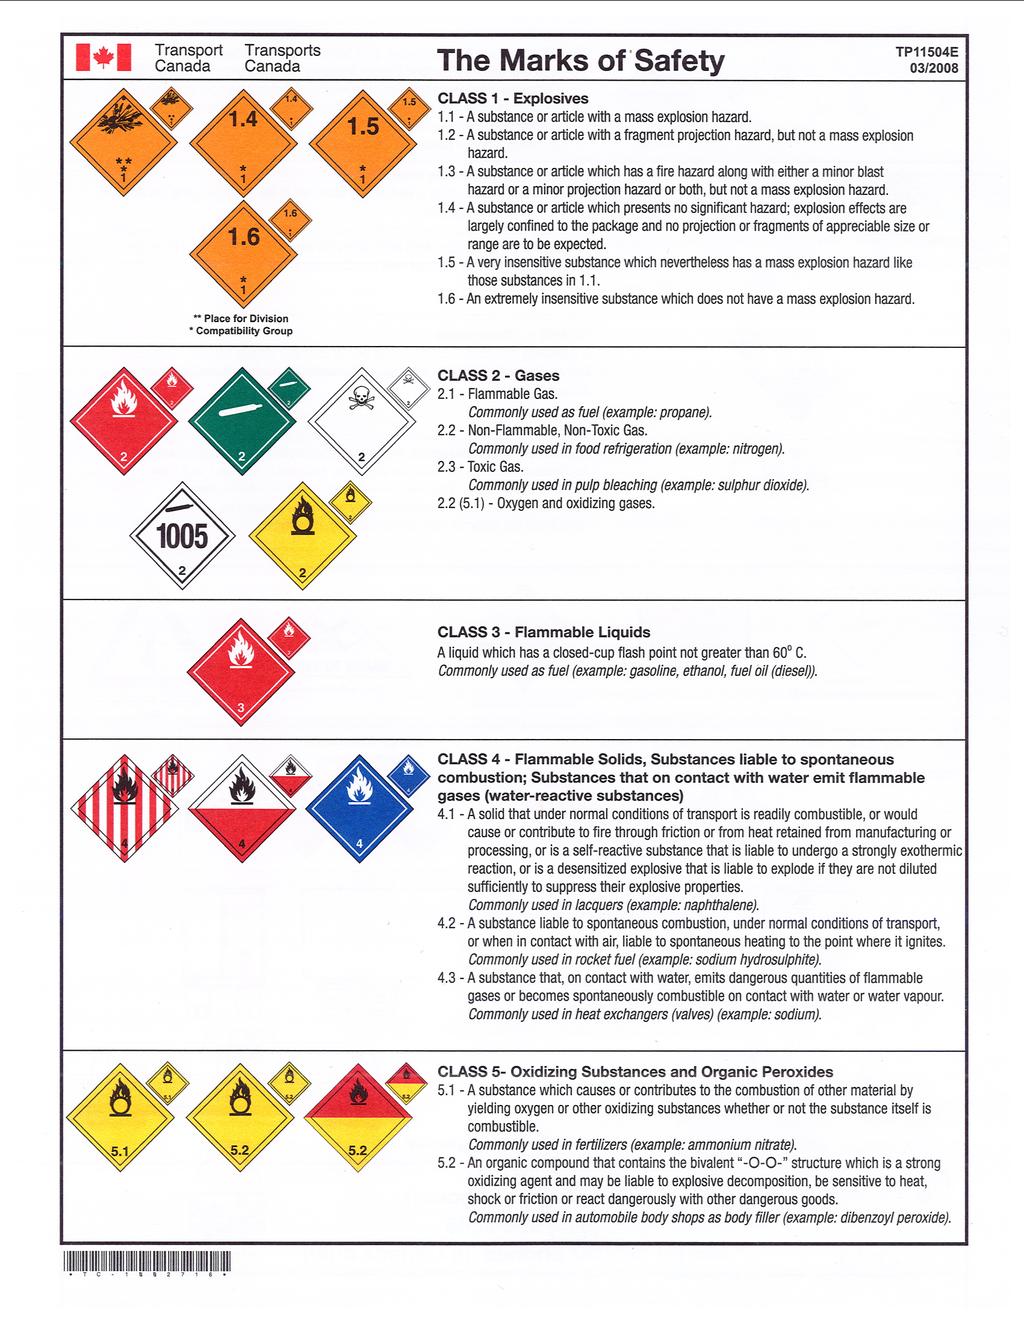
215

216
217 , British Columbia Ministry of Transportation, TransLink angerous Goods and Truck Classification Survey 99
218 , British Columbia Ministry of Transportation, TransLink APPENIX B SAMPLE ANGEROUS GOOS SURVEY FORM angerous Goods and Truck Classification Survey
219 HAZAROUS GOOS TRAFFIC SURVEY SHEET Site Code: Screenline Stn#: Screenline Stn: Weather: JAMAR #: ate: NOTES: UNSHIFTE: Surveyor : BANK : Surveyor : BANK : Surveyor : PLACAR COLOUR (check one) details available on attached sheet Passenger Cars Light trucks VEHICLE SIZE/TYPE (check one) Trucks (at least rear axles) # RECOR TIME IRECTION (check one) ORANGE RE RE / WHITE STRIPE RE / WHITE SPLIT GREEN YELLOW YE ELLOW / WHITE SPLIT BLUE WHITE WHITE/BLACK SPLIT WHIT TE / BLACK SPLIT STRIPE ANGER MISSE CLASS # UN # TANK HAS FLAT ENS TANK HAS ROUN ENS with two FLAT EN tank trailers with two ROUN EN tank trailers? hh:mm NB SB EB WB POSSIBLE CLASS #s FOR PLACAR COLOUR x to 9 4 digits (use X for missed digits) vans/ pickups small trucks (single unit, single rear axle) tractor with or without trailer, container or flatbed tanker truck (flat tank ends) tanker truck (round tank ends) double tanker truck (flat tank ends) double tanker truck (round tank ends) Construction vehicles Other heavies Creative Transportation Solutions Project # 6 Screenline Commercial Vehicle Survey
220 , British Columbia Ministry of Transportation, TransLink APPENIX C ATA PROCESSING, CLEANING, LOGIC CHECKS AN ATABASE STRUCTURE ATA COLLECTION METHOOLOGY The two components (the dangerous goods survey and the commercial truck classification count) of the survey were collected concurrently. The surveys were conducted on weekdays in February through May from 7: to 7: for a total of.5 hours. These hours were selected based on the number of forecasted daylight hours to maximize visibility and accuracy of the data. Surveyors worked to collect the data on overlapping four-hour shift rotations to ensure data collection continuity throughout the day. Busier and more complex locations were assigned multiple surveyors (and each surveyor assigned a specific task or direction, etc.) to ensure adequate coverage. Scheduling of the surveys was communicated to the project management group with enough lead up time to facilitate any changes that may have been required due to foreseeable interruptions to truck traffic such as road works and special events. angerous Goods Survey Field surveyors were positioned at the various screenline locations to observe any and all vehicles with a hazard class placard and record the information by vehicle and direction. Since the specifics of the study required some knowledge of placard recognition and the classification system, all surveyors participated in an extensive dangerous goods training session prior to survey commencement. To record the required dangerous goods information, each surveyor was provided a set of data sheets (see sample in appendix) and an illustrative placard summary sheet (entitled The Marks of Safety) provided by. The data sheets were designed to record the following information for each vehicle that was observed with a hazard class placard: the direction of travel the time of observation the colour of placard (out of ) the hazard class # (class -9) the UN number (if present) the vehicle type (out of 9 categories) The vehicle types covered for the dangerous goods survey were as follows: vans/pickups light trucks (including only standard single unit, singlerear axle vehicles of less than, kg GVW) Tractors with and without a trailer container or flatbed (no tanker trailers included) Tanker trucks (flat tank ends) Tanker trucks (semi-hemispherical tank ends) ouble tanker trucks (flat tank ends) angerous Goods and Truck Classification Survey
221 , British Columbia Ministry of Transportation, TransLink ouble tanker trucks (semi-hemispherical tank ends) Construction vehicles (cement trucks, dump/refuse container trucks, crane trucks etc.) All other heavy trucks Both the placard colour and the vehicle type were recorded as a secondary means of determining the hazard class and UN number, where possible. anger placards and multiple placards were also recorded to identify the number of vehicles carrying goods categorized under more than one hazard class type. The absence of a UN number was marked with a dash, whereas missed details were marked with an x. Vehicles where the placard information was missed entirely were recorded as such to maintain an accurate count. Each record was then transcribed into a database format for analysis. Truck Classification Survey Field surveyors were positioned at the various screenline locations to categorically count all commercial truck traffic by direction categorized under one of the vehicle types: Light truck (including only standard single unit, singlerear axle vehicles of less than, kg GVW) Tractor only (no trailer) Tractor and empty container chassis Tractor and container (all sizes) Flatbed with a commodity load (lumber, steel, etc.) Tractor and panel trailer (all sizes) Tanker (all kinds and sizes) Construction vehicles (cement trucks, dump/refuse container trucks, crane trucks etc.) Other heavy truck (includes flatbeds without a commodity load, fire trucks, buses, etc.) Unlike the dangerous goods survey, smaller vehicles such as vans and pick-up trucks were NOT included in the commercial truck classification counts. Electronic traffic count boards were used by each field surveyor to conduct the count. All boards were synchronized to within the minute of GPS time and set to tally and record count totals in 5-minute intervals. Illustrative count board templates were used to assist the surveyor in distinguishing between categories and minimizing field input errors. ATA PROCESSING AN CLEANING The dangerous goods survey sheets were tabulated into a database format using pick lists to minimize data entry formatting errors. The database format consisted of two worksheets in Microsoft Excel.XLS format. One sheet was used for the recording of vehicles with placards and one sheet for the different classes of commercial trucks. The placards sheet consisted of the following columns: CTS internal identifier Station identifier Screenline identifier bound (any of N, S, E or W) ate of data collection Time of observation (hour and minute) angerous Goods and Truck Classification Survey
222 , British Columbia Ministry of Transportation, TransLink Type of vehicle (any listed in section.) Type of Placard ( sets of the following columns) Placard Colour Placard Class Number ( if ANGER) Placard UN Number ( nil if none observed) This allowed recording of up to three multiple placards on the same vehicle if they were observed. Any class or UN numbers which were not visible during the observation were recorded with an x for each digit unseen. In some situations where numbers were not visible, they could be determined from the other information that was recorded. For example, if a class number was unseen but the UN number was recorded as 75, then class number was assumed. The truck class sheet consisted of the following columns: CTS internal identifier Station identifier Screenline identifier bound (any of N, S, E or W) ate of data collection 5-minute interval start-time of observation Vehicle count during the 5-minute interval for each of the following classes listed in section.. 4 angerous Goods and Truck Classification Survey
223 , British Columbia Ministry of Transportation, TransLink angerous Goods and Truck Classification Survey 5
224 , British Columbia Ministry of Transportation, TransLink APPENIX ANALYSIS OF STATIONS SAMPLE TWICE The transport of dangerous goods is driven by many factors such as regular scheduling of gasoline station refilling, variable demands for movement of other dangerous goods such as batteries or explosives, and preferences for time of day of travel. Likewise, the movement of heavy trucks in support of local industry and the Asia-Pacific Gateway is dynamic and driven by a variety of factors such as private industry logistics strategies, steamship line vessel rotation and earliest receiving dates at marine terminals, location and stage of construction projects, truck dispatch systems etc. A SNAPSHOT OF A COMPLEX SYSTEM The challenge of securing a dataset that is fully representative of a very complex, fluid and dynamic trucking industry is acknowledged. It is expected that traffic counts of longer duration, or on different days, or for longer periods, or a larger complement of stations, or for different seasons The results in this report should be considered a snapshot of truck movements in Metro Vancouver. would produce variations in the observed data. Appendix reviews the day-to-day variation at stations sampled twice with a view towards establishing a confidence that within a reasonable tolerance level the summary observations and station summaries are representative of typical conditions. AY-TO-AY VARIATION Examination of traffic observations at stations sampled twice enables interpretation of the overall results and rankings provided in the main section of the report and gives confidence that these observations are generally representative of truck traffic on the transport system at the time the counts were conducted. The thirteen stations sampled twice are listed in Exhibit.. Exhibit. Stations Sampled Twice Screenline Number and escription Station 6 9 Burrard Inlet Middle Arm of Fraser River Mid-Richmond South Arm of Fraser River Main Arm of Fraser River Second Narrows Bridge Knight Street Bridge Queensborough Bridge Hwy 9, west of No. Rd Westminster Hwy, west of No. Rd Alex Fraser Bridge George Massey Tunnel Port Mann Bridge Patullo Bridge North Road Brunette,south of Hwy Pitt Meadows / Port Coquitlam Pitt River Bridge elta River Road, west of Nordel Way Mid-Vancouver Knight Street, north of 4st Ave The stations listed in Exhibit. were selected based upon their interest for both the transport of dangerous goods as well as truck classification. For example, the Port Mann Bridge carries a significant amount of dangerous goods and Asia-Pacific Gateway traffic. George Massey Tunnel was selected for the purposes of the Asia-Pacific Gateway, despite a prohibition on dangerous goods traffic through the tunnel. 6 angerous Goods and Truck Classification Survey
225 , British Columbia Ministry of Transportation, TransLink VARIATION IN PLACARS - TOTAL The day-to-day variation in total placards observed at of the stations, not including George Massey Tunnel is presented in Exhibit.. Exhibit. Variation in Placards - Total Count Station Second Narrows Knight Street Bridge Queensborough Bridge Hwy 9 - Mid-Richmond West. Hwy - Mid- Richmond Alex Fraser Bridge Pattullo Bridge Port Mann Bridge Brunette South of Highway Pitt River Bridge River Road, West of Nordel Way Knight Street at 4st Ave ay of Week Total Monday Tuesday Thursday 9 Thursday Thursday 4 Thursday 5 Friday Wednesday Friday Wednesday Wednesday Friday Wednesday 4 Thursday 4 Tuesday 6 Wednesday 6 Monday Tuesday Tuesday Thursday 9 Friday 9 Wednesday 9 Monday Tuesday Abs. iff % iff % -% 7% % % -9% % % -% % % 5% Overall, there seems to be a general consistency from dayto-day. In summary: Stations where over placards were observed are highlighted in blue. With the exception of Highway 9 mid-richmond, all of the observations are within % of each other. For example, 4 dangerous goods trucks were observed on Queensborough Bridge on a Thursday; and 5 dangerous goods trucks on a following Thursday, or a difference of 7 percent Stations with less than observed placards are highlighted in green. The absolute difference for each station does not exceed. Although this may be substantial in percentage terms, the value in absolute terms is not material The cells highlighted in orange indicate traffic counts undertaken on a Friday. The general trend towards peaking of dangerous goods travel at mid-week is modestly observed here, with the exception perhaps of Westminster Highway in Richmond. MORE VIOLATORS!!! 9 dangerous goods trucks were observed on one day at George Massey Tunnel, where they are prohibited. of these trucks were Class Corrosives. angerous Goods and Truck Classification Survey 7
226 , British Columbia Ministry of Transportation, TransLink VARIATION AMONG HAZAR CLASSES Variations among the hazard classes that constitute 9 percent of the dangerous goods observations are presented in Exhibit.. Exhibit. Variation Among Hazard Classes Count Station Second Narrows Knight Street Bridge Queensborough Bridge Hwy 9 - Mid- Richmond West. Hwy - Mid- Richmond Alex Fraser Bridge Pattullo Bridge Port Mann Bridge Brunette South of Highway Pitt River Bridge River Road, West of Nordel Way Knight Street at 4st Ave ay of Week Total Gases - Liquified / Compressed Flammable Liquids Corrosive Substances anger Mon Tue. 4 6 Thur. 9 5 Thur. 5 7 Thur Thur Fri Wed Fri. 4 Wed. 9 9 Wed Fri Wed Thur. 4 5 Tues Tues Mon Tues Tues Thur Fri. 9 4 Wed. 9 5 Mon. 7 5 Tues. Overall, there seems to be a strong consistency from day-today. In summary: Green the cells highlighted in green represent the top three stations for total placards among those counted twice, and were discussed in the previous section. Orange liquefied or compressed gases: the top three stations are internally consistent, with the largest magnitude difference on a Friday at Alex Fraser Bridge. Blue flammable or combustible liquids: the top three stations are internally consistent, with the largest magnitude difference on a Tuesday at Port Mann Bridge. Purple corrosives: the top three stations are internally consistent, with the largest magnitude difference on a Tuesday at Port Mann Bridge. Pink anger: the top three stations are internally consistent, with the largest magnitude difference on a Wednesday at Alex Fraser Bridge. Confidence Examination of the day-to-day variation for stations sampled twice demonstrates a strong internal consistency, and imbues a confidence that the results in this report are representative of typical conditions in Metro Vancouver, as observed at the time of the survey. angerous Goods and Truck Classification Survey
227 , British Columbia Ministry of Transportation, TransLink VARIATION AMONG TRUCK CLASSES Variations among the truck classifications are presented in Exhibit.4. Overall, the truck classifications were fairly consistent for each station. When compared to the overall ranking of stations based on the total number of trucks observed, the count variability moves the stations up or down by no more than one rank, thereby giving confidence to the results of this study. Some notes of particular interest include: Blue Only two of the stations that were counted twice saw differences of 5 to percent in the total number of trucks observed. The day-to-day variation at Knight Street and 4 st Avenue was likely due to the arrival or departure of container ships, as noted by the differences in the marine container and marine container chassis classes. Pink Light truck observations appeared the somewhat variable, with 5 stations seeing differences of 5 to 5 percent. This may be due to different delivery schedules and requirements for each day of the week and the flexible nature of the light truck industry. Yellow Construction vehicle observations were the most variable, which is not surprising given the fastpaced nature of the industry and the different stages of development of projects around the region. The variability has minimal impact on the overall station rankings and within the construction vehicle class. Green Although these stations have day-to-day variations of to trucks, the effects on the overall and class-specific station rankings are nominal. Purple There were typically fewer trucks observed on Fridays. Orange Out of all the stations that were counted twice, Port Mann Bridge had the highest truck volumes. Volumes for each truck classification were internally consistent except for tractors with containers and tractortrailers. The difference may be due to surveyor error in the visual identification of truck types. This may be applicable to Pattullo Bridge and River Road as well. In general, the tractor only, tractor with chassis and tanker categories had stable counts, with the exception of Knight Street at 4 st Avenue, which could be explained by the arrival or departure of container ships. In Conclusion Upon examining the day-to-day variation in the truck classification surveys of the stations that were counted twice, the variations resulted in only nominal changes to the overall station rankings and the rankings within each vehicle class. This gives confidence that the results are representative of typical conditions in Metro Vancouver, as observed at the time of the survey. angerous Goods and Truck Classification Survey 9
228 , British Columbia Ministry of Transportation, TransLink Exhibit.4 Variation Among Truck Classes Count Station ay of Week Total Light Truck Tractor Only Tractor with marine container chassis Tractor with marine container Flatbed with commodity Tractor with trailer Tanker (any) Construction Vehicle Other Second Narrows Knight Street Bridge Queensborough Bridge Highway 9 - Mid- Richmond Westminster Hwy - Mid-Richmond George Massey Tunnel Alex Fraser Bridge Pattullo Bridge Port Mann Bridge Brunette Avenue, south of Highway Pitt River Bridge River Road, west of Nordel Way Knight Street at 4st Avenue Mon Tue Thur Thur Thur Thur Fri Wed Fri Wed Fri Wed Wed Fri Wed Thur Tues Tues Mon Tues Tues Thur Fri Wed Mon Tues angerous Goods and Truck Classification Survey
229 , British Columbia Ministry of Transportation, TransLink angerous Goods and Truck Classification Survey
230 , British Columbia Ministry of Transportation, TransLink APPENIX E STATION SUMMARIES FOR STATIONS SAMPLE TWICE angerous Goods and Truck Classification Survey
231 , British Columbia Ministry of Transportation, TransLink angerous Goods and Truck Classification Survey
232 Summary Station Report Station I MONTH/YEAR: February. Comments: Second Narrows Burrard Inlet Screenline AY OF WEEK: Monday ay of Commercial Truck Volume - Non-angerous and angerous Goods All Trucks (veh./ min.) : : 9: : : : : 4: 5: 6: 7: Time Beginning Non-G G Non-G G Non-G G TOTAL 7: : : : : : : : : : : : : : : : : : : 9 6 6: 7 7: TOTAL 7 49 (.7%) (.%) (.%) 45 angerous Goods Placards - Hazard Classes TOTAL by Hazard Class Class Class Class Class 4 Class 5 Class 6 Class 7 Class Class 9 ANGER TOTAL 9 7:-7: 7:-7: 7:-7: %.%.% 7.6% 5.6% 6.7% 49.% 4.9% 49.% 5.9%.%.%.% 6.7%.%.%.%.%.%.%.% 5.7%.% 7.7%.9% 4.4% 4.%.% 4.4%.% Please note: The total number of placards may differ from the total number of vehicles due to vehicles having more than one placard. Placards where the class number could not be determined are not included in the Hazard Class total Commercial Truck Volume - Truck Classification LIGHT TRUCK HEAVY TRUCK TOTALS A B C E F G H X Single rear-axle Tractor Tractor w. Tractor w. Flatbed w. Tractor w. Tanker only chassis container commodity trailer (any) Construction Other HEAVY vs. ALL % HEAVY AM (7:-:) of % M (:-4:) of % PM (4:-7:) of % 7:-7: %.4%.%.% 5.%.9%.7% 9.% 6.4% 46 of 57.% AM (7:-:) of % M (:-4:) of % PM (4:-7:) of % 7:-7: %.4%.% 4.5% 7.% 6.9%.9% 6.% 4.% 4 of 55.% AM (7:-:) of 6.% M (:-4:) of 5.6% PM (4:-7:) of 9 5.7% 7:-7: %.4%.7%.9% 6.% 7.%.% 7.5% 5.% 7 of % TOTAL by Vehicle Class Light (A) (B to X) B C E F G TOTAL by Time of ay % % 4% 6% % % H X Creative Transportation Solutions Ltd. Project #6- Commercial Vehicle Screenline Surveys
233 Second Narrows Summary Station Report Station I MONTH/YEAR: February AY OF WEEK: Tuesday. Burrard Inlet Screenline ay of Comments: traffic very slow at 6: due to congestion at Cassiar Tunnel. Commercial Truck Volume - Non-angerous and angerous Goods All Trucks (veh./ min.) : : 9: : : : : 4: 5: 6: 7: Time Beginning Non-G G Non-G G Non-G G TOTAL 7: : : : : : : : : : : : : : : : : : : 4 6: : 7 5 TOTAL 6 4 (.9%) 9 56 (.4%) (.%) 46 angerous Goods Placards - Hazard Classes TOTAL by Hazard Class Class Class Class Class 4 Class 5 Class 6 Class 7 Class Class 9 ANGER TOTAL 7:-7: 7.% 5.% 5.%.%.%.%.% 5.9%.% 4.5% :-7: %.% 6.4%.% 9.%.%.% 6.4% 5.5%.9% :-7:.%.% 4.4%.% 5.%.%.% 6.% 4.%.% Please note: The total number of placards may differ from the total number of vehicles due to vehicles having more than one placard. Placards where the class number could not be determined are not included in the Hazard Class total Commercial Truck Volume - Truck Classification LIGHT TRUCK HEAVY TRUCK TOTALS A B C E F G H X Single rear-axle Tractor Tractor w. Tractor w. Flatbed w. Tractor w. Tanker only chassis container commodity trailer (any) Construction Other HEAVY vs. ALL % HEAVY AM (7:-:) of 6 55.% M (:-4:) of 64.6% PM (4:-7:) of % 7:-7: %.%.5%.9%.5%.9%.% 9.%.% of 4 57.% AM (7:-:) of 67 6.% M (:-4:) of 9 5.% PM (4:-7:) of 7 9.6% 7:-7: %.5%.6%.6% 6.% 7.%.%.%.% of % AM (7:-:) of % M (:-4:) of 5 57.% PM (4:-7:) of 4.5% 7:-7: %.%.6%.% 4.9% 5.%.9%.% 7.6% 5 of % TOTAL by Vehicle Class Light (A) (B to X) B C E F G TOTAL by Time of ay % % 4% 6% % % H X Creative Transportation Solutions Ltd. Project #6- Commercial Vehicle Screenline Surveys
234 Summary Station Report Station I MONTH/YEAR: February AY OF WEEK: Thursday ay of 6. Comments: Knight Street Bridge Richmond / Vancouver Screenline Commercial Truck Volume - Non-angerous and angerous Goods All Trucks (veh./ min.) : : 9: : : : : 4: 5: 6: 7: Time Beginning Non-G G Non-G G Non-G G TOTAL 7: : : : : : : : : : : : : : : : : : : : : TOTAL 9 5 (.%) 77 6 (.%) 66 7 (.%) 657 angerous Goods Placards - Hazard Classes TOTAL by Hazard Class Class Class Class Class 4 Class 5 Class 6 Class 7 Class Class 9 ANGER TOTAL 7:-7: 6.% 5.6% 46.%.%.%.%.6% 5.% 5.% 5.4% 9 7:-7: 7:-7: %.%.% 7.% 4.5% 44.7%.%.%.%.%.%.%.%.4%.%.4% 6.5% 5.9% 9.6% 7.6% Please note: The total number of placards may differ from the total number of vehicles due to vehicles having more than one placard. Placards where the class number could not be determined are not included in the Hazard Class total Commercial Truck Volume - Truck Classification LIGHT TRUCK HEAVY TRUCK TOTALS A B C E F G H X Single rear-axle Tractor Tractor w. Tractor w. Flatbed w. Tractor w. Tanker only chassis container commodity trailer (any) Construction Other HEAVY vs. ALL % HEAVY AM (7:-:) of % M (:-4:) of 65.6% PM (4:-7:) of % 7:-7: %.% 4.%.4%.% 6.%.% 6.9% 6.% of 44 6.% AM (7:-:) of % M (:-4:) of 6.% PM (4:-7:) of % 7:-7: %.7% 6.6%.4%.4%.%.% 6.%.% 945 of 6.5% AM (7:-:) of 6.% M (:-4:) of 5 6.% PM (4:-7:) of 55 5.% 7:-7: %.9% 5.4%.4%.% 7.%.% 6.5%.7% 77 of % TOTAL by Vehicle Class Light (A) (B to X) B C E F G H TOTAL by Time of ay % % 4% 6% % % X Creative Transportation Solutions Ltd. Project #6- Commercial Vehicle Screenline Surveys
235 Summary Station Report Station I MONTH/YEAR: April 6. Comments: Knight Street Bridge Richmond / Vancouver Screenline AY OF WEEK: Thursday ay of Commercial Truck Volume - Non-angerous and angerous Goods All Trucks (veh./ min.) : : 9: : : : : 4: 5: 6: 7: Time Beginning Non-G G Non-G G Non-G G TOTAL 7: : : : : : : : : : : : : : 7 9 4: : : : : : : 9 TOTAL 67 (.%) (.%) (.%) 674 angerous Goods Placards - Hazard Classes TOTAL by Hazard Class Class Class Class Class 4 Class 5 Class 6 Class 7 Class Class 9 ANGER TOTAL 5 9 7:-7: 4.% 4.7% 5.%.%.%.%.%.%.% 6.5% 7:-7: 7:-7: 5 7.% 4.% 7.%.4%.% 45.7%.%.%.%.%.%.%.%.%.% 4.%.%.%.% 4.% Please note: The total number of placards may differ from the total number of vehicles due to vehicles having more than one placard. Placards where the class number could not be determined are not included in the Hazard Class total. 6 7 Commercial Truck Volume - Truck Classification LIGHT TRUCK HEAVY TRUCK TOTALS A B C E F G H X Single rear-axle Tractor Tractor w. Tractor w. Flatbed w. Tractor w. Tanker only chassis container commodity trailer (any) Construction Other HEAVY vs. ALL % HEAVY AM (7:-:) of 6.5% M (:-4:) of 6.6% PM (4:-7:) of 6 57.% 7:-7: %.%.6%.4%.9%.%.9%.6% 7.% 6 of 4 6.6% AM (7:-:) of 6.9% M (:-4:) of 7 57.% PM (4:-7:) of % 7:-7: %.5% 7.9%.9%.%.%.%.6%.% 9 of 4 57.% AM (7:-:) of 4 6.5% M (:-4:) of % PM (4:-7:) of % 7:-7: %.% 5.7%.7%.6%.%.% 7.7%.% 97 of % Light (A) TOTAL by Vehicle Class (B to X) B C E TOTAL by Time of ay F G % % 4% 6% % % H X Creative Transportation Solutions Ltd. Project #6- Commercial Vehicle Screenline Surveys
236 Summary Station Report Station I MONTH/YEAR: March 6.4 Comments: Queensborough Bridge Richmond / Vancouver Screenline AY OF WEEK: Thursday ay of Commercial Truck Volume - Non-angerous and angerous Goods All Trucks (veh./ min.) : : 9: : : : : 4: 5: 6: 7: Time Beginning Non-G G Non-G G Non-G G TOTAL 7: : : : : : : : : 6 6 : : : : : : : : : : : : TOTAL (.7%) (.%) 577 (.7%) 575 angerous Goods Placards - Hazard Classes TOTAL by Hazard Class Class Class Class Class 4 Class 5 Class 6 Class 7 Class Class 9 ANGER TOTAL 7:-7: 5.% 9.%.9%.4%.%.%.% 6.9%.%.6% 7 7:-7: 7:-7: %.% 4.4%.6%.%.6%.6%.5%.%.%.%.%.%.% 4.9% 6.%.%.% 7.9% 9.% Please note: The total number of placards may differ from the total number of vehicles due to vehicles having more than one placard. Placards where the class number could not be determined are not included in the Hazard Class total. 6 4 Commercial Truck Volume - Truck Classification LIGHT TRUCK HEAVY TRUCK TOTALS A B C E F G H X Single rear-axle Tractor Tractor w. Tractor w. Flatbed w. Tractor w. Tanker only chassis container commodity trailer (any) Construction Other HEAVY vs. ALL % HEAVY AM (7:-:) of % M (:-4:) of 7 6.7% PM (4:-7:) of % 7:-7: % 5.7%.4%.%.9%.6%.7% 7.%.5% 965 of 9 59.% AM (7:-:) of 64.% M (:-4:) of 7 66.% PM (4:-7:) of 65 6.% 7:-7: % 5.4%.% 7.4% 7.5%.4%.% 9.6% 7.6% 64 of % AM (7:-:) of % M (:-4:) of % PM (4:-7:) of % 7:-7: % 5.6%.%.% 5.5% 6.%.9%.% 9.% 599 of % TOTAL by Vehicle Class Light (A) (B to X) B C E TOTAL by Time of ay F G H X % % 4% 6% % % Creative Transportation Solutions Ltd. Project #6- Commercial Vehicle Screenline Surveys
237 Summary Station Report Station I MONTH/YEAR: April 6.4 Comments: Queensborough Bridge Richmond / Vancouver Screenline AY OF WEEK: Thursday ay of Commercial Truck Volume - Non-angerous and angerous Goods All Trucks (veh./ min.) : : 9: : : : : 4: 5: 6: 7: Time Beginning Non-G G Non-G G Non-G G TOTAL 7: : : : : : 44 : : : : : : : : : : : : 4 6 6: : : TOTAL 5 74 (.%) 67 5 (.%) 59 4 (.%) 67 angerous Goods Placards - Hazard Classes TOTAL by Hazard Class Class Class Class Class 4 Class 5 Class 6 Class 7 Class Class 9 ANGER TOTAL :-7: 5.%.6%.%.%.%.%.% 7.6%.%.% 7:-7: 7:-7: %.7%.5%.6% 5.6%.%.%.%.%.%.%.%.%.%.5%.9%.7%.4%.7%.% Please note: The total number of placards may differ from the total number of vehicles due to vehicles having more than one placard. Placards where the class number could not be determined are not included in the Hazard Class total Commercial Truck Volume - Truck Classification LIGHT TRUCK HEAVY TRUCK TOTALS A B C E F G H X Single rear-axle Tractor Tractor w. Tractor w. Flatbed w. Tractor w. Tanker only chassis container commodity trailer (any) Construction Other HEAVY vs. ALL % HEAVY AM (7:-:) of % M (:-4:) of % PM (4:-7:) of 76 5.% 7:-7: % 5.%.4%.% 5.% 9.6%.% 7.% 9.% 994 of 9 6.% AM (7:-:) of % M (:-4:) of 5.% PM (4:-7:) of % 7:-7: % 5.5%.9%.%.5%.%.6% 6.%.% 575 of % AM (7:-:) of % M (:-4:) of % PM (4:-7:) of % 7:-7: % 5.4%.%.%.5%.9%.7% 7.% 9.5% 569 of % Light (A) TOTAL by Vehicle Class (B to X) B C E TOTAL by Time of ay F G H X % % 4% 6% % % Creative Transportation Solutions Ltd. Project #6- Commercial Vehicle Screenline Surveys
238 Summary Station Report Station I MONTH/YEAR: February. Comments: Highway 9 Richmond Screenline AY OF WEEK: Friday ay of Commercial Truck Volume - Non-angerous and angerous Goods All Trucks (veh./ min.) : : 9: : : : : 4: 5: 6: 7: Time Beginning Non-G G Non-G G Non-G G TOTAL 7: : : : 7 5 9: : : : : : : : : : : : : 9 6 5: : : : 49 6 TOTAL 6 64 (.%) 4 57 (.4%) 46 (.6%) 47 angerous Goods Placards - Hazard Classes TOTAL by Hazard Class Class Class Class Class 4 Class 5 Class 6 Class 7 Class Class 9 ANGER TOTAL 7:-7: 7:-7: 7:-7: %.%.% 9.4% 9.7% 9.5% 5.7% 6.% 57.%.5%.%.%.5%.6%.6%.%.%.%.%.%.%.4%.%.9%.%.6%.%.4% 6.6%.6% Please note: The total number of placards may differ from the total number of vehicles due to vehicles having more than one placard. Placards where the class number could not be determined are not included in the Hazard Class total Commercial Truck Volume - Truck Classification LIGHT TRUCK HEAVY TRUCK TOTALS A B C E F G H X Single rear-axle Tractor Tractor w. Tractor w. Flatbed w. Tractor w. Tanker only chassis container commodity trailer (any) Construction Other HEAVY vs. ALL % HEAVY AM (7:-:) of 69 6.% M (:-4:) of % PM (4:-7:) of % 7:-7: % 5.% 4.% 7.%.7% 9.4%.4% 6.7%.% 4 of % AM (7:-:) of 6.4% M (:-4:) of 6.6% PM (4:-7:) of % 7:-7: % 5.%.%.% 6.%.%.7% 6.4% 6.% 456 of % AM (7:-:) of % M (:-4:) of % PM (4:-7:) of % 7:-7: % 5.%.% 9.5% 4.%.%.5% 6.5%.7% 79 of % TOTAL by Vehicle Class Light (A) (B to X) B C E TOTAL by Time of ay F G H X % % 4% 6% % % Creative Transportation Solutions Ltd. Project #6- Commercial Vehicle Screenline Surveys
239 Summary Station Report Station I MONTH/YEAR: April. Comments: Highway 9 Richmond Screenline AY OF WEEK: Wednesday ay of Commercial Truck Volume - Non-angerous and angerous Goods All Trucks (veh./ min.) : : 9: : : : : 4: 5: 6: 7: Time Beginning Non-G G Non-G G Non-G G TOTAL 7: : : : : : : : : : : : : : : : : : : : : TOTAL 7 (.%) (.%) (.%) 55 angerous Goods Placards - Hazard Classes TOTAL by Hazard Class Class Class Class Class 4 Class 5 Class 6 Class 7 Class Class 9 ANGER TOTAL 7:-7: 7:-7: 7:-7: %.%.%.9% 4.7% 4.% 5.% 54.% 5.%.%.%.%.%.%.6%.%.%.6%.%.%.% 5.7%.4% 4.%.%.%.%.%.%.5% 5 7 Please note: The total number of placards may differ from the total number of vehicles due to vehicles having more than one placard. Placards where the class number could not be determined are not included in the Hazard Class total Commercial Truck Volume - Truck Classification LIGHT TRUCK HEAVY TRUCK TOTALS A B C E F G H X Single rear-axle Tractor Tractor w. Tractor w. Flatbed w. Tractor w. Tanker only chassis container commodity trailer (any) Construction Other HEAVY vs. ALL % HEAVY AM (7:-:) of % M (:-4:) of 9 54.% PM (4:-7:) of % 7:-7: % 5.5%.9% 6.%.5% 7.%.%.7%.5% 74 of % AM (7:-:) of 9 5.5% M (:-4:) of 6.% PM (4:-7:) of % 7:-7: % 5.%.%.9% 6.% 9.%.% 7.9% 7.6% 55 of % AM (7:-:) of % M (:-4:) of % PM (4:-7:) of % 7:-7: % 5.%.5% 7.9%.9%.6%.%.% 9.% 959 of % Light (A) TOTAL by Vehicle Class (B to X) B C E TOTAL by Time of ay F G H % % 4% 6% % % X Creative Transportation Solutions Ltd. Project #6- Commercial Vehicle Screenline Surveys
240 Summary Station Report Station I MONTH/YEAR: March. Comments: Westminster Highway Richmond Screenline AY OF WEEK: Friday ay of Commercial Truck Volume - Non-angerous and angerous Goods All Trucks (veh./ min.) 6 4 7: : 9: : : : : 4: 5: 6: 7: Time Beginning Non-G G Non-G G Non-G G TOTAL 7: : : : : : : : : : : : : : : : : : : : : TOTAL 9 (.7%) 7 4 (.%) 575 (.9%) 59 angerous Goods Placards - Hazard Classes TOTAL by Hazard Class Class Class Class Class 4 Class 5 Class 6 Class 7 Class Class 9 ANGER TOTAL 7:-7: 6.%.% 6.%.%.%.%.%.%.%.% 7:-7: 7 7.% 4.% 4.%.%.%.%.%.%.% 7.6% 7 4 7:-7:.% 7.% 4.%.%.%.%.%.%.% 4.% Please note: The total number of placards may differ from the total number of vehicles due to vehicles having more than one placard. Placards where the class number could not be determined are not included in the Hazard Class total. 7 Commercial Truck Volume - Truck Classification LIGHT TRUCK HEAVY TRUCK TOTALS A B C E F G H X Single rear-axle Tractor Tractor w. Tractor w. Flatbed w. Tractor w. Tanker only chassis container commodity trailer (any) Construction Other HEAVY vs. ALL % HEAVY AM (7:-:) of % M (:-4:) of % PM (4:-7:) of % 7:-7: %.5%.7%.%.9% 7.%.%.4%.5% 99 of % AM (7:-:) of % M (:-4:) of % PM (4:-7:) of 9 7.% 7:-7: %.%.4%.%.4% 4.9%.7%.%.7% 97 of 5 7.5% AM (7:-:) of % M (:-4:) of 94 7.% PM (4:-7:) of 76 6.% 7:-7: % 9.9%.%.7%.7%.9%.4%.%.6% 6 of % TOTAL by Vehicle Class Light (A) (B to X) B C E TOTAL by Time of ay F G H X % % 4% 6% % % Creative Transportation Solutions Ltd. Project #6- Commercial Vehicle Screenline Surveys
241 Summary Station Report Station I MONTH/YEAR: April. Comments: Westminster Highway Richmond Screenline AY OF WEEK: Wednesday ay of Commercial Truck Volume - Non-angerous and angerous Goods All Trucks (veh./ min.) 6 4 7: : 9: : : : : 4: 5: 6: 7: Time Beginning Non-G G Non-G G Non-G G TOTAL 7: : : : : : 5 7 : : : : : : : : : : 4 5: : : : : TOTAL 45 (.5%) 4 5 (.%) 6 (.%) 9 angerous Goods Placards - Hazard Classes TOTAL by Hazard Class Class Class Class Class 4 Class 5 Class 6 Class 7 Class Class 9 ANGER TOTAL 7:-7: 7:-7: 7:-7: 7 6.%.%.% 5.% 4.% 45.5%.% 7.5% 6.4%.%.%.%.%.%.%.%.%.%.%.%.%.%.%.% 6.7% 6.% 9.%.%.5% 9.% 6 6 Please note: The total number of placards may differ from the total number of vehicles due to vehicles having more than one placard. Placards where the class number could not be determined are not included in the Hazard Class total. Commercial Truck Volume - Truck Classification 9 TOTAL by Vehicle Class LIGHT TRUCK HEAVY TRUCK TOTALS A B C E F G H X Single rear-axle Tractor Tractor w. Tractor w. Flatbed w. Tractor w. Tanker only chassis container commodity trailer (any) Construction Other HEAVY vs. ALL % HEAVY AM (7:-:) of 4 6.6% M (:-4:) of % PM (4:-7:) of 46 7.% 7:-7: %.9% 4.4% 5.4%.%.5%.%.6% 7.% 4 of % AM (7:-:) of 54 7.% M (:-4:) of % PM (4:-7:) 5 9 of 7.9% 7:-7: %.%.9% 9.5%.%.7%.7% 7.% 6.9% 59 of 4 7.9% AM (7:-:) of % M (:-4:) of % PM (4:-7:) of 56 7.% 7:-7: %.5%.6% 7.4%.5%.6%.9% 7.9% 7.% 9 of 9 7.4% Light (A) (B to X) B C E TOTAL by Time of ay F G H X % % 4% 6% % % Creative Transportation Solutions Ltd. Project #6- Commercial Vehicle Screenline Surveys
242 George Massey Tunnel Summary Station Report Station I MONTH/YEAR: February AY OF WEEK: Friday 9. Richmond / Vancouver / elta Screenline ay of Comments: lane stopped at 5:. lane started at 5:. Commercial Truck Volume - Non-angerous and angerous Goods All Trucks (veh./ min.) : : 9: : : : : 4: 5: 6: 7: Time Beginning Non-G G Non-G G Non-G G TOTAL 7: : 6 4 : 4 4 : : : : : 7 49 : : 4 7 : : 6 : : : 4: : : : : : TOTAL 4 (.%) 57 (.%) 497 (.%) 49 angerous Goods Placards - Hazard Classes TOTAL by Hazard Class Class Class Class Class 4 Class 5 Class 6 Class 7 Class Class 9 ANGER TOTAL 7:-7: 7:-7: 7:-7:.%.%.%.%.%.%.%.%.%.%.%.%.%.%.%.%.%.%.%.%.%.%.%.%.%.%.%.%.%.% Please note: The total number of placards may differ from the total number of vehicles due to vehicles having more than one placard. Placards where the class number could not be determined are not included in the Hazard Class total. Commercial Truck Volume - Truck Classification TOTAL by Vehicle Class LIGHT TRUCK HEAVY TRUCK TOTALS A B C E F G H X Single rear-axle Tractor Tractor w. Tractor w. Flatbed w. Tractor w. Tanker only chassis container commodity trailer (any) Construction Other HEAVY vs. ALL % HEAVY AM (7:-:) of 96 7.% M (:-4:) of % PM (4:-7:) of % 7:-7: %.4% 6.% 7.%.%.%.%.%.% 74 of 4 7.4% AM (7:-:) of % M (:-4:) of % PM (4:-7:) of % 7:-7: %.6%.4% 7.% 4.%.6%.% 6.7% 7.% 96 of 5 74.% AM (7:-:) of 7 7.7% M (:-4:) of % PM (4:-7:) of 4 67.% 7:-7: %.5% 4.5% 7.% 4.%.9%.4% 7.4%.6% 6 of 49 7.% Light (A) (B to X) B C E TOTAL by Time of ay F G H % % 4% 6% % % X Creative Transportation Solutions Ltd. Project #6- Commercial Vehicle Screenline Surveys
243 George Massey Tunnel Summary Station Report Station I MONTH/YEAR: March AY OF WEEK: Wednesday 9. Richmond / Vancouver / elta Screenline ay of Comments: lane stopped at 5:. lane started at 5:. Commercial Truck Volume - Non-angerous and angerous Goods All Trucks (veh./ min.) : : 9: : : : : 4: 5: 6: 7: Time Beginning Non-G G Non-G G Non-G G TOTAL 7: 7 7: : : : : : : : : : : : : : : : 6 9 5: : : : 4 69 TOTAL 7 6 (.%) 9 9 (.%) 56 5 (.%) 565 angerous Goods Placards - Hazard Classes TOTAL by Hazard Class Class Class Class Class 4 Class 5 Class 6 Class 7 Class Class 9 ANGER TOTAL 9 7:-7: 7:-7: 4.% 6.7% 6.7%.%.%.%.% 66.7%.%.% 5 4.%.5% 5.4%.%.%.%.%.% 5.4%.% 6 6 7:-7:.%.6% 5.%.%.%.%.% 4.%.5%.% Please note: The total number of placards may differ from the total number of vehicles due to vehicles having more than one placard. Placards where the class number could not be determined are not included in the Hazard Class total. 9 Commercial Truck Volume - Truck Classification LIGHT TRUCK HEAVY TRUCK TOTALS A B C E F G H X Single rear-axle Tractor Tractor w. Tractor w. Flatbed w. Tractor w. Tanker only chassis container commodity trailer (any) Construction Other HEAVY vs. ALL % HEAVY AM (7:-:) of 4 7.6% M (:-4:) of 7 77.% PM (4:-7:) of 49 7.% 7:-7: %.9% 4.% 5.% 5.5%.5%.5%.%.6% of % AM (7:-:) of % M (:-4:) of % PM (4:-7:) of 7.% 7:-7: %.5% 4.%.5% 4.%.5%.%.%.9% 6 of % AM (7:-:) of 7.% M (:-4:) of 6 76.% PM (4:-7:) of 6 7.7% 7:-7: %.% 4.% 6.% 4.%.5%.9% 9.4%.7% 47 of % TOTAL by Vehicle Class Light (A) (B to X) B C E TOTAL by Time of ay F G H % % 4% 6% % % X Creative Transportation Solutions Ltd. Project #6- Commercial Vehicle Screenline Surveys
244 Summary Station Report Station I MONTH/YEAR: March 9. Comments: Alex Fraser Bridge Richmond / Vancouver / elta Screenline AY OF WEEK: Wednesday ay of Commercial Truck Volume - Non-angerous and angerous Goods All Trucks (veh./ min.) : : 9: : : : : 4: 5: 6: 7: Time Beginning Non-G G Non-G G Non-G G TOTAL 7: : : : : : : : : : : : : : : : : : : : : TOTAL 4 (.9%) 97 4 (.%) (.9%) 6544 angerous Goods Placards - Hazard Classes TOTAL by Hazard Class Class Class Class Class 4 Class 5 Class 6 Class 7 Class Class 9 ANGER TOTAL 7:-7: % 7.%.%.%.%.%.% 5.%.%.5% 7:-7: 7:-7: %.% 9.%.% 4.% 6.6%.%.%.%.4%.%.%.%.% 6.% 6.%.%.%.4%.% Please note: The total number of placards may differ from the total number of vehicles due to vehicles having more than one placard. Placards where the class number could not be determined are not included in the Hazard Class total Commercial Truck Volume - Truck Classification LIGHT TRUCK HEAVY TRUCK TOTALS A B C E F G H X Single rear-axle Tractor Tractor w. Tractor w. Flatbed w. Tractor w. Tanker only chassis container commodity trailer (any) Construction Other HEAVY vs. ALL % HEAVY AM (7:-:) of 67.% M (:-4:) of 65.% PM (4:-7:) of % 7:-7: % 6.%.%.% 7.%.7%.% 4.%.% of % AM (7:-:) of % M (:-4:) of 7 6.4% PM (4:-7:) of 6.9% 7:-7: %.%.% 7.7%.%.%.4% 4.% 9.% 7 of 6.% AM (7:-:) of 5 64.% M (:-4:) of 6.% PM (4:-7:) of 9 6.6% 7:-7: % 7.5%.% 9.% 5.%.9%.% 4.5%.% 455 of % TOTAL by Vehicle Class Light (A) (B to X) B C E TOTAL by Time of ay F G H X % % 4% 6% % % Creative Transportation Solutions Ltd. Project #6- Commercial Vehicle Screenline Surveys
245 Summary Station Report Station I MONTH/YEAR: March 9. Comments: Alex Fraser Bridge Richmond / Vancouver / elta Screenline AY OF WEEK: Friday ay of Commercial Truck Volume - Non-angerous and angerous Goods All Trucks (veh./ min.) : : 9: : : : : 4: 5: 6: 7: Time Beginning Non-G G Non-G G Non-G G TOTAL 7: : : : : : : : : : : : : : : : : : : : 6 9 7: TOTAL 4 9 (.6%) 76 (.7%) (.7%) 6449 angerous Goods Placards - Hazard Classes TOTAL by Hazard Class Class Class Class Class 4 Class 5 Class 6 Class 7 Class Class 9 ANGER TOTAL 7:-7: 4.% 7.% 5.%.%.6%.9%.%.4%.6%.4% 4 7:-7: 7:-7: %.%.% 9.5% 4.9%.%.%.5%.%.4%.%.5%.%.% 7.5% 9.7%.%.9% 6.% 7.4% Please note: The total number of placards may differ from the total number of vehicles due to vehicles having more than one placard. Placards where the class number could not be determined are not included in the Hazard Class total Commercial Truck Volume - Truck Classification LIGHT TRUCK HEAVY TRUCK TOTALS A B C E F G H X Single rear-axle Tractor Tractor w. Tractor w. Flatbed w. Tractor w. Tanker only chassis container commodity trailer (any) Construction Other HEAVY vs. ALL % HEAVY AM (7:-:) of 6.7% M (:-4:) of 7 59.% PM (4:-7:) of % 7:-7: % 6.5%.4% 7.% 4.%.7%.5% 4.%.% 79 of % AM (7:-:) of 5 56.% M (:-4:) of 54.% PM (4:-7:) of 4 5.6% 7:-7: % 9.%.7% 6.%.%.%.%.4%.4% 666 of % AM (7:-:) of 75 6.% M (:-4:) of % PM (4:-7:) of 57.% 7:-7: % 7.%.% 6.7%.6%.6%.%.%.% 745 of % TOTAL by Vehicle Class Light (A) (B to X) B C E TOTAL by Time of ay F G H X % % 4% 6% % % Creative Transportation Solutions Ltd. Project #6- Commercial Vehicle Screenline Surveys
246 Summary Station Report Station I MONTH/YEAR: March. Comments: Pattullo Bridge Surrey / New Westminster / Coquitlam Screenline AY OF WEEK: Wednesday ay of Commercial Truck Volume - Non-angerous and angerous Goods All Trucks (veh./ min.) 6 4 7: : 9: : : : : 4: 5: 6: 7: Time Beginning Non-G G Non-G G Non-G G TOTAL 7: : : : : : 4 4 : : : : : : : : : : : : : 4 4 6: : TOTAL 5 (.%) 66 (.4%) 49 6 (.%) 5 angerous Goods Placards - Hazard Classes TOTAL by Hazard Class Class Class Class Class 4 Class 5 Class 6 Class 7 Class Class 9 ANGER TOTAL 7:-7:.% 5.4% 4.6%.%.%.%.%.%.%.% 7:-7: % 9.% 57.7%.%.%.%.%.%.% 9.% :-7:.% 7.9% 66.7%.%.%.%.%.6%.%.% Please note: The total number of placards may differ from the total number of vehicles due to vehicles having more than one placard. Placards where the class number could not be determined are not included in the Hazard Class total. 9 Commercial Truck Volume - Truck Classification LIGHT TRUCK HEAVY TRUCK TOTALS A B C E F G H X Single rear-axle Tractor Tractor w. Tractor w. Flatbed w. Tractor w. Tanker only chassis container commodity trailer (any) Construction Other HEAVY vs. ALL % HEAVY AM (7:-:) of 6 6.9% M (:-4:) of % PM (4:-7:) of 66.% 7:-7: % 4.9% 4.% 9.5% 5.7% 7.%.5% 9.%.% 99 of % AM (7:-:) of 57 6.% M (:-4:) of 66 6.% PM (4:-7:) of 46 7.% 7:-7: % 5.%.6%.% 5.9% 9.%.5%.% 9.% 4 of % AM (7:-:) of 5 65.% M (:-4:) of % PM (4:-7:) of % 7:-7: % 5.% 6.4% 9.% 5.%.%.5%.%.% 9 of 5 67.% TOTAL by Vehicle Class Light (A) (B to X) B C TOTAL by Time of ay E F G H X % % 4% 6% % % Creative Transportation Solutions Ltd. Project #6- Commercial Vehicle Screenline Surveys
247 Summary Station Report Station I MONTH/YEAR: March. Comments: Pattullo Bridge Surrey / New Westminster / Coquitlam Screenline AY OF WEEK: Thursday ay of Commercial Truck Volume - Non-angerous and angerous Goods All Trucks (veh./ min.) : : 9: : : : : 4: 5: 6: 7: Time Beginning Non-G G Non-G G Non-G G TOTAL 7: : : : : : 9 : : 9 9 : : : 6 9 : : : : : : : : : 69 7: TOTAL 5 7 (.%) 96 (.%) 54 9 (.%) 54 angerous Goods Placards - Hazard Classes TOTAL by Hazard Class Class Class Class Class 4 Class 5 Class 6 Class 7 Class Class 9 ANGER TOTAL 7:-7: 7:-7:.% 7.6% 64.7%.%.%.%.%.% 5.9%.% 9.% 6.% 44.%.%.%.%.% 4.% 4.%.% :-7:.%.6% 5.4%.%.%.%.%.4% 4.%.9% Please note: The total number of placards may differ from the total number of vehicles due to vehicles having more than one placard. Placards where the class number could not be determined are not included in the Hazard Class total. 4 Commercial Truck Volume - Truck Classification LIGHT TRUCK HEAVY TRUCK TOTALS A B C E F G H X Single rear-axle Tractor Tractor w. Tractor w. Flatbed w. Tractor w. Tanker only chassis container commodity trailer (any) Construction Other HEAVY vs. ALL % HEAVY AM (7:-:) of % M (:-4:) of 5 7.7% PM (4:-7:) of % 7:-7: % 4.4% 4.5%.7% 4.%.%.%.%.5% of % AM (7:-:) of % M (:-4:) of 69.% PM (4:-7:) of % 7:-7: % 6.%.5%.7%.9%.7%.% 4.5%.% 6 of % AM (7:-:) of 6.% M (:-4:) of 7.% PM (4:-7:) of % 7:-7: % 5.4% 6.7%.7% 4.%.5%.% 4.% 9.6% of % TOTAL by Vehicle Class Light (A) (B to X) B C E TOTAL by Time of ay F G H % % 4% 6% % % X Creative Transportation Solutions Ltd. Project #6- Commercial Vehicle Screenline Surveys
248 Summary Station Report Station I MONTH/YEAR: March. Comments: Port Mann Bridge Surrey / New Westminster / Coquitlam Screenline AY OF WEEK: Tuesday ay of Commercial Truck Volume - Non-angerous and angerous Goods All Trucks (veh./ min.) : : 9: : : : : 4: 5: 6: 7: Time Beginning Non-G G Non-G G Non-G G TOTAL 7: : : : : : : : : : : : : : : : : : : : : TOTAL 67 5 (.6%) 57 (4.4%) 674 (.4%) 696 angerous Goods Placards - Hazard Classes TOTAL by Hazard Class Class Class Class Class 4 Class 5 Class 6 Class 7 Class Class 9 ANGER TOTAL 7:-7: 7:-7: % 9.9% 7.%.%.9%.%.% 5.4%.%.6% 5 9.% 4.% 6.4%.%.7%.7%.% 7.6%.% 5.5% :-7:.%.% 65.6%.%.%.4%.% 6.6%.%.6% Please note: The total number of placards may differ from the total number of vehicles due to vehicles having more than one placard. Placards where the class number could not be determined are not included in the Hazard Class total. 56 Commercial Truck Volume - Truck Classification LIGHT TRUCK HEAVY TRUCK TOTALS A B C E F G H X Single rear-axle Tractor Tractor w. Tractor w. Flatbed w. Tractor w. Tanker only chassis container commodity trailer (any) Construction Other HEAVY vs. ALL % HEAVY AM (7:-:) of % M (:-4:) of 5 6.9% PM (4:-7:) of 79 6.% 7:-7: % 4.9%.6% 5.7% 5.%.%.% 9.%.7% 4 of 97 6.% AM (7:-:) of % M (:-4:) of 5 59.% PM (4:-7:) of 7 6.% 7:-7: % 4.%.% 7.% 4.%.%.% 7.4%.% 759 of 99 5.% AM (7:-:) of 5.9% M (:-4:) of % PM (4:-7:) of % 7:-7: % 4.%.% 6.% 4.7% 9.4%.4%.4%.% 49 of % TOTAL by Vehicle Class Light (A) (B to X) B C E TOTAL by Time of ay F G H X % % 4% 6% % % Creative Transportation Solutions Ltd. Project #6- Commercial Vehicle Screenline Surveys
249 Summary Station Report Station I MONTH/YEAR: March. Comments: Port Mann Bridge Surrey / New Westminster / Coquitlam Screenline AY OF WEEK: Wednesday ay of Commercial Truck Volume - Non-angerous and angerous Goods All Trucks (veh./ min.) : : 9: : : : : 4: 5: 6: 7: Time Beginning Non-G G Non-G G Non-G G TOTAL 7: : : : : : : : : : : : : : : : : : : : : TOTAL 76 6 (.7%) 94 (4.%) (.%) 6997 angerous Goods Placards - Hazard Classes TOTAL by Hazard Class Class Class Class Class 4 Class 5 Class 6 Class 7 Class Class 9 ANGER TOTAL 7:-7: 7:-7: 7:-7: %.%.% 4.%.%.% 6.% 6.6% 6.4%.%.%.%.%.%.%.%.%.%.9%.7%.%.%.%.4%.9%.%.6%.6% 7.%.% Please note: The total number of placards may differ from the total number of vehicles due to vehicles having more than one placard. Placards where the class number could not be determined are not included in the Hazard Class total Commercial Truck Volume - Truck Classification LIGHT TRUCK HEAVY TRUCK TOTALS A B C E F G H X Single rear-axle Tractor Tractor w. Tractor w. Flatbed w. Tractor w. Tanker only chassis container commodity trailer (any) Construction Other HEAVY vs. ALL % HEAVY AM (7:-:) of % M (:-4:) of % PM (4:-7:) of 66 6.% 7:-7: % 4.%.7%.% 7.%.%.9% 6.%.% 5 of 9 6.% AM (7:-:) of 9 57.% M (:-4:) of % PM (4:-7:) of 7 5.% 7:-7: % 4.4%.9%.%.6% 7.7%.% 6.%.7% 777 of 5 5.9% AM (7:-:) of 5 6.% M (:-4:) of % PM (4:-7:) of 54 5.% 7:-7: % 4.%.9%.% 5.7% 5.%.% 6.%.4% 477 of % TOTAL by Vehicle Class Light (A) (B to X) B C E F TOTAL by Time of ay G H X % % 4% 6% % % Creative Transportation Solutions Ltd. Project #6- Commercial Vehicle Screenline Surveys
250 Summary Station Report Station I MONTH/YEAR: March. Comments: Brunette Avenue, south of Highway Burnaby/Coquitlam Municipal Boundary (west of North Road) Screenline AY OF WEEK: Monday ay of Commercial Truck Volume - Non-angerous and angerous Goods All Trucks (veh./ min.) : : 9: : : : : 4: 5: 6: 7: Time Beginning Non-G G Non-G G Non-G G TOTAL 7: : : : : : : : : : : : : : : : : : : : : TOTAL 46 5 (.6%) 65 5 (.%) 5 (.%) 54 angerous Goods Placards - Hazard Classes TOTAL by Hazard Class Class Class Class Class 4 Class 5 Class 6 Class 7 Class Class 9 ANGER TOTAL 7:-7: 7:-7: 7:-7: %.%.% 9.6%.6% 6.6% 46.% 5.9% 4.6%.%.%.%.9%.%.9%.%.%.%.%.%.%.7% 5.5% 4.6%.%.6%.%.5% 6.4% 7.4% Please note: The total number of placards may differ from the total number of vehicles due to vehicles having more than one placard. Placards where the class number could not be determined are not included in the Hazard Class total Commercial Truck Volume - Truck Classification LIGHT TRUCK HEAVY TRUCK TOTALS A B C E F G H X Single rear-axle Tractor Tractor w. Tractor w. Flatbed w. Tractor w. Tanker only chassis container commodity trailer (any) Construction Other HEAVY vs. ALL % HEAVY AM (7:-:) of 64 7.% M (:-4:) of 7 7.4% PM (4:-7:) of 5 74.% 7:-7: % 6.% 5.4%.%.% 9.%.4%.5% 4.% of 96 7.% AM (7:-:) of % M (:-4:) of 99 7.% PM (4:-7:) of % 7:-7: % 6.%.% 7.% 4.%.%.4% 5.4%.7% 6 of 5 7.5% AM (7:-:) of 7.% M (:-4:) of 5 7.% PM (4:-7:) of 5 7.4% 7:-7: % 6.% 4.%.%.%.%.% 4.%.% 54 of 54 7.% TOTAL by Vehicle Class Light (A) (B to X) B C E TOTAL by Time of ay F G H X % % 4% 6% % % Creative Transportation Solutions Ltd. Project #6- Commercial Vehicle Screenline Surveys
251 Summary Station Report Station I MONTH/YEAR: April. Comments: Brunette Avenue, south of Highway Burnaby/Coquitlam Municipal Boundary (west of North Road) Screenline AY OF WEEK: Tuesday ay of Commercial Truck Volume - Non-angerous and angerous Goods All Trucks (veh./ min.) : : 9: : : : : 4: 5: 6: 7: Time Beginning Non-G G Non-G G Non-G G TOTAL 7: : : : : : : : : 6 5 : : : : : : : : 6 7 5: : 9 6: : TOTAL (.%) 54 4 (.9%) (.%) 544 angerous Goods Placards - Hazard Classes TOTAL by Hazard Class Class Class Class Class 4 Class 5 Class 6 Class 7 Class Class 9 ANGER TOTAL :-7: 6.% 5.4%.%.6%.%.%.6%.%.% 7.% 7:-7: 7:-7: %.%.7% 4.% 5.% 4.%.%.9%.%.9%.%.%.%.9%.4%.%.%.9% 9.% 9.6% Please note: The total number of placards may differ from the total number of vehicles due to vehicles having more than one placard. Placards where the class number could not be determined are not included in the Hazard Class total Commercial Truck Volume - Truck Classification LIGHT TRUCK HEAVY TRUCK TOTALS A B C E F G H X Single rear-axle Tractor Tractor w. Tractor w. Flatbed w. Tractor w. Tanker only chassis container commodity trailer (any) Construction Other HEAVY vs. ALL % HEAVY AM (7:-:) of % M (:-4:) of 9 75.% PM (4:-7:) of % 7:-7: % 5.% 5.% 4.4%.%.5%.% 6.% 5.% 4 of % AM (7:-:) of % M (:-4:) of 95.% PM (4:-7:) of % 7:-7: % 6.% 7.%.5%.%.%.7%.% 6.7% 67 of % AM (7:-:) of 7 7.9% M (:-4:) of 79 7.% PM (4:-7:) of % 7:-7: % 5.9% 5.9% 7.9%.%.%.% 7.4%.6% 74 of % Light (A) TOTAL by Vehicle Class (B to X) B C E TOTAL by Time of ay F G H X % % 4% 6% % % Creative Transportation Solutions Ltd. Project #6- Commercial Vehicle Screenline Surveys
252 Pitt River Bridge Summary Station Report Station I MONTH/YEAR: March AY OF WEEK: Thursday. Pitt Meadows / Port Coquitlam Screenline ay of Comments: Traffic very slow from 5: to 7:. Commercial Truck Volume - Non-angerous and angerous Goods All Trucks (veh./ min.) : : 9: : : : : 4: 5: 6: 7: Time Beginning Non-G G Non-G G Non-G G TOTAL 7: : : : : : : : : : : : : : : : : : : : : 6 46 TOTAL 79 4 (.%) (.%) 76 7 (.5%) angerous Goods Placards - Hazard Classes TOTAL by Hazard Class Class Class Class Class 4 Class 5 Class 6 Class 7 Class Class 9 ANGER TOTAL 7:-7: %.% 57.%.%.%.%.% 4.4%.% 5.6% 45 7:-7:.%.% 6.9%.%.%.%.% 5.6%.%.% :-7:.% 4.% 6.5%.%.%.%.% 4.9%.%.5% Please note: The total number of placards may differ from the total number of vehicles due to vehicles having more than one placard. Placards where the class number could not be determined are not included in the Hazard Class total. Commercial Truck Volume - Truck Classification LIGHT TRUCK HEAVY TRUCK TOTALS A B C E F G H X Single rear-axle Tractor Tractor w. Tractor w. Flatbed w. Tractor w. Tanker only chassis container commodity trailer (any) Construction Other HEAVY vs. ALL % HEAVY AM (7:-:) of 4 66.% M (:-4:) of % PM (4:-7:) of 7 6.5% 7:-7: %.%.7%.5%.% 9.%.%.4% 9.7% 9 of 49 6.% AM (7:-:) of % M (:-4:) of % PM (4:-7:) of 7 6.% 7:-7: % 6.7% 5.5%.%.% 9.5%.% 9.7%.% 946 of % AM (7:-:) of 5 6.6% M (:-4:) of % PM (4:-7:) of 79 6.% 7:-7: % 5.%.6%.4%.4% 9.%.%.6%.9% 7 of 64.% TOTAL by Vehicle Class Light (A) (B to X) B C E F G H TOTAL by Time of ay % % 4% 6% % % X Creative Transportation Solutions Ltd. Project #6- Commercial Vehicle Screenline Surveys
253 Summary Station Report Station I MONTH/YEAR: April. Comments: Pitt River Bridge Pitt Meadows / Port Coquitlam Screenline AY OF WEEK: Tuesday ay of Commercial Truck Volume - Non-angerous and angerous Goods All Trucks (veh./ min.) : : 9: : : : : 4: 5: 6: 7: Time Beginning Non-G G Non-G G Non-G G TOTAL 7: : 59 6 : : : : : : : : : : : : : : : : : : : TOTAL 7 4 (.4%) 56 6 (.%) 7 79 (.4%) 5 angerous Goods Placards - Hazard Classes TOTAL by Hazard Class Class Class Class Class 4 Class 5 Class 6 Class 7 Class Class 9 ANGER TOTAL 7:-7: 7:-7: 7:-7: %.%.% 4.5% 6.%.% 47.% 55.% 5.5%.%.%.%.%.%.%.%.%.%.%.%.% 5.5%.%.6%.%.%.%.9% 5.%.6% 55 9 Please note: The total number of placards may differ from the total number of vehicles due to vehicles having more than one placard. Placards where the class number could not be determined are not included in the Hazard Class total. Commercial Truck Volume - Truck Classification TOTAL by Vehicle Class LIGHT TRUCK HEAVY TRUCK TOTALS A B C E F G H X Single rear-axle Tractor Tractor w. Tractor w. Flatbed w. Tractor w. Tanker only chassis container commodity trailer (any) Construction Other HEAVY vs. ALL % HEAVY AM (7:-:) of 56 6.% M (:-4:) of 69 6.% PM (4:-7:) of % 7:-7: %.9%.%.% 4.% 5.%.%.5% 9.6% 54 of % AM (7:-:) of % M (:-4:) of % PM (4:-7:) of 4 6.% 7:-7: %.%.9%.7%.6% 7.%.%.% 9.% 967 of % AM (7:-:) of 6 6.% M (:-4:) of 6 6.5% PM (4:-7:) of % 7:-7: %.%.4%.5%.5% 6.%.% 9.7% 9.7% of 5 6.% Light (A) (B to X) B C E F G H TOTAL by Time of ay % % 4% 6% % % X Creative Transportation Solutions Ltd. Project #6- Commercial Vehicle Screenline Surveys
254 Summary Station Report Station I MONTH/YEAR: March. Comments: River Road, west of Nordel Way elta (west of Highway 9) Screenline AY OF WEEK: Friday ay of Commercial Truck Volume - Non-angerous and angerous Goods All Trucks (veh./ min.) : : 9: : : : : 4: 5: 6: 7: Time Beginning Non-G G Non-G G Non-G G TOTAL 7: 5 6 7: : : : : : : : : : : 6 4 : 97 9 : : : 7 7 5: : : : : TOTAL 97 (.5%) (.%) 7 6 (.7%) 9 angerous Goods Placards - Hazard Classes TOTAL by Hazard Class Class Class Class Class 4 Class 5 Class 6 Class 7 Class Class 9 ANGER TOTAL 7:-7: 7:-7: 7.6% 4.%.4%.% 5.%.%.%.6%.6% 4.% 7.%.% 4.4%.%.%.%.% 6.7% 4.4% 7.% :-7:.% 7.7%.7%.%.6%.%.% 4.%.6% 6.% Please note: The total number of placards may differ from the total number of vehicles due to vehicles having more than one placard. Placards where the class number could not be determined are not included in the Hazard Class total Commercial Truck Volume - Truck Classification LIGHT TRUCK HEAVY TRUCK TOTALS A B C E F G H X Single rear-axle Tractor Tractor w. Tractor w. Flatbed w. Tractor w. Tanker only chassis container commodity trailer (any) Construction Other HEAVY vs. ALL % HEAVY AM (7:-:) of % M (:-4:) of % PM (4:-7:) of 66.9% 7:-7: % 9.7%.% 7.% 4.% 7.6%.9% 9.7% 7.% 5 of 7 7.% AM (7:-:) of 69 7.% M (:-4:) of 7 6.% PM (4:-7:) of 44 7.% 7:-7: % 7.% 6.9% 4.6% 4.7% 7.%.%.% 9.5% 4 of % AM (7:-:) of % M (:-4:) of % PM (4:-7:) of 6 77.% 7:-7: %.5% 9.6% 5.% 4.4% 7.7%.%.9%.4% 9 of 9 74.% TOTAL by Vehicle Class Light (A) (B to X) B C E TOTAL by Time of ay F G H X % % 4% 6% % % Creative Transportation Solutions Ltd. Project #6- Commercial Vehicle Screenline Surveys
255 Summary Station Report Station I MONTH/YEAR: May. Comments: River Road, west of Nordel Way elta (west of Highway 9) Screenline AY OF WEEK: Wednesday ay of Commercial Truck Volume - Non-angerous and angerous Goods All Trucks (veh./ min.) : : 9: : : : : 4: 5: 6: 7: Time Beginning Non-G G Non-G G Non-G G TOTAL 7: : : : : : : : : : : : : : : : : : : : : TOTAL 6 4 (.6%) 4 4 (.%) 4 77 (.%) 47 angerous Goods Placards - Hazard Classes TOTAL by Hazard Class Class Class Class Class 4 Class 5 Class 6 Class 7 Class Class 9 ANGER TOTAL 5 7:-7:.% 9.5%.%.%.%.%.6% 5.%.6%.9% 7:-7: 7:-7: %.% 6.5%.%.6% 6.4%.%.%.%.%.%.%.%.%.% 9.%.%.%.6%.7% Please note: The total number of placards may differ from the total number of vehicles due to vehicles having more than one placard. Placards where the class number could not be determined are not included in the Hazard Class total Commercial Truck Volume - Truck Classification LIGHT TRUCK HEAVY TRUCK TOTALS A B C E F G H X Single rear-axle Tractor Tractor w. Tractor w. Flatbed w. Tractor w. Tanker only chassis container commodity trailer (any) Construction Other HEAVY vs. ALL % HEAVY AM (7:-:) of % M (:-4:) of 4 76.% PM (4:-7:) of % 7:-7: %.7%.% 6.% 5.%.%.%.%.5% 56 of % AM (7:-:) of % M (:-4:) of 5 7.5% PM (4:-7:) of 5 74.% 7:-7: %.% 6.% 5.4%.6%.4%.% 9.% 7.7% 6 of 4 74.% AM (7:-:) of % M (:-4:) of % PM (4:-7:) of 74 7.% 7:-7: %.%.4%.% 4.4%.%.4% 9.%.% 5 of % Light (A) TOTAL by Vehicle Class (B to X) B C TOTAL by Time of ay E F G H X % % 4% 6% % % Creative Transportation Solutions Ltd. Project #6- Commercial Vehicle Screenline Surveys
256 Summary Station Report Station I MONTH/YEAR: March. Comments: Knight Street, north of 4st Avenue Mid-Vancouver Screenline AY OF WEEK: Monday ay of Commercial Truck Volume - Non-angerous and angerous Goods All Trucks (veh./ min.) 6 4 7: : 9: : : : : 4: 5: 6: 7: Time Beginning Non-G G Non-G G Non-G G TOTAL 7: : 6 5 : : : : : : : : : : 75 4 : : : : : : 74 6: : : TOTAL 4 (.6%) 5 (.7%) 576 (.7%) 594 angerous Goods Placards - Hazard Classes TOTAL by Hazard Class Class Class Class Class 4 Class 5 Class 6 Class 7 Class Class 9 ANGER TOTAL 7:-7: 9.%.%.%.%.%.%.%.%.%.% 7:-7: 6.%.% 54.5%.%.%.%.% 9.% 9.% 7.% 7 5 7:-7:.% 5.% 5.% 5.%.%.%.%.%.% 5.% Please note: The total number of placards may differ from the total number of vehicles due to vehicles having more than one placard. Placards where the class number could not be determined are not included in the Hazard Class total. 9 4 Commercial Truck Volume - Truck Classification LIGHT TRUCK HEAVY TRUCK TOTALS A B C E F G H X Single rear-axle Tractor Tractor w. Tractor w. Flatbed w. Tractor w. Tanker only chassis container commodity trailer (any) Construction Other HEAVY vs. ALL % HEAVY AM (7:-:) of % M (:-4:) of 56 6.% PM (4:-7:) of % 7:-7: %.6%.% 9.%.%.%.% 7.%.9% 75 of 49 6.% AM (7:-:) of % M (:-4:) of % PM (4:-7:) of 4 6.% 7:-7: %.7% 6.%.%.% 9.%.% 7.%.% 94 of % AM (7:-:) of % M (:-4:) of 7 6.% PM (4:-7:) of % 7:-7: %.7%.%.7%.% 9.7%.% 7.%.5% 644 of % Light (A) TOTAL by Vehicle Class (B to X) B C TOTAL by Time of ay E F G H X % % 4% 6% % % Creative Transportation Solutions Ltd. Project #6- Commercial Vehicle Screenline Surveys
257 Summary Station Report Station I MONTH/YEAR: May. Comments: Knight Street, north of 4st Avenue Mid-Vancouver Screenline AY OF WEEK: Tuesday ay of Commercial Truck Volume - Non-angerous and angerous Goods All Trucks (veh./ min.) : : 9: : : : : 4: 5: 6: 7: Time Beginning Non-G G Non-G G Non-G G TOTAL 7: : : : : : : 9 : 4 9 : : : : : : : 9 9 4: : 6 6 5: : : 5 7: TOTAL (.6%) 69 (.%) 5 (.%) 6 angerous Goods Placards - Hazard Classes TOTAL by Hazard Class Class Class Class Class 4 Class 5 Class 6 Class 7 Class Class 9 ANGER TOTAL 5 7:-7:.%.%.%.%.%.%.%.%.% 5.% 7:-7: 7:-7: 6.%.% 5.%.5% 4.7% 5.%.%.% 4.%.9%.%.%.%.9%.5%.% 4.%.9%.5%.5% Please note: The total number of placards may differ from the total number of vehicles due to vehicles having more than one placard. Placards where the class number could not be determined are not included in the Hazard Class total Commercial Truck Volume - Truck Classification LIGHT TRUCK HEAVY TRUCK TOTALS A B C E F G H X Single rear-axle Tractor Tractor w. Tractor w. Flatbed w. Tractor w. Tanker only chassis container commodity trailer (any) Construction Other HEAVY vs. ALL % HEAVY AM (7:-:) of 6 6.5% M (:-4:) of 65 6.% PM (4:-7:) of 5.6% 7:-7: %.6% 5.6%.%.9% 5.%.% 9.% 5.% 96 of % AM (7:-:) of % M (:-4:) of % PM (4:-7:) of % 7:-7: %.5%.%.6%.7% 7.%.5% 9.% 5.6% 95 of 6 67.% AM (7:-:) of 9 64.% M (:-4:) of 5 6.% PM (4:-7:) of 7 64.% 7:-7: %.5% 4.% 5.%.% 6.%.% 9.% 5.% 57 of 6 64.% Light (A) TOTAL by Vehicle Class (B to X) B C TOTAL by Time of ay E F G H X % % 4% 6% % % Creative Transportation Solutions Ltd. Project #6- Commercial Vehicle Screenline Surveys
258 , British Columbia Ministry of Transportation, TransLink APPENIX F AITIONAL ANGEROUS GOOS MAPS AN TABLES 4 angerous Goods and Truck Classification Survey
259 , British Columbia Ministry of Transportation, TransLink Exhibit F. Top Class Stations (Liquefied or Compressed Gases) Class Total Class Placards Stn # Location and escription Rank Placards Abs. % 9. Alex Fraser Bridge %. Port Mann Bridge % 6.4 Queensborough Bridge % 4. Highway 9, mid-richmond 65 5 % 5.6 Highway, west of North Road 75 5 % 6. Brunette Avenue, south of Highway 5 4% 7. River Road, west of Highway 9 5 5% 7. Highway, FVR/GVR Boundary 4 5 % 9. Pitt River Bridge 5 5% 6. Highway, west of th Street 5 5 7% 6. 96th Avenue, west of th Street 75 5 % 6. Knight Street Bridge 9 5 % 4. Highway 5, north of Border % 4. Second Narrows Bridge % Highway, west of th Street % th Street, south of Highway 5 5% 7 6. Oak Street Bridge 5 5% 5.6 9nd Street, south of Highway 5 5% Marine Way, west of Boundary Road 4 5% 9. Highway 99, south of Squamish 5 9% Exhibit F. Top Class Stations (Flammable Liquids) Class Total Class Placards Stn # Location and escription Rank Placards Abs. %.6 Highway, west of North Road 75 7%. Port Mann Bridge % 6. Highway, west of th Street 5 7% 4. Highway 9, mid-richmond % 5 9. Alex Fraser Bridge 55 % 6 7. Highway, FVR/GVR Boundary % 7 7. Airport Connector / Moray Bridge % 4. Highway 5, north of Border 6 6% 9. Brunette Avenue, south of Highway 5 5 4%. Pitt River Bridge 5 5%. Second Narrows Bridge 45 45% 6.4 Queensborough Bridge %. Highway, west of Hope % 4 6. Knight Street Bridge 9 5 9% 5. Pattullo Bridge % th Avenue, west of th Street 75 7% 7. River Road, west of Highway 9 % 6.7 Highway, west of th Street 55 6% 9 9. Highway 99, south of Squamish 5 5 4% 5.6 Marine Way, west of Boundary Road 4 5 % angerous Goods and Truck Classification Survey 4
260 , British Columbia Ministry of Transportation, TransLink Exhibit F. Top Class Locations (Liquefied or Compressed Gases) 4 angerous Goods and Truck Classification Survey
261 , British Columbia Ministry of Transportation, TransLink Exhibit F.4 Top Class Locations (Flammable Liquids) angerous Goods and Truck Classification Survey 4
262 , British Columbia Ministry of Transportation, TransLink Orange cells Ranks to 5 in each class Yellow cells Ranks 6 to in each class Exhibit F.5 Hazardous Goods Rankings for All Stations ( of ) G Trucks Hazard Class Rank G Truck Rank Station Number and escription Total Trucks Absolute % Explosives Gases Flammable Liquids Flammable Solids Oxidizing Substances Toxic / Infectious Substances Radioactive Substances Corrosive Substances Miscellaneous Substances anger.6 Highway, west of North Road % Port Mann Bridge 69.% Alex Fraser Bridge 6497.% Highway, west of th Street % Highway 9 (mid-richmond) 49.% Highway, FVR/GVR boundary 5 66.% Queensborough Bridge % 6 5. Brunette Avenue, south of Highway 97 5.% Second Narrows Bridge 96 4.% Highway 5, north of Border % Pitt River Bridge % 6. River Road, west of Highway % Airport Connector / Moray Bridge % Knight Street Bridge % Highway, west of Hope % th Avenue, west of th Street % Highway, west of th Street 47 9.% Pattullo Bridge 64.% Marine Way, west of Boundary Road 7.4% Highway 99, south of Squamish % th Street, south of Highway % Knight Street, north of 4st Avenue 5 95.% Highway 7, FVR/GVR boundary 466.6% Westminster Highway (mid-richmond) 745.% nd Street, south of Highway 4.9% angerous Goods and Truck Classification Survey
263 , British Columbia Ministry of Transportation, TransLink Exhibit F.5 Hazardous Goods Rankings for All Stations ( of ) G Trucks Hazard Class Rank G Truck Rank Station Number and escription Total Trucks Absolute % Explosives Gases Flammable Liquids Flammable Solids Oxidizing Substances Toxic / Infectious Substances Radioactive Substances Corrosive Substances Miscellaneous Substances anger 6.5 Boundary Road, north of Kingsway 7.% Oak Street Bridge 9.% Arthur Laing Bridge 7 54.% McGill Street, west of Highway 6 96.% Highway 7, east of Gaglardi Way 5 46.% Highway 7, west of Boundary Road 5.5% Highway 5, south of Highway 5 7.% King George Highway, south of Highway 6.5% nd Street, south of Highway.9% Highway 99, west of Highway 9 7.6% th Avenue, west of th Street 7.5% Southwest Marine rive, west of Blanca Street 94.% North Road, south of Highway 64.6% Hastings Street, west Highway 9.% Grandview Highway, west of Boundary Road 4.9% Hastings Street, west of Main Street 5.9% th Avenue, west of Boundary Road 676.5% Fraser Highway, FVR/GVR boundary 76.% Highway, north of Border 9 6.% Highway 7a, west of North Road 9.7% ewdney Trunk Road, FVR/GVR boundary 7.% st Avenue, west of Highway 6.% George Massey Tunnel 57.% Oak Street, north of 4st Avenue 7 4.7% Quebec Street, north of Terminal Avenue 7 75.% angerous Goods and Truck Classification Survey 45
264 , British Columbia Ministry of Transportation, TransLink Exhibit F.5 Hazardous Goods Rankings for All Stations ( of ) G Trucks Hazard Class Rank G Truck Rank Station Number and escription Total Trucks Absolute % Explosives Gases Flammable Liquids Flammable Solids Oxidizing Substances Toxic / Infectious Substances Radioactive Substances Corrosive Substances Miscellaneous Substances anger 5. Burrard Street Bridge % Cordova Street, west of Main Street 6 7.6% Highway, west of Highway % No. Road Bridge 5 45.% Kingsway, west of Boundary Road % Fraser Highway, west of th Street 4 5.% th Avenue, west of th Street 4 4.% Main Street, north of 4st Avenue 4 6.6% University Boulevard, west of Blanca Street.% Powell Street, west of Main Street.% Highway, north of Border 495.6% Granville Street Bridge 9.4% W. 6th Avenue, west of Blanca Street.5% Waterfront Street, west of Main Street.% insmore Bridge.7% Highway 7, west of Hope 49.5% Lions Gate Bridge 467.4% unsmuir Street, west of Main Street 44.4% angerous Goods and Truck Classification Survey
265 , British Columbia Ministry of Transportation, TransLink angerous Goods and Truck Classification Survey 47
266 , British Columbia Ministry of Transportation, TransLink APPENIX G AITIONAL TRUCK CLASSIFICATION MAPS AN TABLES 4 angerous Goods and Truck Classification Survey
267 , British Columbia Ministry of Transportation, TransLink Exhibit G. Truck Classification Rankings for All Stations ( of ) Orange cells Ranks to 5 in each class Yellow cells Ranks 6 to in each class Truck Classification Rank Overall Truck Rank Station Number and escription Total Trucks Light Trucks Trucks % Light Trucks Trucks Tractor Only Marine Container / Chassis Flatbed with Commodity Tractor with Trailer Tanker Construction Vehicle Other. Port Mann Bridge % Highway, west of North Road % Alex Fraser Bridge % Knight Street Bridge % Highway, FVR/GVR boundary % Queensborough Bridge % Highway, west of th Street % George Massey Tunnel % Brunette Avenue, south of Highway % Highway 9 (mid-richmond) % Second Narrows Bridge % River Road, west of Highway % 7 4. Pattullo Bridge % Pitt River Bridge % Knight Street, north of 4st Avenue % Westminster Highway (mid-richmond) % Marine Way, west of Boundary Road % th Avenue, west of th Street % Highway 99, west of Highway % McGill Street, west of Highway % Highway, west of th Street % Oak Street Bridge % th Avenue, west of th Street % Boundary Road, north of Kingsway % Highway, west of Hope % angerous Goods and Truck Classification Survey 49
268 , British Columbia Ministry of Transportation, TransLink Exhibit G. Truck Classification Rankings for All Stations ( of ) Truck Classification Rank Overall Truck Rank Station Number and escription Total Trucks Light Trucks Trucks % Light Trucks Trucks Tractor Only Marine Container / Chassis Flatbed with Commodity Tractor with Trailer Tanker Construction Vehicle Other 6 7. Airport Connector / Moray Bridge % Arthur Laing Bridge % Highway 7, FVR/GVR boundary % nd Street, south of Highway % Highway 5, north of Border 7 6.5% Grandview Highway, west of Boundary Road % nd Street, south of Highway % Highway 5, south of Highway % Hastings Street, west Highway % Highway 7, west of Boundary Road % th Street, south of Highway % King George Highway, south of Highway % Highway 7, east of Gaglardi Way % Granville Street Bridge % st Avenue, west of Highway % Georgia Street, west of Main Street % Fraser Highway, FVR/GVR boundary % Burrard Street Bridge % Highway, west of Highway % Quebec Street, north of Terminal Avenue % North Road, south of Highway % th Avenue, west of Boundary Road % Main Street, north of 4st Avenue % Granville Street, north of 4st Avenue % Kingsway, west of Boundary Road % angerous Goods and Truck Classification Survey
269 , British Columbia Ministry of Transportation, TransLink Exhibit G. Truck Classification Rankings for All Stations ( of ) Truck Classification Rank Overall Truck Rank Station Number and escription Total Trucks Light Trucks Trucks % Light Trucks Trucks Tractor Only Marine Container / Chassis Flatbed with Commodity Tractor with Trailer Tanker Construction Vehicle Other Hastings Street, west of Main Street % Cambie Street Bridge 5 6.% Highway, north of Border % unsmuir Street, west of Main Street % Lions Gate Bridge % Highway 99, south of Squamish % th Avenue, west of Boundary Road % Highway 7, west of Hope 49 4.% Oak Street, north of 4st Avenue % No. Road Bridge % Southwest Marine rive, west of Blanca Street % th Avenue, west of th Street 4.4% Cordova Street, west of Main Street % Highway 7a, west of North Road % Fraser Highway, west of th Street % Highway, north of Border % Powell Street, west of Main Street % insmore Bridge 4 5.% Waterfront Street, west of Main Street 5 5.% W. 6th Avenue, west of Blanca Street % University Boulevard, west of Blanca Street 6 4.% ewdney Trunk Road, FVR/GVR boundary % angerous Goods and Truck Classification Survey 5
270 , British Columbia Ministry of Transportation, TransLink Exhibit G. Top Tractor Only Locations 5 angerous Goods and Truck Classification Survey
271 , British Columbia Ministry of Transportation, TransLink Exhibit G. Top Marine Container and Marine Container Chassis Locations angerous Goods and Truck Classification Survey 5

272 , British Columbia Ministry of Transportation, TransLink Exhibit G.4 Top Flatbed with Commodity Locations 54 angerous Goods and Truck Classification Survey
Classification Surveys 2008
 Dangerous Goods and Truck Classification Surveys 2008 Metro Vancouver, British Columbia 2 Introduction ti Conducted in Spring 2008 throughout Metro Vancouver Two objectives to better understand: d 1) Dangerous
PDF Version. HIGHWAY ACT REGULATIONS published by Quickscribe Services Ltd.
 PDF Version [Printer-friendly - ideal for printing entire document] HIGHWAY ACT REGULATIONS published by DISCLAIMER: These documents are provided for private study or research purposes only. Every effort
Jeffrey Busby A/Director, Infrastructure Program Management TransLink Urban Sustainability Accelerator
 TransLink: A multi-modal, integrated transport and operations system Jeffrey Busby A/Director, Infrastructure Program Management TransLink Urban Sustainability Accelerator Is the Grass Greener? Transportation
Hazardous Materials Transportation Study for Contra Costa County
 Hazardous Materials Transportation Study for Contra Costa County Contra Costa Health Services Hazardous Materials Programs Randall Sawyer, Nathaniel Zuckerman, and Neal Price California Department of Health
10-Year Vision Update. Vancouver City Council May 2, 2017
 1 10-Year Vision Update Vancouver City Council May 2, 2017 The 10-year Vision is our Regional Blueprint for Multimodal Transportation Investments Welcome 1 million more people and 500,000 more jobs in
CITY OF VANCOUVER ADMINISTRATIVE REPORT
 Supports Item No. 1 T&T Committee Agenda May 13, 2008 CITY OF VANCOUVER ADMINISTRATIVE REPORT Report Date: April 29, 2008 Author: Don Klimchuk Phone No.: 604.873.7345 RTS No.: 07283 VanRIMS No.: 13-1400-10
PASSENGER TRANSPORTATION BRANCH MINISTRY OF TRANSPORTATION AND INFRASTRUCTURE LICENCE. Passenger Transportation Licence COPY
 SPECIAL AUTHORIZATION Licence Holder: Trade Name(s): PASSENGER TRANSPORTATION BRANCH MINISTRY OF TRANSPORTATION AND INFRASTRUCTURE LICENCE Passenger Transportation Licence NEWTON WHALLEY HI WAY TAXI LTD.
2013/2014 Strategic Priorities Fund Application Overview
 2013/2014 Strategic Priorities Fund Application Overview Bob Paddon, Executive Vice President Strategic Planning and Public Affairs TransLink 3 December 2013 Strategic Priorities Fund Application Context
2012 Water Consumption Statistics Report. Water Services Department
 212 Water Consumption Statistics Report Water Services Department Issued: December 213 TABLE OF CONTENTS 212 Water Consumption Statistics Report December 213 212 GVWD Statistics Book - Notes...3 Annual
Downtown Lee s Summit Parking Study
 Downtown Lee s Summit Parking Study As part of the Downtown Lee s Summit Master Plan, a downtown parking and traffic study was completed by TranSystems Corporation in November 2003. The parking analysis
Ambient PM 10 Monitoring Sechelt, B.C Update
 Ministry of Environment LOWER MAINLAND REGION Ambient PM 10 Monitoring Sechelt, B.C. 2004-2005 Update E N V I R O N M E N T A L Q U A L I T Y Library and Archives Canada Cataloguing in Publication Data
The Engineering Department recommends Council receive this report for information.
 CORPORATE REPORT NO: R161 COUNCIL DATE: July 23, 2018 REGULAR COUNCIL TO: Mayor & Council DATE: July 19, 2018 FROM: General Manager, Engineering FILE: 8740-01 SUBJECT: Surrey Long-Range Rapid Transit Vision
PROPOSAL FOR A LIMOUSINE MINIMUM RATES PILOT PROJECT FEBRUARY 2011
 PROPOSAL FOR A LIMOUSINE MINIMUM RATES PILOT PROJECT FEBRUARY 2011 NOTE: IN RESPONSE TO INITIAL COMMENTS RECEIVED SINCE FEBRUARY, UPDATES WERE MADE TO THIS PROPOSAL ON MARCH 8, 2011. 1. Context The Board
Water Consumption Statistics Report
 Water Consumption Statistics Report Operations and Maintenance Department 29 Edition TABLE OF CONTENTS 29 Water Consumption Statistics Report October 21 SYSTEM AND MUNICIPAL CONSUMPTION 29 GVWD Statistics
Hazard Control Refresher Using the ERG
 Hazard Control Refresher Using the ERG The Emergency Response Guidebook (ERG) provides summary information on potential hazards, public safety and emergency response to unintended releases of goods being
Newsletter. service to rider demand and ensure efficient use of its fleet. I NSIDE T HIS ISSUE
 Newsletter Volume 5, Issue 8 August 2013 I NSIDE T HIS ISSUE 1 2 3 Fall Service Changes Start September 2nd Call for Interest to Serve on the 2014 Access Transit Users Advisory Committee Accessible Bus
Metropolitan Freeway System 2013 Congestion Report
 Metropolitan Freeway System 2013 Congestion Report Metro District Office of Operations and Maintenance Regional Transportation Management Center May 2014 Table of Contents PURPOSE AND NEED... 1 INTRODUCTION...
Monitoring the Canadian Grain Handling and Transportation System. Annual Report Crop Year. Data Tables
 Monitoring the Canadian Grain Handling and Transportation System Annual Report 2008-2009 Crop Year 2 Data Tables Government of Canada Gouvernement du Canada Data Tables PREFACE The material presented in
Value of Lower Mainland commercial property transactions climbs in third quarter
 News Release of Lower Mainland commercial property transactions climbs in third quarter Vancouver, B.C. December 2, 2013 While the number of commercial property transactions in the Lower Mainland continues
5. What are other common issues with on farm fuel storage?
 5. What are other common issues with on farm fuel storage? Storing fuel on the farm poses some interesting challenges to producers in order to maintain the quality and quantity of the product. Changes
Michigan/Grand River Avenue Transportation Study TECHNICAL MEMORANDUM #18 PROJECTED CARBON DIOXIDE (CO 2 ) EMISSIONS
 EMISSIONS") TECHNICAL MEMORANDUM #18 PROJECTED CARBON DIOXIDE (CO 2 ) EMISSIONS Michigan / Grand River Avenue TECHNICAL MEMORANDUM #18 From: URS Consultant Team To: CATA Project Staff and Technical Committee Topic:
TECHNICAL MEMORANDUM #18 PROJECTED CARBON DIOXIDE (CO 2 ) EMISSIONS Michigan / Grand River Avenue TECHNICAL MEMORANDUM #18 From: URS Consultant Team To: CATA Project Staff and Technical Committee Topic:
TRANSPORTATION REVIEW
 TRANSPORTATION REVIEW - PROPOSED MIX OF LAND USES IS CONSISTENT WITH THE CITY S UNDER THE GRANVILLE BRIDGE POLICIES THAT AIM TO MEET NEIGHBOURING RESIDENTS SHOPPING NEEDS AND REDUCE RELIANCE ON AUTOMOBILE
June Safety Measurement System Changes
 June 2012 Safety Measurement System Changes The Federal Motor Carrier Safety Administration s (FMCSA) Safety Measurement System (SMS) quantifies the on-road safety performance and compliance history of
2016 Congestion Report
 2016 Congestion Report Metropolitan Freeway System May 2017 2016 Congestion Report 1 Table of Contents Purpose and Need...3 Introduction...3 Methodology...4 2016 Results...5 Explanation of Percentage Miles
FOR LEASE 8899 LAUREL STREET VANCOUVER, BC MARKETED BY: CHRIS MACCAULEY. ILYA TIHANENOKS
 FOR LEASE 8899 MANAGED BY: DEVELOPED BY: MARKETED BY: JASON KISELBACH 604 662 508 jason.kiselbach@cbre.com ILYA TIHANENOKS 778 372 3930 ilya.tihanenoks@cbre.com CHRIS MACCAULEY PERSONAL REAL ESTATE CORPORATION
2012 Air Emissions Inventory
 SECTION 6 HEAVY-DUTY VEHICLES This section presents emissions estimates for the heavy-duty vehicles (HDV) source category, including source description (6.1), geographical delineation (6.2), data and information
EXECUTIVE SUMMARY. The following is an outline of the traffic analysis performed by Hales Engineering for the traffic conditions of this project.
 EXECUTIVE SUMMARY This study addresses the traffic impacts associated with the proposed Shopko redevelopment located in Sugarhouse, Utah. The Shopko redevelopment project is located between 1300 East and
NEW HAVEN HARTFORD SPRINGFIELD RAIL PROGRAM
 NEW HAVEN HARTFORD SPRINGFIELD RAIL PROGRAM Hartford Rail Alternatives Analysis www.nhhsrail.com What Is This Study About? The Connecticut Department of Transportation (CTDOT) conducted an Alternatives
Livingston County Hazardous Material Flow Study August 2018
 Livingston County Hazardous Material Flow Study August 2018 Table of Contents Statement of Purpose Page 2 Study Area Page 3 Transportation Summary Page 4 Highway Transportation Page 5-6 Railroad Transportation
Update on Community or Heritage Rail Project (Project Manager Services) The Engineering Department recommends that Council:
 The Engineering Department recommends that Council:") Corporate NO: R279 Report COUNCIL DATE: DECEMBER 18, 2006 REGULAR COUNCIL TO: Mayor & Council DATE: December 15, 2006 FROM: General Manager, Engineering FILE: 8710-20 (Heritage) SUBJECT: Update on Community
Corporate NO: R279 Report COUNCIL DATE: DECEMBER 18, 2006 REGULAR COUNCIL TO: Mayor & Council DATE: December 15, 2006 FROM: General Manager, Engineering FILE: 8710-20 (Heritage) SUBJECT: Update on Community
U N I V E R S I T Y O F B R I T I S H C O L U M B I A. Fall 2008 Transportation Status Report
 U N I V E R S I T Y O F B R I T I S H C O L U M B I A Fall 2008 Transportation Status Report 6 February 2009 U N I V E R S I T Y O F B R I T I S H C O L U M B I A Fall 2008 Transportation Status Report
TRAFFIC SIMULATION IN REGIONAL MODELING: APPLICATION TO THE INTERSTATEE INFRASTRUCTURE NEAR THE TOLEDO SEA PORT
 MICHIGAN OHIO UNIVERSITY TRANSPORTATION CENTER Alternate energy and system mobility to stimulate economic development. Report No: MIOH UTC TS41p1-2 2012-Final TRAFFIC SIMULATION IN REGIONAL MODELING: APPLICATION
Weight Allowance Reduction for Quad-Axle Trailers. CVSE Director Decision
 Weight Allowance Reduction for Quad-Axle Trailers CVSE Director Decision Brian Murray February 2014 Contents SYNOPSIS...2 INTRODUCTION...2 HISTORY...3 DISCUSSION...3 SAFETY...4 VEHICLE DYNAMICS...4 LEGISLATION...5
A Port Energy and Emission Inventory Model
 A Port Energy and Emission Inventory Model Green Tech 2012, Green Marine Annual Conference Quebec City: May 29, 30 Bryan McEwen, SNC-Lavalin Inc., Environment Division Vancouver, British Columbia, Canada
Ministry of Finance Tax Bulletin
 Ministry of Finance Tax Bulletin ISSUED: April 1999 REVISED: April 2011 Bulletin MFT-CT 005 www.fin.gov.bc.ca/rev.htm Tax Rates on s Motor Tax Act and Carbon Tax Act Do you sell or purchase fuel in British
New West Partnership Deliverables July 2011/2012 Reporting
 Area 1 - Vehicle Weights and Dimensions Steering Axle Weight Limits July 2011 Changes to vehicle design and It is Alberta s position, jointly agreed upon by other New West additional required equipment
Part I: Metered Rates
 Board Rule Respecting Metro Vancouver Taxicab Rates Effective January 5, 2019 Background On September 24, 2018, the Board approved a Taxi & Limousine Cost Index (TLCI) 2018 rule that permits a rate increase
Vehicle Scrappage and Gasoline Policy. Online Appendix. Alternative First Stage and Reduced Form Specifications
 Vehicle Scrappage and Gasoline Policy By Mark R. Jacobsen and Arthur A. van Benthem Online Appendix Appendix A Alternative First Stage and Reduced Form Specifications Reduced Form Using MPG Quartiles The
Moving around Metro Vancouver: EXPLORING NEW APPROACHES TO REDUCING CONGESTION
 Moving around Metro Vancouver: EXPLORING NEW APPROACHES TO REDUCING CONGESTION OCTOBER 2017 IT S TIME TO ADDRESS CONGESTION IN METRO VANCOUVER It s Time is a research and public engagement DECONGESTION
BC Hydro s DCFC Station Network
 BC Hydro s DCFC Station Network Existing and Planned Presentation to the Vancouver Electric Vehicle Association September 19, 2017 Background - Types of EV Charging Since batteries are direct current (DC)
To: File From: Adrian Soo, P. Eng. Markham, ON File: Date: August 18, 2015
 Memo To: From: Adrian Soo, P. Eng. Markham, ON : 165620021 Date: Reference: E.C. Row Expressway, Dominion Boulevard Interchange, Dougall Avenue Interchange, and Howard 1. Review of Interchange Geometry
Route Description. Dist.(int. Dist.(cum TurnDirectio
 Tour de Cenotaph 200 Nov 11, 18 Ride Organizer : Craig Premack 778-232-0204 Start - 4th Ave & Boundary Rd, Vancouver Finish - Knight & Day, Broadway & Boundary, Vancouver Route Description Dist.(cum TurnDirectio
VDOT Unused Facilities
 VDOT Unused Facilities Appropriation Act Item 457 K.1 (2010) Report to the Chairmen of House Appropriations and Senate Finance Committees Virginia Department of Transportation 1401 East Broad Street Richmond,
TORONTO TRANSIT COMMISSION REPORT NO.
 Form Revised: February 2005 TORONTO TRANSIT COMMISSION REPORT NO. MEETING DATE: October 24, 2012 SUBJECT: DOWNTOWN RAPID TRANSIT EXPANSION STUDY (DRTES) PHASE 1 STRATEGIC PLAN ACTION ITEM RECOMMENDATIONS
Funding Scenario Descriptions & Performance
 Funding Scenario Descriptions & Performance These scenarios were developed based on direction set by the Task Force at previous meetings. They represent approaches for funding to further Task Force discussion
UPPER GREEN RIVER OZONE INVESTIGATION (O3i) LUMAN AND PARADISE ROAD TRAFFIC COUNT STUDY 03/05/2009 AND 06/09/2009. Study Summary.
 LUMAN AND PARADISE ROAD TRAFFIC COUNT STUDY 03/05/2009 AND 06/09/2009. Study Summary.") UPPER GREEN RIVER OZONE INVESTIGATION (O3i) LUMAN AND PARADISE ROAD TRAFFIC COUNT STUDY 03/05/2009 AND 06/09/2009 Study Summary Prepared for WYOMING DEPARTMENT OF ENVIRONMENTAL QUALITY 122 West 25 th Street
UPPER GREEN RIVER OZONE INVESTIGATION (O3i) LUMAN AND PARADISE ROAD TRAFFIC COUNT STUDY 03/05/2009 AND 06/09/2009 Study Summary Prepared for WYOMING DEPARTMENT OF ENVIRONMENTAL QUALITY 122 West 25 th Street
Alpine Highway to North County Boulevard Connector Study
 Alpine Highway to North County Boulevard Connector Study prepared by Avenue Consultants March 16, 2017 North County Boulevard Connector Study March 16, 2017 Table of Contents 1 Summary of Findings... 1
Oregon DOT Slow-Speed Weigh-in-Motion (SWIM) Project: Analysis of Initial Weight Data
 Project: Analysis of Initial Weight Data") Portland State University PDXScholar Center for Urban Studies Publications and Reports Center for Urban Studies 7-1997 Oregon DOT Slow-Speed Weigh-in-Motion (SWIM) Project: Analysis of Initial Weight Data
Portland State University PDXScholar Center for Urban Studies Publications and Reports Center for Urban Studies 7-1997 Oregon DOT Slow-Speed Weigh-in-Motion (SWIM) Project: Analysis of Initial Weight Data
LONG RANGE PERFORMANCE REPORT. Study Objectives: 1. To determine annually an index of statewide turkey populations and production success in Georgia.
 State: Georgia Grant Number: 08-953 Study Number: 6 LONG RANGE PERFORMANCE REPORT Grant Title: State Funded Wildlife Survey Period Covered: July 1, 2010 - June 30, 2011 Study Title: Wild Turkey Production
Parks and Transportation System Development Charge Methodology
 City of Sandy Parks and Transportation System Development Charge Methodology March, 2016 Background In order to implement a City Council goal the City of Sandy engaged FCS Group in January of 2015 to update
Executive Summary. Phase 2 Evaluation Report. Introduction
 , Executive Summary Executive Summary Introduction TransLink and the Province of British Columbia sponsored a multi-phase study to evaluate alternatives for rapid transit service in the Broadway corridor
DOT CHART 10 HAZARDOUS MATERIALS MARKING, LABELING & PLACARDING GUIDE
 FM 55-5 FM 55-5 APPENDIX E DOT CHART 0 HAZARDOUS MATERIALS MARKING, LABELING & PLACARDING GUIDE This appendix contains facsimiles of hazardous materials warning labels, placards, and package markings and
Table of Contents INTRODUCTION... 3 PROJECT STUDY AREA Figure 1 Vicinity Map Study Area... 4 EXISTING CONDITIONS... 5 TRAFFIC OPERATIONS...
 Crosshaven Drive Corridor Study City of Vestavia Hills, Alabama Table of Contents INTRODUCTION... 3 PROJECT STUDY AREA... 3 Figure 1 Vicinity Map Study Area... 4 EXISTING CONDITIONS... 5 TRAFFIC OPERATIONS...
Transportation and Transfer
 Participant Guide Module 4 Transportation and Transfer Module Objective Upon completion of this module, participants should be able to describe how ethanol-blended fuels are transported and transferred
APPLICATION FOR SAFETY FITNESS CERTIFICATE (SFC)
") APPLICATION FOR SAFETY FITNESS CERTIFICATE (SFC) Motor Carrier Division Unit C 1695 Sargent Ave. Winnipeg MB R3H 0C4 Telephone 204.945.5322 Fax 204.948.2078 http://www.manitoba.ca/mit/mcd/mcs/index.html
APPLICATION FOR SAFETY FITNESS CERTIFICATE (SFC) Motor Carrier Division Unit C 1695 Sargent Ave. Winnipeg MB R3H 0C4 Telephone 204.945.5322 Fax 204.948.2078 http://www.manitoba.ca/mit/mcd/mcs/index.html
Energy Technical Memorandum
 Southeast Extension Project Lincoln Station to RidgeGate Parkway Prepared for: Federal Transit Administration Prepared by: Denver Regional Transportation District May 2014 Table of Contents Page No. Chapter
Alternative Fuel Price Report
 July 2016 Natural Gas Ethanol Propane Biodiesel CLEAN CITIES Alternative Fuel Price Report Welcome to the July 2016 issue! The Clean Cities Alternative Fuel Price Report is a quarterly report designed
CHARACTERIZATION AND DEVELOPMENT OF TRUCK LOAD SPECTRA FOR CURRENT AND FUTURE PAVEMENT DESIGN PRACTICES IN LOUISIANA
 CHARACTERIZATION AND DEVELOPMENT OF TRUCK LOAD SPECTRA FOR CURRENT AND FUTURE PAVEMENT DESIGN PRACTICES IN LOUISIANA LSU Research Team Sherif Ishak Hak-Chul Shin Bharath K Sridhar OUTLINE BACKGROUND AND
Interstate Operations Study: Fargo-Moorhead Metropolitan Area Simulation Output
 NDSU Dept #2880 PO Box 6050 Fargo, ND 58108-6050 Tel 701-231-8058 Fax 701-231-6265 www.ugpti.org www.atacenter.org Interstate Operations Study: Fargo-Moorhead Metropolitan Area 2015 Simulation Output Technical
Motor Vehicle Related Fatalities 10-year Statistics for British Columbia Research and Data Unit Policy and Strategic Initiatives Branch
 Motor Vehicle Related Statistics for British Columbia 2008-2017 Research and Data Unit Policy and Strategic Initiatives Branch Website: www.gov.bc.ca/roadsafetybc Twitter: http://twitter.com/ October 2018
The major roadways in the study area are State Route 166 and State Route 33, which are shown on Figure 1-1 and described below:
 3.5 TRAFFIC AND CIRCULATION 3.5.1 Existing Conditions 3.5.1.1 Street Network DRAFT ENVIRONMENTAL IMPACT REPORT The major roadways in the study area are State Route 166 and State Route 33, which are shown
Applicability for Green ITS of Heavy Vehicles by using automatic route selection system
 Applicability for Green ITS of Heavy Vehicles by using automatic route selection system Hideyuki WAKISHIMA *1 1. CTI Enginnering Co,. Ltd. 3-21-1 Nihonbashi-Hamacho, Chuoku, Tokyo, JAPAN TEL : +81-3-3668-4698,
LCV Operating Conditions & Routes (August 2017) Page 1 of 5
 Page 1 of 5") Page 1 of 5 APPROVED ROUTES & CONDITIONS FOR LONG COMBINATION VEHICLES (LCV S) CVSE Permits are valid in British Columbia on highways under the jurisdiction of the Ministry of Transportation and Infrastructure
Page 1 of 5 APPROVED ROUTES & CONDITIONS FOR LONG COMBINATION VEHICLES (LCV S) CVSE Permits are valid in British Columbia on highways under the jurisdiction of the Ministry of Transportation and Infrastructure
Travel Forecasting Methodology
 Travel Forecasting Methodology Introduction This technical memorandum documents the travel demand forecasting methodology used for the SH7 BRT Study. This memorandum includes discussion of the following:
Motorcyclist Deaths Jan Jul. 2018
 Motorcyclist Deaths Jan. 2008 Jul. 2018 This report summarizes all accidental deaths of motorcyclists in traffic-related motor vehicle incidents (MVIs) between January 1, 2008 and July 30, 2018. Inclusion
1 On Time Performance
 MEMORANDUM: US 29 Travel Time & OTP To: From: Joana Conklin, Montgomery County DOT James A. Bunch, SWAI Subject: US 29 Travel Time and On Time Performance Analysis Date: This memorandum documents the US
Suicide Deaths in BC
 Suicide Deaths in BC 2006-2016 This report summarizes all deaths classified as suicide between January 1, 2006 and December 31, 2016. This includes cases that have been completed and those still under
TABLE OF CONTENTS EXECUTIVE SUMMARY...1 INTRODUCTION...3 PROJECTED FUTURE GROWTH...3 ROADWAY IMPROVEMENT PROJECTS...4 POTENTIAL FUNDING SOURCES...
 Transportation Impact Fee Study September 2014 TABLE OF CONTENTS EXECUTIVE SUMMARY...1 INTRODUCTION...3 PROJECTED FUTURE GROWTH...3 ROADWAY IMPROVEMENT PROJECTS......4 POTENTIAL FUNDING SOURCES...7 PROPOSED
Truck Axle Weight Distributions
 Truck Axle Weight Distributions Implementation Report IR-16-02 Prepared for Texas Department of Transportation Maintenance Division Prepared by Texas A&M Transportation Institute Cesar Quiroga Jing Li
Southern Windsor County 2016 Traffic Count Program Summary April 2017
 Southern Windsor County 2016 Traffic Count Program Summary April 2017 The Southern Windsor County Regional Planning Commission (the RPC ) has been monitoring traffic at 19 locations throughout the southern
Edmonton Region Commodity Flow Study
 A Joint Alberta Transportation, City of Edmonton and Economic Development Edmonton Venture Supported by: Alberta Motor Transport Association (AMTA) Alberta Capital Region Alliance (ACRA) Page 1 27,748
Transportation & Traffic Engineering
 Transportation & Traffic Engineering 1) Project Description This report presents a summary of findings for a Traffic Impact Analysis (TIA) performed by A+ Engineering, Inc. for the Hill Country Family
Metropolitan Freeway System 2007 Congestion Report
 Metropolitan Freeway System 2007 Congestion Report Minnesota Department of Transportation Office of Traffic, Safety and Operations Freeway Operations Section Regional Transportation Management Center March
Parking Management Element
 Parking Management Element The State Transportation Planning Rule, adopted in 1991, requires that the Metropolitan Planning Organization (MPO) area implement, through its member jurisdictions, a parking
TRAVEL DEMAND FORECASTS
 Jiangxi Ji an Sustainable Urban Transport Project (RRP PRC 45022) TRAVEL DEMAND FORECASTS A. Introduction 1. The purpose of the travel demand forecasts is to assess the impact of the project components
Federal Motor Carrier Safety Regulations
 FLEET SAFETY Reducing Your Risk of Loss Our policy is performance. Federal Motor Carrier Safety Regulations» Ensuring Fleet Safety Through Better Driving Practices The Federal Motor Carrier Safety Regulations
Zorik Pirveysian, Air Quality Policy and Management Division Manager Policy and Planning Department
 Environment Committee Meeting: April 11, 2006 To: From: Environment Committee Zorik Pirveysian, Air Quality Policy and Management Division Manager Policy and Planning Department Date: March 20, 2006 Subject:
Northern Ontario Commercial Vehicle Travel Profile
 TRANSPORTATION Final Report The Preparation of a Northern Ontario Passenger and Commercial Vehicle Origin-Destination Survey Northern Ontario Commercial Vehicle Travel Profile Submitted to Ministry of
A9 Data Monitoring and Analysis Report. January Content. 1. Executive Summary. 2. Overview. 3. Purpose. 4. Baseline Data Sources
 A9 Data Monitoring and Analysis Report January 2018 Content 1. Executive Summary 2. Overview 3. Purpose 4. Baseline Data Sources 5. Casualty Analysis 6. Vehicle Speed Data 7. Incident Frequency & Impact
2002 Virginia Department of Transportation Daily Traffic Volume Estimates Including Vehicle Classification Estimates. Special Locality Report 129
 Daily Traffic Volume Estimates Including Vehicle Classification Estimates where available Special Locality Report 129 Prepared By In Cooperation With U.S. Department of Transportation Federal Highway Administration
Clean Harbors Canada, Inc.
 Clean Harbors Canada, Inc. Proposed Lambton Landfill Expansion Environmental Assessment Terms of Reference Transportation Assessment St. Clair Township, Ontario September 2009 itrans Consulting Inc. 260
M R Ratcliffe Transport Insurance Schemes Commercial Vehicle Enquiry Form
 M R Ratcliffe Transport Insu Contacts: M R Ratcliffe Transport Insurance Schemes Commercial Vehicle Enquiry Form Sam - 01242 544 536 / sammcquoid@ratcliffes.co.uk or Adrian - 01242 544 514 / adrianblay@ratcliffes.co.uk
HISTORIC TRAFFIC COUNT DATA ( )
") HISTORIC TRAFFIC COUNT DATA (1980 2015) Highlights The traffic trends for 25 locations in the 22202 zip code area have decreased by 20 percent (on average) since 2000, when traffic peaked. Currently, average
HISTORIC TRAFFIC COUNT DATA (1980 2015) Highlights The traffic trends for 25 locations in the 22202 zip code area have decreased by 20 percent (on average) since 2000, when traffic peaked. Currently, average
Driver Speed Compliance in Western Australia. Tony Radalj and Brian Kidd Main Roads Western Australia
 Driver Speed Compliance in Western Australia Abstract Tony Radalj and Brian Kidd Main Roads Western Australia A state-wide speed survey was conducted over the period March to June 2 to measure driver speed
Phase Two of the 10-Year Vision PUBLIC CONSULTATION DISCUSSION GUIDE. tenyearvision.translink.ca
 Phase Two of the 10-Year Vision PUBLIC CONSULTATION DISCUSSION GUIDE tenyearvision.translink.ca THE 10-YEAR VISION IDENTIFIES TRANSIT AND TRANSPORTATION IMPROVEMENTS THAT ARE PRIORITIES FOR KEEPING THE
Port of Long Beach. Diesel Emission Reduction Program
 Diesel Emission Reduction Program Competition Port of Long Beach, Planning Division July 16, 2004 Contact: Thomas Jelenić, Environmental Specialist 925 Harbor Plaza, Long Beach, CA 90802 (562) 590-4160
PRESENTATION Metro s Streets & Freeways Subcommittee
 PRESENTATION Metro s Streets & Freeways Subcommittee Los Angeles County Metro s 2011 Interstate 210 Truck Origin & Destination (O D) Study Presented by: Fred Minagar MINAGAR & ASSOCIATES, INC. October
New Zealand Transport Outlook. VKT/Vehicle Numbers Model. November 2017
 New Zealand Transport Outlook VKT/Vehicle Numbers Model November 2017 Short name VKT/Vehicle Numbers Model Purpose of the model The VKT/Vehicle Numbers Model projects New Zealand s vehicle-kilometres travelled
ORDER OF THE LIEUTENANT GOVERNOR IN COUNCIL
 PROVINCE OF BRITISH COLUMBIA ORDER OF THE LIEUTENANT GOVERNOR IN COUNCIL Order in Council No. 392, Approved and Ordered October 13, 2017 Executive Council Chambers, Victoria On the recommendation of the
Simulating Trucks in CORSIM
 Simulating Trucks in CORSIM Minnesota Department of Transportation September 13, 2004 Simulating Trucks in CORSIM. Table of Contents 1.0 Overview... 3 2.0 Acquiring Truck Count Information... 5 3.0 Data
Report Date: May 18, 2012 Contact: Al Zacharias Contact No.: RTS No.: 9587 VanRIMS No.: Meeting Date: June 12, 2012
 A5 ADMINISTRATIVE REPORT Report Date: May 18, 2012 Contact: Al Zacharias Contact No.: 604.873.7214 RTS No.: 9587 VanRIMS No.: 08-2000-21 Meeting Date: June 12, 2012 TO: FROM: SUBJECT: Vancouver City Council
American Driving Survey,
 RESEARCH BRIEF American Driving Survey, 2015 2016 This Research Brief provides highlights from the AAA Foundation for Traffic Safety s 2016 American Driving Survey, which quantifies the daily driving patterns
Supports Item No. 1 T&T Committee Agenda October 5, 2010
 Supports Item No. 1 T&T Committee Agenda October 5, 2010 ADMINISTRATIVE REPORT Report Date: September 28, 2010 Contact: Jerry Dobrovolny Contact No.: 604.873.7331 RTS No.: 8301 VanRIMS No.: 08-2000-20
I-95 Corridor Coalition Vehicle Probe Project: HERE, INRIX and TOMTOM Data Validation. Report for North Carolina (#08) I-240, I-40 and I-26
 I-240, I-40 and I-26") I-95 Corridor Coalition Vehicle Probe Project: HERE, INRIX and TOMTOM Data Validation Report for North Carolina (#08) I-240, I-40 and I-26 Prepared by: Masoud Hamedi, Sanaz Aliari University of Maryland,
I-95 Corridor Coalition Vehicle Probe Project: HERE, INRIX and TOMTOM Data Validation Report for North Carolina (#08) I-240, I-40 and I-26 Prepared by: Masoud Hamedi, Sanaz Aliari University of Maryland,
RESOLUTION MSC.286(86) (adopted on 5 June 2009) RECOMMENDATIONS FOR MATERIAL SAFETY DATA SHEETS (MSDS) FOR MARPOL ANNEX I OIL CARGO AND OIL FUEL
 (adopted on 5 June 2009) RECOMMENDATIONS FOR MATERIAL SAFETY DATA SHEETS (MSDS) FOR MARPOL ANNEX I OIL CARGO AND OIL FUEL") MSC 86/26/Add.1 RESOLUTION MSC.286(86) SHEETS (MSDS) FOR MARPOL ANNEX I OIL CARGO AND OIL FUEL THE MARITIME SAFETY COMMITTEE, RECALLING Article 28(b) of the Convention on the International Maritime Organization
MSC 86/26/Add.1 RESOLUTION MSC.286(86) SHEETS (MSDS) FOR MARPOL ANNEX I OIL CARGO AND OIL FUEL THE MARITIME SAFETY COMMITTEE, RECALLING Article 28(b) of the Convention on the International Maritime Organization
IV. ENVIRONMENTAL IMPACT ANALYSIS K.2. PARKING
 IV. ENVIRONMENTAL IMPACT ANALYSIS K.2. PARKING ENVIRONMENTAL SETTING The following analysis summarizes the findings and conclusions of the Traffic Analysis (Traffic Study), prepared by The Mobility Group,
CITY OF LONDON STRATEGIC MULTI-YEAR BUDGET ADDITIONAL INVESTMENTS BUSINESS CASE # 6
 2016 2019 CITY OF LONDON STRATEGIC MULTI-YEAR BUDGET ADDITIONAL INVESTMENTS BUSINESS CASE # 6 STRATEGIC AREA OF FOCUS: SUB-PRIORITY: STRATEGY: INITIATIVE: INITIATIVE LEAD(S): BUILDING A SUSTAINABLE CITY
Appendix B: Travel Demand Forecasts July 2017
 Appendix B: Travel Demand Forecasts July 2017 Table of Contents 1 Introduction... 2 2 Model Review and Updates... 2 2.1 Overview of Smart Moves Model ( City of London Model )... 2 2.1.1 Network and Zone
RE: A Traffic Impact Statement for a proposed development on Quinpool Road
 James J. Copeland, P.Eng. GRIFFIN transportation group inc. 30 Bonny View Drive Fall River, NS B2T 1R2 May 31, 2018 Ellen O Hara, P.Eng. Project Engineer DesignPoint Engineering & Surveying Ltd. 200 Waterfront
Transportation of Dangerous Goods (TDG) - Transport des marchandises dangereuses (TMD)
 - Transport des marchandises dangereuses (TMD)") Quebec Québec Transportation of Dangerous Goods (TDG) - Transport des marchandises dangereuses (TMD) This material has been extracted from the Acts and Regulations of the Province to help students understand
Quebec Québec Transportation of Dangerous Goods (TDG) - Transport des marchandises dangereuses (TMD) This material has been extracted from the Acts and Regulations of the Province to help students understand