2009 Origin and Destination Studies International Bridge and Blue Water Bridge
|
|
|
- Michael Pearson
- 5 years ago
- Views:
Transcription


1 2009 Origin and Destination Studies International Bridge and Blue Water Bridge Prepared by: Statewide and Urban Travel Analysis Section Michigan Department of Transportation November, 2009
2 Table of Contents Introduction 2 Expansion Process..2 International Bridge Study.4 Passenger Vehicles. 4 Commercial Vehicles.8 Blue Water Bridge Study.13 Passenger Vehicles...13 Commercial Vehicles...16 Summary..20 Appendix Expansion Table..22 Interview Form 23 1
3 INTRODUCTION The Michigan Department of Transportation (MDOT) conducted origin and destination (O&D) studies in June 2009 at the International Bridge in Sault Ste. Marie and at the Blue Water Bridge in Port Huron. These studies are a continuation of the Statewide and Urban Travel Analysis (SUTA) section s plan to gather statewide travel data to improve our forecasting models and provide the department and its customers with updated travel characteristics and statistics. These studies are intercept surveys of traffic, where information is gathered from the driver including trip origin and destination, trip purpose, frequency, vehicle type, and number of passengers. For commercial vehicles, the origin and destination, truck type, commodity carried, and commodity weight are captured. Additional questions pertaining only to each site were asked at both bridges. At the International Bridge, drivers were asked if they had a Prox Card, and if not, why. The Prox Card works similar to a speed pass, where the driver can prepay an amount on a card and travel through automated booths to save time crossing the border. Also, a question was asked whether the driver is making this crossing more or less often than in the past, or if about the same. For the Blue Water Bridge, long distance travelers were asked why they chose to travel across this bridge and not through Detroit. Including these two bridge studies; MDOT has now completed 34 intercept surveys since 2003, with nine being commercial only. MDOT s Data Collection section manually conducted the surveys and entered the information into an automated program that formats all data into a spreadsheet file. The file was then reviewed by the Statewide and Urban Travel Analysis Section, and corrections and edits were done on any erroneous records. Both sections in MDOT did a great amount of work to collect, clean, and analyze the data. EXPANSION The interview crew at both studies captured as many vehicles as possible to record the vehicles trip details. The crew surveyed from 6:00 a.m. until 8:00 p.m., working one direction on a Tuesday and the other direction on Wednesday. Recording trips on these days offer a better representation of the average daily traffic, as weekend traffic can be very different. The goal of the expansion process was to increase the survey data recorded at each location to correspond to the annual average daily traffic (). Because traffic should be similar in different parts of the day, the studies were broken up into three time periods AM Peak (6:00 9:00 a.m.), Midday (9:00 3 p.m.), and PM Peak (3:00 8:00 p.m.). At both locations, vehicles were counted and classified manually by the study crew for each hour and for each direction. Also, classification counts from the bridge authorities were obtained. Because of the slight difference in how a vehicle may be classified at the bridge, the manual classifications were considered to be proper for expanding the studies. The percentage difference between the crew s manual count and the bridges counts for all study hours were used to adjust the bridges counts during the non-study hours, when no manual counts were available. 2
4 During the study hours, records were grouped by time period and direction. Each group was expanded to match the manual counts for each time period. All records were used to represent the night traffic during non-study hours, as it was deemed reasonable to expect that similar trip types also occur during non-study hours. Dividing a direction s total non-study period adjusted count by the total number of records in that direction equals the non-study period expansion factor. Adding a record s study period expansion factor with its non-study period expansion factor yields the 24-hour expansion total. Adding all records 24-hour expansion totals equals the total traffic for that study day. In order to portray the for a study, the percentage difference was calculated between the location s and the study s 24-hour volume. The for each bridge was obtained by using the past year s passenger and commercial counts from the bridges and dividing by 365. The passenger vehicles 24-hour counts were multiplied by the percentage difference between the study day and the passenger vehicle, and likewise for commercial vehicles. Adding all records expansion totals equals the location s total. The tables and maps presented in this report are based on the totals for passenger and commercial vehicles. The expansion table at the end of the report shows the calculation of expansion factors by direction and time period. For both studies, the last year s worth of bridge crossing statistics were used to calculate the s. Monthly bridge classification counts from June 1, 2008 to May 31, 2009 were used to develop the latest. In past studies, the previous calendar year from the MDOT Sufficiency file was used. This alternative process was done to help account for the large decrease in traffic that has resulted from the weak economy. If we used the previous calendar year for the bridge locations, we would be overstating the traffic by quite a bit. This process was deemed reasonable, although if traffic continues to decline, our values used at both bridges may still be a little high. 3
5 INTERNATIONAL BRIDGE The study was conducted on Tuesday, June 16, 2009 for inbound traffic, and Wednesday, June 17, 2009 for the outbound traffic. The inbound traffic was surveyed after customs, as they were queuing at the toll booths entering Michigan. The outbound traffic was captured in interview lines immediately after passing through the northbound toll booths, before crossing the bridge. A total of 3,019 vehicles were interviewed at the International Bridge, 2,831 passenger vehicles and 188 commercial vehicles. The percentage of overall traffic interviewed was 86 percent of passenger vehicles, 68 percent of commercial vehicles, 84 percent overall, and was consistent by direction. The survey records were expanded to an annual average daily traffic of 4,588 passenger vehicles and 286 commercial vehicles, combining for a total of 5,874. Passenger Vehicles - There is a strong relationship between Sault Ste. Marie, Michigan and Sault Ste. Marie, Ontario. Of the expanded total of 4,588 passenger vehicles, 61.6 percent travel between the two cities. Twenty nine percent of all car trips indicated shopping as one of the trip ends. This is almost entirely Canadians shopping in the United States, due to the exchange rate and a more populous Canadian Sault Ste. Marie. Other trip purposes of note were outdoor and indoor recreation. Twenty two percent of all passenger vehicle traffic had a trip end of either recreation purpose. Casinos on both sides of the bridge and the popular fishing trips of northern Ontario made up a big part of these movements. The following tables show the top five passenger vehicle trip ends by direction for the International Bridge O&D study and the destination trip purposes by direction. Top Five International Bridge Passenger Vehicle Trip Ends NORTHBOUND Avg Trip Distance ORIGINS SURVEYS EXPANDED PERCENT DESTINATIONS SURVEYS EXPANDED PERCENT SAULT STE MARIE % SAULT STE MARIE % BRIMLEY % SUDBURY % MACKINAW CITY % WAWA % KINROSS % THUNDER BAY % PETOSKEY % ECHO BAY % SOUTHBOUND Avg Trip Distance ORIGINS SURVEYS EXPANDED PERCENT DESTINATIONS SURVEYS EXPANDED PERCENT SAULT STE MARIE % SAULT STE MARIE % WAWA % BAY MILLS TWP % GOULAIS RIVER % BRIMLEY % SUDBURY % KINROSS % ST JOSEPH ISLAND % PICKFORD % 4
6 As previously stated, when analyzing the following data regarding trip purposes and the previous table of city trip ends, one can see that the majority of traffic is Canadians from Sault Ste. Marie going to the United States for shopping, work, and recreation and then returning home. People from the United States traveling into Canada come from a greater distance, and the trips are more vacation/recreation oriented. PASSENGER VEHICLE TRIP DESTINATIONS NORTHBOUND # aadt pct avg trip length Home % Work % School % Shopping % Personal Business % Outdoor Rec % Indoor Rec % Lodging % Social/Other % No Answer % TOTAL % SOUTHBOUND # aadt pct avg trip length Home % Work % School % Shopping % Personal Business % Outdoor Rec % Indoor Rec % Lodging % Social/Other % No Answer % TOTAL %

7 The following three maps are different views of the passenger vehicle trip flows from the International Bridge traffic. The statewide model network was used to project the traffic flows and does not include much of the Ontario road network. The line heading northeast from Sault Ste. Marie is a statewide model link that shows flows starting and ending in the rural area of Algoma District in Ontario. 6
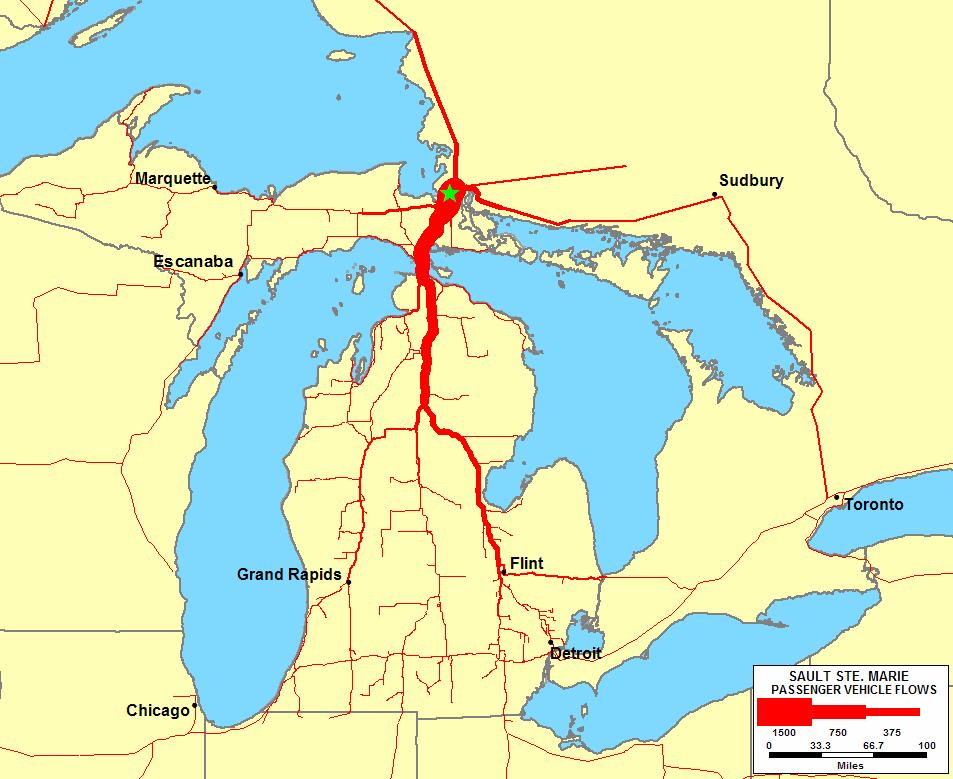
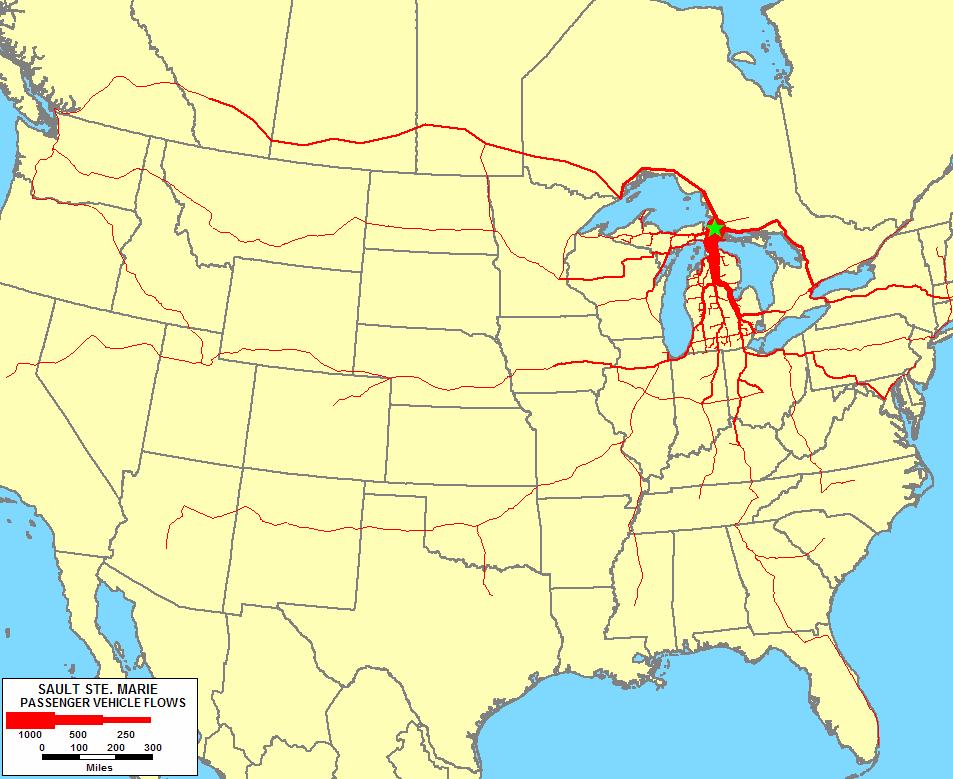
8 7
9 Passenger Vehicle Comparison - A similar O&D study of passenger vehicles was done by MDOT and the Ontario Ministry of Transportation in The results from this study showed many similarities in travel for both passenger vehicles and trucks. The trip purpose questions for the two studies had different possible answers, so that makes some of the comparisons rather difficult. Two of the noticeable differences since 2000: Less United States vacation travel Answers in the 2000 study were coded differently, so there is not an exact match for the question. But what is noticeable is that traffic northbound for vacation, casino, recreation, and entertainment in 2000 was about 25 percent. When combining outdoor recreation, indoor recreation, and lodging, the 2009 study is about 10.5 percent for northbound traffic. This shows a large decrease in vacation travel into Canada by United States residents. More shopping trips to the United States In 2000, shopping trips accounted for seven percent of the trips into Canada, and 12 percent of trips to the United States. The 2009 study shows that mainly because of the weak United States dollar, Canadians can afford more in the United States and are crossing the border more to purchase goods. In 2009, shopping trips to Canada accounted for only just over two percent of International Bridge trips, while these trips from Canada to the United States rose to over 25 percent. In 2000, the strength of the United States dollar and the expense of goods in the United States were curbing the number of Canadians crossing to shop. Commercial Vehicles - Long distance trips were prevalent from the commercial vehicle surveys. Due to the remote border location, the average trip distance of over 650 miles is the longest of all O&D s MDOT has completed. Common trip ends were Sault Ste. Marie, Ontario and Quebec for Canadian cities, and a scattering of cities throughout Michigan, Wisconsin, and Minnesota in the United States. Empty trucks (25 percent) accounted for the most truck movements, while logs/lumber products (19 percent) and paper products (17 percent) were the top commodities moving across the bridge. More empties (30 percent) travel northbound into Canada than into the United States (20 percent). Primary metal products traveling southbound from the Sault Ste. Marie, Ontario steel manufacturing industry were also prevalent. Casino buses were popular commercial vehicles crossing the bridge. Once the survey crew captured the first couple of buses, the remaining casino buses were allowed through the survey without stopping. Capturing the same driver over and over was detrimental to their business and could be potentially irritating. Thus, casino buses were understated in the study, as normally about 20 bus trips a day occur over the bridge. Likewise, a trucking firm in Brimley continued to make multiple trips across the bridge and they were allowed though after the first few stops. Therefore, Brimley should have a few more origins and destinations among the total. 8
10 The following table shows the top five commercial vehicle trip ends by direction for the International Bridge O&D study. Approximately one hundred trucks a day to and from either Sault Ste. Marie, Ontario or Quebec dominate the truck movements, more than a third of all trucks. Top Five International Bridge Truck Trip Ends NORTHBOUND Avg Trip Distance ORIGINS SURVEYS EXPANDED PERCENT DESTINATIONS SURVEYS EXPANDED PERCENT SAULT STE MARIE % SAULT STE MARIE % MINNESOTA (MN) % QUEBEC % BRIMLEY % TORONTO % CHICAGO, IL % ALGOMA DISTRICT % MARQUETTE % ESPANOLA % SOUTHBOUND Avg Trip Distance ORIGINS SURVEYS EXPANDED PERCENT DESTINATIONS SURVEYS EXPANDED PERCENT SAULT STE MARIE % MINNESOTA (MN) % QUEBEC % GREEN BAY,WI % SUDBURY % BRIMLEY % NORTH BAY % SAULT STE MARIE % THESSALON % MARQUETTE % 9
11 International Bridge Truck Movement Commodities COMMODITY SURVEYS EXPANDED PERCENT AVG TRIP LENGTH (MILES) AVG WEIGHT (LBS) AVG TONS Empty % N/A N/A Logs, Lumber or Wood Products % , Pulp, Paper, or Allied Products % , Primary Metal Products % , Waste or Scrap Material % , Food and Kindred Products % , Machinery % , Miscellaneous Manufacturing Products % , Farm Products % , Chemicals or Allied Products % , Transportation Equipment % , Rubber or Misc. Plastics % , Stone, Clay and Glass Products % , Furniture or Fixtures % , Printed Matter % , Mixed Freight Shipments % , Shipping Containers % , Leather Products % , Nonmetallic Ores, Minerals % , Electrical Equipment % , Fabricated Metal Products % , Apparel or Finished Textles % , Misc Forest Products % , Buses* % 5.42 N/A N/A Total % , Commercial Avg Daily Traffic Commercial Avg Daily Weight - 10,046,453 lbs (5,023 tons) *Several casino buses were allowed through the study, making their overall total lower than actual 10
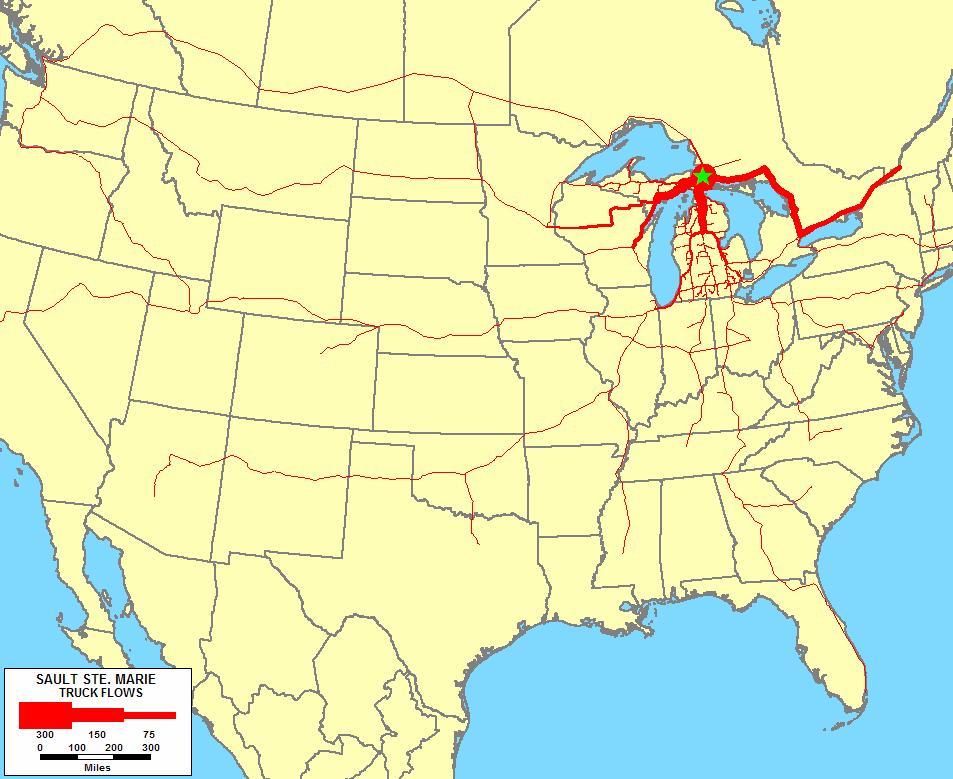
12 The following three maps show different views of the commercial vehicle trip flows from the International Bridge traffic. The number of International Bridge truck trips going across the Upper Peninsula to and from Minnesota and Wisconsin, and those crossing the Mackinac Bridge to and from southern Michigan are very similar about 125 trucks per day. 11
13 12
14 BLUE WATER BRIDGE The study was conducted on Tuesday, June 23, 2009 for inbound traffic, and Wednesday, June 24, 2009 for the outbound traffic. The inbound traffic was captured after customs, in interview lines before entering I-94. The outbound traffic was captured in interview lines immediately after passing through the eastbound toll booths, before crossing the bridge. An electrical storm interrupted the study about 3:00 p.m. on June 24, for minutes. A total of 4,511 vehicles were interviewed at the Blue Water Bridge, 3,430 passenger vehicles and 1,081 commercial vehicles. The percentage of overall traffic interviewed was 51 percent of passenger vehicles, 32 percent of commercial vehicles, and 45 percent overall. The percentage interviewed was a little higher westbound, as the eastbound survey had the electrical storm and a period in the morning with heavy queuing. Traffic needed to be let through the interview lines to alleviate the backup. The survey records were expanded to an annual average daily traffic of 8,810 passenger vehicles and 3,880 commercial vehicles, combining for a total of 12,690. Passenger Vehicles The responses for trip purposes at the Blue Water Bridge study indicate a heavy movement of Canadian residents traveling to the United States for work (18 percent) and shopping (17.5 percent). A third of the westbound movements do not go any further than the city of Port Huron, and of those trips, 45 percent is for shopping and 17 percent for work. Traveling eastbound to Canada, 53 percent of trips are to home. The casino just on the Canadian side of the bridge at Point Edward was a common destination and part of the over 7 percent of trips eastbound. Also prevalent were long distance recreation trips. Chicago, Toronto, New York, and Niagara Falls were all popular trip origins and destinations. The following tables show the top five passenger vehicle trip ends by direction for the Blue Water Bridge O&D study and the destination trip purposes by direction. Top Five Blue Water Bridge Passenger Vehicle Trip Ends EASTBOUND Avg Trip Distance ORIGINS SURVEYS EXPANDED PERCENT DESTINATIONS SURVEYS EXPANDED PERCENT PORT HURON % SARNIA % DETROIT % TORONTO % CHICAGO, IL % LONDON % TROY % NEW YORK (NY) % GRAND RAPIDS % NIAGARA FALLS % WESTBOUND Avg Trip Distance ORIGINS SURVEYS EXPANDED PERCENT DESTINATIONS SURVEYS EXPANDED PERCENT SARNIA % PORT HURON % LONDON % CHICAGO, IL % TORONTO % DETROIT % NEW YORK (NY) % GRAND RAPIDS % NIAGARA FALLS % FLINT % 13

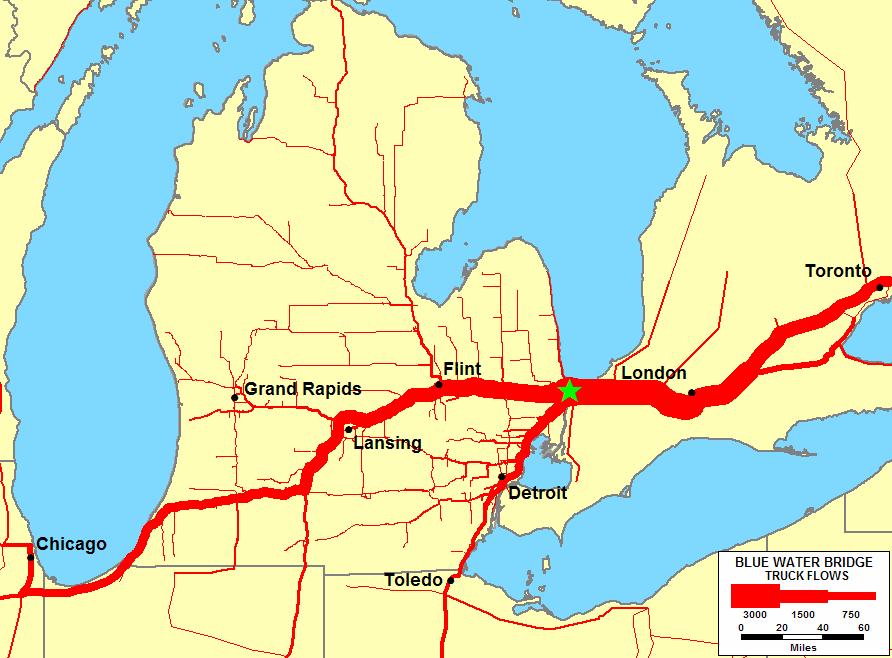
15 The following three maps portray passenger vehicle flows on the road network from the Blue Water Bridge O&D study. Again, the statewide model network is sparse in Ontario, and road links may have flows to and from groups of nearby cities. 14

16 15
17 Commercial Vehicles The Blue Water Bridge provides an alternative to the Ambassador Bridge for international movements traveling between the Toronto metro area and the Midwest. Several trucks opt for traveling the I-69 corridor due to speed and negating potential Detroit area congestion. The top trip ends on the Canadian side are in the Ontario manufacturing area around Toronto, cities in Quebec, and the border city of Sarnia. Trip ends common on the United States side are Chicago, Lennox Township, and Port Huron. Lenox Township is home to Pine Tree Acres landfill, the most prevalent destination for Ontario waste entering Michigan via the Blue Water Bridge. Top Five Blue Water Bridge Truck Trip Ends EASTBOUND Avg Trip Distance ORIGINS SURVEYS EXPANDED PERCENT DESTINATIONS SURVEYS EXPANDED PERCENT CHICAGO % TORONTO % DETROIT % MISSISSAUGA % LENOX TOWNSHIP % BRAMPTON % PORT HURON % SARNIA % LANSING % QUEBEC % WESTBOUND Avg Trip Distance ORIGINS SURVEYS EXPANDED PERCENT DESTINATIONS SURVEYS EXPANDED PERCENT TORONTO % LENOX TOWNSHIP % QUEBEC % CHICAGO % MISSISSAUGA % PORT HURON % SARNIA % KENTUCKY (KY) % LONDON % MONTROSE % 16
18 Empty movements account for about 20 percent of trucks crossing the Blue Water Bridge. While transportation equipment movements may be down from past years, the commodity still tops the list of products traveling across the bridge, followed by waste movements. The morning hours see a convoy of trucks hauling garbage from the Toronto area to Michigan landfills. Primary metal products, food products, chemicals, and plastics are the other top commodities crossing the bridge. Also prevalent are intermodal container movements of mixed freight going eastbound from Chicago to Toronto. Blue Water Bridge Truck Movement Commodities COMMODITY SURVEYS EXPANDED PERCENT AVG TRIP LENGTH (MILES) AVG WEIGHT (LBS) AVG TONS Empty % N/A N/A Transportation Equipment % , Waste or Scrap Material % , Primary Metal Products % , Food Products % , Chemicals or Allied Products % , Plastics and Rubber % , Farm Products % , Pulp, Paper, or Allied Products % , Shipping Containers % , Mixed Freight Shipments % , Machinery % , Logs, Lumber or Wood Products % , Petroleum or Coal Products % , Stone, Clay and Glass Products % , Fabricated Metal Products % , Miscellaneous Manufacturing Products % , Furniture or Fixtures % , Nonmetallic Ores, Minerals % , Electrical Equipment % , Hazardous Material % , Printed Matter % , Apparel or Finished Textles % , Misc Forest Products % , Instruments, Photo Equip, Optical % , Service % N/A N/A Metallic Ores % , Mail or Contract Traffic % , Textile Mill Products % , Ordnance % , Buses % N/A N/A TOTAL % , Commercial Avg Daily Traffic - 3,880 Commercial Avg Daily Weight - 118,483,561 lbs (59,242 tons) 17

19 The following three maps show different views of the commercial vehicle trip flows from the Blue Water Bridge traffic. 18

20 19
21 SUMMARY It has been widely noted that border crossing traffic has been decreasing due to the downturn in the economy. The International Bridge traffic peaked in 1993 at about 3.5 million vehicles. Traffic has been about 1.9 million/year from , and the projection for 2009 looks to be about 1.7 million vehicles. The Blue Water Bridge experienced its high point in 1991 with over 6.1 million crossings. Since the early 1990s, the Blue Water Bridge has seen some dips in volumes, but has remained consistently around 5.5 million. Bridge traffic in 2008 saw a decrease to below 5 million and the 2009 projection is about 4.6 million, the lowest since It appears that much of the border crossing traffic depends on the exchange rate of the Canadian and United States currencies. Traffic has decreased some from its peak in the early 1990s due to less Canadian travelers shopping in the United States for increasingly expensive products. The past two years now have seen less American travel due to the economic recession. There is less money for discretionary travel for recreation and shopping. High gas prices and the new passport rule at border crossings have also contributed to the decrease in traffic. These O&D studies enable MDOT transportation planners to discern the types of traffic continuing to cross the border during the economic down turn. The trip records are beneficial to validation of the MDOT travel demand forecasting models and provide statistics to transportation planners and the public. MDOT hopes to conduct an Ambassador Bridge O&D study in the future. All forecasts are showing an increase in border crossings in the future, especially in truck movements. Contact: Jesse Gwilliams Transportation Planner Michigan Department of Transportation gwilliamsj@michigan.gov
22 APPENDIX 21
23 Expansion Calculation Passenger Vehicles AM (6am-9am) MID-DAY (9am-3pm) PM (3pm-8pm) Study Hours Manual Counts Study Hours Bridge Counts Study Hours Manual-to- Bridge % Non-Study Bridge Count Adjusted Non-Study Counts Adjusted 24-Hour Counts Total Interview Counts Non-Study Hours Expansion Factor Study Direction Interview Manual Expansion Factor Interview Manual Expansion Factor Interview Manual Expansion Factor Sault Ste Marie Northbound Southbound Port Huron Eastbound Westbound Commercial Vehicles AM (7am-9am) MID-DAY (9am-3pm) PM (3pm-8pm) Study Hours Manual Counts Study Hours Bridge Counts Study Hours Manual-to- Bridge % Non-Study Bridge Count Adjusted Non-Study Counts Adjusted 24-Hour Counts Total Interview Counts Non-Study Hours Expansion Factor Study Direction Interview Manual Expansion Factor Interview Manual Expansion Factor Interview Manual Expansion Factor Sault Ste Marie Northbound Southbound Port Huron Eastbound Westbound
24
North American Machine Vision Market Update
 North American Machine Vision Market Update Alex Shikany AIA Director of Market Analysis February 20-22, 2013 Orlando World Marriott Center Orlando, Florida USA Table of Contents I. U.S. Economy II. Manufacturing
APPENDIX B. Origin Destination Study Data
 APPENDIX B Origin Destination Study Data - TABLE OF CONTENTS - Page No. EXECUTIVE SUMMARY... 1 Map of the Study area with Site Locations... 2 Summary Table of Results for the TH 14 Corridor Study... 3
U.S. Rail Traffic 1. Week 27, 2018 Ended July 7, 2018
 U.S. Rail Traffic 1 240,514 5.4% 6,987,928 258,812 1.4% 30,160 3.2% 871,930 32,294 3.8% 76,562-0.5% 2,217,801 82,141-0.1% Farm Products excl., and Food 15,124 10.0% 436,221 16,156 1.5% 10,017 7.2% 275,445
U.S. Rail Traffic 1. Week 42, 2018 Ended October 20, 2018
 U.S. Rail Traffic 1 265,776-0.7% 11,047,756 263,042 1.8% 30,761-0.2% 1,352,962 32,213 4.1% 85,929-0.4% 3,546,082 84,431-0.9% Farm Products excl., and Food 16,808-4.1% 681,566 16,228 2.4% 9,845 2.3% 432,578
U.S. Rail Traffic 1. Week 39, 2018 Ended September 29, 2018
 U.S. Rail Traffic 1 272,306 0.5% 10,248,559 262,784 2.0% 33,047 4.4% 1,260,433 32,319 4.5% 89,445 1.5% 3,284,902 84,228-1.0% Farm Products excl., and Food 16,942 2.8% 631,634 16,196 2.7% 10,721-2.9% 402,632
U.S. Rail Traffic 1. Week 44, 2018 Ended November 3, 2018
 U.S. Rail Traffic 1 270,305 1.8% 11,586,596 263,332 1.9% 32,209 2.2% 1,416,860 32,201 4.1% 88,399 1.6% 3,722,456 84,601-0.7% Farm Products excl., and Food 17,133 2.8% 715,329 16,257 2.3% 10,357 3.2% 453,424
U.S. Rail Traffic 1. Week 41, 2018 Ended October 13, 2018
 U.S. Rail Traffic 1 263,787 10,781,980 262,975 1.9% 30,416-1.7% 1,322,201 32,249 4.2% 86,312 0.2% 3,460,153 84,394-0.9% Farm Products excl., and Food 16,355 664,758 16,214 2.5% 9,927-0.3% 422,733 10,311
U.S. Rail Traffic 1. Week 46, 2018 Ended November 17, 2018
 U.S. Rail Traffic 1 262,514-1.1% 12,110,985 263,282 1.8% 31,796-0.4% 1,480,087 32,176 4.0% 86,159-0.2% 3,893,147 84,634-0.7% Farm Products excl., and Food 16,141-3.7% 747,905 16,259 2.1% 9,541-5.4% 473,048
U.S. Rail Traffic 1. Week 45, 2018 Ended November 10, 2018
 U.S. Rail Traffic 1 261,875 0.1% 11,848,471 263,299 1.8% 31,431 1,448,291 32,184 4.1% 84,532-0.7% 3,806,988 84,600-0.7% Farm Products excl., and Food 16,435-1.3% 731,764 16,261 2.3% 10,083 2.5% 463,507
U.S. Rail Traffic 1. Week 18, 2018 Ended May 5, 2018
 U.S. Rail Traffic 1 265,563 6.4% 4,612,788 256,266 0.9% 33,807 9.5% 583,320 32,407 3.6% 77,468 5.5% 1,483,363 82,409 0.4% Farm Products excl., and Food 16,952 8.3% 290,667 16,148 0.6% 10,407 4.6% 181,165
U.S. Rail Traffic 1. Week 17, 2018 Ended April 28, 2018
 U.S. Rail Traffic 1 266,453 3.7% 4,347,225 255,719 0.6% 32,916 3.4% 549,513 32,324 3.2% 78,970 4.2% 1,405,895 82,700 0.1% Farm Products excl., and Food 16,221 4.5% 273,715 16,101 0.1% 10,563 4.7% 170,758
U.S. Rail Traffic 1. Week 26, 2018 Ended June 30, 2018
 U.S. Rail Traffic 1 270,916 0.7% 6,747,414 259,516 1.3% 33,563 5.5% 841,770 32,376 3.8% 83,214-5.3% 2,141,239 82,355-0.1% Farm Products excl., and Food 16,316 2.1% 421,097 16,196 1.3% 11,027 1.8% 265,428
U.S. Rail Traffic 1. Week 24, 2018 Ended June 16, 2018
 U.S. Rail Traffic 1 269,748 1.9% 6,208,034 258,668 1.3% 31,707 1.5% 775,785 32,324 3.7% 85,538-1.6% 1,975,019 82,292 0.3% Farm Products excl., and Food 16,717 6.2% 388,721 16,197 1.3% 10,837 7.4% 244,234
Edmonton Region Commodity Flow Study
 A Joint Alberta Transportation, City of Edmonton and Economic Development Edmonton Venture Supported by: Alberta Motor Transport Association (AMTA) Alberta Capital Region Alliance (ACRA) Page 1 27,748
U.S. Rail Traffic 1. Week 11, 2018 Ended March 17, 2018
 U.S. Rail Traffic 1 263,352 7.5% 2,764,973 251,361-0.8% 33,430 6.9% 351,170 31,925 2.7% 85,939 11.3% 918,975 83,543-1.9% Farm Products excl., and Food 16,050 0.9% 175,940 15,995-0.9% 10,049 1.4% 109,760
U.S. Rail Traffic 1. Week 13, 2018 Ended March 31, 2018
 U.S. Rail Traffic 1 265,470 3,296,199 253,554-0.3% 33,691 4.6% 418,649 32,204 3.1% 82,740 5.1% 1,089,063 83,774-0.5% Farm Products excl., and Food 15,927-1.6% 208,740 16,057-0.8% 10,595 1.3% 130,447 10,034
U.S. Rail Traffic 1. Week 9, 2019 Ended March 2, 2019
 U.S. Rail Traffic 1 250,522-5.5% 2,238,465 248,718-0.3% 33,518-1.4% 286,869 31,874 0.7% 78,596-8.3% 725,583 80,620-3.2% Farm Products excl., and Food 15,205-8.4% 139,539 15,504-2.4% 9,661-1.5% 90,948 10,105
U.S. Rail Traffic 1. Week 11, 2019 Ended March 16, 2019
 U.S. Rail Traffic 1 240,317-8.8% 2,716,886 246,990-1.7% 31,865-4.7% 350,088 31,826-0.3% 72,190-16.0% 874,335 79,485-4.9% Farm Products excl., and Food 15,606-2.8% 170,620 15,511-3.0% 10,012-0.4% 110,563
Introduction and Background Study Purpose
 Introduction and Background The Brent Spence Bridge on I-71/75 across the Ohio River is arguably the single most important piece of transportation infrastructure the Ohio-Kentucky-Indiana (OKI) region.
WIM #41 CSAH 14, MP 14.9 CROOKSTON, MINNESOTA MAY 2013 MONTHLY REPORT
 WIM #41 CSAH 14, MP 14.9 CROOKSTON, MINNESOTA MAY 2013 MONTHLY REPORT In order to understand the vehicle classes and groupings the Mn/DOT Vehicle Classification Scheme and the Vehicle Classification Groupings
U.S. Rail Traffic 1. Week 14, 2016 Ended April 9, 2016
 U.S. Rail Traffic 1 Cars vs 2015 Cumulative Avg/wk 2 vs 2015 229,704-20.0% 3,372,955 240,925-14.2% 31,259-0.3% 442,374 31,598 3.0% 58,166-44.9% 995,981 71,142-33.4% Farm Products excl., and Food 15,886-7.3%
U.S. Rail Traffic 1. Week 13, 2017 Ended April 1, 2017
 U.S. Rail Traffic 1 Cars vs 2016 Cumulative Avg/wk 2 vs 2016 259,720 9.1% 3,324,102 255,700 5.7% 32,210-5.6% 406,275 31,252-1.2% 78,665 26.8% 1,095,079 84,237 16.8% Farm Products excl., and Food 16,269-2.6%
WIM #39 MN 43, MP 45.2 WINONA, MN APRIL 2010 MONTHLY REPORT
 WIM #39 MN 43, MP 45.2 WINONA, MN APRIL 2010 MONTHLY REPORT In order to understand the vehicle classes and groupings the Mn/DOT Vehicle Classification Scheme and the Vehicle Class Groupings for Forecasting
Clean Harbors Canada, Inc.
 Clean Harbors Canada, Inc. Proposed Lambton Landfill Expansion Environmental Assessment Terms of Reference Transportation Assessment St. Clair Township, Ontario September 2009 itrans Consulting Inc. 260
Windsor, Ontario, Canada
 Windsor, Ontario, Canada The Heart Of Essex County Windsor Essex Quick Facts 200 Mile Radius Map GRAND RAPIDS LANSING DETROIT 200MI 100MI 50 MI 25 MI WINDSOR CANADA TORONTO HAMILTON LONDON ANN ARBOR TOLEDO
U.S. Rail Crude Oil Traffic
 U.S. Rail Crude Oil Traffic Association of American Railroads November 215 Summary U.S. crude oil production has risen sharply in recent years, with much of the increased output moving by rail. In 28,
Madison BRT Transit Corridor Study Proposed BRT Operations Plans
 Madison BRT Transit Corridor Study Proposed BRT Operations Plans This paper presents a description of the proposed BRT operations plan for use in the Madison BRT Transit Corridor Study. The objective is
Truck Movement Characteristics on Selected Truck Routes in Washington State
 Truck Movement Characteristics on Selected Truck Routes in Washington State EWITS Working Paper Number 6 August 1996 by Kathleen M. Painter Post-Doctoral Research Associate and Ken Casavant, EWITS Project
WIM #40 US 52, MP S. ST. PAUL, MN APRIL 2010 MONTHLY REPORT
 WIM #40 US 52, MP 126.8 S. ST. PAUL, MN APRIL 2010 MONTHLY REPORT In order to understand the vehicle classes and groupings the Mn/DOT Vehicle Classification Scheme and the Vehicle Class Groupings for Forecasting
The Community of Yesteryear
 The Community of Yesteryear Charles, Calvert, & St. Mary s County are generally considered Southern Maryland. In years past, residents made a living growing tobacco or working the waters of the Chesapeake.
WIM #41 CSAH 14, MP 14.9 CROOKSTON, MINNESOTA APRIL 2014 MONTHLY REPORT
 WIM #41 CSAH 14, MP 14.9 CROOKSTON, MINNESOTA APRIL 2014 MONTHLY REPORT In order to understand the vehicle classes and groupings, the MnDOT Vehicle Classification Scheme and the Vehicle Classification
Trip Generation and Parking Study New Californian Apartments, Berkeley
 Trip Generation and Parking Study New Californian Apartments, Berkeley Institute of Transportation Engineers University of California, Berkeley Student Chapter Spring 2012 Background The ITE Student Chapter
MEMO VIA . Ms. Amy Roth DPS Director, City of Three Rivers. To:
 MEMO To: Ms. Amy Roth DPS Director, City of Three Rivers VIA EMAIL From: Michael J. Labadie, PE Julie M. Kroll, PE, PTOE Brandon Hayes, PE, P.Eng. Fleis & VandenBrink Date: January 5, 2017 Re: Proposed
Evaluation of Renton Ramp Meters on I-405
 Evaluation of Renton Ramp Meters on I-405 From the SE 8 th St. Interchange in Bellevue to the SR 167 Interchange in Renton January 2000 By Hien Trinh Edited by Jason Gibbens Northwest Region Traffic Systems
2016 North Trunk Highway 65 Corridor Coalition Manufacturers Survey
 2016 North Trunk Highway 65 Corridor Coalition Manufacturers Survey Purpose The North TH 65 Corridor Coalition is focused on improving transportation access and safety and supporting development along
U.S. Rail Crude Oil Traffic
 U.S. Rail Crude Oil Traffic Association of American Railroads May 217 Summary U.S. crude oil production has risen sharply in recent years, with much of the increased output moving by rail. In 28, U.S.
Facts and Figures. October 2006 List Release Special Edition BWC National Benefits and Related Facts October, 2006 (Previous Versions Obsolete)
") Facts and Figures Date October 2006 List Release Special Edition BWC National Benefits and Related Facts October, 2006 (Previous Versions Obsolete) Best Workplaces for Commuters - Environmental and Energy
Facts and Figures Date October 2006 List Release Special Edition BWC National Benefits and Related Facts October, 2006 (Previous Versions Obsolete) Best Workplaces for Commuters - Environmental and Energy
GoToBermuda.com. Q3 Arrivals and Statistics at September 30 th 2015
 Q3 Arrivals and Statistics at September 30 th 2015 1 Q3 Total Vacation Visitor Arrivals Q3 Arrivals 2014 2015 YTD 2014 YTD 2015 Air - Vacation 54,305 54,473 0.31% 168 117,639 116,700-0.80% (939) Cruise
Motorcoach Census. A Study of the Size and Activity of the Motorcoach Industry in the United States and Canada in 2015
 Motorcoach Census A Study of the Size and Activity of the Motorcoach Industry in the United States and Canada in 2015 Prepared for the American Bus Association Foundation by John Dunham & Associates October
Transportation Data in Southeast Michigan
 January 2014 Transportation Data in Southeast Michigan SEMCOG, the Southeast Michigan Council of Governments, collects, analyzes, and reports on transportation data in Southeast Michigan as a service to
US 81 Bypass of Chickasha Environmental Assessment Public Meeting
 US 81 Bypass of Chickasha Environmental Assessment Public Meeting March 14, 2013 Introductions ODOT FHWA SAIC Meeting Purpose Present need for bypass Provide responses to 10/04/11 public meeting comments
Northern Ontario Commercial Vehicle Travel Profile
 TRANSPORTATION Final Report The Preparation of a Northern Ontario Passenger and Commercial Vehicle Origin-Destination Survey Northern Ontario Commercial Vehicle Travel Profile Submitted to Ministry of
Monthly Report on the Corporate Goods Price Index ( Preliminary Figures for August 2014 )
") Research and Statistics Department Bank of Japan Report on the Corporate Goods Price The Producer Price fell 0.2 percent from the previous. The Export Price (contract currency ) rose 0.1 percent from the
Research and Statistics Department Bank of Japan Report on the Corporate Goods Price The Producer Price fell 0.2 percent from the previous. The Export Price (contract currency ) rose 0.1 percent from the
Technical Memorandum Analysis Procedures and Mobility Performance Measures 100 Most Congested Texas Road Sections What s New for 2015
 Technical Memorandum Analysis Procedures and Mobility Performance Measures 100 Most Congested Texas Road Sections Prepared by Texas A&M Transportation Institute August 2015 This memo documents the analysis
2.0 Development Driveways. Movin Out June 2017
 Movin Out June 2017 1.0 Introduction The proposed Movin Out development is a mixed use development in the northeast quadrant of the intersection of West Broadway and Fayette Avenue in the City of Madison.
WIM #31 US 2, MP 8.0 EAST GRAND FORKS, MN JANUARY 2015 MONTHLY REPORT
 WIM #31 US 2, MP 8.0 EAST GRAND FORKS, MN JANUARY 2015 MONTHLY REPORT WIM #31 EAST GRAND FORKS MONTHLY REPORT - JANUARY 2015 WIM Site Location WIM #31 is located on US 2 at mile post 8.0, southeast of
Speed Evaluation Saw Mill Drive
 Speed Evaluation Saw Mill Drive Prepared for: Mount Laurel Township Burlington County, New Jersey Prepared by: Dana Litwornia Litwornia & Associates, Inc. Transportation, Traffic & Environmental Engineering
WIM #37 was operational for the entire month of September Volume was computed using all monthly data.
 SEPTEMBER 2016 WIM Site Location WIM #37 is located on I-94 near Otsego in Wright county. The WIM is located only on the westbound (WB) side of I-94, meaning that all data mentioned in this report pertains
Metropolitan Freeway System 2007 Congestion Report
 Metropolitan Freeway System 2007 Congestion Report Minnesota Department of Transportation Office of Traffic, Safety and Operations Freeway Operations Section Regional Transportation Management Center March
UNDERSTANDING THE SIGNIFICANCE OF AXLE VERSUS LENGTH CLASSIFICATION ON AXLE FACTORS AND THE EFFECT ON AADT TO ENSURE RELIABLE TRAFFIC DATA
 WISCONSIN DOT CASE STUDY FINDINGS UNDERSTANDING THE SIGNIFICANCE OF AXLE VERSUS LENGTH CLASSIFICATION ON AXLE FACTORS AND THE EFFECT ON AADT TO ENSURE RELIABLE TRAFFIC DATA NATMEC 2014, Chicago, Illinois
Appendix B CTA Transit Data Supporting Documentation
 RED ED-PURPLE BYPASS PROJECT ENVIRONMENTAL ASSESSMENT AND SECTION 4(F) EVALUATION Appendix B CTA Transit Data Supporting Documentation 4( Memorandum Date: May 14, 2015 Subject: Chicago Transit Authority
PRESENTATION Metro s Streets & Freeways Subcommittee
 PRESENTATION Metro s Streets & Freeways Subcommittee Los Angeles County Metro s 2011 Interstate 210 Truck Origin & Destination (O D) Study Presented by: Fred Minagar MINAGAR & ASSOCIATES, INC. October
Labor Productivity, Compensation Costs, and U.S. International Competitiveness
 Cornell University ILR School DigitalCommons@ILR Federal Publications Key Workplace Documents June 1993 Labor Productivity, Compensation Costs, and U.S. International Competitiveness U.S. Bureau of Labor
National Household Travel Survey Add-On Use in the Des Moines, Iowa, Metropolitan Area
 National Household Travel Survey Add-On Use in the Des Moines, Iowa, Metropolitan Area Presentation to the Transportation Research Board s National Household Travel Survey Conference: Data for Understanding
2016 Greenhouse Gas Inventory
 2016 Greenhouse Gas Inventory A Summary of Dickinson College s Greenhouse Gas Emissions Prepared by: Marcus Welker, Center for Sustainability Education, Projects Coordinator Final: 08/04/17 1 Introduction
Appendix SAN San Diego, California 2003 Annual Report on Freeway Mobility and Reliability
 (http://mobility.tamu.edu/mmp) Office of Operations, Federal Highway Administration Appendix SAN San Diego, California 2003 Annual Report on Freeway Mobility and Reliability This report is a supplement
CIF # City of Barrie. Large Curbside Containers. Final Report. Final Project Report, September City of Barrie. CIF Project # 801.
 Final Report CIF #801.5 City of Barrie Large Curbside Containers Final Project Report, September 2015 City of Barrie CIF 801.5 City of Barrie: Large Curbside Containers, September 2015 1 CIF Project #
UTA Transportation Equity Study and Staff Analysis. Board Workshop January 6, 2018
 UTA Transportation Equity Study and Staff Analysis Board Workshop January 6, 2018 1 Executive Summary UTA ranks DART 6 th out of top 20 Transit Agencies in the country for ridership. UTA Study confirms
King County Metro. Columbia Street Transit Priority Improvements Alternative Analysis. Downtown Southend Transit Study. May 2014.
 King County Metro Columbia Street Transit Priority Improvements Alternative Analysis Downtown Southend Transit Study May 2014 Parametrix Table of Contents Introduction... 1 Methodology... 1 Study Area...
Monthly Report on the Corporate Goods Price Index ( Preliminary Figures for November 2017 )
") Research and Statistics Department Bank of Japan Report on the Corporate Goods Price Index The Producer Price Index rose 0.4 percent from the previous. The Export Price Index (contract currency ) rose
Research and Statistics Department Bank of Japan Report on the Corporate Goods Price Index The Producer Price Index rose 0.4 percent from the previous. The Export Price Index (contract currency ) rose
Monthly Report on the Corporate Goods Price Index ( Preliminary Figures for November 2018 )
") Research and Statistics Department Bank of Japan Report on the Corporate Goods Price Index The Producer Price Index fell 0.3 percent from the previous. The Export Price Index (contract currency ) fell
Research and Statistics Department Bank of Japan Report on the Corporate Goods Price Index The Producer Price Index fell 0.3 percent from the previous. The Export Price Index (contract currency ) fell
Traffic Engineering Study
 Traffic Engineering Study Bellaire Boulevard Prepared For: International Management District Technical Services, Inc. Texas Registered Engineering Firm F-3580 November 2009 Executive Summary has been requested
Technical Memorandum. Purpose of Report and Study Objectives. Summary of Results
 Technical Memorandum To: Derek Leuer, MnDOT Traffic Safety Engineer From: Max Moreland, P.E. and Bryant Ficek, P.E., P.T.O.E. Date: February 17, 217 Re: Median Acceleration Lane Usage Purpose of Report
Interstate Operations Study: Fargo-Moorhead Metropolitan Area Simulation Output
 NDSU Dept #2880 PO Box 6050 Fargo, ND 58108-6050 Tel 701-231-8058 Fax 701-231-6265 www.ugpti.org www.atacenter.org Interstate Operations Study: Fargo-Moorhead Metropolitan Area 2015 Simulation Output Technical
WYOMING COST OF LIVING FOR THE SECOND QUARTER 2010
 State of Wyoming Department of Administration and Information Economic Analysis Division 2800 Central Avenue Cheyenne, WY 82002-0060 E-mail: ead@wyo.gov http://eadiv.state.wy.us Ph. (307) 777-7504 Fax
More persons in the cars? Status and potential for change in car occupancy rates in Norway
 Author(s): Liva Vågane Oslo 2009, 57 pages Norwegian language Summary: More persons in the cars? Status and potential for change in car occupancy rates in Norway Results from national travel surveys in
Monthly Report on the Corporate Goods Price Index ( Preliminary Figures for June 2014 )
") Research and Statistics Department Bank of Japan Report on the Corporate Goods Price The Producer Price rose 0.2 percent from the previous. The Export Price (contract currency ) fell 0.1 percent from the
Research and Statistics Department Bank of Japan Report on the Corporate Goods Price The Producer Price rose 0.2 percent from the previous. The Export Price (contract currency ) fell 0.1 percent from the
OFF-PEAK DELIVERIES. Ontario Trucking Association June 26 th, Goods Movement Office Transportation Policy Branch Ministry of Transportation
 OFF-PEAK DELIVERIES Ontario Trucking Association June 26 th, 2015 Goods Movement Office Transportation Policy Branch Ministry of Transportation 2 Outline Off-Peak Deliveries Pilot Background Phase One
Table of Contents INTRODUCTION... 3 PROJECT STUDY AREA Figure 1 Vicinity Map Study Area... 4 EXISTING CONDITIONS... 5 TRAFFIC OPERATIONS...
 Crosshaven Drive Corridor Study City of Vestavia Hills, Alabama Table of Contents INTRODUCTION... 3 PROJECT STUDY AREA... 3 Figure 1 Vicinity Map Study Area... 4 EXISTING CONDITIONS... 5 TRAFFIC OPERATIONS...
Proposed location of Camp Parkway Commerce Center. Vicinity map of Camp Parkway Commerce Center Southampton County, VA
 Proposed location of Camp Parkway Commerce Center Vicinity map of Camp Parkway Commerce Center Southampton County, VA Camp Parkway Commerce Center is a proposed distribution and industrial center to be
2009/10 NWT Aurora Visitor Survey Report. Industry, Tourism and Investment Government of the Northwest Territories
 2009/10 NWT Aurora Visitor Survey Report Industry, Tourism and Investment Government of the Northwest Territories INTRODUCTION... 3 SURVEY METHODOLOGY... 4 EXECUTIVE SUMMARY... 5 VISITOR PROFILE... 7 AGE...
Passenger Vehicle Survey: Traffic and Vehicle Classification Summary
 TRANSPORTATION Final Report The Preparation of a Northern Ontario and Commercial Vehicle Origin-Destination Survey Vehicle Survey: Traffic and Vehicle Classification Summary Submitted to Ministry of Transportation,
Transportation accomplishments
 1 1 Welcome Transportation accomplishments Federal Funding State Funding Challenges Future Projects 2 Transportation Project: The NDDOT had a record construction season in 2011. Completed $595.6 million
Alberta Speeding Convictions and Collisions Involving Unsafe Speed
 Alberta Speeding Convictions and Collisions Involving Unsafe Speed 2004-2008 Overview This document was prepared under the Alberta Traffic Safety Plan, Strategic Research Plan for 2008-2010, with the objective
Washington State Freight Truck Origin and Destination Study: Ferry County
 Washington State Freight Truck Origin and Destination Study: Ferry County EWITS Research Report Number 21-Ferry January 1998 by Kathleen M. Painter in cooperation with Kenneth L. Casavant, EWITS Project
WIM #48 is located on CSAH 5 near Storden in Cottonwood county.
 WIM Site Location WIM #48 is located on CSAH 5 near Storden in Cottonwood county. System Operation WIM #48 was operational for the entire month of August 2017. Volume was computed using all monthly data.
STH 60 Northern Reliever Route Feasibility Study Report
 #233087 v3 STH 60 Northern Reliever Route Feasibility Study Report Washington County Public Works Committee Meeting September 28, 2016 1 STH 60 Northern Reliever Route Feasibility Study Hartford Area Development
WIM #40 is located on US 52 near South St. Paul in Dakota county.
 WIM Site Location WIM #40 is located on US 52 near South St. Paul in Dakota county. System Operation WIM #40 was operational for the entire month of November 2017. Volume was computed using all monthly
Abstract. Executive Summary. Emily Rogers Jean Wang ORF 467 Final Report-Middlesex County
 Emily Rogers Jean Wang ORF 467 Final Report-Middlesex County Abstract The purpose of this investigation is to model the demand for an ataxi system in Middlesex County. Given transportation statistics for
King Soopers #116 Thornton, Colorado
 Traffic Impact Study King Soopers #116 Thornton, Colorado Prepared for: Galloway & Company, Inc. T R A F F I C I M P A C T S T U D Y King Soopers #116 Thornton, Colorado Prepared for Galloway & Company
Monthly Report on the Corporate Goods Price Index ( Preliminary Figures for May 2018 )
") Research and Statistics Department Bank of Japan Report on the Corporate Goods Price Index The Producer Price Index rose 0.6 percent from the previous. The Export Price Index (contract currency ) rose
Research and Statistics Department Bank of Japan Report on the Corporate Goods Price Index The Producer Price Index rose 0.6 percent from the previous. The Export Price Index (contract currency ) rose
SERVICE IMPROVEMENT GUIDE
 SOUTH COOK COUNTY / WILL COUNTY RESTRUCTURING INITIATIVE SERVICE IMPROVEMENT GUIDE Working to Improve Your Commute Change has arrived for residents of south and southwest Cook County, in the form of improved
Pedestrians, Cars, Buses and Trains? Considerations for Rapid Transit Service at Western University
 Pedestrians, Cars, Buses and Trains? Considerations for Rapid Transit Service at Western University Shift: The City of London s Rapid Transit Proposal Shift: The City of London s Rapid Transit Proposal
Energy Technical Memorandum
 Southeast Extension Project Lincoln Station to RidgeGate Parkway Prepared for: Federal Transit Administration Prepared by: Denver Regional Transportation District May 2014 Table of Contents Page No. Chapter
Monthly Report on the Corporate Goods Price Index ( Preliminary Figures for October 2014 )
") Research and Statistics Department Bank of Japan Report on the Corporate Goods Price The fell 0.8 percent from the previous. The index excluding extra charges for summer electricity fell 0.6 percent from
Research and Statistics Department Bank of Japan Report on the Corporate Goods Price The fell 0.8 percent from the previous. The index excluding extra charges for summer electricity fell 0.6 percent from
THE MACHINERY INDUSTRY OF JAPAN 2009
 00 2010 THE MACHINERY INDUSTRY OF JAPAN 2009 CONTENTS 1. Recent Trends in the Machinery Industry 1-1. Production Trends... 1 1-2. Foreign Trade... 1 2. The Importance of the Machinery Sector in Japanese
Commercial Vehicle Survey: Traffic and Vehicle Classification Summary
 TRANSPORTATION Final Report The Preparation of a Northern Ontario and Commercial Vehicle Origin-Destination Survey Commercial Vehicle Survey: Traffic and Vehicle Classification Summary Submitted to Ministry
Monthly Report on the Corporate Goods Price Index ( Preliminary Figures for July 2015 )
") Research and Statistics Department Bank of Japan Report on the Corporate Goods Price The Producer Price fell 0.2 percent from the previous. The index excluding extra charges for summer electricity fell
Research and Statistics Department Bank of Japan Report on the Corporate Goods Price The Producer Price fell 0.2 percent from the previous. The index excluding extra charges for summer electricity fell
Monthly Report on the Corporate Goods Price Index ( Preliminary Figures for February 2018 )
") Research and Statistics Department Bank of Japan Report on the Corporate Goods Price Index The Producer Price Index was und from the previous. The Export Price Index (contract currency ) rose 0.4 percent
Research and Statistics Department Bank of Japan Report on the Corporate Goods Price Index The Producer Price Index was und from the previous. The Export Price Index (contract currency ) rose 0.4 percent
EXECUTIVE SUMMARY. The following is an outline of the traffic analysis performed by Hales Engineering for the traffic conditions of this project.
 EXECUTIVE SUMMARY This study addresses the traffic impacts associated with the proposed Shopko redevelopment located in Sugarhouse, Utah. The Shopko redevelopment project is located between 1300 East and
RE: A Traffic Impact Statement for a proposed development on Quinpool Road
 James J. Copeland, P.Eng. GRIFFIN transportation group inc. 30 Bonny View Drive Fall River, NS B2T 1R2 May 31, 2018 Ellen O Hara, P.Eng. Project Engineer DesignPoint Engineering & Surveying Ltd. 200 Waterfront
Heightened Expectations
 Q 0 INDUSTRIAL BIG BOX THE BIG BOX REPORT A SNAPSHOT OF S BULK WAREHOUSE DISTRIBUTION TRENDS Heightened Expectations MARKET SNAPSHOT > > The Chicago big box inventory base consists of 40 facilities totaling
Appendix J Traffic Impact Study
 MRI May 2012 Appendix J Traffic Impact Study Level 2 Traffic Assessment Limited Impact Review Appendix J [This page was left blank intentionally.] www.sgm-inc.com Figure 1. Site Driveway and Trail Crossing
In this report, last week multiple commodities came down in price while parts of Wall Street hit new all-time highs.
 This is the Scrap Metal & Commodities Recycling report, by BENLEE Roll off, Lugger and Open Top Trailers and Raleigh and Goldsboro Metal Recycling Monday August 8th, 2016. In this report, last week multiple
Transit City Etobicoke - Finch West LRT
 Delcan Corporation Transit City Etobicoke - Finch West LRT APPENDIX D Microsimulation Traffic Modeling Report March 2010 March 2010 Appendix D CONTENTS 1.0 STUDY CONTEXT... 2 Figure 1 Study Limits... 2
Open House. Highway212. Meetings. Corridor Access Management, Safety & Phasing Plan. 5:30 to 6:30 p.m. - Southwest Corridor Transportation Coalition
 Welcome Meetings 5:30 to 6:30 p.m. - Southwest Corridor Transportation Coalition 6:30 to 8:00 p.m. - Open House Why is Highway 212 Project Important? Important Arterial Route Local Support Highway 212
Service Quality: Higher Ridership: Very Affordable: Image:
 Over the past decade, much attention has been placed on the development of Bus Rapid Transit (BRT) systems. These systems provide rail-like service, but with buses, and are typically less expensive to
[Report Title] [Report Tag Line]
![[Report Title] [Report Tag Line]](/thumbs/90/104316182.jpg "[Report Title] [Report Tag Line]") [Report Title] [Report Tag Line] TTS 6 REGIONAL MUNICIPALITY OF PEEL SUMMARY BY WARD MARCH 8 Bess Ashby, Research Director 5 Yonge St. Toronto, ON M5B E7 Phone: (6) 6-6 ext. E-mail: b.ashby@malatest.com
[Report Title] [Report Tag Line] TTS 6 REGIONAL MUNICIPALITY OF PEEL SUMMARY BY WARD MARCH 8 Bess Ashby, Research Director 5 Yonge St. Toronto, ON M5B E7 Phone: (6) 6-6 ext. E-mail: b.ashby@malatest.com
Maple Syrup Production Statistics
 Maple Syrup Production Statistics An Updated Report to the North American Maple Syrup Council October, 2016 Burlington, Vermont Updated from the 2012 Report Data Compiled By: Dr. Gary Graham Ohio State
US Exports to China by State
 US Exports to China by State 2000 10 1818 N Street, NW, Suite 200, Washington, DC 20036 Tel: 202-429-0340 Fax: 202-775-2476 E-mail: info@uschina.org www.uschina.org Executive Summary Exports to China are