Wellington Transport Models
|
|
|
- Sharon Cain
- 5 years ago
- Views:
Transcription

1 TN15 Input Parameters Date: December 2012
 Level 9, Majestic Centre, 100 Willis Street Geoffrey Cornelis (GWRC) PO Box 12003, Wellington 6144 New Zealand Ph: +64 4 471 7000")

2 Wellington Transport Models TN15: Input Parameters prepared for Greater Wellington Regional Council Prepared By Opus International Consultants Limited Andy Wilson (Opus) Wellington Office John Pell (Opus) Level 9, Majestic Centre, 100 Willis Street Geoffrey Cornelis (GWRC) PO Box 12003, Wellington 6144 New Zealand Ph: Reviewed By Fraser Fleming (Opus) Arup Level 17, 1 Nicholson Street Melbourne VIC 3000 Australia Ph: Date: December 2012 Reference: g:\localauthorities\wrc\proj\5- c c3079 wtsm wptm\600 deliverables\630 final tech notes\tn15 input parameters final.docx Status: Final Revision: 2 Opus International Consultants Limited 2012
3 Document History and Status Issue Rev Issued To Qty Date Reviewed Approved Draft v1 Nick Sargent - GW electronic 11/04/2012 Andy Wilson Andy Wilson Draft v2 Nick Sargent and John Bolland electronic 06/07/2012 Fraser Fleming David Dunlop Final 1 Nick Sargent and John Bolland electronic 31/08/2012 Andy Wilson David Dunlop Final 2 Nick Sargent - GW 1 Hard & 1 CD 06/12/2012 Andy Wilson David Dunlop This report takes into account the particular instructions and requirements of our client. It is not intended for and should not be relied upon by any third party and no responsibility is undertaken to any third party. John Bolland: (Peer Reviewer) Nick Sargent: (GWRC)
4 Contents 1 Introduction Base 2011 Approach Forecast Approach Values of Time Methodology Values of Time Calculation Values of Time Forecast Vehicle Operating Costs Methodology Base 2008 Costs from the EEM Road Surface Condition Costs Congestion Costs Stoppage Costs Changes in Speed Costs Total Costs Total VoC Adjustment to VoC & VoT Assignment Weightings Vehicle Operating Cost Forecast Fuel Price Forecasts Vehicle Efficiency Forecasts Car Parking Costs Summary of the 2006 Update Approach Car Parking Cost Forecast Public Transport Fares Introduction Transfer Penalties Public Transport Fares Forecast Travel Demand Management Parameters Model Response to Parameters Adjustments Conclusions APPENDIX A Indexing of Economic Indicators APPENDIX B Survey of Wellington CBD Parking Charges (2011)... 37
5 APPENDIX C Initial Approach to Parking Charge Update APPENDIX D David Young s WTSM Forecasting Inputs Note APPENDIX E Economic Evaluation Manual Tables... 52
6 1 Introduction Opus International Consultants Limited (Opus) and Arup Australia (Arup) were commissioned by Greater Wellington Regional Council (GWRC) to rebase the existing 2006 Wellington Transport Strategy Model (WTSM) to a new base year of Opus updated the WTSM while Arup developed a Wellington Public Transport Model (WPTM) based on figures from WTSM and detailed public transport surveys. The whole process of model updates and development is complex and involves several steps which have each been individually reported in a series of technical notes. This note documents the process used to update the Wellington Transport Strategic Model (WTSM) input parameters from 2006 to 2011 and the approach to forecasting these parameters to 2021, 2031 and The approach differs significantly from the 2006 update in both the calculation of the base 2011 parameters and the forecast year parameters: Firstly, the 2006 update used nominal 2006 values whereas during this update it was decided to adjust nominal 2011 prices back to 2001 dollars using the Consumer Price Index (CPI). The reason for this was that trip distribution and mode choice models had been calibrated in 2001 prices so the model would respond to prices at these levels i.e. using inflated nominal prices supercharged model responses; Secondly, substantial investigations were conducted into adjusting input parameters for forecast scenarios. This included reviews of the approaches in Auckland, Christchurch, Waikato and Melbourne. The work was initially guided by the work of David Young who produced a memo for GWRC which has been included in Appendix D. The memo contrasted the approaches of Auckland and Wellington (given the similarities of the models). Also contacted were the New Zealand Transport Agency (NZTA) and developers / users of the Canterbury, Waikato and Melbourne Travel Demand Forecasting Models for additional perspective. Teleconference meetings were held with representatives of some interested parties while others were contacted for their views and experience directly; and Thirdly, in calibrating the 2011 model it became clear that there was excess Public Transport (PT) demand in the mode choice model. The reasons for this have been summarised in TN18 but the outcomes have also been reported in this technical note due to the fact the manipulation was applied directly to the input parameters. The result of the investigations was that a factor of 1.2 was applied to the PT generalised cost matrices. 1.1 Base 2011 Approach All the input parameters in the 2006 version of WTSM were expressed in 2006 prices. The approach taken in the 2011 update is to first adjust all inputs to nominal values in 2011 before making an inflation adjustment to Table 1-1 below summarises the approach taken. 1
7 TN15: Input Parameters Table 1-1: Summary of Input Sources and Adjustment Process Value of Time (VoT) VoT taken from Economic Evaluation Manual (EEM) and adjusted to 2011 nominal value using growth in nominal GDP per capita from 2001 to Vehicle Operating Cost (VoC) - Fuel VoC fuel taken from EEM in 2008 values and adjusted to 2011 nominal values using fuel inflation. VoC Non Fuel VoC non fuel taken from EEM in 2008 and adjusted to 2011 nominal values using CPI. Parking Charges Parking charges taken from WCC and Wilsons Parking websites in Public Transport (PT)Fares PT Fares extracted from metlink website in All Input Values All inputs then inflation adjusted to 2001 using CPI. The inflation adjustment is not to reproduce costs as they were in 2001 but to scale them in a way that the trip distribution and mode split models can respond properly - due to the fact the demand model was calibrated using responses in 2001 prices. The nominal 2011 prices include an inflationary element which the demand model would interpret as a real effect and respond accordingly. The figure below shows how key nominal economic indicators used in the model have changed compared to an index year of 2001 (data included in Appendix A). It can be seen from Figure 1-1 that Gross Domestic Product (GDP) per capita has been increasing but with a levelling off period between 2008 and 2009 reflecting the impacts of the Global Financial Crisis. CPI is also growing but at a slower rate than GDP. Perhaps most remarkable is the volatility of the household petrol index which climbed rapidly to peaks in 2005, 2008 and
8 Mar Sep Mar Sep Mar Sep Mar Sep Mar Sep Mar Sep Mar Sep Mar Sep Mar Sep Mar Sep Mar Index TN15: Input Parameters Yearly Quarters GDP per Capita (index 1=2001) Consumer Price Index (index 1=2001) Household Petrol (index 1=2001) Figure 1-1: Nominal Economic Indicators Indexing Finally input parameters must distinguish between the price year required for the operation of the 4 stage model and the price year required for reporting. To clarify: As mentioned above the price year required for the operation of the model is the year the demand model was calibrated; and Model outputs, such as estimated Public Transport (PT) revenues, are reported in 2011 prices. The approach of using 2001 prices rather than 2011 prices was confirmed during the validation process. The balance of car and PT trips aligned much more closely with observed values using 2001 prices rather than 2011 prices. In addition, the sensitivity testing undertaken as part of the validation process also confirmed sensible responses using 2001 prices. The results of the testing have been documented in Appendix F. 1.2 Forecast Approach Wide consultation was undertaken on the approach to forecast parameters in other major centres. It was found that, at the time of writing this note, the only model where input parameters had been adjusted in the future scenarios was Auckland. The Christchurch, Waikato and Melbourne models kept parameters unchanged in future scenarios. Auckland modellers, in large part, were driven by public pressures regarding planning for peak oil 1 Source: \\wbsv01\wb_gen_g\z_drive\wtsm_2011\economic Parameters\Updated 2011 VoT, VOC & Parking.xlsx 3
9 whereas developers of the Canterbury, Waikato and Melbourne models had maintained the convention of keeping input parameters unchanged due to the magnitude of the uncertainties involved. On balance, the favoured approach was to make some changes as the overwhelming weight of evidence pointed to changes, particularly with regards to fuel prices. Ultimately, it was decided that it would be very useful to understand the impacts these were having under different assumption scenarios. This view was supported by NZTA who favoured the Auckland based approach to input parameter forecasting as it helped provide consistency in appraising economic benefits of projects in the two regions. NZTA, however, were also cautious as it was likely that the findings from the Wellington investigations (being the most recent) would warrant circulation for further discussion. 4
10 2 Values of Time 2.1 Methodology Values of time parameters in WTSM are based on values from the NZTA s Economic Evaluation Manual (EEM) expressed by different modes and trip purposes, and by proportions for these trips modes and purposes from the 2001 Wellington Household Travel Survey (HTS). These values of time were adjusted for the WTSM 2006 update using GDP growth, and the same procedure has been applied to update these values to Values of Time Calculation The values of time given by the EEM (Vol1, Table A4.1) are for 2002 and are shown in Table 2-1. Table 2-1: EEM Base Values of Time 2002 Values for Vehicle Occupant Transport User Time in $/hr (all road categories; all time periods - July 2002) Vehicle occupant Work travel purpose Commuting to/from work Base values of time for uncongested traffic ($/h) Car / motorcycle driver Car / motorcycle passenger Light commercial driver Light commercial passenger Medium/heavy commercial driver Medium/heavy commercial passenger Seated bus and train passenger Standing bus and train passenger Other non-work travel purposes These costs were adjusted to 2011 using nominal GDP per capita from Statistics NZ between 2001 and 2011, which led to a growth factor of These values (converted to cents/minute) were allocated to the different trip modes and purposes used in the model, and the proportions from the 2001 HTS and were used to calculate the values of time per trip purpose and car availability. The resulting values of time are detailed in the Table
11 Table 2-2: Value of Time per Purpose (All road categories, all time periods July 2011) Purpose Car Availability 2011 VoT (c/min) Car Driver Car Pax PT CV 1 HBW 2 Competition & Choice Captive HBEd 3 Competition & Choice Captive EB 4 All Other Purpose Captive Competition & Choice Car Availability Trips (from 2001 HTS) Car Driver Car Pax PT CV VoT (c/min) 5 HBW 2 Competition & Choice 141,940 26,803 37, Captive , HBEd 3 Competition & Choice 37,596 48,967 30, Captive , EB 4 All 79,792 9,007 4,291 32, Captive 1,876 18,043 13, Other Competition & Choice 569, ,199 32, Notes: 1. CV = commercial vehicle 2. HBW = home based work 3. HBEd = home based education 4. EB = employers business 5. Average weighted by number of trips Table 2-3 below shows the final 2001 values of time as well as the values used in the 2006 update and intermediate 2011 values for comparison. 6
12 Values of Time (indexed to 2006) TN15: Input Parameters Table 2-3: 2006 and 2011 Values of Time (All road categories, all time periods July 2011) Purpose HBW HBEd Car Availability Nominal values used in WTSM 2006 (c/min) 1 Estimated Nominal 2011 (c/min) 1 CPI adjusted to 2001 (c/min) 1 Captive Competition & Choice All Captive Competition & Choice All EB All Other Captive Competition & Choice All Notes: 1. Average weighted by number of trips 2.3 Values of Time Forecast The forecast approach for values of time has been based on the recommendations of both David Young and a group of industry representatives mentioned in Section 1. The recommendation was to use the Auckland approach which included adjustment to real VoT using the real GDP per capita growth with an elasticity of 0.8 applied to non-work travel purposes. Figure 2-1 shows how the work and non-work values of time increase with respect to 2006 values in the Auckland model resulting in increases of 87% and 65% respectively by Values of Time Non-Work Work Figure 2-1: Auckland Values of Time (Indexed to 2006 values) 7
13 Table 2-4 shows the values of time in each model year (2011, 2021, 2031 and 2041) for each trip purpose plus how the adjustment factors were calculated. The use of NZ Treasury forecasts made it possible to improve the accuracy of the VoT forecast by using the labour force instead of total population. The approach was chosen because the purpose of the using GDP per capita was that it would reflect the fact that peoples incomes were increasing and a large proportion of the VoT explanatory variables related to income i.e. the more a person earned the higher their value of time. By using Forecast Labour Force it was possible to determine a more accurate link between VoT and income. Table 2-4: Wellington Forecast Values of Time (in 2001 Prices) Adjustment Factor Source Real GDP (Base = 1995/96) Labour Force (millions) GDP/Labout_force DDP/Labour_force Index Purpose Car Availability Values of Time Adjustment Factors (Index 1=2011) HBW Captive Competition & Choice Combined HBEd Captive Competition & Choice Combined EB Competition & Choice Captive Other Captive Competition & Choice Combined
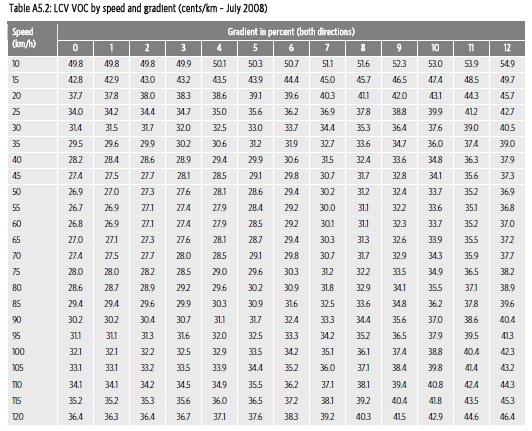
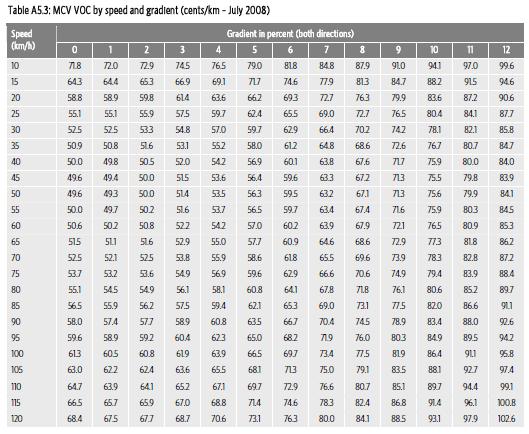
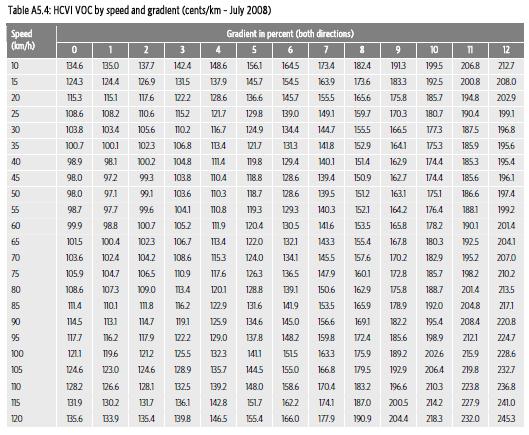
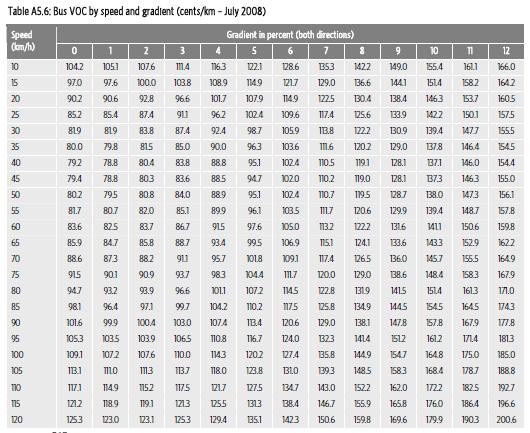
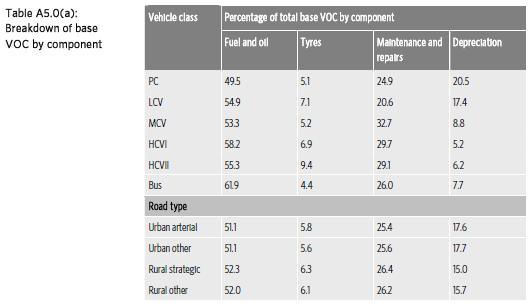
14 3 Vehicle Operating Costs 3.1 Methodology The vehicle operating costs (VoC) used in WTSM are based on values from Appendix A5 of the EEM (all costs in July 2008 dollars) and include the following components: Base costs: fuel and oil, tyres, maintenance and repairs (M&R), depreciation; Road surface condition / roughness; Congestion; Stoppages (VoC due to bottleneck delay); and Changes in speed. Although some of these components are defined in the EEM as a function of road category, gradient or speed (and therefore congestion), they are implemented in WTSM as fixed parameters and do not vary with changes in infrastructure or travel conditions. For this purpose, and in order to calculate network-wide values, a number of assumptions had to be made regarding average speed, gradient and other parameters, which were all based on the 2006 model update. VoC are, however, calculated separately for the following vehicle categories: Private Car (PC); Light Commercial Vehicle (LCV); Medium Commercial Vehicle (MCV); Heavy Commercial Vehicle Category I (HCVI); Heavy Commercial Vehicle Category II (HCVII); and Bus. In addition to this, the Road User Charges for diesel vehicles have also been included. The costs are calculated in units of cents per kilometre. 3.2 Base 2008 Costs from the EEM Base VoC includes fuel, tyres, maintenance and repairs (M&R), and vehicle depreciation. The total base VoC for each vehicle category is given in Tables A5.1 to A5.6 of the EEM and are a function of speed and gradient (see Appendix E). The 2006 model assumed a network-wide value with an average speed of 45km/h and an average gradient of 1%. The 2011 model used the same assumptions to maintain consistency. These total costs are then disaggregated into fuel, tyre, M&R and depreciation with the proportions for each components obtained from Table A5.0(a) of the EEM (also included in Appendix E). The total base costs, proportions and resulting components costs are detailed in Table
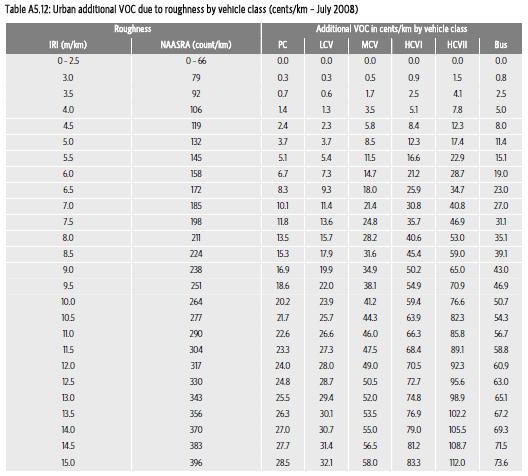
15 Table 3-1: Base Costs (2008) Base Cost Component Proportions and Costs Fuel/Oil Tyres R&M Depreciation Class c/km % c/km % c/km % c/km % c/km PC LCV MCV HCVI HCVII Bus Road Surface Condition Costs The road surface condition (or road roughness) costs are an estimation of a vehicles natural wear and tear caused by the condition of the road. It is given for each vehicle category in Table A5.12 of the EEM (Appendix E) and is a function of the International Roughness Index (IRI) of the road. The 2006 model assumed a network-wide cost with an average value of 4.5 m/km for urban road. The 2011 model used the same assumptions to maintain consistancy The resulting road surface condition costs are shown in Table 3-2. Table 3-2: Road Surface Condition Costs (2008) 3.4 Congestion Costs Class Costs (c/km) PC 2.4 LCV 2.3 MCV 5.8 HCVI 8.4 HCVII 12.3 Bus 8 Congestion costs account for additional fuel use caused by vehicle acceleration and deceleration in a congested environment and are a function of the vehicle to capacity ratio (V/C). The 2006 model assumed values for urban roads category with an average V/C of 0.7, as shown in Table A5.16 of the EEM. The 2011 model used the same assumptions to maintain consistancy The resulting congestion costs are shown in Table
16 Table 3-3: Congestion Costs (2008) Class Costs (c/km) PC 1.2 LCV 2.2 MCV 3.5 HCVI 13.1 HCVII 37.2 Bus Stoppage Costs Stoppage costs represent the fuel consumption of idle vehicles experiencing bottleneck delays (when V/C>1) and are shown in Table A5.22 of the EEM (Appendix E). Stoppage costs assumed in the 2006 model were expressed in c/min and the following assumptions were made to convert them to c/km: 1 stop per kilometre travelled; and 4 minutes per stop. Again, the same has been assumed for the 2011 update. The resulting stoppage costs are shown in Table 3-4, both in c/min and c/km. Table 3-4: Stoppage Costs (2008) Class Costs (c/min) Costs (c/km) PC LCV MCV HCVI HCVII Bus Changes in Speed Costs Changes in speed costs account for additional costs incurred by vehicles having their speed interrupted due to road features (change in geometry, intersection, etc), causing speed cycles: the vehicle decelerates to a minimum speed and then accelerates back to its original cruise speed. Changes in speed costs are given in EEM Tables A5.25 to A5.35 and are expressed in cents/cycle. The following assumptions were made in the 2006 model to convert them to c/km: 1 intersection stop per kilometre (as opposed to bottleneck stops in stoppages); Lower speed is 0kph; and Upper speed is 65kph. 11
17 The assumptions have been carried forward into the 2011 model. The resulting change in speed costs are shown in Table 3-5. Table 3-5: Changes in Speed Costs (2008) Class Costs (c/cycle) Costs (c/km) PC LCV MCV HCVI HCVII Bus Total Costs Table 3-6 below shows the calculated VoC for each vehicle category. The components are separated into fuel, M&R and other. Table 3-6: Total Vehicle Operating Costs (2008) Financial Costs (c/km) PC LCV MCV HCVI HCVII Bus Base Costs: Fuel/Oil Congestion Fuel Stoppages Changes in Speed Total Base Costs: R&M R&M Road Surface Condition Total Base Costs: Tyres Other* Base Costs: Depreciation Total Total (excl GST) * Extracted directly from Base Costs (EEM Tables A5.7 to A5.6, July 2008) VoC values in WTSM are input for Cars Employers Business (fuel and non-fuel), Cars Other (fuel only, including 12.5% GST) and Trucks (fuel and non-fuel). The above values were therefore aggregated using the following vehicle proportions from the 2001 Wellington HTS: Cars Employers Business: 93.2% cars, 6.8% LCV; Cars Other: 93.2% cars, 6.8% LCV; and Trucks: 39% MCV, 26% HCVI, 35% HCVII. The resulting VoC parameters are shown in Table 3-7 below. 12
18 Table 3-7: Vehicle Operating Costs (2008) Class (c/km) Car-EB fuel Car-EB non-fuel Car - EB Total Car - Other (inc GST) Trucks - fuel Trucks -non-fuel Trucks - total Total VoC Adjustment to 2011 WTSM fuel costs were calculated in two steps: First, the 2008 VoCs were adjusted to 2011 using: Nominal fuel price index from Statistics NZ to adjust fuel component of VoC (factor of 1.28); and CPI to adjust non-fuel costs (factor of 1.09). Second, the 2011 nominal costs were then adjusted to 2001 levels using Statistics New Zealand s CPI (factor of 0.76). The final 2011 VoC inputs to WTSM are shown in Table 3-8 below, along with the 2006 VoC for comparison. Class Table 3-8: Vehicle Operating Costs Nominal values used in WTSM 2006 (c/km) Estimated Nominal 2011 (c/km) CPI used to adjust VoC to 2001 (c/km) Car-EB fuel Car-EB non-fuel Car - EB Total Car - Other (inc GST) Trucks - fuel Trucks -non-fuel Trucks - total VoC & VoT Assignment Weightings VoC is incorporated into the WTSM assignment through extra attribute. The assignment also required a weighting to be applied and 2006 values were carried forward and used in the 2011 update: 6.3 weighting on fixed costs for light vehicles; and 13
19 2.7 weighting on fixed costs for heavy commercial vehicles. These weightings are only applied in the final assignments. Assignments conducted during looping of the trip distribution and mode split models used single class highway assignment. These assignments used: Vehicle operating costs of 7.5 cents per km; and A weighting of 6.3 for all vehicles. Again, the above parameters were used in 2006 (and 2001) and carried forward in the 2011 update Vehicle Operating Cost Forecast The approach to forecast VoC was split in to two elements non-fuel related, and fuel related VoC. Forecast non-fuel related VoC was assumed to increase at the CPI and given this element was represented in the model in 2001 prices, the values used in the final forecasts remained at 2011 levels. Forecast fuel related VoC was another matter and required more detailed investigation. The analysis was broken down again into two main avenues of investigation: Fuel price forecasts; and Vehicle efficiency forecasts Fuel Price Forecasts With regards to fuel, the starting point was an assessment of the forecasts used in the Auckland model. Auckland Council were approached and supplied fuel forecasts made in 2008 / 2009 through a McCormick Rankin Cagney report. These forecasts were compared against the Ministry of Economic Development (MED) forecasts made by their Energy Modelling team and were found to be significantly different to all forecast scenarios supplied by MED. Figure 3-1 shows some of the forecast scenarios made available by the MED while Figure 3-2 compares the Auckland forecast against the MED high oil forecast scenario. 14
20 c/l TN15: Input Parameters Retail Petrol Price (c/l, including Carbon, Real 2010) Projection Oil Price High Reference Emissions Price Low Exchange Rate High Oil Price Low Figure 3-1: Fuel Cost Predictions (Sourced from Ministry of Economic Development) Figure 3-2: Comparison of ARC and MED Forecasts (High oil price scenario) The Auckland forecasts appeared to track very closely to MED high oil forecasts between 2021 and 2041 but were relatively flat between 2011 and Ultimately it was decided that while the Auckland information was very useful for context and explaining influencing factors on oil prices, it was somewhat out of date when compared with the MED forecasts. Also being considered was the fact that: NZTA are looking for a set of fuel forecasts that can be applied consistently across all of NZ; Commissioning a separate fuel price forecasting model for Wellington is not considered a practical move particular given that MED already have one; and 15
21 The MED forecasts provide both NZTA, and regional advisors a wider range of fuel forecast scenarios to be considered. It was therefore concluded that the MED forecasts would be used - this resulted in the need to select a fuel price forecast scenario. The MED reference case scenario was selected first but the results presented for peer review caused concern as it generated an increase in fuel related VoC that was less than PT fares and the technical steering committee did not consider this to be intuitively correct. While a good part of the reason for this effect was explained by the forecast vehicle efficiency changes (described below) there was serious concern that the results would not be believable. Ultimately the high oil price scenario produced by MED was selected to generate baseline forecasts that were more intuitively correct. However, there are several other MED scenarios available so should the decision be made to revisit these assumptions flexibility has been added to the model to make this process easier and more transparent (documented in TN21). The MED fuel forecasts stopped at 2031 so it was necessary to develop an approach to detail fuel prices between 2031 and To address the issue the average percentage increase in real fuel prices between 1990 and 2011 (1.3%) was calculated and applied to the fuel price increase between 2031 and Vehicle Efficiency Forecasts With regards to vehicle efficiency adjustments advice was received to use the Ministry of Transport (MoT) Fleet Emissions Model which was obtained via the Auckland Council. Figure 3-3 illustrates those forecasts and shows that the average litres of fuel consumed per 100 kilometres falls from approximately 10 litres/100km in 2000 to approximately 6.5 litres/100km by Concern was raised over the fact that the forecast assumes an ever increasing rate of vehicle efficiency improvements and that this seemed improbable. For the baseline forecasts it was therefore decided to: Adopt Auckland Regional Council s (ARC now Auckland Council ) estimates between 2011 and 2031; and Maintain 2031 forecast to This decision was taken in consultation with the Peer Reviewer who recommended that the part of the MoT Fleet Emissions Model dealing with be investigated more thoroughly. 16
22 liters per 100km TN15: Input Parameters Figure 3-3: Projected Vehicle Efficiency As mentioned above, this caused a level of VoC increase that appeared counter intuitive which resulted in the high oil price scenario being selected for the baseline forecasts. As with the fuel price forecasts, should the decision be made to revisit these assumptions, flexibility has been added to the model to make this process easier and more transparent (documented in TN21). Table 3-9 summarises the values of time selected for the baseline forecasts. It shows that fuel related VoC is forecast to increase by 29% between 2011 and 2021 before easing to increases of 35% and 54% by 2031 and 2041, respectively. Table 3-9: Forecast VoC (Real values in 2001 prices) Class Car-EB fuel Car-EB non-fuel Car - EB Total Car - Other (inc GST) Trucks - fuel Trucks -non-fuel Trucks - total Values of Time Adjustment Factors (Index 1=2011) It is important to reiterate that there are two main factors that go into the final adjustment factors and they act against each other - fuel price forecasts drive VoC up while vehicle efficiency forecasts drive fuel VoC down. This relationship has been illustrated in Figure 3-4 and shows, were it not for the inflationary vehicle efficiency adjustment, that fuel VoC would increase by a factor of 3.35 by
23 Index 1=2011) TN15: Input Parameters Impact of inflation adjustment Impact of Vehicle Efficiency Adjustment Nominal Fuel VoC (excluding Veh efficiency Real Fuel Price Increase Final Fuel VoC after Veh effieciency adjustments) Figure 3-4: Fuel VoC Adjustment (Impact of inflation and vehicle efficiency) 18

24 4 Car Parking Costs 4.1 Summary of the 2006 Update Approach Parking costs are incorporated in WTSM by trip purpose (work and non-work) for two Wellington CBD areas, lower and upper. The actual costs applied take into account the proportion of trips that do pay, which was derived from the 2001 HTS i.e. the final costs calculated are a weighted average of those that do pay and those that don t pay. Figure 4-1 below illustrates the locations and zone number for both the lower and upper parking sectors in WTSM. Key WTSM Zone CBD Upper CBD Lower Figure 4-1: Wellington CBD Parking Zones Parking costs for 2006 were increased from 2001 levels using information available from Wellington City Council (WCC) and an assumed 20% increase in the proportion of cars that do pay for parking. WCC provided information on the costs for three metered on-street areas and for the designated commuter area. In 2001 WCC operated all parking buildings in the CBD. These were sold around 2004 and are now operated privately. Hence it was not possible to obtain information on historical increases, so: A 25% increase was assumed for commuter parking from 2001 to 2006; and 19
25 A 50% increase was assumed for other parking. 4.2 Car Parking Cost Forecast Given the uncertainty surrounding forecast parking charges, particularly in light of the fact that a large part of the supply in Wellington is privately priced and controlled, there was some debate about the issue. Two main approaches were considered: Advice from the industry advisors (see Section 1.2) was to hold the parking costs constant and in line with the levels assumed for 2011 and to report on the parking demand. However, the option was later discarded as unrealistic. All else being equal, Wellington CBD is forecast to experience the largest increase in employment and without any planned (or known) increase in parking supply it is likely real prices will increase. Adjust parking charges with respect to GDP per capita with an elasticity of 1.2 for commuter travel and 1.0 for non-commuter travel. This approach was chosen because the purpose of using GDP per capita was that it would reflect the fact that peoples incomes were increasing and the more a person earned the more money they were prepared to devote to parking charges. Table 4-1 below shows the factors used for forecasting in the 2011 WTSM model. It confirms the approach used in Auckland. Table 4-1: Car Parking Factors Inflation Adjusted to 2001 Final Model Input factors Area HBW Lower Wellington HBW Upper Wellington EB Lower Wellington EB Upper Wellington Other Lower Wellington Other Upper Wellington
26 5 Public Transport Fares in Generalised Costs 5.1 Introduction PT generalised cost calculations in WTSM use a fare matrix to represent the monetary cost of travelling between O-Ds in the regions. In the 2006 WTSM update PT fares were adjusted from the 2001 model by assuming an average 10% increase in rail fares, but no increase in bus fares. Given that all PT modes are aggregated together in WTSM, the increase in fares was implemented at a Terrirotial Authority (TA) level, by applying this 10% increase only for TA to TA movements which have a high rail mode share. For the 2011 update, it was decided not to use the 2001 PT fare matrix with further adjustment, but to produce a new matrix replicating more accurately the current Metlink fare region 2 system for both bus and rail. The proposed methodology would provide a more appropriate tool as: Fare regions have changed since 2001; and Bus routes and fares are expected to change again with the Wellington City bus review. Having a more dynamic approach would enable the fare matrices to be recalculated automatically for each major permutation of the transit line and fare policies e.g. the new approach makes it easier to test integrated fares (where users pay one boarding fare for the total number of fare regions travelled). The adopted approach is as follows: 1. Implement Metlink fare regions in WTSM This was done both by allocating the Metlink fare region number for all 225 zones in the model, and by creating a link attribute to identify all roads and rail links crossing a fare region boundary. The resulting network containing the fare region information as illustrated in the Figure Metlink uses the fare zone description. Fare regions have been used in this TN to avoid confusion with model centroid zones. 21
, producing, for each time")
27 Figure 5-1: Fare Regions and Boundaries 2. Calculate the number of fare region boundary crossings for each Origin-Destination pair A unit matrix was assigned on the transit lines (for both AM and Inter peak periods), producing, for each time period, two output matrices containing, respectively, the number of boardings and fare region boundary crossings between each origin/destination (O-D) pair. These were then rounded to an average value to counter the fact that passengers travelling from one zone to another might have a choice and use a number of PT services with different routeing and transfer characteristics. An exception was also implemented within Wellington (fare regions 1 to 3) to reproduce the current rule that fares within this area are limited to 3 regions only. This, however, only applies to single leg trips, and not to journeys which include boarding of more than one service. 3. Calculate full fare for each O-D The full fare (adult cash fare) was then calculated for both AM and Inter peak periods, based on the number of region boundary crossings and service boardings. Metlink effectively includes the fare regions where the service is boarded, therefore counting every boarding as being a fare region. As an example, a service that travels 22
28 across two fare boundaries will be counted as having travelled three regions, because it includes the initial boarding region. This applies to any additional boarding which will count as another zone, therefore equivalent to a transfer penalty. The resulting matrices containing the number of boardings, boundary crossings, and full fares were compared to the 2006 WTSM as well as checked against the Metlink Journey Planner service. This was carried out for wide ranging types of journeys including bus and rail trips, journeys with 2 or more transfers, within Wellington or between different TAs, etc. Table 5-1 below shows the results of this checking exercise for the AM Peak, comparing the number of boardings, zone crossing and full fares estimated by WTSM 2011 and the same results from Metlink Journey Planner (as well as the PT fares as modelled in WTSM 2006 for reference). Table 5-1: PT Fare Comparison, AM Peak Period Journey Planner WTSM11 WTSM06* Origin Destination No. Board. No. Zones Fare No. Board No. Zones Fare Fare Owhiro Bay Manners Mall Evans Bay Rail Station Parade Seatoun Karori Wilton Bush Maupuia Houghton Ngaio Bay Porirua Rail Station Petone Rail Station Karori Lyall Bay Eastbourne Kilbirnie Upper Hutt Newlands Road Masterton Newton Masterton Rail Station Pukerua Bay Lower Hutt Central Paraparaumu Rail Station Rail Station Airport Featherston Whitby Waikanae Wainuiomata Petone Willis Street *Fares output by WTSM 2006 are discounted fares to take into account both full and concessions fares. These were converted to full fare using an average discount value of 0.64 (sourced from the 2001 document TN14.2 Base Public Transport Network) and then growthed to 2011 by using an increase of 25%. These values are therefore given for comparison only. 23
29 As shown by the table above, the applied methodology returns results that are a good representation of journey characteristics estimated by the Metlink Journey Planner, with the numbers of boardings and boundary crossing being identical for every O-D pair. The modelled full fare is generally correct for trips with one boarding, but fluctuates slightly for multi-leg trips (although it is always within $1 of the real fare). This variation is caused by the fact that fare increments are not constant for each additional boundary crossed in the Metlink fare region system (varying between $0.5 and $1.5). The model however calculates the number of zones travelled, applies the corresponding fare, and then adds $2 per additional boarding (equivalent to an additional initial zone being travelled). It therefore doesn t pick up the various possible breakdowns of multi-leg trips. It is, however, estimated that this is a reasonable approximation given the possibilities offered by this methodology to analyse future changes in fare region structure and potential removal of / changes to transfer penalties. 4. Apply discount factor to full fare A discount factor was then applied to the full fare (adult cash fare) to take into account the various type of Metlink fares and the proportion of passengers paying each type, for both AM and Inter peak periods. The categories of fares considered were as follows: Bus Adult Child Cash; Period (30 day pass, etc); Purse (Snapper Card); and Gold Card. Cash; Period (30-day pass, etc); and Purse (Snapper Card). Train Adult Child Cash & off-peak cash; Period (monthly pass); and Purse (10-trip train ticket). Cash; Period (monthly pass, school term ticket); and Purse (10-trip train ticket). 24
30 ratio of the discounted fare to the full cash fare ratio of the discounted fare to the full cash fare TN15: Input Parameters Monthly passes were treated as 40-trip tickets and rail school term as 100-trip tickets. A weighted average fare was calculated, using the fare category above and patronage numbers from the Electronic Ticketing Machine (ETM) data and rail survey. This was carried out for both bus and rail and was calculated for every number of fare region crossings, to take into account the variations in fare structure depending on the journey length. Figure 5-2 below show the resulting discount factors to apply to the full fare AM Peak 0.90 Inter Peak Bus 0.20 Bus 0.10 Rail 0.10 Rail Number of Fare Sectors Travelled Number of Fare Sectors Travelled Figure 5-2: Fare Discount Final discount factors were calculated using the weighted average of bus and rail factors and were applied to the full fares calculated in the previous step to obtain the final discounted fare for each O-D. These fares do not include variations for services with a different fare structure such as the Airport Flyer and the Ferry. These will be incorporated at the assignment stage of the model Nominal Fare matrices are adjusted to 2001 levels using a factor of 0.76 derived from Statistics NZ CPI data. 5.2 Transfer Penalties Transfer / boarding penalties have been coded into the model using guidance from the 2006 WTSM User Manual which is summarised in Table
 Bus Rail Fare 10.0 10.0 10.0 Boarding 3.0 3.0 3.0 Penalty 10.0 8.0 5.0 Total 23.0 21.0 18.0 Fare 10.0 10.0 10.0 Boarding 3.0 3.0 3.0 Penalty 7.5 5.5 2.")
31 Standard Interchanges Purpose Built Interchanges High Quality / Planned Interchanges TN15: Input Parameters Table 5-2: Transit Penalties Coded into Attribute Mode Fare element (all represented in the model in Generalised Minutes) Bus Rail Fare Boarding Penalty Total Fare Boarding Penalty Total The following figures, Figure 5-3 to, illustrate the nodes where both the purpose built and high quality interchanges have been coded. Key High Quality = 15.5 Purpose built = 18.5 Figure 5-3: Regional Map Showing Boarding Penalties Applied at Rail Stations 26
32 Key High Quality = 15.5 Purpose built = 18.5 Figure 5-4: Local Map Showing Boarding Penalties Applied at Rail Stations 27
33 Key Purpose Built = 21 Figure 5-5: Regional Map Showing Boarding Penalties Applied at Bus Stations/Stops 28

34 Key Purpose Built = 21 Figure 5-6: Local Map Showing Boarding Penalties Applied at Bus Station/Stops 5.3 Public Transport Fares Forecast Two approaches to public transport forecasting were discussed and assessed during the confirmation of the baseline forecast PT fares: A policy based approach using GWRC PT fare policy of a nominal increase of 3% per annum (reducing to 1% per annum once forecast inflation was taken into account). This produced some counter inuitive forecasts in terms of balance between real PT fare increases and fuel related VoC (once vehicle efficiency savings had been taken into account) i.e. it was found that using this assumption resulted in a bigger real increase in PT fares than VoC between 2011 and This was not considered reasonable by the Peer Review Comittee as PT service systems are generally able to spread VoC over a greater number of users giving them a competitve cost advantage over private transport. While there is some uncertainty over the fare elasticity, the approach of using growth in GDP per capita is generally accepted. David Young s forecasting memo recommended that the Auckland approach be adopted. This is described below: PT fares in ART3 are increased with respect to GDP/capita growth (1.8% p.a.), with an elasticity of This relationship was arrived at following analysis of adult 1-stage cash fares in Auckland, fuel prices, and GDP/capita over the period Different elasticities were applied to best fit the fares with GDP/capita. Ian Wallis, in his review of this, noted that overall the average fares 29
35 paid have remained close to constant between 2000 and 2010, depending on which PT mode and which measure (passengers or passenger-km) are considered. He then recommended that an elasticity of 0.25 be used as the base case, which results in a fare increase of about 0.45% p.a., but that 0.5 should be used as a sensitivity test where required. It was decided to use the 0.25 eleasticity approach adopted in the Auckland model for the baseline forecasts until better information from Wellington became available. Table 5-3 below shows the resulting forecast adjustment factors for PT fares. The net result is a forecast increase of 15% (in real terms) by 2041 which compares to an increase of 54% in fuel related VoC. Table 5-3: PT Fare Forecast Adjustment Factors Real_GDP/labour_force Index PT Fare Adjustment factor (using 0.25 elasticity)
36 6 Travel Demand Management Parameters As described in David Young s memo WTSM Forecasting Inputs Note (Appendix D) the effects of workplace travel initiatives in WTSM has, to date, assumed to be 5% of HBW trips by car to the Wellington CBD are removed with 90% of these transferred to the same trip by PT and the remaining 10% not allocated, so assumed to either not-travel or to walk or cycle to a destination close to the home. There is now the facility in WTSM to vary these percentages, including setting them to zero. The model received by Opus had assumed some form of TDM effect by This function was subsequently switched off during the model update process as it interfered with the calibration. However, the function has been activated for 2021, 2031, Without new information on the TDM measures being collected (as such an exercise was excluded from the project scope), it was decided to maintain the following approach for future years: 3% of HBW trips originally allocated to car travel are partially reallocated to the PT matrices. The reason for the slight reduction assumed for baseline forecasting was: 90% of the reallocated demand was put to PT matrices; and 10% was assumed to be walking and cycling and so was removed from the assigned matrices. 31
37 7 Model Response to Parameters Adjustments The following section documents the tests undertaken to assess the impact of various changes to input parameters on percentage trip increases between 2011 and The tests were as follows: Test 1: PT fares increased by 10% by 2021; Test 2: PT fares increased by 10% and Vehicle Operating Costs increased by 29%; Test 3: PT fares increased by 10%, Vehicle Operating Costs increased by 29%; and Parking increased by 23% Test 4: PT fares increased by 10%, Vehicle Operating Costs increased by 29%, Parking increased by 23%, and Value of Time increased by 23%. Table 7-1 and Figure 7-1 illustrate the results of the tests. Table 7-1: Tests Showing Impacts of Different Combinations of Inputs on Travel Demand Test no. PT Fare VoC Parking Value of Time Increase in TOTAL Trips Increase in CAR Trips Increase in PT Trips Base 8.6% 8.8% 7.0% 1 110% 8.5% 9.1% 4.7% 2 110% 129% 7.6% 6.7% 13.6% 3 110% 129% 123% 7.7% 5.9% 19.1% 4 110% 129% 123% 123% 8.5% 8.0% 11.2% Increasing PT fares by 10% between 2011 and 2021 causes the PT demand-increase to drop from 7% to 4.7%. However, this impact is mitigated when combined with a corresponding increase of 29% in VoC which allows PT demand-increase to rise to 13.6% instead of 7%. When CBD parking charges are increased by 23% PT demand increases by the highest amount out of the tests considered 19.1%. However, this increase is then dampened once the 23% increase in VoT is included PT demand-increase decreases to 11.2%. 32
38 Figure 7-1: PT Trip Growth (Cumulative impact of parameters) 33
39 8 Conclusions Opus International Consultants Limited (Opus) and Arup Australia (Arup) were commissioned by Greater Wellington Regional Council (GWRC) to rebase the existing 2006 Wellington Transport Strategy Model (WTSM) to a new base year of Opus updated the WTSM while Arup developed a Wellington Public Transport Model (WPTM) based on figures from WTSM and detailed public transport surveys. The whole process of model updates and development is complex and involves several steps which have each been individually reported in a series of technical notes. This note has documented the development of the following parameters: Values of time. The approach taken in the 2011 update was to adjust all inputs to nominal values in 2011 before making an inflation adjustment to Real GDP per capita forecasts from NZ Government Treasury Department were used to adjust values of time, with an elasticity of 1 on work travel and 0.8 for non-work travel. This corresponds with advice in the UK s Department for Transport Webtag. Vehicle operating costs. Vehicle operating costs covered two main elements fuel related VoC and non-fuel related VoC. The two sets of data inputted from the model were guided by the EEM (2008 prices). Fuel related costs were affected by congestion, stoppage costs and change in speed costs whereas non-fuel costs related to road surface condition costs i.e. the rougher the road, the faster the tyres, suspension wears out. Fuel related costs were then adjusted to 2011 values using fuel price data from Statistics NZ while non-fuel prices were adjusted using CPI data from Statistics NZ. Both fuel and non-fuel costs were adjusted to 2001 levels using CPI. The forecasting approach was to use both Ministry of Economic Development (MED) fuel price forecasts and vehicle efficiency changes from the Ministry of Transport Fleet Emissions Model to forecast VoC for 2021, 2031, and Parking Costs. Parking charges were applied in WTSM but only in the CBD. The 2011 update of parking charges were complicated by the fact that the 2001 parking charges were not corroborated by data collection. Similar problems were encountered in the 2006 update resulting in an estimation of parking cost changes in the future. After collecting parking charge information from parking management companies in Wellington the conclusion was reached that the same adjustment applied in 2006 would be applied to 2011 (before being adjusted back to 2001 prices). While there was substantial debate around this approach amongst industry representative it was decided to accept David Young s recommendation which was to use the real GDP per capita forecasts from the NZ Treasury to forecast parking costs. PT Fares. There are two components to the PT fares in WTSM assignment based fares and matrix based fares (used in the trip distribution and mode split models). The update approach is summarised below: Assignment based PT fares are incorporated into penalty attribute. These are used in the calibration of routing so relate more to the perceived penalty of boarding buses and trains rather than actual PT fares i.e. these values are not passed back into the trip distribution and mode choice models. Matrix based PT fares are values used in the calculation of PT generalised costs so are used in the trip distribution and mode choice models. The 2011 update used PT assignment macros to count the number of fare-zone boundary crossings. These were updated using a PT assignment macro which: o Identified boarding and distance based components separately; and 34
40 o Counted the number fare-zone boundary crossings. Two approaches to forecasting PT fares were considered one was to follow a policy based increase of 1% a year (in real terms) while the other was to apply real GDP per capita forecasts with an elasticity of Travel Demand Management Parameters. The effects of workplace travel initiatives in WTSM is an assumed removal of 3% of HBW trips by car to the Wellington CBD with 90% of these trips transferred to the same trip by PT modes and the remaining 10% not allocated. 35
41 APPENDIX A Indexing of Economic Indicators Indexing of Economic Indicators (nominal prices) Quarter GDP per Capita Average Weekly Wage Consumer Price Index Fuel Price Adjustment of VoT from 2001 to 2011 Adustment of Non Fuel VoC from 2008 to 2011 Adustment of Fuel VoC from 2008 to 2012 Adjustment of VoT and VoC from 2011 to 2001 Mar Jun Sep Dec Mar Jun Sep Dec Mar Jun Sep Dec Mar Jun Sep Dec Mar Jun Sep Dec Mar Jun Sep Dec Mar Jun Sep Dec Mar Jun Sep Dec Mar Jun Sep Dec Mar Jun Sep Dec Mar Jun Sep
42 APPENDIX B Survey of Wellington CBD Parking Charges (2011) Survey of Wellington CBD Parking Charges (2011) Car Park Casual Fee (/1/2 hr) Early Bird Non Commute (2 hours) 139 The Terrace $ 2.00 $ $ Lambton Quay $ 5.00 $ $ Boulcott Street $ 5.00 $ $ Bolton Street $ 2.00 $ $ 8.00 Bond Street $ 3.00 $ $ Bute / Garrett Street $ 3.00 $ $ Chews Lane $ 4.00 $ $ Cuba Street $ 2.00 $ $ 8.00 Ebor Street $ 4.00 $ $ Frank Kitts Park $ 4.00 $ $ Ghuznee Street $ 2.00 $ $ 8.00 Gilmer Terrace $ 3.00 $ $ HP Tower / Intercontinental Hotel $ 5.00 $ $ HSBC Tower $ 3.00 $ $ James Cook Hotel $ 6.00 $ $ Kate Sheppard Place $ 2.00 $ $ 8.00 Knigges Avenue $ 2.00 $ 9.00 $ 8.00 Little Pipitea Street $ 2.00 $ $ 8.00 Lower Willis Street $ 4.00 $ $ Mowbray Street $ $ - Pipitea Marae $ 2.00 $ $ 8.00 Queens Wharf $ 6.00 $ $ Station Carpark $ 4.00 $ $ Taranaki Street $ 2.00 $ $ 8.00 Upper Willis Street $ 3.00 $ $ Victoria Street $ 2.00 $ 9.00 $ 8.00 Westpac Stadium $ 9.00 $ - Average $ $ Source: 37
43 APPENDIX C Initial Approach to Parking Charge Update The 2011 update suffered from a similar lack of data to the 2006 update over historical increases in fares. To compensate the following sources were used: Metered on street parking: Commuter: early bird prices from the table in Appendix B; and Other: non-commute (e.g. two hours) taken from the table in Appendix B. The table below shows both: The raw parking costs extracted from the modelling reports for 2001 and 2006 and from the WCC and Wilsons Parking websites for 2011; and Final parking charges once adjusted for the proportion actually paying parking charges. As discussed in the main body of the report the approach was subsequently abandoned due to the magnitude of some of the parking charge increases. For example, using the approach below HBW Lower Wellington charges were estimated to have increased 295% between 2001 and Without raw data collected in 2001 it was impossible to corroborate this sort of change. 38
44 Final Costs entered in the model % trips paying Cost % Increase in trips paying % trips paying Cost % Increase in trips paying* % trips paying Cost Final Cost (post CPI Adjustment) Raw costs TN15: Input Parameters Parking Costs Initial Attempt to Estimate CBD Parking Charges (Approach abandoned but reported for completeness) 2001 WTSM 2006 WTSM 2011 Nominal Metered on-street ($/hr $1.00 $1.50 $ 1.50 $2.00 $3.00 $ 3.00 $3.00 $4.00 $ 4.00 HBW Cost $2.50 $3.50 $ 3.50 Commuter ($/day) $4.00 $5.00 $ Other (assumed) ($/day) $4.00 $6.00 $ Other Cost $4.00 $5.50 $ WTSM HBW Lower 43% $ % 51% $2.81 0% 51% $6.11 $5.02 Wellington HBW Upper 69% $ % 83% $4.54 0% 83% $9.88 $8.12 Wellington EB Lower Wellington 23% $ % 28% $0.98 0% 28% $0.90 $0.74 EB Upper Wellington 42% $ % 50% $1.75 0% 50% $1.61 $1.32 Other Lower 19% $ % 23% $0.81 0% 23% $0.74 $0.61 Wellington Other Upper Wellington 38% $ % 46% $1.61 0% 46% $1.48 $1.22 Source: K:\Z_Drive\WTSM_2011\Economic Parameters\[Updated 2011 VoT, VoC & Parking.xlsx]Parking Charges * 2011 Update assumed no increased in the proportion of trips paying for parking 39
45 APPENDIX D David Young s WTSM Forecasting Inputs Note David Young s WTSM Forecasting Inputs Document WTSM Forecasting Inputs - DRAFT 1 Background The Wellington Transport Strategy Model (WTSM) is presently based in year 2006 and has been used in forecasting by Greater Wellington Regional Council (GWRC) as far as year This forecasting has been in relation to development of the Regional Land Transport Strategy (RLTS) and investigations into specific projects. WTSM is being updated to a base year of 2011 following which new base forecasts will be produced. Due to the timing of the updated model, the 2006-based WTSM is to be used in the initial stage of the PT Spine Study and New Zealand Transport Agency (NZTA) wish to make use of WTSM for the evaluation of the Wellington Roads of National Significance (RoNS). The updated 2011-based model will be used, in the first instance, in the latter stages of the PT Spine Study, along with the new Wellington Passenger Transport Model (WPTM). There has been recent debate about the inputs to WTSM in forecasting (e.g. NZTA Modelling Panel) and, given the upcoming uses of the 2006-based WTSM and then the 2011-based model, the need to develop inputs that fit with good modelling practice and are agreed by GWRC and stakeholders, notably NZTA. Similar debate has occurred in Auckland in respect of the Auckland Regional Transport (ART3) model over the past 2 years, culminating in a set of inputs that has been agreed by the model owners (Auckland Council) and stakeholders (Auckland Transport, NZTA, MoT, etc). A key aspect arising from this debate is that there should be consistency of approach to the economic inputs in forecasting; that is, either they are not increased from the base year values, or if they are, then all should be. This follows good international modelling practice, but is relatively new to New Zealand as generally these inputs have not changed in forecasting. 2 This Note This note is intended to assist with the process of reaching agreed inputs. As such it: lists the WTSM forecasting inputs, describes which inputs are currently varied from the base year (2006), describes the situation with these inputs for the Auckland model, ART3, 40
46 sets out, for each input, the effect of changing the input, the current situation with both WTSM and ART3, and makes a recommendation on what should occur with WTSM, and provides a tabular summary at the end. 3 Forecasting Inputs The key forecasting inputs to WTSM are as follows: Land use Zonal persons, households, employment and educational rolls by category Transport improvements Roading infrastructure PT infrastructure PT services (routeings and frequencies) Economic and policy inputs GDP/capita growth Values of time Private vehicle operating costs Car parking costs PT fares TDM non-pricing effects Assumed effects of travel plan initiatives The future land use and transport improvements are usually determined through their own processes, and that is the case for the up-coming forecasting. As such these aspects are not discussed further here. This includes the effects of integrated ticketing and fares real time information, which are incorporated into WTSM forecasts when specified. 4 Current WTSM Forecasting Inputs In the WTSM forecasting undertaken in recent years some of the inputs listed above, excluding land use and transport improvements, have been varied from the base year, 2006: Vehicle operating costs have been increased to account for both increases in real fuel prices and improvements in vehicle efficiency. The 2006 PT fares have been increased by 20% in all forecast years due to this actual increase occurring shortly after the 2006 update. 41
47 The effects of workplace travel initiatives have been included in the forecasts. Other inputs have not been varied, but have remained at 2006 levels. 5 Forecasting Inputs in Auckland The case in Auckland with regard to forecasting inputs for ART3 is relevant to WTSM given the debate and development of these inputs over the past several years. As with WTSM, vehicle operating costs in ART3 were increased in the forecasts undertaken around 2009 in response to the increases in pump petrol prices and the high-profile concerns about peak oil. The future fuel prices taken from an ARC-commissioned report by McCormick Rankin Cagney (MRC) which developed estimates of future fuel prices (they were undertaking a research project on a similar topic at the time). These estimates were included in the forecasting along with assumed TDM non-pricing effects which transferred significant numbers of trips by car to PT and active modes. The result was much lower growth in car trips than previous forecasts and much higher growth in PT and active mode trips. The use of these lower forecasts in car trips in evaluating a specific project led to a review of the inputs, and incorporating increases in other economic and policy inputs and more conservative assumptions on the TDM effects. Further reviews and revisions of these inputs occurred in the context of other individual studies. In undertaking the modelling for the Auckland Plan, Auckland Council then sought to achieve a set of inputs agreed by stakeholders, including Auckland Transport, NZTA, MoT. This occurred, including a review and input by Ian Wallis. The agreed economic and policy inputs are of particular relevance to WTSM. 6 Economic and Policy Inputs 6.1 Introduction The following sections describe each economic and policy input as implemented in WTSM currently and the ART3 model, and then makes a recommendation. 6.2 GDP/Capita Growth The growth in GDP per capita impacts on future car ownership levels and the growth in HCV trips. The future values of other economic and policy inputs can be dependent on the growth in GDP/capita as well (see below). 42
48 WTSM The current value used in WTSM is 1.8% p.a. This is based on historic data and was established during the original 2001 WTSM calibration. The historic data was updated for the 2006 update which did not alter the value. ART3 In ART3 the same growth, 1.8% p.a., is used. Recommendation Hence it is recommended that the GDP/capita growth of 1.8% p.a. be retained and that this is reviewed as part of the 2011 update. 6.3 Values of Time The values of time in WTSM vary by purpose and are the same for car and PT. They are used in the generalised costs to convert between monetary values ($) and time (minutes); generalised costs in WTSM are in minutes. If the values of time increase, and all other parameters remain the same, the non-time components of generalised costs (VOC, parking costs, fares) will reduce, therefore reducing the overall generalised costs. This would occur for both car and PT costs, so the net effects on distribution and mode shares are not clearcut. WTSM The values of time in WTSM vary by purpose (HBW, HBEd, EB, Other) and car availability (expressed as captive, competition, or choice trips). The 2001 values were updated to 2006 values as part of the 2006 update. These values have not been altered in forecasting. ART3 With ART3 the values of time are increased from those in the base year (2006) with respect to GDP/capita growth (1.8% p.a.), with an elasticity of 1 on work travel and 0.8 for nonwork travel. This corresponds based on advice in the UK s Department for Transport Webtag. Recommendation It is recommended that the values of time be increased in the same manner as with ART3. Using the above GDP/capita growth and elasticities, Figure 1 shows how the work and nonwork values of time increase with respect to 2006 values. They increase by 87% and 65% respectively by
49 Values of Time (indexed to 2006) TN15: Input Parameters Figure 1 - Values of Time (Indexed to 2006 Values) 2.00 Values of Time Non-Work 1.40 Work Private Vehicle Operating Costs Private vehicle operating costs (VOC) are a component of the car generalised costs. Increasing VOC over time will increase car costs relative to PT (all other things remaining constant), and hence reduce the car mode share and also tend to shorten average trip length. VOC is made up of fuel costs, fuel consumption rates per kilometre (vehicle efficiency), and non-fuel related costs (maintenance, licencing, etc). Private travel purposes include the fuelrelated components including GST in the generalised costs, but not maintenance etc as these are not taken into account in trip-making decisions. Work-related travel (employers business) includes all three components, but does not include GST. Non-fuel-related costs do not change in forecasting based on the assumption that these costs do not increase in real terms over time. The fuel costs and vehicle efficiency are considered below. WTSM VOC have been increased in WTSM forecasting though there has been some uncertainty over the increases, their basis and whether they were just fuel increases or included vehicle efficiency improvement as well. The correct situation is that GWRC have increased the 2006 VOC (fuel and vehicle efficiency combined) by 20% to year 2016 and to year 2026, that is, VOC remains constant from 2016 onwards. 44
50 The basis for the increases is the estimation of future nominal fuel prices and of inflation effects to determine real fuel price increases, and accounting for improvements in the efficiency of vehicle fuel use. The nominal fuel price increases are based on estimated nominal values of the barrel price of fuel and the estimated exchange rate of the NZ dollar with the US dollar. The basis of these is unclear though may have been derived from historical data on the price of Dubai crude oil and the US:NZ exchange rate. The inflation forecasts are based on Treasury forecasts for 2011/12, assuming that these continue at the same rate to The vehicle efficiency improvements to 2016 and 2026 are based on a version of the MoT s Vehicle Fleet Emissions Model that has now been superseded. The factors for fuel price increases in real terms (excluding vehicle efficiency improvements) over 2006 to 2016 and 2026 are and respectively. The corresponding factors for vehicle efficiency improvements are and When these two sets of factors are combined the factors for fuel-related VOC to are and to 2016 and 2026 respectively. That is, it is coincidence that the VOC increases to 2016 and 2026 are both 20%. ART3 In ART3 VOC are increased over time with fuel prices increasing in line with estimates arising from MRC s report for the ARC (refer to Section 4 above). For shorter horizon forecasts a variant to the MRC estimates was developed by Beca, which adjusts the MRC estimates to align with actual fuel prices in 2010 and then linearly interpolates between this and the 2026 MRC estimate. Vehicle efficiency improvements are based on the latest MoT projections of fleet composition, fuel types, and efficiency improvements. Figure 2 shows how fuel prices, both the MRC and adjusted estimates, and vehicle efficiency change over time and Figure 3 shows the fuel-related VOC (which is the product of the first two). The MRC estimates have fuel prices increasing rapidly to 2011 and then declining slightly to 2021 before increasing again. The adjusted estimates show a steady linear increase to 2026 from which the two coincide. By 2041 the real price of fuel is 2.4 times that in Vehicle efficiency improves at a steady rate to 30% improvement by 2041 over 2006 levels. The combination of these, the fuel-related VOC, increase by 65% by 2041, with clear differences in the early years between that using the MRC fuel price estimates and that using the adjusted estimates. 45
51 Vehicle Operating Costs (indexed to 2006) Fuel Price and Vehicle Efficiency (indexed to 2006) TN15: Input Parameters Figure 2 Fuel Prices and Vehicle Efficiency (Indexed to 2006 Values) Fuel Price and Vehicle Efficiency Fuel Price (MRC) Fuel Price (adjusted) Vehicle Efficiency Figure 3 Vehicle Operating Costs (fuel-related) (Indexed to 2006 Values) Vehicle Operating Costs VOC (fuel-related, MRC) VOC (fuel-related, adj) WTSM vs ART3 The future fuel, vehicle efficiency and VOC values current being used in WTSM and ART3 in years 2016 and 2026 are given in Table 1. 46
52 WTSM and ART3 have the same fuel increase factor in 2016, and in 2026 WTSM s is slightly lower than ART3 s. WTSM assumes greater improvements in vehicle efficiency than ART3. Combining these two, WTSM has lower fuel-related VOC factors in both years, plus ART3 s factors increase over time; that is the fuel price effect is greater than the vehicle efficiency effect between 2016 and Table 1 - WTSM and ART3 Fuel, Vehicle Efficiency and Fuel-Related VOC Factors WTSM ART3 WTSM ART3 Fuel price increase Vehicle efficiency improvement Fuel-related VOC factor Recommendation The basis for the WTSM fuel price increase is not totally clear and the estimates of vehicle efficiency are now out of date, whereas the basis for the ART3 future values is clear and have been reviewed and agreed within the Auckland region. The WTSM values are for 2016 and 2026 only, whereas ART3 values are available for the future years 2016 to 2051 at 5- year intervals. It is recommended that the VOC used in WTSM forecasts align with those used in ART3 from year 2026 onwards, but that, for the shorter-term forecasting the 2011 estimate is compared against the actual price and the estimates to 2026 adjusted accordingly. 6.5 Car Parking Costs Car parking costs are a component of the car generalised costs that are applied to specified zones by trip purpose. Parking costs do not affect routeing but do impact on car demand; higher parking costs will result in lower car demand to those zones. WTSM Car parking costs in WTSM are applied by trip purpose (HBW, EB, Other) to two Wellington CBD areas, upper and lower. The actual costs take into account the proportion of trips that do pay, which was originally derived from the 2001 HTS. The 2001 costs were increased for the 2006 update based on information available and the proportion paying was assumed to increase by 20%. These costs are currently used in forecasting, though the current system for creating scenarios, Netcreator, does have the facility to apply a generic percentage increase to the CBD zones. Parking costs are not applied to other locations such as sub-regional CBDs. 47
53 Parking Costs (indexed to 2006) TN15: Input Parameters ART3 In ART3 parking costs are escalated with respect to GDP/capita growth (1.8% p.a.), with an elasticity of 1.2 for commuter travel and 1.0 for non-commuter travel. These elasticities gave similar increases to those being used in the ARC s modelling in The location of parking costs also changes over time and is specific to the land use scenario being modelled. Commuter parking costs in ART3 increase by 54% from 2006 to 2026, and 112% to 2041 as shown in Figure 4. Figure 4 Parking Costs (Indexed to 2006 Values) 2.40 Parking Costs Parking Costs (commuter) Parking Costs (other) Recommendation If it is considered that parking costs in the Wellington CBD will increase in real terms over time in line with regional and local policies, it is recommended that parking costs be increased in forecasting in the same manner as with ART3. Different elasticities could be used to align the increases with regional parking policies. 6.6 PT Fares PT fares are one component of the PT generalised costs. Increasing the fares will increase the costs, which all other costs remaining constant will reduce the PT mode share. It should be noted that for an average PT trip of 30 minutes in-vehicle-time a fare of, say, $3 would make up approximately 20% of the generalised cost when access, egress and wait time are considered. 48
54 PT Fares (indexed to 2006) TN15: Input Parameters WTSM In WTSM forecasts PT fares are increased from the 2006 levels by 20% to account for the fare increase that occurred shortly after the update. This level is currently maintained in all forecast years. ART3 PT fares in ART3 are increased with respect to GDP/capita growth (1.8% p.a.), with an elasticity of This relationship was arrived at following analysis of adult 1-stage cash fares in Auckland, fuel prices, and GDP/capita over the period Different elasticities were applied to best fit the fares with GDP/capita. Ian Wallis, in his review of this, noted that overall the average fares paid have remained close to constant between 2000 and 2010, depending on which PT mode and which measure (passengers or passenger-km) are considered. He then recommended that an elasticity of 0.25 be used as the base case, which results in a fare increase of about 0.45% p.a., but that 0.5 should be used as a sensitivity test where required. The 0.25 elasticity was adopted in Auckland and the future values, indexed to 2006, are given in Figure 5. Figure 5 PT Fares, ART3 (Indexed to 2006 Values) 1.25 PT Fares, ART Recommendation While there is some uncertainty over the fare elasticity, the approach of using growth in GDP/capita is generally accepted. Hence it is proposed that this approach be used for WTSM following the 2011 update, and that data is collated and analysis undertaken to 49
55 determine the most appropriate elasticity for Wellington. For the upcoming modelling using the 2006-based model, it is suggested that the current PT are used. 7 TDM Non-Pricing Inputs The effects of TDM non-pricing initiatives are inserted into WTSM and ART3 having the effect of reducing car trips and increasing trips by PT and/or active modes. WTSM The effects of workplace travel initiatives in WTSM has, to date, assumed to be 5% of HBW trips by car to the Wellington CBD are removed with 90% of these transferred to the same trip by PT and the remaining 10% not allocated, so assumed to either not-travel or to walk or cycle to a destination close to the home. There is now the facility in WTSM to vary these percentages, including setting them to zero. ART3 In Auckland the TDM non-pricing effects are considered in more detail, with increased working from home, and workplace, education and community travel initiatives. The assumed effects of these have been debated at length, the key difficulty being the lack of evidence of the effects. A set of inputs has been agreed for use in all forecasting generally, which are: Working from home increases from 6.9% in 2006 to 12.9% in 2041, with a straight line interpolation for years in-between; Workplace travel initiatives resulting in an 8% reduction in car trips to Auckland CBD, 7.5% reduction to specified intensified town centres, and reductions to all other urban areas which increase over time (1.5% in 2026) and corresponding increases in PT and walk/cycle trips; Education travel initiatives resulting in reductions in car trips to schools and tertiary institutions which increase over time (9% in 2026) and corresponding increases in PT and walk/cycle trips; Community travel initiatives resulting reductions in short distance car trips which increase over time (1.5% in 2026) and corresponding increases in walk/cycle trips. Recommendation While Auckland has different and more extensive assumptions on the effects of TDM initiatives, they are implemented in a similar manner in both models. The processes used in WTSM should be retained and the percentage reduction in commuting trips by car to the 50
56 CBD should be based on the latest information on the effectiveness of the TDM programmes. 8 Summary Table 2 summarises the forecasting inputs for WTSM and ART3 currently, and those proposed for WTSM. Table 2 Summary of Current WTSM and ART3 Inputs and Proposed WTSM Inputs Input Current WTSM ART3 Proposed WTSM GDP/capita growth 1.8% p.a. based on historic data 1.8% p.a. based on historic data retain current growth Values of time not changed increased using GDP/capita increase using GDP/capita the same as ART3 Fuel price Vehicle efficiency increased, but basis unclear increased based on MRC estimates improved, but based on older data improved based on latest MoT data use the MRC estimates, but assess 2011 value against actual fuel price and adjust shorter term forecasts accordingly use the latest MoT data Parking costs not changed increased based on GDP/capita growth increase using GDP/capita with elasticities to fit with policy PT fares non- TDM pricing 2006 fares increased by 20% to account for actual increase shortly after; not increased further % reduction in commuting trips by car to CBD increased based on GDP/capita growth % reductions in car trips for workplace, education, and community travel initiatives retain current fares at this time, but analyse historic data to determine changes retain current process, % reduction to fit with latest information David Young 7 October


57 APPENDIX E Economic Evaluation Manual Tables Economic Evaluation Manual - Tables 52
58 53

59 54
60 55
61 56
Department for Transport. Transport Analysis Guidance (TAG) Unit Values of Time and Operating Costs
 Unit Values of Time and Operating Costs") Department for Transport Transport Analysis Guidance (TAG) Unit 3.5.6 Values of Time and Operating Costs September 2006 1 Contents 1. Values of Time and Operating Costs 3 1.1 Introduction 3 1.2 Values
Department for Transport Transport Analysis Guidance (TAG) Unit 3.5.6 Values of Time and Operating Costs September 2006 1 Contents 1. Values of Time and Operating Costs 3 1.1 Introduction 3 1.2 Values
Wellington Transport Strategy Model. TN19.1 Time Period Factors Report Final
 Wellington Transport Strategy Model TN19.1 Time Period Factors Report Final Wellington Transport Strategy Model Time Period Factors Report Final July 2003 prepared for Greater Wellington The Regional Council
TRAVEL DEMAND FORECASTS
 Jiangxi Ji an Sustainable Urban Transport Project (RRP PRC 45022) TRAVEL DEMAND FORECASTS A. Introduction 1. The purpose of the travel demand forecasts is to assess the impact of the project components
New Zealand Transport Outlook. VKT/Vehicle Numbers Model. November 2017
 New Zealand Transport Outlook VKT/Vehicle Numbers Model November 2017 Short name VKT/Vehicle Numbers Model Purpose of the model The VKT/Vehicle Numbers Model projects New Zealand s vehicle-kilometres travelled
Project Appraisal Guidelines for National Roads Unit National Parameters Values Sheet
 Project Appraisal Guidelines for National Roads Unit 6.11 - National Parameters Values Sheet TRANSPORT INFRASTRUCTURE IRELAND (TII) PUBLICATIONS About TII Transport Infrastructure Ireland (TII) is responsible
Fueling Savings: Higher Fuel Economy Standards Result In Big Savings for Consumers
 Fueling Savings: Higher Fuel Economy Standards Result In Big Savings for Consumers Prepared for Consumers Union September 7, 2016 AUTHORS Tyler Comings Avi Allison Frank Ackerman, PhD 485 Massachusetts
Pricing Strategies for Public Transport. Neil Douglas Douglas Economics
 Pricing Strategies for Public Transport Neil Douglas Douglas Economics Start Oct 2011 Scope Feb 2012 Review June 2012 Mkt Res Plan Sept 2012 Pilot Results Nov 2012 Main Surveys Dec 2012 May 2013 Final
Future Funding The sustainability of current transport revenue tools model and report November 2014
 Future Funding The sustainability of current transport revenue tools model and report November 214 Ensuring our transport system helps New Zealand thrive Future Funding: The sustainability of current transport
Submission to Greater Cambridge City Deal
 What Transport for Cambridge? 2 1 Submission to Greater Cambridge City Deal By Professor Marcial Echenique OBE ScD RIBA RTPI and Jonathan Barker Introduction Cambridge Futures was founded in 1997 as a
Aging of the light vehicle fleet May 2011
 Aging of the light vehicle fleet May 211 1 The Scope At an average age of 12.7 years in 21, New Zealand has one of the oldest light vehicle fleets in the developed world. This report looks at some of the
Travel Demand Modeling at NCTCOG
 Travel Demand Modeling at NCTCOG Arash Mirzaei North Central Texas Council Of Governments for Southern Methodist University The ASCE Student Chapter October 24, 2005 Contents NCTCOG DFW Regional Model
Three ULTra Case Studies examples of the performance of the system in three different environments
 Three ULTra Case Studies examples of the performance of the system in three different environments airport application: London Heathrow : linking business and staff car parks through the access tunnel
Appendix B: Travel Demand Forecasts July 2017
 Appendix B: Travel Demand Forecasts July 2017 Table of Contents 1 Introduction... 2 2 Model Review and Updates... 2 2.1 Overview of Smart Moves Model ( City of London Model )... 2 2.1.1 Network and Zone
2016/17 ANNUAL MONITORING REPORT ON THE REGIONAL LAND TRANSPORT PLAN NOVEMBER 2017
 2016/17 ANNUAL MONITORING REPORT ON THE REGIONAL LAND TRANSPORT PLAN NOVEMBER 2017 2016/17 Annual Monitoring Report on the Regional Land Transport Plan For more information, contact Greater Wellington
HALTON REGION SUB-MODEL
 WORKING DRAFT GTA P.M. PEAK MODEL Version 2.0 And HALTON REGION SUB-MODEL Documentation & Users' Guide Prepared by Peter Dalton July 2001 Contents 1.0 P.M. Peak Period Model for the GTA... 4 Table 1 -
Energy Saving Potential Study on Thailand s Road Sector:
 A n n e x 1 Energy Saving Potential Study on Thailand s Road Sector: Applying Thailand s Transport Model SUPIT PADPREM, DIRECTOR OF ENERGY ANALYSIS AND FORECAST GROUP, ENERGY POLICY AND PLANNING OFFICE
Travel Time Savings Memorandum
 04-05-2018 TABLE OF CONTENTS 1 Background 3 Methodology 3 Inputs and Calculation 3 Assumptions 4 Light Rail Transit (LRT) Travel Times 5 Auto Travel Times 5 Bus Travel Times 6 Findings 7 Generalized Cost
The Boston South Station HSIPR Expansion Project Cost-Benefit Analysis. High Speed Intercity Passenger Rail Technical Appendix
 The Boston South Station HSIPR Expansion Project Cost-Benefit Analysis High Speed Intercity Passenger Rail Technical Appendix Prepared by HDR August 5, 2010 The Boston South Station HSIPR Expansion Project
How to Create Exponential Decline in Car Use in Australian Cities. By Peter Newman, Jeff Kenworthy and Gary Glazebrook.
 How to Create Exponential Decline in Car Use in Australian Cities By Peter Newman, Jeff Kenworthy and Gary Glazebrook. Curtin University and University of Technology Sydney. Car dependent cities like those
The Value of Travel-Time: Estimates of the Hourly Value of Time for Vehicles in Oregon 2007
 The Value of Travel-Time: Estimates of the Hourly Value of Time for Vehicles in Oregon 2007 Oregon Department of Transportation Long Range Planning Unit June 2008 For questions contact: Denise Whitney
Vehicle Types and Weight Bands: Proposals for Consultation
 Road User Charges Bill 2010: Regulations Vehicle Types and Weight Bands: Proposals for Consultation Purpose of this document 1. This document outlines a proposed approach to definition of vehicle types
Application of EMME3 and Transportation Tomorrow Survey (TTS) for Estimation of Zonal Time Varying Population Density Distribution in
 for Estimation of Zonal Time Varying Population Density Distribution in") Application of EMME3 and Transportation Tomorrow Survey (TTS) for Estimation of Zonal Time Varying Population Density Distribution in the Greater Toronto Area Prepared by: Matthew Roorda, Associate Professor
Application of EMME3 and Transportation Tomorrow Survey (TTS) for Estimation of Zonal Time Varying Population Density Distribution in the Greater Toronto Area Prepared by: Matthew Roorda, Associate Professor
Interstate Freight in Australia,
 Interstate Freight in Australia, 1972 2005 Leo Soames, Afzal Hossain and David Gargett Bureau of Transport and Regional Economics, Department of Transport and Regional Services, Canberra, ACT, Australia
Traffic Micro-Simulation Assisted Tunnel Ventilation System Design
 Traffic Micro-Simulation Assisted Tunnel Ventilation System Design Blake Xu 1 1 Parsons Brinckerhoff Australia, Sydney 1 Introduction Road tunnels have recently been built in Sydney. One of key issues
Autonomous Vehicle Impacts on Traffic and Transport Planning
 Autonomous Vehicle Impacts on Traffic and Transport Planning AITPM Regional Seminar 11 May 2017 Discussion Paper AVs/CAVs Autonomous/Automated Vehicles (AVs) Connected and Automated Vehicles (CAVs) Increased
Appendix F Model Development Report
 Appendix F Model Development Report This page intentionally left blank. Westside Mobility Plan Model Development Report December 2015 WESTSIDE MOBILITY PLAN MODEL DEVELOPMENT REPORT December 2015 Originally
DEVELOPMENT OF RIDERSHIP FORECASTS FOR THE SAN BERNARDINO INFRASTRUCTURE IMPROVEMENT STUDY
 APPENDIX 1 DEVELOPMENT OF RIDERSHIP FORECASTS FOR THE SAN BERNARDINO INFRASTRUCTURE IMPROVEMENT STUDY INTRODUCTION: This Appendix presents a general description of the analysis method used in forecasting
Sustainable Urban Transport Index (SUTI)
") Sustainable Urban Transport Index (SUTI) City Comparisons & Way Forward PROF. H.M SHIVANAND SWAMY, CEPT UNIVERSITY DHAKA SEPTEMBER 12, 2018 Purpose Discussion of Results from 5 Cities Reflections on the
Sustainable Urban Transport Index (SUTI) City Comparisons & Way Forward PROF. H.M SHIVANAND SWAMY, CEPT UNIVERSITY DHAKA SEPTEMBER 12, 2018 Purpose Discussion of Results from 5 Cities Reflections on the
CSTM Improvements. AITPM Canberra 11 May 2017
 CSTM Improvements AITPM Canberra 11 May 2017 7 December 2016 1 Introduction Josh Everett SMEC Australia Worked on modelling in Canberra for 11 years Used TransCAD, then EMME, now back to TransCAD Presentation
TABLE OF CONTENTS. Table of contents. Page ABSTRACT ACKNOWLEDGEMENTS TABLE OF TABLES TABLE OF FIGURES
 Table of contents TABLE OF CONTENTS Page ABSTRACT ACKNOWLEDGEMENTS TABLE OF CONTENTS TABLE OF TABLES TABLE OF FIGURES INTRODUCTION I.1. Motivations I.2. Objectives I.3. Contents and structure I.4. Contributions
Modernising the Great Western railway
 Report by the Comptroller and Auditor General Department for Transport and Network Rail Modernising the Great Western railway HC 781 SESSION 2016-17 9 NOVEMBER 2016 4 Key facts Modernising the Great Western
Traffic Counts
 www.trafficcounts.co.nz www.trafficcounts.co.nz Quality Assurance Information Prepared for: Job Number: Prepared by: Reviewed by: Abley Limited 0000 Shane Ingley, Transportation Engineer Courtney Groundwater,
PROMOTING THE UPTAKE OF ELECTRIC AND OTHER LOW EMISSION VEHICLES
 Chair Cabinet Economic Growth and Infrastructure Committee Office of the Minister of Transport Office of the Minister of Energy and Resources PROMOTING THE UPTAKE OF ELECTRIC AND OTHER LOW EMISSION VEHICLES
Transportation Statistical Data Development Report BAY COUNTY 2035 LONG RANGE TRANSPORTATION PLAN
 Transportation Statistical Data Development Report BAY COUNTY 2035 LONG RANGE TRANSPORTATION PLAN Prepared for Bay County Transportation Planning Organization and The Florida Department of Transportation,
WLTP DHC subgroup. Draft methodology to develop WLTP drive cycle
 WLTP DHC subgroup Date 30/10/09 Title Working paper number Draft methodology to develop WLTP drive cycle WLTP-DHC-02-05 1.0. Introduction This paper sets out the methodology that will be used to generate
March - Wisbech Rail Study Stage 1 Final Report
 March - Wisbech Rail Study Stage 1 Final Report Cambridgeshire County Council 7 th December 2012 Notice This document and its contents have been prepared and are intended solely for Cambridgeshire County
! report Hutt Corridor Study Stage 2
 report Hutt Corridor Study Stage 2 report Hutt Corridor Study Stage 2 Prepared for Wellington Regional Council By Beca Carter Hollings & Ferner Ltd 8110573 L1:76412 Revision History Revision Nº Prepared
Mobility on Demand, Mobility as a Service the new transport paradigm. Richard Harris, Xerox
 Mobility on Demand, Mobility as a Service the new transport paradigm Richard Harris, Xerox Xerox Transport Services 37 billion 100 million transit fare transactions processed annually and more public transport
FENEBUS POSITION PAPER ON REDUCING CO2 EMISSIONS FROM ROAD VEHICLES
 FENEBUS POSITION PAPER ON REDUCING CO2 EMISSIONS FROM ROAD VEHICLES The Spanish Federation of Transport by Bus (Fenebús) is aware of the importance of the environmental issues in order to fully achieve
CITY OF VANCOUVER ADMINISTRATIVE REPORT
 Supports Item No. 1 T&T Committee Agenda May 13, 2008 CITY OF VANCOUVER ADMINISTRATIVE REPORT Report Date: April 29, 2008 Author: Don Klimchuk Phone No.: 604.873.7345 RTS No.: 07283 VanRIMS No.: 13-1400-10
WP3 Transport and Mobility Analysis. D.3.8. Transport Scenarios Results Report Cesena
 WP3 Transport and Mobility Analysis D.3.8. Transport Scenarios Results Report Cesena May 2015 314164 (ENER/FP7/314164) Project acronym: InSMART Project full title: Integrative Smart City Planning Coordination
1 Faculty advisor: Roland Geyer
 Reducing Greenhouse Gas Emissions with Hybrid-Electric Vehicles: An Environmental and Economic Analysis By: Kristina Estudillo, Jonathan Koehn, Catherine Levy, Tim Olsen, and Christopher Taylor 1 Introduction
Travel Forecasting Methodology
 Travel Forecasting Methodology Introduction This technical memorandum documents the travel demand forecasting methodology used for the SH7 BRT Study. This memorandum includes discussion of the following:
The role of rail in a transport system to limit the impact of global warming
 The role of rail in a transport system to limit the impact of global warming 26 November 213 Gerard Drew, Beyond Zero Emissions Tilo Schumann, German Aerospace Centre (DLR) Overview CONTEXT Character of
Senate Standing Committees on Economics 27 June 2014 PO Box 6100 Parliament House CANBERRA ACT 2600 By
 Senate Standing Committees on Economics 27 June 2014 PO Box 6100 Parliament House CANBERRA ACT 2600 By email: economics.sen@aph.gov.au Submission: Inquiry into Fuel Indexation (Road Funding) Bill 2014
REAL WORLD DRIVING. Fuel Efficiency & Emissions Testing. Prepared for the Australian Automobile Association
 REAL WORLD DRIVING Fuel Efficiency & Emissions Testing Prepared for the Australian Automobile Association - 2016 2016 ABMARC Disclaimer By accepting this report from ABMARC you acknowledge and agree to
Written Exam Public Transport + Answers
 Faculty of Engineering Technology Written Exam Public Transport + Written Exam Public Transport (195421200-1A) Teacher van Zuilekom Course code 195421200 Date and time 7-11-2011, 8:45-12:15 Location OH116
Policy Note. Vanpools in the Puget Sound Region The case for expanding vanpool programs to move the most people for the least cost.
 Policy Note Vanpools in the Puget Sound Region The case for expanding vanpool programs to move the most people for the least cost Recommendations 1. Saturate vanpool market before expanding other intercity
RELEASED UNDER THE OFFICIAL INFORMATION ACT 1982
 Subject MINISTERIAL BRIEFING NOTE Rapid Transit in Auckland Date 1 November 2017 Briefing number BRI-1133 Contact(s) for telephone discussion (if required) Name Position Direct line Cell phone 1 st contact
Back ground Founded in 1887, and has expanded rapidly Altitude about 2500 meters above MSL Now among the ten largest cities in Sub Saharan Africa
 Back ground Founded in 1887, and has expanded rapidly Altitude about 2500 meters above MSL Now among the ten largest cities in Sub Saharan Africa Annual growth rate is 3.8% By 2020 population growth would
Application of claw-back
 Application of claw-back A report for Vector Dr. Tom Hird Daniel Young June 2012 Table of Contents 1. Introduction 1 2. How to determine the claw-back amount 2 2.1. Allowance for lower amount of claw-back
Parks and Transportation System Development Charge Methodology
 City of Sandy Parks and Transportation System Development Charge Methodology March, 2016 Background In order to implement a City Council goal the City of Sandy engaged FCS Group in January of 2015 to update
National Health Care Expenditures Projections:
 National Health Care Expenditures Projections: 2001-2011 Methodology Summary These projections are produced annually by the Office of the Actuary at the Centers for Medicare & Medicaid Services. They are
VEPM 5.3. Vehicle Emission Prediction Model update: Technical report. Prepared for NZ Transport Agency. April 2017
 VEPM 5.3 Vehicle Emission Prediction Model update: Prepared for NZ Transport Agency April 2017 Suite 1-6, D72 Building, 72 Dominion Rd Mt Eden, Auckland 1024 +64 9 629 1435 www.emissionimpossible.co.nz
Bus The Case for the Bus
 Bus 2020 The Case for the Bus Bus 2020 The Case for the Bus Introduction by Claire Haigh I am sure we are all pleased that the economy is on the mend. The challenge now is to make sure people, young and
Quarterly Vehicle Fleet Statistics
 Quarterly Vehicle Fleet Statistics April-June Quarter of 214 ISSN 1173-179 Introduction The April-June 214 Quarterly Fleet Report is a brief review of vehicle fleet statistics. It provides information
NATIONAL ASSOCIATION OF AUTOMOBILE MANUFACTURERS OF SOUTH AFRICA
 NATIONAL ASSOCIATION OF AUTOMOBILE MANUFACTURERS OF SOUTH AFRICA GROUND FLOOR, BUILDING F ALENTI OFFICE PARK 457 WITHERITE ROAD, THE WILLOWS, X82 PRETORIA PO BOX 40611, ARCADIA 0007 TELEPHONE: (012) 807-0152
CO2 Performance ladder CO2 Inventory 2014
 Issue 9 October 2014 This report is a draft version. After official external verification and corrections the report will be made final and communicated. Arup bv Postbus 57145 1040 BA Amsterdam The Netherlands
Facts and Figures. October 2006 List Release Special Edition BWC National Benefits and Related Facts October, 2006 (Previous Versions Obsolete)
") Facts and Figures Date October 2006 List Release Special Edition BWC National Benefits and Related Facts October, 2006 (Previous Versions Obsolete) Best Workplaces for Commuters - Environmental and Energy
Facts and Figures Date October 2006 List Release Special Edition BWC National Benefits and Related Facts October, 2006 (Previous Versions Obsolete) Best Workplaces for Commuters - Environmental and Energy
105 Toronto Street South, Markdale Transportation Impact Study. Paradigm Transportation Solutions Limited
 105 Toronto Street South, Markdale Transportation Impact Study Paradigm Transportation Solutions Limited December 2016 Project Summary Project Number 162060 December 2016 Client Zelinka Priamo Ltd 318
Presentation A Blue Slides 1-5.
 Presentation A Blue Slides 1-5. 1 Presentation A Blue Slides 1-5. 2 Presentation A Blue Slides 1-5. 3 Presentation A Blue Slides 1-5. 4 Presentation A Blue Slides 1-5. 5 Transit Service right. service
BENCHMARKING URBAN TRANSPORT-A STRATEGY TO FULFIL COMMUTER ASPIRATION
 BENCHMARKING URBAN TRANSPORT-A STRATEGY TO FULFIL COMMUTER ASPIRATION Rahul Tiwari Senior City Transport Officer Directorate, Urban Administration and Development Bhopal & PhD Scholar (+91) 98930 44012
The Impact on Québec s Budget Balance
 ISSN 1715-2682 Volume 1, no. 2 August 17, 2005 Higher Fuel Prices The Impact on Québec s Budget Balance Summary 1. The increase in the price of gasoline at the pump since 1999 is due primarily to the soaring
Valvoline Fourth-Quarter Fiscal 2016 Earnings Conference Call. November 9, 2016
 Valvoline Fourth-Quarter Fiscal 2016 Earnings Conference Call November 9, 2016 Forward-Looking Statements This presentation contains forward-looking statements within the meaning of Section 27A of the
TARIFF DECISION FOR SASOL OIL (PTY) LTD S SECUNDA TO NATREF INTEGRATED (SNI) PIPELINE
 LTD S SECUNDA TO NATREF INTEGRATED (SNI) PIPELINE") TARIFF DECISION FOR SASOL OIL (PTY) LTD S SECUNDA TO NATREF INTEGRATED (SNI) PIPELINE 10 MAY 2018 Page 1 of 19 TABLE OF CONTENTS Introduction... 6 Applicable Law... 6 The Methodology... 6 Decision-Making
TARIFF DECISION FOR SASOL OIL (PTY) LTD S SECUNDA TO NATREF INTEGRATED (SNI) PIPELINE 10 MAY 2018 Page 1 of 19 TABLE OF CONTENTS Introduction... 6 Applicable Law... 6 The Methodology... 6 Decision-Making
WAITING FOR THE GREEN LIGHT: Sustainable Transport Solutions for Local Government
 WAITING FOR THE GREEN LIGHT: Sustainable Transport Solutions for Local Government C Published by the Climate Council of Australia Limited Climate Council of Australia Ltd 2018 ISBN-13: 978-1-925573-70-1
UTA Transportation Equity Study and Staff Analysis. Board Workshop January 6, 2018
 UTA Transportation Equity Study and Staff Analysis Board Workshop January 6, 2018 1 Executive Summary UTA ranks DART 6 th out of top 20 Transit Agencies in the country for ridership. UTA Study confirms
WATFORD LOCAL PLAN PART 2. Review of Car Parking Policy and Standards. Evidence Base. February 2012
 WATFORD LOCAL PLAN PART 2 Review of Car Parking Policy and Standards Evidence Base February 2012 1.0 Background 1.1 The Watford District Plan 2000 contains various policies relating to the provision of
4 COSTS AND OPERATIONS
 4 COSTS AND OPERATIONS 4.1 INTRODUCTION This chapter summarizes the estimated capital and operations and maintenance (O&M) costs for the Modal and High-Speed Train (HST) Alternatives evaluated in this
STRATEGIC PRIORITIES AND POLICY COMMITTEE MAY 5, 2016
 STRATEGIC PRIORITIES AND POLICY COMMITTEE MAY 5, 2016 Shift Rapid Transit Initiative Largest infrastructure project in the city s history. Rapid Transit initiative will transform London s public transit
! " # $ % # & " ' % ( ' ) "
") "#!! $% ! " # $ % # " ' % ( ' ) ",-..*-/--0"-00"0**0 2 In agreement with the Terms of Reference, we have conducted an analysis of the road user charges (RUC) paid by the users of the road networks in the
"#!! $% ! " # $ % # " ' % ( ' ) ",-..*-/--0"-00"0**0 2 In agreement with the Terms of Reference, we have conducted an analysis of the road user charges (RUC) paid by the users of the road networks in the
Figure 1 Unleaded Gasoline Prices
 Policy Issues Just How Costly Is Gas? Summer 26 Introduction. Across the nation, the price at the pump has reached record highs. From unleaded to premium grade, prices have broken three dollars per gallon
Executive Summary. Draft Environmental Impact Statement/Environmental Impact Report ES-1
 Executive Summary Introduction The Eastside Transit Corridor Phase 2 Project is a vital public transit infrastructure investment that would provide a transit connection to the existing Metro Gold Line
2 VALUE PROPOSITION VALUE PROPOSITION DEVELOPMENT
 2 VALUE PROPOSITION The purpose of the Value Proposition is to define a number of metrics or interesting facts that clearly demonstrate the value of the existing Xpress system to external audiences including
AIR QUALITY DETERIORATION IN TEHRAN DUE TO MOTORCYCLES
 Iran. J. Environ. Health. Sci. Eng., 25, Vol. 2, No. 3, pp. 145-152 AIR QUALITY DETERIORATION IN TEHRAN DUE TO MOTORCYCLES * 1 M. Shafiepour and 2 H. Kamalan * 1 Faculty of Environment, University of Tehran,
1. Thank you for the opportunity to comment on the Low Emissions Economy Issues Paper ( Issues Paper ).
.") 20 September 2017 Low-emissions economy inquiry New Zealand Productivity Commission PO Box 8036 The Terrace Wellington 6143 info@productivity.govt.nz Dear Commission members, Re: Orion submission on Low
20 September 2017 Low-emissions economy inquiry New Zealand Productivity Commission PO Box 8036 The Terrace Wellington 6143 info@productivity.govt.nz Dear Commission members, Re: Orion submission on Low
Superfast Cornwall Baseline Summary Report
 Superfast Cornwall Cornwall Development Company Superfast Cornwall Baseline Summary Report April 2017 pfa-research.com Use of Data Market Research supporting PR activities All of the work carried out by
committee report General Permitted Development Order SPT response to consultation
 committee report General Permitted Development Order SPT response to consultation Committee Strategy and Programmes Date of meeting 24 June 2011 Date of report 1 June 2011 Report by Assistant Chief Executive
Additional Transit Bus Life Cycle Cost Scenarios Based on Current and Future Fuel Prices
 U.S. Department Of Transportation Federal Transit Administration FTA-WV-26-7006.2008.1 Additional Transit Bus Life Cycle Cost Scenarios Based on Current and Future Fuel Prices Final Report Sep 2, 2008
WP3 Transport and Mobility Analysis. D.3.5. Transport Scenarios Results Report Nottingham
 WP3 Transport and Mobility Analysis D.3.5. Transport Scenarios Results Report Nottingham October 2015 314164 (ENER/FP7/314164) Project acronym: InSMART Project full title: Integrative Smart City Planning
Our mission is to be the best public service transporter for passengers in the city of Kigali using modern, clean and safe urban city buses.
 Kigali Bus Services Ltd. was incorporated in January 2006 in Kigali Rwanda. The Company started operations in March 2007 with just a few buses! We now operate a fleet of 50 Buses throughout Kigali City
Submission to Select Committee on Electric Vehicles - inquiry into the use and manufacture of electric vehicles in Australia
 31 July 2018 Senator Tim Storer Department of the Senate PO Box 6100 Parliament House Canberra ACT 2600 Dear Senator Storer, RE: Submission to Select Committee on Electric Vehicles - inquiry into the use
Chapter 4. Design and Analysis of Feeder-Line Bus. October 2016
 Chapter 4 Design and Analysis of Feeder-Line Bus October 2016 This chapter should be cited as ERIA (2016), Design and Analysis of Feeder-Line Bus, in Kutani, I. and Y. Sado (eds.), Addressing Energy Efficiency
Statement of Expected Price Trends
 2012-13 2016-17 June 2016 TasNetworks Pty Ltd PO Box 606 Moonah TAS 7009 ABN 24 167 357 299 Enquiries regarding this document should be addressed to: TasNetworks Revenue and Pricing Regulation Team Leader
BENCHMARK SURVEY 2013
 AUSTRALIAN CAR WASH INDUSTRY BENCHMARK SURVEY 2013 This survey was undertaken in response to many requests for information about the car wash industry in Australia both the current position and the trends
EXECUTIVE SUMMARY. The following is an outline of the traffic analysis performed by Hales Engineering for the traffic conditions of this project.
 EXECUTIVE SUMMARY This study addresses the traffic impacts associated with the proposed Shopko redevelopment located in Sugarhouse, Utah. The Shopko redevelopment project is located between 1300 East and
A CO2-fund for the transport industry: The case of Norway
 Summary: A CO2-fund for the transport industry: The case of Norway TØI Report 1479/2016 Author(s): Inger Beate Hovi and Daniel Ruben Pinchasik Oslo 2016, 37 pages Norwegian language Heavy transport makes
WHERE S MY BUS GOING?
 WHERE S MY BUS GOING? From late 2017, Greater Wellington Regional Council(GWRC) wants to change the way your buses run and not for the better. GWRC want a cost effective bus service that s attractive to
Chairperson and Committee Members REGULATORY MANAGEMENT COMMITTEE 3 SEPTEMBER 2015
 Chairperson and Committee Members REGULATORY MANAGEMENT COMMITTEE 3 SEPTEMBER 2015 SPEED LIMIT CHANGE ON KĀPITI ROAD PURPOSE OF REPORT Meeting Status: Public Purpose of Report: For Decision 1 The purpose
IDS. Pavement Cost Impact Assessment from Increased Axle Loads on 2 and 3-Axle Buses VDAM Bus Amendment March 2016
 IDS Pavement Cost Impact Assessment from Increased Loads on 2 and 3- Buses VDAM Bus Amendment Pavement Impact Assessment from Increased Loads on 2 and 3- Buses VDAM Bus Amendment This document has been
QUARTERLY REVIEW OF BUSINESS CONDITIONS: NEW MOTOR VEHICLE MANUFACTURING INDUSTRY / AUTOMOTIVE SECTOR: 2 ND QUARTER 2017
 NATIONAL ASSOCIATION OF AUTOMOBILE MANUFACTURERS OF SOUTH AFRICA GROUND FLOOR, BUILDING F ALENTI OFFICE PARK 457 WITHERITE ROAD, THE WILLOWS, X82 PRETORIA PO BOX 40611, ARCADIA 0007 TELEPHONE: (012) 807-0152
Parking Management Element
 Parking Management Element The State Transportation Planning Rule, adopted in 1991, requires that the Metropolitan Planning Organization (MPO) area implement, through its member jurisdictions, a parking
SCC Greenhouse Gas Assessment
 SCC Greenhouse Gas Assessment April 2015 March 2016 Produced by CO2balance UK Ltd March 2017 CO2balance UK Ltd, 1 Discovery House, Cook Way, Bindon Road, Taunton, Somerset, TA2 6BJ, UK Tel: +44 (0) 1823
ECONOMIC AND FINANCIAL ANALYSIS
 South Asia Subregional Economic Cooperation Dhaka Northwest Corridor Road Project, Phase 2 (RRP BAN 40540) A. Introduction ECONOMIC AND FINANCIAL ANALYSIS 1. The proposed project primarily aims at capacity
The City of Toronto s Transportation Strategy July 2007
 The City of Toronto s Transportation Strategy July 2007 Presentation Outline Transportation Statistics Transportation Building Blocks Toronto s Official Plan Transportation and City Building Vision Projects
Urban Transport systems in major cities in China. Sun Kechao Senior Engineer China Academy of Transportation Sciences, Beijing, China
 Urban Transport systems in major cities in China Sun Kechao Senior Engineer China Academy of Transportation Sciences, Beijing, China Part 1 Part 2 Part 3 Part 4 Introduction Urban transport policies Urban
L O W E M I S S I O N CITY
 A V I SION FOR AN ULTRA - L O W E M I S S I O N CITY Improving Air Quality in London Elliot Treharne Air Quality Manager June 2014 Central London Kuwait New Zealand Qatar Czech London in 6 facts Global
STATISTICAL TABLES REAL SECTOR SECOND QUARTER 2018 Last updated August 17, 2018
 CENTRALE BANK VAN ARUBA STATISTICAL TABLES REAL SECTOR SECOND QUARTER 2018 Last updated August 17, 2018 Contents 1 Real sector 1.1 Gross Domestic Product 1.2A Business Perception Results 1.2B Business
DRIVER SPEED COMPLIANCE WITHIN SCHOOL ZONES AND EFFECTS OF 40 PAINTED SPEED LIMIT ON DRIVER SPEED BEHAVIOURS Tony Radalj Main Roads Western Australia
 DRIVER SPEED COMPLIANCE WITHIN SCHOOL ZONES AND EFFECTS OF 4 PAINTED SPEED LIMIT ON DRIVER SPEED BEHAVIOURS Tony Radalj Main Roads Western Australia ABSTRACT Two speed surveys were conducted on nineteen
Economy. 38% of GDP in 1970; 33% of GDP in 1998 Most significant decline in Manufacturing 47% to 29%
 Economy MCMA as important, but declining, force in national economy 38% of GDP in 1970; 33% of GDP in 1998 Most significant decline in Manufacturing 47% to 29% Relatively constant contribution of Financial