! report Hutt Corridor Study Stage 2
|
|
|
- Earl Jennings
- 5 years ago
- Views:
Transcription
1 report Hutt Corridor Study Stage 2
2 report Hutt Corridor Study Stage 2 Prepared for Wellington Regional Council By Beca Carter Hollings & Ferner Ltd L1:76412
3 Revision History Revision Nº Prepared By Description Date A Stephen Hewett Draft 2 June 2002 B Stephen Hewett Draft 24 June 2002 Document Acceptance Action Name Signed Date Prepared by Reviewed by Approved by Stephen Hewett Andrew Murray Robert Jamieson Beca Carter Hollings & Ferner Ltd Page i
4 Table of Contents 1 Introduction Report Structure Indicators and Assessment Methodology The Planning Balance Sheet Method The Indicators Methodology for Accessibility and Sustainability Indicators Methodology for Economic Efficiency Indicator Methodology for Affordability Indicator Results of Assessment of Stage 1 Options Evaluation of Individual Projects Passenger Transport Services Stage II Transport Scenarios Stage 2 Options Option S Option S Option S Option S Option S Option S Results of Assessment for Stage 2 Options Conclusion Beca Carter Hollings & Ferner Ltd Page ii
5 Appendices Appendix A Performance indicator test results and indicative BCR for each Stage 1 option Appendix B EMME/2 Modelling assumptions made for each Stage 2 option Appendix C Performance indicator test results for each Stage 2 option Appendix D Rough order of cost, indicative benefits and Benefits Cost Ratio (BCR) for each Stage 2 option Beca Carter Hollings & Ferner Ltd Page iii
6 1 Introduction The Regional Land Transport Committee through the Wellington Regional Council have commissioned the Hutt Corridor Plan Study. This corridor links Wairarapa, Hutt Valley, Porirua, Kapiti and Wellington City. This is a multi-modal corridor with highways, major local roads, rail and bus services playing a major role in daily travel patterns. The purpose, scope, objectives and methodology of the Study are set out in the document Hutt Corridor Study Stage 1 Report, March 2002, and this document should be read in conjunction with the Stage 1 Report. This document outlines the preliminary strategic that can be confirmed for a Hutt Corridor Plan, as part of the Region s wider transport strategies. This study was directed by a Technical group made up of officers from Wellington Regional Council, Transfund New Zealand, Transit New Zealand, Hutt City Council, Upper Hutt City Council, Masterton District Council, Porirua City Council and Wellington City Council. The technical group is chaired by Tony Brennand from the Wellington Regional Council. 1.1 Report Structure The remainder of this report is structured as follows: Section 2 Section 3 Section 4 Section 5 Section 6 Describes the indicators and assessment methodology; Describes the assessment of results for Stage 1 options; Describes the evaluation of individual projects; Details Stage 2 transport scenarios; and Assessment of results for Stage 2 options Beca Carter Hollings & Ferner Ltd Page 4
7 2 Indicators and Assessment Methodology This section list the indicators against which the options in Stage 1 have been assessed and described the methodologies used in the assessments. 2.1 The Planning Balance Sheet Method The Planning Balance Sheet (PBS) method is being used for all the Wellington Regional Transport Study to evaluate the options at each stage. Each option is scored against a series of indictors, applying weightings and summing the individual scores to obtain an overall score for each option. Table 2.1 gives the possible range of scores used in the PBS method. Note that scores may differ depending on the criteria or weightings used. Description Table 2.1 Planning Balance Sheet Scoring System Score Adequately meets indicator ++ Partially meets indicator + Neutral with respect to indicator 0 Marginally fails to meet indicator - Fails to meet indicator The Indicators There are four main indicators used to assess the options. They are: Indicator 1: Accessibility and Economic Development Indicator 2: Affordability Indicator 3: Economic Efficiency Indicator 4: Sustainability Table 2.2 gives the full set of indicators and Appendix A lists the indicators and the individual measures within each Beca Carter Hollings & Ferner Ltd Page 5
8 Table 2.2 Indicators 1. ACCESSIBILITY & ECONOMIC DEVELOPMENT Motor Vehicle Statistics Vehicle Travel Times to Airport (minutes): Public Transport Statistics Annual economic cost of congestion 2. AFFORDABILITY 5 year cost (Capital plus operating costs) 3. ECONOMIC EFFICIENCY Benefit Cost Ratio 4. SUSTAINABILITY Environment CO emissions Fuel consumption Safety V/C Ratio 2.3 Methodology for Accessibility and Sustainability Indicators This section briefly outlines the generic process used to assess the options with respect to: Indicator 1: Accessibility (To provide a transport system that optimises access to and within the region.) Indicator 4: Sustainability indicators (To provide a land transport system that: Operates in a manner that recognises the needs of the community; Avoids, remedies or mitigates adverse effects; Uses resources in an efficient way; and supports an optimal demand for energy. The process involved two general steps: the options were assessed by individuals separately using their own specific methods (Authors evaluation only); the individuals met for a Delphi Session to discuss their individual scores and to agree the scores for the collective PBS (Yet to undertaken). Several methods were used by individuals in the first step. These methods included: Combining of specific indicators using an objective process with or without weighting them to obtain a PBS numerical value; Beca Carter Hollings & Ferner Ltd Page 6
9 Assess whether scenarios meet or fail to meet the objectives of an indicator relative to the base, using all of the indicators or only those judged to be critical in differentiating between the options. The scores for these indicators were allocated by splitting the results into 5 bands as given in Table 2.3 for the two main assessment methods. Table 2.3 Allocating Scores for Indicators 1, and 4 Combining Indicators Meet/Fail Assessment Score Objectively highest value adequately meets indicator ++ intermediate value partially meets indicator + 1 (base) neutral to indicator 0 intermediate value marginally fails to meet indicator - lowest value fails to meet indicator - - The Delphi Session involved: Calculating the average score for each indicator; Discussing variations between scores, with the reasoning behind scores explained; If a consensus was not reached quickly, undertaking further investigations, such as referring to the technical notes, until an agreed score became clear; Revisiting scores in the light of further evidence if necessary. 2.4 Methodology for Economic Efficiency Indicator This section describes the methodology for determining Indicator 3, Economic Efficiency. The specific indicator is total system use costs per person-kilometre and this is measured by the Cost Benefit Ratio. This is the ratio of the expected present value of the option benefits to the expected present value of the option costs, that is: Cost Benefit Ratio = NPV (Benefits - Costs + Tolls) / NPV Cost Benefits The indicative benefits of each option have been calculated using the AM 2 hour and Interpeak 7-hour models. The Weekday daily benefits have been calculated as 2 times the AM peak plus 1.7 times the Interpeak periods modelled. The Weekend benefits have been calculated as 4 times the Interpeak benefits. The Annual benefits have been calculated as 240 weekdays and 60 weekend benefits. The 25 year benefits were calculated using a uniform series present worth factor of 9.524, which equates to 25 years from time zero. Time zero is assumed to be 2016, the year modelled. Because we are only using one model year of 2016 there is no growth assumed in the benefits calculation Beca Carter Hollings & Ferner Ltd Page 7
10 The calculation is: 1 weekday = 2 * (AM peak outputs) * (Interpeak outputs) 1 weekend = 4* (Interpeak outputs) 1 year = 240 * 1 weekday + 60 * 1 weekend Construction Costs The construction costs of the options have been obtained from various feasibility-study reports, and technical review by Graham Ramsay, Beca. These and are given in Table 2.4 in 2001 dollars. Those costs estimated prior to the year 2001 have been factored to 2001 values to account for changes in the Consumer Price Index (CPI) as published by Statistics New Zealand. Table 2.4 Construction Costs of Projects in Stage 1 Options Project and Source Option Cost ($million) Advance Traffic Management System (ATMS) H Melling Grade Separated Interchange Silverstream Bridge Upgrade to 4 lanes Hutt Expressway High Occupancy Toll (HOT) Lane H Melling Grade Separated Interchange Silverstream Bridge Upgrade to 4 lanes Hutt Expressway High Occupancy Toll (HOT) Lane H2_2a 13 Hutt Expressway Tidal Flow Lane ( Petone Ngauranga); Full Grade Separation at: Melling Belmont Silverstream Moonshine Road Gibbons Street Totara Park Road Realignment of Petone Curve; Whakatiki Street access to SH2 closed; and Silverstream Bridge Upgrade to 4 lanes. H Hutt Expressway Tidal Flow Lane ( Petone Ngauranga); H3_2a Beca Carter Hollings & Ferner Ltd Page 8
11 Project and Source Option Cost ($million) Hutt Expressway High Occupancy Vehicle (HOV) Bus only P lane (Petone Ngauranga) New Bus & Ferry Services & Routes between Hutt & Porirua Increased frequency and speed of rail services; and New bus service between Hutt & Porirua. Melling Loop Light Rapid Transit (LRT); Stokes Valley LRT; New stations at Timberlea & Cruickshank Road; Hutt Valley Heavy Rail Services; and Wairarapa Services. Rail speeds increased; Bus services between Hutt & Porirua; Hutt Expressway HOV Bus only lane; Wainuiomata Superbus network; and Eastbourne Ferry Service doubled Petone Grenada Link Road; and Esplanade Upgrade. Melling Porirua Link Road; and Cross Valley Link: Whites Line Road to Wakefield Bridge; 4-lane road from Randwick Road to Dowse SH2 interchange. Melling Porirua Link Road; Melling Grade Separation; and Randwick Melling Link around the Lower Hutt CBD Belmont Porirua Link Road; Randwick Cambridge Terrace Belmont Link. P2 6.5 P P X X X X Public Transport Capital Costs Public transport capital costs are only included if a scenario results in less PT vehicles and this does not translate into a benefit. The number of new buses and/or new double-carriage trains required in an option was calculated and the corresponding number required in the base subtracted. If the net result was positive, it was multiplied by the estimated cost of a new bus ($250,000) or two train car sets ($5,000,000) Beca Carter Hollings & Ferner Ltd Page 9
12 2.4.4 Public Transport Operating Costs Bus and train operating costs are calculated directly within the models and include those items not included in vehicle costs, such as labour costs Present Value Calculation The net present values (NPV) of the benefits and costs were calculated over 25 years using 10% discount rate. That is: NPV = Data yr / (1 + r) yr The modelling was undertaken in only one future year, 2016, and the outputs for this year were assumed to be constant for 25 years Allocation of Scores The scores for the Efficiency indicator were allocated by splitting the results into 5 bands as given in Table 2.5. Table 2.5 Allocation of Efficiency Indicator Scores Result Score (BCR) > to to to < Beca Carter Hollings & Ferner Ltd Page 10
13 2.5 Methodology for Affordability Indicator Affordability is measures by the plan for a land transport system that recognises funding constraints and the ability to pay. The target is for the 5 year costs not to exceed $250 million within the Wellington Region. It is assumed that $150 million is the target figure for this corridor. The scores for the Affordability indicator were allocated by splitting the results into 4 or 5 bands as given in Table 2.6. Table 2.6 Allocation of Affordability Indicator Scores Total Option Cost Score ($) 0 to $50M ++ $50M to $100M + 0 $100M to $150M - > $150M Beca Carter Hollings & Ferner Ltd Page 11
14 3 Results of Assessment of Stage 1 Options This section presents and comments on the results of the assessments of the Stage 1 options using the PBS methodology. Table 3.1 gives the results for all options and indicators. The results of the performance indicator tests are detailed in the following Tables in Appendix A: Table 5.1 AM peak results Table 5.2 AM peak results as % difference compared to the Base Table 5.3 AM peak results as actual difference compared to the Base Table 5.4 Interpeak results Table 5.5 Interpeak results as % difference compared to the Base Table 5.6 Interpeak results as actual difference compared to the Base Table 5.7 The Benefit Cost Ratio for each option Beca Carter Hollings & Ferner Ltd Page 12
15 Table 3.1 Planning Balance Sheet Scores for Stage 1 Options 1. Accessibility Indicators Options Base H1 H2 H2-2a H3 H3_2a X1 X2 X3 X4 P1b P2 P3 P4 Motor Vehicle Statistics Public Transport Statistics Vehicle Travel times to Airport Affordability 5 year cost Economic Efficiency Benefit Cost Ratio (BCR) Sustainability Environment Fuel Safety V/C Ratios Beca Carter Hollings & Ferner Ltd Page 13
16 4 Evaluation of Individual Projects 4.1 Passenger Transport Services Wairarapa Service Improvements The current Wellington Transport Strategic Model has no PT trips between the Wairarapa and Hutt or Wellington Cities. However, from our initial investigation of the 2001 Rimutaka screenline roadside interview survey and the 2002 Rail survey 340 people currently use the rail with some people per day driving over the Rimutaka Range into Upper Hutt, Lower Hutt and Wellington City. There seems to be significant scope to improve patronage of the Wairarapa to Wellington rail services. This improvement looks appropriate as part of an overall passenger transport strategy, but can only be evaluated fully when the new Wellington Transport Strategic model is available in May Recommendation: Include as part of the overall passenger Transport improvement strategy Eastbourne Ferry Service Improvement Only 56 passengers were attached to this service by doubling the frequency. The model output does not support this improvement, as 56 passengers would not justify the additional ferry required to double the frequency during peak periods. Recommendation: This PT improvements does not seem viable and should be dropped Petone Ferry Service The model estimates that this service would attach only three passengers. The delays to potential Petone passengers using either existing bus and rail services or cars is not sufficient to attached passengers of this new service. Recommendation: This PT improvements does not seem viable and should be dropped Seaview Ferry Service The model estimates that this service would attach zero passengers. The delays to potential Seaview passengers using either existing bus and rail services or cars is not sufficient to attached passengers of this new service. In addition the catchment for this service is small. Recommendation: This PT improvements does not seem viable and should be dropped Beca Carter Hollings & Ferner Ltd Page 14
17 4.1.5 Superbus Services The proposed Superbus network proposed included improved services that covered: Lower Hutt; Stokes Valley; Upper Hutt; Western Hills; and Wainuiomata. (a) Lower Hutt The Lower Hutt service only picks up passengers from the corner of Melling Link and High Street and then travels as an express into Wellington CBD. The services provide good penetration into the CBD but only attached 168 passengers and most were directly transferred from the Melling rail service. This service is in direct competition with the Melling rail service. Recommendation: This PT improvements does not seem viable and should be dropped (b) Stokes Valley During the 2-hour morning peak period the proposed Stokes Valley services picks up 400 passengers from Stokes Valley Road and 160 from the corner of Melling Link and High Street and then travels as an express into Wellington CBD. The service provides good penetration into the CBD. This service also provides the same service as the proposed Lower Hutt service. Recommendation: Include as part of the overall passenger Transport improvement strategy (c) Upper Hutt During the 2-hour morning peak period the proposed Upper Hutt services travel down the State Highway and picks up a total of 460 passengers from Akatarawa, Totara Park Road, Gibbons, Whakatiki Street, Moonshine Road and Silverstream Bridge, before expressing to Wellington CBD. The model shows that patronage for this service is a transfer from rail with few drivers and car passengers being attracted to this bus service. The potential benefits of this service should be discussed further with the Technical group. Recommendation: Include as part of the overall passenger Transport improvement strategy (d) Western Hills The Western Hills service attached 337 passengers during the 2-hour morning peak period, but with most passengers directly transfer from the Melling rail service. This service is in direct competition with the Melling rail service. The service would reduce the number of rail passengers that drive their car to the rail station. Promotion of this service would increase the subsidy as either the Melling or this proposed Western Hill buses would be commercially viable Beca Carter Hollings & Ferner Ltd Page 15
18 Recommendation: This PT improvement does not seem viable with the Melling rail service in place and should be dropped. (e) Wainuiomata During the 2-hour morning peak period the proposed Wainuiomata service picks up 760 passengers from Wainuiomata area and then travels as an express into Wellington CBD from the intersection of Wainuiomata Road and Parkway. The service provides good penetration into the CBD. This service does result in some passengers transferring from rail to bus, but does provide a good alternative to using the car from the Wainuiomata area. The current model does not model the benefits buses gain in bypassing delayed car traffic on The Esplanade during the peak morning period. Recommendation: Include as part of the overall passenger Transport improvement strategy Haywards Bus Service The modelled service split between Upper Hutt, Lower Hutt and Porirua is estimated to carry the following passengers during the morning two-hour peak period with a headway of 30 minutes: Lower Hutt to Porirua 18 passengers Porirua to Lower Hutt 16 passengers Upper Hutt to Porirua 30 passengers Porirua to Upper Hutt 25 passengers The current service between Upper Hutt and Porirua with a headway of 60 minutes was surveyed recently. The patronage flows recorded were: Porirua to Upper Hutt AM peak 2 hours 10 passengers Interpeak 7 hours 4 passengers Upper Hutt to Porirua AM peak 2 hours 2 passengers Interpeak 7 hours 13 passengers This service would require a high subsidy, and does not compete efficiently with car travel. The viability and function of this service should be further discussed with the Technical Group. Recommendation: This PT improvement does not seem viable. As the Upper Hutt to Porirua service is currently in operation with a high subsidy the Technical Group should discuss the strategic longterm viability of this service or the proposed additional service to Lower Hutt Beca Carter Hollings & Ferner Ltd Page 16
19 4.1.7 Increased Rail Speed and Doubled Rail Frequency Increasing the rail speed by 10% and halving the headway of the current rail services showed that modal shift is sensitive to service frequency. Vehicle volumes on SH2 from Petone to Ngauranga only change by 70 vehicles, but rail passengers through this corridor have increased by 500 over the two hour AM peak period. This option is expected to produce $46 million in road user benefits and have an indicative BCR of 7.1. The Wellington Regional Council have confirmed that existing track alignment can accommodate a 10% increase in speed safely. Recommendation: Include as part of the overall passenger Transport improvement strategy New Timberlea and Cruickshank Stations During the morning two-hour peak period approximately 280 and 160 passengers were modelled accessing the rail at the proposed Timberlee and Cruickshank stations respectively, which was modelled with a service frequency of 15 minute headway. These two new stations would be well utilised and provide improved access to the Wellington CBD and Lower Hutt. Recommendation: Include as part of the overall passenger Transport improvement strategy Petone to Ngauranga Capacity Improvements The three capacity improvement projects evaluated in Stage 1: (1) Tidal Flow; (2) High Occupancy Toll Lane (HOT); and (3) Bus Only Lane have been evaluated separately to determine the individual BCR and the effect on auto traffic and Passenger Transport flows between Petone and Ngauranga. Table 4.1 and 4.2 provides a comparison of the vehicles and passenger transport flows between Petone and Ngauranga. Table 4.1 AM 2-Hour Peak Southbound Trip Distribution through Petone - Ngauranga Corridor Mode Base Tidal Flow HOT Expressway Bus Lane Private Vehicles Bus Train Table Beca Carter Hollings & Ferner Ltd Page 17
20 AM 2-Hour Peak Northbound Trip Distribution through Petone - Ngauranga Corridor Mode Base Tidal Flow HOT Expressway Bus Lane Private Vehicles Bus Train Table 4.3 compares these three capacity improvements. Table 4.3 Petone - Ngauranga Corridor Improvement BCR's Options BCR BCR AM & PM Flows AM Peak Flows Tidal Flow 1.1 HOT Lane Hutt Expressway Bus Lane Based on the AM flow only the HOT lane optimal annual toll value is estimated at around $520,000. The Tidal flow project is estimated to attract approximately an extra 1000 vehicles into the Wellington CBD the remaining 1400 vehicle would travel to other area where parking is expected to be available. This will require additional car parking infrastructure. Assuming a rough order of cost of $25,000 per car park to construct and purchase land on the CBD fringe. The Tidal Flow project would require approximately $25,000,000 in car park infrastructure. This reduces the BCR to 1.1 The HOT lane is estimated to attract approximately an extra 650 vehicles into the Wellington CBD mostly due to a transfer from rail. The HOT project would require approximately $16,250,000 in car park infrastructure. This reduces the BCR to 1.3. However, if the toll revenue was included in the economic evaluation the cost was reduced increasing the BCR to 1.5. The modelling shows that the Expressway Bus lane has little effect on attracting motorist from cars with the increase in bus patronage coming from rail. The main reasons why the model shows little effect in attracting motorists onto buses is that before the generalised cost for bus travel is compared to the generalised cost of auto travel, the model adds the generalised cost of rail travel and bus travel together to calculated the average generalised cost of PT travel. Therefore the benefit of improved bus travel is reduced by the averaging effect of combining rail travel. We have analysed the generalised cost of travelling by bus and car from the Wainuiomata and Stokes Valley and the proposed super bus network plus Expressway Bus lane have a significant effect in reducing car travel to the Wellington CBD. However, these commuter cars are replaced by peak compression or induced auto trips to other areas. We believe Beca Carter Hollings & Ferner Ltd Page 18
21 that the Expressway Bus only lane should generate significantly more benefits than currently been calculated. Recommendation: Include the High Occupancy Toll and the Expressway Bus Lane as part of the overall passenger Transport improvement strategy Melling Rail Extension Sinclair Knight Merz were commissioned to evaluate the feasibility of a Melling Rail extension, with Booz Allen Hamiton undertaking modelling using the current Wellington Regional model. Based on the Hutt City Council Melling Rail Extension Feasibility & Scheme Assessment Study Stage II Report, February 2001, the project sought to determine the feasibility of extending the Melling branch rail line across the Hutt River and/or linking the Melling branch rail line to the Wairarapa rail line at Waterloo Station using light rail through the streets of lower Hutt business central district. The study evaluated eight options divided into three groups, with those options in each group having similar features in relation to operation and construction phasing. The groups are: Heavy Rail Extension of Melling line to east bank of river (2 options) Heavy Rail Extension of Melling line to east bank of river plus Light Rail link through Central Business District to Wairarapa line (3 options) Light Rail Link from Melling line direct to Wairarapa line, passing through the central business district (3 options) The study recommended the option, which completes the loop from the Melling line to the Wairarapa line and provides excellent access to the CBD. The likely operation on this link would be running light rail vehicles from Wellington Station, to Petone, Melling, through the Hutt Central Business District, Waterloo, then back to Petone and Wellington (or in the reverse direction). For the Hutt Corridor Stage 1 strategic evaluation the Melling LRT loop was modelled with a two-way operation with a 20-minute headway from Melling to Waterloo Station. The model estimated that during the 2-hour AM peak: 49 passengers would use the LRT from Waterloo to Melling. 69 passengers would use the LRT from Melling to Lower Hutt CBD, with 22 passengers travelling from Melling to Waterloo. As part of the Stage 2 evaluation the headway was increased from 20 minutes to 10 minutes. The model estimated that during the 2-hour AM peak: 62 passengers would use the LRT from Waterloo to Melling. 76 passengers would use the LRT from Melling to Lower Hutt CBD, with 38 passengers travelling from Melling to Waterloo Beca Carter Hollings & Ferner Ltd Page 19
22 The previous evaluation by Booz Allen Hamilton provided a similar result, in terms of the increase in PT trips during the AM peak 2-hour period. However, we do not believe the LRT loop can stack up with the lower projected patronage between the Melling and Wairarapa rail lines. A summary of the key performance indicators is provided in Table 4.4. Table 4.4 Summary of Key AM Peak Indicator for Melling LRT Loop (Headway 10 Minutes) Key Indicator Base Option P3 Percentage Difference Total Motor Vehicle Travel Time (hrs) Travel Time from Upper Hutt to Airport (hrs) Total Passenger Travel Time (hrs) Estimated Cost $12M BCR 0.8 Total Number of Vehicle Trips Total number of Passenger Transport Trips Cost of Congestion In our opinion the only potentially viable options would be to extend the Melling rail line across the river to improve access into the Hutt CBD. As an alternative it would be more cost effective to provide a shuttle bus service from Waterloo and Melling Stations. Recommendation: Based on the current modelling result the Melling Loop LRT does not seem to be viable, and therefore should not be evaluated further as part of the Hutt Corridor strategic transport improvements. However, we proposed to evaluate extending the Melling line across the river Stokes Valley LRT For the Hutt Corridor Stage 1 strategic evaluation the Stokes Valley LRT was modelled with a 20-minute headway from Stokes Valley to Wellington joining the Wairarapa rail line north of Pomare Station. The model estimated that during the 2-hour AM peak: 154 passengers would use the LRT from Stokes Valley; and. 17 passengers to Stokes Valley. As part of stage two of the evaluation the headway was increased from 20 minutes to 10 minutes. The model estimated that during the 2-hour AM peak: 370 passengers would use the LRT from Stokes Valley; and. 24 passengers to Stokes Valley. A summary of the key performance indicators is provided in Table Beca Carter Hollings & Ferner Ltd Page 20
23 Table 4.5 Summary of Key AM Peak Indicator for Option Stokes Valley LRT (Headway 10 Minutes) Key Indicator Base Option P3 Percentage Difference Total Motor Vehicle Travel Time (hrs) Travel Time from Upper Hutt to Airport (hrs) Total Passenger Travel Time (hrs) Estimated Cost $6M BCR 1.4 Total Number of Vehicle Trips Total number of Passenger Transport Trips Cost of Congestion In our opinion the Stokes Valley bus network has better accessibility and penetration into the Wellington CBD at a lower cost. Recommendation: Based on the current modelling result the Stokes Valley LRT does not seem to be viable, and therefore should not be evaluated further as part of the Hutt Corridor strategic transport improvements Hutt to Porirua Link Options Bill Barclay has been commissioned to use the Hutt City Traffic model to test the local effects of: Option X1 which includes the following improvements: Petone Grenada Link Road; and Esplanade Upgrade. Option X2 which includes the following improvements: Melling Porirua Link Road; and Cross Valley Link: Whites Line Road to Wakefield Bridge; 4 lane road from Randwick Road to Dowse SH2 These option were coded into the Hutt Traffic Model as follows: Beca Carter Hollings & Ferner Ltd Page 21
24 Option TT31 Option X1 The base was modified to include: Grade separation at Koro Cr (no connection); Interchange at Dowse Drive; Petone-Grenada link road; Diamond interchange at Petone; 4 lanes on Esplanade and Estuary Bridge. Cuba St connection to Esplanade retained with high-capacity intersection. (BCHF Option X1) Option TT41 Cross Valley Link Only Grade separation at Koro Cr (no connection); Interchange at Dowse Drive Upgrade of Wakefield St with connection across river to Ludlam/Whites Line intersection; Roundabout at Hutt/Wakefield intersection with no modifications to Dowse interchange. Option TT42 Option X2 without Cross Valley Link Grade separation at Koro Crescent(no connection); Interchange at Dowse Drive; Melling-Porirua link road; New interchange at Melling with SH2 and Melling Bridge -Porirua link traffic grade separated; 4 lanes on Melling Bridge. Option TT43 Option X2 with Cross Valley Link Grade separation at Koro Crescent (no connection); Interchange at Dowse Drive; Upgrade of Wakefield St with connection across river to Ludlam/Whites Line intersection; Roundabout at Hutt/Wakefield intersection with no modifications to Dowse interchange; Melling-Porirua link road; New interchange at Melling with SH2 and Melling Bridge-Porirua link traffic grade separated; 4 lanes on Melling Bridge Beca Carter Hollings & Ferner Ltd Page 22
25 The Hutt Traffic model has been run for the years 2001 and 2016, for morning peak and interpeak periods. Trip matrices representing both fixed base matrix and induced travel conditions (derived from the Wellington Transport Strategic Model) have been applied. Summary two-way flows on selected links for the morning peak hour for 2016 is shown in Tables 4.6. Establishment of the Dowse interchange transfers a large amount of traffic from the Petone Ramps to Dowse. Much of this traffic is travelling to or from central parts of Lower Hutt rather than to Seaview, Eastbourne or Wainuiomata, and it will be seen that in the morning peak while flows immediately east of the Petone Ramps drop by over 1,000 vehicles per hour, at the Estuary Bridge the reduction is only around 100. Although flows at either end of the Esplanade are of similar magnitude, it is clear that relatively small proportions are travelling the full length. Petone to Grenada Link Addition of a Petone-Grenada link increases flows at Petone, but the majority of traffic from the new link uses SH2 and accesses the valley floor at Dowse Interchange. The Hutt model identifies that the Petone ramp merges would be at capacity in 2016 with this link road. Under induced traffic conditions flow on SH2 between Petone and Dowse (5490 vph) exceeds the capacity of a four lane road. Therefore this option would require 6 lanes between Petone and Dowse interchanges. Six laning through the Korokoro area is extremely difficult due to the Cemetery and Petone rail station. The extra traffic induced by the new link road would over load the proposed Dowse Interchanges as proposed. Cross Valley Link The interchange configuration, which Transit has adopted at Dowse Drive establishes an efficient cross-valley route using Hutt Road, Railway Avenue, Ewen Bridge and Woburn Road. This route will compete effectively with any new cross valley route on Wakefield Street if the new route is not connected directly to the interchange, and it will be seen that on the Option TT41 network (Cross Valley Road only) the new bridge only attracts a few hundred vehicles per hour. Its attractiveness is even worse if a new Porirua-Melling link is built, since some traffic previously travelling through Ngauranga will be diverted to Melling, away from the Dowse connection. The finding that the Cross Valley Link has poor attractiveness for traffic contrasts with the conclusions of earlier studies, which found that it would carry flows equivalent to between 20,000 and 30,000 vehicles per day. Those studies however assumed a direct connection between SH2 and Wakefield Street, and relied on Victoria Street as a link to the Ewen Bridge. Under these conditions the new Cross Valley Link would be very efficient, and more successful in attracting traffic from both Estuary and Ewen Bridges. Another important issue is whether Hutt Road or Victoria Street is used as the main link to Ewen Bridge. At present, both roads carry similar volumes of traffic, between 15,000 and 20,000 vehicles per day. The nature of the traffic however is quite different; on Hutt Road a Beca Carter Hollings & Ferner Ltd Page 23
26 large proportion is travelling between central Lower Hutt and Wellington. Construction of an interchange at Dowse merely changes the point at which these vehicles transfer between SH2 and Hutt Road, and total volumes only increase by a modest amount. Victoria Street on the other hand carries mainly short-distance traffic between Lower Hutt and Petone, and if the interchange is connected there will be a substantial increase in flow, probably beyond the capacity of a two-lane road. The present proposal of connecting to Hutt Road makes effective utilisation of both roads within a two-lane regime, but at the same time reduces the effectiveness of a new bridge at Wakefield Street. Melling Porirua Link A Porirua link terminating at Melling will further intensify pressure at Melling, already a major attraction point. The link will be used by many vehicles presently passing through Ngauranga, or using State Highway 58 and as a result there will be a transfer of traffic from Ewen Bridge to Melling, and to a lesser extent from the Cross Valley Link and Estuary Bridges. This link option removes the pressure on the Dowse Interchange, due to the unattractiveness. However, this is because fewer than expected vehicles are attached to use the Cross Valley Link if not directly connected to State Highway 2. Summary In summary the Petone Grenada link road would overload the Petone on-ramps; The two lane on State Highway 2 between Petone and Dowse; and Hutt Road roundabout Dowse Interchange link approach and Hutt Road north approach. The Melling interchange would be more complicated with the inclusion of the Melling to Porirua link road. If the Cross Valley link is only constructed between Whites Lines West and Wakefield Street with no connection to the State Highway 2. The Hutt model has predicted few vehicle being attracted to it. The Cross Valley link would need to be connected directly to SH2 at Dowse. This would require the Dowse interchange to be significantly altered Beca Carter Hollings & Ferner Ltd Page 24
27 Table morning peak hour two-way flows on selected links (vph) Network: Direction TT10 TT11 TT31 TT31-I TT41 TT43-F TT43-I Estuary Br Eastbound Westbound Cross Valley Link Br Eastbound Westbound Ewen Br Eastbound Westbound Melling Br Eastbound Westbound Kennedy-Good Br Eastbound Westbound Silverstream Br Eastbound Westbound Petone Interchange (E side) Eastbound Westbound Dowse Interchange (E side) Northbound Southbound SH2 Petone - Dowse Northbound Southbound SH2 Dowse - Melling Northbound Southbound SH2 Melling - Kennedy-Good Northbound Southbound SH2 Kennedy-Good - Manor Park Northbound Southbound SH2 Manor Park - Silverstream Northbound Southbound Note: TT31-F is the flows with the fixed base matrix. TT31-I is the flows with the induced matrix derived from the WTS model with the Option X1 included Beca Carter Hollings & Ferner Ltd Page 25
28 5 Stage II Transport Scenarios Based on the Stage I evaluation of the transport packages and further evaluation of individual projects as discussed in section 3. The following modified options have been developed for the Hutt Corridor. These are outlined below and a full description of the coding assumptions made for each Stage 2 option, by period, for the EMME/2 modelling is shown in Appendix B. It should be noted that the improved Wairarapa rail service has not been modelled as the current model will not reflect the benefits of this improvement. D However, the improved Wairarapa service should in our opinion be included in the improved passenger transport strategy. 5.1 Stage 2 Options R Option S1 This option is a combination of the Stage 1 options H1 +H2 + P2 + P3 modified to remove the ferry service improvements, the Lower Hutt and Western Hill services from the superbus network and Melling Loop and Stokes Valley LRT services. A Option S1 includes the following improvements: Hutt Expressway High Occupancy Toll (HOT) Lane; Melling Grade Separated Interchange; F New rail stations at Timberlea and Cruickshank Road and Heavy Rail Services; and Silverstream Bridge Upgrade to 4 lanes; Haywards Bus Services; Double rail frequency and speed increase of 10%; Superbus network (Upper Hutt, Stokes Valley and Wainuiomata services only). T Option S2 This option is a combination of the Stage 1 options H1 + P4 modified to remove the Eastbourne ferry service improvement and the Lower Hutt and Western Hill services from the superbus network. Option S2 includes the following improvements: Hutt Expressway Bus Lane + existing Bus Lane Services; Melling Grade Separated Interchange; Silverstream Bridge Upgrade to 4 lanes; Haywards Bus Services; Double rail frequency and speed increase of 10%; Beca Carter Hollings & Ferner Ltd Page 26
29 New rail stations at Timberlea and Cruickshank Road and Heavy Rail Services; and Superbus network (Upper Hutt, Stokes Valley and Wainuiomata services only) Option S3 This option is an Option S2 but with the removal of the Hutt Expressway Bus lane and superbus network and inclusion of the Hutt Expressway Tidal Flow lane. DSilverstream Bridge Upgrade to 4 lanes; R Option S3 includes the following improvements: Hutt Expressway Tidal Flow lane; Melling Grade Separated Interchange; Haywards Bus Services; Double rail frequency and speed increase of 10%; and New rail stations at Timberlea and Cruickshank Road and Heavy Rail Services. A Option S4 includes the following improvements: Option S4 Hutt Expressway High Occupancy Toll (HOT) Lane; Melling Grade Separated Interchange; F New rail stations at Timberlea and Cruickshank Road and Heavy Rail Services; T Silverstream Bridge Upgrade to 4 lanes; Haywards Bus Services; Double rail frequency and speed increase of 10%; Superbus network (Upper Hutt, Stokes Valley and Wainuiomata services only); Petone-Grenada Link; and Esplanade Upgrade Option S5 Option S5 includes the following improvements: Hutt Expressway High Occupancy Toll (HOT) Lane; Melling Grade Separated Interchange; Silverstream Bridge Upgrade to 4 lanes; Haywards Bus Services; Double rail frequency and speed increase of 10%; Beca Carter Hollings & Ferner Ltd Page 27
30 New rail stations at Timberlea and Cruickshank Road and Heavy Rail Services; Superbus network (Upper Hutt, Stokes Valley and Wainuiomata services only); Melling Porirua Link Road: and Cross Valley Link: Whites Line West to Wakefield Street; D 4 lane road from Randwick Road to Dowse SH Option S6 Option S6 includes the following improvements: Hutt Expressway High Occupancy Toll (HOT) Lane; R Double rail frequency and speed increase of 10%; A Melling Grade Separated Interchange; Silverstream Bridge Upgrade to 4 lanes; Haywards Bus Services; New rail stations at Timberlea and Cruickshank Road and Heavy Rail Services; Superbus network (Upper Hutt, Stokes Valley and Wainuiomata services only); Petone-Grenada Link; and Cross Valley Link: F 4 lane road from Randwick Road to Dowse SH2 Whites Line West to Wakefield Street; Extend Melling Line across river to CBD 5.2 Option S1 T This option is based on an optional tolling scenario for the Hutt Expressway High Occupancy Toll (HOT) Lane and significantly improved Rail and Bus service. We have corrected the negative way in which the current WTS model, models the benefits of Grade Separated Interchanges. However, the regional model is not designed to model the true benefits of grade separating intersection. We therefore have not included the cost of the proposed Melling Interchange as it incorrectly biases the BCR. A summary of the key performance indicators is provided in Table 4.1. In addition, Table 4.2 provides a comparison of the vehicle and passenger transport flow through the Petone to Ngauranga corridor. Table 4.1 Summary of Key AM Peak Indicator for Option S Beca Carter Hollings & Ferner Ltd Page 28
31 Key Indicator Base Option S1 Percentage Difference Total Motor Vehicle Travel Time (hrs) % Travel Time from Upper Hutt to Airport (hrs) % Total Passenger Travel Time (hrs) % Estimated Cost $54.2M BCR 2.2 D Total Number of Vehicle Trips % Total number of Passenger Transport Trips % Cost of Congestion % Table 4.1 shows that the travel time between Upper Hutt railway station and the Wellington Airport is 15% faster with the HOT lane and the cost of congestion over the regional network has reduced by 11%. R Assuming that this strategy could be constructed in 2 years in a preliminary BCR of 4.1 has been calculated. If the AM benefits for the HOT were only included the preliminary BCR could be expected to reduce to 3.6. The inclusion of the toll revenue in the economic evaluation would reduce the cost and therefore increase the BCR. A Mode Base Option S1 Percentage F Train (Passengers) % T Table 4.2 AM 2-Hour Peak Southbound Trip Distribution through Petone Ngauranga Corridor State Highway 2 (Vehicles) HOT Lane (Vehicles) 1700 Difference Vehicle Passengers % Bus (Passengers) % 13% Total % Table 4.2 shows that Option S1 increases vehicle flow between Petone and Ngauranga by 13% with train passenger flow reducing by 9%. The increased number of bus services and bus speed between Petone and Ngauranga has encouraged a 980% increase in bus passengers. This option with the tolled lane increases the number of vehicle by 13%, but vehicle passengers decrease by 10%. Vehicle passengers seem to be attached to the improved bus service. With this option the total southbound people flow between Petone and Ngauranga has increased by 11%. It is estimated that 400 new car parks would need to be constructed within the Wellington CBD at a cost of $10million Beca Carter Hollings & Ferner Ltd Page 29
32 5.3 Option S2 This option is based on the Hutt Expressway Bus Only Lane and significantly improved Rail and Bus service. A summary of the key performance indicators is provided in Table 4.3. In addition, Table 4.4 provides a comparison of the vehicle and passenger transport flow through the Petone to Ngauranga corridor. D Table 4.3 Summary of Key AM Peak Indicator for Option S2 Key Indicator Base Option S2 Percentage Difference Total Motor Vehicle Travel RTime (hrs) % Total Number of Vehicle Trips % A Travel Time from Upper Hutt to Airport (hrs) % Total Passenger Travel Time (hrs) % Estimated Cost $47.5M BCR 2.1 Total number of Passenger Transport Trips % Cost of Congestion % Table 4.3 shows that the travel time between Upper Hutt railway station and the Wellington Airport is 6% faster with the Hutt Expressway Bus Lane and the cost of congestion over the regional network has reduced by 8%. F Assuming that this strategy could be constructed in 2 years a preliminary BCR of 4.2 has been calculated. If the AM benefits for the Bus only lane were only included the preliminary BCR could be expected to reduce to 3.0. T AM 2-Hour Peak Southbound Trip Distribution through Petone Ngauranga Corridor Table 4.4 Mode Base Option S2 Percentage Difference State Highway 2 (Vehicles) % Vehicle Passengers % Bus (Passengers) % Train (Passengers) % Total % Table 4.4 shows that Option S2 decreases vehicle flow between Petone and Ngauranga by 2% with train passenger flow reducing by 4%. The increased number of bus services and bus speed between Petone and Ngauranga has encouraged a 1400% increase in bus Beca Carter Hollings & Ferner Ltd Page 30
33 passengers. This option increases the total southbound people flow between Petone and Ngauranga by 8%, but carries these people in less vehicles. Under this scenario the model predicts that only some 300 vehicles destined for the CBD are removed on the AM peak two hour period. A detailed analysis for the generalised cost and model split calculation has lead us to believe that the model is underestimating the number of drivers that would transfer to either a bus or train. However the model is predicting that people would be attached to live in the Hutt area because of the improved accessibility. DThis would explain the 8% increase in trips between Petone and Ngauranga in the AM peak period. This option meets the requirements on Objective 1, Theme 1.1 of the RLTS. 5.4 Option S3 R This option is based on Hutt Expressway Tidal Flow Lane and significantly improved Rail and Bus services. A summary of the key performance indicators is provided in Table 4.5. In addition, Table 4.6 provides a comparison of the vehicle and passenger transport flow through the Petone to Ngauranga corridor. ATable 4.5 Key Indicator Base Option S3 Percentage F Summary of Key AM Peak Indicator for Option S3 Difference Total Motor Vehicle Travel Time (hrs) Travel Time from Upper Hutt to Airport (hrs) Total Passenger Travel Time (hrs) Estimated Cost $71.0M BCR 1.9 T Total Number of Vehicle Trips Total number of Passenger Transport Trips Cost of Congestion Table 4.5 shows that the travel time between Upper Hutt railway station and the Wellington Airport is 19% faster with the HOT lane and the cost of congestion over the regional network has reduced by 9%. Assuming that this strategy could be constructed in 2 years and including the estimated $25 million to construct additional car parking the preliminary BCR has been calculated as Beca Carter Hollings & Ferner Ltd Page 31
34 Table 4.6 AM 2-Hour Peak Southbound Trip Distribution through Petone Ngauranga Corridor Mode Base Option S3 Percentage Difference State Highway 2 (Vehicles) % Vehicle Passengers % D Bus (Passengers) % Train (Passengers) % Total % Table 4.6 shows that Option S3 increases vehicle and passenger flow between Petone and Ngauranga by 30% and 22% respectively, with train passenger flow reducing by 5%. The R increased number of bus services and bus speed between Petone and Ngauranga has encouraged a 270% increase in bus passengers. This option would increase the people travelling southbound in the morning peak two hour period by 18%. The performance of the tidal flow lane is lower than the inclusion of the HOT and Bus only lane. A 5.5 Option S4 This option is based on an optional tolling scenario for the Hutt Expressway High Occupancy Toll (HOT) Lane, significantly improved Rail and Bus services plus the Petone to Grenada Link to improve the connection between Hutt FCity and Porirua. A summary of the key performance indicators is provided in Table 4.7. In addition, Table 4.8 provides a comparison of the vehicle and passenger transport flows through the Petone to Ngauranga corridor. Table 4.7 T Key Indicator Base Option S4 Percentage Summary of Key AM Peak Indicator for Option S4 Difference Total Motor Vehicle Travel Time (hrs) Travel Time from Upper Hutt to Airport (hrs) Total Passenger Travel Time (hrs) Estimated Cost $111.5M BCR 1.7 Total Number of Vehicle Trips Total number of Passenger Transport Trips Cost of Congestion Beca Carter Hollings & Ferner Ltd Page 32
35 Table 4.7 shows that the travel time between Upper Hutt railway station and the Wellington Airport is 12% faster with the HOT lane and the cost of congestion over the regional network has reduced by 11%. Assuming that this strategy could be constructed in 3 years a preliminary BCR of 3.1 has been calculated. If the AM benefits for the bus only lane were only included the preliminary BCR could be expected to reduce to 3.0. Table 4.8 DAM 2-Hour Peak Southbound Trip Distribution through Petone Ngauranga Corridor Mode Base Option S4 Percentage Difference State Highway 2 (Vehicles) % HOT Lane (Vehicles) 649 R Vehicle Passengers % Bus (Passengers) % Train (Passengers) % Total % Table 4.8 shows that there is no increase Ain vehicle flow between Petone and Ngauranga, but with 3% increase in vehicle passengers (i.e. Occupancy has increased). Train passenger flow has reduced by 12%. The increased number of bus services and bus speed between Petone and Ngauranga has encouraged a 385% increase in bus passengers. This option would increase the people travelling southbound in the morning two hour period by 18%. F Table 4.9 details the vehicle flow using the Petone to Grenada Link Road. Table 4.9 AM Peak Two Hour Traffic Flow on the Petone to Grenada Link Road Direction Vehicles Car Passengers T Eastbound Porirua to Hutt Westbound Hutt to Porirua The addition of the Petone to Grenada Link Road seems to attract 1050 southbound vehicles (13%) between Petone and Ngauranga. The number of vehicles using the Petone to Grenada link has reduced by some 2000 vehicle as part of this strategy from when modelled as a single improvement in Stage 1 as Option X1. This may explain why the BCR has drop with the inclusion of the strategic link road. Benefits only increased by $81million compared to $148million as a single improvement Beca Carter Hollings & Ferner Ltd Page 33
36 5.6 Option S5 This option is an alternative to Option S4 with Stage 1 Option X2 replacing Option X1. A summary of the key performance indicators is provided in Table In addition, Table 4.11 provides a comparison of the vehicle and passenger transport flow through the Petone to Ngauranga corridor. Table 4.10 D Key Indicator Base Option S5 Percentage Total Motor Vehicle Travel Time (hrs) R Total number of Passenger Transport Trips A Summary of Key AM Peak Indicator for Option S5 Difference Travel Time from Upper Hutt to Airport (hrs) Total Passenger Travel Time (hrs) Estimated Cost $169.7M BCR 1.6 Total Number of Vehicle Trips Cost of Congestion Table 4.10 shows that the travel time between Upper Hutt railway station and the Wellington Airport is 14% faster with the HOT lane and the cost of congestion over the regional network has reduced by 14%. F AM 2-Hour Peak Southbound Trip Distribution through Petone Ngauranga Corridor Mode Base Option S5 Percentage T Table 4.11 State Highway 2 (Vehicles) HOT Lane (Vehicles) 1416 Difference Vehicle Passengers % Bus (Passengers) % Train (Passengers) % Total % 9% Table 4.11 shows that there is a 9% increase in vehicle flow between Petone and Ngauranga, with train passenger flow reducing by 12%. The increased number of bus services and bus speed between Petone and Ngauranga has encouraged a 410% increase in bus passengers. This option increases the total southbound people flow between Petone and Ngauranga by 11%. Table 4.12 details the vehicle flow using the Petone to Grenada Link Road Beca Carter Hollings & Ferner Ltd Page 34
37 Table 4.12 AM Peak Two Hour Traffic Flow on the Melling to Porirua Link Road Direction Vehicles Car Passengers Eastbound Porirua to Hutt Westbound Hutt to Porirua The Dnumber of vehicles using the Melling to Porirua link has reduced by some 300 vehicles as part of this strategy from when modelled as a signal improvement in Stage 1 as Option X2. However, with the inclusion of the Melling to Porirua link plus the Cross Valley link benefits were increased by $164million compared to $155million as a single improvement. R 5.7 Option S6 This option is an alternative to Option S4 with the Petone Esplanade upgrade being replaced by the Cross Valley link and the Melling Rail line extended over the river to improve access to the Hutt CBD. ATable 4.13 F Summary of Key AM Peak Indicator for Option S6 Total Motor Vehicle Travel Time (hrs) T A summary of the key performance indicators is provided in Table In addition, Table 4.14 provides a comparison of the vehicle and passenger transport flow through the Petone to Ngauranga corridor. Key Indicator Base Option S6 Percentage Difference Travel Time from Upper Hutt to Airport (hrs) Total Passenger Travel Time (hrs) Estimated Cost $157.8 BCR 1.6 Total Number of Vehicle Trips Total number of Passenger Transport Trips Cost of Congestion Table 4.13 shows that the travel time between Upper Hutt railway station and the Wellington Airport is 12% faster with the HOT lane and the cost of congestion over the regional network has reduced by 13%. Taking account of the AM benefits only gives an indicative Benefits Cost Ratio (BCR) of approximately 2.0 for this option Beca Carter Hollings & Ferner Ltd Page 35
38 Table 4.14 AM 2-Hour Peak Southbound Trip Distribution through Petone Ngauranga Corridor Mode Base Option S4 Percentage Difference State Highway 2 (Vehicles) D HOT Lane (Vehicles) 672 Vehicle Passengers % Bus (Passengers) % Train (Passengers) % Total % R Table 4.14 shows that there is no change in vehicle flow between Petone and Ngauranga, but vehicle passengers increase by 3%. Train passenger flow reduces by 6%. The increased number of bus services and bus speed between Petone and Ngauranga has encouraged a 404% increase in bus passengers. This option increases the total southbound people flow during the AM Peak period by 11%. A Table 4.15 details the vehicle flow using the Petone to Grenada Link Road. Table 4.15 AM Peak Two Hour Traffic Flow on the Petone to Grenada Link Road Direction Vehicles F Car Passengers The number of vehicles using the Petone to Grenada link has reduced by some 1920 vehicle as part of this strategy from when modelled as a signal improvement Tin Stage 1 as Option X1 and 100 vehicles more than Option S4. The inclusion of the extension of the Melling rail line across the Hutt River to a new Hutt CBD station and the Cross Valley Link with a direct connection to State Highway 2 has increased the benefits for this project from $202 million to $343million. Eastbound Porirua to Hutt Westbound Hutt to Porirua It is our option that the extension of the Melling rail line across the Hutt river with good bus linkage could be a worthwhile project and would seem to have greater benefits than the proposed Melling loop LRT. 0% Beca Carter Hollings & Ferner Ltd Page 36
39 6 Results of Assessment for Stage 2 Options This section presents and comments on the results of the assessments of the Stage 2 options using the PBS methodology. Table 6.1 gives the results for all options and indicators. Table 6.1 D 1. Accessibility Planning Balance Sheet Scores for Stage 2 Options Indicators Options Base S1 S2 S3 S4 S5 S6 Motor Vehicle Statistics Public Transport Statistics Vehicle Travel times to Airport R 5 year cost A 2. Affordability 3. Economic Efficiency Benefit Cost Ratio (BCR) Sustainability F Environment Fuel Safety V/C Ratios T Beca Carter Hollings & Ferner Ltd Page 37
40 7 Conclusion The Regional Land Transport Committee through the Wellington Regional Council have commissioned the Hutt Corridor Plan Study. This corridor links Wairarapa, Hutt Valley, Porirua, Kapiti and Wellington City. This is a multi-modal corridor with highways, major local roads, rail and bus services playing a major role in daily travel patterns. The purpose, scope, objectives and methodology of the Study are set out in the document Hutt Corridor Study Stage 1 Report, March 2002, and this document should be read in conjunction with the Stage 1 report. This document outlines the preliminary strategy that can be confirmed for a Hutt Corridor Plan, as part of the Region s wider transport strategies. Six Stage 2 strategies were developed for the Stage 1 options modelled. Further analysis of the Stage 1 component found the following individual improvements should be analysed as part of a transport strategy for the Hutt Corridor. The transport and infrastructure improvements are: Wairarapa rail service Supers bus network from: Stoke Valley; Upper Hutt; and Wainuiomata to the Wellington CBD Increase rail speed and double rail frequency New Stations at Timberlea and Cruickshank Capacity improvement between Petone and Ngauranga using either: Tidal flow lane; High Occupancy Vehicle Toll lane; or Bus only lane. Melling rail extension across the Hutt River with a new Hutt CBD station. Hutt to Porirua Link on either the: Petone to Grenada link alignment; or Melling to Porirua Link Road alignment. Each Stage two strategy was evaluated around the following core transport improvements: Melling Grade Separated Interchange; Silverstream Bridge Upgrade to 4 lanes; Haywards Bus Services; Double rail frequency and speed increase of 10%; Beca Carter Hollings & Ferner Ltd Page 38
41 New rail stations at Timberlea and Cruickshank Road and improved Heavy Rail Services; and Superbus network (Upper Hutt, Stokes Valley and Wainuiomata services only). Table 7.1 summaries the capital cost, 25 year user benefits and Benefit Cost Ratios for each Stage 2 option. Table 7.1 Stage 2 Benefit Cost Ratios Option Capital Cost 25 Year User Benefits BCR $M $M S S S S S S Based on the planning balance sheet, Strategy Option S2 with the Expressway bus only lane between Petone and Ngauranga seems to be the best overall option. However, we believe that the High Occupancy Vehicle Lane Toll lane between Petone and Ngauranga could provide a better long-term solution, but would need more detailed investigation. The Stage 2 analysis has also identified that the Petone to Grenada link road would require the widening of State Highway 2 between Petone and Dowse Interchanges to six lanes. This would be extremely difficult due to the location of the Cemetery and Petone rail station at Korokoro. The cost of this improvement has not been included, in the capital cost and it would decrease the BCR. It would seem from the analysis that the Melling to Porirua link would be a better option. However, it has been identified through this analysis that if the Cross Valley link is not directly connected to State Highway 2 then this link does not provide the relief to Petone Esplanade and Ewen Bridge that one would expect. Direct connection to State Highway 2 would require the reconstruction of the proposed Dowse grade separated interchange. Option S6 included the extension of the Melling rail line across the Hutt River to a new Station on the edge of the Hutt CBD. The analysis shows that this infrastructure improvement complements the core strategy improvements Beca Carter Hollings & Ferner Ltd Page 39
42 Appendix A Performance indicator test results and indicative BCR for each Stage 1 option
43 Table AM Results (Note: Values are for the period 0700 to 0900) INDICATOR Base H1 H2 H3 P1 P2 P3 P4 X1 X2 X3 X4 X6 X7 ACCESSIBILITY Auto Total motor vehicle travel time (hrs) Total motor vehicle travel distance ('000km) Average vehicle network speed (km/hr) Total auto trips spread from the peak Total vehicle hours below service level D Auto Travel times to Airport (mins): CBD Port Johnsonville to Airport Porirua to Airport Plimerton to Airport Paraparaumu to Airport West External to Airport Lower Hutt to Airport Upper Hutt to Airport East External to Airport Transit Total passenger travel time (hrs) Total passenger travel distance ('000km) Average passenger network speed (km/hr) AFFORDABILITY Strategy Revenue ($) Toll Fare Parking Total ECONOMIC EVALUATION Cross-valley-link-road user benefits Porirua-Hutt-link-road user benefits Non-link-road user benefits Region-wide user benefits SUSTAINABILITY Environment CO2 Emmissions (Tonnes) CO Emmissions (Tonnes) Fuel Fuel Consumption (Litres) Safety Total Accident Cost ($) General Statistics Total Number of motor vehicle trips Total Number of passenger trips Total Number of slow trips Total Number of PT trips Average motor vehicle trip length (km) Cost of Congestion ($) V/C Ratios Melling Bridge (WB) SH2 South of SH58 (SB) Kenn Good Bridge (WB) Randwick Rd (SB) Petone Esplanade (WB) Hutt Rd South of Wakefield (SB) SH2 Petone - Ngauranga (SB) SH1 Ngauranga - Aotea Quay (SB) SH1 Aotea Quay - Ngauranga (NB) HUTT_RESULTS03 summary.xls AM Runs Page 1 1/11/02 12:04
44 Table AM Results - % Difference INDICATOR Base H1 H2 H3 P1b P2 P3 P4 X1 X2 X3 X4 X6 X7 ACCESSIBILITY Auto Total motor vehicle travel time (hrs) % -0.50% -0.36% -1.79% -1.26% -0.39% -2.20% 0.39% 0.36% -0.41% 0.42% -0.29% 0.05% Total motor vehicle travel distance ('000km) % 1.32% 3.97% -0.48% -0.46% -0.16% -0.66% 2.04% 1.58% 1.77% 1.76% 0.16% 0.03% Average vehicle network speed (km/hr) % 1.83% 4.34% 1.33% 0.80% 0.23% 1.58% 1.64% 1.21% 2.19% 1.33% 0.46% -0.02% Total auto trips spread from the peak % % % % % % % % % % % -5.78% -6.25% Total vehicle hours below service level D % 2.29% -4.91% -2.16% -2.98% -0.94% -2.76% 3.28% 0.89% -1.83% -3.30% -0.58% -0.06% Auto Travel times to Airport (mins): CBD % 0.34% 1.10% -0.16% -0.12% -0.02% -0.06% 0.19% 0.14% -0.06% 0.23% -0.06% -0.09% Port % 0.48% 1.78% -0.32% -0.16% -0.08% -0.16% 0.32% 0.16% 0.00% 0.32% -0.08% -0.08% Johnsonville to Airport % 0.20% 0.79% -1.11% -0.95% -0.16% -1.62% -4.48% -1.50% -2.26% -0.55% -0.44% 0.16% Porirua to Airport % -0.56% -1.17% -1.73% -1.48% -0.28% -2.19% 3.21% -1.67% -2.47% 0.19% -0.31% 0.15% Plimerton to Airport % -0.54% -1.13% -1.49% -1.29% -0.26% -1.88% 2.65% -1.34% -1.98% 0.28% -0.28% 0.10% Paraparaumu to Airport % -0.39% -0.85% -1.05% -0.90% -0.18% -1.33% 1.75% -0.88% -1.40% 0.17% -0.18% -0.11% West External to Airport % -0.29% -0.63% -0.80% -0.67% -0.14% -0.99% 1.29% -0.66% -1.04% 0.12% -0.14% -0.12% Lower Hutt to Airport % % % -4.01% -2.72% -0.78% -4.86% -7.63% -0.70% -2.98% -4.22% -0.52% 0.18% Upper Hutt to Airport % % % -3.08% -2.31% -0.87% -3.97% -5.57% -1.25% -3.01% -2.85% -0.33% -0.02% East External to Airport % -4.67% % -1.36% -1.02% -0.42% -1.78% -2.46% -0.51% -1.27% -1.19% -0.08% 0.00% Transit Total passenger travel time (hrs) % -1.85% -4.98% 3.77% 2.47% 2.31% 5.46% -1.38% -1.93% -1.43% -1.21% -0.01% -0.08% Total passenger travel distance ('000km) % -3.19% -6.39% 6.18% 5.40% 2.84% 8.45% -1.97% -3.12% -2.18% -2.04% 0.02% -0.14% Average passenger network speed (km/hr) % -1.80% -2.15% 0.39% 3.43% 0.91% 1.57% -0.78% -1.47% -0.97% -1.01% 0.05% -0.08% AFFORDABILITY Strategy Revenue ($) Toll 0 Fare % -1.54% -4.59% 8.74% 4.94% 1.55% 8.91% -0.89% -1.92% -1.31% -1.18% 0.04% -0.07% Parking % 1.85% 4.54% -1.66% -1.27% -0.44% -2.06% 1.29% 1.03% 0.71% 0.83% -0.05% 0.04% Total % 1.60% 0.91% 2.48% 1.20% 0.35% 2.30% 0.42% -0.14% -0.09% 0.03% -0.01% 0.00% ECONOMIC EVALUATION Cross-valley-link-road user benefits 0 Porirua-Hutt-link-road user benefits 0 Non-link-road user benefits 0 Region-wide user benefits 0 SUSTAINABILITY Environment CO2 Emmissions (Tonnes) % 0.89% 2.22% -1.07% -0.82% -0.26% -1.35% 1.77% 1.25% 0.93% 1.42% -0.06% 0.06% CO Emmissions (Tonnes) % -0.39% -0.14% -1.75% -1.21% -0.38% -2.14% 0.52% 0.43% -0.29% 0.51% -0.28% 0.05% Fuel Fuel Consumption (Litres) % 0.89% 2.22% -1.07% -0.82% -0.26% -1.35% 1.77% 1.25% 0.93% 1.42% -0.06% 0.06% Safety Total Accident Cost ($) % 1.33% -3.96% -0.47% -0.46% -0.14% -0.64% 3.85% 5.09% 5.27% 5.26% 0.28% 0.09% General Statistics Total Number of motor vehicle trips % 0.42% 1.06% -0.48% -0.59% -0.22% -0.72% 0.68% 0.70% 0.63% 0.60% 0.02% 0.02% Total Number of passenger trips % 0.70% 1.33% -0.57% -0.56% -0.22% -0.78% 0.60% 0.59% 0.51% 0.51% 0.03% 0.02% Total Number of slow trips % -0.20% -0.44% -0.45% -0.59% -0.30% -0.70% -0.62% -0.39% -0.53% -0.53% -0.05% -0.03% Total Number of PT trips % -1.30% -2.87% 2.38% 2.57% 1.13% 3.41% -1.25% -1.58% -1.07% -1.09% 0.00% -0.03% Average motor vehicle trip length (km) % 0.90% 2.88% 0.00% 0.12% 0.06% 0.06% 1.35% 0.88% 1.13% 1.16% 0.14% 0.01% Cost of Congestion ($) % -5.39% -8.58% -5.05% -3.10% -0.91% -5.82% -4.71% -2.64% -6.35% -3.86% -0.67% -0.10% V/C Ratios Melling Bridge (WB) % % % -0.62% -2.05% -0.43% -1.45% -2.85% 13.44% % 6.20% 1.03% 0.25% SH2 South of SH58 (SB) % 3.65% 16.07% -0.52% -1.09% -0.93% -0.90% -5.69% % % % 0.71% 0.28% Kenn Good Bridge (WB) % 6.76% 22.01% -0.96% -0.32% 0.43% -0.77% -4.92% 11.66% 4.47% % -0.32% -0.17% Randwick Rd (SB) % 0.09% -2.54% -0.55% -1.59% -0.74% -0.63% 18.68% -6.15% % % 0.19% 0.04% Petone Esplanade (WB) % 9.91% 3.46% -2.09% -1.58% -0.58% -2.42% % % -2.22% -2.57% -0.15% -0.04% Hutt Rd South of Wakefield (SB) % 7.74% 7.01% 3.26% 1.59% 0.70% 3.57% 39.17% % % -5.55% -0.24% -0.01% SH2 Petone - Ngauranga (SB) % -7.88% % -1.35% -0.87% -0.24% -1.61% -5.81% -1.67% -2.18% -2.28% -0.20% 0.02% SH1 Ngauranga - Aotea Quay (SB) % 4.80% 11.01% -1.24% -0.84% -0.20% -1.33% 1.30% 1.66% 1.44% 1.16% 0.00% 0.00% SH1 Aotea Quay - Ngauranga (NB) % 2.87% 5.51% 2.74% 1.81% 0.72% 3.18% 1.05% -0.58% -0.90% -0.33% 0.06% 0.00% HUTT_RESULTS03 summary.xls AM Difference % Page 1 1/11/02 12:05
45 Table AM Results - Actual Difference INDICATOR Base H1 H2 H3 P1 P2 P3 P4 X1 X2 X3 X4 X6 X7 ACCESSIBILITY Auto Total motor vehicle travel time (hrs) Total motor vehicle travel distance ('000km) Average vehicle network speed (km/hr) Total auto trips spread from the peak Total vehicle hours below service level D Auto Travel times to Airport (mins): CBD Port Johnsonville to Airport Porirua to Airport Plimerton to Airport Paraparaumu to Airport West External to Airport Lower Hutt to Airport Upper Hutt to Airport East External to Airport Transit Total passenger travel time (hrs) Total passenger travel distance ('000km) Average passenger network speed (km/hr) AFFORDABILITY Strategy Revenue ($) Toll Fare Parking Total ECONOMIC EVALUATION Cross-valley-link-road user benefits Porirua-Hutt-link-road user benefits Non-link-road user benefits Region-wide user benefits SUSTAINABILITY Environment CO2 Emmissions (Tonnes) CO Emmissions (Tonnes) Fuel Fuel Consumption (Litres) Safety Total Accident Cost ($) General Statistics Total Number of motor vehicle trips Total Number of passenger trips Total Number of slow trips Total Number of PT trips Average motor vehicle trip length (km) Cost of Congestion ($) V/C Ratios Melling Bridge (WB) SH2 South of SH58 (SB) Kenn Good Bridge (WB) Randwick Rd (SB) Petone Esplanade (WB) Hutt Rd South of Wakefield (SB) SH2 Petone - Ngauranga (SB) SH1 Ngauranga - Aotea Quay (SB) SH1 Aotea Quay - Ngauranga (NB) HUTT_RESULTS03 summary.xls AM Difference Page 1 1/11/02 12:06
46 Table IP Results (Note: Values are for the period 0900 to 1600) INDICATOR Base H1 H2 H3 P1 P2 P3 P4 X1 X2 X3 X4 X6 X7 ACCESSIBILITY Auto Total motor vehicle travel time (hrs) Total motor vehicle travel distance ('000km) Average vehicle network speed (km/hr) Total auto trips spread from the peak Total vehicle hours below service level D Auto Travel times to Airport (mins): CBD Port Johnsonville to Airport Porirua to Airport Plimerton to Airport Paraparaumu to Airport West External to Airport Lower Hutt to Airport Upper Hutt to Airport East External to Airport Transit Total passenger travel time (hrs) Total passenger travel distance ('000km) Average passenger network speed (km/hr) AFFORDABILITY Strategy Revenue ($) Toll Fare Parking Total ECONOMIC EVALUATION Cross-valley-link-road user benefits Porirua-Hutt-link-road user benefits Non-link-road user benefits Region-wide user benefits SUSTAINABILITY Environment CO2 Emmissions (Tonnes) CO Emmissions (Tonnes) Fuel Fuel Consumption (Litres) Safety Total Accident Cost ($) General Statistics Total Number of motor vehicle trips Total Number of passenger trips Total Number of slow trips Total Number of PT trips Average motor vehicle trip length (km) Cost of Congestion ($) V/C Ratios Melling Bridge (WB) SH2 South of SH58 (SB) Kenn Good Bridge (WB) Randwick Rd (SB) Petone Esplanade (WB) Hutt Rd South of Wakefield (SB) SH2 Petone - Ngauranga (SB) SH1 Ngauranga - Aotea Quay (SB) SH1 Aotea Quay - Ngauranga (NB) HUTT_RESULTS03 summary.xls IP Runs Page 1 1/11/02 12:07
47 Table IP Results - % Difference INDICATOR Base H1 H2 H3 P1 P2 P3 P4 X1 X2 X3 X4 X6 X7 ACCESSIBILITY Auto Total motor vehicle travel time (hrs) % 0.95% 1.38% 0.18% 0.06% 0.10% 0.14% 1.32% 1.29% 1.42% 1.53% -0.02% -0.06% Total motor vehicle travel distance ('000km) % 0.62% 1.54% 0.19% 0.10% 0.10% 0.17% 1.88% 1.64% 1.74% 1.65% 0.15% -0.18% Average vehicle network speed (km/hr) % -0.32% 0.16% 0.01% 0.04% 0.01% 0.03% 0.55% 0.35% 0.31% 0.12% 0.17% -0.12% Total auto trips spread from the peak % % % % % % % % % % % -7.24% -3.41% Total vehicle hours below service level D % % 19.98% 3.84% 2.46% -0.59% 1.05% -2.85% 11.30% % 19.11% 2.58% -1.47% Auto Travel times to Airport (mins): CBD % 0.08% -0.11% -0.08% 0.16% 0.15% 0.15% 0.08% 0.01% -0.15% -0.01% 0.04% 0.15% Port % 0.10% -0.10% -0.10% 0.10% 0.10% 0.10% 0.10% 0.00% -0.10% 0.00% 0.00% 0.10% Johnsonville to Airport % 0.32% 0.26% 0.13% 0.19% 0.06% 0.19% -0.45% 0.06% -0.19% 0.00% 0.00% 0.00% Porirua to Airport % 0.19% 0.14% 0.05% 0.09% 0.00% 0.14% 0.19% 0.09% -0.05% 0.05% -0.05% 0.00% Plimerton to Airport % 0.15% 0.07% 0.04% 0.07% 0.00% 0.11% 0.11% -0.04% -0.15% -0.04% 0.00% 0.00% Paraparaumu to Airport % 0.10% 0.07% 0.02% 0.05% 0.00% 0.07% 0.07% 0.02% -0.05% 0.00% -0.02% -0.05% West External to Airport % 0.06% 0.05% 0.03% 0.05% 0.02% 0.06% 0.06% 0.02% -0.02% 0.02% 0.00% -0.15% Lower Hutt to Airport % 0.49% 0.38% 0.16% 0.16% 0.05% 0.27% 0.16% 0.16% 0.49% 0.05% 0.00% 0.00% Upper Hutt to Airport % -0.07% 1.26% 0.11% 0.14% 0.04% 0.18% 0.11% 0.00% -0.18% 0.00% 0.00% -0.04% East External to Airport % -0.02% -0.22% 0.02% 0.03% 0.01% 0.04% 0.03% -0.01% -0.05% 0.00% 0.00% -0.02% Transit Total passenger travel time (hrs) % -2.25% -1.19% -0.46% -0.02% 2.92% 3.19% -1.96% -2.16% -1.27% 0.01% 0.03% -0.02% Total passenger travel distance ('000km) % -3.02% -1.56% 0.32% 1.24% 1.33% 2.93% -2.75% -3.57% -2.66% -0.55% 0.05% -0.05% Average passenger network speed (km/hr) % -0.84% -0.58% 0.55% 1.08% -1.24% -0.04% -1.04% -1.69% -1.67% -0.49% 0.02% -0.03% AFFORDABILITY Strategy Revenue ($) Toll 0 Fare % -2.24% -1.04% 1.46% 2.17% 1.44% 3.12% -1.44% -1.89% -0.75% -0.16% 0.02% -0.01% Parking % 0.35% 0.34% 0.07% -0.11% -0.04% -0.13% 0.20% 0.19% 0.07% 0.07% 0.02% 0.02% Total % -0.12% 0.09% 0.32% 0.30% 0.23% 0.46% -0.09% -0.19% -0.08% 0.03% 0.02% 0.01% ECONOMIC EVALUATION Cross-valley-link-road user benefits 0 0 Porirua-Hutt-link-road user benefits 0 0 Non-link-road user benefits 0 0 Region-wide user benefits 0 0 SUSTAINABILITY Environment CO2 Emmissions (Tonnes) % 0.93% 1.42% 0.19% 0.09% 0.10% 0.17% 1.71% 1.43% 1.59% 1.59% 0.06% -0.11% CO Emmissions (Tonnes) % 0.96% 1.38% 0.20% 0.08% 0.10% 0.17% 1.33% 1.34% 1.46% 1.54% 0.00% -0.07% Fuel Fuel Consumption (Litres) % 0.93% 1.42% 0.19% 0.09% 0.10% 0.17% 1.71% 1.43% 1.59% 1.59% 0.06% -0.11% Safety Total Accident Cost ($) % 0.89% -6.37% 0.25% 0.17% 0.14% 0.25% 3.98% 4.85% 5.02% 5.07% 0.18% -0.21% General Statistics Total Number of motor vehicle trips % 0.12% 0.07% -0.16% -0.24% -0.04% -0.25% 0.38% 0.39% 0.37% 0.32% 0.02% 0.01% Total Number of passenger trips % 0.27% 0.40% 0.07% 0.06% 0.06% 0.09% 0.60% 0.55% 0.53% 0.46% 0.02% 0.02% Total Number of slow trips % -0.39% -0.79% -0.28% -0.25% -0.11% -0.37% -1.21% -1.04% -1.15% -1.01% -0.06% -0.03% Total Number of PT trips % -1.07% -0.90% 0.54% 0.87% 0.22% 1.04% -1.37% -1.50% -1.09% -0.79% -0.04% -0.02% Average motor vehicle trip length (km) % 0.50% 1.47% 0.35% 0.34% 0.14% 0.42% 1.50% 1.24% 1.37% 1.33% 0.13% -0.18% Cost of Congestion ($) % 12.46% 20.51% 5.88% 3.95% 2.16% 5.10% -9.26% 5.95% -7.69% 4.66% 1.89% -0.92% V/C Ratios Melling Bridge (WB) % % % 0.48% 0.28% 0.30% 0.46% 2.66% 19.85% % 16.02% 0.39% 0.08% SH2 South of SH58 (SB) % 1.96% 5.68% 0.57% 0.49% 0.51% 0.46% -4.34% % % % 0.53% -0.10% Kenn Good Bridge (WB) % 8.11% 8.68% 0.55% 0.57% 0.48% 0.56% 5.99% 5.08% 6.72% % 0.38% 0.15% Randwick Rd (SB) % -0.92% -2.54% -0.56% -0.55% -0.10% -0.76% -1.75% -4.33% % % -0.06% -0.02% Petone Esplanade (WB) % 6.50% 4.46% -0.92% -1.69% -1.28% -0.83% % % % % -0.68% -1.18% Hutt Rd South of Wakefield (SB) % 13.61% 7.80% 3.45% 2.80% 0.38% 3.87% 41.83% 2.84% -4.61% 2.28% 0.69% 2.52% SH2 Petone - Ngauranga (SB) % % % 2.60% 1.79% 0.74% 2.81% % -2.92% -3.86% -3.00% 0.39% -0.01% SH1 Ngauranga - Aotea Quay (SB) % 3.27% 5.31% 1.44% 0.99% 0.37% 1.50% 1.56% 0.81% 0.34% 0.59% 0.11% 0.03% SH1 Aotea Quay - Ngauranga (NB) % 2.14% 3.56% 0.96% 0.78% 0.37% 1.16% 0.92% 0.43% 0.13% 0.38% 0.07% 0.03% HUTT_RESULTS03 summary.xls IP Difference % Page 1 1/11/02 12:07
48 Table IP Results - Actual Difference INDICATOR Base H1 H2 H3 P1 P2 P3 P4 X1 X2 X3 X4 X6 X7 ACCESSIBILITY Auto Total motor vehicle travel time (hrs) Total motor vehicle travel distance ('000km) Average vehicle network speed (km/hr) Total auto trips spread from the peak Total vehicle hours below service level D Auto Travel times to Airport (mins): CBD Port Johnsonville to Airport Porirua to Airport Plimerton to Airport Paraparaumu to Airport West External to Airport Lower Hutt to Airport Upper Hutt to Airport East External to Airport Transit Total passenger travel time (hrs) Total passenger travel distance ('000km) Average passenger network speed (km/hr) AFFORDABILITY Strategy Revenue ($) Toll 0 Fare Parking Total ECONOMIC EVALUATION Cross-valley-link-road user benefits Porirua-Hutt-link-road user benefits Non-link-road user benefits Region-wide user benefits SUSTAINABILITY Environment CO2 Emmissions (Tonnes) CO Emmissions (Tonnes) Fuel Fuel Consumption (Litres) Safety Total Accident Cost ($) General Statistics Total Number of motor vehicle trips Total Number of passenger trips Total Number of slow trips Total Number of PT trips Average motor vehicle trip length (km) Cost of Congestion ($) V/C Ratios Melling Bridge (WB) SH2 South of SH58 (SB) Kenn Good Bridge (WB) Randwick Rd (SB) Petone Esplanade (WB) Hutt Rd South of Wakefield (SB) SH2 Petone - Ngauranga (SB) SH1 Ngauranga - Aotea Quay (SB) SH1 Aotea Quay - Ngauranga (NB) HUTT_RESULTS03 summary.xls IP Difference Page 1 1/11/02 12:07
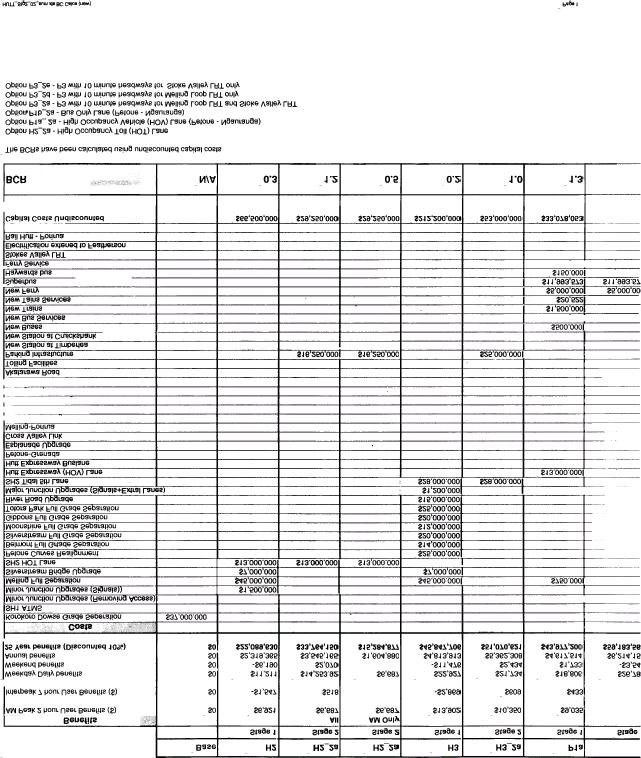
49 Table 5.7 Hutt Corridor - Benefit Cost Calculations (over 25 year evaluation period) Base H1 H2 H2 (AM only) H3 P1 P1 (AM only) P2 P3 P4 X1 X2 X3 X4 X6 X7 Benefits AM Peak 2 hour User Benefits ($) $0 -$1,450 $6,921 $6,921 $13,902 $10,100 $10,100 $8,594 $3,866 $12,824 $14,680 $13,251 $14,083 $12,428 $783 $517 Interpeak 7 hour User Benefits ($) $0 -$4,691 -$1,547 $0 -$2,869 $703 $0 $1,103 $123 $1,527 $13,099 $15,311 $14,003 $12,890 $818 $271 Weekday Daily benefits $0 -$10, $11,211 $6,921 $22,927 $21, $10, $19,063 $7,941 $28, $51,628 $52,531 $51,971 $46,769 $2,957 $1,495 Weekend benefits $0 -$18, $6,190 $0 -$11,476 $2, $0.00 $4,412 $492 $6,108 $52,396 $61,244 $56,012 $51,560 $3,271 $1,085 Annual benefits $0 -$3,735,624 $2,319,365 $1,661,040 $4,813,913 $5,303,350 $2,424,000 $4,839,864 $1,935,319 $7,145,016 $15,534,552 $16,282,008 $15,833,784 $14,318,160 $905,870 $423, Year benefits (Discounted 10%) $0 -$35,578,083 $22,089,630 $15,819,745 $45,847,706 $50,509,102 $23,086,176 $46,094,865 $18,431,980 $68,049,132 $147,951,073 $155,069,844 $150,800,959 $136,366,156 $8,627,510 $4,036,446 Costs Korokoro Dowse Grade Seperation $37,000,000 SH1 ATMS $5,000,000 Minor Junction Upgrades (Removing Access) $500,000 Minor Junction Upgrades (Signals)) $1,500,000 $1,500,000 Melling Full Separation $45,000,000 $45,000,000 $45,000,000 $750,000 $750,000 $45,000,000 Silverstream Bridge Upgrade $7,000,000 $7,000,000 $7,000,000 $7,000,000 SH2 HOT Lane $13,000,000 $13,000,000 Petone Curves Realignment $25,000,000 Belmont full Grade Separation $14,000,000 Silverstream Full Grade Separation $20,000,000 Moonshine Full Grade Separation $12,000,000 Gibbons Full Grade Separation $20,000,000 Totara Park Full grade Separation $25,000,000 River Road Upgrade $15,000,000 Major Junction Upgrades (Signal+extra lanes) $1,200,000 SH2 Tidal 5th Lane $28,000,000 Hutt Expressway Buslane $13,000,000 $13,000,000 $13,000,000 Petone-Grenada $45,000,000 Esplanade Upgrade $22,000,000 Cross Valley Link $45,000,000 Melling-Porirua $80,000,000 $80,000,000 Randwick Melling $45,000,000 Belmont-Porirua $80,000,000 Randwick -Cambridge-KGB $75,000,000 Melling Loop LRT Line $12,000,000 $12,000,000 SH58 $10,000,000 Akatarawa Road $10,000,000 Tolling Facilities New Station at Timberlea $2,000,000 $2,000,000 New Station at Cruickshank $2,000,000 $2,000,000 New Buses $8,250,000 $8,250,000 $750,000 $6,750,000 New Bus Services $61,112 $61,112 $17,838 $54,240 New Trains $5,500,000 $5,500,000 $3,000,000 New Tains Services $61,877 $126,051 $126,051 New Ferry $5,000,000 $5,000,000 $10,000,000 Superbus $11,993,573 $11,993,573 Haywards bus $150,000 $150,000 $150,000 $150,000 Ferry Service $150,000 $150,000 $300,000 Stokes Valley LRT $6,000,000 $6,000,000 Electrification extened to Featherson $5,000,000 $5,000,000 Rail Hutt - Porirua Capital Costs Undiscounted $12,500,000 $66,500,000 $66,500,000 $212,200,000 $39,354,685 $39,354,685 $6,479,715 $32,626,051 $60,380,291 $67,000,000 $125,000,000 $170,000,000 $155,000,000 $10,000,000 $10,000,000 BCR N/A HUTT_RESULTS03 summary.xls BC Calcs (new) Page 1 1/11/02 12:17
50
PROJECT: Wilkinson Road Corridor Improvement Traffic Management Planning Project SUBJECT: Traffic Analysis
 TECHNICAL MEMORANDUM DATE: September 10, 2014 PROJECT 5861.03 NO: PROJECT: Wilkinson Road Corridor Improvement Traffic Management Planning Project SUBJECT: Traffic Analysis TO: Steve Holroyd - District
CITY OF LONDON STRATEGIC MULTI-YEAR BUDGET ADDITIONAL INVESTMENTS BUSINESS CASE # 6
 2016 2019 CITY OF LONDON STRATEGIC MULTI-YEAR BUDGET ADDITIONAL INVESTMENTS BUSINESS CASE # 6 STRATEGIC AREA OF FOCUS: SUB-PRIORITY: STRATEGY: INITIATIVE: INITIATIVE LEAD(S): BUILDING A SUSTAINABLE CITY
Submission to Greater Cambridge City Deal
 What Transport for Cambridge? 2 1 Submission to Greater Cambridge City Deal By Professor Marcial Echenique OBE ScD RIBA RTPI and Jonathan Barker Introduction Cambridge Futures was founded in 1997 as a
Transit City Etobicoke - Finch West LRT
 Delcan Corporation Transit City Etobicoke - Finch West LRT APPENDIX D Microsimulation Traffic Modeling Report March 2010 March 2010 Appendix D CONTENTS 1.0 STUDY CONTEXT... 2 Figure 1 Study Limits... 2
Wellington Transport Strategy Model. TN19.1 Time Period Factors Report Final
 Wellington Transport Strategy Model TN19.1 Time Period Factors Report Final Wellington Transport Strategy Model Time Period Factors Report Final July 2003 prepared for Greater Wellington The Regional Council
Traffic and Toll Revenue Estimates
 The results of WSA s assessment of traffic and toll revenue characteristics of the proposed LBJ (MLs) are presented in this chapter. As discussed in Chapter 1, Alternatives 2 and 6 were selected as the
Post Opening Project Evaluation. M6 Toll
 M6 Toll Five Post Years Opening After Study: Project Summary Evaluation Report Post Opening Project Evaluation M6 Toll Five Years After Study Summary Report October 2009 Document History JOB NUMBER: 5081587/905
Three ULTra Case Studies examples of the performance of the system in three different environments
 Three ULTra Case Studies examples of the performance of the system in three different environments airport application: London Heathrow : linking business and staff car parks through the access tunnel
APPENDIX 6: Transportation Modelling Considerations City of Toronto, February 2014
 APPENDIX 6: Transportation Modelling Considerations City of Toronto, February 2014 Transportation and Infrastructure The future of the elevated Gardiner Expressway east of Jarvis Street forms part of a
STRATEGIC PRIORITIES AND POLICY COMMITTEE MAY 5, 2016
 STRATEGIC PRIORITIES AND POLICY COMMITTEE MAY 5, 2016 Shift Rapid Transit Initiative Largest infrastructure project in the city s history. Rapid Transit initiative will transform London s public transit
The Boston South Station HSIPR Expansion Project Cost-Benefit Analysis. High Speed Intercity Passenger Rail Technical Appendix
 The Boston South Station HSIPR Expansion Project Cost-Benefit Analysis High Speed Intercity Passenger Rail Technical Appendix Prepared by HDR August 5, 2010 The Boston South Station HSIPR Expansion Project
Travel Time Savings Memorandum
 04-05-2018 TABLE OF CONTENTS 1 Background 3 Methodology 3 Inputs and Calculation 3 Assumptions 4 Light Rail Transit (LRT) Travel Times 5 Auto Travel Times 5 Bus Travel Times 6 Findings 7 Generalized Cost
Alternatives Analysis Findings Report
 6.0 This chapter presents estimates of the potential capital, operations and maintenance costs associated with the alternatives carried forward for detailed evaluation. The methodology used to develop
HALTON REGION SUB-MODEL
 WORKING DRAFT GTA P.M. PEAK MODEL Version 2.0 And HALTON REGION SUB-MODEL Documentation & Users' Guide Prepared by Peter Dalton July 2001 Contents 1.0 P.M. Peak Period Model for the GTA... 4 Table 1 -
Challenges in a Post-Katrina Environment East-West Corridor Project Overview February, 2007
 EAST-WEST CORRIDOR Challenges in a Post-Katrina Environment East-West Corridor Project Overview February, 2007 Presentation Agenda Project Overview / Purpose and Need Highway Component Transit Component
The capital cost estimates do not include allowances for: ROW acquisition. Third-party mitigation works. Hazardous materials handling.
 Mode Selection Report 7 Cost Evaluation The cost evaluation criteria used in the evaluation of the transit modes are: Capital cost. operating costs. Fare revenue. Net cost per passenger/passenger-mile.
BROWARD BOULEVARD CORRIDOR TRANSIT STUDY
 BROWARD BOULEVARD CORRIDOR TRANSIT STUDY FM # 42802411201 EXECUTIVE SUMMARY July 2012 GOBROWARD Broward Boulevard Corridor Transit Study FM # 42802411201 Executive Summary Prepared For: Ms. Khalilah Ffrench,
Location Concept Plan Amendment Recommendation Approved 2011 Concept Plan
 Valley Line West LRT Concept Plan Recommended Amendments Lewis Farms LRT Terminus Site Location Concept Plan Amendment Recommendation Approved 2011 Concept Plan Lewis Farms LRT terminus site, 87 Avenue/West
Table of Contents INTRODUCTION... 3 PROJECT STUDY AREA Figure 1 Vicinity Map Study Area... 4 EXISTING CONDITIONS... 5 TRAFFIC OPERATIONS...
 Crosshaven Drive Corridor Study City of Vestavia Hills, Alabama Table of Contents INTRODUCTION... 3 PROJECT STUDY AREA... 3 Figure 1 Vicinity Map Study Area... 4 EXISTING CONDITIONS... 5 TRAFFIC OPERATIONS...
2016/17 ANNUAL MONITORING REPORT ON THE REGIONAL LAND TRANSPORT PLAN NOVEMBER 2017
 2016/17 ANNUAL MONITORING REPORT ON THE REGIONAL LAND TRANSPORT PLAN NOVEMBER 2017 2016/17 Annual Monitoring Report on the Regional Land Transport Plan For more information, contact Greater Wellington
4 COSTS AND OPERATIONS
 4 COSTS AND OPERATIONS 4.1 INTRODUCTION This chapter summarizes the estimated capital and operations and maintenance (O&M) costs for the Modal and High-Speed Train (HST) Alternatives evaluated in this
105 Toronto Street South, Markdale Transportation Impact Study. Paradigm Transportation Solutions Limited
 105 Toronto Street South, Markdale Transportation Impact Study Paradigm Transportation Solutions Limited December 2016 Project Summary Project Number 162060 December 2016 Client Zelinka Priamo Ltd 318
AECOM 30 Leek Cres., 4 th Floor Richmond Hill, ON L4B 4N4 Canada
 \ AECOM 30 Leek Cres., 4 th Floor Richmond Hill, ON L4B 4N4 Canada www.aecom.com 905-882-4401 tel 905-882-4399 fax Memorandum To CC Subject Peter Dorton (MTO), Eric Terro (MTO) Olga Garces (MTO) Page 1
US 81 Bypass of Chickasha Environmental Assessment Public Meeting
 US 81 Bypass of Chickasha Environmental Assessment Public Meeting March 14, 2013 Introductions ODOT FHWA SAIC Meeting Purpose Present need for bypass Provide responses to 10/04/11 public meeting comments
RTID Travel Demand Modeling: Assumptions and Method of Analysis
 RTID Travel Demand Modeling: Assumptions and Method of Analysis Overall Model and Scenario Assumptions The Puget Sound Regional Council s (PSRC) regional travel demand model was used to forecast travel
TORONTO TRANSIT COMMISSION REPORT NO.
 Form Revised: February 2005 TORONTO TRANSIT COMMISSION REPORT NO. MEETING DATE: October 24, 2012 SUBJECT: DOWNTOWN RAPID TRANSIT EXPANSION STUDY (DRTES) PHASE 1 STRATEGIC PLAN ACTION ITEM RECOMMENDATIONS
GTA West Corridor Planning and EA Study Stage 1
 GTA West Corridor Planning and EA Study Stage 1 Draft Development Strategy Presentation to Peel Goods Movement Task Force April 8 2011 Study Areas 2 Unique Approach Unprecedented two-stage EA process:
STH 60 Northern Reliever Route Feasibility Study Report
 #233087 v3 STH 60 Northern Reliever Route Feasibility Study Report Washington County Public Works Committee Meeting September 28, 2016 1 STH 60 Northern Reliever Route Feasibility Study Hartford Area Development
Bi-County Transitway/ Bethesda Station Access Demand Analysis
 Bi-County Transitway/ Bethesda Station Access Demand Analysis Prepared for: Washington Metropolitan Area Transit Authority Office of Planning and Project Development May 2005 Prepared by: in conjunction
IMPROVEMENT CONCEPTS
 IMPROVEMENT CONCEPTS for the South Novato Transit Hub Study Prepared by: January 11, 2010 DKS Associates With Wilbur Smith Associates IMPROVEMENT CONCEPTS Chapter 1: Introduction 1. INTRODUCTION The strategic
TRAFFIC IMPACT STUDY DERRY GREEN CORPORATE BUSINESS PARK MILTON SECONDARY PLAN MODIFICATION
 TRAFFIC IMPACT STUDY DERRY GREEN CORPORATE BUSINESS PARK MILTON SECONDARY PLAN MODIFICATION TRAFFIC IMPACT STUDY DERRY GREEN CORPORATE BUSINESS PARK MILTON SECONDARY PLAN MODIFICATION DECEMBER 24 UPDATED
TIMBERVINE TRANSPORTATION IMPACT STUDY FORT COLLINS, COLORADO JANUARY Prepared for:
 TIMBERVINE TRANSPORTATION IMPACT STUDY FORT COLLINS, COLORADO JANUARY 2014 Prepared for: Hartford Companies 1218 W. Ash Street Suite A Windsor, Co 80550 Prepared by: DELICH ASSOCIATES 2272 Glen Haven Drive
Green Line LRT: Beltline Recommendation Frequently Asked Questions
 Green Line LRT: Beltline Recommendation Frequently Asked Questions June 2017 Quick Facts Administration has evaluated several alignment options that would connect the Green Line in the Beltline to Victoria
Unified Corridor Investment Study DRAFT Step 2 Scenario Analysis Report
 Unified Corridor Investment Study DRAFT Step 2 Scenario Analysis Report REVISIONS 1. Table 39: New Public Investments for Operation and Maintenance Costs 2. Appendix A-10: Passenger Rail Service - Operations
Clean Harbors Canada, Inc.
 Clean Harbors Canada, Inc. Proposed Lambton Landfill Expansion Environmental Assessment Terms of Reference Transportation Assessment St. Clair Township, Ontario September 2009 itrans Consulting Inc. 260
Chapter 4. HS2 Route Capacity and Reliability. Prepared by Christopher Stokes
 Chapter 4 HS2 Route Capacity and Reliability Prepared by Christopher Stokes 4 HS2 ROUTE CAPACITY AND RELIABILITY Prepared by Christopher Stokes 4.1 This chapter relates to the following questions listed
TRAVEL DEMAND FORECASTS
 Jiangxi Ji an Sustainable Urban Transport Project (RRP PRC 45022) TRAVEL DEMAND FORECASTS A. Introduction 1. The purpose of the travel demand forecasts is to assess the impact of the project components
Interstate Operations Study: Fargo-Moorhead Metropolitan Area Simulation Results
 NDSU Dept #2880 PO Box 6050 Fargo, ND 58108-6050 Tel 701-231-8058 Fax 701-231-6265 www.ugpti.org www.atacenter.org Interstate Operations Study: Fargo-Moorhead Metropolitan Area 2025 Simulation Results
Michigan/Grand River Avenue Transportation Study TECHNICAL MEMORANDUM #18 PROJECTED CARBON DIOXIDE (CO 2 ) EMISSIONS
 EMISSIONS") TECHNICAL MEMORANDUM #18 PROJECTED CARBON DIOXIDE (CO 2 ) EMISSIONS Michigan / Grand River Avenue TECHNICAL MEMORANDUM #18 From: URS Consultant Team To: CATA Project Staff and Technical Committee Topic:
TECHNICAL MEMORANDUM #18 PROJECTED CARBON DIOXIDE (CO 2 ) EMISSIONS Michigan / Grand River Avenue TECHNICAL MEMORANDUM #18 From: URS Consultant Team To: CATA Project Staff and Technical Committee Topic:
MEMO VIA . Ms. Amy Roth DPS Director, City of Three Rivers. To:
 MEMO To: Ms. Amy Roth DPS Director, City of Three Rivers VIA EMAIL From: Michael J. Labadie, PE Julie M. Kroll, PE, PTOE Brandon Hayes, PE, P.Eng. Fleis & VandenBrink Date: January 5, 2017 Re: Proposed
RELEASED UNDER THE OFFICIAL INFORMATION ACT 1982
 Subject MINISTERIAL BRIEFING NOTE Rapid Transit in Auckland Date 1 November 2017 Briefing number BRI-1133 Contact(s) for telephone discussion (if required) Name Position Direct line Cell phone 1 st contact
APPENDIX C1 TRAFFIC ANALYSIS DESIGN YEAR TRAFFIC ANALYSIS
 APPENDIX C1 TRAFFIC ANALYSIS DESIGN YEAR TRAFFIC ANALYSIS DESIGN YEAR TRAFFIC ANALYSIS February 2018 Highway & Bridge Project PIN 6754.12 Route 13 Connector Road Chemung County February 2018 Appendix
Introduction and Background Study Purpose
 Introduction and Background The Brent Spence Bridge on I-71/75 across the Ohio River is arguably the single most important piece of transportation infrastructure the Ohio-Kentucky-Indiana (OKI) region.
CITY OF ANN ARBOR, MICHIGAN 301 E. Huron St., P.O. Box 8647 Ann Arbor, Michigan
 Date: Wednesday, June 24, 2014 Location: Ann Arbor District Library Attendees: 40 citizen attendees Ann Arbor Station Environmental Review Public Meeting Meeting Notes Meeting #2 The second public meeting
Metropolitan Freeway System 2013 Congestion Report
 Metropolitan Freeway System 2013 Congestion Report Metro District Office of Operations and Maintenance Regional Transportation Management Center May 2014 Table of Contents PURPOSE AND NEED... 1 INTRODUCTION...
Sound Transit East Link: Bus/LRT System Integration Study
 Sound Transit East Link: Bus/LRT System Integration Study Prepared For: Sound Transit King County Metro Mercer Island WSDOT Prepared By: CH2M HILL July, 2014 1 SOUND TRANSIT EAST LINK: BUS/LRT SYSTEMES
TORONTO TRANSIT COMMISSION REPORT NO.
 Revised: March/13 TORONTO TRANSIT COMMISSION REPORT NO. MEETING DATE: March 26, 2014 SUBJECT: COMMUNITY BUS SERVICES ACTION ITEM RECOMMENDATION It is recommended that the Board not approve any routing
Downtown One Way Street Conversion Technical Feasibility Report
 Downtown One Way Street Conversion Technical Feasibility Report As part of the City s Transportation Master Plan, this report reviews the technical feasibility of the proposed conversion of the current
Policy Note. Vanpools in the Puget Sound Region The case for expanding vanpool programs to move the most people for the least cost.
 Policy Note Vanpools in the Puget Sound Region The case for expanding vanpool programs to move the most people for the least cost Recommendations 1. Saturate vanpool market before expanding other intercity
Operating & Maintenance Cost Results Report
 Operating & Maintenance Cost Results Report Prepared for: Hennepin County Regional Railroad Authority Prepared by: Connetics Transportation Group Under Contract To: Kimley-Horn and Associates FINAL June
Town of Londonderry, New Hampshire NH Route 28 Western Segment Traffic Impact Fee Methodology
 Town of Londonderry, New Hampshire NH Route 28 Western Segment Traffic Impact Fee Methodology Prepared by the Londonderry Community Development Department Planning & Economic Development Division Based
MINERVA PARK SITE TRAFFIC IMPACT STUDY M/I HOMES. September 2, 2015
 5500 New Albany Road Columbus, Ohio 43054 Phone: 614.775.4500 Fax: 614.775.4800 Toll Free: 1-888-775-EMHT emht.com 2015-1008 MINERVA PARK SITE TRAFFIC IMPACT STUDY M/I HOMES September 2, 2015 Engineers
Green Line LRT: Beltline Segment Update April 19, 2017
 Green Line LRT: Beltline Segment Update April 19, 2017 Quick Facts On April 11, 2017, City Council approved Administration s recommendation for the Green Line to be underground in the Beltline from 2 Street
The Engineering Department recommends Council receive this report for information.
 CORPORATE REPORT NO: R161 COUNCIL DATE: July 23, 2018 REGULAR COUNCIL TO: Mayor & Council DATE: July 19, 2018 FROM: General Manager, Engineering FILE: 8740-01 SUBJECT: Surrey Long-Range Rapid Transit Vision
Public Transportation Problems and Solutions in the Historical Center of Quito
 TRANSPORTATION RESEARCH RECORD 1266 205 Public Transportation Problems and Solutions in the Historical Center of Quito JACOB GREENSTEIN, Lours BERGER, AND AMIRAM STRULOV Quito, the capital of Ecuador,
Revision Nº Prepared By Description Date. A Caroline Clear Draft for Client and Peer Review 15 June 2012
 Enforcement Revision History Revision Nº Prepared By Description Date A Caroline Clear Draft for Client and Peer Review 15 June 2012 B Caroline Clear Draft for Client Review 13 September 2012 C Eric Whitfield
Waco Rapid Transit Corridor (RTC) Feasibility Study
 Feasibility Study") Waco Rapid Transit Corridor (RTC) Feasibility Study Chris Evilia, Director of Waco Metropolitan Planning Organization Allen Hunter, General Manager Waco Transit System Jimi Mitchell, Project Manager AECOM
Waco Rapid Transit Corridor (RTC) Feasibility Study Chris Evilia, Director of Waco Metropolitan Planning Organization Allen Hunter, General Manager Waco Transit System Jimi Mitchell, Project Manager AECOM
Broward County Intermodal Center And People Mover. AASHTO Value Engineering Conference Presentation. September 1, 2009 San Diego, CA
 Project Development & Environment Study Broward County Intermodal Center And People Mover AASHTO Value Engineering Conference Presentation September 1, 2009 San Diego, CA Background P D & E Study Regional
Modernising the Great Western railway
 Report by the Comptroller and Auditor General Department for Transport and Network Rail Modernising the Great Western railway HC 781 SESSION 2016-17 9 NOVEMBER 2016 4 Key facts Modernising the Great Western
Subarea Study. Manning Avenue (CSAH 15) Corridor Management and Safety Improvement Project. Final Version 1. Washington County.
 Corridor Management and Safety Improvement Project. Final Version 1. Washington County.") Subarea Study Manning Avenue (CSAH 15) Corridor Management and Safety Improvement Project Final Version 1 Washington County June 12, 214 SRF No. 138141 Table of Contents Introduction... 1 Forecast Methodology
Subarea Study Manning Avenue (CSAH 15) Corridor Management and Safety Improvement Project Final Version 1 Washington County June 12, 214 SRF No. 138141 Table of Contents Introduction... 1 Forecast Methodology
City of Pacific Grove
 Regional Study Utilizing Caltrans Intersection Evaluation Section 7: City of Pacific Grove s: FIRST STREET AT CENTRAL AVENUE Transportation Agency for Monterey County Prepared by Transportation Agency
Metropolitan Freeway System 2007 Congestion Report
 Metropolitan Freeway System 2007 Congestion Report Minnesota Department of Transportation Office of Traffic, Safety and Operations Freeway Operations Section Regional Transportation Management Center March
FINAL. Sound Transit Long-Range Plan Update. Issue Paper S.1: Tacoma Link Integration with Central Link. Prepared for: Sound Transit
 Sound Transit Long-Range Plan Update Issue Paper S.1: Tacoma Link Integration with Central Link Prepared for: Sound Transit Prepared by: Quade & Douglas, Inc. FINAL March 2005 Foreword This issue paper
The major roadways in the study area are State Route 166 and State Route 33, which are shown on Figure 1-1 and described below:
 3.5 TRAFFIC AND CIRCULATION 3.5.1 Existing Conditions 3.5.1.1 Street Network DRAFT ENVIRONMENTAL IMPACT REPORT The major roadways in the study area are State Route 166 and State Route 33, which are shown
Interstate Operations Study: Fargo-Moorhead Metropolitan Area Simulation Output
 NDSU Dept #2880 PO Box 6050 Fargo, ND 58108-6050 Tel 701-231-8058 Fax 701-231-6265 www.ugpti.org www.atacenter.org Interstate Operations Study: Fargo-Moorhead Metropolitan Area 2015 Simulation Output Technical
Error! Reference source not found.
 shown in Error! Reference source not found..5. Four scenarios are shown representing the AM and PM peak periods for the current status quo of traffic and the 2011 projected traffic with all of the public
Proposed location of Camp Parkway Commerce Center. Vicinity map of Camp Parkway Commerce Center Southampton County, VA
 Proposed location of Camp Parkway Commerce Center Vicinity map of Camp Parkway Commerce Center Southampton County, VA Camp Parkway Commerce Center is a proposed distribution and industrial center to be
Fueling Savings: Higher Fuel Economy Standards Result In Big Savings for Consumers
 Fueling Savings: Higher Fuel Economy Standards Result In Big Savings for Consumers Prepared for Consumers Union September 7, 2016 AUTHORS Tyler Comings Avi Allison Frank Ackerman, PhD 485 Massachusetts
M6 TOLL TRAFFIC MONITORING STUDY
 ` M6 TOLL TRAFFIC MONITORING STUDY Traffic Impact Study Report POST OPENING PROJECT EVALUATION M6 TOLL TRAFFIC IMPACT STUDY REPORT JOB NUMBER: 4416515.1525.600 DOCUMENT REF: M6 Toll Traffic Impact Study
RE: A Traffic Impact Statement for a proposed development on Quinpool Road
 James J. Copeland, P.Eng. GRIFFIN transportation group inc. 30 Bonny View Drive Fall River, NS B2T 1R2 May 31, 2018 Ellen O Hara, P.Eng. Project Engineer DesignPoint Engineering & Surveying Ltd. 200 Waterfront
King Street & Wyman Road Transportation Impact Study & Transportation Demand Management. Paradigm Transportation Solutions Limited
 King Street & Wyman Road Transportation Impact Study & Transportation Demand Management Paradigm Transportation Solutions Limited April 28 Project Summary Project Number 822 April 28 Client RISE Commercial
2016 Congestion Report
 2016 Congestion Report Metropolitan Freeway System May 2017 2016 Congestion Report 1 Table of Contents Purpose and Need...3 Introduction...3 Methodology...4 2016 Results...5 Explanation of Percentage Miles
Needs and Community Characteristics
 Needs and Community Characteristics Anticipate Population and Job Growth in the City Strongest density of population and jobs in Ann Arbor are within the Study Area Population expected to grow 8.4% by
Executive Summary. Treasure Valley High Capacity Transit Study Priority Corridor Phase 1 Alternatives Analysis October 13, 2009.
 Treasure Valley High Capacity Transit Study Priority Corridor Phase 1 Alternatives Analysis October 13, 2009 Background As the Treasure Valley continues to grow, high-quality transportation connections
Office of Transportation Bureau of Traffic Management Downtown Parking Meter District Rate Report
 Office of Transportation Bureau of Traffic Management 1997 Downtown Parking Meter District Rate Report Introduction The City operates approximately 5,600 parking meters in the core area of downtown. 1
West Hills Shopping Centre Lowe s Expansion Traffic Impact Study
 West Hills Shopping Centre Lowe s Expansion Traffic Impact Study Prepared for: Armel Corporation January 2015 Paradigm Transportation Solutions Ltd. 22 King Street South, Suite 300 Waterloo ON N2J 1N8
committee report General Permitted Development Order SPT response to consultation
 committee report General Permitted Development Order SPT response to consultation Committee Strategy and Programmes Date of meeting 24 June 2011 Date of report 1 June 2011 Report by Assistant Chief Executive
LAWRENCE TRANSIT CENTER LOCATION ANALYSIS 9 TH STREET & ROCKLEDGE ROAD / 21 ST STREET & IOWA STREET LAWRENCE, KANSAS
 LAWRENCE TRANSIT CENTER LOCATION ANALYSIS 9 TH STREET & ROCKLEDGE ROAD / 21 ST STREET & IOWA STREET LAWRENCE, KANSAS TRAFFIC IMPACT STUDY FEBRUARY 214 OA Project No. 213-542 TABLE OF CONTENTS 1. INTRODUCTION...
IH 45 (GULF FWY) IH 10 (Katy Fwy) to IH 610 S (South Loop) 2010 Rank: Rank: 12
 IH 10 (Katy Fwy) to IH 610 S (South Loop) 2010 Rank: Rank: 12") Mobility Investment Priorities Project Houston IH 45 IH 45 (GULF FWY) IH 10 (Katy Fwy) to IH 610 S (South Loop) Current Conditions From IH 10 to IH 610 south, IH 45 is a 6- to 9-lane facility with three
Mobility Investment Priorities Project Houston IH 45 IH 45 (GULF FWY) IH 10 (Katy Fwy) to IH 610 S (South Loop) Current Conditions From IH 10 to IH 610 south, IH 45 is a 6- to 9-lane facility with three
Sustainable Urban Transport Index (SUTI)
") Sustainable Urban Transport Index (SUTI) City Comparisons & Way Forward PROF. H.M SHIVANAND SWAMY, CEPT UNIVERSITY DHAKA SEPTEMBER 12, 2018 Purpose Discussion of Results from 5 Cities Reflections on the
Sustainable Urban Transport Index (SUTI) City Comparisons & Way Forward PROF. H.M SHIVANAND SWAMY, CEPT UNIVERSITY DHAKA SEPTEMBER 12, 2018 Purpose Discussion of Results from 5 Cities Reflections on the
Appendix B CTA Transit Data Supporting Documentation
 RED ED-PURPLE BYPASS PROJECT ENVIRONMENTAL ASSESSMENT AND SECTION 4(F) EVALUATION Appendix B CTA Transit Data Supporting Documentation 4( Memorandum Date: May 14, 2015 Subject: Chicago Transit Authority
TORONTO TRANSIT COMMISSION REPORT NO.
 Form Revised: February 2005 TORONTO TRANSIT COMMISSION REPORT NO. MEETING DATE: May 28, 2009 SUBJECT: DON MILLS STATION ACTION ITEM RECOMMENDATIONS It is recommended that the Commission: 1. Endorse the
TRAFFIC IMPACT ANALYSIS
 TRAFFIC IMPACT ANALYSIS Emerald Isle Commercial Development Prepared by SEPI Engineering & Construction Prepared for Ark Consulting Group, PLLC March 2016 I. Executive Summary A. Site Location The Emerald
ENVIRONMENTAL IMPACT STATEMENT
 RED HILL MINING LEASE ENVIRONMENTAL IMPACT STATEMENT Section 14 Transport Section 14 Transport 14.1 Description of Environmental Values This section of the Red Hill Mining Lease Environmental Impact Statement
Draft Results and Open House
 Waco Rapid Transit Corridor (RTC) Feasibility Study Draft Results and Open House Chris Evilia, Director of Waco Metropolitan Planning Organization Allen Hunter, General Manager Waco Transit System Jimi
Appendix 4. HS2 Route Capacity and Reliability. Prepared by Christopher Stokes
 Appendix 4 HS2 Route Capacity and Reliability Prepared by Christopher Stokes 4 HS2 ROUTE CAPACITY AND RELIABILITY Prepared by Christopher Stokes Introduction 4.1 This appendix considers the planned utilisation
Parks and Transportation System Development Charge Methodology
 City of Sandy Parks and Transportation System Development Charge Methodology March, 2016 Background In order to implement a City Council goal the City of Sandy engaged FCS Group in January of 2015 to update
Craigieburn Employment Precinct North and English Street
 Craigieburn Employment Precinct North and English Street METROPOLITAN PLANNING AUTHORITY Intersection Analyses 7 February 2014 Intersection Analyses Craigieburn Employment Precinct North and English Street
Draft Results and Recommendations
 Waco Rapid Transit Corridor (RTC) Feasibility Study Draft Results and Recommendations Chris Evilia, Director of Waco Metropolitan Planning Organization Allen Hunter, General Manager Waco Transit System
Baddow Road Bus Gate Frequently Asked Questions May 2018
 Baddow Road Bus Gate Frequently Asked Questions May 2018 Contents page Key Information: 1. What is the Bus Gate? 2. Why is it being proposed? 3. What alternatives have been considered? 4. What are the
6. Strategic Screenlines
 6. Strategic Screenlines Introduction 6.1 Previous sections in this report have presented changes in traffic flows at individual count locations. Some of these count locations have also been grouped into
4.0 TIER 2 ALTERNATIVES
 4.0 TIER 2 ALTERNATIVES The Tier 2 Alternatives represent the highest performing Tier 1 Alternatives. The purpose of the Tier 2 Screening was to identify the LPA utilizing a more robust list of evaluation
Downtown Lee s Summit Parking Study
 Downtown Lee s Summit Parking Study As part of the Downtown Lee s Summit Master Plan, a downtown parking and traffic study was completed by TranSystems Corporation in November 2003. The parking analysis
King County Metro. Columbia Street Transit Priority Improvements Alternative Analysis. Downtown Southend Transit Study. May 2014.
 King County Metro Columbia Street Transit Priority Improvements Alternative Analysis Downtown Southend Transit Study May 2014 Parametrix Table of Contents Introduction... 1 Methodology... 1 Study Area...
DEVELOPMENT OF RIDERSHIP FORECASTS FOR THE SAN BERNARDINO INFRASTRUCTURE IMPROVEMENT STUDY
 APPENDIX 1 DEVELOPMENT OF RIDERSHIP FORECASTS FOR THE SAN BERNARDINO INFRASTRUCTURE IMPROVEMENT STUDY INTRODUCTION: This Appendix presents a general description of the analysis method used in forecasting
V. DEVELOPMENT OF CONCEPTS
 Martin Luther King, Jr. Drive Extension FINAL Feasibility Study Page 9 V. DEVELOPMENT OF CONCEPTS Throughout the study process several alternative alignments were developed and eliminated. Initial discussion
Wellington Transport Strategy Model. Validation Report Final
 Wellington Transport Strategy Model Validation Report Final Wellington Transport Strategy Model Validation Report Final February 24 prepared for Greater Wellington The Regional Council By Beca Carter Hollings
To: File From: Adrian Soo, P. Eng. Markham, ON File: Date: August 18, 2015
 Memo To: From: Adrian Soo, P. Eng. Markham, ON : 165620021 Date: Reference: E.C. Row Expressway, Dominion Boulevard Interchange, Dougall Avenue Interchange, and Howard 1. Review of Interchange Geometry
MEMORANDUM. Figure 1. Roundabout Interchange under Alternative D
 MEMORANDUM Date: To: Liz Diamond, Dokken Engineering From: Subject: Dave Stanek, Fehr & Peers Western Placerville Interchanges 2045 Analysis RS08-2639 Fehr & Peers has completed a transportation analysis
5. OPPORTUNITIES AND NEXT STEPS
 5. OPPORTUNITIES AND NEXT STEPS When the METRO Green Line LRT begins operating in mid-2014, a strong emphasis will be placed on providing frequent connecting bus service with Green Line trains. Bus hours