Republic of Turkey. Traffic Demand Management of Historical Area in Istanbul (İSTDM) Final Report Vol.2
|
|
|
- Emil Gallagher
- 5 years ago
- Views:
Transcription
1 Republic of Turkey Transport Department of Istanbul Metropolitan Municipality Republic of Turkey Traffic Demand Management of Historical Area in Istanbul (İSTDM) Final Report Vol.2 July, 2014 JAPAN INTERNATIONAL COOPERATION AGENCY(JICA) ALMEC Corporation PADECO Co., Ltd. EI JR
2 Republic of Turkey Transport Department of Istanbul Metropolitan Municipality Republic of Turkey Traffic Demand Management of Historical Area in Istanbul (İSTDM) Final Report Vol.2 July, 2014 JAPAN INTERNATIONAL COOPERATION AGENCY(JICA) ALMEC Corporation PADECO Co., Ltd.
3 The exchange rate used in the report is: US$ 1 = TRY 1.90
4 Table of Contents 1. Characteristics of the Study Area 1.1 Socio-economic Characteristics Land Use Conditions Transport Infrastructure and Facilities Transport Projects Transport Demand Changes by Rail-Transit Development 2.1 Transport Demand Structure in the Historical Area Passenger Flow before/ after Rail Transit Opening Modal conversion caused by the Marmaray and User Behaviors of Marmaray Potential Demand of Rail Urgent improvement plan of Yenikapi Station and Sirkeci Station and the walker facilities in the outskirts 3.1 Passenger Flows at Yenikapi and Sirkeci Station Current Situation and Issues of Pedestrian Facilities Improvement Plans for Around Yenikapi Station Suggestions on Improvement at/around the Sirkeci Station Urgent Projects for Bus Rerouting in the Historical Area 4.1 Demand Changes of Bus Routes in the Historical Area Issues of Current Bus Lines and Bus Rerouting Proposal Effect of Bus Rerouting Next Step 5.1 General Planning Issues for Next Step Expected Continuous Project for Next Step Appendices Appendix-1 Current Bus Route in the Historical Area as of December, 2013 Appendix-2 Marmaray Passenger Interview Survey Appendix-3 3D Simulations for Yenikapi Station Area Recommendations
5 Figures and Tables Figure 1.1 Population Change in the Historical Peninsula Figure 1.2 Trend in Museum Visitors in the Historical Peninsula Figure 1.3 Hotel Facilities in the Historical Peninsula Figure 1.4 Passenger Growth at Istanbul Airports Figure 1.5 Topography and UNESCO World Heritage Sites Figure 1.6 Existing Land Use Figure 1.7 Road Area Ratios among Major Cities in the World Figure 1.8 Hierarchical Road Network in the Historical Peninsula Figure 1.9 Distribution of Parking Sites in the Historical Peninsula Figure 1.10 The Number of Parking Facilities by Size Figure 1.11 The Number of Parking Facilities by Type Figure 1.12 Urban Rail Lines in the Historical Peninsula Figure 1.13 Alignment of Eurasia Tunnel Project Figure 1.14 Traffic Calming Measures in the Historical Peninsula Figure 2.1 Trip Production and Attraction by Purpose (day and peak time) Figure 2.2 Desired Line (Public Transportation) Figure 2.3 Demand Structure of Historical Area Figure 2.4 Trip Pattern of Public Transport before Opening of Marmaray Figure 2.5 Changes by Rail Transit Development (by Transit Assignment) after Marmaray and Taksim Line (M2) Extension Figure 2.6 Trend in the Number of Passengers on Airport Line (M1) in the Historical Area Figure 2.7 Trend in the Number of Passengers in M1 Aksaray Station Figure 2.8 Trend in the Number of Passengers on MetroBus in the Historical Area Figure 2.9 Trend in the Number of Passengers on Tramway (T1) in the Historical Area Figure 2.10 Trend in the Number of Passengers in T1 Aksaray Station Figure 2.11 Trend in the Number of Passengers on Buses (excluding MetroBus) in the Historical Area Figure 2.12 Trend in the Number of Passengers at Eminönü Ferry Terminal Figure 2.13 Trend in the Number of Passengers at Yenikapı Ferry Terminal Figure 2.14 Number of Boarding Passengers at Each Marmaray Station and Volume of Passengers Carried between Stations (Transit Assignment Result of Present Case) Figure 2.15 Changes by Rail Transit Development (by Transit Assignment) after Marmaray, Taksim Line (M2) Extension and Airport Line (M1) Extension Figure 2.16 Mode Converted to Marmaray Figure 2.17 Origin -District Figure 2.18 Destination -District Figure 2.19 Frequency of Using Marmaray Figure 2.20 Reason of Using Marmaray Figure 2.21 Travel Cost Saving (Before-After Marmaray Usage)
6 Figure 2.22 Travel Time Saving (Before- After Marmaray Usage) Figure 2.23 Access Mode Figure 2.24 Egress Mode Figure 2.25 Reasons not Using Marmaray Figure 3.1 Passenger Flow in and around Yenikapi Station before and after Airport Line (M1) Extension Figure 3.2 Passenger Flow in and around Sirkeci Station before and after Airport Line (M1) Extension Figure 3.3 Situations around Yenikapi Station Figure 3.4 Railway Stations around Yenikapi Station Figure 3.5 Construction of LRT Yenikapi Station Figure 3.6 Information Board of Istanbul Archeological Museum Figure 3.7 Bus Terminal near the IDO Ferry Terminal Figure 3.8 Road Crossing around Aksaray Station of Tramvay Figure 3.9 Under Pass and Pedestrian Bridge around the Aksaray Station of Tramvay Figure 3.10 Pedestrian ways connecting Yenikapi Station and Aksaray Station Figure 3.11 Two-dimensional Diagram of Yenikapi Station Figure 3.12 Bus Stop under the U-tern Bridge Figure 3.13 Bus Stop and Taxi Stand of Yenikapi Station Figure 3.14 Transfer Information Board Figure 3.15 Taxis parked at bus stops illegally, and peoples waiting for a traffic light Figure 3.16 Sirkeci Station Area Figure 3.17 Sirkeci Station Figure 3.18 Harem Car Pire Figure 3.19 Sirkeci staion of Tramvey Figure 3.20 Re-constructed Building Figure 3.21 Pedestrian crossing near Sirkeci station Figure 3.22 Pedestrian Bridge and Tramvey around Sirkeci Station Area Figure 3.23 Classification of Transport Related Transfer Facility Figure 3.24 Structure of Transfer Facility Figure 3.25 Image Figure near Aksaray Station Figure 3.26 Improvement Plan of sidewalk between Aksaway station and Yenikapi Station Figure 3.27 Underground mall near Aksaray Station Figure 3.28 Pedestrianized Street connected to underground mall Figure 3.29 Congested Road and Intersection Figure 3.30 Vehicle Stopping Barrier Figure 3.31 Vehicle Stopping Barrier in other area Figure 3.32 Concept of Road Space Figure 3.33 Metro Line connected with Aksaray Station and Yenikapi Station Figure 3.34 Function of Station Plaza Figure 3.35 Conceptual image
7 Figure 3.36 Improvement of station plaza of Yenikapi station (Proposal) Figure 3.37 Zoning Pattern 1 of Station Plaza Figure 3.38 Location of the Building at the East-South Edge Surrounded by Fence Figure 3.39 Zoning Pattern 2 of Station Plaza Figure 3.40 Vehicle Curving Track in the Case of Japanese Taxi Figure 3.41 Suggestion of More Bus Usage (1) Figure 3.42 Suggestion of More Bus Usage (2) Figure 3.43 Bus Usage Plan (Upper: Single Queue, Lower: Double Queues) Figure 3.44 Existing Conditions of the North Side Road Figure 3.45 Comparison of Existing Bus Stop with Bus Time Table in Istanbul with Greenery Bus Stop with Bus Waiting Time Board Figure 3.46 Unique Bus Stop Design at Curitiba, Brazil Figure 3.47 Plan of Archeological Museum and Underground Parking Figure 3.48 Archeological Museum Site (planned) and Pedestrian Bridge Figure 3.50 Integrated Railway Station Building and Bus Terminal (Sapporo City, Japan) Figure 3.49 Integrated Subway Station and Bus Terminal (Nagoya City, Japan) Figure 3.51 Separated Locations of Taxi and Bus Stops (Kawasaki City in Kanagawa Pref.) Figure 3.52 Taxi Stops with Roofs Solar Panel Figure 3.53 Road Pavement with Solar Panels Figure 3.54 Explanation panel of Environmentally Friendly Design of Station Plaza (Kawasaki Station of Kawasaki City) Figure 3.55 Environment friendly devices with greenery Figure 3.56 Environment friendly spaces with Flower beds Figure 3.57 Habima Square, Tel Aviv, Israel Figure 3.58 Narrow Pedestrian Bridge crossing over Ataturk Highway with heavy traffic Figure 3.59 New Entrance of the Station at the Southeast Corner Figure 3.60 A Ramp Approach to the New Wider Bridge Figure 3.61 Pedestrian Bridge crossing Kennedy Road connecting with IDO Terminal Figure 3.62 Planned Pedestrian Bridge over Kennedy Road Figure 3.63 Connection of Pedestrian Road and Bridge between Yenikapi Station and IDO Terminal Figure 3.64 Three Points for planning of Pedestrian Bridge Figure 3.65 A Conceptual Design of Pedestrian Deck Figure 3.66 Example of Exclusive Pedestrian Bridge (German, Berlin City) Figure 3.67 Example of Pedestrian Bridge (London) Figure 3.68 Example of Pedestrian Bridge (PORTUGAL, Coimbra city) Figure 3.69 Examples of Pedestrian Bridges attached to Stations (JAPAN) Figure 3.70 Example of Pedestrian Bridges (GERMAN, Stuugart) Figure 3.71 Example of Pedestrian Bridges (SPAIN, Campo Volantin) Figure 3.72 Example of Large Scale Pedestrian Bridge (JAPAN, Shin-Yokohama Station)
8 Figure 3.73 Example of Illumination Systems (some stations in JAPAN) Figure 3.74 Example of Open Space with LED Lighting System (London) Figure 3.75 Example of Setting of Urban Furniture Figure 3.76 Examples of Creation of Urban Amenities at Railway Stations (JAPAN) Figure 3.77 Example of Visibly Understandable Map-Boards (London) Figure 4.1 Trend in the Number of Passengers at Yenikapı Bus Terminal Figure 4.2 Trend in the Number of Passengers at Eminönü Bus Terminal Figure 4.3 Bus Lines with Increasing Ratio of Passengers to All Bus Lines after Opening of Marmaray (and Extension of M2) Figure 4.4 Bus Lines with Decreasing Ratio of Passengers to All Bus Lines after Opening of Marmaray (and Extension of M2) Figure 4.5 Proposed Bus Lines for Rerouting (Eminönü Terminal-Based Lines) Figure 4.6 Proposed Bus Lines for Rerouting (Aksaray Terminal-Based Lines) Figure 4.7 Proposed Bus Lines for Rerouting (Beyazıt Terminal-Based Lines) Figure 4.8 Changes by Rail Transit Development (by Transit Assignment) after Bus Rerouting (and Airport Line (M1) Extension) Figure 4.9 Passenger Flow in and around Yenikapı and Sirkeci Stations after Bus Line Rerouting (and Airport Line (M1) Extension) Table 1.1 Population Change in the Historical Peninsula Table 1.2 Transport Nodes in the Historical Peninsula Table 1.3 Roads and Transport Lands in the Historical Peninsula Table 1.4 Summary of Parking Facilities in the Historical Peninsula Table 1.5 Representative Traffic Calming Projects in the Historical Peninsula Table 2.1 Changes in the Number of Passengers on Major Modes before and after Opening of Marmaray (and Extension of M2) Table 2.2 Comparison between Transit Assignment Result and Statistical Data (No. of Boarding Passengers at Each Marmaray Station) Table 2.3 Changes in the Number of Passengers on Major Modes before and after Airport Line (M1) Extension Table 2.4 Mode converted to Marmaray Table 2.5 Current and Future Production trips by mode ( 000 Trips/ day) Table 4.1 Proposed List of Bus Lines for Rerouting Table 4.2 Changes in the Number of Passengers on Major Modes before and after Rerouting of Bus Lines4-7 Table 4.3 Expected Benefit Brought by Bus Line Rerouting
9 List of Abbreviations Bimtaş CP İDO İETT IMM IMP İSBAK İSPARK Istanbul Ulaşım İSTDM IUAP JCC JICA Otobüs PDM PO TDM UKOME UNESCO UTK Bosphorus Construction Consulting Company Counterpart Istanbul Sea Bus Company IETT General Directorate Istanbul Electric, Tram and Tunnel Authority Istanbul Metropolitan Municipality Metropolitan Planning and Urban Design Center Istanbul Transportation Maintenance Company Istanbul Parking Trade company Istanbul Transportation Company Istanbul TDM Management Project Istanbul Ulaşım Ana Plani Istanbul Transport Master Plan Joint Coordination Committee Japan International Cooperation Agency Public Bus Project Design Matrix Plan of Operation Traffic Demand Management Coordination of Transportation Department United Nations Educational, Scientific and Cultural Organization Transportation Traffic Management Board
10 1. Characteristics of the Study Area 1.1 Socio-economic Characteristics (1) Nighttime Population The Historical Peninsula of Istanbul is allowed to discuss its population in a long range of 2,000 years. In the light of widespread vehicular traffic in the peninsula, however, recent 50 years duration is mostly meaningful for analysis. At a glance, the district population reached a peak in 1975 and then it has shown a downward trend. The 2012 population was 428,857, decreased by 32 percent from 1975 while the downward trend has become slow in recent years. Area-wisely, Eminönü has drastically decreased its population by around 60 percent since On the other hand, it is observed that Fatih has decreased its population by around 20 percent during the same period. The population density of the Historical Peninsula was 275 inhabitants per hectare, still showing a densely inhabited feature. Since there are many one-person households, an average household scale is 3.2 persons. While the population of Istanbul increased from 2.3 million in 1965 to 14.2 million in 2012, the share of the Historical Peninsula adversely decreased from 21% in 1965 to 3.4% in 2012, respectively. In the future, downward trend of population is likely to continue without urban redevelopment for massive residential units. 700, , , , , , , EMINONU FATIH Historical Peninsula Figure 1.1 Population Change in the Historical Peninsula Table 1.1 Population Change in the Historical Peninsula EMINONU 137, , ,126 92,672 74,037 83,444 65,256 55, FATIH 344, , , , , , , , Historical 482, , , , , , , , , ,857 Peninsula Source: Population Census and others 1-1
11 (2) Employment The magnitude of employment in the Historical Peninsula was 287 thousand in Contrary to nighttime population, Eminönü (171 thousand) had larger employment than Fatih (116 thousand). The peninsula provided many employment opportunities for wholesale, retail sale and manufacturing in terms of industry type. The areas of Sultanamet and Grand Bazaar had large employment. Compared with Istanbul s employment scale, i.e million in 2005, the peninsula accounted for 7.4 percent of the city total. Historically, the peninsula s employment scale shrank like nighttime population. Between 1996 and 2005, the peninsula experienced a decrease rate of 36 percent from the situation where 446 thousand worked in (3) Tourist The trend in the tourists to the Historical Peninsula is analyzed based on the statistical data of museums which require admission fees. Among them, the most popular museums are Topkapı Museum and Hagia Sophia Museum located in the Sultanahmet Archaeology Park. In 2010, they received 3.59 million visitors and 2.95 million visitors, respectively. Notably, the statistics show sharp growth rates of the two museums. In 2002, they received more or less 1.1 million visitors and thus the number of visitors increased by three times until Although the Historical Peninsula is a world-wide famous tourism destination, recent tourist increase is remarkable. 4,000,000 3,500,000 3,000,000 2,500,000 2,000,000 1,500,000 1,000, , Topkapi Palaca Museum Hagia Sophia Museum Archipelagical Museum Basilica Sitern Museum Turkish Islamic Art Museum Kariye Museum Source: Istanbul Historical Peninsula Site Management Plan 2011 Figure 1.2 Trend in Museum Visitors in the Historical Peninsula Hotels are intensively located in the Historical Peninsula. As of 2009, 182 hotel facilities with 20,916 beds were reported. The accumulated hotels account for 49 percent in terms of facilities as well as 34 percent in terms of beds. Five-star and four-star hotels are observed around the Sultanahmet Archaeology Park and along Ordu Street. Many other-class hotels are observed at Laleli and Sirkeci. Regardless of class, hotels are concentrated in Eminönü where the capacity of hotel facilities is expanding in line with increased tourist arrivals. Since the district has a population of around 40 thousand, the difference between the numbers of hotel stayers and residents becomes narrow. 1-2
12 No. of Facilities Five-Star Hotel Four-Star Hotel Three-Star Hotel One or Two- Star Hotels Others No of Beds (4) Airport Passengers Source: Istanbul Historical Peninsula Site Management Plan 2011 Figure 1.3 Hotel Facilities in the Historical Peninsula Increased people movement is not limited to the Historical Peninsula. It is a phenomenon of the Istanbul Metropolis in an accelerated pace. For instance, the European gateway of Ataturk Airport has sharply increased its patronage by over three times, i.e. from 11.4 million in 2002 to 51.3 million in International flight passengers of which have a share of 67 percent. The Asian gateway of Sabiha Gökçen Airport started its operation in 2003 and handled 18.6 million passengers in 2013 with less international flight passengers (36 percent). The central government as well as IMM has made continuous efforts for tourism development as an important pillar of city economy, resulting in accelerating tourist arrivals. However, the Historical Peninsula is not spacious to receive unlimited numbers. There is a danger to give negative impact to the traffic environment due to saturated and outgrown tourist movement Ataturk Sabina Gokcen Unit: Million Passengers Source:General Directorate of State Airports Authority Figure 1.4 Passenger Growth at Istanbul Airports 1-3

13 1.2 Land Use Conditions (1) Topography and UNESCO World Heritage Sites The topographic characteristics of the Historical Peninsula lie on a combination of three seas and seven hills. It is surrounded by three unique waters, the Marmara Sea, the Golden Horn Bay and the Bosphorus Strait, providing different peninsula views. Seven hills, ranging from 55 to 65 meters at each hilltop, are scenic landmarks of the peninsula. It is a walled city with a long fortified wall of 6,650 meters. There are some historical walled cities listed on the UNESCO World Heritage such as Vienna in Austria (371 ha) and Lahore in Pakistan (256 ha). The Historical Peninsula has the largest inside space as a historical walled city. In 1985, four sites were listed in the UNESCO World Heritage, covering Sultanahmet Archeological Park, Süleymaniye Mosque and its associated area, Zeyrek Mosque and its associated area and the Land Walls which amount to 678 hectare. The Historical Peninsula is composed of the Land Walls and inside lands, 1,562 hectare in total. In 2010, the Directorate of Istanbul Natural and Cultural Sites Management set the Site Management Plan Area which adds the buffer zone (548 ha) to the Historical Peninsula. Subsequently, it was approved by the Ministry of Culture and Tourism. Source:Istanbul Historical Peninsula Site Management Plan Figure 1.5 Topography and UNESCO World Heritage Sites 1-4
, greenery and cemetery (10%) and commercial (7%).")
14 (2) Land Use Although the largest land use is residential use in the Historical Peninsula, its share is modestly around 30 percent even including mixed residential use with commercial and others. Other major land uses are roads and park (29%), greenery and cemetery (10%) and commercial (7%). As a unique feature of the peninsula, education, religion, culture and medical care are important land use categories with considerably allocated lands. However, dedicate lands for manufacturing are marginal. Source:Istanbul Historical Peninsula Site Management Plan Figure 1.6 Existing Land Use 1.3 Transport Infrastructure and Facilities (1) Transport Node There are seven transport nodes of different public transport routes and means in the Historical Peninsula. The table below shows available transport services at every node. Topkapı is located at the fringe of the Land Walls where abundant land is available. Previously, Yenikapı had ferry terminal and TCDD station. Now it becomes the largest transport node in the peninsula where Marmaray Line, Metro Line 1 for airport access and Line 2 for CBD access are connected. 1-5
15 Table 1.2 Transport Nodes in the Historical Peninsula TCDD Tram Metro Line 1 Metro Line 2 Marmaray Ferry Bus Dolmuş/ Minibus Sirkeci Eminönü Beyazıt Aksaray Yenikapı Topkapı Edirnekapı Source:JICA Study Team (2) Road Roads in the Historical Peninsula are composed of artery roads, collector roads and block roads. The total road area amounts to hectare or 24.0 percent of the total peninsula lands. It compares favorably with the cities which were developed after the Industrial Revolution and superior to Asian cities Source:JICA Study Team Figure 1.7 Road Area Ratios among Major Cities in the World 1-6 As a whole, the aggregated road areas in the peninsula are at a satisfactory level. But there are inherent problems in relation with road network and road classification. They are specified below in the lights of the table and figure prepared by IMM. Arterial Roads (1 st rank roads, cream color in the figure): They are well developed. If the peninsula were physically isolated by the Land Walls, they must be satisfied with traffic. As a matter of fact, they serve for considerable through traffic in Istanbul. More precisely, there are five roads across the Land Walls but only two bridges across the Golden Horn Bay. As results, the meeting areas such as Aksaray and Atatürk Boulevard become daily congested areas. In addition, there is no interior artery at Eminönü. Therefore, Ordu Street connecting with Aksaray is always congested. Collector Roads (2 nd rank roads, yellow in the figure): They are quite insufficient compared with arterial roads and block roads. It is largely attributed to the history because the road network in the peninsula was developed longtime before motorization. Existing collectors are mostly narrow and steep where roadside parking worsens the situations. Traffic signal control

16 is also inadequate and turning vehicles at intersections are likely hampered by roadside parking. For local traffic improvement, it is important to depict how to strengthen weak collectors function in the network. Block Roads (3 rd rank roads, green color in the figure): Due to insufficient collector roads, many vehicles for passing through only may enter into block roads. Since roadsides are mostly parked, vehicles not related to blocks may cause traffic congestions, resulting in degraded living and commercial business environments. To address the situations, in recent years, traffic demand control measures have been introduced along block roads such as pedestrianization, traffic ban during daytime and so on. Table 1.3 Roads and Transport Lands in the Historical Peninsula Category EMİNÖNÜ FATİH Historical Peninsula No Area (ha) Share (%) No Area (ha) Share (%) No Area (ha) Share (%) 1st Rank Road nd Rank Road rd Rank Road Dead End Roads Pedestrian Walk Open Car Park Indoor Car Park Open Space TOTAL Source: Planning and Protection Management 2003 Source:IMM, 2003 Figure 1.8 Hierarchical Road Network in the Historical Peninsula 1-7

17 (3) Parking Facilities According to the İSTDM Parking Facility Survey, there are 202 parking facilities and areas with 12,176 vehicles in capacity. İSPARK manages 63 sites. They are mostly small including 51 on-street parking. There are 114 off-street parking sites without roof and 20 sites with roof. Only 16 parking buildings are observed in the Historical Peninsula. The number of necessary parking slots in the peninsula has not been analyzed taking nighttime population, employment and tourists into account. IMM once estimated an all block roads parking capacity of 53,720 vehicles in the peninsula on condition that one vehicle could be parked per a block road surface of 25 square meters (IMM, 2004). It assumes that all block roads serve for roadside parking. In order to improve traffic congestion and upgrade urban environment, roadside parking must be controlled together with more off-street parking facilities. Vertical use of the existing off-street at-grade parking sites (134 sites) is one solution. However, only 10 sites of which are under İSPARk s control. Therefore, it is important to encourage private parking site operators to invest additional parking capacity. At the same time, it is also imperative that sufficient parking space should be secured at every large-scale urban redevelopment and transport terminal development. It is worth noting that TAV, Atatürk Airport s terminal operator, extends its business to parking using their experience of airport parking service. TAV operates two underground parking facilities in the peninsula which participated in the social experiment for smart parking system in the JICA project. Source:iSDM Parking Survey, 2012 Figure 1.9 Distribution of Parking Sites in the Historical Peninsula 1-8
18 Table 1.4 Summary of Parking Facilities in the Historical Peninsula No. of Car No. of Subscribed Capacity Daily Users Parks Users İSPARK 63 4,289 9, Private 139 7,878 No data No data Total , ispark private Figure 1.10 The Number of Parking Facilities by Size road side open space indoor multi-storey unknown ispark private Source:İSTDM Parking Survey, 2012 Figure 1.11 The Number of Parking Facilities by Type 1.4 Transport Projects (1) Urban Rail Projects In recent years, three urban railway projects have been implemented and partly still under construction where Yenikapı is a terminal station for them in the Historical Peninsula. The urban rail projects are profiled as follows: Marmaray Line: The submarine and underground section across the Bosphorus Strait was open in October There are two stations, Sirkeci and Yenikapı, in the peninsula. The Marmaray Line will be able to transport 1.5 million passengers daily by 10 train coaches at 2-minute intervals during peak hours. As of May 2014, the line carries 120 thousand 1-9
, Vezneciler and Yenikapı, in the peninsula.")

19 passengers by 5 train coaches at loose intervals. Metro No.2 Line: The line was extended to Yenikapı in February There are three stations, Haliç (located above the Golden Horn Bay), Vezneciler and Yenikapı, in the peninsula. The operation is done by five train coaches at five-minute intervals during the peak hours. Metro No.1 Line: The line is scheduled to reach Yenikapı from Aksaray in Those huge urban rail investments can strengthen public transport services within the Historical Peninsula. To make it happen, improved convenience of Yenikapı station is strategically important by way of smooth transfer among the three lines and better access of passenger cars, dolmuş and buses to the station. Source:JICA Study Team Figure 1.12 Urban Rail Lines in the Historical Peninsula (2) Road Projects There is only one new road project the Eurasia Tunnel Project which is designed to construct a two-layer tunnel of 5.4 km and improve and expand its access roads, 9.2 km in total. The ground-breaking ceremony was held in 2011 while the tunnel construction commencement ceremony was done in April 2014 where Prime Minister and other related ministers attended. There is growing apprehension that the Eurasia Tunnel would attract considerable passing through traffic and make arterial roads congested in the Historical Peninsula. Therefore, adequate traffic guidance must be a critical issue. Source: Figure 1.13 Alignment of Eurasia Tunnel Project 1-10


20 (3) Traffic Demand Management Projects Traffic Demand Management of Historical Area in Istanbul (istdm) For traffic environment improvement in the Historical Peninsula, IMM has made large efforts to rail-based public transport services. IMM have also examined some traffic demand management measures such as road pricing, control of roadside parking, utilization of public parking facilities, conversion to pedestrian paths, etc. Lately, IMM and Fatih Municipality have undertaken traffic calming measures such as conversion to pedestrian paths, traffic ban during daytime and widening of sidewalks. For instance, UKOME made 16 decisions for traffic calming in the peninsula during the period Fatih Municipality implemented numerous traffic calming projects covering 256 block roads between 2010 and Some representative projects are outlined below: Table 1.5 Representative Traffic Calming Projects in the Historical Peninsula Project Site Eminönü Laleli Hocapaşa No. of Roads subject to Traffic Calming Project Year Implementing Body IMM, Fatih Municipality, Istanbul 2010 European Capital of Cultural Fatih Municipality, Laleli Businessmen Association Fatih Municipality Agency Project Road improvement Rehabilitation of Hydraulic vehicle Contents New car parks for streetlights and water stopping barriers: 18 tourist buses tanks sites Control of roadside Hydraulic vehicle Control of roadside parking stopping barriers: parking Traffic ban (8am-11pm 240sites Traffic ban during summer time) (10am-6pm) Project Cost YTL 3.35million YTL 11.95million YTL 90 Thousand Associated Project Source: Sultanahmet Square pavement rehabilitation and landscape improvement project Hydraulic Vehicle Stopping Barrier (left: out of operation, right: in operation) Source: JICA Study Team Corner Cutting of Small Intersection Segregation of Roadside Parking from Carriage Lane Figure 1.14 Traffic Calming Measures in the Historical Peninsula 1-11
21 1. Characteristics of the Study Area Socio-economic Characteristics Land Use Conditions Transport Infrastructure and Facilities Transport Projects 1-9 Figure 1.1 Population Change in the Historical Peninsula 1-1 Figure 1.2 Trend in Museum Visitors in the Historical Peninsula 1-2 Figure 1.3 Hotel Facilities in the Historical Peninsula 1-3 Figure 1.4 Passenger Growth at Istanbul Airports 1-3 Figure 1.5 Topography and UNESCO World Heritage Sites 1-4 Figure 1.6 Existing Land Use 1-5 Figure 1.7 Road Area Ratios among Major Cities in the World 1-6 Figure 1.8 Hierarchical Road Network in the Historical Peninsula 1-7 Figure 1.9 Distribution of Parking Sites in the Historical Peninsula 1-8 Figure 1.10 The Number of Parking Facilities by Size 1-9 Figure 1.11 The Number of Parking Facilities by Type 1-9 Figure 1.12 Urban Rail Lines in the Historical Peninsula 1-10 Figure 1.13 Alignment of Eurasia Tunnel Project 1-10 Figure 1.14 Traffic Calming Measures in the Historical Peninsula 1-11 Table 1.1 Population Change in the Historical Peninsula 1-1 Table 1.2 Transport Nodes in the Historical Peninsula 1-6 Table 1.3 Roads and Transport Lands in the Historical Peninsula 1-7 Table 1.4 Summary of Parking Facilities in the Historical Peninsula 1-9 Table 1.5 Representative Traffic Calming Projects in the Historical Peninsula

22 2. Transport Demand Changes by Rail-Transit Development 2.1 Transport Demand Structure in the Historical Area The current numbers of daily produced trips in Istanbul are 7,045,000 trips on foot, 6,254,000 trips by car, 2,314,000 trips by service, 9,677,000 trips by public mode and total 25,290,000 trips. Public mode consists 38% of all trips. The numbers of daily produced trips in historical area are 561,000 trips on foot, 484,000 trips by car, 222,000 trips by service, 966,000 trips by public mode and total 2,233,000 trips. The public mode share in historical area is 43%. It is larger than the share in whole Istanbul. Figure 2.1 shows the production and attraction trips in historical area by purpose. A large number of trips, particularly peak time trips, are produced from the west side which is a residential area. A large number of trips are attracted to the east side which is a commercial are. During peak term, work trips and school trips consists mostly of all trips. Figure 2.2 shows the desired line of the public transportation trips in historical area. A large number of trips are produced from Beyazıt and Eminönü areas which have the bus terminal and the tram station. The demand structure in Historical area is shown in Figure 2.3. Historical area was divided to old Eminönü district and old Fatih district in the figure. In addition, this figure did not show the intra trips. The 1.3 million persons are moving every day between historical area and other areas. Through trips connected to other areas are more than 0.5 million persons per day. The trips between old Eminönü district and old Fatih district are not large. Source: JICA Study Team Figure 2.1 Trip Production and Attraction by Purpose (day and peak time) 2-1


23 Source: JICA Study Team Figure 2.2 Desired Line (Public Transportation) Source: JICA Study Team Figure 2.3 Demand Structure of Historical Area 2.2 Passenger Flow before/ after Rail Transit Opening Before the opening of Marmaray railway in October 2013, MetroBus was the major public transport carrier, running through the city of Istanbul and carrying nearly one million passengers, as presented by the transit assignment result in Figure 2.4. In addition, other various mass transit modes such as subway, LRT, and tramway are functioning by complementing the public transport. Among others, ferry is also taking a significant role of public transport across the Bosporus connecting the Asian and European sides of the city. 2-2
24 Metro Bus Ferry Source: JICA Study Team [1 mm = 200,000 persons/day] Figure 2.4 Trip Pattern of Public Transport before Opening of Marmaray Then, since Marmaray railway, which is composed of five stations such as Yenikapı, Sirkeci, and Üsküdar, started its operation and Taksim Line (M2) was extended to Yenikapı Station in February 2014, there has been a significant change in the public transportation patterns in Istanbul. As explained later, focusing on the public transport across the Bosporus, the transit assignment result in Table 2.1 shows a shift from MetroBus or ferry to Marmaray railway that is made nearly equally by the former MetroBus or ferry passengers. The table also consequently shows that most of the Marmaray rail passengers are crossing the Bosporus. Table 2.1 Changes in the Number of Passengers on Major Modes before and after Opening of Marmaray (and Extension of M2) Case Before Opening of Marmaray (and Extension of Taksim Line (M2)) Present Case (After Opening of Marmaray and Extension of M2) No. of Boarding Passengers on Marmaray(/day) No. of Passengers Crossing the Bosporus (/day) Marmaray MetroBus Ferry* - - 1,003, , , , , ,600 Note: *Ferry lines to/from Kadıköy only Source: JICA Study Team Furthermore, extension of Taksim Line (M2) to Yenikapı Station, which is nearly concurrent with opening of Marmaray rail, has enabled underground transfer between Marmaray and M2 and enhanced access to the new city, resulting in a significant increase in the number of passengers on M2 as well, as presented in Figure 2.5. In addition, the extension of M2 has also enabled transfer by walk between Yenikapı Station and Aksaray Station of Airport Line 2-3
25 (M1), resulting in an increase in the number of passengers on M1 as well. M1 M2 Uskudar Sirkeci Yenikapi Marmaray Railway Kazlicesme Ayrilikcesme Source: JICA Study Team [1 mm = 200,000 persons/day] Figure 2.5 Changes by Rail Transit Development (by Transit Assignment) after Marmaray and Taksim Line (M2) Extension Those changes in the passengers travel patterns can also be confirmed through the trend of the statistical data of the number of boarding passengers by major mode of transport that are held by the city of Istanbul. There is an increase in the number of boarding passengers on Airport Line (M1) before and after the opening of Marmaray (Figure 2.6); particularly, the increase at Aksaray Station is remarkable, as shown in Figure 2.6. As for the MetroBus passengers, the number should have decreased taking the above-mentioned shift to Marmaray into consideration; however, overall, an increase in the number of MetroBus passengers has been observed as shown in Figure 2.8, probably due to the continuing urban development and natural growth of the population along the MetroBus line. Meanwhile, as for the tramway (T1) that can be connected with Marmaray railway at Aksaray Station, no significant increase or decrease in the number of boarding passengers is observed on all the line in the historical area and at Aksaray Station (Figure 2.10). Likewise, no significant increase or decrease can be observed in terms of the number of boarding passengers on the buses serving the historical area (except for MetroBus lines) (Figure 2.11). On the other hand, as for the numbers of boarding passengers at Eminönü ferry terminal (Figure 2.12), which is located close to Sirkeci Station, and at Yenikapı ferry terminal, which is located close to Yenikapı Station, a remarkable decrease can be observed before and after the opening of Marmaray railway. This is considered to be caused by the shift from ferry to Marmaray railway that has been made by passengers crossing the Bosporus, as stated earlier. 2-4
26 Source: BELBİM Figure 2.6 Trend in the Number of Passengers on Airport Line (M1) in the Historical Area Source: BELBİM Figure 2.7 Trend in the Number of Passengers in M1 Aksaray Station 2-5
27 Source: BELBİM Figure 2.8 Trend in the Number of Passengers on MetroBus in the Historical Area Source: BELBİM Figure 2.9 Trend in the Number of Passengers on Tramway (T1) in the Historical Area 2-6
28 Source: BELBİM Figure 2.10 Trend in the Number of Passengers in T1 Aksaray Station Source: BELBİM Figure 2.11 Trend in the Number of Passengers on Buses (excluding MetroBus) in the Historical Area 2-7
29 Source: BELBİM Figure 2.12 Trend in the Number of Passengers at Eminönü Ferry Terminal Source: BELBİM Figure 2.13 Trend in the Number of Passengers at Yenikapı Ferry Terminal 2-8
30 With respect to the number of boarding passengers at each station on Marmaray railway, though it may be still on the transitionally increasing trend due to some issues like a shortage of information such as promotion and guidance for connecting transit lines, the number of boarding passengers from the transit network assignment was compared with the one from the actual statistical data as presented in Table 2.2. Though the forecast number of passengers from the former is a little larger than the statistical data, it may be considered as reasonable taking the above into account. As for the balances of the number of passengers between the stations, while the one of Sirkeci Station was forecasted as smaller than the statistical figure, overall tendencies can be considered as similar between the forecast and the actual data; for example, it is commonly observed that Ayrılıkçeşme Station in the Asian side has the largest number of boarding passengers, followed by Üsküdar Station, and then Yenikapı Station in the European side. Table 2.2 Comparison between Transit Assignment Result and Statistical Data (No. of Boarding Passengers at Each Marmaray Station) [unit: thousand persons / day] Kazlıçeşme Yenikapı Sirkeci Üsküdar Ayrılıkçeşme Total Transit Assignment Result (Present Case) Statistical Data (as of Mar. 2014) Source: JICA Study Team The transportation network assignment presented in this study is originally based on the OD (origin- destination) matrices and the highway and transit network data created on a TransCAD platform by IMM, and has been converted to JICA STRADA and calibrated to adjust to the actual observations. Results from this JICA STRADA have been utilized for the subsequent forecasts and analyses. The numbers of boarding and alighting passengers at each station on Marmaray railway and the volumes of passengers carried between stations derived from the present transit assignment are depicted in Figure The most heavily loaded section among the five stations on Marmaray railway is Sirkeci Üsküdar, which crosses the Bosporus, followed by Yenikapı Sirkeci. 2-9
31 Based on STRADA Unit : 1,000 Pax/ Day KAZLICESME Alighting 46% 31% 54% 69% 86 Boarding YENIKAPI 31% 47% 69% 40% 53% 60% SIRKECI USKUDAR AYRILIKCESME Source: JICA Study Team Figure 2.14 Number of Boarding Passengers at Each Marmaray Station and Volume of Passengers Carried between Stations (Transit Assignment Result of Present Case) In the above-mentioned transit network assignment, changes in the number of passengers on the major modes before and after Airport Line (M1) extension that is scheduled in December 2014 are shown in Table 2.3, and the overall flow of public transport passengers after the M1 extension is presented in Figure The M1 extension is expected to add nearly 30,000 passengers per day to Marmaray railway. Focusing on the number of passengers crossing the Bosporus, the increase in the number of passengers on Marmaray railway is expected to come from MetroBus rather than ferry. Meanwhile, as for the overall flow of public transport passengers, an increase in passengers particularly on M1 is notable. Table 2.3 Changes in the Number of Passengers on Major Modes before and after Airport Line (M1) Extension Case Present Case (After Opening of Marmaray and Extension of M2) No. of Boarding Passengers on Marmaray(/day) No. of Passengers Crossing the Bosporus (/day) Marmaray MetroBus Ferry* 140, , , ,600 After Extension of M1 169, , , ,900 Note: *Ferry lines to/from Kadıköyonly Source: JICA Study Team 2-10
32 M1 M2 Source: JICA Study Team [1 mm = 200,000 persons/day] Figure 2.15 Changes by Rail Transit Development (by Transit Assignment) after Marmaray, Taksim Line (M2) Extension and Airport Line (M1) Extension 2.3 Modal conversion caused by the Marmaray and User Behaviors of Marmaray The modal conversion, the origin and destination of users, frequency, reason of using, the cost saving and time saving by Marmaray, access and egress mode will be shown in this section based on results of the interview survey. The detail of survey results is shown in Appendix of this report. (1) Modal Conversion by Marmaray The more than half of Marmaray users were converted from a sea transport. The users converted from Metro Bus and Bus are 14% and 10%, respectively. The users converted from car is a few persons, it is 7% only. Also the conversion from minibus and Dolmuş is few because there are no routes crossing Bosporus. The conversion from service which consists large share in Istanbul is also few. It is maybe that the route connecting Marmaray stations and working places is not developed. 2-11
 Origin and Destination Total 1309 100.0 Figure 2.17 and Figure 2.")
33 Source: JICA Study Team Figure 2.16 Mode Converted to Marmaray Table 2.4 Mode converted to Marmaray Mode No. of answers (Multiple) % Sea transport Bus Metro bus Car Rail First time Service Minibus Taxi Dolmuş Source: JICA Study Team (2) Origin and Destination Total Figure 2.17 and Figure 2.18 shows purpose and location of origin and destination. 65 % of boarding passenger of Sirkeci and Yenikapı station came from Fatih district. The reminders came from west side of Fatih or Taksim side. Üsküdar and Kadıköy consist 80% of destination place. 2-12
34 Source: JICA Study Team Figure 2.17 Origin -District Source: JICA Study Team Figure 2.18 Destination -District (3) Frequency of Using Marmaray More than 40% of users are using Marmaray line 5 to 7 days a week as shown below. However, 13.9% of answers are first time. This means that Marmaray line still has potential users. 2-13

 Travel Cost Saving by Marmaray The average travel cost before using Marmaray is 5.2 TL.")
35 Source: JICA Study Team Figure 2.19 Frequency of Using Marmaray (4) Reason of Using Marmaray Figure 2.20 shows reasons of using Marmaray line. Almost users answered There is a significant reduction in my trip time. Marmaray line contributes reducing tip time of citizens in Istanbul. Source: JICA Study Team Figure 2.20 Reason of Using Marmaray (5) Travel Cost Saving by Marmaray The average travel cost before using Marmaray is 5.2 TL. By using Marmaray it became 3.8 TL. Therefore the average travel cost saving is 1.4 TL. However, the persons whose 2-14


36 travel cost decreased is 34% only as shown in Figure On the other hand, the person whose travel cost did not change is account for 60% of all. Increase is 7%. Source: JICA Study Team Figure 2.21 Travel Cost Saving (Before-After Marmaray Usage) (6) Travel Time Saving by Marmaray The average travel time dramatically improved after the Marmaray usage from 85 min to 33 min. As shown in Figure 2.22, approximately 90% of all persons answered that their travel time decreased by using Maramaray. Source: JICA Study Team Figure 2.22 Travel Time Saving (Before- After Marmaray Usage) 2-15

37 (7) Access/ Egress Mode Figure 2.23 shows access mode to Yenikapı station or Sirkeci station. The largest access mode with 44.2% is on foot. Railway and Bus account for 29.8% and 20.8% of answers respectively. It means that improvement of transfer facilities of Yenikapı station and Sirkesi station is necessary to increase transfer passengers from other mode. On the other hand, the largest egress mode from Asian side stations is Railway as shown in Figure It shows that many passengers transfer to Metro in Asian side at Ayrılıkçeşme station. Source: JICA Study Team Figure 2.23 Access Mode Source: JICA Study Team Figure 2.24 Egress Mode 2-16

38 (8) Reason of not Using Mramray Traffic Demand Management of Historical Area in Istanbul (istdm) Figure 2.25 shows the reasons of not using Marmara which is result of interview survey to sea transport users. Marmaway s route does not correspond with my trip and Marmaray is far to my location are consisted 25.1% and 23.5% respectively. If accessibility to station will be improved, they may move to Marmaray line. I do not have any information about Marmaray is 9.1%. It means that promotion of Marmaray is important. Source: JICA Study Team Figure 2.25 Reasons not Using Marmaray 2.4 Potential Demand of Rail The production trips by mode prepared by The study on Integrated Urban Transportation Master Plan for Istanbul Metropolitan Area in the Republic of Turkey were updated by using latest socio economics. The updated numbers are shown in Table 2.5. The public transportation demand will increase approximately by 30% from 9,677,000 trips in 2014 to 12,482,000 trips in The public transportation demand included railway. Therefore, the improvement of railway service will contribute to increase railway user. Table 2.5 Current and Future Production trips by mode ( 000 Trips/ day) Mode Year Car 6,254 8,914 11,056 Service 2,314 2,306 2,440 Public Transportation 9,677 10,133 12,482 Total 18,245 21,353 25,978 Source: JICA Study Team 2-17
39 2. Transport Demand Changes by Rail-Transit Development Transport Demand Structure in the Historical Area Passenger Flow before/ after Rail Transit Opening Modal conversion caused by the Marmaray and User Behaviors of Marmaray Potential Demand of Rail 2-17 Figure 2.1 Trip Production and Attraction by Purpose (day and peak time) 2-1 Figure 2.2 Desired Line (Public Transportation) 2-2 Figure 2.3 Demand Structure of Historical Area 2-2 Figure 2.4 Trip Pattern of Public Transport before Opening of Marmaray 2-3 Figure 2.5 Changes by Rail Transit Development (by Transit Assignment) after Marmaray and Taksim Line (M2) Extension 2-4 Figure 2.6 Trend in the Number of Passengers on Airport Line (M1) in the Historical Area 2-5 Figure 2.7 Trend in the Number of Passengers in M1 Aksaray Station 2-5 Figure 2.8 Trend in the Number of Passengers on MetroBus in the Historical Area 2-6 Figure 2.9 Trend in the Number of Passengers on Tramway (T1) in the Historical Area 2-6 Figure 2.10 Trend in the Number of Passengers in T1 Aksaray Station 2-7 Figure 2.11 Trend in the Number of Passengers on Buses (excluding MetroBus) in the Historical Area 2-7 Figure 2.12 Trend in the Number of Passengers at Eminönü Ferry Terminal 2-8 Figure 2.13 Trend in the Number of Passengers at Yenikapı Ferry Terminal 2-8 Figure 2.14 Number of Boarding Passengers at Each Marmaray Station and Volume of Passengers Carried between Stations (Transit Assignment Result of Present Case) 2-10 Figure 2.15 Changes by Rail Transit Development (by Transit Assignment) after Marmaray, Taksim Line (M2) Extension and Airport Line (M1) Extension 2-11 Figure 2.16 Mode Converted to Marmaray 2-12 Figure 2.17 Origin -District 2-13 Figure 2.18 Destination -District 2-13 Figure 2.19 Frequency of Using Marmaray 2-14 Figure 2.20 Reason of Using Marmaray 2-14 Figure 2.21 Travel Cost Saving (Before-After Marmaray Usage) 2-15 Figure 2.22 Travel Time Saving (Before- After Marmaray Usage) 2-15 Figure 2.23 Access Mode 2-16 Figure 2.24 Egress Mode 2-16 Figure 2.25 Reasons not Using Marmaray 2-17 Table 2.1 Changes in the Number of Passengers on Major Modes before and after Opening of Marmaray (and Extension of M2) 2-3 Table 2.2 Comparison between Transit Assignment Result and Statistical Data (No. of Boarding Passengers at Each Marmaray Station) 2-9 Table 2.3 Changes in the Number of Passengers on Major Modes before and after Airport Line (M1) Extension 2-10 Table 2.4 Mode converted to Marmaray 2-12 Table 2.5 Current and Future Production trips by mode ( 000 Trips/ day)
40 3. Urgent improvement plan of Yenikapi Station and Sirkeci Station and the walker facilities in the outskirts 3.1 Passenger Flows at Yenikapi and Sirkeci Station Passenger flow in and around Yenikapi Station and Sirkeci Station in the present case (after the opening of Marmaray and extension of Taksim Line (M2)) and after Airport Line (M1) extension from Aksaray Station to Yenikapi Station that is scheduled in December 2014 is presented in Figure 3.1 and Figure 3.2. Current Yenikapi Station is used by about 350,000 passengers every day, consisting of about 90,000 passengers at Marmaray Yenikapi Station and about 260,000 passengers at M2 Yenikapi Station. Since the transfer between these two modes will be made underground, it is not displayed in Figure 3.1, but the number of passengers transferring between Yenikapi Station, as a combination of Marmaray railway and M2, and the surrounding public transport modes is displayed. While it will take time until the actual situation becomes stable enough to reach the passenger flow depicted as present in the figure, the transit assignment result indicates that the largest number of transferring passengers to/from Yenikapi Station at present is daily about 190,000 passengers who transfer to/from M1 Aksaray Station on the ground by walk, spending over ten minutes. The second largest number of transferring passengers is those transferring to/from the bus stop beside the station and Aksaray bus terminal that account for daily about 30,000 passengers each, followed by about 10,000 passengers transferring to/from Yenikapi bus terminal. In addition, approximately another 30,000 passengers utilize Yenikapi Station for access to or egress from the nearby zones. Meanwhile, the numbers of passengers transferring to/from tramway (T1) Aksaray Station and Yenikapi ferry terminal are relatively small showing daily around 7,000 and 2,000 passengers, respectively. Furthermore, after extension of airport Line (M1) from Aksaray station to Yenikapi Station, the total number of daily passengers at Yenikapi station, which now connects three lines, namely Marmaray railway, Taksim Line (M2), and M1, is forecast as about 960,000 passengers, consisting of approximately 120,000 at Marmaray, 450,000 at M2, and 390,000 at M1. However, it should be noted that, since the transfers to/from M1 will be made underground after the extension of M1, the number of transferring passengers to/from Aksaray is forecast to decrease drastically. In addition, the number of transfers between Yenikapi Station and Aksaray bus terminal is forecast to decrease as they will be shifted to transfers between M1 Aksaray Station and Aksaray bus terminal. It should also be noted that the number of transfers to/from the nearby transport modes around Yenikapi Station is forecast to generally increase. Among others, increase in the number of passengers who utilize Yenikapi Station for access to or egress from the nearby zones is remarkable. 3-1
![[Present] [After M1 Extension] Source: JICA Study Team [unit: persons / day] Figure 3.](/docs-images/91/105442916/images/41-0.jpg "1 Passenger Flow in and around Yenikapi Station before and after Airport Line (M1) Extension Meanwhile, as for Sirkeci Station, the number of passengers transferring to/from the public transport")
41 [Present] [After M1 Extension] Source: JICA Study Team [unit: persons / day] Figure 3.1 Passenger Flow in and around Yenikapi Station before and after Airport Line (M1) Extension Meanwhile, as for Sirkeci Station, the number of passengers transferring to/from the public transport modes around the station is forecast as much smaller than that of around Yenikapi Station as shown in Figure 3.2, partly because Sirkeci Station consists of Marmaray railway only, or because the transit network assignment has been proved to underestimate the number of passengers at Sirkeci Station. While the direct impact of the extension of M1 on Sirkeci Station is considered to be minor, ripple effects are forecast such as an increase in the number of passengers at Sirkeci Station and the number of trips to/from the nearby zones. On the other hand, the number of transfers between Sirkeci Station and Eminonu bus terminal or Sirkeci Tramway (T1) station is forecast to decrease due to the shift to Yenikapi Station as a transfer point for more convenience. It should be noted that this figure shows flow of Marmaray passengers only; thus, there may be many more passengers transferring between Eminonu ferry and bus terminals as well as the tramway station and the area of Eminonu and Sirkeci is forecast to be crowded with those passengers. 3-2
42 [Present] [After M1 Extension] Source: JICA Study Team [unit: persons / day] Figure 3.2 Passenger Flow in and around Sirkeci Station before and after Airport Line (M1) Extension 3-3
 of Hafif Metro (M1) Aksaray Station and Yusufpasa Station of Tranvay (T1) Yenikapi IDO Terminal Yenikapi Station of")
43 3.2 Current Situation and Issues of Pedestrian Facilities (1) Yenikapi Station Vicinities There are four railway stations and one ferry terminal around Yenikapi station as follows. Yenikapi Station of Marmary Railway Aksaray Station and Yenikapi Station (plan) of Hafif Metro (M1) Aksaray Station and Yusufpasa Station of Tranvay (T1) Yenikapi IDO Terminal Yenikapi Station of Marmary Railway Aksaray Station of Hafif Metro (M1) Aksaray Station of Tranvay Yusufpasa Station of Tranvay (T1) Figure 3.3 Situations around Yenikapi Station 3-4

44 Figure 3.4 Railway Stations around Yenikapi Station 3-5


45 Now Yenikapi Station of Hafif Metro is being build. Figure 3.5 Construction of LRT Yenikapi Station There is a plan to construct the Istanbul an Archeological Museum next to a building Yenikapı Station of Hafif Metro in the Yenikapı Transfer Center area. 3-6 Figure 3.6 Information Board of Istanbul Archeological Museum

46 There is a ferry terminal of IDO about 1 kilometer from Yenikapi Station. The relatively large bus terminal is located near this ferry terminal, and there are not so many passengers. MarmarayYenikapi Station Bus terminal Ferry port Figure 3.7 Bus Terminal near the IDO Ferry Terminal 3-7


47 There are many passengers and pedestrians at the Aksaray station, but pedestrian environment is not so good. Because crossing time for pedestrians is very short and there are many vehicles. So many pedestrians need to across the road in unsafety. Figure 3.8 Road Crossing around Aksaray Station of Tramvay There is a narrow pedestrian bridge near the Aksaray station of tramvay. Figure 3.9 Under Pass and Pedestrian Bridge around the Aksaray Station of Tramvay 3-8


48 Current situation of road spaces between Aksaray station and Yenikapi station 1 Pedestrian crossings are set out around Yenilapi station area, but crossway width is not enough to cross safely. And duration of pedestrian green is too short to cross safely. Traffic is very heavy on the road connecting tow stations and road width is not so wide. There are many illegal parking vehicles on the pedestrian roads. There are always traffic jams on road around Aksaray area Figure 3.10 Pedestrian ways connecting Yenikapi Station and Aksaray Station 3-9


49 Figure 3.11 Two-dimensional Diagram of Yenikapi Station There are three bus stops and one taxi stand on the east side road of Yenikapi stationas in Figure And two busy bus route are located under the u-tern bridge and bus information boards are set up at those bus stop. Figure 3.12 Bus Stop under the U-tern Bridge 3-10


50 Taxi stand is located at the side of the road and in parallel with the bus stop as in Figure There are four - five waiting taxies at the taxi stand usually. This system there will be a huge traffic jam on the road due to this design. Figure 3.13 Bus Stop and Taxi Stand of Yenikapi Station There are many transfer information board around Yenikapi station, but those information boards are not friendly for those unfamiliar with this area because those information boards mention only direction without area map. Figure 3.14 Transfer Information Board 3-11

51 Transport problems around Yenikapi station are as follows; Pedestrian crossings are set out around Yenilapi station area and Aksaray station area, but crossway width is not enough to cross safely. And duration of pedestrian green is too short to cross safely. People cannot cross the road safely at the peak hour. And so many people crosses against light. Pedestrian crossing are set out at the limited places between two staions, Yenikapi Station and Aksaray Station. So people needs to go by a roundabout route and seems much longer sensuously. It s about 770 meters between Aksaray station of Hafif Metro and Yrnikapi station. 420 meters between Aksaray station of Tramvey and Yenikapi station, and about 670 meters between Yusufpasa station of Tramvey and Yenikapi station. Those distances are too far than average distance which people can accept to walk for transfer. And also width of those pedestrian ways are not enough to walk at the peak hours. There are many on-street café and they stand in the way of pedestrians. There are few passengers at the Yenikapi bus terminal near the IDO ferry terminal. And three bus stops around Yenikapi station are not suitable for passengers. Taxi stand near the Yenikapi station causes a traffic jam, and sometime taxi puts obstacles in the way of buses. It s around 500 meters between Yeniakpi station and Yenikapi IDO ferry terminal and people needs to cross the arterial road. Figure 3.15 Taxis parked at bus stops illegally, and peoples waiting for a traffic light (2) Sirkeci Area There are two stations and one car ferry terminal at Sirkeci area, and Eminonu station is located at the not-too-distant area. And there are many transfer passengers between ferry terminal and those stations. Marmaray : Tram: Ferry-port : Sirkeci station Sirkeci Tram station Harem Car Ferry Pire 3-12


52 Bogazici Pier Eminonu Tram station Uskudar Pier Kadikoy Pier Harem Car Ferry Pier Sirkeci Tram station Marmaray Sirkeci station Figure 3.16 Sirkeci Station Area 3-13


53 Figure 3.17 Sirkeci Station Figure 3.18 Harem Car Pire Figure 3.19 Sirkeci staion of Tramvey Sirkeci area is surrounded by congested roads, and there are car parking, small garden, taxi stand and tram station in front of Sirkeci station. This area is located in the historical peninsular. So there are many narrow road inside this area. And this area bustles with many transfer passengers, tourists and others. 3-14


54 Figure 3.20 Re-constructed Building There are two ways to access the ferry ports from Sirkeci station, one is a pedestrian crossing and another is a pedestrian bridge. Figure 3.21 Pedestrian crossing near Sirkeci station The height of the pedestrian bridge is about 6.5 meters and elevated electric cables are built under the pedestrian bridge. 3-15

55 Figure 3.22 Pedestrian Bridge and Tramvey around Sirkeci Station Area Transport problems around Sirkeci station are as follows; Pedestrian crossings are set out around Sirkeci station area. Crossway widths of those crossings are not enough to cross safely, and also duration of pedestrian green is too short to cross safely. People cannot cross the road safely at the peak hour. So many people cross the road against lights. There are many transfer information boards around Sirkeci station, but those information boards are not friendly for those who are unfamiliar with this area because those information boards mention only direction without area map. 3-16
56 3.3 Improvement Plans for Around Yenikapi Station Traffic Demand Management of Historical Area in Istanbul (istdm) The current situation and issues around Yenikapi station and Aksaray station were shown in previous section. The improvement plans will be proposed in this section in order to increase the railway users. The keywords for improvement are Intersection, Side walk and Usage of station plaza. First, a station plaza will be summarized based on a view of a transfer facility. (1) Concept of a transfer facility planning A view of transfer facility in planning of station plaza is important for improvement of urban transport. In addition, the development of transfer facility each station will contribute to develop the transit oriented city. Smoother transport related to transfer facility Improvement of service level of public transportation Hub center Rebuild of city structure Railway User(Transfer) (Along a railway) (Around Station) (Transfer point) Station Railway user (Access, Egress transport) Non railway user (Terminal transport) Non railway user (Related transport around station) Here, *Railway user Transfer between railways Railway user whose destination is around station *Non railway user Terminal transport such as transfer between buses Walking trips etc. Figure 3.23 Classification of Transport Related Transfer Facility 3-17
57 (2) Structure of transfer facility A transfer facility will be developed as a part of redevelopment project around a station or a part of a new transportation plan. The number of users of Yenikapi station will increase after connection of Airport metro to Yenikapi station. In addition a historical museum will be constructed next to Yenikapi station. Therefore a station plaza should develop with these projects. The outline of structure of transfer facility is shown the figure below. Transfer Facility Station Other Transportation facilities Station plaza (road) Access road etc. Parking facility Bus terminal etc. Figure 3.24 Structure of Transfer Facility 3-18
 Aksaray intersection should be had an open space and a")


58 (3) Improvement of Intersection Traffic Demand Management of Historical Area in Istanbul (istdm) Aksaray intersection should be had an open space and a pedestrian crossing. Particularly the area around Aksaray tram station is not comfortable situation for pedestrian due to an emission gas from vehicles. Therefore the open space with green area was proposed in order to improve the intersection. Current Situation Proposed Plan Figure 3.25 Image Figure near Aksaray Station 3-19


59 (4) Improvement of sidewalk The sidewalk between Aksaway station and Yenikapi station is narrow. Therefore parking space should be space for pedestrian. Current Situation Improvement Plan Figure 3.26 Improvement Plan of sidewalk between Aksaway station and Yenikapi Station 3-20

 connects to pedestrianized streets.")

60 The underground mall has a role of connection with Aksaray Metro station and Yenikapi station. Figure 3.27 Underground mall near Aksaray Station The underground mall (AVM OUTLET) connects to pedestrianized streets. Therefore many persons are using this underground mall. Entrance Figure 3.28 Pedestrianized Street connected to underground mall 3-21


61 The roads in south area of underground mall have congested by vehicles because of no signal control and road side parking. Figure 3.29 Congested Road and Intersection 3-22


62 On May of 2014, the vehicle stopping barrier is installing in this area. Figure 3.30 Vehicle Stopping Barrier The vehicle regulation has been enforced in other areas in Istanbul. Therefore the vehicle regulation will be acceptable measure by a resident in this area. Figure 3.31 Vehicle Stopping Barrier in other area 3-23


63 Thus, the time vehicle regulation will contribute to develop a comfortable pedestrian apace. In addition it will also contribute to increase Marmaray users. Natural environment (Tree, flower) Comfortable sidewalk surface Sidewalk surface by using historical resources Change to café etc. Parking regulation Time vehicle regulation Figure 3.32 Concept of Road Space 3-24


64 The underground passageway connected with the underground mall and Yenikapi station was proposed as one of the countermeasure. However it was rejected because of some issues such as security and impact to historical heritage. (5) Improvement of the transfer facility by using a station plaza The railway users will increase after the Metro line, M1, will connect to Yenikapi station from Aksaray station. Therefore improvement plan by using a station plaza will be proposed in this section. Figure 3.33 Metro Line connected with Aksaray Station and Yenikapi Station A function of station plaza should be considered in order to improve the station plaza. Guideline for Station Plaza Planning was referred A space of a station plaza is able to separate to a traffic space and an environmental space. A function is able to separate to a transfer function and an open space function. 3-25


65 Figure 3.34 Function of Station Plaza 1 Basic policy for construction of a traffic space A station plaza should be considered following matters in order to increase in a level of convenience and coziness. Traffic line and walking line should be separated. Walking line should be continuance. Consider an elderly people and disability person. Easily-transferred guide facility and rest facility. Main traffic line should be simplification and shortening. 2 Basic policy for construction of environmental space It should be considered characteristics of a station and an area. In addition it should be consider following matters. Land scape facility such as a symbolic facility or planting Safety and accessibility Enjoying the historical heritage. Considering smell or music etc. A planting and lighting should be constructed with a rest facility as necessary Construction of an information spot Standardized guide facility 3-26
66 3 Concept for considering station plaza The concepts of Yenikapi statin are proposed below. (Five concepts). Providing easily-transfer space, access-friendly space and easily-coming space Share of synchronized design space with surrounding area Considering nature environment Share of inheritance of historical heritage Using fashionable technology 3-27

67 Figure 3.35 Conceptual image 3-28


68 In current situation, Yenikapi station is covered by concrete because of under construction. Current situation In the future station plaza should be comfortable space for everyone by using historical materials. Improved Figure 3.36 Improvement of station plaza of Yenikapi station (Proposal) 3-29

69 4 Zoning Plans of Station Plaza Two zoning plans are proposed at Yenikapi station plaza, serving for access transport means (bus, taxi and passenger car) and open space of pedestrian. Pattern 1 The spaces for buses and taxis are allocated at both east and west sides of the station Figure 3.37 Zoning Pattern 1 of Station Plaza


70 If the restaurant building at the east-south edge, opening only for nighttime, would be removed in the future, a larger space for pedestrian could be allocated. Since the building is designated within a station plaza area, it is likely to happen after necessary discussion and coordination. Figure 3.38 Location of the Building at the East-South Edge Surrounded by Fence 3-31


71 Pattern 2 Only buses will be allowed at both east and west sides of the station while taxis at the north-central area of the station site. Due to narrow carriageway and many roadside parking practices at the north side of the station, it is an issue how to use this road. Currently the road is closed for civil works. Figure 3.39 Zoning Pattern 2 of Station Plaza 3-32


72 It is noted that a necessary space for a taxi to boarding and alighting passengers has been examined in terms of taxi curving track at either Pattern 1 or Pattern 2. Relevant drawings are depicted below. If roadside is lined with taxies, it may cause or worsen traffic congestion. It is suggested that a taxi bay for several taxies be allocated within the station site. However, there may be no planning dimension available to design such a taxi bay in Istanbul. When designing a taxi bay, minimum necessary space will be provided within the station site. Pattern 1 Pattern 2 Figure 3.40 Vehicle Curving Track in the Case of Japanese Taxi 3-33

73 5 Promotion of Bus Usage It is suggested to promote bus usage at both east and west sides of the station.. Present Improvement Figure 3.41 Suggestion of More Bus Usage (1) 3-34

74 Present Improvement Figure 3.42 Suggestion of More Bus Usage (2) 3-35
 3-36")
75 With the suggested bus usage, a berth capacity of 8-15 buses can be created at both east and west sides of the station. Figure 3.43 Bus Usage Plan (Upper: Single Queue, Lower: Double Queues) 3-36


76 It is necessary to coordinate with bus routes when assigning the road for a bus stop at the west side of the station. At present, the road is as wide as 12 meters with a few traffic such as vehicles for civil works. However, daily traffic congestion is observed at the intersection of the north-west edge of the station site. Figure 3.44 Existing Conditions of the North Side Road 3-37


77 It is suggested that a convenient bus stop be developed where bus waiting time by route is indicated on board and high environmental amenity is secured. Present Improvement Figure 3.45 Comparison of Existing Bus Stop with Bus Time Table in Istanbul with Greenery Bus Stop with Bus Waiting Time Board 3-38


78 There are various bus stop designs available. For instance, Curitiba in Brazil employs a cylindrical shape of bus stop for BRT. To gain passengers satisfaction, bus stop appearance is also crucial. Figure 3.46 Unique Bus Stop Design at Curitiba, Brazil 3-39


79 (6) Phased Development for Station Plaza With roadside geometric adjustment, the number of maximum bus berths is 15 as mentioned in the previous section. If more bus space would be necessary, more fundamental development plan must come in. Yenkapi Marmaray Station Yenkapi Marmaray Station The basement parking area that is planned Figure 3.47 Plan of Archeological Museum and Underground Parking There is still an archaeological excavation site beside Yenikapi Station. One plan shows that an archeological museum will be built on the ground while underground car parking will be constructed. 3-40
 Figure 3.")
80 As the plan comes into reality, when Yenikapi Station development is completed and a historical museum is ready for construction, the temporary pedestrian bridge to cross the excavation site will be removed. Archeological Museum (tentative name) Figure 3.48 Archeological Museum Site (planned) and Pedestrian Bridge 3-41


81 Under such circumstances, there is a way to strengthen terminal function by an integrated building serving for railways, buses, taxis, cars and travelers. For example, bus and taxi terminals are allocated at the ground while pedestrian deck is provided above for safe and smooth people movement. An integrated rail station building accommodates rail station(s) inside and commercial and restaurant floors for travelers convenience. Although there is no such railway station building in Istanbul, this concept can realize greater connectivity among rail service and its access transport services. Figure 3.49 Integrated Railway Station Building and Bus Terminal (Sapporo City, Japan) Figure 3.50 Integrated Subway Station and Bus Terminal (Nagoya City, Japan) 3-42

 At taxi stop, an advanced technology of roof glass with solar panels is installed, of which")
82 At the station plaza, bus stops and taxi stops are desirably located at different places separately for the convenience of passengers. Figure 3.51 Separated Locations of Taxi and Bus Stops (Kawasaki City in Kanagawa Pref.) At taxi stop, an advanced technology of roof glass with solar panels is installed, of which generated power is used for lighting. Figure 3.52 Taxi Stops with Roofs Solar Panel 3-43

83 Recently, an experimental road pavement with hexagonal modules embedded with solar panels was reported in the Idaho State, USA. The project is called Solar Roadway Project aiming at self-supporting of energy. The hexagonal unit is embedded with solar panel, LED bulb and heater for melting snow. In the night time, road signs are lighted with electricity generated and stocked in the daytime. The experiment succeeded to make the road in service all the year round, in spite of the severe cold weather in Idaho. The modules generate energy enough for lighting and heating. The modules will last more than 20 years and a damaged module is easily replaced, which will expectedly result in low maintenance cost. greenz.jp/2014/05/23/solar_led_roadway/ Figure 3.53 Road Pavement with Solar Panels 3-44
 In addition, design of a station plaza will need to consider raising greenery at parking")
84 There is a large panel at the station plaza of Kawasaki City, explaining passengers how the plaza is designed environmentally friendly. Figure 3.54 Explanation panel of Environmentally Friendly Design of Station Plaza (Kawasaki Station of Kawasaki City) In addition, design of a station plaza will need to consider raising greenery at parking or retaining walls, which are already observed along highways in Istanbul. Figure 3.55 Environment friendly devices with greenery 3-45


85 It is recommended to plant flowers of each season to put colors in a station plaza, as well as lawn and trees, in order to make a pleasant space to see. To plant a variety of colorful flowers 3-46 Figure 3.56 Environment friendly spaces with Flower beds


86 Figure 3.57 Habima Square, Tel Aviv, Israel 3-47


87 Two measures are recommendable to improve pedestrians convenience between Yenicapi station and Yenicapi IDO s terminal: one is to improve crossing of the artery adjacent to the station and the other is to build a pedestrian bridge. Currently, pedestrians are forced to cross a narrow bridge if they want to take the shortest pass, as the photos below show. Yenikapi Ido Figure 3.58 Narrow Pedestrian Bridge crossing over Ataturk Highway with heavy traffic. 3-48

88 Recommendations are to replace the narrow pedestrian bridge to a new wider one and the station entrance is to be built at the southeast corner of the block, which is presently surrounded with a fence and shops in which are open only in the night. New Entrance Plan for Pedestrian Flow Plan it on a slope Figure 3.59 New Entrance of the Station at the Southeast Corner 3-49


89 The present narrow pedestrian bridge is planned to widen into a new bridge 12 m wide and a ramp way for pedestrian is to be built to fill the gap in height. Figure 3.60 A Ramp Approach to the New Wider Bridge 3-50


90 The other recommendation is to build another pedestrian bridge over the Kennedy Road to guide pedestrians to Bus Terminal and IDO Terminal. Figure 3.61 Pedestrian Bridge crossing Kennedy Road connecting with IDO Terminal 3-51


91 It shows Perth that watched the bird's-eye view of the foregoing paragraph from another angle. Figure 3.62 Planned Pedestrian Bridge over Kennedy Road 3-52

92 Figure 3.63 Connection of Pedestrian Road and Bridge between Yenikapi Station and IDO Terminal 3-53


93 There three points for planning of pedestrian bridge. Among them, material and structure have shown a variety of new possibilities by technological evolution, receiving greater attention through fusion with new design and ecological contribution. User Vicinity Environment Material & Structure Figure 3.64 Three Points for planning of Pedestrian Bridge Figure 3.64 presents three aspects important for pedestrian bridge design. Beside these, design should consider well-harmonization and consistency of the inner and outer soaces. 1) Outer Space Outer spaces are directly perceived by people being outside the bridge and will give a variety of impressions to them depending on the sight distance. From a distant place, shape as a whole, dominant color and massiveness are clearly perceived and detail design and texture of material will become important from nearby. 2) Inner Space Inner spaces are the pedestrian walk and on the bridge and approach, where comfortableness and ambience such as view and interior of the bridge are important rather than distance from the bridge. In case of lower floor bridges especially, design of a semi-closed space surrounded by suspensions and trusses are important. 3-54
94 Exterior Design Interior Interior Space Exterior Design Landscaping Exterior Design Exterior Design Exterior Space Changes in spatial feature, depending on distance Figure 3.65 A Conceptual Design of Pedestrian Deck Six (6) objectives are proposed as design criteria of the pedestrian decks/bridge as follows: Objective 1: To assure fair, safe and flexible use by anyone offering the same means to any user to a possible extent; encouraging any user to use a lifting and lowering device; and assuring any user s safety and privacy equally. Objective 2: to provide effective transmission of information and communication using a variety of communication methods by sight, hearing and/or sense of touch to assure accurate information; providing understandable key-information to users, making it distinct from other non-key information; and making information available for users to identify their surrounding situation, conditions and attributes. Objective 3: to evade user s missteps and dangers providing an easily understandable and simple system so that any user, regardless of his/her experience and knowledge level, can intuitively identify the way to use it; lessening mixtures and/or congestions of users traffic lines to assure their smooth movements with keeping their sense of orientation. making the easiest use of those which are often used by many users, thereby resulting in reduction of users accidents and dangers effectively. Objective 4: To reduce physical and psychological burdens 3-55

95 proving safe and comfortable usage for any user regardless of day-and-night and weather; protecting any user from apprehension, discomfort and being involved in criminals; minimizing user s physical burden and fatigue; and provoking user s funs and pleasure to reduce his/her psychological and physical stress, constructing vista and resting places. Objective 5: to offer necessary space and size providing space sufficient enough for users to assure their easy and smooth mobility; providing clear visibility for any user not to be disturbed from his/her necessary vista; assuring users smooth flows at entrance/exit without accumulated fluids due to excessive concentration; securing sunshine in the neighboring; and offering adequate space necessary for public services for local people, if is required. Objective 6: to utilize environment-friendly materials and structures using appropriate materials to minimize environmental loads, and remove adverse impacts on users health; examining use of recyclable materials; using construction materials with lightweight, corrosion-resistant and environment-depurative nature; utilizing reused materials and designing a maintenance-free structure; inventing new and unique structure with appropriate techniques to make best use of materials in terms of coloring and texturing; considering a possibility of being a symbolic landmark to represent its historic and culture-oriented atmospheres in the locality. There are a lot of the construction models of the pedestrian decks/bridges based on the objectives above over the world, out of which some example structures are as shown below (see Figures 3.67 through 3.72) Figure 3.66 Example of Exclusive Pedestrian Bridge (German, Berlin City) 3-56


")


96 Figure 3.67 Example of Pedestrian Bridge (London) Figure 3.68 Example of Pedestrian Bridge (PORTUGAL, Coimbra city) Figure 3.69 Examples of Pedestrian Bridges attached to Stations (JAPAN) 3-57


97 Figure 3.70 Example of Pedestrian Bridges (GERMAN, Stuugart) 3-58
 Large")


98 Figure 3.71 Example of Pedestrian Bridges (SPAIN, Campo Volantin) Large Scale Bridge over Intersection A special attention to landscape and urban design should be placed on the pedestrian bridge to be planned in a history district. A slender structure may be considered in this sense. A circle structure of large scale pedestrian bridge is a unique model to cross over the wide road and with several approaches (as seen in Fig. 3.73). The design with roofing is optional. However, any closed space with roofs must not be created due to a security reason. Figure 3.72 Example of Large Scale Pedestrian Bridge (JAPAN, Shin-Yokohama Station) 3-59


99 Lighting System: In consideration of security and safety of passengers at the station, a lighting system needs to be carefully designed. The illumination intensity at night time should be sufficient enough to prevent crimes without dark spots. Nowadays, an LED lighting system is popular to be installed for saving of electricity consumption and environment (See Fig. 3.74) There exists a unique and fascinating lighting system to lighten public open space in London where LED illuminations form grid lines on the pedestrian plaza (see Fig. 3.75). Figure 3.73 Example of Illumination Systems (some stations in JAPAN) 3-60

 Street Furniture: Well-designed furniture such as bench and pedestrian paths is an")

100 The Finsbury Avenue Square was seen as a dark and unwelcoming plaza that people avaided at all hours of the days. SOM s redesign is centered around an intricate lighting installation built into a matrix on the ground. Over 100,000 LED lights and 650 fixtures illuminate a variety of scenes during the day and night. Figure 3.74 Example of Open Space with LED Lighting System (London) Street Furniture: Well-designed furniture such as bench and pedestrian paths is an essential element to create comfortable public space. At present, only temporary benches and fences for construction are placed in the station plaza with theater-type steps at the Yenikapi Station, and other urban furniture has not been designed for the public space (see Fig.3.76). Theater Steps can be utilized for recreational activities. Figure 3.75 Example of Setting of Urban Furniture 3-61
 Billboards and Guiding Boards: Well-designed billboards")


.")
101 Figure 3.76 Examples of Creation of Urban Amenities at Railway Stations (JAPAN) Billboards and Guiding Boards: Well-designed billboards and visibly understandable guiding boards are indispensable equipment at station in particular. Those are important devices for tourists to get necessary mapping information on use of transportations and the surrounding areas. A good example is observed in the city of London where billboards and map-boards were innovated at main streets under the campaign of "Legible London ( This movement was conducted before the Olympic Game was held in 2012 (see Fig. 3.77). In the Istanbul City, a number of map-boards indicating their locations are installed at corners of streets, but there are few map-boards showing the locations in overviewing the whole town. The guiding boards should be designed to be visibly understandable as seen in the London example (Fig. 3.77), so that we can identify where we are now and how distant to our destinations. 3-62

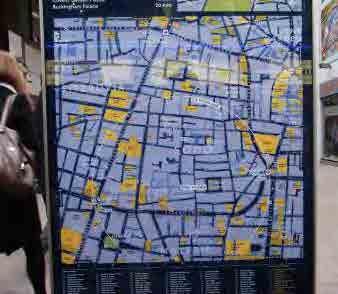

102 Figure 3.77 Example of Visibly Understandable Map-Boards (London) 3-63
103 3.4 Suggestions on Improvement at/around the Sirkeci Station After the Uskudar Station in the Asian side was connected with the Yenikapi Station in the European side by the Marmaray Line, a significant change in passengers traffic movements took place. On the Marmaray Line, the Sirkeci Station must be another focal station for its inter-modality. The Sirkeci Station, the terminal of the Turkish National Railways in the European side, used to be famous with its function of the terminal of the Orient-Express. Thus, the station is a historical station with interconnections with transnational, domestic, and sub-urban trains. In addition, the station needs inter-modal facilities which assure passengers safe and comfortable transfers to/from bus, taxi and ferry. Needless to say, as this station is located at the corner of the historical district, scenic landscaping and spatial harmony with neighboring historical buildings must be taken into consideration for designing of new transportation facilities. Because only narrow open space is available around/nearby the station, it is difficult to find a land area to develop new bus terminal(s), taxi-stands and pedestrian paths unlike the Yenikapi Station. Under these circumstances, it is suggested that some urgent improvement works should be undertaken to assure safe and efficient passengers/pedestrians transfers to/from the other transportation modes, including the following works: Widening of sidewalks; Increasing of improved pedestrian crossings with signaling systems; Placement of well-designed guiding boards and/or map-boards. The Eminonu area, being composed of the Sirkeci Station, the Eminonu Station, the ferry port and the bus terminal, is one of the busiest tourist destination. Therefore, this station area should be improved in such a way that pedestrians/tourists can benefit from safe and convenient usage of the multi-modal public transportations. 3-64
104 3. Urgent improvement plan of Yenikapi Station and Sirkeci Station and the walker facilities in the outskirts Passenger Flows at Yenikapi and Sirkeci Station Current Situation and Issues of Pedestrian Facilities Improvement Plans for Around Yenikapi Station Suggestions on Improvement at/around the Sirkeci Station 3-64 Figure 3.1 Passenger Flow in and around Yenikapi Station before and after Airport Line (M1) Extension 3-2 Figure 3.2 Passenger Flow in and around Sirkeci Station before and after Airport Line (M1) Extension 3-3 Figure 3.3 Situations around Yenikapi Station 3-4 Figure 3.4 Railway Stations around Yenikapi Station 3-5 Figure 3.5 Construction of LRT Yenikapi Station 3-6 Figure 3.6 Information Board of Istanbul Archeological Museum 3-6 Figure 3.7 Bus Terminal near the IDO Ferry Terminal 3-7 Figure 3.8 Road Crossing around Aksaray Station of Tramvay 3-8 Figure 3.9 Under Pass and Pedestrian Bridge around the Aksaray Station of Tramvay 3-8 Figure 3.10 Pedestrian ways connecting Yenikapi Station and Aksaray Station 3-9 Figure 3.11 Two-dimensional Diagram of Yenikapi Station 3-10 Figure 3.12 Bus Stop under the U-tern Bridge 3-10 Figure 3.13 Bus Stop and Taxi Stand of Yenikapi Station 3-11 Figure 3.14 Transfer Information Board 3-11 Figure 3.15 Taxis parked at bus stops illegally, and peoples waiting for a traffic light 3-12 Figure 3.16 Sirkeci Station Area 3-13 Figure 3.17 Sirkeci Station 3-14 Figure 3.18 Harem Car Pire 3-14 Figure 3.19 Sirkeci staion of Tramvey 3-14 Figure 3.20 Re-constructed Building 3-15 Figure 3.21 Pedestrian crossing near Sirkeci station 3-15 Figure 3.22 Pedestrian Bridge and Tramvey around Sirkeci Station Area 3-16 Figure 3.23 Classification of Transport Related Transfer Facility 3-17 Figure 3.24 Structure of Transfer Facility 3-18 Figure 3.25 Image Figure near Aksaray Station 3-19 Figure 3.26 Improvement Plan of sidewalk between Aksaway station and Yenikapi Station 3-20 Figure 3.27 Underground mall near Aksaray Station 3-21 Figure 3.28 Pedestrianized Street connected to underground mall 3-21 Figure 3.29 Congested Road and Intersection 3-22 Figure 3.30 Vehicle Stopping Barrier 3-23 Figure 3.31 Vehicle Stopping Barrier in other area 3-23 Figure 3.32 Concept of Road Space 3-24 Figure 3.33 Metro Line connected with Aksaray Station and Yenikapi Station 3-25 Figure 3.34 Function of Station Plaza 3-26 Figure 3.35 Conceptual image 3-28 Figure 3.36 Improvement of station plaza of Yenikapi station (Proposal) 3-29 Figure 3.37 Zoning Pattern 1 of Station Plaza 3-30 Figure 3.38 Location of the Building at the East-South Edge Surrounded by Fence 3-31 Figure 3.39 Zoning Pattern 2 of Station Plaza 3-32 Figure 3.40 Vehicle Curving Track in the Case of Japanese Taxi 3-33 Figure 3.41 Suggestion of More Bus Usage (1) 3-34 Figure 3.42 Suggestion of More Bus Usage (2) 3-35 Figure 3.43 Bus Usage Plan (Upper: Single Queue, Lower: Double Queues) 3-36 Figure 3.44 Existing Conditions of the North Side Road 3-37 Figure 3.45 Comparison of Existing Bus Stop with Bus Time Table in Istanbul with Greenery Bus Stop with Bus Waiting Time Board
105 Figure 3.46 Unique Bus Stop Design at Curitiba, Brazil 3-39 Figure 3.47 Plan of Archeological Museum and Underground Parking 3-40 Figure 3.48 Archeological Museum Site (planned) and Pedestrian Bridge 3-41 Figure 3.50 Integrated Railway Station Building and Bus Terminal (Sapporo City, Japan) 3-42 Figure 3.49 Integrated Subway Station and Bus Terminal (Nagoya City, Japan) 3-42 Figure 3.51 Separated Locations of Taxi and Bus Stops (Kawasaki City in Kanagawa Pref.) 3-43 Figure 3.52 Taxi Stops with Roofs Solar Panel 3-43 Figure 3.53 Road Pavement with Solar Panels 3-44 Figure 3.54 Explanation panel of Environmentally Friendly Design of Station Plaza (Kawasaki Station of Kawasaki City) 3-45 Figure 3.55 Environment friendly devices with greenery 3-45 Figure 3.56 Environment friendly spaces with Flower beds 3-46 Figure 3.57 Habima Square, Tel Aviv, Israel 3-47 Figure 3.58 Narrow Pedestrian Bridge crossing over Ataturk Highway with heavy traffic Figure 3.59 New Entrance of the Station at the Southeast Corner 3-49 Figure 3.60 A Ramp Approach to the New Wider Bridge 3-50 Figure 3.61 Pedestrian Bridge crossing Kennedy Road connecting with IDO Terminal 3-51 Figure 3.62 Planned Pedestrian Bridge over Kennedy Road 3-52 Figure 3.63 Connection of Pedestrian Road and Bridge between Yenikapi Station and IDO Terminal 3-53 Figure 3.64 Three Points for planning of Pedestrian Bridge 3-54 Figure 3.65 A Conceptual Design of Pedestrian Deck 3-55 Figure 3.66 Example of Exclusive Pedestrian Bridge (German, Berlin City) 3-56 Figure 3.67 Example of Pedestrian Bridge (London) 3-57 Figure 3.68 Example of Pedestrian Bridge (PORTUGAL, Coimbra city) 3-57 Figure 3.69 Examples of Pedestrian Bridges attached to Stations (JAPAN) 3-57 Figure 3.70 Example of Pedestrian Bridges (GERMAN, Stuugart) 3-58 Figure 3.71 Example of Pedestrian Bridges (SPAIN, Campo Volantin) 3-59 Figure 3.72 Example of Large Scale Pedestrian Bridge (JAPAN, Shin-Yokohama Station) 3-59 Figure 3.73 Example of Illumination Systems (some stations in JAPAN) 3-60 Figure 3.74 Example of Open Space with LED Lighting System (London) 3-61 Figure 3.75 Example of Setting of Urban Furniture 3-61 Figure 3.76 Examples of Creation of Urban Amenities at Railway Stations (JAPAN) 3-62 Figure 3.77 Example of Visibly Understandable Map-Boards (London) 3-63 図表目次項目が見つかりません 3-66
106 4. Urgent Projects for Bus Rerouting in the Historical Area 4.1 Demand Changes of Bus Routes in the Historical Area Regarding the number of passengers on the bus lines (except for Metro Bus) serving the historical area, no significant change is observed as shown in Chapter 2. Meanwhile, focusing on the number of passengers boarding at Yenikapı bus terminal, which is located close to Yenikapı Station and ferry terminal, a slight increase can be observed before and after the opening of Marmaray railway (and extension of Taksim Line (M2)), as shown in Figure 4.1. This tendency is considered to be due to the increase in the number of passengers at Yenikapı Station, where several public transport lines are interconnected. As stated earlier, in accordance with the extension of Airport Line (M1) from Aksaray Station to Yenikapı Station in the near future, the number of passengers at the bus terminal as well as on the bus lines connecting to Yenikapı Station is forecast to increase further. On the other hand, the number of passengers boarding at Eminönü bus terminal, which is located close to Sirkeci Station and Eminönü ferry terminal, no significant change is observed (Figure 4.2). Though the impact on the total passengers at Eminönü bus terminal may be minor, the number of transferring passengers between Marmaray Sirkeci Station and Eminönü bus terminal is forecast to decrease. Source: BELBİM Figure 4.1 Trend in the Number of Passengers at Yenikapı Bus Terminal 4-1
107 Source: BELBİM Figure 4.2 Trend in the Number of Passengers at Eminönü Bus Terminal Furthermore, based on the statistical data of boarding passengers on buses, a ratio of the number of passengers on each bus line to the total passengers on all the bus lines serving the historical area was calculated and plotted in order to analyze the changes before and after the opening of Marmaray railway (and extension of Taksim Line (M2) in 2014). Based on the data of the monthly number of passengers of every March, bus lines where the abovementioned ratios have increased or decreased are identified and presented in Figure 4.3 and Figure 4.4, respectively. As a result, four bus lines with the ratios increased after the opening of Marmaray and eight bus lines with the ratios decreased are displayed in these figures. The increasing or decreasing tendencies on these bus lines have also matched with the result of the transit network assignment that was simulated before and after the opening of Marmaray railway. All the bus lines with the ratios increased after the opening of Marmaray have proved to pass by Yenikapı Station except for one bus line. It can be considered to be caused by the increase in the number of transferring passengers at Yenikapı Station. Meanwhile, most of the bus lines with the ratios decreased have proved to originate from Eminönü bus terminal and pass by Yenikapı Station. Among others, it can be inferred that the common section among those decreasing bus lines, that is, the section between Eminönü bus terminal and Yenikapı Station has lost passengers traveling from/to the west of the historical area, who have changed their transfer point from Eminönü bus terminal to Yenikapı Station since the opening of Marmaray railway (and extension of Taksim Line (M2)). 4-2

108 Aksaray Terminal Eminönü Terminal Sirkeci Station Beyazit Terminal Yenikapı Station Yenikapı Terminal Note: Analysis based on the data of monthly number of passengers in March Source: BELBiM Figure 4.3 Bus Lines with Increasing Ratio of Passengers to All Bus Lines after Opening of Marmaray (and Extension of M2) 4-3
 4.")
109 Aksaray Terminal Beyazit Terminal Yenikapı Station Yenikapı Terminal Eminönü Terminal Sirkeci Station Note: Analysis based on the data of monthly number of passengers in March Source: BELBİM Figure 4.4 Bus Lines with Decreasing Ratio of Passengers to All Bus Lines after Opening of Marmaray (and Extension of M2) 4.2 Issues of Current Bus Lines and Bus Rerouting Proposal Based on the analyses in terms of the increasing or decreasing tendencies of the number of passengers on individual bus lines, issues of the current bus lines can be summarized as follows: Around Yenikapı Station, where the demand for transfers has been increasing, it is 4-4
110 important to partly reroute the bus lines which particularly serve the west direction of the historical area and add a new bus stop beside Yenikapı Station, thereby increasing the bus lines via Yenikapı and enhancing the transfer connectivity between Yenikapı Station and the bus lines; and About the bus lines originating from Eminönü bus terminal and serving the west direction of the historical area, it is important to eventually modify and make these bus lines originate from Yenikapı Station (or bus terminal), focusing intensively on the transfers at Yenikapı Station. While the above-mentioned issues have already been implemented in some of the bus lines, it is proposed to target not only Eminönü terminal-based bus lines but also nearby Aksaray or Beyazit terminal-based bus lines which serve the west direction of the historical area and reroute most of those bus lines via Yenikapı Station, and eventually to modify and make them originate from Yenikapı Station. Those targeted Eminönü, Aksaray, and Beyazit terminalbased bus lines are listed in Table 4.1 and proposed rerouting plans are presented in Figure 4.5, Figure 4.6, and Figure 4.7. Table 4.1 Proposed List of Bus Lines for Rerouting Eminönü Terminal-Based Aksaray Terminal-Based 35 Make these lines originate 89 Make these lines originate from 33B from Yenikapı Station instead 89B Yenikapı Station instead of Aksaray 82 of Eminönü terminal 89i terminal 92 (Disconnect the service 145 Rerouting via Yenikapı is completed 92C between Eminönü Yenikapı) Beyazıt Terminal-Based (92G) Cancelled 82B Make these lines originate from Yenikapı Station instead 92B 94A Make these lines originate from 97A of Eminönü terminal 97 Yenikapı Station instead of Beyazıt terminal Source: JICA Study Team (Disconnect the service between Eminönü Yenikapı) 97B (397B) Cancelled 4-5


 4-6")
111 Eminönü Terminal Yenikapı Station Cut off this section and connect to Yenikapı Station Source: JICA Study Team Figure 4.5 Proposed Bus Lines for Rerouting (Eminönü Terminal-Based Lines) Aksaray Terminal Change the terminal from Aksaray to Yenikapı Station Yenikapı Station Source: JICA Study Team Figure 4.6 Proposed Bus Lines for Rerouting (Aksaray Terminal-Based Lines) 4-6


112 Cut off this section and connect to Yenikapı Station Beyazıt Terminal Yenikapı Station Source: JICA Study Team Figure 4.7 Proposed Bus Lines for Rerouting (Beyazıt Terminal-Based Lines) 4.3 Effect of Bus Rerouting In the transit network assignment, changes in the number of passengers on the major modes after implementing the above-mentioned bus rerouting are shown in Table 4.2, and the overall flow of public transport passengers is presented in Figure 4.8. Implementation of the proposed bus rerouting is expected to further add nearly 15,000 passengers per day to Marmaray railway compared to the forecast in the case of after the extension of Airport Line (M1) that is scheduled in December Focusing on the number of passengers crossing the Bosporus, most of the increase in the number of passengers on Marmaray railway is expected to come from ferry. Table 4.2 Changes in the Number of Passengers on Major Modes before and after Rerouting of Bus Lines No. of Boarding No. of Passengers Crossing the Bosporus (/day) Case Passengers on Marmaray(/day) Marmaray MetroBus Ferry* After Extension of Airport 169, , , ,900 Line (M1) After Rerouting of Bus 184, , , ,800 Lines Note: *Ferry lines to/from Kadıköy only Source: JICA Study Team 4-7
113 Source: JICA Study Team [1 mm = 200,000 persons/day] Figure 4.8 Changes by Rail Transit Development (by Transit Assignment) after Bus Rerouting (and Airport Line (M1) Extension) Passenger flow in and around Yenikapı Station and Sirkeci Station after implementation of the proposed bus rerouting is presented in Figure 4.9. The total number of daily passengers at Yenikapı station is forecast to increase to about 983,000 passengers, consisting of approximately 130,000 at Marmaray, 460,000 at M2, and 393,000 at M1. While there is an increase of about 10,000 passengers on both Marmaray and M2, in terms of the growth ratios, the one on Marmaray railway is the highest, implying that it will bring a great benefit especially to the passengers on Marmaray railway. Focusing on the changes in the number of transfers to/from the nearby transport modes around Yenikapı Station, increase in the number of passengers who transfer to/from the bus stop beside Yenikapı Station is remarkable, exceeding 50,000 passengers per day. Meanwhile, as for the number of passengers transferring to/from the public transport modes around Sirkeci Station, no significant change from the case after the extension of Airport Line (M1) can be observed. Though many of the existing Eminönü-based bus lines are modified into Yenikapı-based bus lines, no significant change is observed in terms of the number of transferring passengers to/from Marmaray Sirkeci Station, which implies little negative impact on the transfers at Sirkeci Station. 4-8
![[Yenikapı Station] [Sirkeci Station] Source: JICA Study Team [unit: persons / day] Figure 4.](/docs-images/91/105442916/images/114-0.jpg "9 Passenger Flow in and around Yenikapı and Sirkeci Stations after Bus Line Rerouting (and Airport Line (M1) Extension) Finally, in terms of the effect of the proposed bus rerouting, indicators of")
114 [Yenikapı Station] [Sirkeci Station] Source: JICA Study Team [unit: persons / day] Figure 4.9 Passenger Flow in and around Yenikapı and Sirkeci Stations after Bus Line Rerouting (and Airport Line (M1) Extension) Finally, in terms of the effect of the proposed bus rerouting, indicators of the expected benefit brought to the entire transit network (namely, entire Istanbul) are presented in Table 4.3. Focusing on the case after rerouting of the bus lines, while there is no remarkable change in the number of transfers, the total passenger-hours have certainly decreased. As a result, the travel time reduction per trip all over Istanbul can also be expected though the range is one minute or so. If the reduction of travel time or total passenger-hours shown in the table is to be enjoyed by additional transferring passengers at Yenikapı bus stop (approximately 21,000 person-trips), average travel time reduction per person-trip is estimated to be around 10 minutes per trip. Though it should be noted that this benefit will be brought to not only Marmaray passengers but also M1 and M2 passengers, about 15,000 passengers are transfer passengers between Marmaray Rail and Yenikapı bus stop. Thus, estimation of the above-mentioned travel time reduction may be reasonable. 4-9
2.1 Outline of Person Trip Survey
 Trip Characteristics 2.1 Outline of Person Trip Survey 2.1.1 Outline of the Survey The Person Trip survey was carried out from 2006 to 2007 as a part of the Istanbul Transportation Master Plan undertaken
Urban Mobility and Energy Trends in Istanbul
 Round Table National experiences in control of the energy on the sector of building» Event Energaia, December 10-12, 2008 Urban Mobility and Energy Trends in Istanbul Haluk GERÇEK (PhD), Istanbul Technical
Bi-County Transitway/ Bethesda Station Access Demand Analysis
 Bi-County Transitway/ Bethesda Station Access Demand Analysis Prepared for: Washington Metropolitan Area Transit Authority Office of Planning and Project Development May 2005 Prepared by: in conjunction
TRAVEL DEMAND FORECASTS
 Jiangxi Ji an Sustainable Urban Transport Project (RRP PRC 45022) TRAVEL DEMAND FORECASTS A. Introduction 1. The purpose of the travel demand forecasts is to assess the impact of the project components
Submission to Greater Cambridge City Deal
 What Transport for Cambridge? 2 1 Submission to Greater Cambridge City Deal By Professor Marcial Echenique OBE ScD RIBA RTPI and Jonathan Barker Introduction Cambridge Futures was founded in 1997 as a
Public Transportation Problems and Solutions in the Historical Center of Quito
 TRANSPORTATION RESEARCH RECORD 1266 205 Public Transportation Problems and Solutions in the Historical Center of Quito JACOB GREENSTEIN, Lours BERGER, AND AMIRAM STRULOV Quito, the capital of Ecuador,
Amman Green Policies Projects and Challenges. Prepared by: Eng. Sajeda Alnsour Project coordinator Sept. 20, 2017
 Amman Green Policies Projects and Challenges Prepared by: Eng. Sajeda Alnsour Project coordinator Sept. 20, 2017 Amman: Demographics Greater AMMAN Municipality GAM Amman is the capital of Jordan with a
Travel Demand Modeling at NCTCOG
 Travel Demand Modeling at NCTCOG Arash Mirzaei North Central Texas Council Of Governments for Southern Methodist University The ASCE Student Chapter October 24, 2005 Contents NCTCOG DFW Regional Model
Troost Corridor Transit Study
 Troost Corridor Transit Study May 23, 2007 Kansas City Area Transportation Authority Agenda Welcome Troost Corridor Planning Study Public participation What is MAX? Survey of Troost Riders Proposed Transit
Networks of pedestrian's paths
 Plan for Internal Circulation Road plans, land use plans, and facility arrangement plans are determined on an assumption that daily access to the new town railway stations for commuting to work to attend
Findings from the Limassol SUMP study
 5 th European Conference on Sustainable Urban Mobility Plans 14-15 May 2018 Nicosia, Cyprus Findings from the Limassol SUMP study Apostolos Bizakis Deputy PM General Information The largest city in the
Istanbul METROBUS BRT. Adapted from Presentations by World Resources Institute/EMBARQ s Sibel Koyluoglu and Dario Hidalgo
 Istanbul METROBUS BRT Adapted from Presentations by World Resources Institute/EMBARQ s Sibel Koyluoglu and Dario Hidalgo Historic Istanbul Modern Istanbul Istanbul Among World s most historic and rapidly
1 Downtown LRT Connector: Draft Concept
 Downtown LRT Connector: Draft Concept Plan November 2010 We re moving forward. Get involved. On June 21, 2010, City Council approved a street-level downtown LRT route, including a connector for the future
Spatial planning and sustainable urban transport systems
 Jean-Christophe Goudouneix Rita Magris Laura Richter Nicolae Serban Stef Tomesen George Yates Erasmus Intensive Programme 2013 Oradea Group 4 Spatial planning and sustainable urban transport systems Developing
Back ground Founded in 1887, and has expanded rapidly Altitude about 2500 meters above MSL Now among the ten largest cities in Sub Saharan Africa
 Back ground Founded in 1887, and has expanded rapidly Altitude about 2500 meters above MSL Now among the ten largest cities in Sub Saharan Africa Annual growth rate is 3.8% By 2020 population growth would
Executive Summary. Draft Environmental Impact Statement/Environmental Impact Report ES-1
 Executive Summary Introduction The Eastside Transit Corridor Phase 2 Project is a vital public transit infrastructure investment that would provide a transit connection to the existing Metro Gold Line
The Engineering Department recommends Council receive this report for information.
 CORPORATE REPORT NO: R161 COUNCIL DATE: July 23, 2018 REGULAR COUNCIL TO: Mayor & Council DATE: July 19, 2018 FROM: General Manager, Engineering FILE: 8740-01 SUBJECT: Surrey Long-Range Rapid Transit Vision
Downtown Lee s Summit Parking Study
 Downtown Lee s Summit Parking Study As part of the Downtown Lee s Summit Master Plan, a downtown parking and traffic study was completed by TranSystems Corporation in November 2003. The parking analysis
Chapter 4. Design and Analysis of Feeder-Line Bus. October 2016
 Chapter 4 Design and Analysis of Feeder-Line Bus October 2016 This chapter should be cited as ERIA (2016), Design and Analysis of Feeder-Line Bus, in Kutani, I. and Y. Sado (eds.), Addressing Energy Efficiency
Toward the Realization of Sustainable Mobility
 GIES 2008 Toward the Realization of Sustainable Mobility March 13, 2008 Toyota Motor Corporation Senior Technical Executive Hiroyuki Watanabe 1 CO 2 Emission from Transportation Sector Distribution by
FREQUENTLY ASKED QUESTIONS
 FREQUENTLY ASKED QUESTIONS 2018 What is the More MARTA Atlanta program? The More MARTA Atlanta program is a collaborative partnership between MARTA and the City of Atlanta to develop and implement a program
CORE AREA SPECIFIC PLAN
 only four (A, B, D, and F) extend past Eighth Street to the north, and only Richards Boulevard leaves the Core Area to the south. This street pattern, compounded by the fact that Richards Boulevard is
STRATEGIC PRIORITIES AND POLICY COMMITTEE MAY 5, 2016
 STRATEGIC PRIORITIES AND POLICY COMMITTEE MAY 5, 2016 Shift Rapid Transit Initiative Largest infrastructure project in the city s history. Rapid Transit initiative will transform London s public transit
8. TRIP DISTRIBUTION. 8.1 Trip Distribution by Trip Purpose. Figures 8.1 show desire lines by trip purpose. < To Work >
 8. TRIP DISTRIBUTION 8.1 Trip Distribution by Trip Purpose Figures 8.1 show desire lines by trip purpose. < To Work > Quezon (II) and Makati form large centers for to Work trips. Manila also attracts a
Smoothing Traffic for Urban Environment
 Smoothing Traffic for Urban Environment 1. The Current State of Road Improvement in Japan 2. The Current State of Road Traffic in Metropolitan Areas 3. Systematic Measures to Enhance Road Traffic Flow
UTA Transportation Equity Study and Staff Analysis. Board Workshop January 6, 2018
 UTA Transportation Equity Study and Staff Analysis Board Workshop January 6, 2018 1 Executive Summary UTA ranks DART 6 th out of top 20 Transit Agencies in the country for ridership. UTA Study confirms
2016 Congestion Report
 2016 Congestion Report Metropolitan Freeway System May 2017 2016 Congestion Report 1 Table of Contents Purpose and Need...3 Introduction...3 Methodology...4 2016 Results...5 Explanation of Percentage Miles
Green Line LRT: Beltline Segment Update April 19, 2017
 Green Line LRT: Beltline Segment Update April 19, 2017 Quick Facts On April 11, 2017, City Council approved Administration s recommendation for the Green Line to be underground in the Beltline from 2 Street
Yonge-Eglinton. Mobility Hub Profile. September 19, 2012 YONGE- EGLINTON
 September 19, 2012 PEEL YORK HALTON DURHAM HAMILTON TORONTO YONGE- EGLINTON MOBILITY HUBS: places of connectivity between regional and rapid transit services, where different modes of transportation come
NAVY YARD BALLPARK STATION ACCESS IMPROVEMENTS STUDY. Final Report. Washington Metropolitan Area Transit Authority
 NAVY YARD BALLPARK STATION ACCESS IMPROVEMENTS STUDY Final Report Washington Metropolitan Area Transit Authority Office of Real Estate and Station Planning April 2016 [This page intentionally left blank]
Travel and Tourism in Malaysia to 2017
 Published on Market Research Reports Inc. (https://www.marketresearchreports.com) Home > Travel and Tourism in Malaysia to 2017 Travel and Tourism in Malaysia to 2017 Publication ID: TMC0513014 Publication
What We Heard Report - Metro Line NW LRT
 What We Heard Report - Metro Line NW LRT by Metro Line NW LRT Project Team LRT Projects City of Edmonton April 11, 2018 Project / Initiative Background Name Date Location Metro Line Northwest Light Rail
Parking Management Element
 Parking Management Element The State Transportation Planning Rule, adopted in 1991, requires that the Metropolitan Planning Organization (MPO) area implement, through its member jurisdictions, a parking
Transport systems integration into urban development planning processes
 Transport systems integration into urban development planning processes Phd. Vytautas Palevičius 2014-03-28 Klaipėda Šiauliai Panevėžys Kaunas Vilnius At the beginning of year 2013, Lithuania was populated
Metropolitan Freeway System 2013 Congestion Report
 Metropolitan Freeway System 2013 Congestion Report Metro District Office of Operations and Maintenance Regional Transportation Management Center May 2014 Table of Contents PURPOSE AND NEED... 1 INTRODUCTION...
Back to the Future? Land Use, Mobility & Accessibility in Metropolitan China Day 23 C. Zegras. Contents
 Back to the Future? Land Use, Mobility & Accessibility in Metropolitan China 11.953 Day 23 C. Zegras Contents Remember the Developing World..? Motorization! China: Motorization and its Challenges Land
Filling systemic transit convenience gaps A case in Chongqing s high-density Jiangbei Centre
 Introducing Integrated Eco-Mobility to the new Asian Urban Model Filling systemic transit convenience gaps A case in Chongqing s high-density Jiangbei Centre Stefan RAU 饶士凡 Jianfeng XU Hang Yi CHEN Yi
Three ULTra Case Studies examples of the performance of the system in three different environments
 Three ULTra Case Studies examples of the performance of the system in three different environments airport application: London Heathrow : linking business and staff car parks through the access tunnel
Develop ground transportation improvements to make the Airport a multi-modal regional
 Project Overview TRANSPORTATION IMPROVEMENTS WHAT ARE THE PROJECT GOALS? Transportation transportation hub. Develop ground transportation improvements to make the Airport a multi-modal regional Land Use
BARRHAVEN FELLOWSHIP CRC 3058 JOCKVALE ROAD OTTAWA, ONTARIO TRANSPORTATION BRIEF. Prepared for:
 BARRHAVEN FELLOWSHIP CRC 3058 JOCKVALE ROAD OTTAWA, ONTARIO TRANSPORTATION BRIEF Prepared for: Barrhaven Fellowship CRC 3058 Jockvale Road Ottawa, ON K2J 2W7 December 7, 2016 116-649 Report_1.doc D. J.
Seoul. (Area=605, 10mill. 23.5%) Capital Region (Area=11,730, 25mill. 49.4%)
 Capital Region (Area=11,730, 25mill. 49.4%)") Seoul (Area=605, 10mill. 23.5%) Capital Region (Area=11,730, 25mill. 49.4%) . Major changes of recent decades in Korea Korea s Pathways at a glance 1950s 1960s 1970s 1980s 1990s 2000s Economic Development
Seoul (Area=605, 10mill. 23.5%) Capital Region (Area=11,730, 25mill. 49.4%) . Major changes of recent decades in Korea Korea s Pathways at a glance 1950s 1960s 1970s 1980s 1990s 2000s Economic Development
Green Line LRT: Beltline Recommendation Frequently Asked Questions
 Green Line LRT: Beltline Recommendation Frequently Asked Questions June 2017 Quick Facts Administration has evaluated several alignment options that would connect the Green Line in the Beltline to Victoria
Transportation Demand Management Element
 Transportation Demand Management Element Over the years, our reliance on the private automobile as our primary mode of transportation has grown substantially. Our dependence on the automobile is evidenced
STH 60 Northern Reliever Route Feasibility Study Report
 #233087 v3 STH 60 Northern Reliever Route Feasibility Study Report Washington County Public Works Committee Meeting September 28, 2016 1 STH 60 Northern Reliever Route Feasibility Study Hartford Area Development
RE: A Traffic Impact Statement for a proposed development on Quinpool Road
 James J. Copeland, P.Eng. GRIFFIN transportation group inc. 30 Bonny View Drive Fall River, NS B2T 1R2 May 31, 2018 Ellen O Hara, P.Eng. Project Engineer DesignPoint Engineering & Surveying Ltd. 200 Waterfront
THE DUBLIN TRANSPORTATION INITIATIVE: HOW INTEGRATED TRANSPORTATION SOLUTIONS CHANGE A CITY
 THE DUBLIN TRANSPORTATION INITIATIVE: HOW INTEGRATED TRANSPORTATION SOLUTIONS CHANGE A CITY Innovations in Regional Transportation Plans Rail~Volution Conference, Miami 2007 Alan Jones Associate November
The City of Toronto s Transportation Strategy July 2007
 The City of Toronto s Transportation Strategy July 2007 Presentation Outline Transportation Statistics Transportation Building Blocks Toronto s Official Plan Transportation and City Building Vision Projects
BROWARD BOULEVARD CORRIDOR TRANSIT STUDY
 BROWARD BOULEVARD CORRIDOR TRANSIT STUDY FM # 42802411201 EXECUTIVE SUMMARY July 2012 GOBROWARD Broward Boulevard Corridor Transit Study FM # 42802411201 Executive Summary Prepared For: Ms. Khalilah Ffrench,
CITY OF LONDON STRATEGIC MULTI-YEAR BUDGET ADDITIONAL INVESTMENTS BUSINESS CASE # 6
 2016 2019 CITY OF LONDON STRATEGIC MULTI-YEAR BUDGET ADDITIONAL INVESTMENTS BUSINESS CASE # 6 STRATEGIC AREA OF FOCUS: SUB-PRIORITY: STRATEGY: INITIATIVE: INITIATIVE LEAD(S): BUILDING A SUSTAINABLE CITY
King County Metro. Columbia Street Transit Priority Improvements Alternative Analysis. Downtown Southend Transit Study. May 2014.
 King County Metro Columbia Street Transit Priority Improvements Alternative Analysis Downtown Southend Transit Study May 2014 Parametrix Table of Contents Introduction... 1 Methodology... 1 Study Area...
Chapter 4 : THEME 2. Transportation
 Chapter 4 : THEME 2 Strengthen connections to keep the Central Area easy to reach and get around 55 Figure 4.2.1 Promote region-wide transit investments. Metra commuter rail provides service to the east,
MPO Staff Report Technical Advisory Committee: July 12, 2017
 MPO Staff Report Technical Advisory Committee: July 12, 2017 RECOMMENDED ACTION: 2 nd TAC Meeting with Kimley-Horn/WSB in Updating the Street/Highway Element of 2045 Metropolitan Transportation Plan. Matter
Denver Car Share Program 2017 Program Summary
 Denver Car Share Program 2017 Program Summary Prepared for: Prepared by: Project Manager: Malinda Reese, PE Apex Design Reference No. P170271, Task Order #3 January 2018 Table of Contents 1. Introduction...
Written Exam Public Transport + Answers
 Faculty of Engineering Technology Written Exam Public Transport + Written Exam Public Transport (195421200-1A) Teacher van Zuilekom Course code 195421200 Date and time 7-11-2011, 8:45-12:15 Location OH116
5. OPPORTUNITIES AND NEXT STEPS
 5. OPPORTUNITIES AND NEXT STEPS When the METRO Green Line LRT begins operating in mid-2014, a strong emphasis will be placed on providing frequent connecting bus service with Green Line trains. Bus hours
Transit Access Study
 West of Hudson Regional Transit Access Study Open House presentation July 20, 2010 1 Agenda Progress To date Summary of Level 2 Alternatives and Screening Service Plans Bus and Rail Operating and Capital
TEXAS CITY PARK & RIDE RIDERSHIP ANALYSIS
 TEXAS CITY PARK & RIDE RIDERSHIP ANALYSIS This document reviews the methodologies and tools used to calculate the projected ridership and parking space needs from the proposed Texas City Park & Ride to
Parks and Transportation System Development Charge Methodology
 City of Sandy Parks and Transportation System Development Charge Methodology March, 2016 Background In order to implement a City Council goal the City of Sandy engaged FCS Group in January of 2015 to update
Transportation Statistical Data Development Report BAY COUNTY 2035 LONG RANGE TRANSPORTATION PLAN
 Transportation Statistical Data Development Report BAY COUNTY 2035 LONG RANGE TRANSPORTATION PLAN Prepared for Bay County Transportation Planning Organization and The Florida Department of Transportation,
Making Mobility Better, Together
 Making Mobility Better, Together Austin Transportation Department Gordon Derr, P.E., for Robert J. Spillar, P.E Director, Austin Transportation Department 1 AUSTIN TRANSPORTATION DEPARTMENT Our Mission
EUGENE-SPRINGFIELD, OREGON EAST WEST PILOT BRT LANE TRANSIT DISTRICT
 EUGENE-SPRINGFIELD, OREGON EAST WEST PILOT BRT LANE TRANSIT DISTRICT (BRIEF) Table of Contents EUGENE-SPRINGFIELD, OREGON (USA)... 1 COUNTY CONTEXT AND SYSTEM DESCRIPTION... 1 SYSTEM OVERVIEW... 1 PLANNING
Mobility of Gurugram & NCR-
 Mobility of Gurugram & NCR- Vision for Efficient Transport Systems By Sujata Savant Additional General Manger Urbanization and Mobility Urbanization & Mobility Magnitude 31% Indians live in urban areas
EXECUTIVE SUMMARY. The following is an outline of the traffic analysis performed by Hales Engineering for the traffic conditions of this project.
 EXECUTIVE SUMMARY This study addresses the traffic impacts associated with the proposed Shopko redevelopment located in Sugarhouse, Utah. The Shopko redevelopment project is located between 1300 East and
Travel Forecasting Methodology
 Travel Forecasting Methodology Introduction This technical memorandum documents the travel demand forecasting methodology used for the SH7 BRT Study. This memorandum includes discussion of the following:
4. Transportation Plan
 The sizes of the most suitable sites are indicated in Table 4.3.6.2. Table 4.3.6.2: Site Sizes and Potential Development Area Potential Development Site Site Size (m 2 ) Area m 2 (3 Floors) D1 29,000 87,000
Urban Transport systems in major cities in China. Sun Kechao Senior Engineer China Academy of Transportation Sciences, Beijing, China
 Urban Transport systems in major cities in China Sun Kechao Senior Engineer China Academy of Transportation Sciences, Beijing, China Part 1 Part 2 Part 3 Part 4 Introduction Urban transport policies Urban
HALTON REGION SUB-MODEL
 WORKING DRAFT GTA P.M. PEAK MODEL Version 2.0 And HALTON REGION SUB-MODEL Documentation & Users' Guide Prepared by Peter Dalton July 2001 Contents 1.0 P.M. Peak Period Model for the GTA... 4 Table 1 -
Service Quality: Higher Ridership: Very Affordable: Image:
 Over the past decade, much attention has been placed on the development of Bus Rapid Transit (BRT) systems. These systems provide rail-like service, but with buses, and are typically less expensive to
IV. ENVIRONMENTAL IMPACT ANALYSIS K.2. PARKING
 IV. ENVIRONMENTAL IMPACT ANALYSIS K.2. PARKING ENVIRONMENTAL SETTING The following analysis summarizes the findings and conclusions of the Traffic Analysis (Traffic Study), prepared by The Mobility Group,
LAWRENCE TRANSIT CENTER LOCATION ANALYSIS 9 TH STREET & ROCKLEDGE ROAD / 21 ST STREET & IOWA STREET LAWRENCE, KANSAS
 LAWRENCE TRANSIT CENTER LOCATION ANALYSIS 9 TH STREET & ROCKLEDGE ROAD / 21 ST STREET & IOWA STREET LAWRENCE, KANSAS TRAFFIC IMPACT STUDY FEBRUARY 214 OA Project No. 213-542 TABLE OF CONTENTS 1. INTRODUCTION...
Welcome. Green Line in Your Community
 Welcome Green Line in Your Community Today's session will provide you with information about Administration's recommendation for connecting the Green Line in the Beltline to Victoria Park and Inglewood/Ramsay
THE WAY WE MOVE LRT FOR EVERYONE
 THE WAY WE MOVE LRT FOR EVERYONE 2 LRT for Everyone LRT FOR EVERYONE Light rail is about more than transit; it s about transforming Edmonton. As the city grows, so do its transportation needs. LRT is an
* Presented at 2011 World Bank Transport Forum, March Jaehak Oh. Director, Global Research Office for Green Growth & Convergence
 * Presented at 2011 World Bank Transport Forum, March 2011 Jaehak Oh Director, Global Research Office for Green Growth & Convergence I. Green Growth and Transport II. Future Trend III. Innovative Technologies
Draft Marrickville Car Share Policy 2014
 Draft Marrickville Car Share Policy 2014 1. Background 1.1. Marrickville Council has supported car sharing in the LGA since 2007 as part of a holistic approach to encouraging more sustainable modes of
AN ANALYSIS OF DRIVER S BEHAVIOR AT MERGING SECTION ON TOKYO METOPOLITAN EXPRESSWAY WITH THE VIEWPOINT OF MIXTURE AHS SYSTEM
 AN ANALYSIS OF DRIVER S BEHAVIOR AT MERGING SECTION ON TOKYO METOPOLITAN EXPRESSWAY WITH THE VIEWPOINT OF MIXTURE AHS SYSTEM Tetsuo Shimizu Department of Civil Engineering, Tokyo Institute of Technology
History of Subway in Kyoto
 TO: Board Members FROM: Yasuyo Tsukamoto DATE: May 6, 2016 SUBJECT: Alternative Plan to Increasing Fares in Kyoto City I am strongly against the idea that the (KMTB) increase the subway fare. Although
APPENDIX VMT Evaluation
 APPENDIX 2.7-2 VMT Evaluation MEMORANDUM To: From: Mr. Jonathan Frankel New Urban West, Incorporated Chris Mendiara LLG, Engineers Date: May 19, 2017 LLG Ref: 3-16-2614 Subject: Villages VMT Evaluation
Mysuru PBS Presentation on Prepared by: Directorate of Urban Land Transport
 Mysuru PBS Presentation on 04.11.2017 Prepared by: Directorate of Urban Land Transport Introduction to Mysuru Public Bicycle Sharing System Mysuru Public Bicycle Sharing System Bicycle based transportation
Attachment 5 Eglinton West LRT Planning and Technical Update
 Eglinton West LRT Planning and Technical Update 1. Introduction In July 2016, City Council approved an Eglinton West LRT with between 8 and 12 stops between Mount Dennis and Renforth Gateway, and up to
Case of Toyama City. Public Transport Planning and Development toward Resilience. Mayor Masashi Mori Toyama City, Japan RESILIENT CITY TOYAMA
 Public Transport Planning and Development toward Resilience Case of Toyama City Mayor Masashi Mori Toyama City, Japan TOYAMA City Partnership RESILIENT CITY TOYAMA Rockefeller 100 Resilient Cities -1-
Proposed Program of Interrelated Projects
 DALLAS AREA RAPID TRANSIT Proposed Program of Interrelated Projects Federal Transit Administration Capital Investment Program Summer 204 INTRODUCTION The current federal transportation bill, Moving Ahead
Applicability for Green ITS of Heavy Vehicles by using automatic route selection system
 Applicability for Green ITS of Heavy Vehicles by using automatic route selection system Hideyuki WAKISHIMA *1 1. CTI Enginnering Co,. Ltd. 3-21-1 Nihonbashi-Hamacho, Chuoku, Tokyo, JAPAN TEL : +81-3-3668-4698,
TORONTO TRANSIT COMMISSION REPORT NO.
 Form Revised: February 2005 TORONTO TRANSIT COMMISSION REPORT NO. MEETING DATE: October 24, 2012 SUBJECT: DOWNTOWN RAPID TRANSIT EXPANSION STUDY (DRTES) PHASE 1 STRATEGIC PLAN ACTION ITEM RECOMMENDATIONS
Strategic Plan
 2005-2015 Strategic Plan SUMMARY OF THE REVISED PLAN IN 2011 A decade focused on developing mass transit in the Outaouais A updated vision of mass transit in the region The STO is embracing the future
Chapter 740, Street Vending One Year Review
 STAFF REPORT ACTION REQUIRED Chapter 740, Street Vending One Year Review Date: April 7, 2015 To: From: Wards: Reference Number: Licensing and Standards Committee Executive Director, Municipal Licensing
DOWNTOWN PARKING STUDY AND STRATEGIC PLAN
 INTRODUCTION This report includes a summary of several key components of the Rapid City Downtown Parking Study and Strategic Plan, including: Current Conditions Analysis (Inventory and Occupancy and Length
Car Sharing at a. with great results.
 Car Sharing at a Denver tweaks its parking system with great results. By Robert Ferrin L aunched earlier this year, Denver s car sharing program is a fee-based service that provides a shared vehicle fleet
PROMOTION OF EFFICIENT PUBLIC TRANSPORT IN MALAWI BY CHIMWEMWE KAUNDA
 PROMOTION OF EFFICIENT PUBLIC TRANSPORT IN MALAWI BY CHIMWEMWE KAUNDA Introduction Malawi has a population of about 17 million people out of this population 80% is in the rural areas and 20% is in urban
Traffic Data Services: reporting and data analytics using cellular data
 Make traffic and population movement analysis smart, fast, pervasive and cost-effective. Data sheet Traffic Data Services: reporting and data analytics using cellular data Accurate data collection and
San Rafael Transit Center. Update. Golden Gate Bridge, Highway & Transportation District Transportation Committee of the Board of Directors
 Transportation Committee November 17, 2016 Agenda Item No. 5, Update on the San Rafael Transit Center Relocation San Rafael Transit Center Relocation Study Update 11/17/16 Golden Gate Bridge, Highway &
Traffic Engineering Study
 Traffic Engineering Study Bellaire Boulevard Prepared For: International Management District Technical Services, Inc. Texas Registered Engineering Firm F-3580 November 2009 Executive Summary has been requested
AIR QUALITY DETERIORATION IN TEHRAN DUE TO MOTORCYCLES
 Iran. J. Environ. Health. Sci. Eng., 25, Vol. 2, No. 3, pp. 145-152 AIR QUALITY DETERIORATION IN TEHRAN DUE TO MOTORCYCLES * 1 M. Shafiepour and 2 H. Kamalan * 1 Faculty of Environment, University of Tehran,
RELEASED UNDER THE OFFICIAL INFORMATION ACT 1982
 Subject MINISTERIAL BRIEFING NOTE Rapid Transit in Auckland Date 1 November 2017 Briefing number BRI-1133 Contact(s) for telephone discussion (if required) Name Position Direct line Cell phone 1 st contact
HOW TO DELIVER PUBLIC TRANSPORT ON REDUCED BUDGET
 LONDON MAY 25, 2011 HOW TO DELIVER PUBLIC TRANSPORT ON REDUCED BUDGET Marc Le Tourneur Direction de l Innovation et du Développement Sinotropher Conference London - May 25, 2011 - SUMMARY PART - 1 Climate
Citizens Committee for Facilities
 Citizens Committee for Facilities AGENDA Thursday, December 11, 2014 City Council Chambers 305 3 rd Avenue East -Twin Falls, Idaho 11:30 A.M. AGENDA ITEMS Purpose By 1. Discussion and possible action on
CITY OF ANN ARBOR, MICHIGAN 301 E. Huron St., P.O. Box 8647 Ann Arbor, Michigan
 Date: Wednesday, June 18, 2014 Location: Ann Arbor District Library Attendees: 14 citizen attendees Ann Arbor Station Environmental Review Citizen Working Group Meeting Notes Meeting #3 The third meeting
Transport Demand Management Policies in Beijing. CAI Jing Beijing Transport Energy and Environment Center April 2016 in New Delhi
 Transport Demand Management Policies in Beijing CAI Jing Beijing Transport Energy and Environment Center April 2016 in New Delhi Contents I. Beijing Basics II. Transport demand management policies Beijing
Midtown Corridor Alternatives Analysis. Policy Advisory Committee Meeting February 12, 2014
 Midtown Corridor Alternatives Analysis Policy Advisory Committee Meeting February 12, 2014 Today s Agenda Introductions Outreach efforts and survey results Other updates since last meeting Evaluation results
Ex-Ante Evaluation (for Japanese ODA Loan)
") Japanese ODA Loan Ex-Ante Evaluation (for Japanese ODA Loan) 1. Name of the Project Country: India Project: Delhi Mass Rapid Transport System Project Phase 2 (V) Loan Agreement: March 31, 2010 Loan Amount:
Japanese ODA Loan Ex-Ante Evaluation (for Japanese ODA Loan) 1. Name of the Project Country: India Project: Delhi Mass Rapid Transport System Project Phase 2 (V) Loan Agreement: March 31, 2010 Loan Amount:
Energy Technical Memorandum
 Southeast Extension Project Lincoln Station to RidgeGate Parkway Prepared for: Federal Transit Administration Prepared by: Denver Regional Transportation District May 2014 Table of Contents Page No. Chapter