Universitas Sumatera Utara
|
|
|
- Prudence Murphy
- 5 years ago
- Views:
Transcription
1 LAMPIRAN I LAMPRIAN PDRB Harga Berlaku NO KAB/KOTA Asahan Dairi Deli Serdang Humbang Hasundutan Karo Langkat Labuhan Batu Mandailing Natal Nias Nias Selatan Pakpak Bharat Simalungun Tapanuli Selatan Tapanuli Tengah Tapanuli Utara Toba Samosir Binjai Medan Pematang Siantar Padang Sidempuan Sibolga Tanjung Balai Tebing Tinggi
2 LAMPIRAN II LAMPIRAN PENGELUARAN DAERAH No Nama Kab/Kota 2005 BD PD TP BTL BL Total BD 1 Asahan Dairi Deli Serdang Humbang Hasundutan Karo Langkat Labuhan Batu Mandailing Natal Nias Nias Selatan Pakpak Bharat Simalungun Tapanuli Selatan Tapanuli Tengah Tapanuli Utara Toba Samosir Binjai Medan Pematang Siantar Padang Sidempuan Sibolga Tanjung Balai Tebing Tinggi
3 No Nama Kab/Kota 2006 BD PD PENGLRN BTL BL Total BD 1 Asahan Dairi Deli Serdang Humbang Hasundutan Karo Langkat Labuhan Batu Mandailing Natal Nias Nias Selatan Pakpak Bharat Simalungun Tapanuli Selatan Tapanuli Tengah Tapanuli Utara Toba Samosir Binjai Medan Pematang Siantar Padang Sidempuan Sibolga Tanjung Balai Tebing Tinggi
4 No Nama Kab/Kota 2007 BD PD TP BTL BL Total BD 1 Asahan Dairi Deli Serdang Humbang Hasundutan Karo Langkat Labuhan Batu Mandailing Natal Nias Nias Selatan Pakpak Bharat Simalungun Tapanuli Selatan Tapanuli Tengah Tapanuli Utara Toba Samosir Binjai Medan Pematang Siantar Padang Sidempuan Sibolga Tanjung Balai Tebing Tinggi
5 No Nama Kab/Kota 2008 BD PD TP BTL BL Total BD 1 Asahan Dairi Deli Serdang Humbang Hasundutan Karo Langkat Labuhan Batu Mandailing Natal Nias Nias Selatan Pakpak Bharat Simalungun Tapanuli Selatan Tapanuli Tengah Tapanuli Utara Toba Samosir Binjai Medan Pematang Siantar Padang Sidempuan Sibolga Tanjung Balai Tebing Tinggi
6 No Nama Kab/Kota 2009 BD PD TP BTL BL Total BD 1 Asahan Dairi Deli Serdang Humbang Hasundutan Karo Langkat Labuhan Batu Mandailing Natal Nias Nias Selatan Pakpak Bharat Simalungun Tapanuli Selatan Tapanuli Tengah Tapanuli Utara Toba Samosir Binjai Medan Pematang Siantar Padang Sidempuan Sibolga Tanjung Balai Tebing Tinggi
7 No Nama Kab/Kota 2010 BD PD TP BTL BL Total BD 1 Asahan Dairi Deli Serdang Humbang Hasundutan Karo Langkat Labuhan Batu Mandailing Natal Nias Nias Selatan Pakpak Bharat Simalungun Tapanuli Selatan Tapanuli Tengah Tapanuli Utara Toba Samosir Binjai Medan Pematang Siantar Padang Sidempuan Sibolga Tanjung Balai Tebing Tinggi
8 LAMPIRAN III LAMPIRAN PERHITUNGAN DESENTRALISASI FISKAL DF=PAD+DBH/Pengeluaran Daerah PAD DBH Pengeluaran PAD+DBH PAD+DBH/pd x100 Daerah
9
10
11
12 LAMPIRAN IV LAMPIRAN DATA PENDUKUNG SPSS x1 x2 x3 Z Y N DAU DAK LLPDS DF PE
13
14
15
16 LAMPIRAN V LAMPIRAN DATA LOG Log x1 x2 x3 Z Y DAU DAK LLPDS DF PE
17
18
19
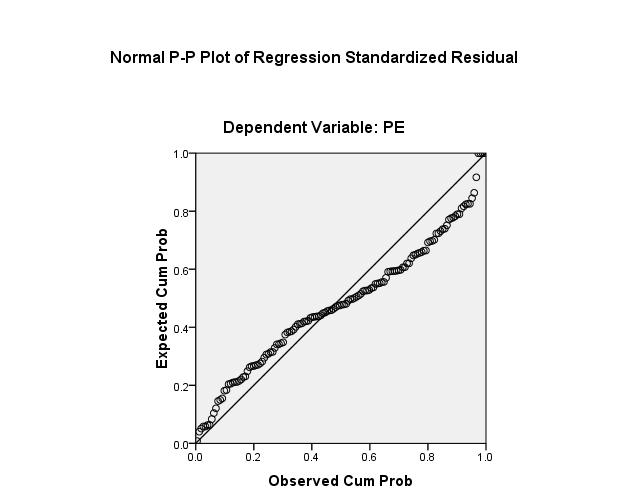
20 LAMPIRAN SPSS LAMPIRAN DATA PENDUKUNG SPSS LAMPIRAN DATA REGRESI LINIER AWAL NPar Tests One-Sample Kolmogorov-Smirnov Test Unstandardized Residual N 138 Normal Parameters a Mean Std. Deviation E9 Most Extreme Differences Absolute.131 Positive.131 Negative Kolmogorov-Smirnov Z Asymp. Sig. (2-tailed).018 a. Test distribution is Normal.
21 Regression Descriptive Statistics N Minimum Maximum Sum Mean Std. Deviation DAU DAK LLPDS DF PE Valid N (listwise) 138 Correlations PE DAU DAK LLPDS Pearson Correlation PE DAU DAK LLPDS Sig. (1-tailed) PE DAU DAK LLPDS N PE DAU
22 DAK LLPDS Model Variables Entered/Removed b Variables Entered 1 LLPDS, DAK, DAU a a. All requested variables entered. b. Dependent Variable: PE Variables Removed. Enter Method Model R R Square Adjusted R Square Std. Error of the Estimate Model Summary b Change Statistics R Square Change F Change df1 df2 Sig. F Change Durbin-Watson a E a. Predictors: (Constant), LLPDS, DAK, DAU b. Dependent Variable: PE ANOVA b Model Sum of Squares df Mean Square F Sig. 1 Regression 1.821E E a Residual 6.555E E19 Total 2.476E a. Predictors: (Constant), LLPDS, DAK, DAU b. Dependent Variable: PE
23 Coefficients a Unstandardized Coefficients Standardized Coefficients Correlations Collinearity Statistics Model B Std. Error Beta t Sig. Zero-order Partial Part Tolerance VIF 1 (Constant) E E DAU DAK LLPDS a. Dependent Variable: PE Collinearity Diagnostics a Dimensi Variance Proportions Model on Eigenvalue Condition Index (Constant) DAU DAK LLPDS a. Dependent Variable: PE
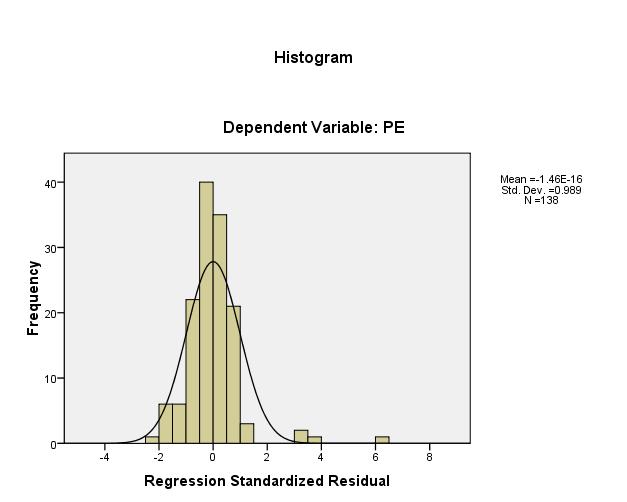
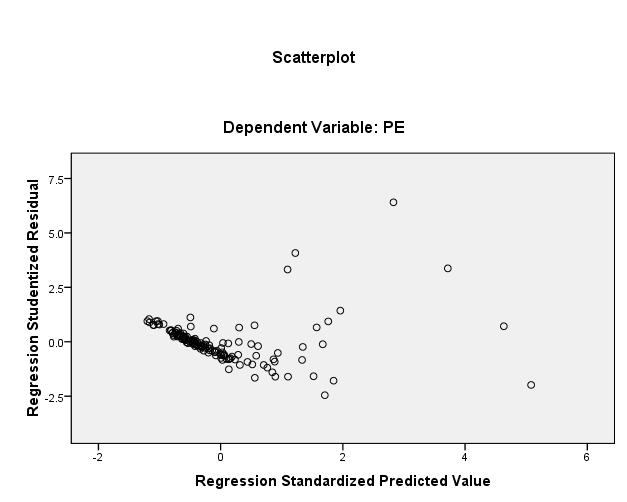
24 Charts
25
26
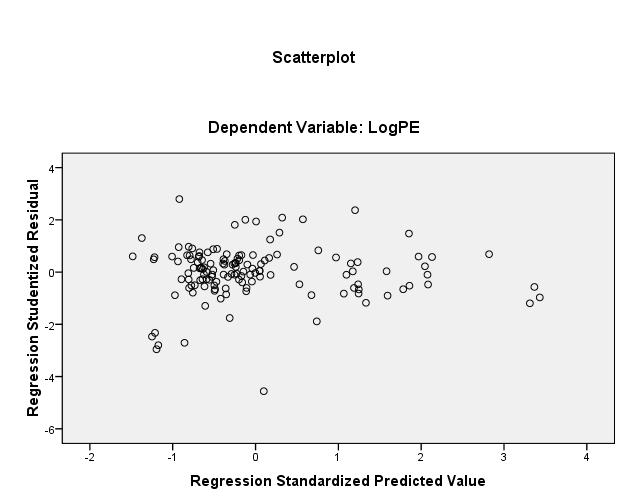
27 LAMPIRAN DATA REGRESI PERSAMAAN LIN-LOG (data LogPE) PE= a+dau + DAK + LLPDYS NPar Tests One-Sample Kolmogorov-Smirnov Test Unstandardized Residual N 138 Normal Parameters a Mean Std. Deviation Most Extreme Differences Absolute.111 Positive.111 Negative Kolmogorov-Smirnov Z Asymp. Sig. (2-tailed).067 a. Test distribution is Normal.
28 Regression Descriptive Statistics Mean Std. Deviation N LogPE DAU DAK LLPDYS Correlations LogPE DAU DAK LLPDYS Pearson Correlation LogPE DAU DAK LLPDYS Sig. (1-tailed) LogPE DAU DAK LLPDYS N LogPE DAU DAK LLPDYS
29 Model Variables Entered/Removed b Variables Entered 1 LLPDYS, DAK, DAU a a. All requested variables entered. b. Dependent Variable: LogPE Variables Removed. Enter Method Model Summary b Std. Error of the Change Statistics Model R R Square Adjusted R Square Estimate R Square Change F Change df1 df2 Sig. F Change Durbin-Watson a a. Predictors: (Constant), LLPDYS, DAK, DAU b. Dependent Variable: LogPE ANOVA b Model Sum of Squares df Mean Square F Sig. 1 Regression a Residual Total a. Predictors: (Constant), LLPDYS, DAK, DAU b. Dependent Variable: LogPE
30 Model Unstandardized Coefficients Standardized Coefficients Coefficients a Correlations Collinearity Statistics B Std. Error Beta T Sig. Zero-order Partial Part Tolerance VIF 1 (Constant) DAU DAK LLPDYS a. Dependent Variable: LogPE Collinearity Diagnostics a Dimensi Variance Proportions Model on Eigenvalue Condition Index (Constant) DAU DAK LLPDYS a. Dependent Variable: LogPE
31 Charts
32
33
34 LAMPIRAN DATA REGRESI SPSS PERSAMAAN DF=a + DAU +DAK+LLPDYS NPar Tests One-Sample Kolmogorov-Smirnov Test Unstandardized Residual N 138 Normal Parameters a Mean Std. Deviation Most Extreme Differences Absolute.101 Positive.101 Negative Kolmogorov-Smirnov Z Asymp. Sig. (2-tailed).120 a. Test distribution is Normal.
35 Regression Descriptive Statistics Mean Std. Deviation N DF DAU E E8 138 DAK E E7 138 LLPDYS E E7 138 Correlations DF DAU DAK LLPDYS Pearson Correlation DF DAU DAK LLPDYS Sig. (1-tailed) DF DAU DAK LLPDYS N DF DAU DAK LLPDYS
36 Model Variables Entered/Removed b Variables Entered 1 LLPDYS, DAK, DAU a a. All requested variables entered. b. Dependent Variable: DF Variables Removed. Enter Method Model Summary b Std. Error of the Change Statistics Model R R Square Adjusted R Square Estimate R Square Change F Change df1 df2 Sig. F Change Durbin-Watson a a. Predictors: (Constant), LLPDYS, DAK, DAU b. Dependent Variable: DF ANOVA b Model Sum of Squares df Mean Square F Sig. 1 Regression a Residual Total a. Predictors: (Constant), LLPDYS, DAK, DAU b. Dependent Variable: DF
37 Model Unstandardized Coefficients Standardized Coefficients Coefficients a Correlations Collinearity Statistics B Std. Error Beta t Sig. Zero-order Partial Part Tolerance VIF 1 (Constant) DAU DAK LLPDYS a. Dependent Variable: DF Collinearity Diagnostics a Dimensi Variance Proportions Model on Eigenvalue Condition Index (Constant) DAU DAK LLPDYS a. Dependent Variable: DF
38 Residuals Statistics a Minimum Maximum Mean Std. Deviation N Predicted Value Std. Predicted Value Standard Error of Predicted Value Adjusted Predicted Value Residual E Std. Residual Stud. Residual Deleted Residual E Stud. Deleted Residual Mahal. Distance Cook's Distance Centered Leverage Value a. Dependent Variable: DF
39 Charts
40

41
42 LAMPIRAN DATA REGRESI SPSS PERSAMAAN Moderating Residual ABS = a + PE Regression Descriptive Statistics Mean Std. Deviation N ABSresd PE E E Correlations ABSresd PE Pearson Correlation ABSresd PE Sig. (1-tailed) ABSresd..000 PE.000. N ABSresd PE Variables Entered/Removed b Model Variables Entered Variables Removed Method 1 PE a. Enter a. All requested variables entered.
43 Model Variables Entered/Removed b Variables Entered Variables Removed 1 PE a. Enter b. Dependent Variable: ABSresd Method Model Summary b Change Statistics Std. Error of the Model R R Square Adjusted R Square Estimate R Square Change F Change df1 df2 Sig. F Change Durbin-Watson a a. Predictors: (Constant), PE b. Dependent Variable: ABSresd ANOVA b Model Sum of Squares df Mean Square F Sig. 1 Regression a Residual Total a. Predictors: (Constant), PE b. Dependent Variable: ABSresd
44 Coefficients a Model Unstandardized Coefficients Standardized Coefficients Correlations Collinearity Statistics B Std. Error Beta t Sig. Zero-order Partial Part Tolerance VIF 1 (Constant) PE a. Dependent Variable: ABSresd Collinearity Diagnostics a Dimensi Variance Proportions Model on Eigenvalue Condition Index (Constant) PE a. Dependent Variable: ABSresd Residuals Statistics a Minimum Maximum Mean Std. Deviation N Predicted Value Residual Std. Predicted Value Std. Residual a. Dependent Variable: ABSresd
HASIL OUTPUT SPSS. Reliability Scale: ALL VARIABLES
 139 HASIL OUTPUT SPSS Reliability Scale: ALL VARIABLES Case Processing Summary N % 100 100.0 Cases Excluded a 0.0 Total 100 100.0 a. Listwise deletion based on all variables in the procedure. Reliability
. Enter. Model Summary b. Std. Error. of the. Estimate. Change. a. Predictors: (Constant), Emphaty, reliability, Assurance, responsive, Tangible
, Emphaty, reliability, Assurance, responsive, Tangible") LAMPIRAN Variables Entered/Removed b Variables Model Variables Entered Removed Method 1 Emphaty, reliability, Assurance, responsive, Tangible a. Enter a. All requested variables entered. b. Dependent Variable:
LAMPIRAN Variables Entered/Removed b Variables Model Variables Entered Removed Method 1 Emphaty, reliability, Assurance, responsive, Tangible a. Enter a. All requested variables entered. b. Dependent Variable:
LAMPIRAN DAFTAR SAMPEL PENELITIAN. Kriteria No. Nama Perusahaan. Sampel Emiten
 LAMPIRAN DAFTAR SAMPEL PENELITIAN Kode Kriteria No. Nama Perusahaan Sampel Emiten 1 2 3 1. AGRO PT. Bank Agroniaga, Tbk 1 2. BABP PT. Bank ICB Bumiputera Indonesia, Tbk X - 3. BBCA PT. Bank Central Asia,
LAMPIRAN I Data Perusahaan Sampel kode DPS EPS Ekuitas akpi ,97 51,04 40,
 LAMPIRAN I Data Perusahaan Sampel kode DPS EPS Ekuitas 2013 2014 2015 2013 2014 2015 2013 2014 2015 akpi 34 8 9 50,97 51,04 40,67 1.029.336.000.000 1.035.846.000.000 1.107.566.000.000 asii 216 216 177
CHAPTER V CONCLUSION, SUGGESTION AND LIMITATION. 1. Independent commissioner boards proportion does not negatively affect
 CHAPTER V CONCLUSION, SUGGESTION AND LIMITATION 5.. Conclusion Based on data analysis that has been done, researcher may draw following conclusions:. Independent commissioner boards proportion does not
Daftar Sampel Perusahaan
 Lampiran i Daftar Sampel Perusahaan NAMA PERUSAHAAN PT. Bank Bukopin Tbk PT. Bank Bumi Arta Tbk PT. Bank Central Asia Tbk PT. Bank CIMB Niaga Tbk PT. Bank Danamon Indonesia Tbk PT. Bank Ekonomi Raharja
Lampiran 1. Data Perusahaan
 Lampiran. Data Perusahaan NO PERUSH MV EARN DIV CFO LB.USAHA TOT.ASS ACAP 3 9 8 5 369 9678 376 ADES 75-35 - 6 3559-5977 7358 3 AQUA 5 368 65 335 797 678 53597 BATA 88 5 9 863 958 93 5 BKSL 5.3 -. 9-9 5
Lampiran IV. Hasil Output SPSS Versi 16.0 untuk Analisis Deskriptif
 182 Lampiran IV. Hasil Output SPSS Versi 16.0 untuk Analisis Deskriptif Frequencies Statistics Kinerja Guru Sikap Guru Thdp Kepsek Motivasi Kerja Guru Kompetensi Pedagogik Guru N Valid 64 64 64 64 Missing
LAMPIRAN 1. Lampiran Nama dan Kondisi Perusahaan Textile No Kode Nama Perusahaan Hasil z-score FD Non-FD
 87 LAMPIRAN 1. Lampiran Nama dan Kondisi Perusahaan Textile 2010-2014 No Kode Nama Perusahaan Hasil z-score FD Non-FD 1 ADMG PT Polychem Indonesia Tbk 1,39 1 2 ARGO PT Argo Pantes Tbk 0,93 1 3 CTNX PT
DATA SAMPEL TAHUN 2006
 DATA SAMPEL TAHUN 2006 No Nama Emiten CGPI Kode Saham Harga Saham EPS PER Laba Bersih 1 Bank Niaga 89.27 BNGA 920 54 17.02 647,732 2 Bank Mandiri 83.66 BMRI 2,900 118 24.65 2,422,472 3 Astra International
LAMPIRAN A. Tabulasi Data Perusahaan Sample
 LAMPIRAN A Tabulasi Data Perusahaan Sample Current Ratio (%) NO Kode Emiten Nama Perusahaan ASII Astra International Tbk. 2 AUTO Astra Otoparts Tbk. 3 BATA Sepatu Bata Tbk. 4 BRAM Indo Kordsa Tbk 5 BRNA
TRY OUT 30 Responden Variabel Kompetensi/ x1
 1 TRY OUT 30 Responden Variabel Kompetensi/ x1 Case Processing Summary N % 30 100.0 Cases Excluded a 0.0 Total 30 100.0 a. Listwise deletion based on all variables in the procedure. Reliability Statistics
Lampiran i Jadwal Penelitian
 Lampiran i Jadwal Penelitian Tahap penelitian Juni Juli Agust Sept Oktb Pengajuan Judul Penyetujuan proposal Penyelesain proposal Bimbingan skripisi 81 Lampiran i (lanjutan) Daftar Sampel Perusahaan Manufaktur
Rata-Rata Nilai Debt to Equity Ratio (DER) Perusahaan Otomotif yang 0, ,97 0, ,44 1,9 1,6 1,4 1,7 1,65
 Perusahaan Otomotif yang 0, ,97 0, ,44 1,9 1,6 1,4 1,7 1,65") Lampiran I Rata-Rata Nilai Debt to Equity Ratio (DER) Perusahaan Otomotif yang Terdaftar di Bursa Efek Indonesia Periode 2010-2013 DER No Kode Nama perusahaan 2010 2011 2012 2013 Rata-rata 1. ASII PT Astra
Lampiran I Rata-Rata Nilai Debt to Equity Ratio (DER) Perusahaan Otomotif yang Terdaftar di Bursa Efek Indonesia Periode 2010-2013 DER No Kode Nama perusahaan 2010 2011 2012 2013 Rata-rata 1. ASII PT Astra
TRY OUT 25 Responden Variabel Kepuasan / x1
 1 TRY OUT 25 Responden Variabel Kepuasan / x1 Case Processing Summary N % 25 100.0 Cases Excluded a 0.0 Total 25 100.0 a. Listwise deletion based on all variables in the procedure. Reliability Statistics
LAMPIRAN I FORMULIR SURVEI
 LAMPIRAN I FORMULIR SURVEI 56 Universitas Kristen Maranatha L.1.1 FORMULIR SURVEI KEBISINGAN LALULINTAS Lokasi : Cuaca : Hari/Tanggal : Surveyor : Periode / menit 5 10 15 20 25 30 35 40 45 50 55 60 65
UJI VALIDITAS DAN RELIABILIAS VARIABEL KOMPENSASI
 1 UJI VALIDITAS DAN RELIABILIAS VARIABEL KOMPENSASI Case Processing Summary N % 20 100.0 Cases Excluded a 0.0 Total 20 100.0 a. Listwise deletion based on all variables in the procedure. Reliability Statistics
Lampiran 1. Daftar Sampel Perusahaan
 Lampiran 1. Daftar Sampel Perusahaan NO. KODE NAMA PERUSAHAAN 1 ARNA Arwana Citramulia Tbk. 2 ASII Astra Internastional Tbk. 3 AUTO Astra otoparts Tbk. 4 BTON Betonjaya Manunggal Tbk 5 DVLA Darya-Varia
Perusahaan Consumer Goods yang Terdaftar di BEI ( ) Nama Perusahaan Perusahaan 1
 Nama Perusahaan Perusahaan 1") LAMPIRAN 1 Perusahaan Consumer Goods yang Terdaftar di BEI (2010-2012) No. Sub Sektor Kode Nama Perusahaan Perusahaan 1 ADES Akasha Wira Internasional Tbk 2 AISA Tiga Pilar Sejahtera Food Tbk 3 ALTO Tri
LAMPIRAN 1 Perusahaan Consumer Goods yang Terdaftar di BEI (2010-2012) No. Sub Sektor Kode Nama Perusahaan Perusahaan 1 ADES Akasha Wira Internasional Tbk 2 AISA Tiga Pilar Sejahtera Food Tbk 3 ALTO Tri
LAMPIRAN. Lampiran 1 Data Sampel Penelitian
 LAMPIRAN Lampiran Data Sampel Penelitian Variabel Karakteristik Auditor pada Perusahaan Sampel Ukuran KAP No Kode 2 2 22 23 (Aryanto, Amir AGRO Jusuf, Mawar & Saptoto) 2 BABP 3 BACA 4 BAEK 5 BBCA 6 BBKP
Data Nama Perusahaan Perbankan Yang Terdaftar Di BEI.
 LAMPIRAN Lampiran 1 Data Nama Perusahaan Perbankan Yang Terdaftar Di BEI. No Kode Perusahaan Nama Perusahaan 1 AGRO Bank Rakyat Indonesia Agroniaga Tbk 2 BMRI Bank Mandiri (Persero) Tbk 3 BMAS PT Bank
DATA PENELITIAN 1. CAR CAR (%)
") DATA PENELITIAN. CAR No. Tahun Nama Bank CAR (%) Arta Niaga Kencana 2,8 2 Artha Graha 0,58 3 Asiatic -9,9 4 Danpac 25,74 5 Global International 42, 6 Harmoni 7,47 7 IFI 22,62 8 Bukopin 20,37 9 International
DATA PENELITIAN. CAR No. Tahun Nama Bank CAR (%) Arta Niaga Kencana 2,8 2 Artha Graha 0,58 3 Asiatic -9,9 4 Danpac 25,74 5 Global International 42, 6 Harmoni 7,47 7 IFI 22,62 8 Bukopin 20,37 9 International
Industry Classification/Stock Name
 Lampiran 1 : Data Perusahaan Sampel Industry Classification/Stock Name 1. AGRICULTURE Plantation 1 AALI Astra Argo Lestari Tbk (S) 2 LSIP PP London Sumatera Tbk (S) 3 SGRO Sampoerna Agro Tbk (S) 4 SMAR
Lampiran 1 DAFTAR PERUSAHAAN MANUFAKTUR YANG TERDAFTAR DI BURSA EFEK INDONESIA TAHUN (Menyajikan Laporan Keuangan Secara Berturut-turut)
") Lampiran 1 DAFTAR PERUSAHAAN MANUFAKTUR YANG TERDAFTAR DI BURSA EFEK INDONESIA TAHUN 2014-2016 (Menyajikan Laporan Keuangan Secara Berturut-turut) NO KODE NAMA PERUSAHAAN 1 ALKA PT ALASKA INDONESIA TBK
Lampiran 1 DAFTAR PERUSAHAAN MANUFAKTUR YANG TERDAFTAR DI BURSA EFEK INDONESIA TAHUN 2014-2016 (Menyajikan Laporan Keuangan Secara Berturut-turut) NO KODE NAMA PERUSAHAAN 1 ALKA PT ALASKA INDONESIA TBK
Daftar Sampel Perusahaan Pertambangan. 4 BORN Borneo Lumbung Energy & Metal, Tbk
 Lampiran i Daftar Sampel Perusahaan Daftar Sampel Perusahaan Pertambangan No Kode Sampel 1 ADRO Adaro Energy, Tbk 2 ANTM Aneka Tambang (Persero), Tbk 3 ATPK ATPK Resources, Tbk 4 BORN Borneo Lumbung Energy
LAMPIRAN 1 : DAFTAR PERUSAHAAN SAMPEL PERIODE
 69 LAMPIRAN 1 : DAFTAR PERUSAHAAN SAMPEL PERIODE 2008-2010 No Kode Nama Perusahaan 1 AISA PT Tiga Pilar Sejahtera Food Tbk 2 ARNA PT Arwana Citramulia Tbk 3 ASII PT Astra International Tbk 4 AUTO PT Astra
Team project 2017 Dony Pratidana S. Hum Bima Agus Setyawan S. IIP
 Hak cipta dan penggunaan kembali: Lisensi ini mengizinkan setiap orang untuk menggubah, memperbaiki, dan membuat ciptaan turunan bukan untuk kepentingan komersial, selama anda mencantumkan nama penulis
Daftar Perusahaan Real Estate dan Property
 Lampiran 1 Daftar Perusahaan Real Estate dan Property Kriteria No Kode Nama Perusahaan 1 2 3 Sampel 1 APLN Agung Podomoro Land Tbk 2 ASRI Alam Sutera Realty Tbk 1 3 ELTY Bakrieland Development Tbk 4 BAPA
LAMPIRAN 1. Tabel 1. Data Indeks Harga Saham PT. ANTAM, tbk Periode 20 Januari Februari 2012
 LAMPIRAN 1 Tabel 1. Data Indeks Harga Saham PT. ANTAM, tbk Periode 20 Januari 2011 29 Februari 2012 No Tanggal Indeks Harga Saham No Tanggal Indeks Harga Saham 1 20-Jan-011 2.35 138 05-Agst-011 1.95 2
a. Uji kenormalan data model sebaran suhu pada band 7 citra tahun 2001 b. Uji kenormalan data model sebaran suhu pada band 4 citra tahun 2006
 Dependent Variable: Suhu Regression Standardized Residual of Plot P-P Normal Dependent Variable: Suhu Regression Standardized Residual of Plot P-P Normal Lampiran 1. Hasil Uji Normalitas a. Uji kenormalan
Getting Started with Correlated Component Regression (CCR) in XLSTAT-CCR
 in XLSTAT-CCR") Tutorial 1 Getting Started with Correlated Component Regression (CCR) in XLSTAT-CCR Dataset for running Correlated Component Regression This tutorial 1 is based on data provided by Michel Tenenhaus and
Tutorial 1 Getting Started with Correlated Component Regression (CCR) in XLSTAT-CCR Dataset for running Correlated Component Regression This tutorial 1 is based on data provided by Michel Tenenhaus and
Universitas Sumatera Utara
 LAMPIRAN 1 DATA AWAL PERUSAHAAN SAMPEL No. KODE NAMA PERUSAHAAN AGE (Tahun) PPS (%) SIZE (Rupiah) UNDERP RICING (%) 1 EMTK Elang Mahkota Teknologi Tbk 26,44 10 4.314.284.667.000 1 2 PTPP PT PP (PERSERO)
APPENDIX A. A.1 Sample of Indian MFIs
 APPENDIX A A.1 Sample of Indian MFIs S.N. Sample of Indian MFIs Inception Legal Form 1 SEWA 1974 BANK 2 CRESA 1980 NGO 3 SKDRDP 1982 NGO 4 GRAMA VIDYALAY 1983 NGO 5 JANODAYA 1987 NGO 6 RASS 1989 NGO 7
Lampiran 1 Tabel 3.1 Sampel No. Kode Nama Perusahaan Sumber : didownload tanggal 13 November 2016 (data diolah)
") 72 Lampiran 1 Tabel 3.1 Sampel No. Kode Nama Perusahaan 1 ALKA PT. Alakasa Industrindo Tbk 2 BIMA PT. Primarindo Asia Infrastructure Tbk 3 BRNA PT. Berlina Tbk 4 ETWA PT. Eterindo Wahanatama Tbk 5 FASW
72 Lampiran 1 Tabel 3.1 Sampel No. Kode Nama Perusahaan 1 ALKA PT. Alakasa Industrindo Tbk 2 BIMA PT. Primarindo Asia Infrastructure Tbk 3 BRNA PT. Berlina Tbk 4 ETWA PT. Eterindo Wahanatama Tbk 5 FASW
: ( .
 2 27 ( ) 2 3 4 2 ( ) 59 Y n n U i ( ) & smith H 98 Draper N Curran PJ,bauer DJ & Willoughby Kam,Cindy &Robert 23 MT24 Jaccard,J & Rebert T23 Franzese 23 Aiken LS & West SG 99 " Multiple Regression Testing
Stat 301 Lecture 30. Model Selection. Explanatory Variables. A Good Model. Response: Highway MPG Explanatory: 13 explanatory variables
 Model Selection Response: Highway MPG Explanatory: 13 explanatory variables Indicator variables for types of car Sports Car, SUV, Wagon, Minivan 1 Explanatory Variables Engine size (liters) Cylinders (number)
Appendix B STATISTICAL TABLES OVERVIEW
 Appendix B STATISTICAL TABLES OVERVIEW Table B.1: Proportions of the Area Under the Normal Curve Table B.2: 1200 Two-Digit Random Numbers Table B.3: Critical Values for Student s t-test Table B.4: Power
LAMPIRAN. Lampiran I. Daftar Populasi Perusahaan Properti dan Real Estate di Bursa Efek Indonesia No Kode. Kriteria Nama Perusahaan Emiten 1 2 3
 LAMPIRAN Lampiran I Daftar Populasi Perusahaan Properti dan Real Estate di Bursa Efek Indonesia No Kode Kriteria Nama Perusahaan Emiten 1 2 3 Sampel 1 ASRI Alam Sutera Reality Tbk 1 2 BAPA Bekasi Asri
Daftar Nama Perusaahan. yang ada di Industri Consumer Goods periode
 99 Lampiran 1 Daftar Nama Perusaahan yang ada di Industri Consumer Goods periode 2013-2016 KODE AISA ALTO CEKA CLEO DLTA ICBP INDF HOKI MLBI MYOR PSDN ROTI SKBM SKLT STTP ULTJ GGRM HMSP RMBA WIIM CINT
Lampiran 1: Nama Perusahaan yang menjadi Sampel Penelitian
 LAMPIRAN Lampiran 1: Nama Perusahaan yang menjadi Sampel Penelitian NO. KODE NAMA PERUSAHAAN 1. INTA PT Intraco Penta Tbk 2. JKON PT Jaya Konstruksi Manggala Pratama Tbk 3. KONI PT Perdana Bangun Pusaka
MODUL PELATIHAN SEM ANANDA SABIL HUSSEIN, PHD
 MODUL PELATIHAN SEM ANANDA SABIL HUSSEIN, PHD PUSAT KAJIAN DAN PENGABDIAN MASYARAKAT JURUSAN MANAJEMEN UNIVERSITAS BRAWIJAYA 2018 1) 2) ANALISA JALUR 1) LMK = 27,209 3,599IPK + 1,749 x 10-7 US + 0,019JR
Stat 401 B Lecture 31
 Model Selection Response: Highway MPG Explanatory: 13 explanatory variables Indicator variables for types of car Sports Car, SUV, Wagon, Minivan 1 Explanatory Variables Engine size (liters) Cylinders (number)
Lampiran 1. Proses Pemilihan Sampel. Universitas Sumatera Utara
 Lampiran 1 Proses Pemilihan Sampel No. Kode Emiten Nama Perusahaan Tanggal Pengumuman Stock Split Kriteria Pemilihan Sampel 1 2 3 4 Sampel 1. CTBN Citra Tubindo 12 Januari Tbk 2009 2. ARNA Arwana 11 September
Sharif University of Technology. Graduate School of Management and Economics. Econometrics I. Fall Seyed Mahdi Barakchian
 Sharif University of Technology Graduate School of Management and Economics Econometrics I Fall 2010 Seyed Mahdi Barakchian Textbook: Wooldridge, J., Introductory Econometrics: A Modern Approach, South
Important Formulas. Discrete Probability Distributions. Probability and Counting Rules. The Normal Distribution. Confidence Intervals and Sample Size
 blu38582_if_1-8.qxd 9/27/10 9:19 PM Page 1 Important Formulas Chapter 3 Data Description Mean for individual data: Mean for grouped data: Standard deviation for a sample: X2 s X n 1 or Standard deviation
fruitfly fecundity example summary Tuesday, July 17, :13:19 PM 1
 fruitfly fecundity example summary Tuesday, July 17, 2018 02:13:19 PM 1 The UNIVARIATE Procedure Variable: fecund line = NS Basic Statistical Measures Location Variability Mean 33.37200 Std Deviation 8.94201
Lampiran 1. Daftar Perusahaan Sampel. No Kode Nama Perusahaan
 Lampiran 1. Daftar Perusahaan Sampel No Kode Nama Perusahaan 1 ADES PT Akasha Wira Internasional (d/h Ades Waters Indonesia) Tbk. 2 AISA PT Tiga Pilar Sejahterah (d/h Asia Intiselera) Tbk. 3 ALMI PT Alumindo
MOTORCYCLE ACCIDENT MODEL ON THE ROAD SECTION OF HIGHLANDS REGION BY USING GENELARIZED LINEAR MODEL
 International Journal of Civil Engineering and Technology (IJCIET) Volume 8, Issue 10, October 2017, pp. 1249-1258 1248, Article ID: IJCIET_08_10_127 Available online at http://http://www.iaeme.com/ijciet/issues.asp?jtype=ijciet&vtype=8&itype=10
Lampiran 1. Uji Validitas dan Reliability Variabel Kualitas Pelayanan
 Lampira 1. Uji itas da Reliability Variabel Kualitas Pelayaa 1 Frequecy Percet Percet Percet Kurag setuju 14 14.1 14.1 14.1 Ragu-ragu 57 57.6 57.6 71.7 Setuju 24 24.2 24.2 96.0 Sagat Setuju 4 4.0 4.0 100.0
FINANCIAL PERFORMANCE OF TWO WHEELER INDUSTRY IN INDIA
 I J A B E R, Vol. 14, No. 6, (2016): 3607-3621 FINANCIAL PERFORMANCE OF TWO WHEELER INDUSTRY IN INDIA A. Aparna * Abstract: Over the past many years, two wheelers have been garnering an important space
Drilling Example: Diagnostic Plots
 Math 3080 1. Treibergs Drilling Example: Diagnostic Plots Name: Example March 1, 2014 This data is taken from Penner & Watts, Mining Information, American Statistician 1991, as quoted by Levine, Ramsey
The PRINCOMP Procedure
 Grizzly Bear Project - Coastal Sites - invci 15:14 Friday, June 11, 2010 1 Food production variables The PRINCOMP Procedure Observations 16 Variables 4 Simple Statistics PRECIP ndvi aet temp Mean 260.8102476
Daftar Perusahaan Sektor Property and Realestate yang terdaftar di BEI
 83 LAMPIRAN 1 Daftar Perusahaan Sektor Property and Realestate yang terdaftar di BEI Kode Nama Perusahaan No Saham 1 APLN Agung Podomoro Land Tbk 2 ASRI Alam Sutera Reality Tbk 3 BAPA Bekasi Asri Pemula
EMPIRICAL ANALYSIS ON ROAD TRAFFIC CRASHES IN ANAMBRA STATE, NIGERIA: ACCIDENT PREDICTION MODELING USING REGRESSION APPROACH
 EMPIRICAL ANALYSIS ON ROAD TRAFFIC CRASHES IN ANAMBRA STATE, NIGERIA: ACCIDENT PREDICTION MODELING USING REGRESSION APPROACH Obubu M a*, Konwe C.S b, Nwabenu D.C c, Omokri Peter A d, Chijioke M e a Department
LAMPIRAN. Daftar Perusahaan Manufaktur yang menjadi sampel. 1 AMFG PT.Asahimas Flat Glass Tbk 1. 2 INDF PT. Indofood Skses Makmur Tbk 2
 LAMPIRAN Lampiran i Daftar Perusahaan Manufaktur yang menjadi sampel No Kode Populasi Kriteria Sampel 1 2 3 4 1 AMFG PT.Asahimas Flat Glass 1 2 INDF PT. Indofood Skses Makmur 2 3 UNIT PT.Nusantara Inti
From Developing Credit Risk Models Using SAS Enterprise Miner and SAS/STAT. Full book available for purchase here.
 From Developing Credit Risk Models Using SAS Enterprise Miner and SAS/STAT. Full book available for purchase here. About this Book... ix About the Author... xiii Acknowledgments...xv Chapter 1 Introduction...
Regression Models Course Project, 2016
 Regression Models Course Project, 2016 Venkat Batchu July 13, 2016 Executive Summary In this report, mtcars data set is explored/analyzed for relationship between outcome variable mpg (miles for gallon)
LECTURE 6: HETEROSKEDASTICITY
 LECTURE 6: HETEROSKEDASTICITY Summary of MLR Assumptions 2 MLR.1 (linear in parameters) MLR.2 (random sampling) the basic framework (we have to start somewhere) MLR.3 (no perfect collinearity) a technical
LAMPIRAN. Lampiran 1. Data deviden untuk menghitung economic performance tahun
 LAMPIRAN Lampiran 1. Data deviden untuk menghitung economic performance tahun 2011-2013 No Kode 2011 2012 2013 Div Div Div 1 SMCB 23 32 48 2 UNVR 250 300 300 3 AMFG 80 80 80 4 INTP 263 293 450 5 ICBP 116
tool<-read.csv(file="d:/chilo/regression 7/tool.csv", header=t) tool
 tool") Regression nalysis lab 7 1 Indicator variables 1.1 Import data tool
Regression nalysis lab 7 1 Indicator variables 1.1 Import data tool
Lampiran 1. Penjualan PT Honda Mandiri Bogor
 LAMPIRAN 64 Lampiran 1. Penjualan PT Honda Mandiri Bogor 29-211 PENJUALAN 29 TYPE JAN FEB MAR APR MEI JUNI JULI AGT SEP OKT NOV DES TOTA JAZZ 16 14 22 15 23 19 13 28 15 28 3 25 248 FREED 23 25 14 4 13
Antonio Olmos Priyalatha Govindasamy Research Methods & Statistics University of Denver
 Antonio Olmos Priyalatha Govindasamy Research Methods & Statistics University of Denver American Evaluation Association Conference, Chicago, Ill, November 2015 AEA 2015, Chicago Ill 1 Paper overview Propensity
DAFTAR LAMPIRAN. Daftar Perusahaan yang dijadikan sampel
 83 DAFTAR LAMPIRAN Daftar Perusahaan yang dijadikan sampel No KODE Nama perusahaan 01 ALKA Alakasa Industrindo Tbk 02 ALMI Alumindo Light Metal Industri Tbk 03 AMFG Asahimas Flat Glass Tbk 04 ASTRA Astra
Review of Upstate Load Forecast Uncertainty Model
 Review of Upstate Load Forecast Uncertainty Model Arthur Maniaci Supervisor, Load Forecasting & Energy Efficiency New York Independent System Operator Load Forecasting Task Force June 17, 2011 Draft for
Daftar Nama Perusahaan Sampel Tahun 2010
 LAMPIRAN Daftar Nama Perusahaan Sampel Tahun 2010 No Kode Perusahaan Nama Perusahaan 1 INTP PT Indocement Tunggal Prakarsa Tbk 2 SMGR PT Semen Indonesia Persero Tbk 3 ARNA PT Arwana Citramulia Tbk 4 TOTO
namibia UniVERSITY OF SCIEnCE AnD TECHnOLOGY FACULTY OF HEALTH AND APPLIED SCIENCES DEPARTMENT OF MATHEMATICS AND STATISTICS MARKS: 100
 namibia UniVERSITY OF SCIEnCE AnD TECHnOLOGY FACULTY OF HEALTH AND APPLIED SCIENCES DEPARTMENT OF MATHEMATICS AND STATISTICS QUALIFICATION: BACHELOR OF ECONOMICS -., QUALIFICATION CODE: 7BAMS LEVEL: 7
Reliability and Validity of Seat Interface Pressure to Quantify Seating Comfort in Motorcycles
 Reliability and Validity of Seat Interface Pressure to Quantify Seating Comfort in Motorcycles Sai Praveen Velagapudi a,b, Ray G. G b a Research & Development, TVS Motor Company, INDIA; b Industrial Design
THERMOELECTRIC SAMPLE CONDITIONER SYSTEM (TESC)
") THERMOELECTRIC SAMPLE CONDITIONER SYSTEM (TESC) FULLY AUTOMATED ASTM D2983 CONDITIONING AND TESTING ON THE CANNON TESC SYSTEM WHITE PAPER A critical performance parameter for transmission, gear, and hydraulic
THERMOELECTRIC SAMPLE CONDITIONER SYSTEM (TESC) FULLY AUTOMATED ASTM D2983 CONDITIONING AND TESTING ON THE CANNON TESC SYSTEM WHITE PAPER A critical performance parameter for transmission, gear, and hydraulic
Motor Trend Yvette Winton September 1, 2016
 Motor Trend Yvette Winton September 1, 2016 Executive Summary Objective In this analysis, the relationship between a set of variables and miles per gallon (MPG) (outcome) is explored from a data set of
Modeling Ignition Delay in a Diesel Engine
 Modeling Ignition Delay in a Diesel Engine Ivonna D. Ploma Introduction The object of this analysis is to develop a model for the ignition delay in a diesel engine as a function of four experimental variables:
Level of service model for exclusive motorcycle lane
 387 Level of service model for exclusive motorcycle lane Seyed Farzin Faezi, Hussain Hamid, Sulistyo Arintono and Seyed Rasoul Davoodi Dept. of Civil Engineering, University Putra Malaysia, 43400, UPM
LAMPIRAN 1 Perusahaan Sampel Penelitian Tahun
 LAMPIRAN 1 Perusahaan Sampel Penelitian Tahun 2008-2010 No. Perusahaan Kode Tahun 1. PT. Gozco Plantation Tbk. GZCO 2008 2. PT. Indika Energy Tbk. INDY 2008 3. PT. Adhi Karya (Persero) Tbk. ADHI 2008 4.
Influence of motorcycles lane to the traffic volume and travel speed in Denpasar, Indonesia
 IOP Conference Series: Earth and Environmental Science PAPER OPEN ACCESS Influence of motorcycles lane to the traffic volume and travel speed in Denpasar, Indonesia To cite this article: A M Mulyadi 2018
EXST7034 Multiple Regression Geaghan Chapter 11 Bootstrapping (Toluca example) Page 1
 Page 1") Chapter 11 Bootstrapping (Toluca example) Page 1 Toluca Company Example (Problem from Neter, Kutner, Nachtsheim & Wasserman 1996,1.21) A particular part needed for refigeration equipment replacement parts
Chapter 11 Bootstrapping (Toluca example) Page 1 Toluca Company Example (Problem from Neter, Kutner, Nachtsheim & Wasserman 1996,1.21) A particular part needed for refigeration equipment replacement parts
The Coefficient of Determination
 The Coefficient of Determination Lecture 46 Section 13.9 Robb T. Koether Hampden-Sydney College Tue, Apr 13, 2010 Robb T. Koether (Hampden-Sydney College) The Coefficient of Determination Tue, Apr 13,
Lampiran 1. Tabel Sampel Penelitian
 Lampiran 1 Tabel Sampel Penelitian No Kode Emiten Nama Perusahaan Tanggal IPO 1 APLN Agung Podomoro Land Tbk 11 Nov 2010 2 ASRI Alam Sutera Reality Tbk 18 Dec 2007 3 BAPA Bekasi Asri Pemula Tbk 14 Jan
Statistics and Quantitative Analysis U4320. Segment 8 Prof. Sharyn O Halloran
 Statistics and Quantitative Analysis U4320 Segment 8 Prof. Sharyn O Halloran I. Introduction A. Overview 1. Ways to describe, summarize and display data. 2.Summary statements: Mean Standard deviation Variance
female male help("predict") yhat age
 yhat age") 30 40 50 60 70 female male 1.0 help("predict") 0.5 yhat 0.0 0.5 1.0 30 40 50 60 70 age 30 40 50 60 70 1.5 1.0 female male help("predict") 0.5 yhat 0.0 0.5 1.0 1.5 30 40 50 60 70 age 2 Wald Statistics Response:
30 40 50 60 70 female male 1.0 help("predict") 0.5 yhat 0.0 0.5 1.0 30 40 50 60 70 age 30 40 50 60 70 1.5 1.0 female male help("predict") 0.5 yhat 0.0 0.5 1.0 1.5 30 40 50 60 70 age 2 Wald Statistics Response:
Author s Accepted Manuscript
 Author s Accepted Manuscript Dataset on statistical analysis of Jet A-1 fuel laboratory properties for on-spec into-plane operations Aderibigbe Israel Adekitan, Tobi Shomefun, Temitope M. John, Bukola
Preface... xi. A Word to the Practitioner... xi The Organization of the Book... xi Required Software... xii Accessing the Supplementary Content...
 Contents Preface... xi A Word to the Practitioner... xi The Organization of the Book... xi Required Software... xii Accessing the Supplementary Content... xii Chapter 1 Introducing Partial Least Squares...
Attribution-NonCommercial-NoDerivs 2.0 KOREA. Share copy and redistribute the material in any medium or format
 Attribution-NonCommercial-NoDerivs 2.0 KOREA You are free to : Share copy and redistribute the material in any medium or format Under the follwing terms : Attribution You must give appropriate credit,
Professor Dr. Gholamreza Nakhaeizadeh. Professor Dr. Gholamreza Nakhaeizadeh
 Statistic Methods in in Data Mining Business Understanding Data Understanding Data Preparation Deployment Modelling Evaluation Data Mining Process (Part 2) 2) Professor Dr. Gholamreza Nakhaeizadeh Professor
LAMPIRAN UJI VALIDITAS
 LAMPIRAN UJI VALIDITAS 1 e1 e2,00 Q1,04 Q2,01 -,04 e3 Q3,00 -,21 -,09 e4 Q4,49 -,01 e5 Q5,70,50,71 e6 Q6,47,69,74 e7 Q7,54,41,08 e8 Q8,17 e9 Q9,01 e10 Q10 Kompetensi Guru Chi-Square = 78,430 Probabilitas
Oregon DOT Slow-Speed Weigh-in-Motion (SWIM) Project: Analysis of Initial Weight Data
 Project: Analysis of Initial Weight Data") Portland State University PDXScholar Center for Urban Studies Publications and Reports Center for Urban Studies 7-1997 Oregon DOT Slow-Speed Weigh-in-Motion (SWIM) Project: Analysis of Initial Weight Data
Portland State University PDXScholar Center for Urban Studies Publications and Reports Center for Urban Studies 7-1997 Oregon DOT Slow-Speed Weigh-in-Motion (SWIM) Project: Analysis of Initial Weight Data
5. CONSTRUCTION OF THE WEIGHT-FOR-LENGTH AND WEIGHT-FOR- HEIGHT STANDARDS
 5. CONSTRUCTION OF THE WEIGHT-FOR-LENGTH AND WEIGHT-FOR- HEIGHT STANDARDS 5.1 Indicator-specific methodology The construction of the weight-for-length (45 to 110 cm) and weight-for-height (65 to 120 cm)
Robust alternatives to best linear unbiased prediction of complex traits
 Robust alternatives to best linear unbiased prediction of complex traits WHY BEST LINEAR UNBIASED PREDICTION EASY TO EXPLAIN FLEXIBLE AMENDABLE WELL UNDERSTOOD FEASIBLE UNPRETENTIOUS NORMALITY IS IMPLICIT
Team project 2017 Dony Pratidana S. Hum Bima Agus Setyawan S. IIP
 Hak cipta dan penggunaan kembali: Lisensi ini mengizinkan setiap orang untuk menggubah, memperbaiki, dan membuat ciptaan turunan bukan untuk kepentingan komersial, selama anda mencantumkan nama penulis
Data Hasil Olahan Populasi
 LAMPIRAN 1 Data Hasil Olahan Populasi No. Kode Bank Nama Bank Kriteria 1 Kriteria 2 Sampel terpilih 1. AGRO Bank Rakyat Indonesia Agro Niaga Tbk 2. AGRS Bank Agris Tbk X X 3. BABP Bank MNC Internasional
PREDICTION OF REMAINING USEFUL LIFE OF AN END MILL CUTTER SEOW XIANG YUAN
 PREDICTION OF REMAINING USEFUL LIFE OF AN END MILL CUTTER SEOW XIANG YUAN Report submitted in partial fulfillment of the requirements for the award of the degree of Bachelor of Engineering (Hons.) in Manufacturing
Linking the Virginia SOL Assessments to NWEA MAP Growth Tests *
 Linking the Virginia SOL Assessments to NWEA MAP Growth Tests * *As of June 2017 Measures of Academic Progress (MAP ) is known as MAP Growth. March 2016 Introduction Northwest Evaluation Association (NWEA
Linking the Georgia Milestones Assessments to NWEA MAP Growth Tests *
 Linking the Georgia Milestones Assessments to NWEA MAP Growth Tests * *As of June 2017 Measures of Academic Progress (MAP ) is known as MAP Growth. February 2016 Introduction Northwest Evaluation Association
TRINITY COLLEGE DUBLIN THE UNIVERSITY OF DUBLIN. Faculty of Engineering, Mathematics and Science. School of Computer Science and Statistics
 ST7003-1 TRINITY COLLEGE DUBLIN THE UNIVERSITY OF DUBLIN Faculty of Engineering, Mathematics and Science School of Computer Science and Statistics Postgraduate Certificate in Statistics Hilary Term 2015
Linking the North Carolina EOG Assessments to NWEA MAP Growth Tests *
 Linking the North Carolina EOG Assessments to NWEA MAP Growth Tests * *As of June 2017 Measures of Academic Progress (MAP ) is known as MAP Growth. March 2016 Introduction Northwest Evaluation Association
Introduction. Materials and Methods. How to Estimate Injection Percentage
 How to Estimate Injection Percentage Introduction The Marel IN33-3 injector for pork bellies is a 5 needle, low-pressure conveyor type machine which utilizes a 3-gpm positive displacement pump and control
Linking the Kansas KAP Assessments to NWEA MAP Growth Tests *
 Linking the Kansas KAP Assessments to NWEA MAP Growth Tests * *As of June 2017 Measures of Academic Progress (MAP ) is known as MAP Growth. February 2016 Introduction Northwest Evaluation Association (NWEA
Linking the Indiana ISTEP+ Assessments to the NWEA MAP Growth Tests. February 2017 Updated November 2017
 Linking the Indiana ISTEP+ Assessments to the NWEA MAP Growth Tests February 2017 Updated November 2017 2017 NWEA. All rights reserved. No part of this document may be modified or further distributed without
Linking the Alaska AMP Assessments to NWEA MAP Tests
 Linking the Alaska AMP Assessments to NWEA MAP Tests February 2016 Introduction Northwest Evaluation Association (NWEA ) is committed to providing partners with useful tools to help make inferences from
Deflection characteristics for radial-ply tractor tyres
 Journal of Parmacognosy and Pytocemistry 218; SP1: 216-221 E-ISSN: 2278-4136 P-ISSN: 2349-8234 JPP 218; SP1: 216-221 Ranjeet Kumar Assistant professor, RMD College of Agriculture and Researc Station, Ambikapur,
Linking the New York State NYSTP Assessments to NWEA MAP Growth Tests *
 Linking the New York State NYSTP Assessments to NWEA MAP Growth Tests * *As of June 2017 Measures of Academic Progress (MAP ) is known as MAP Growth. March 2016 Introduction Northwest Evaluation Association
Lampiran 1. Sampel Penelitian No. Kode Nama Perusahaan 1 AISA Tiga Pilar Sejahtera Food Tbk 2 AKPI Argha Karya Prima Industry Tbk 3 ALKA Alaska
 Lampiran 1. Sampel Penelitian No. Kode Nama Perusahaan 1 AISA Tiga Pilar Sejahtera Food Tbk 2 AKPI Argha Karya Prima Industry Tbk 3 ALKA Alaska Industrindo Tbk 4 ALMI Alumindo Light Metal Industry Tbk