Lampiran IV. Hasil Output SPSS Versi 16.0 untuk Analisis Deskriptif
|
|
|
- Blanche Osborne
- 6 years ago
- Views:
Transcription
1 182 Lampiran IV. Hasil Output SPSS Versi 16.0 untuk Analisis Deskriptif Frequencies Statistics Kinerja Guru Sikap Guru Thdp Kepsek Motivasi Kerja Guru Kompetensi Pedagogik Guru N Valid Missing Mean Std. Error of Mean Median Mode 85 a 96 a Std. Deviation Variance Skewness Std. Error of Skewness Kurtosis Std. Error of Kurtosis Range Minimum Maximum Sum Percentiles a. Multiple modes exist. The smallest value is shown
2 183 Frequency Table Kinerja Guru Frequency Percent Valid Percent Cumulative Percent Valid Total
3 184 Sikap Guru Thdp Kepsek Frequency Percent Valid Percent Cumulative Percent Valid Total
4 185 Motivasi Kerja Guru Frequency Percent Valid Percent Cumulative Percent Valid Total
5 186 Kompetensi Pedagogik Guru Frequency Percent Valid Percent Cumulative Percent Valid Total
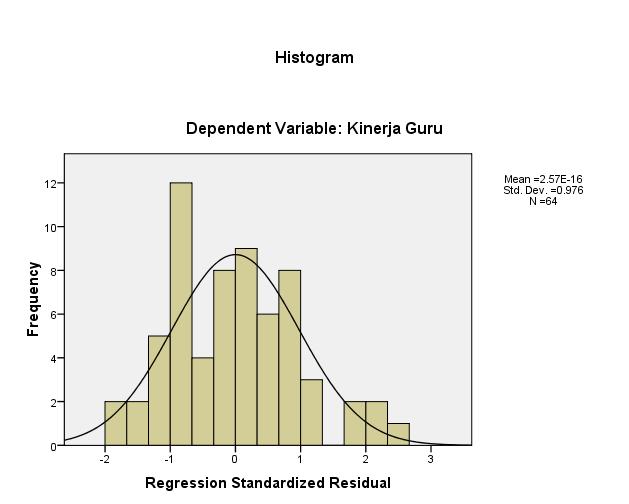
6 Histogram 187
7 188
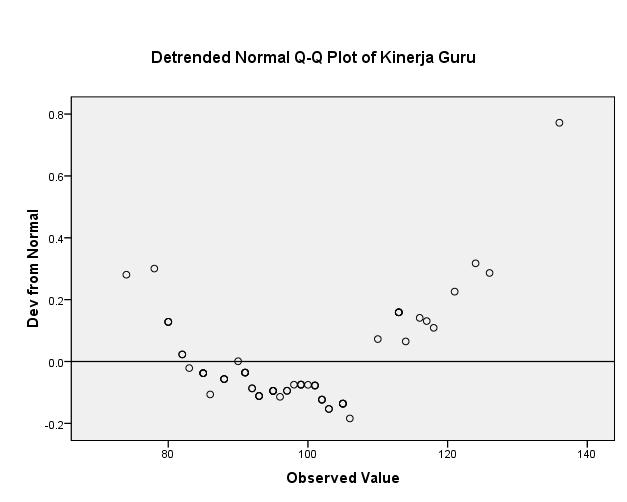
8 189 Lampiran V. Hasil Output SPSS Versi 16.0 untuk Uji Persyaratan Analisis(Uji Normalitas dan Homogenitas) Explore Case Processing Summary Cases Valid Missing Total N Percent N Percent N Percent Kinerja Guru % 0.0% % Descriptives Statistic Std. Error Kinerja Guru Mean % Confidence Interval for Mean Lower Bound Upper Bound % Trimmed Mean Median Variance Std. Deviation Minimum 74 Maximum 135 Range 61 Interquartile Range 16 Skewness Kurtosis Tests of Normality Kolmogorov-Smirnov a Shapiro-Wilk Statistic df Sig. Statistic df Sig. Kinerja Guru * a. Lilliefors Significance Correction *. This is a lower bound of the true significance.

9 190 Kinerja Guru Kinerja Guru Stem-and-Leaf Plot Frequency Stem & Leaf 2, , , , , , ,00 Extremes (>=135) Stem width: 10 Each leaf: 1 case(s)
10 191
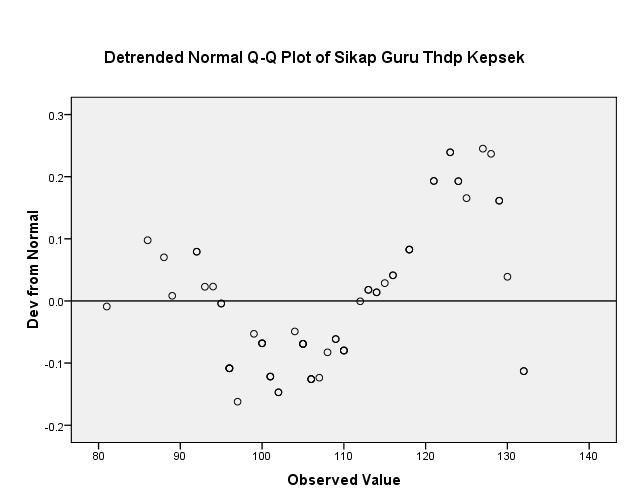
11 192 Explore Case Processing Summary Cases Valid Missing Total N Percent N Percent N Percent Sikap Guru Thdp Kepsek % 0.0% % Descriptives Statistic Std. Error Sikap Guru Thdp Kepsek Mean % Confidence Interval for Mean Lower Bound Upper Bound % Trimmed Mean Median Variance Std. Deviation Minimum 81 Maximum 132 Range Interquartile Range 19 Skewness Kurtosis Tests of Normality Kolmogorov-Smirnov a Shapiro-Wilk Statistic df Sig. Statistic df Sig. Sikap Guru Thdp Kepsek * a. Lilliefors Significance Correction *. This is a lower bound of the true significance.
12 193 Sikap Guru Thdp Kepsek Sikap Guru Thdp Kepsek Stem-and-Leaf Plot Frequency Stem & Leaf 4, , , , , , Stem width: 10 Each leaf: 1 case(s)
13 194
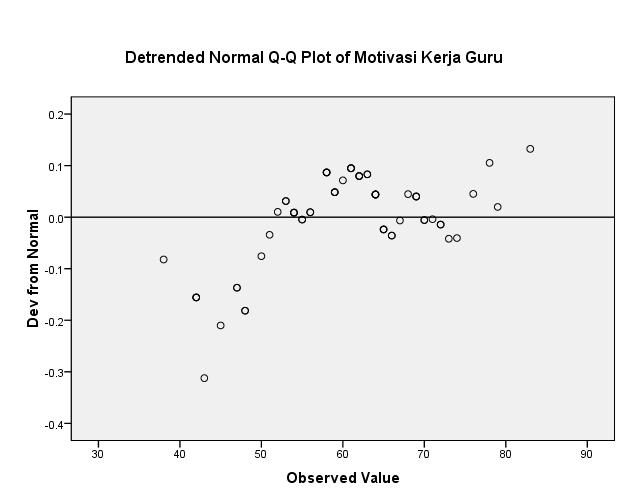
14 195 Explore Case Processing Summary Cases Valid Missing Total N Percent N Percent N Percent Motivasi Kerja Guru % 0.0% % Descriptives Statistic Std. Error Motivasi Kerja Guru Mean % Confidence Interval for Mean Lower Bound Upper Bound % Trimmed Mean Median Variance Std. Deviation Minimum 38 Maximum 83 Range 45 Interquartile Range 13 Skewness Kurtosis Tests of Normality Kolmogorov-Smirnov a Shapiro-Wilk Statistic df Sig. Statistic df Sig. Motivasi Kerja Guru * a. Lilliefors Significance Correction *. This is a lower bound of the true significance.
15 196 Motivasi Kerja Guru Motivasi Kerja Guru Stem-and-Leaf Plot Frequency Stem & Leaf 1, , , , , , Stem width: 10 Each leaf: 1 case(s)
16 197
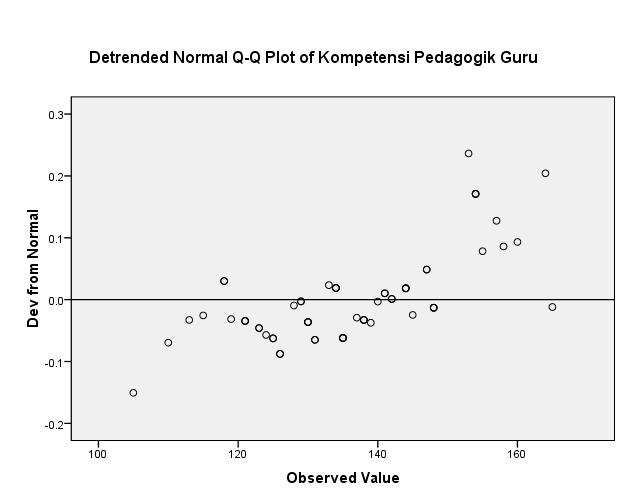
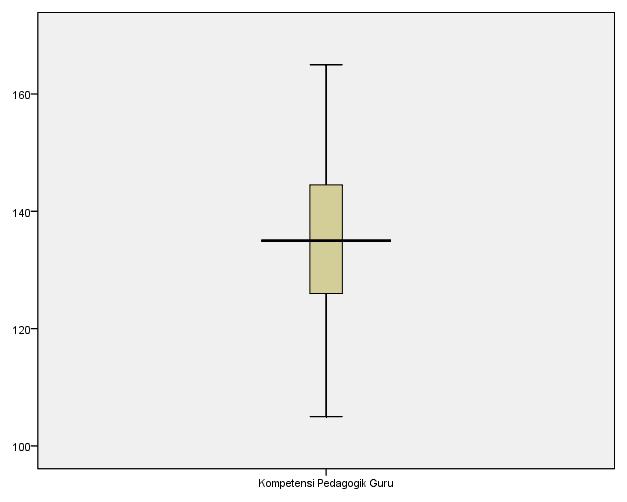
17 198 Explore Case Processing Summary Cases Valid Missing Total Kompetensi Pedagogik Guru N Percent N Percent N Percent % 0.0% % Descriptives Statistic Std. Error Kompetensi Pedagogik Guru Mean % Confidence Interval for Mean Lower Bound Upper Bound % Trimmed Mean Median Variance Std. Deviation Minimum 105 Maximum 165 Range 60 Interquartile Range 19 Skewness Kurtosis Tests of Normality Kolmogorov-Smirnov a Shapiro-Wilk Statistic df Sig. Statistic df Sig. Kompetensi Pedagogik Guru * a. Lilliefors Significance Correction *. This is a lower bound of the true significance.
18 199 Kompetensi Pedagogik Guru Kompetensi Pedagogik Guru Stem-and-Leaf Plot Frequency Stem & Leaf 1, , , , , , , Stem width: 10 Each leaf: 1 case(s)
19 200
20 201 Oneway Test of Homogeneity of Variances Kinerja Guru Levene Statistic df1 df2 Sig ANOVA Kinerja Guru Sum of Squares df Mean Square F Sig. Between Groups Within Groups Total Test of Homogeneity of Variances Kinerja Guru Levene Statistic df1 df2 Sig ANOVA Kinerja Guru Sum of Squares df Mean Square F Sig. Between Groups Within Groups Total Test of Homogeneity of Variances Kinerja Guru Levene Statistic df1 df2 Sig ANOVA Kinerja Guru Sum of Squares df Mean Square F Sig. Between Groups Within Groups Total
21 202 Lampiran VI. Hasil Output SPSS Versi 16.0 untuk Uji Hipotesis Penelitian Regression Variables Entered/Removed b Model Variables Entered 1 Sikap Guru Thdp Kepsek a a. All requested variables entered. Variables Removed. Enter Method b. Dependent Variable: Kinerja Guru Model R R Square Adjuste d R Square Model Summary b Std. Error of the Estimate Change Statistics R Square Change F Change df1 df2 Sig. F Change a a. Predictors: (Constant), Sikap Guru Thdp Kepsek b. Dependent Variable: Kinerja Guru ANOVA b Model Sum of Squares df Mean Square F Sig. 1 Regression a Residual Total a. Predictors: (Constant), Sikap Guru Thdp Kepsek b. Dependent Variable: Kinerja Guru Coefficients a Unstandardized Coefficients Standardized Coefficients Model B Std. Error Beta t Sig. 1 (Constant) Sikap Guru Thdp Kepsek a. Dependent Variable: Kinerja Guru Residuals Statistics a Minimum Maximum Mean Std. Deviation N Predicted Value Residual Std. Predicted Value Std. Residual a. Dependent Variable: Kinerja Guru
22 203 Charts Regression Model Variables Entered/Removed b Variables Entered 1 Motivasi Kerja Guru a a. All requested variables entered. Variables Removed b. Dependent Variable: Kinerja Guru. Enter Method Model R R Square Adjusted R Square Model Summary b Std. Error of the Estimate R Square Change Change Statistics F Change df1 df2 Sig. F Change a E a. Predictors: (Constant), Motivasi Kerja Guru b. Dependent Variable: Kinerja Guru
23 204 ANOVA b Model Sum of Squares df Mean Square F Sig. 1 Regression a Residual Total a. Predictors: (Constant), Motivasi Kerja Guru b. Dependent Variable: Kinerja Guru Coefficients a Unstandardized Coefficients Standardized Coefficients Model B Std. Error Beta t Sig. 1 (Constant) Motivasi Kerja Guru a. Dependent Variable: Kinerja Guru Residuals Statistics a Minimum Maximum Mean Std. Deviation N Predicted Value Residual Std. Predicted Value Std. Residual a. Dependent Variable: Kinerja Guru Charts
24 205 Regression Variables Entered/Removed b Model Variables Entered 1 Kompetensi Pedagogik Guru a a. All requested variables entered. Variables Removed. Enter Method b. Dependent Variable: Kinerja Guru Model R R Square Adjusted R Square Model Summary b Std. Error of the Estimate R Square Change Change Statistics F Change df1 df2 Sig. F Change a E a. Predictors: (Constant), Kompetensi Pedagogik Guru b. Dependent Variable: Kinerja Guru ANOVA b Model Sum of Squares df Mean Square F Sig. 1 Regression a Residual Total a. Predictors: (Constant), Kompetensi Pedagogik Guru b. Dependent Variable: Kinerja Guru Coefficients a Unstandardized Coefficients Standardized Coefficients Model B Std. Error Beta t Sig. 1 (Constant) Kompetensi Pedagogik Guru a. Dependent Variable: Kinerja Guru Residuals Statistics a Minimum Maximum Mean Std. Deviation N Predicted Value Residual Std. Predicted Value Std. Residual a. Dependent Variable: Kinerja Guru
25 206 Charts Regression Variables Entered/Removed b Model Variables Entered 1 Kompetensi Pedagogik Guru, Motivasi Kerja Guru, Sikap Guru Thdp Kepsek a a. All requested variables entered. Variables Removed. Enter Method b. Dependent Variable: Kinerja Guru Model R R Square Adjusted R Square Model Summary b Std. Error of the Estimate R Square Change Change Statistics F Change df1 df2 Sig. F Change a E a. Predictors: (Constant), Kompetensi Pedagogik Guru, Motivasi Kerja Guru, Sikap Guru Thdp Kepsek b. Dependent Variable: Kinerja Guru
26 207 ANOVA b Model Sum of Squares df Mean Square F Sig. 1 Regression a Residual Total a. Predictors: (Constant), Kompetensi Pedagogik Guru, Motivasi Kerja Guru, Sikap Guru Thdp Kepsek b. Dependent Variable: Kinerja Guru Coefficients a Unstandardized Coefficients Standardized Coefficients Model B Std. Error Beta t Sig. 1 (Constant) Sikap Guru Thdp Kepsek Motivasi Kerja Guru Kompetensi Pedagogik Guru a. Dependent Variable: Kinerja Guru Residuals Statistics a Minimum Maximum Mean Std. Deviation N Predicted Value Residual Std. Predicted Value Std. Residual a. Dependent Variable: Kinerja Guru Charts
27 208
Lampiran 1. Data Perusahaan
 Lampiran. Data Perusahaan NO PERUSH MV EARN DIV CFO LB.USAHA TOT.ASS ACAP 3 9 8 5 369 9678 376 ADES 75-35 - 6 3559-5977 7358 3 AQUA 5 368 65 335 797 678 53597 BATA 88 5 9 863 958 93 5 BKSL 5.3 -. 9-9 5
TRY OUT 30 Responden Variabel Kompetensi/ x1
 1 TRY OUT 30 Responden Variabel Kompetensi/ x1 Case Processing Summary N % 30 100.0 Cases Excluded a 0.0 Total 30 100.0 a. Listwise deletion based on all variables in the procedure. Reliability Statistics
HASIL OUTPUT SPSS. Reliability Scale: ALL VARIABLES
 139 HASIL OUTPUT SPSS Reliability Scale: ALL VARIABLES Case Processing Summary N % 100 100.0 Cases Excluded a 0.0 Total 100 100.0 a. Listwise deletion based on all variables in the procedure. Reliability
UJI VALIDITAS DAN RELIABILIAS VARIABEL KOMPENSASI
 1 UJI VALIDITAS DAN RELIABILIAS VARIABEL KOMPENSASI Case Processing Summary N % 20 100.0 Cases Excluded a 0.0 Total 20 100.0 a. Listwise deletion based on all variables in the procedure. Reliability Statistics
DATA SAMPEL TAHUN 2006
 DATA SAMPEL TAHUN 2006 No Nama Emiten CGPI Kode Saham Harga Saham EPS PER Laba Bersih 1 Bank Niaga 89.27 BNGA 920 54 17.02 647,732 2 Bank Mandiri 83.66 BMRI 2,900 118 24.65 2,422,472 3 Astra International
TRY OUT 25 Responden Variabel Kepuasan / x1
 1 TRY OUT 25 Responden Variabel Kepuasan / x1 Case Processing Summary N % 25 100.0 Cases Excluded a 0.0 Total 25 100.0 a. Listwise deletion based on all variables in the procedure. Reliability Statistics
. Enter. Model Summary b. Std. Error. of the. Estimate. Change. a. Predictors: (Constant), Emphaty, reliability, Assurance, responsive, Tangible
, Emphaty, reliability, Assurance, responsive, Tangible") LAMPIRAN Variables Entered/Removed b Variables Model Variables Entered Removed Method 1 Emphaty, reliability, Assurance, responsive, Tangible a. Enter a. All requested variables entered. b. Dependent Variable:
LAMPIRAN Variables Entered/Removed b Variables Model Variables Entered Removed Method 1 Emphaty, reliability, Assurance, responsive, Tangible a. Enter a. All requested variables entered. b. Dependent Variable:
Daftar Sampel Perusahaan
 Lampiran i Daftar Sampel Perusahaan NAMA PERUSAHAAN PT. Bank Bukopin Tbk PT. Bank Bumi Arta Tbk PT. Bank Central Asia Tbk PT. Bank CIMB Niaga Tbk PT. Bank Danamon Indonesia Tbk PT. Bank Ekonomi Raharja
LAMPIRAN DAFTAR SAMPEL PENELITIAN. Kriteria No. Nama Perusahaan. Sampel Emiten
 LAMPIRAN DAFTAR SAMPEL PENELITIAN Kode Kriteria No. Nama Perusahaan Sampel Emiten 1 2 3 1. AGRO PT. Bank Agroniaga, Tbk 1 2. BABP PT. Bank ICB Bumiputera Indonesia, Tbk X - 3. BBCA PT. Bank Central Asia,
LAMPIRAN 1. Lampiran Nama dan Kondisi Perusahaan Textile No Kode Nama Perusahaan Hasil z-score FD Non-FD
 87 LAMPIRAN 1. Lampiran Nama dan Kondisi Perusahaan Textile 2010-2014 No Kode Nama Perusahaan Hasil z-score FD Non-FD 1 ADMG PT Polychem Indonesia Tbk 1,39 1 2 ARGO PT Argo Pantes Tbk 0,93 1 3 CTNX PT
CHAPTER V CONCLUSION, SUGGESTION AND LIMITATION. 1. Independent commissioner boards proportion does not negatively affect
 CHAPTER V CONCLUSION, SUGGESTION AND LIMITATION 5.. Conclusion Based on data analysis that has been done, researcher may draw following conclusions:. Independent commissioner boards proportion does not
Daftar Sampel Perusahaan Pertambangan. 4 BORN Borneo Lumbung Energy & Metal, Tbk
 Lampiran i Daftar Sampel Perusahaan Daftar Sampel Perusahaan Pertambangan No Kode Sampel 1 ADRO Adaro Energy, Tbk 2 ANTM Aneka Tambang (Persero), Tbk 3 ATPK ATPK Resources, Tbk 4 BORN Borneo Lumbung Energy
fruitfly fecundity example summary Tuesday, July 17, :13:19 PM 1
 fruitfly fecundity example summary Tuesday, July 17, 2018 02:13:19 PM 1 The UNIVARIATE Procedure Variable: fecund line = NS Basic Statistical Measures Location Variability Mean 33.37200 Std Deviation 8.94201
Rata-Rata Nilai Debt to Equity Ratio (DER) Perusahaan Otomotif yang 0, ,97 0, ,44 1,9 1,6 1,4 1,7 1,65
 Perusahaan Otomotif yang 0, ,97 0, ,44 1,9 1,6 1,4 1,7 1,65") Lampiran I Rata-Rata Nilai Debt to Equity Ratio (DER) Perusahaan Otomotif yang Terdaftar di Bursa Efek Indonesia Periode 2010-2013 DER No Kode Nama perusahaan 2010 2011 2012 2013 Rata-rata 1. ASII PT Astra
Lampiran I Rata-Rata Nilai Debt to Equity Ratio (DER) Perusahaan Otomotif yang Terdaftar di Bursa Efek Indonesia Periode 2010-2013 DER No Kode Nama perusahaan 2010 2011 2012 2013 Rata-rata 1. ASII PT Astra
Universitas Sumatera Utara
 LAMPIRAN I LAMPRIAN PDRB Harga Berlaku NO KAB/KOTA 2005 2006 2007 2008 2009 2010 1 Asahan 15527794210 6429147880 8174125380 9505603030 10435935630 11931676610 2 Dairi 2303591460 2552751860 2860204810 3116742540
Lampiran i Jadwal Penelitian
 Lampiran i Jadwal Penelitian Tahap penelitian Juni Juli Agust Sept Oktb Pengajuan Judul Penyetujuan proposal Penyelesain proposal Bimbingan skripisi 81 Lampiran i (lanjutan) Daftar Sampel Perusahaan Manufaktur
Lampiran 1. Daftar Sampel Perusahaan
 Lampiran 1. Daftar Sampel Perusahaan NO. KODE NAMA PERUSAHAAN 1 ARNA Arwana Citramulia Tbk. 2 ASII Astra Internastional Tbk. 3 AUTO Astra otoparts Tbk. 4 BTON Betonjaya Manunggal Tbk 5 DVLA Darya-Varia
DATA PENELITIAN 1. CAR CAR (%)
") DATA PENELITIAN. CAR No. Tahun Nama Bank CAR (%) Arta Niaga Kencana 2,8 2 Artha Graha 0,58 3 Asiatic -9,9 4 Danpac 25,74 5 Global International 42, 6 Harmoni 7,47 7 IFI 22,62 8 Bukopin 20,37 9 International
DATA PENELITIAN. CAR No. Tahun Nama Bank CAR (%) Arta Niaga Kencana 2,8 2 Artha Graha 0,58 3 Asiatic -9,9 4 Danpac 25,74 5 Global International 42, 6 Harmoni 7,47 7 IFI 22,62 8 Bukopin 20,37 9 International
LAMPIRAN I FORMULIR SURVEI
 LAMPIRAN I FORMULIR SURVEI 56 Universitas Kristen Maranatha L.1.1 FORMULIR SURVEI KEBISINGAN LALULINTAS Lokasi : Cuaca : Hari/Tanggal : Surveyor : Periode / menit 5 10 15 20 25 30 35 40 45 50 55 60 65
LAMPIRAN I Data Perusahaan Sampel kode DPS EPS Ekuitas akpi ,97 51,04 40,
 LAMPIRAN I Data Perusahaan Sampel kode DPS EPS Ekuitas 2013 2014 2015 2013 2014 2015 2013 2014 2015 akpi 34 8 9 50,97 51,04 40,67 1.029.336.000.000 1.035.846.000.000 1.107.566.000.000 asii 216 216 177
LAMPIRAN. Lampiran 1 Data Sampel Penelitian
 LAMPIRAN Lampiran Data Sampel Penelitian Variabel Karakteristik Auditor pada Perusahaan Sampel Ukuran KAP No Kode 2 2 22 23 (Aryanto, Amir AGRO Jusuf, Mawar & Saptoto) 2 BABP 3 BACA 4 BAEK 5 BBCA 6 BBKP
EXST7034 Multiple Regression Geaghan Chapter 11 Bootstrapping (Toluca example) Page 1
 Page 1") Chapter 11 Bootstrapping (Toluca example) Page 1 Toluca Company Example (Problem from Neter, Kutner, Nachtsheim & Wasserman 1996,1.21) A particular part needed for refigeration equipment replacement parts
Chapter 11 Bootstrapping (Toluca example) Page 1 Toluca Company Example (Problem from Neter, Kutner, Nachtsheim & Wasserman 1996,1.21) A particular part needed for refigeration equipment replacement parts
Data Nama Perusahaan Perbankan Yang Terdaftar Di BEI.
 LAMPIRAN Lampiran 1 Data Nama Perusahaan Perbankan Yang Terdaftar Di BEI. No Kode Perusahaan Nama Perusahaan 1 AGRO Bank Rakyat Indonesia Agroniaga Tbk 2 BMRI Bank Mandiri (Persero) Tbk 3 BMAS PT Bank
Industry Classification/Stock Name
 Lampiran 1 : Data Perusahaan Sampel Industry Classification/Stock Name 1. AGRICULTURE Plantation 1 AALI Astra Argo Lestari Tbk (S) 2 LSIP PP London Sumatera Tbk (S) 3 SGRO Sampoerna Agro Tbk (S) 4 SMAR
Daftar Perusahaan Real Estate dan Property
 Lampiran 1 Daftar Perusahaan Real Estate dan Property Kriteria No Kode Nama Perusahaan 1 2 3 Sampel 1 APLN Agung Podomoro Land Tbk 2 ASRI Alam Sutera Realty Tbk 1 3 ELTY Bakrieland Development Tbk 4 BAPA
Team project 2017 Dony Pratidana S. Hum Bima Agus Setyawan S. IIP
 Hak cipta dan penggunaan kembali: Lisensi ini mengizinkan setiap orang untuk menggubah, memperbaiki, dan membuat ciptaan turunan bukan untuk kepentingan komersial, selama anda mencantumkan nama penulis
Lampiran 1 DAFTAR PERUSAHAAN MANUFAKTUR YANG TERDAFTAR DI BURSA EFEK INDONESIA TAHUN (Menyajikan Laporan Keuangan Secara Berturut-turut)
") Lampiran 1 DAFTAR PERUSAHAAN MANUFAKTUR YANG TERDAFTAR DI BURSA EFEK INDONESIA TAHUN 2014-2016 (Menyajikan Laporan Keuangan Secara Berturut-turut) NO KODE NAMA PERUSAHAAN 1 ALKA PT ALASKA INDONESIA TBK
Lampiran 1 DAFTAR PERUSAHAAN MANUFAKTUR YANG TERDAFTAR DI BURSA EFEK INDONESIA TAHUN 2014-2016 (Menyajikan Laporan Keuangan Secara Berturut-turut) NO KODE NAMA PERUSAHAAN 1 ALKA PT ALASKA INDONESIA TBK
Perusahaan Consumer Goods yang Terdaftar di BEI ( ) Nama Perusahaan Perusahaan 1
 Nama Perusahaan Perusahaan 1") LAMPIRAN 1 Perusahaan Consumer Goods yang Terdaftar di BEI (2010-2012) No. Sub Sektor Kode Nama Perusahaan Perusahaan 1 ADES Akasha Wira Internasional Tbk 2 AISA Tiga Pilar Sejahtera Food Tbk 3 ALTO Tri
LAMPIRAN 1 Perusahaan Consumer Goods yang Terdaftar di BEI (2010-2012) No. Sub Sektor Kode Nama Perusahaan Perusahaan 1 ADES Akasha Wira Internasional Tbk 2 AISA Tiga Pilar Sejahtera Food Tbk 3 ALTO Tri
LAMPIRAN A. Tabulasi Data Perusahaan Sample
 LAMPIRAN A Tabulasi Data Perusahaan Sample Current Ratio (%) NO Kode Emiten Nama Perusahaan ASII Astra International Tbk. 2 AUTO Astra Otoparts Tbk. 3 BATA Sepatu Bata Tbk. 4 BRAM Indo Kordsa Tbk 5 BRNA
a. Uji kenormalan data model sebaran suhu pada band 7 citra tahun 2001 b. Uji kenormalan data model sebaran suhu pada band 4 citra tahun 2006
 Dependent Variable: Suhu Regression Standardized Residual of Plot P-P Normal Dependent Variable: Suhu Regression Standardized Residual of Plot P-P Normal Lampiran 1. Hasil Uji Normalitas a. Uji kenormalan
MODUL PELATIHAN SEM ANANDA SABIL HUSSEIN, PHD
 MODUL PELATIHAN SEM ANANDA SABIL HUSSEIN, PHD PUSAT KAJIAN DAN PENGABDIAN MASYARAKAT JURUSAN MANAJEMEN UNIVERSITAS BRAWIJAYA 2018 1) 2) ANALISA JALUR 1) LMK = 27,209 3,599IPK + 1,749 x 10-7 US + 0,019JR
Guatemalan cholesterol example summary
 Guatemalan cholesterol example summary Wednesday, July 11, 2018 02:04:06 PM 1 The UNIVARIATE Procedure Variable: level = rural Basic Statistical Measures Location Variability Mean 157.0204 Std Deviation
Daftar Nama Perusaahan. yang ada di Industri Consumer Goods periode
 99 Lampiran 1 Daftar Nama Perusaahan yang ada di Industri Consumer Goods periode 2013-2016 KODE AISA ALTO CEKA CLEO DLTA ICBP INDF HOKI MLBI MYOR PSDN ROTI SKBM SKLT STTP ULTJ GGRM HMSP RMBA WIIM CINT
LAMPIRAN 1 : DAFTAR PERUSAHAAN SAMPEL PERIODE
 69 LAMPIRAN 1 : DAFTAR PERUSAHAAN SAMPEL PERIODE 2008-2010 No Kode Nama Perusahaan 1 AISA PT Tiga Pilar Sejahtera Food Tbk 2 ARNA PT Arwana Citramulia Tbk 3 ASII PT Astra International Tbk 4 AUTO PT Astra
Lampiran 1. Uji Validitas dan Reliability Variabel Kualitas Pelayanan
 Lampira 1. Uji itas da Reliability Variabel Kualitas Pelayaa 1 Frequecy Percet Percet Percet Kurag setuju 14 14.1 14.1 14.1 Ragu-ragu 57 57.6 57.6 71.7 Setuju 24 24.2 24.2 96.0 Sagat Setuju 4 4.0 4.0 100.0
APPENDIX A. A.1 Sample of Indian MFIs
 APPENDIX A A.1 Sample of Indian MFIs S.N. Sample of Indian MFIs Inception Legal Form 1 SEWA 1974 BANK 2 CRESA 1980 NGO 3 SKDRDP 1982 NGO 4 GRAMA VIDYALAY 1983 NGO 5 JANODAYA 1987 NGO 6 RASS 1989 NGO 7
: ( .
 2 27 ( ) 2 3 4 2 ( ) 59 Y n n U i ( ) & smith H 98 Draper N Curran PJ,bauer DJ & Willoughby Kam,Cindy &Robert 23 MT24 Jaccard,J & Rebert T23 Franzese 23 Aiken LS & West SG 99 " Multiple Regression Testing
LAMPIRAN UJI VALIDITAS
 LAMPIRAN UJI VALIDITAS 1 e1 e2,00 Q1,04 Q2,01 -,04 e3 Q3,00 -,21 -,09 e4 Q4,49 -,01 e5 Q5,70,50,71 e6 Q6,47,69,74 e7 Q7,54,41,08 e8 Q8,17 e9 Q9,01 e10 Q10 Kompetensi Guru Chi-Square = 78,430 Probabilitas
Regression Models Course Project, 2016
 Regression Models Course Project, 2016 Venkat Batchu July 13, 2016 Executive Summary In this report, mtcars data set is explored/analyzed for relationship between outcome variable mpg (miles for gallon)
Daftar Nama Perusahaan Sampel Tahun 2010
 LAMPIRAN Daftar Nama Perusahaan Sampel Tahun 2010 No Kode Perusahaan Nama Perusahaan 1 INTP PT Indocement Tunggal Prakarsa Tbk 2 SMGR PT Semen Indonesia Persero Tbk 3 ARNA PT Arwana Citramulia Tbk 4 TOTO
Getting Started with Correlated Component Regression (CCR) in XLSTAT-CCR
 in XLSTAT-CCR") Tutorial 1 Getting Started with Correlated Component Regression (CCR) in XLSTAT-CCR Dataset for running Correlated Component Regression This tutorial 1 is based on data provided by Michel Tenenhaus and
Tutorial 1 Getting Started with Correlated Component Regression (CCR) in XLSTAT-CCR Dataset for running Correlated Component Regression This tutorial 1 is based on data provided by Michel Tenenhaus and
LAMPIRAN. Lampiran I. Daftar Populasi Perusahaan Properti dan Real Estate di Bursa Efek Indonesia No Kode. Kriteria Nama Perusahaan Emiten 1 2 3
 LAMPIRAN Lampiran I Daftar Populasi Perusahaan Properti dan Real Estate di Bursa Efek Indonesia No Kode Kriteria Nama Perusahaan Emiten 1 2 3 Sampel 1 ASRI Alam Sutera Reality Tbk 1 2 BAPA Bekasi Asri
Lampiran 1 Tabel 3.1 Sampel No. Kode Nama Perusahaan Sumber : didownload tanggal 13 November 2016 (data diolah)
") 72 Lampiran 1 Tabel 3.1 Sampel No. Kode Nama Perusahaan 1 ALKA PT. Alakasa Industrindo Tbk 2 BIMA PT. Primarindo Asia Infrastructure Tbk 3 BRNA PT. Berlina Tbk 4 ETWA PT. Eterindo Wahanatama Tbk 5 FASW
72 Lampiran 1 Tabel 3.1 Sampel No. Kode Nama Perusahaan 1 ALKA PT. Alakasa Industrindo Tbk 2 BIMA PT. Primarindo Asia Infrastructure Tbk 3 BRNA PT. Berlina Tbk 4 ETWA PT. Eterindo Wahanatama Tbk 5 FASW
Drilling Example: Diagnostic Plots
 Math 3080 1. Treibergs Drilling Example: Diagnostic Plots Name: Example March 1, 2014 This data is taken from Penner & Watts, Mining Information, American Statistician 1991, as quoted by Levine, Ramsey
Lampiran 1. Proses Pemilihan Sampel. Universitas Sumatera Utara
 Lampiran 1 Proses Pemilihan Sampel No. Kode Emiten Nama Perusahaan Tanggal Pengumuman Stock Split Kriteria Pemilihan Sampel 1 2 3 4 Sampel 1. CTBN Citra Tubindo 12 Januari Tbk 2009 2. ARNA Arwana 11 September
The PRINCOMP Procedure
 Grizzly Bear Project - Coastal Sites - invci 15:14 Friday, June 11, 2010 1 Food production variables The PRINCOMP Procedure Observations 16 Variables 4 Simple Statistics PRECIP ndvi aet temp Mean 260.8102476
Lampiran 1. Tabel Sampel Penelitian
 Lampiran 1 Tabel Sampel Penelitian No Kode Emiten Nama Perusahaan Tanggal IPO 1 APLN Agung Podomoro Land Tbk 11 Nov 2010 2 ASRI Alam Sutera Reality Tbk 18 Dec 2007 3 BAPA Bekasi Asri Pemula Tbk 14 Jan
Motor Trend MPG Analysis
 Motor Trend MPG Analysis SJ May 15, 2016 Executive Summary For this project, we were asked to look at a data set of a collection of cars in the automobile industry. We are going to explore the relationship
Cluster Analysis. Presented by: Lauren Franklin and Maria Bakarman COM 631. April 2017
 1 Cluster Analysis Presented by: Lauren Franklin and Maria Bakarman COM 631 April 2017 2 I. Model Data Set: Film and TV Usage National Survey 2015 (Jeffres & Neuendorf) Internal/clustering variables (4
Lampiran 1 Daftar Perusahaan Sampel 2012
 90 Lampiran 1 Daftar Perusahaan Sampel 2012 No Kode Nama Perusahaan 1 BTON Betonjaya Manunggal Tbk 2 GDST Gunawan Dianjaya Steel Tbk 3 KBLM Kabelindo Murni Tbk 4 LMPI Langgeng Makmur Industri Tbk 5 PICO
MOTORCYCLE ACCIDENT MODEL ON THE ROAD SECTION OF HIGHLANDS REGION BY USING GENELARIZED LINEAR MODEL
 International Journal of Civil Engineering and Technology (IJCIET) Volume 8, Issue 10, October 2017, pp. 1249-1258 1248, Article ID: IJCIET_08_10_127 Available online at http://http://www.iaeme.com/ijciet/issues.asp?jtype=ijciet&vtype=8&itype=10
Modeling Ignition Delay in a Diesel Engine
 Modeling Ignition Delay in a Diesel Engine Ivonna D. Ploma Introduction The object of this analysis is to develop a model for the ignition delay in a diesel engine as a function of four experimental variables:
tool<-read.csv(file="d:/chilo/regression 7/tool.csv", header=t) tool
 tool") Regression nalysis lab 7 1 Indicator variables 1.1 Import data tool
Regression nalysis lab 7 1 Indicator variables 1.1 Import data tool
Motor Trend Yvette Winton September 1, 2016
 Motor Trend Yvette Winton September 1, 2016 Executive Summary Objective In this analysis, the relationship between a set of variables and miles per gallon (MPG) (outcome) is explored from a data set of
Lampiran 1: Nama Perusahaan yang menjadi Sampel Penelitian
 LAMPIRAN Lampiran 1: Nama Perusahaan yang menjadi Sampel Penelitian NO. KODE NAMA PERUSAHAAN 1. INTA PT Intraco Penta Tbk 2. JKON PT Jaya Konstruksi Manggala Pratama Tbk 3. KONI PT Perdana Bangun Pusaka
LAMPIRAN. Lampiran 1. Data deviden untuk menghitung economic performance tahun
 LAMPIRAN Lampiran 1. Data deviden untuk menghitung economic performance tahun 2011-2013 No Kode 2011 2012 2013 Div Div Div 1 SMCB 23 32 48 2 UNVR 250 300 300 3 AMFG 80 80 80 4 INTP 263 293 450 5 ICBP 116
5. CONSTRUCTION OF THE WEIGHT-FOR-LENGTH AND WEIGHT-FOR- HEIGHT STANDARDS
 5. CONSTRUCTION OF THE WEIGHT-FOR-LENGTH AND WEIGHT-FOR- HEIGHT STANDARDS 5.1 Indicator-specific methodology The construction of the weight-for-length (45 to 110 cm) and weight-for-height (65 to 120 cm)
LAMPIRAN 1. Tabel 1. Data Indeks Harga Saham PT. ANTAM, tbk Periode 20 Januari Februari 2012
 LAMPIRAN 1 Tabel 1. Data Indeks Harga Saham PT. ANTAM, tbk Periode 20 Januari 2011 29 Februari 2012 No Tanggal Indeks Harga Saham No Tanggal Indeks Harga Saham 1 20-Jan-011 2.35 138 05-Agst-011 1.95 2
Technical Papers supporting SAP 2009
 Technical Papers supporting SAP 29 A meta-analysis of boiler test efficiencies to compare independent and manufacturers results Reference no. STP9/B5 Date last amended 25 March 29 Date originated 6 October
EMPIRICAL ANALYSIS ON ROAD TRAFFIC CRASHES IN ANAMBRA STATE, NIGERIA: ACCIDENT PREDICTION MODELING USING REGRESSION APPROACH
 EMPIRICAL ANALYSIS ON ROAD TRAFFIC CRASHES IN ANAMBRA STATE, NIGERIA: ACCIDENT PREDICTION MODELING USING REGRESSION APPROACH Obubu M a*, Konwe C.S b, Nwabenu D.C c, Omokri Peter A d, Chijioke M e a Department
Stat 301 Lecture 30. Model Selection. Explanatory Variables. A Good Model. Response: Highway MPG Explanatory: 13 explanatory variables
 Model Selection Response: Highway MPG Explanatory: 13 explanatory variables Indicator variables for types of car Sports Car, SUV, Wagon, Minivan 1 Explanatory Variables Engine size (liters) Cylinders (number)
LAMPIRAN. Daftar Perusahaan Manufaktur yang menjadi sampel. 1 AMFG PT.Asahimas Flat Glass Tbk 1. 2 INDF PT. Indofood Skses Makmur Tbk 2
 LAMPIRAN Lampiran i Daftar Perusahaan Manufaktur yang menjadi sampel No Kode Populasi Kriteria Sampel 1 2 3 4 1 AMFG PT.Asahimas Flat Glass 1 2 INDF PT. Indofood Skses Makmur 2 3 UNIT PT.Nusantara Inti
Análisis de la varianza (II)
") 01:43 Thursday, March 10, 2011 1 AGRO 6005 Análisis de la varianza (II) 1. Evaluación de supuestos. Los siguientes datos son recuentos de un áfido en trigo en 6 semanas diferentes. En cada ocasión se muestrearon
01:43 Thursday, March 10, 2011 1 AGRO 6005 Análisis de la varianza (II) 1. Evaluación de supuestos. Los siguientes datos son recuentos de un áfido en trigo en 6 semanas diferentes. En cada ocasión se muestrearon
Important Formulas. Discrete Probability Distributions. Probability and Counting Rules. The Normal Distribution. Confidence Intervals and Sample Size
 blu38582_if_1-8.qxd 9/27/10 9:19 PM Page 1 Important Formulas Chapter 3 Data Description Mean for individual data: Mean for grouped data: Standard deviation for a sample: X2 s X n 1 or Standard deviation
Antonio Olmos Priyalatha Govindasamy Research Methods & Statistics University of Denver
 Antonio Olmos Priyalatha Govindasamy Research Methods & Statistics University of Denver American Evaluation Association Conference, Chicago, Ill, November 2015 AEA 2015, Chicago Ill 1 Paper overview Propensity
Lampiran 1. Penjualan PT Honda Mandiri Bogor
 LAMPIRAN 64 Lampiran 1. Penjualan PT Honda Mandiri Bogor 29-211 PENJUALAN 29 TYPE JAN FEB MAR APR MEI JUNI JULI AGT SEP OKT NOV DES TOTA JAZZ 16 14 22 15 23 19 13 28 15 28 3 25 248 FREED 23 25 14 4 13
Statistics for Social Research
 Facoltà di Scienze della Formazione, Scienze Politiche e Sociali Statistics for Social Research Lesson 2: Descriptive Statistics Prof.ssa Monica Palma a.a. 2016-2017 DESCRIPTIVE STATISTICS How do we describe
TABLE 4.1 POPULATION OF 100 VALUES 2
 TABLE 4. POPULATION OF 00 VALUES WITH µ = 6. AND = 7.5 8. 6.4 0. 9.9 9.8 6.6 6. 5.7 5. 6.3 6.7 30.6.6.3 30.0 6.5 8. 5.6 0.3 35.5.9 30.7 3.. 9. 6. 6.8 5.3 4.3 4.4 9.0 5.0 9.9 5. 0.8 9.0.9 5.4 7.3 3.4 38..6
Level of service model for exclusive motorcycle lane
 387 Level of service model for exclusive motorcycle lane Seyed Farzin Faezi, Hussain Hamid, Sulistyo Arintono and Seyed Rasoul Davoodi Dept. of Civil Engineering, University Putra Malaysia, 43400, UPM
LAMPIRAN 1 Perusahaan Sampel Penelitian Tahun
 LAMPIRAN 1 Perusahaan Sampel Penelitian Tahun 2008-2010 No. Perusahaan Kode Tahun 1. PT. Gozco Plantation Tbk. GZCO 2008 2. PT. Indika Energy Tbk. INDY 2008 3. PT. Adhi Karya (Persero) Tbk. ADHI 2008 4.
KUESIONER PENELITIAN BAGIAN 1
 LAMPIRAN 48 49 Lampiran 1. Kuesioner Penelitian KUESIONER PENELITIAN Kuesioner ini digunakan sebagai bahan untuk menyusun skripsi mengenai Pengaruh Gaya Kepemimpinan Kepala Cabang terhadap Partisipasi
DEFECT DISTRIBUTION IN WELDS OF INCOLOY 908
 PSFC/RR-10-8 DEFECT DISTRIBUTION IN WELDS OF INCOLOY 908 Jun Feng August 10, 2010 Plasma Science and Fusion Center Massachusetts Institute of Technology Cambridge, MA 02139, USA This work was supported
Stat 401 B Lecture 31
 Model Selection Response: Highway MPG Explanatory: 13 explanatory variables Indicator variables for types of car Sports Car, SUV, Wagon, Minivan 1 Explanatory Variables Engine size (liters) Cylinders (number)
Forecasting Driving Behavior to Enable Efficient Grid Integration of Plug-in Electric Vehicles
 Forecasting Driving Behavior to Enable Efficient Grid Integration of Plug-in Electric Vehicles Christoph Goebel Department of Computer Science Technical University Munich Email: christoph.goebel@in.tum.de
Descriptive Statistics
 Chapter 2 Descriptive Statistics 2-1 Overview 2-2 Summarizing Data 2-3 Pictures of Data 2-4 Measures of Central Tendency 2-5 Measures of Variation 2-6 Measures of Position 2-7 Exploratory Data Analysis
Ulangan (%) I II III
 I II III") 85 LAMPIRA 1. TABEL HASIL PEGAMATA Tabel 1.Hasil Daya Berkecambah Konsentrasi H 2 SO 4 Lama perendaman Ulangan Total Ratarata I II III K0 L1 4 8 6 18 6 L2 10 8 2 20 6,666667 L3 8 6 6 20 6,666667 K1 L1
85 LAMPIRA 1. TABEL HASIL PEGAMATA Tabel 1.Hasil Daya Berkecambah Konsentrasi H 2 SO 4 Lama perendaman Ulangan Total Ratarata I II III K0 L1 4 8 6 18 6 L2 10 8 2 20 6,666667 L3 8 6 6 20 6,666667 K1 L1
Oregon DOT Slow-Speed Weigh-in-Motion (SWIM) Project: Analysis of Initial Weight Data
 Project: Analysis of Initial Weight Data") Portland State University PDXScholar Center for Urban Studies Publications and Reports Center for Urban Studies 7-1997 Oregon DOT Slow-Speed Weigh-in-Motion (SWIM) Project: Analysis of Initial Weight Data
Portland State University PDXScholar Center for Urban Studies Publications and Reports Center for Urban Studies 7-1997 Oregon DOT Slow-Speed Weigh-in-Motion (SWIM) Project: Analysis of Initial Weight Data
Start Time. LOCATION: Scotts Valley Dr QC JOB #: SPECIFIC LOCATION: 0 ft from Tabor St. DIRECTION: EB/WB CITY/STATE: Scotts Valley, CA
 Tube Counts Type of report: Tube Count - Volume Data LOCATION: Scotts Valley Dr QC JOB #: 245667 SPECIFIC LOCATION: ft from Tabor St DIRECTION: EB/WB CITY/STATE: Scotts Valley, CA DATE: Mar 2 24 - Mar
1 of 28 9/15/2016 1:16 PM
 1 of 28 9/15/2016 1:16 PM 2 of 28 9/15/2016 1:16 PM 3 of 28 9/15/2016 1:16 PM objects(package:psych).first < function(library(psych)) help(read.table) #or?read.table #another way of asking for help apropos("read")
Booklet of Code and Output for STAD29/STA 1007 Final Exam
 Booklet of Code and Output for STAD29/STA 1007 Final Exam List of Figures in this document by page: List of Figures 1 Raisins data.............................. 2 2 Boxplot of raisin data........................
Preface... xi. A Word to the Practitioner... xi The Organization of the Book... xi Required Software... xii Accessing the Supplementary Content...
 Contents Preface... xi A Word to the Practitioner... xi The Organization of the Book... xi Required Software... xii Accessing the Supplementary Content... xii Chapter 1 Introducing Partial Least Squares...
Statistics and Quantitative Analysis U4320. Segment 8 Prof. Sharyn O Halloran
 Statistics and Quantitative Analysis U4320 Segment 8 Prof. Sharyn O Halloran I. Introduction A. Overview 1. Ways to describe, summarize and display data. 2.Summary statements: Mean Standard deviation Variance
R-Sq criterion Data : Surgical room data Chap 9
 Chap 9 - For controlled experiments model reduction is not very important. P 347 - For exploratory observational studies, model reduction is important. Criteria for model selection p353 R-Sq criterion
Road Surface characteristics and traffic accident rates on New Zealand s state highway network
 Road Surface characteristics and traffic accident rates on New Zealand s state highway network Robert Davies Statistics Research Associates http://www.statsresearch.co.nz Joint work with Marian Loader,
The Session.. Rosaria Silipo Phil Winters KNIME KNIME.com AG. All Right Reserved.
 The Session.. Rosaria Silipo Phil Winters KNIME 2016 KNIME.com AG. All Right Reserved. Past KNIME Summits: Merging Techniques, Data and MUSIC! 2016 KNIME.com AG. All Rights Reserved. 2 Analytics, Machine
Lampiran 1. Daftar Perusahaan Sampel. No Kode Nama Perusahaan
 Lampiran 1. Daftar Perusahaan Sampel No Kode Nama Perusahaan 1 ADES PT Akasha Wira Internasional (d/h Ades Waters Indonesia) Tbk. 2 AISA PT Tiga Pilar Sejahterah (d/h Asia Intiselera) Tbk. 3 ALMI PT Alumindo
female male help("predict") yhat age
 yhat age") 30 40 50 60 70 female male 1.0 help("predict") 0.5 yhat 0.0 0.5 1.0 30 40 50 60 70 age 30 40 50 60 70 1.5 1.0 female male help("predict") 0.5 yhat 0.0 0.5 1.0 1.5 30 40 50 60 70 age 2 Wald Statistics Response:
30 40 50 60 70 female male 1.0 help("predict") 0.5 yhat 0.0 0.5 1.0 30 40 50 60 70 age 30 40 50 60 70 1.5 1.0 female male help("predict") 0.5 yhat 0.0 0.5 1.0 1.5 30 40 50 60 70 age 2 Wald Statistics Response:
Review of Upstate Load Forecast Uncertainty Model
 Review of Upstate Load Forecast Uncertainty Model Arthur Maniaci Supervisor, Load Forecasting & Energy Efficiency New York Independent System Operator Load Forecasting Task Force June 17, 2011 Draft for
THERMOELECTRIC SAMPLE CONDITIONER SYSTEM (TESC)
") THERMOELECTRIC SAMPLE CONDITIONER SYSTEM (TESC) FULLY AUTOMATED ASTM D2983 CONDITIONING AND TESTING ON THE CANNON TESC SYSTEM WHITE PAPER A critical performance parameter for transmission, gear, and hydraulic
THERMOELECTRIC SAMPLE CONDITIONER SYSTEM (TESC) FULLY AUTOMATED ASTM D2983 CONDITIONING AND TESTING ON THE CANNON TESC SYSTEM WHITE PAPER A critical performance parameter for transmission, gear, and hydraulic
Improving CERs building
 Improving CERs building Getting Rid of the R² tyranny Pierre Foussier pmf@3f fr.com ISPA. San Diego. June 2010 1 Why abandon the OLS? The ordinary least squares (OLS) aims to build a CER by minimizing
The purpose of this experiment was to determine if current speed limit postings are
 Memorandum To: Jen Keidel From: Christina Ochs (Seat 28) Date: 1/19/12 Re: Spot Speed Memo 1. Introduction The purpose of this experiment was to determine if current speed limit postings are satisfactory
Universitas Sumatera Utara
 LAMPIRAN 1 DATA AWAL PERUSAHAAN SAMPEL No. KODE NAMA PERUSAHAAN AGE (Tahun) PPS (%) SIZE (Rupiah) UNDERP RICING (%) 1 EMTK Elang Mahkota Teknologi Tbk 26,44 10 4.314.284.667.000 1 2 PTPP PT PP (PERSERO)
Data Hasil Olahan Populasi
 LAMPIRAN 1 Data Hasil Olahan Populasi No. Kode Bank Nama Bank Kriteria 1 Kriteria 2 Sampel terpilih 1. AGRO Bank Rakyat Indonesia Agro Niaga Tbk 2. AGRS Bank Agris Tbk X X 3. BABP Bank MNC Internasional
Effect of Sample Size and Method of Sampling Pig Weights on the Accuracy of Estimating the Mean Weight of the Population 1
 Effect of Sample Size and Method of Sampling Pig Weights on the Accuracy of Estimating the Mean Weight of the Population C. B. Paulk, G. L. Highland 2, M. D. Tokach, J. L. Nelssen, S. S. Dritz 3, R. D.
FINAL REPORT AP STATISTICS CLASS DIESEL TRUCK COUNT PROJECT
 FINAL REPORT AP STATISTICS CLASS 2017-2018 DIESEL TRUCK COUNT PROJECT Authors: AP Statistics Class 2017-2018 Table of Contents SURVEY QUESTION...p. 2 AIR QUALITY...p. 3-4 TOTAL TRUCK COUNTS.p. 5 TRUCK
Quality Control in Mineral Exploration
 Quality Control in Mineral Exploration Controlling the Quality of Information from Field to Data Base Not to be reproduced without written permission Quality Control in Mineral Exploration There many goals
Descriptive Statistics Practice Problems (99-04)
") Descriptive Statistics Practice Problems (99-04) 1. One thousand candidates sit an examination. The distribution of marks is shown in the following grouped frequency table. Marks 1 10 11 20 21 30 31 40
Descriptive Statistics Practice Problems (99-04) 1. One thousand candidates sit an examination. The distribution of marks is shown in the following grouped frequency table. Marks 1 10 11 20 21 30 31 40
namibia UniVERSITY OF SCIEnCE AnD TECHnOLOGY FACULTY OF HEALTH AND APPLIED SCIENCES DEPARTMENT OF MATHEMATICS AND STATISTICS MARKS: 100
 namibia UniVERSITY OF SCIEnCE AnD TECHnOLOGY FACULTY OF HEALTH AND APPLIED SCIENCES DEPARTMENT OF MATHEMATICS AND STATISTICS QUALIFICATION: BACHELOR OF ECONOMICS -., QUALIFICATION CODE: 7BAMS LEVEL: 7
Sharif University of Technology. Graduate School of Management and Economics. Econometrics I. Fall Seyed Mahdi Barakchian
 Sharif University of Technology Graduate School of Management and Economics Econometrics I Fall 2010 Seyed Mahdi Barakchian Textbook: Wooldridge, J., Introductory Econometrics: A Modern Approach, South
Author s Accepted Manuscript
 Author s Accepted Manuscript Dataset on statistical analysis of Jet A-1 fuel laboratory properties for on-spec into-plane operations Aderibigbe Israel Adekitan, Tobi Shomefun, Temitope M. John, Bukola