Recent Developments in International Seaborne Trade and Maritime Transport
|
|
|
- Logan Fleming
- 6 years ago
- Views:
Transcription

1 Recent Developments in International Seaborne Trade and Maritime Transport IFSPA, Hong Kong, 3-5 June 2013 Dr. Vincent F. Valentine Officer-in-Charge, Transport Section Division on Technology and Logistics


2 Research UNCTAD Intergovernmental Technical assistance and capacity building
 (1990 = 100) Source: UNCTAD")
3 The OECD Industrial Production Index and indices for world GDP, world merchandise trade and world seaborne trade ( ) (1990 = 100) Source: UNCTAD secretariat
4 15 per cent annual growth Elasticity Trade/GDP 10 Exports 5 GDP Exports = 2.5 GDP -15 Source: UNCTAD

5 For a country s GDP to grow, e.g., 5% trade needs to grow 7 12%

6 International Seaborne trade in Cargo ton-miles
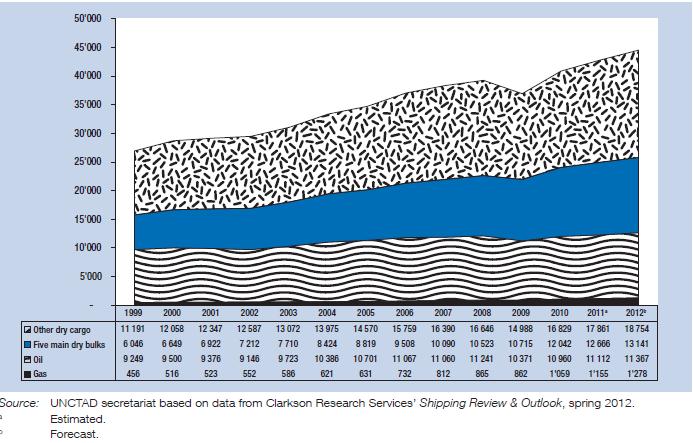
7 International Seaborne Trade by cargo type, selected years (Millions of tons loaded) Year Oil trade Gas trade Five main dry bulks Other dry cargoes All cargoes (e) Total miles for all cargo forecast to grow by over 4% in 2013 RMT 2012 and RMT 2013 forthcoming based on Clarkson Research Services e: estimated ton= metric ton, 1000 kg
8 Baltic Dry Index
9 Average Daily Earnings of Bulker Vessels ($ per day) Panamax Capsize Supramax Source: Clarkson Shipping Intelligence Network Timeseries

10 Transport costs as a % of freight rates UNCTAD Secretariat
11 Growth of demand and supply in container shipping, (Annual growth rates) Demand Supply

12 Trade in intermediate goods Source: UNCTAD TD/B/C.I/16, 2011
13 Tanker market summary: clean and dirty spot rates, (Worldscale) Vessel type Routes Percentage 2013 Dec Jan Feb Mar Apr May Jun Jul Aug Sept Oct Nov Dec change Dec 2012/ Jan Feb Mar Apr Dec 2011 VLCC/ULCC (200,000 dwt+) Persian Gulf Japan % Persian Gulf Republic of Korea % Persian Gulf Caribbean/East Coast of North America % West Africa - China % Suezmax (100, ,000 dwt) West Africa North-West Europe % West Africa Caribbean/East Coast of North America % Mediterranean Mediterranean % Aframax (70, ,000 dwt) North-West Europe North-West Europe % North-West Europe Caribbean/ East Coast of North America Caribbean Caribbean/East Coast of North America % Mediterranean Mediterranean % Mediterranean North-West Europe % Indonesia Far East % Panamax (40,000-70,000 dwt) Mediterranean Mediterranean % Mediterranean Caribbean/East Coast of North America % Caribbean East Coast of North America/Gulf of Mexico % All clean tankers 70,000 80,000 dwt Persian Gulf Japan % ,000 60,000 dwt Persian Gulf Japan % ,000 50,000 dwt Caribbean East Coast of North America/Gulf of Mexico % ,000 35,000 dwt Singapore East Asia
14 1. Leading Maritime Nations Korea and China 74% 1. Building 2. Owning 3. Registration 4. Operation 5. Scrapping 6. Financing 7. Classification 8. Insurance services (P&I) 9. Seafarers 10. Container terminal operators
15 Shipbuilding Nations 2012 Source: DRAFT UNCTAD Review of Maritime Transport 2013 (forthcoming), based on data provided by Clarkson Research Services
16 2: Leading Maritime Nations Greece, Japan: 29% 1. Building 2. Owning 3. Registration 4. Operation 5. Scrapping 6. Financing 7. Classification 8. Insurance services (P&I) 9. Seafarers 10. Container terminal operators
17 Table 2.4 The 35 Countries and Territories with the Largest Owned Fleets (DWT) as at 1st January 2013 Number of Vessels Deadweight Tonnage Country or Territory of Ownership National Flag Foreign Flag c Total National Flag Foreign Flag c Total Foreign Flag c Total as a as % of Total % of World Greece Japan China Germany Korea, Republic of Singapore United States United Kingdom Norway China, Taiwan Province of Denmark Bermuda Turkey Italy China, Hong Kong SAR India United Arab Emirates Russian Federation Malaysia Netherlands Brazil Switzerland Iran (Islamic Republic of) Indonesia Cyprus France Canada Monaco Belgium Viet Nam Saudi Arabia Kuwait Sweden Oman Thailand Total top 35 countries Other Owners Total of known country of ownership Others, unknown country of ownership World total Source: DRAFT UNCTAD Review of Maritime Transport 2013 (forthcoming), based on data provided by Clarkson Research Services

 9. Seafarers 10.")
18 3: Leading Maritime Nations Panama, Liberia, Marshall Islands: 42% 1. Building 2. Owning 3. Registration 4. Operation 5. Scrapping 6. Financing 7. Classification 8. Insurance services (P&I) 9. Seafarers 10. Container terminal operators


19 Per cent of foreign flagged fleet (dwt) UNCTAD Review of Maritime Transport, various issues
, based on data provided by Clarkson Research")
20 Major flags of registration January 2012 (UNCTAD Review of Maritime Transport 2012) Source: DRAFT UNCTAD Review of Maritime Transport 2013 (forthcoming), based on data provided by Clarkson Research Services
 9. Seafarers 10.")
21 4: Leading Maritime Nations Denmark and Switzerland 30% 1. Building 2. Owning 3. Registration 4. Operation 5. Scrapping 6. Financing 7. Classification 8. Insurance services (P&I) 9. Seafarers 10. Container terminal operators

22 Source: Alphaliner. Data for May 2013

23 Source: Alphaliner. Data for May 2013
 9. Seafarers 10.")
24 5: Leading Maritime Nations India, Bangladesh, China, Pakistan 94% 1. Building 2. Owning 3. Registration 4. Operation 5. Scrapping 6. Financing 7. Classification 8. Insurance services (P&I) 9. Seafarers 10. Container terminal operators
, based on data provided by Clarkson Research")
25 Ship Recycling 2012 Source: DRAFT UNCTAD Review of Maritime Transport 2013 (forthcoming), based on data provided by Clarkson Research Services
 9. Seafarers 10.")
26 6-8: Leading Maritime Nations Financial and other services: UK, Scandinavia 1. Building 2. Owning 3. Registration 4. Operation 5. Scrapping 6. Financing 7. Classification 8. Insurance services (P&I) 9. Seafarers 10. Container terminal operators
 9. Seafarers 10.")
27 9: Leading Maritime Nations Philippines, Indonesia, 1. Building 2. Owning 3. Registration 4. Operation 5. Scrapping 6. Financing 7. Classification 8. Insurance services (P&I) 9. Seafarers 10. Container terminal operators
28 10: Leading Maritime Nations Hong Kong, Netherlands, Singapore, UAE: 44% 1. Building 2. Owning 3. Registration 4. Operation 5. Scrapping 6. Financing 7. Classification 8. Insurance services (P&I) 9. Seafarers 10. Container terminal operators

29 Source: Lloyd s List Intelligence 31 May 2013 Container Shipping

30 Source: Lloyd s List Intelligence 31 May 2013

31 Source: Lloyd s List Intelligence 31 May 2013

32 Source: Lloyd s List Intelligence 31 May 2013
33
34 Collaboration Civil Society ESPO AAPA IAPH Data UNCTAD s - Network PMAESA PMAWCA Other Ports Review of Maritime Transport Publication Port Training Programme Trade Logistics Branch, DTL/UNCTAD Portal/ Index? Academic Journals Analysis Port Performance Research Network Transport Newsletter UNCTAD Secretariat

35 JOC Port Productivity Index


36 Other Challenges


37 Review of Maritime Transport www. UNCTAD.org/rmt
REVIEW OF MARITIME TRANSPORT 2013
 UNITED NATIONS CONFERENCE ON TRADE AND DEVELOPMENT REVIEW OF MARITIME TRANSPORT 2013 Report by the UNCTAD secretariat Annex III UNITED NATIONS New York and Geneva, 2013 STATISTICAL ANNEX 173 True nationality
Annex IV. True nationality of the 20 largest fleets by flag of registration, as at 1 January 2011 a
 194 Annex IV. True nationality of the 20 largest fleets by flag of registration, as at 1 January 2011 a Antigua and Barbuda Bahamas China Belgium 0 0-9 122 0.2 1 59 0.1 Bermuda 0 0-17 1 907 2.8 0 0 - Brazil
BP Statistical Review of World Energy June 2017
 BP Statistical Review of World Energy June 217 Primary energy 8 Consumption 8 Consumption by fuel 9 66 th edition Primary energy Consumption* Growth rate per annum Million tonnes oil equivalent 26 27 28
Primary energy. 8 Consumption 9 Consumption by fuel. 67 th edition
 Primary energy 8 Consumption 9 Consumption by fuel 67 th edition Primary energy Consumption* Growth rate per annum Million tonnes oil equivalent 27 28 29 2 211 212 213 214 215 216 217 217 26-16 Share 217
I. World trade in Overview
 I. World trade in - Overview Table I.1 Growth in the volume of world merchandise exports and production, 2-5 (Annual percentage change) 2-5 23 24 World merchandise exports 4.5 5. 9.5 6. Agricultural products
KINGDOM OF CAMBODIA NATION RELIGION KING 3
 KINGDOM OF CAMBODIA NATION RELIGION KING 3 TOURISM STATISTICS REPORT October 2018 MINISTRY OF TOURISM Statistics and Tourism Information Department No. A3, Street 169, Sangkat Veal Vong, Khan 7 Makara,
KINGDOM OF CAMBODIA NATION RELIGION KING 3
 KINGDOM OF CAMBODIA NATION RELIGION KING 3 TOURISM STATISTICS REPORT September 2018 MINISTRY OF TOURISM Statistics and Tourism Information Department No. A3, Street 169, Sangkat Veal Vong, Khan 7 Makara,
FEDERAL RESERVE statistical release
 FEDERAL RESERVE statistical release FOR IMMEDIATE RELEASE MARCH 16, 1992 E.U C1Z1, GEOGRAPHICAL r DISTRIBUTION n OF e ASSETS AND^LIABILITIES (IN MILLIONS OF DOLLARS) ASSETS COUNTRY OF CUSTOMER 12/31/90
World real merchandise trade grows faster than output
 I. I. world trade developments 8 Merchandise trade and GDP World real merchandise trade grows faster than output In 2006, the volume of world merchandise trade grew by 8 per cent while world gross domestic
67 th edition. Renewable energy. Appendices. 44 Other renewables consumption 45 Biofuels production
 Renewable energy 44 Other renewables consumption 45 Biofuels production Appendices A1 Solar Generation A2 Wind Generation A3 Geothermal, biomass and other Generation A4 Geothermal Cumulative installed
M O T O R V E H I C L E S T A T I S T l C S
 M O T O R V E H I C L E S T A T I S T l C S of Japan 2017 JAPAN AUTOMOBILE MANUFACTURERS ASSOCIATlON, INC. C O N T E N T S Motor Vehicles in Use Cars, Trucks, Buses and Special Purpose Vehicles, 1945-2016
 Urchin 7 cflag.ifas.ufl.edu Page 1 of 2 Standard View Export All Visits Permalink Geo Location Jul 1, 2015 - Jul 31, 2015 First Date 2015 Compare to Past Jan Feb Mar Apr May Jun Jul Aug Sep Oct Nov Dec
Natural gas. 26 Reserves 28 Production and consumption 33 Prices 34 Trade movements. 67 th edition
 Natural gas 26 Reserves 28 Production and consumption 33 Prices 34 Trade movements 67 th edition Natural gas Total proved reserves At end 1997 At end 2007 At end 2016 At end Trillion Trillion Trillion
Coal. 36 Reserves and prices 38 Production and consumption. 67 th edition
 Coal 36 Reserves and prices 38 Production and consumption 67 th edition Total proved reserves at end 217 Million tonnes Anthracite and bituminous Subbituminous and lignite US 228 3116 25916 24.2% 357 Canada
AUSTRIA. Table 1. FDI flows in the host economy, by geographical origin. (Millions of US dollars)
") Table 1. FDI flows in the host economy, by geographical origin World 5 690 138 6 195 3 184 10 784 7 933 31 154 6 858 9 303 840 10 618 5 760 Developed economies 5 740 13 5 341 2 689 10 137 6 291 29 721
Table 1. FDI flows in the host economy, by geographical origin World 5 690 138 6 195 3 184 10 784 7 933 31 154 6 858 9 303 840 10 618 5 760 Developed economies 5 740 13 5 341 2 689 10 137 6 291 29 721
SWITZERLAND October 2011
 UNITED NATIONS CONFERENCE ON TRADE AND DEVELOPMENT INVESTMENT COUNTRY PROFILES SWITZERLAND October 2011 i NOTE The Division on Investment and Enterprise of UNCTAD is a global centre of excellence, dealing
Global Dialysis - Cost per Dialysis Session
 Cost per session for dialysis where a cost has been entered for a dialysis centre. All costs have been converted to US Dollars as at 19 May 2006. Note that the costs do not state what is covered by a dialysis
Emerging Trends in Petroleum Markets
 Emerging Trends in Petroleum Markets For Defense Logistics Agency, Worldwide Energy Conference Washington, D.C. By T. Mason Hamilton, Petroleum Markets Analyst U.S. Energy Information Administration Independent
Table 23 Production of minor oil products from refineries - by type Thousand metric tons
 Table 23 Production of minor oil from refineries - by type Table Notes Data refer to production from refineries of refinery, ethane, naphtha, lubricants, bitumen, paraffin, petroleum, white spirit, and
Table 5 Production, trade and supply of hard coal Thousand metric tons and kilograms per capita
 Table Notes Production includes production from other sources as defined in the previous table. Data for China include brown coal. Please refer to the Definitions Section on pages ix to xv for the appropriate
World Air Conditioner Demand by Region
 World Air Conditioner Demand by Region April 2015 The Japan Refrigeration and Air Conditioning Industry Association 1 World Air Conditioner Demand by Region April 2015 The Japan Refrigeration and Air Conditioning
Table 5 Production, trade and supply of hard coal Thousand metric tons and kilograms per capita
 Table Notes Production includes production from other sources as defined in the previous table. Data for China include brown coal. Please refer to the Definitions Section on pages ix to xv for the appropriate
India & Asia. Steel Scrap Industry BY: VED PRAKASH GEMINI CORPORATION N. V., BELGIUM
 India & Asia Steel Scrap Industry BY: VED PRAKASH GEMINI CORPORATION N. V., BELGIUM 1 GEMINI CORPORATION N. V. Steel, Recyclable Plastics, Rubber and Engineered Wood Panels 2 Content How competitive are
EU Dairy Exports to Third countries
 Milk Market Observatory TRA.EU.Extr Latest update : 12.6.218 Source : Eurostat (COMEXT) EU Dairy Exports to Third countries (January-April) 16 14 12 1 8 6 4 2 BUTTER exports 1 Tonnes 162 135 137 12 94
Global Monthly February 2018
 Global Monthly February 18 3 1-year Treasury yields 1-year breakeven inflation rate 1 1 15 16 17 18 February 18 5 3 Global GDP growth Composite PMI (RHS) Index 56 5 5 1 5 1 13 1 15 16 17 18 3..5. 1.5 1.
KINGDOM OF CAMBODIA NATION RELIGION KING 3
 KINGDOM OF CAMBODIA NATION RELIGION KING 3 TOURISM STATISTICS REPORT March 2018 MINISTRY OF TOURISM Statistics and Tourism Information Department No. A3, Street 169, Sangkat Veal Vong, Khan 7 Makara, Phnom
Summary of debt securities outstanding
 Summary of debt securities outstanding All countries........................ 22,695 15,852 6,665 3,427 1,762 Developed countries........................ 16,504 13,087 5,869 2,716 701 Austria 510 173 44
Spain s imports by oil product group and country of origin
 Corporación de Reservas Estratégicas de Productos Petrolíferos Castellana, 79 28046 Madrid T. +34 91 360 09 10 Updated F. +34 91 420 on39 45 www.cores.es September 12 th 2018 Spain s imports by oil product
Martin Stopford President, Clarkson Research
 9//5 Current and past policies for expanding maintaining or reducing shipbuilding capacity: OECD Working Party No 6 9 th November 5 Martin Stopford President, Clarkson Research Martin Stopford, Clarkson
Soybean Oil Prices Diverge on Different Supply Situations
 United States Department of Agriculture Foreign Agricultural Service Circular Series FOP 10-09 October 2009 Soybean Oil Prices Diverge on Different Supply Situations Soybean Oil Price ($/ton) $900 $850
Total credit to the non-financial sector (core debt), % of GDP Table F1.1
, % of GDP Table F1.1") Total credit to the non-financial sector (core debt), % of GDP Table F1.1 2012 2013 2014 2015 2016 Q2 16 Q3 16 Q4 16 Q1 17 Q2 17 Argentina 62.6 66.4 64.6 75.5 75.3 81.7 80.1 75.3 71.6 72.7 Australia 208.0
Total credit to the non-financial sector (core debt), % of GDP Table F1.1 2012 2013 2014 2015 2016 Q2 16 Q3 16 Q4 16 Q1 17 Q2 17 Argentina 62.6 66.4 64.6 75.5 75.3 81.7 80.1 75.3 71.6 72.7 Australia 208.0
Table 13 Production, trade and supply of conventional crude oil Thousand metric tons; kilograms per capita; reserves production ratio (R/P) in years
 in years") , trade and supply of conventional crude oil Thousand metric tons; kilograms per capita; reserves production ratio (R/P) in years Table Notes The Reserves / ratio refers to crude oil and natural gas liquids.
, trade and supply of conventional crude oil Thousand metric tons; kilograms per capita; reserves production ratio (R/P) in years Table Notes The Reserves / ratio refers to crude oil and natural gas liquids.
Imports of seed for sowing by country Calendar year 2011 Source: ISF compilation based on official statistics and international seed trade reports
 USA 157,432 15,562 464 173,458 523 318 67 908 Germany 195,159 5,913 520 201,592 595 97 22 714 France 125,701 4,389 277 130,367 522 150 11 683 Netherlands 140,899 12,253 796 153,948 250 330 48 628 Italy
Production of minor oil products from refineries - by type Thousand metric tons
 Production of minor oil from refineries - by type Table 23 Table Notes Data refer to production from refineries of refinery, ethane, naphtha, lubricants, bitumen, paraffin, petroleum, white spirit, and
KINGDOM OF CAMBODIA NATION RELIGION KING 3
 KINGDOM OF CAMBODIA NATION RELIGION KING 3 TOURISM STATISTICS REPORT March 2015 MINISTRY OF TOURISM Statistics and Tourism Information Department No. A3, Street 169, Sangkat Veal Vong, Khan 7 Makara, Phnom
KINGDOM OF CAMBODIA NATION RELIGION KING 3
 KINGDOM OF CAMBODIA NATION RELIGION KING 3 TOURISM STATISTICS REPORT December 2015 MINISTRY OF TOURISM Statistics and Tourism Information Department No. A3, Street 169, Sangkat Veal Vong, Khan 7 Makara,
China Soybean Imports Stagnant Despite Record Consumption as Production Rebounds
 United States Department of Agriculture Foreign Agricultural Service Circular Series FOP 9-08 tember 2008 China Soybean Stagnant Despite Record Consumption as Rebounds Million Tons 60 50 40 30 20 10 0
Evolving Global Oil Trade Flows. IEA-IEF-OPEC Joint Meeting Vienna, March 2018
 Evolving Global Oil Trade Flows IEA-IEF-OPEC Joint Meeting Vienna, March 2018 SHIFTING FLOWS: WHAT HAS THIS MEANT IN PRACTICE? US/Europe crude imports & exports Saudi crude to Poland Chinese teapots importing
KINGDOM OF CAMBODIA NATION RELIGION KING 3
 KINGDOM OF CAMBODIA NATION RELIGION KING 3 TOURISM STATISTICS REPORT February 2017 MINISTRY OF TOURISM Statistics and Tourism Information Department No. A3, Street 169, Sangkat Veal Vong, Khan 7 Makara,
KINGDOM OF CAMBODIA NATION RELIGION KING 3
 KINGDOM OF CAMBODIA NATION RELIGION KING 3 TOURISM STATISTICS REPORT May 2017 MINISTRY OF TOURISM Statistics and Tourism Information Department No. A3, Street 169, Sangkat Veal Vong, Khan 7 Makara, Phnom
KINGDOM OF CAMBODIA NATION RELIGION KING 3
 KINGDOM OF CAMBODIA NATION RELIGION KING 3 TOURISM STATISTICS REPORT October 2017 MINISTRY OF TOURISM Statistics and Tourism Information Department No. A3, Street 169, Sangkat Veal Vong, Khan 7 Makara,
Growing Soybean Oil Price Raises Oil s Contribution to Total Soybean Value
 United States Department of Agriculture Foreign Agricultural Service Circular Series FOP 10-07 October 2007 Growing Soybean Oil Price Raises Oil s Contribution to Total Soybean Value Relative Share Value:
KINGDOM OF CAMBODIA NATION RELIGION KING 3
 KINGDOM OF CAMBODIA NATION RELIGION KING 3 TOURISM STATISTICS REPORT September 2017 MINISTRY OF TOURISM Statistics and Tourism Information Department No. A3, Street 169, Sangkat Veal Vong, Khan 7 Makara,
Table 13 Production, trade and supply of conventional crude oil Thousand metric tons; kilograms per capita; reserves production ratio (R/P) in years
 in years") Table 13, trade and supply of conventional crude oil Thousand metric tons; kilograms per capita; reserves production ratio (R/P) in years Table Notes The Reserves / ratio refers to crude oil and natural
Table 13, trade and supply of conventional crude oil Thousand metric tons; kilograms per capita; reserves production ratio (R/P) in years Table Notes The Reserves / ratio refers to crude oil and natural
The Tanker Sustainability Scenarios
 Prof Martin Stopford President, Clarkson Research The Tanker Sustainability Scenarios Future view of tanker Industry Intertanko Sustainability Day Grand Hotel, Oslo, 30 th May 2013 1. A word about scenarios
Table 13 Production, trade and supply of conventional crude oil Thousand metric tons; kilograms per capita; reserves production ratio (R/P) in years
 in years") Million metric tons Million metric tons Table 13, trade and supply of conventional crude oil Thousand metric tons; kilograms per capita; reserves production ratio (R/P) in years Table Notes The Reserves
Million metric tons Million metric tons Table 13, trade and supply of conventional crude oil Thousand metric tons; kilograms per capita; reserves production ratio (R/P) in years Table Notes The Reserves
MD s Report. North American Panel Houston. October 18, International Association of Independent Tanker Owners
 North American Panel Houston MD s Report October 18, 2017 International Association of Independent Tanker Owners INTERTANKO 2017 2016 2017 Membership by Registration Greece Italy Germany Singapore Japan
NZPork Monthly Import Report
 NZPork Monthly Import Report IW Barugh and EJ Neumann December 10, 2017 1 Data summary for October 2017 Data from January 2000 through October 2017 was downloaded from the Statistics NZ website (http://www.stats.govt.
Early-Season U.S. Soybean Meal Sales Surge
 United States Department of Agriculture Foreign Agricultural Service November 2014 Early-Season U.S. Soybean Meal Sales Surge U.S. soybean meal export commitments (accumulated exports plus outstanding
Switzerland. A. Definitions and sources of data
 Switzerland A. Definitions and sources of data The Swiss National Bank (SNB) compiles data on foreign direct investment (FDI) for balance of payments- and international investment position- purposes. The
Global Oil&Gas Tanker Outlook
 MARSEILLE MARITIME 28 Global Oil&Gas Tanker Outlook ( and just a few words on containerships) Ralph Leszczynski Marseille, 16 September 28 banchero costa research www.bancosta.it - research@bancosta.it
Regional Vegetable Oil Situation: Cut in Sun Oil Production, Imports Leaves North Africa & the Middle East Looking for Soy & Palm Oil to Fill Demand
 United States Department of Agriculture Foreign Agricultural Service Circular Series FOP 09-07 tember 2007 Regional Vegetable Oil Situation: Cut in Sun Oil, Leaves North Africa & the Middle East Looking
Table 16 Refinery distillation capacity, throughput and output Thousand metric tons
 Million metric tons Table 16 Refinery distillation capacity, throughput and output Table Notes Output is equal to the sum of production from refineries for aviation gasoline, bitumen, gas/diesel oil, ethane,
Global Threat Reduction Initiative Foreign Research Reactor Spent Nuclear Fuel Shipments
 FY1996 1. Sept. 22, 1996 280 assemblies in 8 casks to SRS [First East Coast Shipment] FY 1997 Sweden 64 Switzerland 42 Germany 125 Chile 28 Columbia 21 2. Dec. 15, 1996 41 spent fuel assemblies in one
Global Monthly March 2019
 Global Monthly March 19 Percent of world bonds outstanding 3 5 15 5 Jan-1 Jun-1 Nov-1 Apr-15 Sep-15 Feb-1 Jul-1 Dec-1 May-17 Oct-17 Mar-1 Aug-1 Dec-1 Mar-19 March 19 Percent, year-on-year 7 5 3 1 1Q1 1Q
1. INTERNATIONAL OVERVIEW. 1.0 Area and population. population (1,000) area
 area") 1.0 Area and population area population (1,000) km 2 2000 2010 2018 1 inhabitants per km 2 Belgium 30,530 10,251 10,920 11,443 375 Germany 357,380 82,212 81,777 82,952 232 Estonia 45,230 1,397 1,331 1,315
1.0 Area and population area population (1,000) km 2 2000 2010 2018 1 inhabitants per km 2 Belgium 30,530 10,251 10,920 11,443 375 Germany 357,380 82,212 81,777 82,952 232 Estonia 45,230 1,397 1,331 1,315
Argentine Exporters Switch to Soybean Oil as Biodiesel Exports Fall
 United States Department of Agriculture Foreign Agricultural Service Circular Series FOP 08-13 Argentine Exporters Switch to Soybean Oil as Biodiesel Exports Fall Argentina s soybean oil exports have surged
Table 16 Refinery distillation capacity, throughput and output Thousand metric tons
 Table 16 Refinery distillation capacity, throughput and output Table Notes Output is equal to the sum of production from refineries for aviation gasoline, bitumen, gas/diesel oil, ethane, feedstocks, gasoline-type
Global Competitiveness Index Rankings
 APPENDIX B Global Competitiveness Index 2017 2018 Rankings The following pages report the GCI 2017 2018 rankings for the three subindexes (Table 1) and their corresponding pillars (Tables 2 4). Detailed
Toyota IMV Sales Reach Global 5 Million-unit Mark
 Apr. 06, 2012 Toyota IMV Sales Reach Global 5 Million-unit Mark Toyota City, Japan, April 6, 2012 Toyota Motor Corporation (TMC) announces that worldwide cumulative sales of its Innovative International
UXC.COM A PUBLICATION OF. NPO Overview 1501 MACY DRIVE ROSWELL, GA PH FX
 2019 A PUBLICATION OF UXC.COM NPO Overview 1501 MACY DRIVE ROSWELL, GA 30076 PH +1 770 642-7745 FX +1 770 643-2954 NOTICE UxC, LLC ( UxC ) shall have title to, ownership of, and all proprietary rights
GLOBAL SUMMARY REPORT Market for High Voltage Insulators & Bushings
 GLOBAL SUMMARY REPORT Market for High Voltage Insulators & Bushings 2010-2015 - 2025 GOULDEN REPORTS October 2016 No 1 Priorsfield, Marlborough, Wiltshire, SN84AQ. United Kingdom Tel: +44 1672 513316 Fax:
Explosive Growth in Vegetable Oil Demand Exacerbates Chinese Supply Deficit, Reliance on Imports. Imports
 United States Department of Agriculture Foreign Agricultural Service Circular Series FOP 12-07 ember 2007 Million tons 35 Explosive Growth in Vegetable Oil Demand Exacerbates Chinese Supply Deficit, Reliance
Inbound Tourism Trends Quarterly Q Issue 20 January 2017
 Inbound Tourism Trends Quarterly Q3 216 Issue 2 January 217 1 Contents 1. About this data 2. Global Context: Global view, Economic outlook and Exchange rate 3. Inbound Volume and Value 4. Journey Purpose,
Annex. List of tables
 Statistical annex Annex List of tables A. 1 Developed economies: rates of growth of real GDP, 2000-2010... 145 A. 2 Economies in transition: rates of growth of real GDP, 2000-2010... 146 A. 3 Developing
About Czarnikow. The Premier Provider of Sugar Market Services. Czarnikow has been in the sugar business since 1861
 About Czarnikow The Premier Provider of Sugar Market Services Czarnikow has been in the sugar business since 1861 Czarnikow is the leading professional services company in the sugar market Czarnikow has
Growing Fuel Use Limits Exports of Soybean Oil by South America
 United States Department of Agriculture Foreign Agricultural Service Circular Series FOP 11-09 ember 2009 Growing Fuel Use Limits of Soybean Oil by South America 2006/07 Soybean Oil Distribution Soybean
Total fleet. Oil tankers
 184 as at 1 January 2011 (in thousands of dwt) DEVELOPING ECONOMIES OF AFRICA Algeria 809 30 204 66 0 509 Angola 58 10 0 14 0 34 Benin 0 0 0 0 0 0 Cameroon 10 0 0 4 0 6 Cape Verde 22 5 0 12 0 6 Comoros
Spain s imports by oil product group and country of origin
 Corporación de Reservas Estratégicas de Productos Petrolíferos Castellana, 79 28046 Madrid T. +34 91 360 09 10 Updated F. +34 91 420 on39 45 www.cores.es February 12 th 2018 Spain s imports by oil product
Spain s exports by oil product group and country of destination
 Corporación de Reservas Estratégicas de Productos Petrolíferos Castellana, 79 28046 Madrid T. +34 91 360 09 10 Updated F. +34 91 420 on39 45 www.cores.es February 13 th 2017 Spain s exports by oil product
Inbound Tourism Trends Quarterly Quarter Issue 24 January 2018
 Inbound Tourism Trends Quarterly Quarter 3 217 Issue 24 January 218 1 Contents 1. About this data 2. Global Context: Global view, Economic outlook and Exchange rate 3. Inbound Volume and Value (Journey
China s Global Peanut Export Share Declines
 United States Department of Agriculture Foreign Agricultural Service Circular Series FOP 07-13 China s Global Peanut Export Share Declines U.S. 10% Others 19% Argentina 17% U.S. 11% Others 16% Argentina
19,000 38,500. Mean Crop. 5, ,827 Max , ,869 Last Year 6, ,
 YTD Inventory / Shipment Report In Shell Basis Crop: 2017 Monthly Market Prices FCA Hamburg Iranian Dried In Shell 28/30 Fandoghi Pistachios 10th Marketing Month YTD Carry in from previous year 3,000 Total
Sharp Decline in Vegetable Oil Stocks Leads to Steeply Higher Prices
 United States Department of Agriculture Foreign Agricultural Service Circular Series FOP 1-11 Sharp Decline in Vegetable Oil Leads to Steeply Higher Prices Commodity prices have been on an upward trend
STATISTICS BOTSWANA. BOTSWANA international MONTHLY DIGEST NOVEMBER No. 2014/01
 BOTSWANA international merchandise trade STATISTICS No. 2014/01 MONTHLY DIGEST STATISTICS BOTSWANA Copyrights C Statistics Botswana 2014 NOVEMBER 2013 Contact Statistician: Keanewa Mandoze Email: kmandoze@gov.bw
Information Technology and Economic Development: An Introduction to the Research Issues
 November 1998 Working Papers No. 153 Information Technology and Economic Development: An Introduction to the Research Issues TABLE 1 WORLD-WIDE INFORMATION TECHNOLOGY MARKET BREAKDOWN, 1995
US Crude Oil Reshaping International Crude Oil Flows. Olivier Jakob,
 US Crude Oil Reshaping International Crude Oil Flows Olivier Jakob, ojakob@petromatrix.com www.petromatrix.com Claimer Petromatrix publishes since 2006 a daily market note on the oil markets Our reports
Drought in South America to Limit Soybean Exports
 United States Department of Agriculture Foreign Agricultural Service Circular Series FOP 2-09 ruary 2009 Drought in South America to Limit Soybean Exports Million Tons 16 14 12 10 8 6 4 2 Annual Change
Performance Derby: MSCI Regions/Countries Earnings & Revenues Growth 2019E / 2018E / 2017A
 Performance Derby: MSCI Regions/Countries Earnings & Revenues Growth 2019E / 2018E / 2017A February 28, 2018 Dr. Ed Yardeni 516-972-7683 eyardeni@yardeni.com Joe Abbott 732-497-5306 jabbott@yardeni.com
Rising Coconut Oil Prices Foreshadow Tight Supplies in 2007
 United States Department of Agriculture Foreign Agricultural Service Circular Series FOP 2-07 ruary 2007 Rising Coconut Oil Prices Foreshadow Tight Supplies in 2007 800 Coconut Oil Price: CIF Rotterdam
35,000 52,000 87,000 1,600 8, ,400 76,600. Mean Crop. Monthly YTD Min ,671 8,211 Max. 2017
 YTD Inventory / Shipment Report In Shell Basis Crop: 2018 Monthly Market Prices FCA Hamburg Iranian Dried In Shell 28/30 Fandoghi Pistachios Total Consumption Ending Inventory 2nd Marketing Month YTD Carry
As China s Soybean Oil Imports Fall, Production Expands
 United States Department of Agriculture Foreign Agricultural Service Circular Series FOP 10-10 October 2010 As China s Soybean Oil Fall, Expands 12 10 Million Metric Tons 8 6 4 2 0 2006/07 2007/08 China
(annual average compound growth rate)
") Table 3-1. 3KDVHVRI*URZWKE\0DMRU5HJLRQ (annual average compound growth rate) 1820-70 1870-1913 1913-50 1950-73 1973-92 1820-1992 GDP Western Europe 1.7 2.1 1.4 4.7 2.2 2.2 Western Offshoots 4.3 3.9 2.8
Table 3-1. 3KDVHVRI*URZWKE\0DMRU5HJLRQ (annual average compound growth rate) 1820-70 1870-1913 1913-50 1950-73 1973-92 1820-1992 GDP Western Europe 1.7 2.1 1.4 4.7 2.2 2.2 Western Offshoots 4.3 3.9 2.8
CROP PLUS CARRY FORWARD STOCKS (SULTANA & THOMPSONS) GOLDEN SEEDLESS
 GOLDEN SEEDLESS") WORLD DRIED GRAPE PRODUCTION AND AVAILABILITY, 2017 (TONS) SULTANA & THOMPSONS CROP PLUS CARRY FORWARD STOCKS (SULTANA & THOMPSONS) GOLDEN SEEDLESS CROP PLUS CARRY FORWARD STOCKS (GOLDEN SEEDLESS) CURRANTS
WORLD DRIED GRAPE PRODUCTION AND AVAILABILITY, 2017 (TONS) SULTANA & THOMPSONS CROP PLUS CARRY FORWARD STOCKS (SULTANA & THOMPSONS) GOLDEN SEEDLESS CROP PLUS CARRY FORWARD STOCKS (GOLDEN SEEDLESS) CURRANTS
Soybean Trade Growth: A Story of Brazil, the United States, and China
 United States Department of Agriculture Foreign Agricultural Service October 2017 Soybean Trade Growth: A Story of Brazil, the United States, and China 12-Month Soybean Export Growth Year Ending September
Table B1. Advanced Economies: Unemployment, Employment, and Real per Capita GDP (Percent)
") Statistical Appendix Table B1. Advanced Economies: Unemployment, Employment, and Real per Capita GDP (Percent) Unemployment Rate 2 Averages 1 1993 2002 2003 12 Advanced Economies 6.8 6.9 6.7 6.5 6.3 5.8
Statistical Appendix Table B1. Advanced Economies: Unemployment, Employment, and Real per Capita GDP (Percent) Unemployment Rate 2 Averages 1 1993 2002 2003 12 Advanced Economies 6.8 6.9 6.7 6.5 6.3 5.8
9.01 ICT use for business-to-business transactions
 9.01 ICT use for business-to-business transactions To what extent do businesses in your country use ICTs for communicating and carrying out transactions with other businesses? [1 = not at all; 7 = extensively]
INTERTANKO Report. Hong Kong June International Association of Independent Tanker Owners. Leading the way; Making a difference
 INTERTANKO Report Hong Kong June 2018 International Association of Independent Tanker Owners INTERTANKO 2018 Members Lead continuous improvement of tanker industry s performance Strive to achieve the goals
Spain s imports by oil product group and country of origin
 Corporación de Reservas Estratégicas de Productos Petrolíferos Castellana, 79 28046 Madrid T. +34 91 360 09 10 Updated F. +34 91 420 on39 45 www.cores.es July 12 th 2018 Spain s imports by oil product
Global Economic Briefing: Merchandise Trade
 Global Economic Briefing: Merchandise Trade June 27, 18 Dr. Edward Yardeni 516-972-7683 eyardeni@ Debbie Johnson 48-664-1333 djohnson@ Mali Quintana 48-664-1333 aquintana@ Please visit our sites at www.
U.S. Soybean Prices Fall as Buyers Focus Turns to South America
 United States Department of Agriculture Foreign Agricultural Service Circular Series FOP 2-10 ruary 2010 U.S. Soybean Prices Fall as Buyers Focus Turns to South America $11.00 Daily U.S. Soybean Cash Price
Next Release: 14 November Next Release: 14 November July
 43282 Next Release: 14 November 2018 Next Release: 14 November 2018 July Date of publication: 12 October 2018 TABLE OF CONTENTS Charts 1 Gross consumption of natural gas by OECD region 3 2 Indigenous production
Brazil s Soybean Oil Exports Squeezed by Rising Biodiesel Demand
 United States Department of Agriculture Foreign Agricultural Service Circular Series FOP 6-09 e 2009 Brazil s Soybean Oil Exports Squeezed by Rising Biodiesel Demand Soybean Oil Exports and Industrial
Monetary and Economic Department. Detailed tables on preliminary locational and consolidated banking statistics at end-june 2012
 Monetary and Economic Department Detailed tables on preliminary locational and consolidated banking statistics at end-june 2012 October 2012 Queries concerning this release should be addressed to statistics@bis.org.
JURISDICTIONS PARTICIPATING IN THE CONVENTION ON MUTUAL ADMINISTRATIVE ASSISTANCE IN TAX MATTERS
 JURISDICTIONS PARTICIPATING IN THE CONVENTION ON MUTUAL ADMINISTRATIVE ASSISTANCE IN TAX MATTERS STATUS 27 JULY 2018 ORIGINAL CONVENTION 27-05-2010) OR OR 1. ALBANIA 01-03-2013 (AC) 08-08-2013 01-12-2013
Statistical tables. Heading 01. Chapter IX. Box 103 Out-heading
 Chapter IX Heading 01 Heading 02 Heading 03 Body copy Statistical tables The following statistical tables show long-term trends, more detailled breakdowns of commodity products and country origins and
2016/17 Global Olive Oil Production Down But Prices Stabilize
 United States Department of Agriculture Foreign Agricultural Service November 2016 Global Olive Oil Down But Prices Stabilize Global Olive Oil and Stocks 4000 3500 5000 Extra Virgin Olive Oil Prices Stabilizing
I. Global wine markets,
 I. Global wine markets, 2007-09 Table 1: Summary of the world's wine markets, 2007-09 (annual average) Vine % of cropland Wine Wine Wine Wine Wine Per adult wine Pop- GDP GDP Area under vines produced
OECD unemployment rate stable at 5.4% in March 2018
 OECD unemployment rate stable at.4% in March 2018 The OECD unemployment rate remained stable at.4% in March 2018. Across the OECD area, 34 million people were unemployed, 1.4 million more than in April
WORLD MOTOR VEHICLE PRODUCTION BY COUNTRY AND TYPE QUARTERS June 14, 2018
 QUARTERS 2017-2018 June 14, 2018 CONTENTS BASEPROTOTAL BASEPROCARS BASEPROLCV BASEPROHCV BASEPROBC Summation of cars, LCVs, HCVs, heavy buses Cars LCVs HCVs Heavy buses Note: The production of cars and