The Debrosse Memorial Report 2015 Oil & Gas Activity in Ohio
|
|
|
- Bennett Allison
- 5 years ago
- Views:
Transcription


1 The Debrosse Memorial Report Oil & Gas Activity in Ohio 69 th Annual Winter Meeting Prepared by: Marty Shumway - Shumway Resources, LLC Bill Arnholt - Northwood Energy Corporation Tim Knobloch - James Knobloch Petroleum Consultants, Inc.
2 The Debrosse Memorial Report Oil & Gas Activity in Ohio - Outline General overview of Ohio oil & gas production Permits & completion summaries Operator activity (footage drilled, number of wells) Activity by county (footage drilled, number of wells) Change of owners IP analysis for horizontal wells Production summary Utica EUR summary Class II injection well summary

3 Oil & Gas Production in Ohio More than 275,000 oil and gas wells drilled in Ohio since 1860 More than 50,000 producing wells in 49 of 88 Ohio counties
4 History of Ohio Wells Drilled by Year and Reservoir BEREA OHIO SHALE CLINTON TRENTON ROSE RUN CAMBRIAN NW Ohio Lima-Indiana Clinton Play Tight Gas Sands Morrow County Trempealeau Play Clinton Play Technologic Advance: Hydraulic Fracturing Clinton/Berea Plays 0
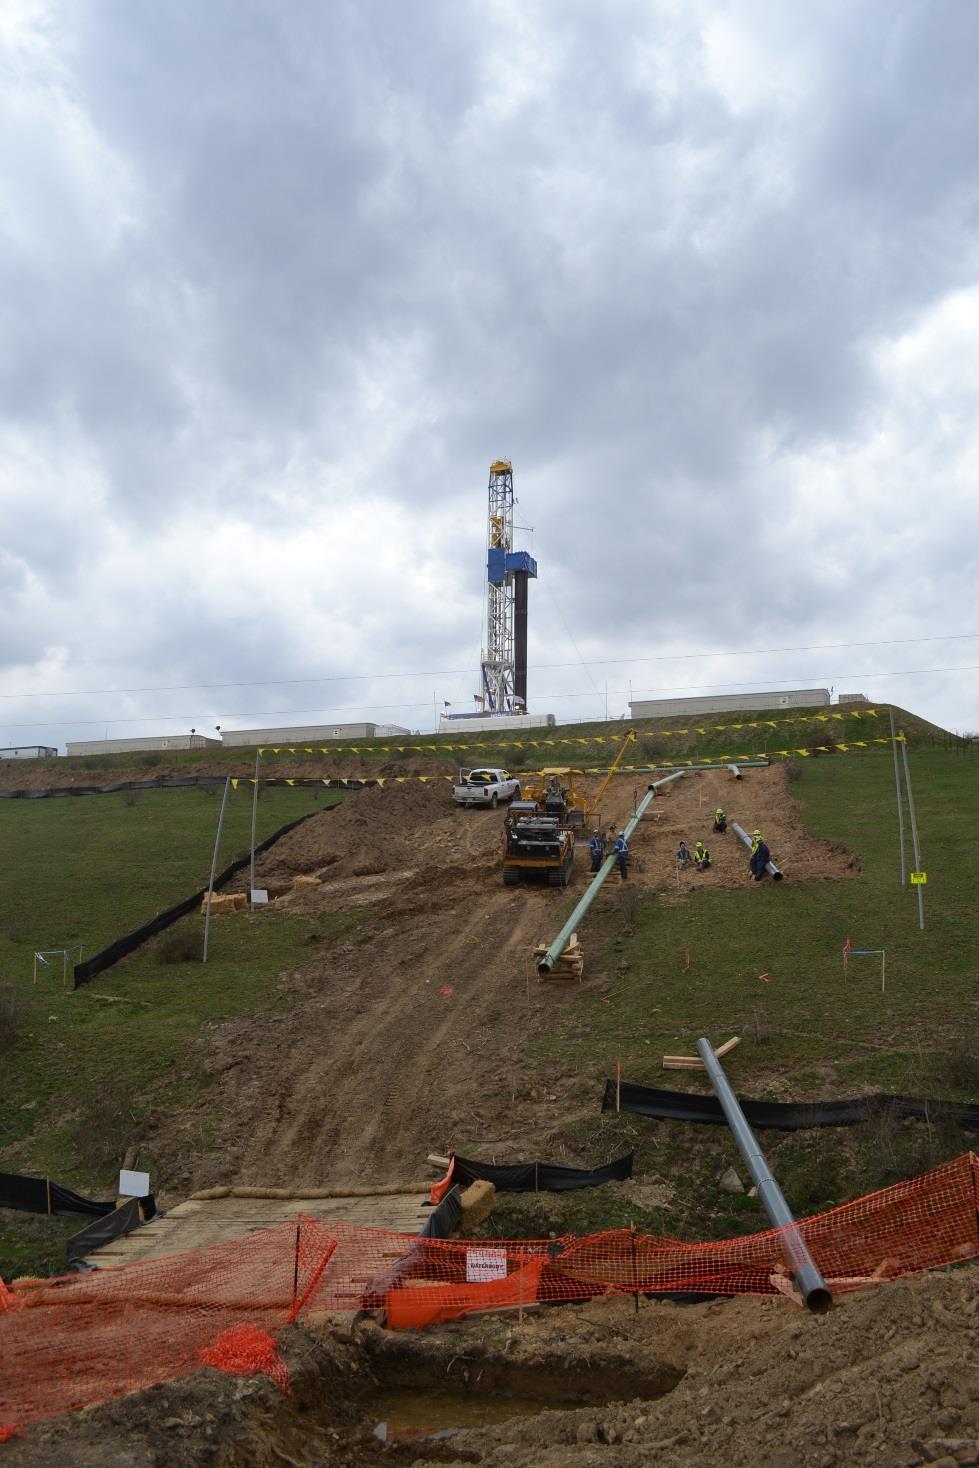


5 Permit & Completion Activity PHOTOGRAPHS COURTESY OF LARRY WICKSTROM
6 Permits & Completions TYPE ( 14 to 15) % PERMIT ,608 1, % COMPLETION % PLUG % TOTAL 1,512 1,533 1,929 2,818 2,942 2, %


7 Permit and Completions By Month Permits Completions Plugging Permits JAN FEB MAR APRIL MAY JUNE JULY AUG SEP OCT NOV DEC

8 Permitted Formations

9 Completions Permits to Drill Permits to Plug

10 Completions Permits to Drill Permits to Plug

11 Operators Completing Wells By Year
12 Wells Completed Type 534 Total Completions Directional 4, 1% Unknown 6, 1% Vertical 151, 28% Horizontal 373, 70%
13 Horizontal Completions By Formation
14 Vertical Completions By Formation
15 Class II Injection Well Completions By TD Formation

16 Completions By Month Horizontal Wells Vertical Wells JAN FEB MAR APRIL MAY JUNE JULY AUG SEP OCT NOV DEC
17 Completions Top 10 Counties COUNTY TOTAL HORIZONTAL VERTICAL* HARRISON CARROLL BELMONT MONROE GUERNSEY NOBLE COSHOCTON STARK KNOX COLUMBIANA OTHER COUNTIES TOTAL *INCLUDES DIRECTIONAL AND UNKNOWN

18 Completions By County HORIZONTAL VERTICAL
19 Top 12 Most Active Operators By Wells OPERATOR % TOT WELLS WELLS % 2014 CHESAPEAKE EXPLORATION LLC 27% % GULFPORT ENERGY CORPORATION 13% 71 92% ANTERO RESOURCES CORPORATION 9% % HESS OHIO DEVELOPMENTS LLC 5% % ASCENT RESOURCES UTICA LLC 4% 22 N/A RICE DRILLING D LLC 4% % ECLIPSE RESOURCES I LP 3% 18 13% NORTHWOOD ENERGY CORP 2% 13 86% ENERVEST OPERATING LLC 2% 10-57% ARTEX OIL COMPANY 2% 9-10% R E GAS DEVELOPMENT LLC 2% 9-31% MOUNTAINEER STATE OPER LLC 1% 7 N/A TOP 12 OPERATORS DRILLED APPROXIMATELY 75% OF TOTAL WELLS IN

20 Hess Ohio CNXGUE10N7W #H-8 PHOTOGRAPH COURTESY OF LARRY WICKSTROM
21 Top 12 Most Active Operators By Footage OPERATOR % TOTAL FOOTAGE FOOTAGE % 2014 CHESAPEAKE EXPLORATION LLC 34% 2,260,537-25% GULFPORT ENERGY CORPORATION 18% 1,155,182 94% ANTERO RESOURCES CORPORATION 12% 817, % HESS OHIO DEVELOPMENTS LLC 7% 465,549 N/A ASCENT RESOURCES UTICA LLC 5% 332,505 N/A ECLIPSE RESOURCES I LP 4% 280,029 18% RICE DRILLING D LLC 4% 272,759 12,730% R E GAS DEVELOPMENT LLC 2% 122,452-27% XTO ENERGY INC. 2% 100, % PDC ENERGY INC 1% 81,905 25% ENERVEST OPERATING LLC 1% 67,045-39% CARRIZO (UTICA) LLC 1% 54,324 N/A TOP 12 OPERATORS DRILLED APPROXIMATELY 91% OF TOTAL FOOTAGE DRILLED IN
22 Top 12 Most Active Counties By Wells COUNTY % TOT WELLS WELLS % 2014 HARRISON 19% 90 53% CARROLL 17% 81-51% BELMONT 15% % MONROE 11% 53 89% GUERNSEY 10% 49 53% NOBLE 9% 42 24% COSHOCTON 4% 17 31% STARK 3% 16-47% KNOX 3% 15-12% COLUMBIANA 3% 14-50% WASHINGTON 3% % LICKING 2% 10-33% OPERATORS REPORTED COMPLETIONS IN 34 OF 89 COUNTIES IN VERSUS 38 IN TOP 12 COUNTIES 88% TOTAL WELLS
23 Top 12 Most Active Counties By Footage COUNTY % TOT FOOTAGE FOOTAGE % 2014 HARRISON 23% 1,453,425 71% CARROLL 20% 1,259,238-46% BELMONT 18% 1,128, % MONROE 12% 764, % GUERNSEY 11% 701, % NOBLE 9% 560,308 73% COLUMBIANA 3% 206,727-40% STARK 2% 102,382-27% WASHINGTON 1% 71,792 69% COSHOCTON 1% 48,509 2% KNOX 1% 39,790-24% TUSCARAWAS 0% 30, % TOP 12 COUNTIES ACCOUNTED FOR 97% OF TOTAL FOOTAGE DRILLED IN
24 Drilling Footage and Wells By Year YEAR TOTAL FOOTAGE WELLS FOOTAGE PER WELL AVG IP GAS AVG IP OIL 6,587, ,336 5, ,854, ,398 2, ,898, ,570 1, ,580, , ,832, , ,224, , ,036, , ,249, , ,030, , ,601, , ,718, , ,324, , ,419, , ,780, , ,332, , TO AVG IP-GAS UP 101%; AVG IP-OIL UP 129% 2014 TO FOOTAGE PER WELL UP 19%

25 Change of Owner Wells By Year YEAR LARGEST CHANGE OF WELL OWNER WAS BROAD STREET ENERGY CO & BROAD STREET SERV LLC TO M&R INVESTMENTS OHIO LLC

26 Rice Energy Razin Kane and Krazy Train PHOTOGRAPH COURTESY OF LARRY WICKSTROM
27 Top 12 Counties By Average IP (MCFE) COUNTY WELLS AVG IP GAS (MCF) AVG IP OIL (BBLS) AVG IP (MCFE) BELMONT 64 10, ,735 MONROE 45 12, ,044 HARRISON 82 5, ,975 GUERNSEY 43 2, ,433 CARROLL 77 3, ,472 NOBLE 39 4, ,305 COLUMBIANA 13 5, ,061 WASHINGTON 7 1, ,416 STARK KNOX GEAUGA COSHOCTON COUNTIES WITH LESS THAN 4 WELLS ARE NOT INCLUDED MCFE CALCULATED USING OIL GAS RATIO OF 15:1
28 Top 12 Operators By Average IP (MCFE) OPERATOR WELLS AVG IP GAS (MCF) AVG IP OIL (BBLS) AVG IP (MCFE) ASCENT RESOURCES UTICA LLC 20 5, ,984 HESS OHIO DEVELOPMENTS LLC 26 12, ,694 ANTERO RESOURCES CORPORATION 45 8, ,771 R E GAS DEVELOPMENT LLC 9 4, ,287 GULFPORT ENERGY CORPORATION 71 8, ,441 CHESAPEAKE EXPLORATION LLC 135 4, ,834 ECLIPSE RESOURCES I LP 15 3, ,140 XTO ENERGY INC. 6 8, ,123 RICE DRILLING D LLC 13 6, ,099 PDC ENERGY INC ,320 ENERVEST OPERATING LLC NORTHWOOD ENERGY CORP OPERATORS WITH LESS THAN 4 WELLS ARE NOT INCLUDED. MCFE CALCULATED USING OIL GAS RATIO OF 15:1

29 Average IP (MCFE) Top 12 Operators By Average IP (MCFE) Thousands OPERATORS WITH LESS THAN 4 WELLS ARE NOT INCLUDED. MCFE CALCULATED USING OIL GAS RATIO OF 15:1
30 Top 10 Operators By Average IP (MCFE) Well Locations
31 PRODUCTION - QUARTER 3 & 4 - MBBLS IP-OIL Versus Production R² = OPERATOR REPORTED IP OIL (BBLS/day) 42 WELL DATA SET, PRODUCTION & IP DATA
32 PRODUCTION - QUARTER 3 & 4 - BCF IP-GAS Versus Production R² = OPERATOR REPORTED IP GAS (MCF/day) 68 WELL DATA SET, PRODUCTION & IP DATA
33 PHOTOGRAPH COURTESY OF LARRY WICKSTROM Ohio Oil & Gas Production
34 COUNT OF WELLS Producing Wells By Year Producing Wells (ODNR) Reported Production YEAR YEAR WELL COUNT IS ESTIMATED
35 Million Barrels of Oil Production Summary Oil By Year 30 Conventional Oil Horizontal Oil PRODUCTION IS APPROXIMATELY 5.6 TIMES 2011 PRODUCTION OIL PRODUCTION REPORTED BY 1,074 HORIZONTAL WELLS 23,900 VERTICAL WELLS (EST) 5 0 YEAR CONVENTIONAL PRODUCTION IS ESTIMATED BY USING AVERAGE ANNUAL PERCENT DECLINE FOR YEAR
36 Billion Cubic Feet of Gas Production Summary Gas By Year 1200 Conventional Gas Horizontal Gas PRODUCTION IS APPROXIMATELY 12.6 TIMES 2011 PRODUCTION GAS PRODUCTION REPORTED BY 1240 HORIZONTAL WELLS 37,000 VERTICAL WELLS (EST) YEAR CONVENTIONAL PRODUCTION IS ESTIMATED BY USING AVERAGE ANNUAL PERCENT DECLINE YEAR
37 MILLIONS OF BARRELS OF OIL Ohio Oil Production MMBLS TRENTON 25.6 MMBLS UTICA MMBLS TREMPEALEAU MMBLS CLINTON MMBLS EOR 1952 HYDRAULIC FRACTURING MMBLS YEAR HISTORICAL DATA COURTESY OF WICKSTROM GEOSCIENCE, LLC
38 OIL (BBLS) / GAS (MCF) COUNT OF WELL Ohio s Aging Wells Average Annual Oil Average Annual Gas Count of Wells % OF ~53,000 PRODUCING WELLS ARE BETWEEN 25 & 39 YEARS OLD WELL AGE - YEARS

39 UTICA PRODUCING WELLS BY OPERATOR Through 12/31/
40 Gas in BCF 350 Utica Gas Production By Quarter % st Qtr nd Qtr rd Qtr % 34 4th Qtr % 43 1st Qtr % 67 48% 2nd Qtr rd Qtr th Qtr st Qtr 2nd Qtr 3rd Qtr 4th Qtr Gas % % % % SHARP QUARTERLY INCREASE IN GAS PRODUCTION BEGINNING 4 TH QTR (INCREASED ACTIVITY IN DRY GAS REGION)
41 Oil in Millions of Bbls 7 Utica Oil Production By Quarter 6 2% 9% % st Qtr nd Qtr rd Qtr % th Qtr % st Qtr % nd Qtr % 3rd Qtr th Qtr st Qtr 2nd Qtr 3rd Qtr Oil % % FLATTENING QUARTERLY INCREASE IN OIL PRODUCTION BEGINNING IN 2 ND QTR 4th Qtr
42 Wells Online Utica Wells Online By Quarter % % % % % % % % INCREASE IN WELLS ONLINE CONSISTENT BEGINNING IN 1 ST QTR st Qtr nd Qtr rd Qtr th Qtr st Qtr nd Qtr rd Qtr th Qtr st Qtr 2nd Qtr Wells rd Qtr 4th Qtr
43 Utica EUR Estimation Used operator reported production to ODNR through 3 rd Qtr Calculated EUR values for each well Adjusted EUR to gas equivalents (BCFE) used GAS/OIL ratio of 15:1 (based on current market prices) Determined treated length (stimulated interval) and then calculated EUR per 1000 of lateral

44 UTICA ESTIMATED AVERAGE EUR PER 1000 BY TOWNSHIP USING GAS:OIL RATIO OF 15:1 (Count of data points per township posted)

45 PHOTOGRAPH COURTESY OF LARRY WICKSTROM Class II Injection Wells
46 Water Volume Injected (Bbls) Annual Injection Volume - Statewide 25,000, ,000,000 15,000, % Increase 25% Increase 8% Increase 141 WELLS REPORTED INJECTION VOLUMES IN 10,000,000 13% Increase 5,000, Bbls of Water 12,759,681 14,630,076 17,420,798 21,700,838 23,411,745
47 Top 10 Class II Injection Wells By Volume COUNTY & TWP OPERATOR LEASE NAME TUSCARAWAS - OXFORD ELKHEAD GAS & OIL CO. MOZENA #1 2,151,488 COSHOCTON - KEENE BUCKEYE BRINE LLC ADAMS #3 1,940,139 MUSKINGUM - UNION HECKMAN WATER RES GOFF SWD #1 1,403,135 COSHOCTON - KEENE BUCKEYE BRINE LLC ADAMS #2 1,332,557 ATHENS - TROY K & H PARTNERS LLC K & H PARTNERS #2 1,327,271 ATHENS - TROY K & H PARTNERS LLC K & H PARTNERS #1 1,292,670 MUSKINGUM - PERRY ROBERT W. ORR, JR. KEMBLE #1-D 965,518 ATHENS - ROME D.T. ATHA, INC. M. FROST #1 586,602 ASHTABULA - NEW LYME SHALELOGIX RHOA #3 469,468 COSHOCTON - KEENE BUCKEYE BRINE LLC ADAMS #1 462,344 TOTALS 11,931,192 THE TOP 10 WELLS, OUT OF 141 TOTAL WELLS ACCOUNTED FOR 51% OF TOTAL WATER INJECTED
48 County Volume (BBls) ATHENS 3,831,788 COSHOCTON 3,772,344 MUSKINGUM 2,778,806 Top 10 Counties - Water Injection TUSCARAWAS 2,405,611 PORTAGE 1,995,995 TRUMBULL 1,686,367 WASHINGTON 1,589,079 ASHTABULA 1,146,171 GUERNSEY 585,942 PICKAWAY 492,947 As of TOTAL 20,285,050 TOP 10 COUNTIES ACCOUNT FOR 87% OF TOTAL WATER INJECTED

49 THANK YOU! Marty Shumway (614) Special Thanks To: Ohio Oil and Gas Association Bill Arnholt, Northwood Energy Tim Knobloch, James Knobloch Petroleum Consultants, Inc. Larry Wickstrom, Wickstrom Geoscience, LLC
The Debrosse Memorial Report 2017 Oil & Gas Activity in Ohio
 The Debrosse Memorial Report 2017 Oil & Gas Activity in Ohio 71 st Annual Winter Meeting Prepared by: Marty Shumway Locus Bio-Energy Solutions LLC; Shumway Resources LLC Bill Arnholt - Northwood Energy
Table A-1 Ohio counties ranked by growth rate from 2010 to 2015 of seniors (population age 60 and older)
") Appendices Table A-1 Ohio counties ranked by growth rate from 2010 to 2015 of seniors (population age 60 and older) Rank County Senior population growth rate Estimated number of seniors 2015 1 Delaware
Appendices Table A-1 Ohio counties ranked by growth rate from 2010 to 2015 of seniors (population age 60 and older) Rank County Senior population growth rate Estimated number of seniors 2015 1 Delaware
courts of common pleas Juvenile Division
 courts of common pleas Juvenile Division Composite Report for the Entire State Delinquency Traffic Dependency, Neglect or Abuse Unruly Adult Permanent Custody Motion Change of Custody/Visitation Enforce/Modify
HOUSING VOUCHERS FUNDED IN OHIO UNDER PENDING PROPOSALS
 820 First Street NE, Suite 510 Washington, DC 20002 Tel: 202-408-1080 Fax: 202-408-1056 center@cbpp.org www.cbpp.org November 1, HOUSING VOUCHERS FUNDED IN OHIO UNDER PENDING PROPOSALS Due largely to the
DEVELOPMENTS IN UTICA SHALE ECONOMIC POTENTIAL
 DEVELOPMENTS IN UTICA SHALE ECONOMIC POTENTIAL Michael Morgan, P.Eng., Ph.D. THREE MAIN POINTS How are new technologies implemented in the oil and gas sector? Which new technologies and/or new applications
A summary of national and global energy indicators. FEDERAL RESERVE BANK of KANSAS CITY
 THE U.S. Energy DATABOOK A summary of national and global energy indicators JULY 1, 17 FEDERAL RESERVE BANK of KANSAS CITY SUMMARY OF CURRENT ENERGY CONDITIONS The number of total active drilling rigs
Appendix G: Data Usage
 Appendix G: Data Usage G.1 Instructions for Using Weights For the purposes of design-based (variance) estimation, the data file includes the following design variables: WT_A, WT_C, adjusted survey weights
/
 News Release FOR IMMEDIATE RELEASE June 26, 2012 CONTACT: NANCY GRAVATT 202.452.7115/ ngravatt@steel.org May Preliminary Finished Steel Imports 2 nd Highest Monthly Amount in 2012 Import Market Share at
/
 News Release FOR IMMEDIATE RELEASE July 5, 0 CONTACT: NANCY GRAVATT 0.45.75/ ngravatt@steel.org Finished Steel Imports Decline in June, But Up Percent in First Half 0 Import Market Share in 0 at 4 Percent
NJ Solar Market Update
 NJ Solar Market Update April 16, 20 Renewable Energy Committee Meeting Trenton, NJ Prepared by Charlie Garrison Solar Installed Capacity Data The preliminary installed solar capacity as of 3/31/ is approximately
Commercial-in-Confidence Ashton Old Baths Financial Model - Detailed Cashflow
 Year 0 1 2 3 4 5 6 7 8 9 10 11 12 13 Oct-16 Nov-16 Dec-16 Jan-17 Feb-17 Mar-17 Apr-17 May-17 Jun-17 Jul-17 Aug-17 Sep-17 Oct-17 2,038 2,922 4,089 4,349 6,256 7,124 8,885 8,885 8,885 8,885 8,885 8,885 9,107
/ PRELIMINARY STEEL IMPORTS INCREASE 2% IN MAY Import Market Share 23% in May
 News Release FOR IMMEDIATE RELEASE June 25, 2013 CONTACT Lisa Harrison 202.452.7115/ lharrison@steel.org PRELIMINARY STEEL IMPORTS INCREASE 2% IN MAY Import Market Share 23% in May Washington, D.C. Based
TRAFFIC VOLUME TRENDS July 2002
 TRAFFIC VOLUME TRENDS July 2002 Travel on all roads and streets changed by +2.3 percent for July 2002 as compared to July 2001. Estimated Vehicle-Miles of Travel by Region - July 2002 - (in Billions) West
COMPARISON OF FIXED & VARIABLE RATES (25 YEARS) CHARTERED BANK ADMINISTERED INTEREST RATES - PRIME BUSINESS*
 CHARTERED BANK ADMINISTERED INTEREST RATES - PRIME BUSINESS*") COMPARISON OF FIXED & VARIABLE RATES (25 YEARS) 2 Fixed Rates Variable Rates For Internal Use Only. FIXED RATES OF THE PAST 25 YEARS AVERAGE RESIDENTIAL MORTGAGE LENDING RATE - 5 YEAR* (Per cent) Year
COMPARISON OF FIXED & VARIABLE RATES (25 YEARS) 2 Fixed Rates Variable Rates For Internal Use Only. FIXED RATES OF THE PAST 25 YEARS AVERAGE RESIDENTIAL MORTGAGE LENDING RATE - 5 YEAR* (Per cent) Year
COMPARISON OF FIXED & VARIABLE RATES (25 YEARS) CHARTERED BANK ADMINISTERED INTEREST RATES - PRIME BUSINESS*
 CHARTERED BANK ADMINISTERED INTEREST RATES - PRIME BUSINESS*") COMPARISON OF FIXED & VARIABLE RATES (25 YEARS) 2 Fixed Rates Variable Rates FIXED RATES OF THE PAST 25 YEARS AVERAGE RESIDENTIAL MORTGAGE LENDING RATE - 5 YEAR* (Per cent) Year Jan Feb Mar Apr May Jun
COMPARISON OF FIXED & VARIABLE RATES (25 YEARS) 2 Fixed Rates Variable Rates FIXED RATES OF THE PAST 25 YEARS AVERAGE RESIDENTIAL MORTGAGE LENDING RATE - 5 YEAR* (Per cent) Year Jan Feb Mar Apr May Jun
Preliminary Steel Imports, Down 14% in June, Increase 35% in First Half of Year; Import Market Share 21% in Second Quarter 2010
 News Release FOR IMMEDIATE RELEASE July 27, 2010 CONTACT: NANCY GRAVATT 202.452.7115/ ngravatt@steel.org Preliminary Steel Imports, Down 14% in June, Increase 35% in First Half of Year; Import Market Share
Up and Down Months of the Stock Market
 Up and Down Months of the Stock Market 1926-2017 Positive years (66) in the stock market were not good all year long and losing years (24) were not losers throughout the year. Winning years produce losing
NJ Solar Market Update As of 6/30/15
 NJ Solar Market Update As of 6/30/ Prepared by Charlie Garrison July 17, 20 SOLAR INSTALLED CAPACITY DATA The preliminary installed solar capacity as of 6/30/ is approximately 1,500.7 MW. Approximately
NJ Solar Market Update As of 10/31/15
 NJ Solar Market Update As of 10/31/15 Prepared by Charlie Garrison Renewable Energy Committee Meeting November 10, 2015 SOLAR INSTALLED CAPACITY DATA The preliminary installed solar capacity as of 10/31/15
Energy Outlook. U.S. Energy Information Administration. For EnerCom Dallas February 22, 2018 Dallas, TX
 Energy Outlook For EnerCom Dallas Dallas, TX Jeff Barron Industry Economist, U.S. Energy Information Administration U.S. Energy Information Administration Independent Statistics & Analysis www.eia.gov
Preliminary Steel Imports Decline 9% in September Import Market Share at 20%
 News Release FOR IMMEDIATE RELEASE October 25, 2011 CONTACT: NANCY GRAVATT 202.452.7115/ ngravatt@steel.org Preliminary Steel Imports Decline 9% in September Import Market Share at 20% Washington, D.C.
Ohio's Transportation Stimulus Projects. County Project Description Stimulus Funds
 District 1 Allen City of Lima; Rail Highway Safety Upgrade $ 11,000,000 Allen ODOT; Repair/Replace Deteriorated Median Barrier on I 75 and Hancock 68 $ 839,000 Defiance City of Defiance; Roadway/Bridge
ENERGY SLIDESHOW. Federal Reserve Bank of Dallas
 ENERGY SLIDESHOW Updated: March 13, 2018 ENERGY PRICES www.dallasfed.org/research/energy Brent & WTI & Crude Brent Oil Crude Oil Dollars per barrel 140 Brent (Mar 9 = $65.12) WTI (Mar 9 = $61.65) 120 100
2007 AAEA Livestock Outlook Symposium
 27 AAEA Livestock Outlook Symposium Ron Plain Professor of Agricultural Economics University of Missouri-Columbia www.ssu.missouri.edu/faculty/rplain Hog Price Outlook Production Efficiency 1 Head 9.5
ENERGY SLIDESHOW. Federal Reserve Bank of Dallas
 ENERGY SLIDESHOW Updated: January 16, 2019 ENERGY PRICES www.dallasfed.org/research/energy Brent & WTI & Crude Brent Oil Crude Oil Dollars per barrel 140 120 100 Brent (Jan 11 = $58.64) WTI (Jan 11 = $50.78)
Update from U.S. - Shale 2.0. Chris Faulkner CEO, Breitling Oil and Gas Shale Gas World Europe 2013 Warsaw, Poland
 Update from U.S. - Shale 2.0 Chris Faulkner CEO, Breitling Oil and Gas Shale Gas World Europe 2013 Warsaw, Poland Unconventional Gas Play Rankings Remaining Recoverable Gas Resources (Tcf) Marcellus Haynesville
/ PRELIMINARY STEEL IMPORTS INCREASE 15% IN APRIL Import Market Share 27% in April
 News Release FOR IMMEDIATE RELEASE May 23, 2014 CONTACT Lisa Harrison 202.452.7115/ lharrison@steel.org PRELIMINARY STEEL IMPORTS INCREASE 15% IN APRIL Import Market Share 27% in April Washington, D.C.
Petroleum and Natural Gas Situation
 Petroleum and Natural Gas Situation John C. Felmy Chief Economist and Director Statistics Department American Petroleum Institute Felmyj@api.org www.api.org www.gasolineandyou.org www.naturalgasfacts.org
/ Preliminary Steel Imports Increase 6% in May Import Market Share at 21%
 News Release FOR IMMEDIATE RELEASE June 21, 2011 CONTACT: NANCY GRAVATT 202.452.7115/ ngravatt@steel.org Preliminary Steel Imports Increase 6% in May Import Market Share at 21% Washington, D.C. Based on
Tight Oil: A Solution to U.S. Import Dependence?
 Tight Oil: A Solution to U.S. Import Dependence? Geological Society of America Denver, Colorado October 28, 213 J. David Hughes Global Sustainability Research Inc. Post Carbon Institute The Shale Revolution
RIDERSHIP TRENDS. March 2017
 RIDERSHIP TRENDS March 2017 Prepared by the Division of Strategic Capital Planning May 2017 Table of Contents Executive Summary...1 Ridership...3 Estimated Passenger Trips by Line...3 Estimated Passenger
NJ Solar Market Update As of 2/29/16
 NJ Solar Market Update As of 2/29/16 Prepared by Charlie Garrison March 24, 2016 SOLAR INSTALLED CAPACITY DATA The installed solar capacity as of 2/29/16 is approximately 1,644.3 MW. Approximately 20.3
IMPROVING OUR NETWORK PERFORMANCE. BNSF Service Update
 IMPROVING OUR NETWORK PERFORMANCE BNSF Service Update 1 Service Challenges Taking Action Progress Service Challenges Service Challenges Increasing Volumes Support Continued BNSF Growth 11,000 2006 Units
Inventory Levels - All Prices. Inventory Levels - By Price Range
 Inventory Levels - All Prices Idaho Falls Bonneville Total 3-Mar-17 152 108 260 2-Mar-18 109 78 187-28% Inventory Levels - By Price Range 3-Mar-17 2-Mar-18 0-100,000 41 6 100,001-125,000 19 8 125,001-150,000
Investor Day New York City May 17, 2011 AUSTRALIA ARGENTINA CANADA EGYPT NORTH SEA U.S. CENTRAL U.S. GULF. Permian
 Investor Day New York City May 17, 2011 AUSTRALIA ARGENTINA CANADA EGYPT NORTH SEA U.S. CENTRAL U.S. GULF Permian Permian Overview 3 MM acres 84 MBOE/D net (68% oil+ngls) #2 industry player Strong free
CREDIT UNION ESTIMATES
 MONTHLY CREDIT UNION ESTIMATES Prepared July 2, 2018 by Credit Union National Association Economics and Statistics Department cuna.org/mcue Loans Credit union loans outstanding grew 1.3% in, compared to
For Region 5 and Region 7 Regional Response Teams Meeting April 22, 2015 St. Charles, Missouri via video/teleconference
 For Region 5 and Region 7 Regional Response Teams Meeting St. Charles, Missouri via video/teleconference By Grant Nülle, Upstream Oil & Gas Economist, Exploration and Production Analysis Team U.S. Energy
U.S. Rail Crude Oil Traffic
 U.S. Rail Crude Oil Traffic Association of American Railroads November 215 Summary U.S. crude oil production has risen sharply in recent years, with much of the increased output moving by rail. In 28,
STEEL IMPORTS DOWN 23% FROM PRIOR MONTH IN MAY Finished Import Market Share YTD at 26%
 News Release FOR IMMEDIATE RELEASE June 25, 2018 CONTACT Lisa Harrison 202.452.7115/lharrison@steel.org STEEL IMPORTS DOWN 23% FROM PRIOR MONTH IN MAY Finished Import Market Share YTD at 26% Washington,
Implications of the U.S. Shale Revolution
 Implications of the U.S. Shale Revolution For October 17, 214 Chicago, Illinois By Adam Sieminski, Administrator U.S. Energy Information Administration U.S. Energy Information Administration Independent
Inventory Levels - All Prices. Inventory Levels - By Price Range
 Inventory Levels - All Prices Idaho Falls Bonneville Total 3-Nov-17 198 128 326 2-Nov-18 155 134 289-11% Inventory Levels - By Price Range 3-Nov-17 2-Nov-18 0-100,000 17 11 100,001-125,000 15 9 125,001-150,000
Total Production by Month (Acre Feet)
") Production by Month (acre-feet) 2008 2009 2010 2011 2012 2013 2014 2015 2016 January 25 339.10 228.90 249.50 297.99 243.06 327.14 247.66 212.37 February 234.00 218.80 212.10 241.52 245.82 279.08 234.16
Production by Month (acre-feet) 2008 2009 2010 2011 2012 2013 2014 2015 2016 January 25 339.10 228.90 249.50 297.99 243.06 327.14 247.66 212.37 February 234.00 218.80 212.10 241.52 245.82 279.08 234.16
Oil & natural gas extraction data
 1 2 3 4 5 6 7 8 9 10 11 12 13 14 15 16 17 19 20 21 22 23 24 26 27 28 29 30 31 32 33 34 35 36 37 38 39 40 41 42 43 44 45 46 47 48 49 50 51 52 53 54 55 56 57 58 59 60 61 62 63 64 65 66 67 68 69 70 71 72
Greater Cleveland Auto Outlook
 Covering First Quarter 2014 Volume 22, Number 2 Sponsored by: Greater Cleveland Automobile Dealers Association FORECAST Area New Vehicle Market Up Slightly in First Quarter of 2014 Small improvement predicted
RIDERSHIP TRENDS. July 2018
 RIDERSHIP TRENDS July Prepared by the Division of Strategic Capital Planning September Table of Contents Executive Summary...1 Ridership...3 Estimated Passenger Trips by Line...3 Estimated Passenger Trips
STEEL IMPORTS DOWN 10% YEAR-TO-DATE Finished Import Market Share YTD at 25%
 News Release FOR IMMEDIATE RELEASE August 24, 2018 CONTACT Lisa Harrison 202.452.7115/lharrison@steel.org STEEL IMPORTS DOWN 10% YEAR-TO-DATE Finished Import Market Share YTD at 25% Washington, D.C. Based
2017 Adjusted Count Report February 12, 2018
 A statewide multi-use trail user study and volunteer data collection program 2017 Adjusted Count Report February 12, 2018 The following report includes the final adjusted infrared (IR) counter data at
RIDERSHIP TRENDS. April 2018
 RIDERSHIP TRENDS April Prepared by the Division of Strategic Capital Planning June Table of Contents Executive Summary...1 Ridership...3 Estimated Passenger Trips by Line...3 Estimated Passenger Trips
Moving Crude Oil by Rail
 Moving Crude Oil by Rail Association of American Railroads May 2013 Summary Technological advances, along with relatively high crude oil prices, have led to sharply higher U.S. crude oil production. Historically,
M onthly arket. Jan Table of Contents. Monthly Highlights
 Table of Contents Market Inventory...2 www.gaar.com Monthly Highlights January 2014 had a 12.29% increase in the number of homes sales when compared to same time last year. The average sale price of single-family
TRAFFIC VOLUME TRENDS
 Page 1 U. S. Department Transportation Federal Highway Administration Office Highway Policy Information TRAFFIC VOLUME TRENDS September Travel on all roads and streets changed by +2.5 (5.8 billion vehicle
Sound Transit Operations July 2016 Service Performance Report. Ridership
 Ridership Total Boardings by Mode Mode Jul-15 Jul-16 % YTD-15 YTD-16 % ST Express 1,618,779 1,545,852-4.5% 10,803,486 10,774,063-0.3% Sounder 333,000 323,233-2.9% 2,176,914 2,423,058 11.3% Tacoma Link
CREDIT UNION ESTIMATES
 MONTHLY CREDIT UNION ESTIMATES Prepared September 4, 2018 by Credit Union National Association Economics and Statistics Department cuna.org/mcue Loans Credit union loans outstanding grew 1.1% in, compared
U.S. Rail Crude Oil Traffic
 U.S. Rail Crude Oil Traffic Association of American Railroads May 217 Summary U.S. crude oil production has risen sharply in recent years, with much of the increased output moving by rail. In 28, U.S.
Economic & Steel Market Development in Japan
 1 Economic & Steel Market Development in Japan 68 th OECD Steel Committee Paris May 6-7, 2010 The Japan Iron & Steel Federation 2 Macro-economic overview Steel Supply and Demand v v v Steel Production
OIL AND GAS DOCKET NO
 OIL AND GAS DOCKET NO. 01-0266452 THE APPLICATION OF ANADARKO E&P COMPANY LP TO AMEND THE TEMPORARY FIELD RULES FOR THE BRISCOE RANCH (EAGLEFORD) FIELD, DIMMIT, MAVERICK, WEBB AND ZAVALA COUNTIES, TEXAS
NEW HAMPSHIRE GAS CORPORATION WINTER PERIOD ORIGINAL FILING CONTENTS 3. CONVERSION OF GAS COSTS - GALLONS TO THERMS SCHEDULE A
 NEW HAMPSHIRE GAS CORPORATION COST OF GAS RATE FILING - DG 13- WINTER PERIOD 2013-2014 ORIGINAL FILING CONTENTS 1. TARIFF PAGE - COST OF GAS RATE 2. MARKED TARIFF PAGE - COST OF GAS RATE 3. CONVERSION
The. Cooperative. Difference
 The Cooperative Difference Electric Cooperatives The foundations for the success of the rural electric cooperative program in America can be found in the Seven Principles that are the framework of every
CREDIT UNION ESTIMATES
 MONTHLY CREDIT UNION ESTIMATES Prepared August 1, 2018 by Credit Union National Association Economics and Statistics Department cuna.org/mcue Loans Credit union loans outstanding grew 1.3% in, matching
Wheat Marketing Situation
 Wheat Marketing Situation Prepared by: Darrell L. Hanavan Executive Director Colorado Wheat Administrative Committee If you would like to receive an email when this report is updated, email gmostek@coloradowheat.org
Monthly Hog Market Update United States Hog Production
 This information is provided as a resource by Saskatchewan Agriculture staff All prices are in Canadian dollars unless otherwise noted. Please use this information at your own risk. Monthly Hog Market
CREDIT UNION ESTIMATES
 MONTHLY CREDIT UNION ESTIMATES Prepared March 2, 2018 by Credit Union National Association Economics and Statistics Department cuna.org/mcue Loans Credit union loans outstanding grew 0.7% in, compared
Design Criteria Data
 MEDFORD/JACKSON CO. OR Latitude = 42.37 N WMO No. 72597 Longitude =122.8 W Elevation = 1329 feet Period of Record = 1973 to 1996 Average Pressure = 28.61 inches Hg Design Criteria Data Mean Coincident
MARKET RATES UPDATE Paula Gold-Williams Cory Kuchinsky
 MARKET RATES UPDATE I N T R O D U C T I O N BY: Paula Gold-Williams President & Chief Executive Officer (CEO) P R E S E N T E D BY: Cory Kuchinsky Interim Vice President, Financial Services September 24,
CREDIT UNION ESTIMATES
 MONTHLY CREDIT UNION ESTIMATES Prepared February 1, 2018 by Credit Union National Association Economics and Statistics Department cuna.org/mcue Loans Credit union loans outstanding grew 1.0% in, compared
NEU Electric and Natural Gas Price Update
 Exelon s $24 Billion Energy Bill Senate Bill 2814 Short-Term Energy Price Outlook On November 15, 2016, Exelon, through its legislative supporters, introduced Senate Bill 2814, a massive 446 page document
Appendix E Water Supply Modeling
 Supply Modeling Modesto Irrigation District Treatment Plant Expansion Project Modeling I. Introduction The Modesto Irrigation District (MID) is situated adjacent to and north of the Tuolumne River. Over
Defining the Debate: Crude Oil Exports
 Defining the Debate: Crude Oil Exports Trisha Curtis, Director of Research Upstream and Midstream Energy Policy Research Foundation, Inc. (EPRINC) Brookings Task Force February 28th, 214 About EPRINC www.eprinc.org
Algebra II Pacing Guide
 Unit 13: Exploring a Business Venture (10 days) 8 May 13 - May 24 n/a MISD Pacing Guide Date Range Unit 01: Introduction to Functions in 15 Aug. 21 - Sept. 11 Sept. 12 Unit 02: Absolute Value Functions,,
All Annual Operating Plan Recipients
 To: All Annual Operating Plan Recipients From: Lower Colorado Region Boulder Canyon Operations Office River Operations Group Daniel Bunk P.O. Box 647 Boulder City, NV 896-47 Phone: 72-293-83 The operation
May 2018 Short-Term Energy Outlook
 May 2018 for Williston Basin Petroleum Conference Bismarck, N.D. by Dr. Linda Capuano Administrator U.S. Energy Information Administration Independent Statistics & Analysis www.eia.gov Brent crude oil
Missouri River Mainstem Reservoirs Runoff Volumes for Annual Operating Plan Studies RCC Technical Report Jy-08
 Missouri River Region Since 1953 US Army Corps of Engineers Reservoir Control Center Missouri River Region Northwestern Division Reservoir Control Center July 2008 Missouri River Basin Fort Peck Montana
Capacity Analysis Report. For. William E. Dunn Water Reclamation Facility 4111 Dunn Drive Palm Harbor, Florida 34683
 Capacity Analysis Report For William E. Dunn Water Reclamation Facility 4111 Dunn Drive Palm Harbor, Florida 34683 Florida Department of Environmental Protection Facility Identification No. FLA0128775
Data Current Through: April, Seattle (All Areas) RESIDENTIAL & CONDOMINIUM. Active, Pending, & Months Supply of Inventory 1,
 RESIDENTIAL & CONDOMINIUM. Active, Pending, & Months Supply of Inventory 1,") April, 2017 MTD MARKET UPDATE Data Current Through: April, 2017 Active, Pending, & Months Supply of Inventory 5,000 4,500 4,000 3,500 3,000 2,500 4,321 5.3 3,670 4.1 3,960 3.2 2,954 3.3 Active Listings
April, 2017 MTD MARKET UPDATE Data Current Through: April, 2017 Active, Pending, & Months Supply of Inventory 5,000 4,500 4,000 3,500 3,000 2,500 4,321 5.3 3,670 4.1 3,960 3.2 2,954 3.3 Active Listings
TABLE C-43. Manufacturers' new and unfilled orders, {Amounts in millions of dollars] Nondurable. Capital goods. Total. goods.
![TABLE C-43. Manufacturers' new and unfilled orders, {Amounts in millions of dollars] Nondurable. Capital goods. Total. goods.](/thumbs/93/112603708.jpg "TABLE C-43. Manufacturers' new and unfilled orders, {Amounts in millions of dollars] Nondurable. Capital goods. Total. goods.") TABLE C-43. Manufacturers' new and unfilled orders, -74 {Amounts in millions of dollars] New orders t, I960. 27, 559 26, 903 30,672 30,115 31,086 33,005 35,322 37,952 41, 803 45, 944 46,763 50, 243 53,
TABLE C-43. Manufacturers' new and unfilled orders, -74 {Amounts in millions of dollars] New orders t, I960. 27, 559 26, 903 30,672 30,115 31,086 33,005 35,322 37,952 41, 803 45, 944 46,763 50, 243 53,
Macroeconomic Outlook. Presented by Dr. Bruce A. Scherr Chairman of the Board Chief Executive Officer Emeritus
 Macroeconomic Outlook Presented by Dr. Bruce A. Scherr Chairman of the Board Chief Executive Officer Emeritus Waterways Symposium Cincinnati, OH November 15-17, 2016 Topics Energy Macro Implications Inflation
CREDIT UNION ESTIMATES
 MONTHLY CREDIT UNION ESTIMATES Prepared June 1, 2018 by Credit Union National Association Economics and Statistics Department cuna.org/mcue Loans Credit union loans outstanding grew 1.1% in, matching the
Year to Date Summary. Average and Median Sale Prices
 A Publication of RMLS, The Source for Real Estate Statistics in Your Community Residential Review: Southwest Washington September 2018 Reporting Period September Residential Highlights Southwest Washington
CREDIT UNION ESTIMATES
 MONTHLY CREDIT UNION ESTIMATES Prepared September 28, 2018 by Credit Union National Association Economics and Statistics Department cuna.org/mcue Loans Credit union loans outstanding grew 1.0% in, compared
D G A G R I D A S H B O A R D : A P P L E S
 Sources: Eurostat, MSs notifications, DG Agri, Comext, Comtrade, GTA, ITC, AMI, Expert groups, Freshfel, Wapa. 000 tonnes 39 41 31 22 29 22 32 27 17 18 9 27 15 12 6 6 6 4 5 6 5 4 11 25 15 9 9 93 62 51
Past Due. Account Charges. Contract Charges Security Deposit Due - Jun 09, , Customer Service. Jun 19, PAST DUE $1,693.
 11983978 Jun 19, 217 1 124 958 PAST DUE $1,693.97 Meter Reading Information Meter # 55271 May 3 655 Jun 15 6642 17 days 1397 on or about Aug 15 82 Past Due Balance payable includes an amount which is payable
Inventory Levels - All Prices. Inventory Levels - By Price Range
 Inventory Levels - All Prices Idaho Falls Bonneville Total 7-Apr-17 154 111 265 6-Apr-18 113 91 204-23% Inventory Levels - By Price Range 7-Apr-17 6-Apr-18 0-100,000 36 10 100,001-125,000 13 9 125,001-150,000
CREDIT UNION ESTIMATES
 MONTHLY CREDIT UNION ESTIMATES Prepared March 4, 2019 by Credit Union National Association Economics and Statistics Department cuna.org/mcue Loans Credit union loans outstanding grew 0.3% in January, compared
CREDIT UNION ESTIMATES
 MONTHLY CREDIT UNION ESTIMATES Prepared May 1, 2018 by Credit Union National Association Economics and Statistics Department cuna.org/mcue Loans Credit union loans outstanding grew 1.1% in, compared to
OHIO DEPARTMENT OF TRANSPORTATION RURAL PUBLIC TRANSIT ARRA PROJECTS BY ODOT DISTRICT
 1 2 Standard Mini Vans 46,000 2 Light Transit Narrow Body Vehicles 90,000 Computer System Upgrade/Upgrade of schedulingdispatching Software and hardware 5,300 Parking Lot Expansion with Canopy 15,000 Capitalized
LOCAL CLIMATOLOGICAL DATA
 ILLINOIS STATE WATER SURVEY DIVISION URBANA, ILLINOIS ISWS MP-21 Archive SWS0964 Illinois State Water Survey LOCAL CLIMATOLOGICAL DATA FDR HILLSBORO, IL. 1901-1962 LOCAL CLIMATOLOGICAL DATA 1901-1962 HILLSBORO
WHATS THE SEDONA REAL ESTATE MARKET DOING?
 WHATS THE SEDONA REAL ESTATE MARKET DOING? That is the question on everyone s lips these days. Everyone wants to know what is the market doing. Why, because it matters to all of us. We are either living
Balance from your previous bill $0.00 Meter # Basic Charge: 17 $ /day 3.23* Energy charge:¹ 2
 11983979 Jun 19, 217 1 124 962 Jul 11, 217 $24.34 Meter Reading Previous Bill. Balance from your previous bill $. Meter # 552711 May 3 19813 Account Account charge 12.4* Charges 17 days 82 Jun 15 19895
462 CENSUS OF AGRICULTURE-OHIO
 462 CENSUS OF AGRICULTURE-OHIO CouNTvTAsLE IV:-SPECIFIED CLASSES OF LIVESTOCK ON FARMS AND RANCHES, APR. 1, 1940 [The 1936 figures are in italics as they are not exactly (For definitions: ITEM nfarms reporting,"
NEWS Release. U.S. Manufacturing Technology Orders. Year-to-date U.S. manufacturing technology orders up 4.1% over 2011
 U.S. Manufacturing Technology Orders A statistical program of AMT NEWS Release FOR RELEASE: October 8, 2012 Contact: Pat McGibbon, AMT, 703-827-5255 Year-to-date U.S. manufacturing technology orders up
Section 5. Crude Oil and Natural Gas Resource Development
 Section 5. Crude Oil and Natural Gas Resource Development The September 4 rotary rig count was 1,4, slightly higher than the count in August 4 and 13 percent higher than the count in September 3. Of the
CREDIT UNION ESTIMATES
 MONTHLY CREDIT UNION ESTIMATES Prepared January 2, 2019 by Credit Union National Association Economics and Statistics Department cuna.org/mcue Loans Credit union loans outstanding grew 0.6% in, compared
2013 / 2014 Revenue Comparison: OCTOBER
 CAR RENTAL GROSS REVENUES 2013 / Revenue Comparison: OCTOBER COMPANY 2013 incr./decr. % change Advantage 1,049,117.25 1,679,547.68 630,430.43 60.1% Alamo/National 5,448,360.80 8,262,318.28 2,813,957.48
Sasha Weintraub Duke Energy
 Fueling Up within the Game Changer Sasha Weintraub Duke Energy The Game Changer is Happening Definition of game changer Completely changing the way something is done, thought about, or made Time Magazine
September 2016 Water Production & Consumption Data
 September 2016 Water Production & Consumption Data September 2016 monthly water production (288.48 AF) was lowest in at least 17 years. Monthly water production has increased slightly each month since
Integrated E&P Contracts. May 2013
 Integrated E&P Contracts May 2013 Oil Production Oil production MBD Incremental production w/o Cantarell MBD 3,500 3,000 2,500 2,000 1,500 1,000 500 0 Cantarell Other fields 97 98 99 00 01 02 03 04 05
Jefferies 2012 Global Energy Conference
 Jefferies 2012 Global Energy Conference November 2012 Exploring, developing and producing oil and natural gas in the U.S. Rocky Mountains. www.kodiakog.com l NYSE: KOG Contact Information Kodiak Oil &
Design Criteria Data
 OKLAHOMA CITY OK Latitude = 35.4 N WMO No. 72353 Longitude = 97.6 W Elevation = 133 feet Period of Record = 1973 to 1996 Average Pressure = 28.62 inches Hg Design Criteria Data Mean Coincident (Average)
Data Current Through: January, Seattle (All Areas) RESIDENTIAL & CONDOMINIUM. Active, Pending, & Months Supply of Inventory. 4 mo.
 RESIDENTIAL & CONDOMINIUM. Active, Pending, & Months Supply of Inventory. 4 mo.") January, 2017 MTD MARKET UPDATE Data Current Through: January, 2017 Active, Pending, & Months Supply of Inventory 4,000 3,500 3,000 3,426 5.9 6.6 3,220 2,973 2,711 Active Listings MTD Pending Sales MTD
January, 2017 MTD MARKET UPDATE Data Current Through: January, 2017 Active, Pending, & Months Supply of Inventory 4,000 3,500 3,000 3,426 5.9 6.6 3,220 2,973 2,711 Active Listings MTD Pending Sales MTD
Tethys assets. Sweden - Gotland större - Gotland mindre. Lithuania - Gargzdai - Rietavas - Raiseiniai. France - Attila - Permis du Bassin D Alès
 1 Tethys assets Sweden - Gotland större - Gotland mindre Lithuania - Gargzdai - Rietavas - Raiseiniai France - Attila - Permis du Bassin D Alès Oman - Block 3 & 4 - Block 15 2 Tethys Oil - An expanding