Shroyer Road Safety Study
|
|
|
- Julia McDaniel
- 5 years ago
- Views:
Transcription
1 Shroyer Road Safety Study DOROTHY LANE TO DELLWOOD AVENUE MVRPC #60 High Crash Ranking (2014) March 7, 2016 Prepared for: City of Oakwood 30 Park Avenue Oakwood, Ohio Prepared by: CMT, Inc. Columbus, Ohio 43235
2 TABLE OF CONTENTS Executive Summary... 1 Purpose and Need... 3 Existing Conditions... 3 Figure 1: Study Area Map... 4 Background... 5 Existing Features... 5 Figure 2: MVRPC Bikeway Map... 6 Photo #1: Peach Orchard Avenue Intersection Looking South... 7 Traffic Operations... 7 Photo #2: Aberdeen Avenue Looking North... 7 Data Collection... 8 Table 1: Dorothy Lane/ Shroyer Road Turn Count... 8 Table 2: Through Vehicle Distribution by Lane (NB Approach)... 8 Graph #1: Shroyer Speed Summary... 9 Graph #2: Shroyer Average Daily Volumes...10 Crash Analysis...10 Graph #3: Frequency of Crashes by Type...11 Graph #4: Frequency of Crashes by Year...11 Table 3: Crash Frequency by Location...12 Figure 3: Intersection Functional Area...13 Table 4: Dorothy Lane/Shroyer Road Crash Summary...14 Countermeasures...15 Shroyer Road Diet 80 Crashes...15 Figure 4: Shroyer Road Typical Section...16 Figure 5: Concept Plan...17 Table 5: Crash Rates by Median Type...20 Table 6: Raised Median Impacts...20 Table 7: Level of Service Summary...22 Speedway Access Management 14 crashes...22
3 Westbound Left Turn Phasing (Dorothy/Shroyer) 11 crashes...23 Figure 6: Eastbound Left Turn SSD...23 Shroyer Road Sight Distance 9 crashes...24 Traffic Signal Installation -- General...24 Implementation...25 Figure 7: RRFB Crossing Example...26 APPENDICES Appendix A: Safe Routes to School (SRTS) Plan Appendix B: Intersection Turning Movement Count (TMC) Data Appendix C: 24-Hour Traffic Data (Speed and Volume) Appendix D: Crash Diagrams Appendix E: Capacity Analysis Appendix F: Construction Cost Estimate 1
4 SHROYER ROAD SAFETY STUDY EXECUTIVE SUMMARY The purpose of this safety study is to evaluate the existing safety performance and to identify potential countermeasures on Shroyer Road between Dorothy Lane and the north corporation line of the City of Oakwood (Dellwood Avenue). The Dorothy Lane and Shroyer Road intersection ranks #60 on the Miami Valley Regional Planning Commission (MVRPC) list of high crash locations for A review of crash data provided by the Ohio Department of Transportation (ODOT) crash database yielded a total of 180 crashes within the study area over a 5 year period ( ). The following crash types and conditions are over represented within the study area compared to the statewide averages ( ) shown in parenthesis. No fatalities occurred. Injury crashes: 48 crashes or 26.7 percent (23.5 percent) Rear end crashes: 78 crashes or 43.3 percent (20.7 percent) Angle crashes: 34 crashes or 18.9 percent (17.6 percent) Left turn crashes: 29 crashes or 16.1 percent ( 3.9 percent) Sideswipe passing: 16 crashes or 8.9 percent ( 6.9 percent) Two pedestrian and two bicycle crashes also occurred. Three of these crashes resulted in injuries: A pedestrian struck on September 1, 2014 was crossing the north leg of Shroyer Road at Dorothy Lane. A pedestrian struck on December 9, 2010 was riding a skateboard on Peach Orchard Avenue and was at fault. No injuries were reported. A bicyclist struck on August 13, 2013 was riding on the sidewalk at Acorn Drive. A bicyclist struck on January 10, 2014 was crossing Shroyer Road at Acorn Drive and was at fault. A pedestrian was also struck on September 10, 2015 on Shroyer Road about 100 feet south of Wiltshire Boulevard. The elementary school age pedestrian suffered minor injuries from the crash. Although this crash occurred outside the 5 year time period of this safety study, the crash highlights the challenges facing pedestrians, especially school age pedestrians, of choosing adequate gaps in traffic when crossing the 4-lane section of Shroyer Road. No facilities exist to assist pedestrians to cross Shroyer Road other than the legal (unmarked) crosswalks at each unsignalized intersection within the study area. A road diet is proposed to mitigate the 80 crashes within the City of Oakwood. A road diet is the conversion of an undivided 4-lane roadway to a 3-lane roadway made up of two through lanes (one each direction) and a center left turn lane with raised medians or two-way left-turn lane 1
 lane, undivided roadways such as Shroyer Road experience a number of typical crash types: Rear end and sideswipe crashes caused by speed differential between vehicles; Sideswipe crashes")
5 (TWLTL). The reduction of lanes allows the roadway cross section to be reallocated for other uses such as bike lanes and pedestrian refuge islands. Four (4) lane, undivided roadways such as Shroyer Road experience a number of typical crash types: Rear end and sideswipe crashes caused by speed differential between vehicles; Sideswipe crashes caused by frequent lane changing between two through lanes; Rear end crashes caused by left-turning vehicles stopped in the inside travel lane; Left turn crashes caused by restricted sight distance obstructed by opposing left turn vehicles that are offset; Angle crashes caused by side street traffic crossing four lanes to make a through movement across an intersection, or turning left across two lanes; Bicycle crashes due to a lack of available space for bicyclists to ride comfortably; and Pedestrian crashes due to the number of lanes for pedestrians to cross with no refuge. An average crash reduction of 30 percent can be expected for all crash types and severity when converting a 4-lane section to a 3-lane section of a minor arterial roadway such as Shroyer Road. A reduction in crashes involving drivers under 35 years of age and over 65 years of age has also been documented with a road diet. Crashes involving at least one driver under 35 years old or greater than 65 years old comprised 73 percent of all crashes on Shroyer Road. A typical section of the road diet countermeasure is shown below with raised medians. Implementation of the road diet improvement is proposed to be incorporated as part of a currently programmed resurfacing project. The design schedule could be accelerated in 2016 to meet a plan sale date of May Reconstruction of the existing median on Shroyer Road near Dorothy Lane is also proposed to be incorporated as part of the currently programmed resurfacing project to mitigate 23 left turn and angle crashes. Median reconstruction includes a median extension to restrict left turn movements from the Speedway site and a median removal to improve intersection sight distance on the Shroyer Road approaches at Dorothy Lane. Another countermeasure that mitigates an additional 11 left turn crashes at the Dorothy Lane and Shroyer Road intersection includes a protected only left turn phase for the eastbound approach. 2
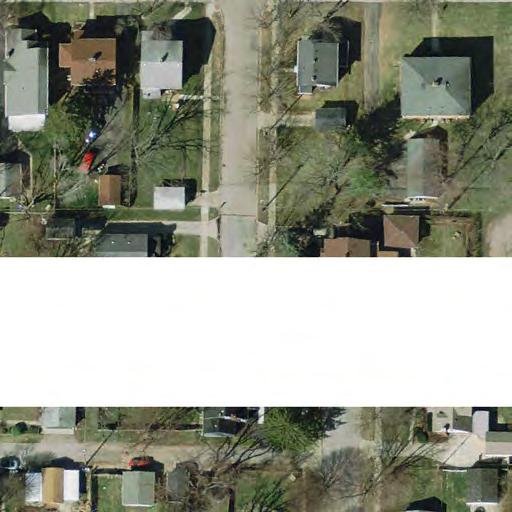
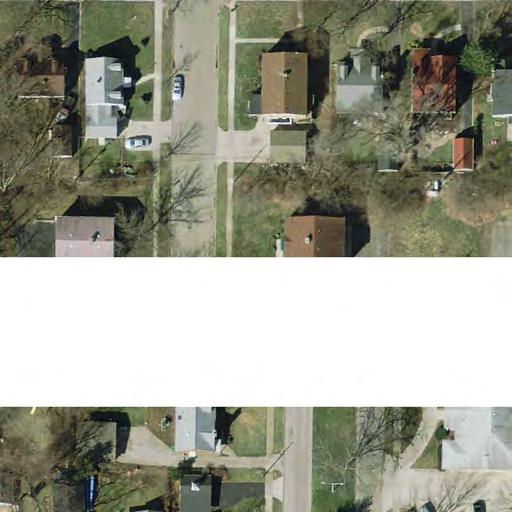
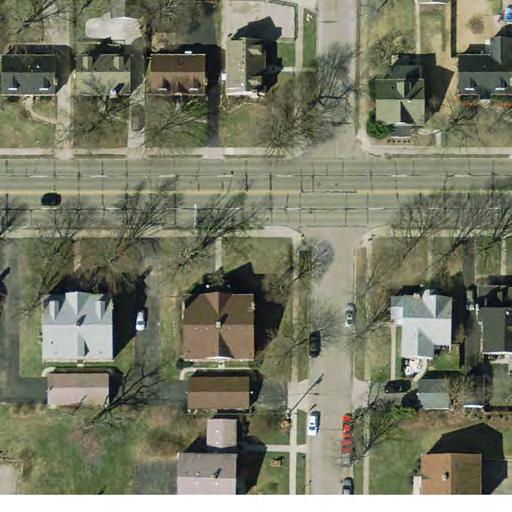
6 PURPOSE AND NEED The purpose of the safety study is to evaluate the existing safety performance and to identify potential countermeasures on Shroyer Road between Dorothy Lane and the north corporation line of the City of Oakwood (Dellwood Avenue). The Dorothy Lane and Shroyer Road intersection ranks #60 on the Miami Valley Regional Planning Commission (MVRPC) list of high crash locations for A review of crash data provided by the Ohio Department of Transportation (ODOT) crash database yielded a total of 180 crashes within the study area over a 5 year period ( ). The following crash types and conditions are over represented within the study area compared to statewide averages ( ) that are shown in parenthesis. Injury crashes: 48 crashes or 26.7 percent (23.5 percent) Rear end crashes: 78 crashes or 43.3 percent (20.7 percent) Angle crashes: 34 crashes or 18.9 percent (17.6 percent) Left turn crashes: 29 crashes or 16.1 percent ( 3.9 percent) Sideswipe passing: 16 crashes or 8.9 percent ( 6.9 percent) Improving accessibility of other transportation modes along the corridor is a priority for the City of Oakwood. EXISTING CONDITIONS The 1.18 mile study section of Shroyer Road is primarily located within the City of Oakwood, Montgomery County. The typical roadway section within the City of Oakwood is a 4-lane section providing connectivity as an Urban Minor Arterial between State Route 48 and Wilmington Pike. The study area is bounded by the following limits: South Boundary. The Shroyer Road and Dorothy Lane intersection is the southern boundary of the study area. The study area includes an additional 250 feet on each approach of the signalized intersection. The south end of the study area is located within the City of Kettering (850 feet). The typical roadway section within the City of Kettering at the south end of the study area is a standard 5-lane section with variable width raised median. North Boundary. The northern boundary of the study area is the north corporation line between the City of Dayton and the City of Oakwood. The typical roadway section within the City of Dayton is a 2-lane section. The daily traffic volume on the Shroyer Road varies between 15,000 vehicles on the north end of the study area near Lonsdale Avenue and 14,300 vehicles on the south end near East Drive. Figure 1 is an area map showing the study area of the Shroyer Road corridor (red box). 3

7 FIGURE 1: STUDY AREA MAP 4
8 BACKGROUND The City of Oakwood is a first ring suburban neighborhood of the Dayton metropolitan region. Residential land use is adjacent to the Shroyer Road corridor. The following sites on the west side of Shroyer Road attract pedestrian traffic from the east side of the corridor: Orchardly Park located between Orchard Drive and Wonderly Avenue Wright Park/Smith Elementary/public library located between Telford and Aberdeen Ave A safe routes to school (SRTS) plan dated August 23, 1995 shows a signalized crossing of Shafor Boulevard at the Aberdeen Avenue and the Telford Avenue intersections. Painted crosswalks at the Dellwood Avenue and Shafor Boulevard intersection were also proposed as part of the plan. No pedestrian accommodations were proposed on the Shroyer Road corridor. A copy of the SRTS plan is shown in Appendix A. The City of Oakwood is a partner with the City of Kettering on a joint resurfacing project for the Shroyer Road corridor extending from the north corporation line of the City of Oakwood to the Dorothy Lane intersection within the City of Kettering. The project also continues south in the City of Kettering to Stroop Road. A project (PID #97897) on the MVRPC transportation improvement plan (TIP) has $1.9 million allocated to pavement rehabilitation related improvements. The construction funding and project development schedule limits the scope of work to improvements within the existing right of way limits. Construction is planned for FY2018 but the project could sell as early as May 2017 (4QFY2017) if project development can be expedited. EXISTING FEATURES Shroyer Road has a posted speed limit of 35 miles per hour. On a four-lane undivided road, vehicle speeds can vary between travel lanes. Speed differential on Shroyer Road is most apparent as motorists approach the northbound lane merge on the north end of the study area. The alignment of Shroyer Road is straight. Pavement transitions occur at two locations within the study area: North End. The 4-lane roadway section transitions to a 2-lane section at the Dayton/ Oakwood corporation line. The 2-lane section within the City of Dayton has a raised median (8 ft width) that serves as a pedestrian/bicycle refuge for a shared use path crossing of the Kettering-Dayton trail. Shared use path (#19) connects the University of Dayton to Iron Horse Park in the City of Centerville. See Figure 2 for an excerpt from the MVRPC bikepath map. The solid line represents a path physically separated from motorized traffic. Double lines represent on-street routes. The red dots represent street crossings/trail access. South End. The 4-lane roadway section transitions to a 5-lane section near the Kettering /Oakwood corporation line. The 5-lane section within the City of Kettering has a raised median (4 ft width) that restricts turning movements of private driveways and of Brydon Road. Turning movements are permitted at the Speedway gas station site. 5

9 FIGURE 2: MVRPC BIKEWAY MAP Street lighting exists on the east side of Shroyer Road. The light fixtures extend about 13 feet from the curb to enable some illumination of the southbound lanes. The profile of Shroyer Road has a slight grade with crest vertical curves south of Peach Orchard Avenue and at the Forrer Boulevard intersection. Stopping sight distance is limited especially when a northbound left turning vehicle is stopped at the Peach Orchard Avenue intersection. Northbound left turn movements therefore are prohibited at the Peach Orchard Avenue intersection to mitigate the potential for rear end crashes. Photo #1 shows the Peach Orchard Avenue intersection looking south towards the crest vertical curve. 6
 exists on both sides of Shroyer Road. The tree lawn varies between 2 and 3 feet wide within the majority of the study area.")

10 PHOTO #1: PEACH ORCHARD AVENUE INTERSECTION LOOKING SOUTH The typical section of Shroyer Road averages 44 feet between the face of existing curbs. Sidewalk (5 feet wide) exists on both sides of Shroyer Road. The tree lawn varies between 2 and 3 feet wide within the majority of the study area. The pavement wearing surface is asphalt but the roadway base is concrete. Joint failures of the concrete result in cracking of the asphalt surface which requires sealant. TRAFFIC OPERATIONS All intersections within the City of Oakwood study area are unsignalized intersections. Traffic control consists of side street stop control at all unsignalized intersections; traffic on Shroyer Road has right of way and does not yield to cross street traffic. Intersection sight distance is restricted at several intersections within the study area including Wonderly Avenue, Aberdeen Avenue (see Photo #2), Wiltshire Boulevard, Monteray Avenue, and others. Trees, shrubs, and embankment behind the sidewalk (west side) all contribute to restricted sight distance of approaching vehicles. The obstructions limiting sight distance are located outside of the public right-of-way. PHOTO #2: ABERDEEN AVENUE LOOKING NORTH Parking is permitted on Shroyer Road although on-street parking by residents is infrequent. Dayton RTA route #17 has designed bus stops on Shroyer Road. The intervals between buses averages 1 hour and 40 minutes. The dwell time to load/unload is about 30 seconds. 7
11 DATA COLLECTION Manual turning movement count (TMC) data was collected at all intersections within the study area by the City of Oakwood and the City of Kettering. Traffic data was collected from 7:15 to 8:45 AM and from 4:00 to 6:00 PM. Peak traffic volumes occur at the critical intersection of Dorothy Lane and Shroyer Road between 7:15 and 8:15 AM (morning peak hour) and between 4:45 and 5:45 PM (evening peak hour). Appendix B contains the TMC data. Peak hour volumes of the Dorothy Lane and Shroyer Road intersection are summarized in Table 1. TABLE 1: DOROTHY LANE/ SHROYER ROAD TURN COUNT Northbound Westbound Southbound Eastbound Shroyer Road Dorothy Lane Shroyer Road Dorothy Lane LT TH RT LT TH RT LT TH RT LT TH RT AM Peak Hour (7:15 to 8:15 AM) PM Peak Hour (4:45 to 5:45 PM) A growth rate was not applied to the existing volumes since future traffic volumes are not expected to increase. The destination of traffic in the curb lane (shared through-right movement) on the northbound approach was of particular interest to quantify the volume of through vehicles. Changes to the lane configuration of Shroyer Road may be affected by the distribution of through vehicles per lane. Table 2 provides a summary of through vehicles in the northbound curb lane between Dorothy Lane and East Drive. TABLE 2: THROUGH VEHICLE DISTRIBUTION BY LANE (NB APPROACH) AM Peak Hour NB Approach Volumes at Dorothy NB Approach Volumes at Speedway NB Approach Volumes at East Drive PM Peak Hour NB Approach Volumes at Dorothy NB Approach Volumes at Speedway NB Approach Volumes at East Drive Left Lane (LT) Center Lane (TH) Curb Lane (TH) Curb Lane (R)
 is summarized in Graph 1. The 85 th percentile speed represents the speed which 85% of drivers are traveling or below.")
12 Traffic data consisting of speed and volume was also collected at 2 locations on Shroyer Road the week of February 1, 2016: Shroyer Rd 75 ft north of East Drive Shroyer Rd 75 ft north of Lonsdale Avenue The speed data by direction (NB and SB) is summarized in Graph 1. The 85 th percentile speed represents the speed which 85% of drivers are traveling or below. Many studies have shown that despite the posted speed limit on a given section of road, most drivers tend to travel at a speed that is comfortable relative to roadway conditions. The 4-lane, undivided section of Shroyer Road does not have features to discourage operating speeds higher than 35 miles per hour. Nearly 90% of all vehicles in the northbound direction at Lonsdale Avenue were traveling over the posted speed limit of 35 miles per hour during the 5- day data collection period. GRAPH #1: SHROYER SPEED SUMMARY The 24-hour traffic volumes from Monday through Friday are summarized in Graph 2. 9
13 GRAPH #2: SHROYER AVERAGE DAILY VOLUMES See Appendix C for the 24-hour traffic data (speed and volume). CRASH ANALYSIS Crash data was obtained from the Ohio Department of Transportation (ODOT) for the Shroyer Road corridor, encompassing a 5-year study period between 2010 and The crash data included crashes within 250 feet of the Dorothy Lane intersection which is ranked #60 on the Miami Valley Regional Planning (MVRPC) high crash locations. The OH-1 report for each documented crash was reviewed to confirm accuracy and to locate crashes properly within the study limits. Crash diagrams are provided in Appendix D. A review of crash data provided by the Ohio Department of Transportation (ODOT) crash database yielded a total of 180 crashes within the study area over the 5 year period. The following crash types and conditions are over represented within the study area compared to the statewide averages ( ) shown in parenthesis. Injury crashes: 48 crashes or 26.7 percent (23.5 percent) Rear end crashes: 78 crashes or 43.3 percent (20.7 percent) Angle crashes: 34 crashes or 18.9 percent (17.6 percent) Left turn crashes: 29 crashes or 16.1 percent ( 3.9 percent) Sideswipe passing: 16 crashes or 8.9 percent ( 6.9 percent) 10

 and 2014 (10 crashes or 26 percent).")
14 No fatalities occurred within the 5-year study period. Rear end, angle, and left turn crashes represent the top 3 crash types, accounting for over 78 percent of the total crashes as shown in Graph #3. Pedestrian and bicycle crashes (4 crashes) resulted in 3 injuries. GRAPH #3: FREQUENCY OF CRASHES BY TYPE Graph #4 shows the frequency of crashes by year. The percentage of crashes involving serious and minor visible injuries were the highest in 2013 (16 crashes or 37 percent) and 2014 (10 crashes or 26 percent). The total injury crashes within the study area is higher (26.7 percent) than the statewide average (23.5 percent) for similar corridors. GRAPH #4: FREQUENCY OF CRASHES BY YEAR 11
15 Of the 180 total crashes, 169 crashes (94 percent) occurred at intersections or driveways. The crash analysis therefore is to focus on intersection or driveway related crashes. Table 3 below shows the breakdown of crashes that occurred at intersections or driveways within the study area. The highlighted cells indicate the higher frequency crash locations (> 6 crashes at unsignalized intersections). TABLE 3: CRASH FREQUENCY BY LOCATION Intersection Rear End Right Angle Obl Angle Left Turn SS Pass Fixed Object Bicycle Ped Total Crashes City of Kettering Dorothy Lane City of Oakwood East Drive Claranna Ave Broad Blvd Wonderly Ave Orchard Drive Triangle Ave Peach Orchard Monteray Ave Hadley Ave Corona Ave Wiltshire Blvd Telford Ave Aberdeen Ave Forrer Blvd Lonsdale Ave Acorn Drive Dellwood Ave Oakwood Subtotal The Dorothy Lane intersection includes crashes within the functional area of a signalized intersection (250 feet). The functional area of an intersection is defined as the area beyond the physical intersection of two roadways as shown in Figure 3. The functional area for a leg of an intersection includes two components: one upstream of the physical area of the intersection and one downstream. The upstream (or intersection approach) includes additional length for decisionmaking, maneuvering, and required vehicle storage. The downstream area consists of a conflict overlap distance that allows a through vehicle to clear the intersection in addition to downstream conflict points. 12
16 FIGURE 3: INTERSECTION FUNCTIONAL AREA Downstream Upstream A review of the documented crash history on Shroyer Road within the City of Oakwood suggests patterns that are consistent with urban/suburban corridors having 4 lanes. The 4-lane section of Shroyer Road exhibits the following crash patterns: Rear end crash. Vehicles stop to turn left in the shared left-through lane. Lack of attention by a following vehicle results in a rear end crash. Following vehicles that abruptly change lanes also contribute to following vehicles colliding with a stopped vehicle intending to turn left at an unsignalized intersection. Rear end crashes can also occur when a vehicle slows intending to complete a right turn movement. The percentage of rear end crashes are two times higher (42.8 percent) than the statewide average (20.7 percent) Sideswipe passing crash. Sideswipe crashes occur when a lead vehicle slows to complete a turning movement at an unsignalized intersection. Following vehicles abruptly change lanes to avoid the need to slow or stop and collide with vehicles in an adjacent lane. The percentage of sideswipe passing crashes are higher (8.9 percent) than the statewide average (6.9 percent). Right angle crash. Right angle crashes are attributed to sight distance obstructions. Sight distance is restricted by trees, fencing, landscaping, and embankment located behind the sidewalk. Intersection sight distance can also be restricted when an RTA bus is stopped to load/unload passengers in the curb lane thus blocking visibility of through traffic in the adjacent lane. A right angle crash pattern (4 crashes) also exists at the Peach Orchard Avenue intersection. The profile of Shroyer Road limits the sight distance of northbound vehicles. Vehicles turning from Peach Orchard Avenue are at fault for all right turn crashes since a No Left Turn sign (R3-2) is posted on the northbound approach. Operational characteristics that contribute to the safety performance of existing Shroyer Road include higher operating speeds, more conflict points, and restricted sight distance of left turning vehicles on the major street. 13
17 Two pedestrian and two bicycle crashes also occurred. Three of these crashes resulted in injuries: A pedestrian struck on September 1, 2014 was crossing the north leg of Shroyer Road at Dorothy Lane. A pedestrian struck on December 9, 2010 was riding a skateboard on Peach Orchard Avenue and was at fault. No injuries were reported. A bicyclist struck on August 13, 2013 was riding southbound on the sidewalk at Acorn Drive. A bicyclist struck on January 10, 2014 was crossing Shroyer Road at Acorn Drive and was at fault. A pedestrian was also struck on September 10, 2015 on Shroyer Road about 100 feet south of Wiltshire Boulevard. The elementary school age pedestrian suffered minor injuries from the crash. Although this crash occurred outside the 5-year time period of this safety study, the crash highlights the challenges facing pedestrians, especially school age pedestrians, of choosing adequate gaps in traffic when crossing the 4-lane section of Shroyer Road. No facilities exist to assist pedestrians to cross Shroyer Road other than the legal (unmarked) crosswalks at each unsignalized intersection within the study area. A review of the documented crash history on at the Dorothy Lane/Shroyer Road intersection within the City of Kettering is summarized in Table 4. Note that the functional area of the intersection is assumed to be 250 feet. TABLE 4: DOROTHY LANE/SHROYER ROAD CRASH SUMMARY Crash Type 1 / Direction North Leg (SB) South Leg (NB) East Leg (WB) West Leg (EB) Rear End 9 (1D) 7 8 (2D) 8 Right Angle 7 (7D) 3 (3R) 4 (4D) 0 Oblique Angle 3 (1D) 0 3 (2D) 1 Left Turn 6 (1R) (1D) 4 (2R) 3 (1D) 11 (2R) SS passing Fixed Obj Ped Note 1: (xr) represents the number Red Light Running violations of the total crash type (xd) represents the number of crashes attributed to a private driveway 14
18 COUNTERMEASURES The following section addresses contributing factors associated with the prevalent crashes patterns on Shroyer Road and potential countermeasures to mitigate those crashes. Additional countermeasures are recommended to minimize potential safety issues that may not be directly attributed to historical crash trends. SHROYER ROAD DIET 80 CRASHES A road diet is proposed to mitigate the 80 crashes within the City of Oakwood. A road diet is the conversion of an undivided 4-lane roadway to a 3-lane roadway made up of two through lanes (one each direction) and a center left turn lane with a raised median or two-way left-turn lane (TWLTL). The reduction of lanes allows the roadway cross section to be reallocated for other uses such as bike lanes and pedestrian refuge islands. Traditional road diets involve the conversion of a 4-lane undivided cross-section to a 3-lane cross section which has 1 travel lane in each direction and a center turn lane. The introduction of the center turn lane removes turning traffic from through lanes and aligns left turning vehicles, removing sight distance obstructions from opposing left turn vehicles, and eliminating speed differential in the travel lanes. This results in consistent speeds on the corridor, reducing rear end crashes and left turn angle crashes. Due to the fact that a traditional road diet does not significantly impact capacity on the roadway, these applications may be used on roadways operating near capacity with the 4-lane cross section without significant operational impacts. Benefits of road diets include the following: traffic calming including reduced and uniform speeds; improved safety performance; improved pedestrian accommodation resulting from decreased crossing distance and slower vehicular speeds (e.g., passing by higher speed vehicles is not possible); improved bicycle accommodations. Four (4) lane, undivided roadways such as Shroyer Road experience a number of typical crash types as traffic volumes increase: Rear end and sideswipe crashes caused by speed differential between vehicles; Sideswipe crashes caused by frequent lane changing between two through lanes often due to stopped vehicles in the inside travel lane waiting to turn left; Rear end crashes caused by left-turning vehicles stopped in the inside travel lane; Angle crashes caused by side street traffic crossing four lanes to make a through movement across an intersection; Left turn crashes caused by restricted sight distance obstructed by opposing left turning vehicles that are offset; Bicycle crashes due to a lack of available space for bicyclists to ride comfortably; and Pedestrian crashes due to the number of lanes for pedestrians to cross with no refuge. 15
19 The Federal Highway Administration (FHWA) has determined through various studies that the acceptable range of daily traffic for a road diet as discussed in this report is 15,000 to 24,000 vehicles per day. The average daily traffic volume on Shroyer Road of 15,000 vehicles per day is well below the 24,000 upper threshold. Research has documented a 19 to 47 percent reduction in overall crashes when a road diet is installed on a previously four-lane undivided facility. ODOT recognizes that an average crash reduction of 30 percent can be expected for all types and severity when converting a 4-lane section to a 3-lane section of a minor arterial roadway such as Shroyer Road. A reduction in crashes involving drivers under 35 years of age and over 65 years of age has also been documented with a road diet. Crashes involving at least one driver under 35 years old or greater than 65 years old comprised 73 percent of all crashes on Shroyer Road. The revised cross section on Shroyer Road consists of through lane widths of 11 feet (plus a 0.5 ft shoulder adjacent to the raised median), dedicated bike lanes of 5 feet, and an 11 ft raised median. Figure 4 is a typical section of Shroyer Road showing pavement dimensions adjacent to the raised medians. Note that the existing concrete curbs remain in the same location as they exist today. FIGURE 4: SHROYER ROAD TYPICAL SECTION Figure 5 are conceptual plans of the Shroyer Road corridor as a 3-lane section. Additional information about the various design features of the road diet are included in the following section. Operational factors taken into consideration as part of the proposed cross section includes the following: 1. Median Type. A raised median (11 feet wide) is proposed between unsignalized intersections to maximize the safety benefits of the proposed improvement. The crash rate of 3.1 million vehicle miles traveled (MVMT) for the Shroyer Road corridor having an access density of approximately 60 per mile is lower than what can be expected for an undivided roadway. The installation of a raised median is shown to reduce the crash rate from existing levels based on the trends shown in Table 5 (The Handbook of Highway Engineering, 2004). 16


20 BIKE LANE RIGHT LANE MUST TURN RIGHT KEEP RIGHT CALCULATED SAK CHECKED SAK KEEP RIGHT R4-7b KEEP RIGHT KEEP RIGHT KEEP RIGHT CLARANNA AVE R4-7b R4-7b KEEP RIGHT KEEP RIGHT KEEP RIGHT KEEP RIGHT KEEP RIGHT KEEP RIGHT PEACH ORCHARD RD BROAD BLVD MATCHLINE STATION MATCHLINE STATION N L:\OakwoodOH\ _ShroyerSafetyStudy\Draw\Roadway\Sheets\15002GP001.dgn 1/28/2016 5:57:38 PM benbrown STA TO STA HORIZONTAL SCALE IN FEET MATCHLINE STATION MATCHLINE STATION EAST DORTHY LANE KEEP RIGHT 300 FT KEEP RIGHT BRYDON RD EAST DR TRIANGLE AVE ORCHARD DR WONDERLY AVE R4-7b R4-7b R4-7b R4-7b R4-7b CITY O F O A K W O O D SHRO YER RO A D IM PRO VEM ENT C O NCEPT PLA N W4-2R R4-7b R4-7b Existing Bus Stop BIKE LANE ENDS Existing Bus Stop R4-7b R4-7b ONLY ONLY R3-5R R3-5a W16-2aP R4-7b Existing Bus Stop Existing Bus Stop R3-17 R13-17bP Existing Bus Stop R3-17 R3-7R Existing Bus Stop 17 Existing Bus Stop 01 03


21 MATCHLINE STATION CORONA AVE KEEP RIGHT R4-7b FORRER BLVD N L:\OakwoodOH\ _ShroyerSafetyStudy\Draw\Roadway\Sheets\15002GP002.dgn 1/27/2016 3:29:53 PM benbrown CALCULATED 0 SAK CHECKED SAK HORIZONTAL SCALE IN FEET SHRO YER RO A D IM PRO VEM ENT C O NCEPT PLA N STA TO STA KEEP RIGHT KEEP RIGHT R4-7b KEEP RIGHT KEEP RIGHT KEEP RIGHT KEEP RIGHT KEEP RIGHT KEEP RIGHT KEEP RIGHT KEEP RIGHT KEEP RIGHT KEEP RIGHT KEEP RIGHT KEEP RIGHT CITY O F O A K W O O D KEEP RIGHT R4-7b WILTSHIRE BLVD MATCHLINE STATION MATCHLINE STATION R4-7b MONTERAY AVE R4-7b HADLEY AVE R4-7b MATCHLINE STATION R4-7b R4-7b R4-7b R4-7b R4-7b TELFORD AVE R4-7b R4-7b R4-7b Existing Bus Stop R4-7b Existing Bus Stop Existing Bus Stop Existing Bus Stop ABERDEEN AVE Existing Bus Stop R4-7b Existing Bus Stop 18


22 Existing Bus Stop GREENMOUNT BLVD LONSDALE AVE Existing Bus Stop R3-17 R13-17bP BIKE LANE ENDS BIKE LANE N SHRO YER RO A D IM PRO VEM ENT C O NCEPT PLA N CITY O F O A K W O O D STA TO STA KEEP RIGHT SAK SAK KEEP RIGHT L:\OakwoodOH\ _ShroyerSafetyStudy\Draw\Roadway\Sheets\15002GP003.dgn 3/2/2016 4:00:02 PM benbrown KEEP RIGHT KEEP RIGHT GAINSBOROUGH RD SHROYER RD MATCHLINE STATION CALCULATED CHECKED 0 HORIZONTAL SCALE IN FEET MATCHLINE STATION R4-7b R4-7b R4-7b R3-17 DELLWOOD AVE KEEP RIGHT R4-7b KEEP RIGHT R4-7b R4-7b
23 TABLE 5: CRASH RATES BY MEDIAN TYPE A raised median provides safety benefits to motorists and to pedestrians who use the raised island as a refuge when crossing Shroyer Road. See the following discussion of enhanced pedestrian crossings within the study area. Raised medians will result in restricted left turn access to some residential properties fronting Shroyer Road. Table 6 lists the parcels that would see restricted movements given the median plan depicted in this study. This list may be reduced depending on the final location of the raised medians. TABLE 6: RAISED MEDIAN IMPACTS X street House # X street House # X street House # X street House # East Orchard Corona Aberdeen Wiltshire Triangle Telford Forrer Claranna 2320/ Wonderly Peach Orchard Lonsdale / / / / Monteray 1408/ / /2508 Hadley Acorn Note 1: Property address for 4 unit apartment 20
24 2. Left turn lane lengths. The average length of dedicated left turn lanes at unsignalized intersections is equal to 100 feet which includes the 50 ft diverging taper. The full width, left turn lane length of 50 feet is adequate to serve peak hour volumes of 60 vehicles (or 15 vehicles in a 15-minute period). Data collection conducted by the City of Oakwood indicate that left turn volumes do not exceed 60 vehicles in the peak hour (or 15 vehicles in the peak 15 minute period) with one exception: the NB left turn movement at Dellwood Avenue. The peak 15-minute period at the Dellwood Avenue intersection documented 17 northbound vehicles turning left which requires an additional 20 feet of length. See Appendix B for turning movement data at each intersection within the study area. 3. Dedicated bike lanes. Dedicated bike lanes are proposed on most segments of Shroyer Road. Segments where travel lanes transition between East Drive and Claranna Avenue are not able to accommodate dedicated bike lanes. The use of sharrows are proposed for this segment to indicate motorists are to share the roadway with cyclists. Bike lanes provide a route for cyclists to access the Kettering-Dayton trail (#19) from the residential land uses within the City of Oakwood. The bike lane also provides a buffer to pedestrians on the existing sidewalk. 4. Bus Route. Bus route #17 has 7 bus stop locations on northbound Shroyer Road and 8 bus stop locations on southbound Shroyer Road. The proposed 3-lane section will result in delays to motorists using Shroyer Road when a bus stops to load/unload passengers. The greatest delays can be expected during the peak hours when one bus is scheduled every 1 hour and 40 minutes. A bus pull off can be accommodated at the East Drive intersection in the northbound direction to minimize delays to through traffic. A reduction of the number of bus stop locations to 4 in each direction should also be considered to reduce delays to through traffic. Assuming a bus stops at every stop (4 locations) during the PM peak period in the southbound direction, a maximum queue length of 1,000 feet could form behind a bus over a 3.5 minute period before it reaches the Dorothy Lane intersection. 850 vehicles 60 min/hour x 3.5 minutes x 20 feet/vehicle 992 feet 5. Intersection Capacity. Intersection capacity analysis was performed at the highest volume intersections within the City of Oakwood: Claranna Avenue, Wiltshire Boulevard, and Greenmount Boulevard. The capacity analysis shows that the Level of Service (LOS) on the side street approaches during the peak traffic period, can expect to degrade from an LOS C to LOS D at 2 intersections as shown in Table 7. The other intersections on Shroyer Road can expect to experience delays consistent with an LOS C for the proposed 21
25 3-lane section. Levels of service are considered to be within an acceptable range for values of LOS D or better. TABLE 7: LEVEL OF SERVICE SUMMARY Existing Condition (4 lane section) Proposed Condition (3-lane section) CROSS STREET DELAY (SEC) LOS DELAY (SEC) LOS Claranna Avenue 19.3 C 30.5 D Wiltshire Boulevard 23.6 C 32.8 D Greenmount Blvd 14.1 B 21.0 C Capacity analyses are summarized in Appendix E. The construction costs for sawcut of pavement, excavation, raised medians, and signs is estimated to be $480,000. The construction costs do not include aesthetic enhancements such as landscaping of the grass medians. Landscape design of the medians should take into account intersection sight distance during the preliminary design. See Appendix F for construction cost estimate. SPEEDWAY ACCESS MANAGEMENT 14 CRASHES There were a total of 14 crashes involving vehicles from the Speedway site in the northeast quadrant of the Dorothy Lane and Shroyer Road intersection. None of the crashes occurred within the AM (7:15 to 8:15) and PM (4:45 to 5:45) peak hours. Seven (7) angle crashes occurred at the Speedway access on Shroyer Road. All but one of the angle crashes involved through traffic on the southbound approach to Dorothy Lane. One crash involved a southbound left turning vehicle entering the site. One crash involved an emergency vehicle traveling left of center to avoid queues on the southbound approach. Six (6) angle crashes occurred at the Speedway access on Dorothy Lane. All crashes involved vehicles exiting the Speedway site with the majority turning left. The Shroyer Road access is located 100 feet from the Dorothy Lane intersection whereas the Dorothy Lane access to the Speedway site is located 80 feet from Shroyer Road. Restricting the left turn movement from the Shroyer Road access is proposed as the most feasible countermeasure to mitigate crashes. Motorists leaving the site can reach all destinations by using the Dorothy Lane access. The implementation of such a change of access can be accomplished by narrowing the median opening on Shroyer Road by 20 feet to allow southbound left turn, northbound right turn, and westbound right turn movements to/from the site. Implementation costs if incorporated as part of the resurfacing project is estimated at $5,000 for sawcut of pavement, excavation, signs, and concrete median costs. Maintenance of traffic is included as part of the separate resurfacing project. See Appendix F for a detailed breakdown of the cost estimate. 22

26 WESTBOUND LEFT TURN PHASING (DOROTHY/SHROYER) 11 CRASHES There were a total of 11 left turn crashes involving eastbound left turning vehicles and westbound through vehicles at the intersection of Shroyer Road and Dorothy Lane. Two of the 11 crashes were attributed to red light running of westbound through traffic. The motorist turning left was atfault for the remaining 9 crashes. Figure 6 shows the sight line of an eastbound left turning motorist (150 feet). The sight distance of 150 feet or less is available when an opposing westbound left turn vehicle is present. The horizontal curvature of Dorothy Lane reduces the available sight distance at the Shroyer Road intersection. The ODOT Location and Design Manual, Volume 2, Figure 201-1E suggests a minimum stopping sight distance of 250 feet for speeds of 35 miles per hour. The available sight distance is not adequate for approach speeds greater than or equal to 25 miles per hour. The existing signal phasing is a protected/permissive phase for both the eastbound and westbound left turn movements. Opposing left turning vehicles restrict sight distances to lengths less than the posted speed limit on Dorothy Lane. Changing the protected/permissive left turn phase to protected only phasing is recommended unless the intersection sight distance is improved to meet minimum criteria. Progression on Dorothy Lane will need to be evaluated by others to determine if lead/lead or lead (EB)/lag (WB) is preferred to reduce stops. Implementation costs of $6,000 are estimated for a new signal head, signal timing analysis, and new signal cables. FIGURE 6: EASTBOUND LEFT TURN SSD 23
27 SHROYER ROAD SIGHT DISTANCE 9 CRASHES There were a total of 9 left turn crashes occurred on the Shroyer Road approaches to Dorothy Lane: Five (5) left turn crashes involving southbound left turning vehicles and northbound through vehicles. One northbound through motorist was at-fault for a red light running violation. Four (4) left turn crashes involving northbound left turning vehicles and southbound through vehicles. Two southbound through motorists were at-fault for red light running violations. Raised medians extend to the stop line adjacent to the southbound left turn lane to control access to private driveways within the functional area of the intersection. The raised medians, however, reduce the available sight distance of left turning vehicles during the permissive left turn phase. Similar to the eastbound left turn movement, sight distance of 150 feet or less is available when an opposing northbound left turn vehicle is present. The ODOT Location and Design manual, Volume 2, Figure 201-1E suggests a minimum stopping sight distance of 250 feet for speeds of 35 miles per hour. The available sight distance is not adequate for approach speeds greater than or equal to 25 miles per hour. Two low cost countermeasures are proposed to mitigate left turn crashes on the Shroyer Road approaches: Reduce length of median on the southbound Shroyer Road approach by 25 feet. Add painted island between the through and left turn lanes to encourage drivers to favor the painted centerline thus improve intersection sight distance. Add a painted island on the northbound approach between the through and left turn lanes. The painted island is to encourage drivers to favor the painted centerline thus improve intersection sight distance. Implementation costs if incorporated as part of the resurfacing project is estimated at $5,000 for sawcut of pavement, excavation, pavement markings, and concrete median costs. Maintenance of traffic is included as part of the separate resurfacing project. TRAFFIC SIGNAL INSTALLATION -- GENERAL The following countermeasures are recommended to mitigate crash frequency at the Dorothy Lane and Shroyer Road intersection: 1. Review clearance Intervals. A review of the yellow change and all red clearance times for through movements is recommended. The standard yellow clearance for a 35 MPH is 3.6 seconds whereas yellow clearance times of 3.9 seconds (40 MPH) for the Shroyer Road approaches and 4.2 seconds (45 MPH) for the Dorothy Lane approaches are currently programmed. NCHRP Report 731 dated July 2012 confirms that the ITE clearance interval guidelines are used by the highest percentage of state and local 24
28 agencies resulting in a total crash reduction of 8 to 14 percent an injury reduction of 12 percent also can be expected. The NCHRP Report 731 also recommends using a design speed of 20 MPH for left turning vehicles which is used by the City of Kettering. The left turn crashes therefore are believed to be a function of sight distance and not clearance timing as discussed above. 2. Upgrade existing traffic signal installation: Upgrades to the existing traffic signal are recommended in conjunction with the lane configuration and clearance interval changes and to address the observed need for signal maintenance. The recommendation includes the following components and has potential to mitigate all intersection related (nondriveway) crashes. Replace all signal heads and provide reflective back plates on new heads Add supplemental signal head to the east and westbound approaches to compensate for the horizontal curve on both approaches. Mount a single, 3-section signal head near side, far right to maximize visibility of the signal installation. IMPLEMENTATION Implementation of the following countermeasures are proposed to be incorporated as part of the currently programmed resurfacing project (PID #97897). The design schedule could be accelerated in 2016 to meet a plan sale date of May Shroyer Road diet. Convert the existing 4-lane section of Shroyer Road north of Dorothy Lane to a 3-lane section with raised medians and bike lanes. Overhead lane use signs are included as part of the lane conversion project. The final decision to convert Shroyer Road to a 3-lane section as part of the roadway resurfacing project is needed by April 2016 to meet a May 2017 sale date. 2. Median reconstruction. Reconstruction of the existing median on Shroyer Road is proposed to be incorporated as part of the currently programmed resurfacing project (PID #97897). Median reconstruction includes a median extension to restrict left turn movements from the Speedway site and a median removal to improve intersection sight distance on the Shroyer Road approaches at Dorothy Lane. General improvements to the traffic signal installation can be implemented as part of a separate project. Additional design is required to confirm the existing strain poles are adequate to support the increased loading caused by additional signal heads and backplates. The ability of the overall construction budget to accommodate an increase of scope and the associated design time are factors that affect the implementation schedule of signal improvements at Dorothy Lane/Shroyer Road. Note that improvements to the Shroyer Road corridor should extend beyond the existing curb lines. Construction activities that extend beyond the existing right of way limits should be avoided to meet schedule commitments for the federal funds. 25

29 Other enhancements that may be considered to improve the safety performance of Shroyer Road include the following: Mid-block pedestrian refuge. A pedestrian refuge may be considered at mid-block locations on Shroyer Road. The pedestrian crossing would be designed to permit a half crossing of Shroyer Road. The pedestrian crossing may be equipped with a Rapid Rectangular Flashing Beacon (RRFB) to enhance the visibility of the crosswalk when pedestrians are present. Figure 7 from the City of Bloomington, Indiana depicts how an RRFB operates at a crossing. FIGURE 7: RRFB CROSSING EXAMPLE Street lighting. Crash analysis of Shroyer Road shows that crashes during nondaylight conditions comprise 26% of all crashes whereas the statewide average for similar roadways is equal to 36%. Existing street lighting on the east side of Shroyer Road may contribute to the improved performance of Shroyer Road when compared to the statewide average. Despite the presence of street lighting on the east side of Shroyer Road, street lighting to improve illumination on the west side of Shroyer Road would enhance visibility during non-daylight conditions. Lighting at intersections can reduce crashes by as much as 31 to 38 percent (ODOT CRF table). Since lighting exists on the east side of Shroyer Road, the actual reduction of crashes will be less than published in the ODOT crash reduction factors. The addition of lighting on the west side would be expected to result in a net improvement to safety performance within the study area. 26
30 Shroyer Road Safety Study APPENDIX A: SAFE ROUTES TO SCHOOL (SRTS) PLAN
31
32
33 Shroyer Road Safety Study APPENDIX B: INTERSECTION TURNING MOVEMENT COUNT (TMC) DATA
34
35
36
37
38 File Name : East & Shroyer - Morning Turn Count Site Code : Start Date : 12/04/2015 Page No : 1 Groups Printed- Unshifted - Bank 1 From North From East From South From West Start Time Right Thru Left Peds App. Total Right Thru Left Peds App. Total Right Thru Left Peds App. Total Right Thru Left Peds App. Total Int. Total 07:40 AM :55 AM :10 AM :25 AM :40 AM Grand Total Apprch % Total % Unshifted % Unshifted Bank % Bank City of Kettering Engineering Dept Shroyer Road Kettering, Ohio
39 File Name : East & Shroyer - Evening Turn Count Site Code : Start Date : 12/02/2015 Page No : 1 Groups Printed- Unshifted From North From East From South From West Start Time Right Thru Left Peds App. Total Right Thru Left Peds App. Total Right Thru Left Peds App. Total Right Thru Left Peds App. Total Int. Total 03:58 PM :13 PM :28 PM :43 PM :58 PM :13 PM :28 PM :43 PM Grand Total Apprch % Total % City of Kettering Engineering Dept Shroyer Road Kettering, Ohio
40 CMT, Inc Columbus, Ohio Centered in Value Claranna CIty of Oakwood File Name : Not Named 7 Site Code : Start Date : 12/16/2015 Page No : 1 CLASHK From North CLAR From East Groups Printed- Unshifted - Bank 1 CLASHK From South CLAR From West Start Time Right Thru Left Peds App. Total Right Thru Left Peds App. Total Right Thru Left Peds App. Total Right Thru Left Peds App. Total Int. Total 07:15 AM :30 AM :45 AM Total :00 AM :15 AM :30 AM *** BREAK *** Total *** BREAK *** 04:00 PM :15 PM :30 PM :45 PM Total :00 PM :15 PM :30 PM :45 PM Total Grand Total Apprch % Total % Unshifted % Unshifted Bank % Bank
41 08:00 AM :15 AM :30 AM *** BREAK *** Total :00 PM :15 PM :30 PM :45 PM Total :00 PM :15 PM :30 PM :45 PM Total Grand Total Apprch % Total % Unshifted % Unshifted Bank % Bank CMT, Inc Columbus, Ohio Centered in Value Shroyer at Broad City of Oakwood File Name : Not Named 8 Site Code : Start Date : 2/18/2016 Page No : 1 SHR From North BROAD From East Groups Printed- Unshifted - Bank 1 SHR From South BROAD From West Start Time Right Thru Left Peds App. Total Right Thru Left Peds App. Total Right Thru Left Peds App. Total Right Thru Left Peds App. Total Int. Total 07:15 AM :30 AM :45 AM Total *** BREAK ***
42 08:00 AM :15 AM :30 AM :45 AM Total :00 AM *** BREAK *** Total :30 PM :45 PM Total :00 PM :15 PM :30 PM :45 PM Total :00 PM :15 PM Grand Total Apprch % Total % Unshifted % Unshifted Bank % Bank CMT, Inc Columbus, Ohio Centered in Value Shroyer at Wonderly CIty of Oakwood File Name : Not Named 2 Site Code : Start Date : 12/10/2015 Page No : 1 SHR From North WOND From East Groups Printed- Unshifted - Bank 1 SHR From South WOND From West Start Time Right Thru Left Peds App. Total Right Thru Left Peds App. Total Right Thru Left Peds App. Total Right Thru Left Peds App. Total Int. Total 07:45 AM Total *** BREAK ***
43 08:00 AM :15 AM :30 AM *** BREAK *** Total :00 PM :15 PM :30 PM :45 PM Total :00 PM :15 PM :30 PM :45 PM Total Grand Total Apprch % Total % Unshifted % Unshifted Bank % Bank CMT, Inc Columbus, Ohio Centered in Value Shroyer at Orchard City of Oakwood File Name : Not Named 3 Site Code : Start Date : 2/3/2016 Page No : 1 SHR From North ORCH From East Groups Printed- Unshifted - Bank 1 SHR From South ORCH From West Start Time Right Thru Left Peds App. Total Right Thru Left Peds App. Total Right Thru Left Peds App. Total Right Thru Left Peds App. Total Int. Total 07:15 AM :30 AM :45 AM Total *** BREAK ***
44 08:00 AM :15 AM :30 AM *** BREAK *** Total :00 PM :15 PM :30 PM :45 PM Total :00 PM :15 PM :30 PM :45 PM Total Grand Total Apprch % Total % Unshifted % Unshifted Bank % Bank CMT, Inc Columbus, Ohio Centered in Value Shroyer at Triangle City of Oakwood File Name : Not Named 1 Site Code : Start Date : 1/27/2016 Page No : 1 SHROY From North TRIANGLE From East Groups Printed- Unshifted - Bank 1 SHROY From South TRIANGLE From West Start Time Right Thru Left Peds App. Total Right Thru Left Peds App. Total Right Thru Left Peds App. Total Right Thru Left Peds App. Total Int. Total 07:15 AM :30 AM :45 AM Total *** BREAK ***
45 08:00 AM :15 AM :30 AM *** BREAK *** Total :00 PM :15 PM :30 PM :45 PM Total :00 PM :15 PM :30 PM :45 PM Total Grand Total Apprch % Total % Unshifted % Unshifted Bank % Bank CMT, Inc Columbus, Ohio Centered in Value Shroyer at Peach Orchard City of Oakwood File Name : Not Named 7 Site Code : Start Date : 1/20/2016 Page No : 1 SHR From North PEA From East Groups Printed- Unshifted - Bank 1 SHR From South PEA From West Start Time Right Thru Left Peds App. Total Right Thru Left Peds App. Total Right Thru Left Peds App. Total Right Thru Left Peds App. Total Int. Total 07:15 AM :30 AM :45 AM Total *** BREAK ***
46 08:00 AM :15 AM :30 AM *** BREAK *** Total :00 PM :15 PM :30 PM :45 PM Total :00 PM :15 PM :30 PM :45 PM Total Grand Total Apprch % Total % Unshifted % Unshifted Bank % Bank CMT, Inc Columbus, Ohio Centered in Value Shroyer at Monteray City of Oakwood File Name : Not Named 4 Site Code : Start Date : 2/4/2016 Page No : 1 SHR From North MON From East Groups Printed- Unshifted - Bank 1 SHR From South MON From West Start Time Right Thru Left Peds App. Total Right Thru Left Peds App. Total Right Thru Left Peds App. Total Right Thru Left Peds App. Total Int. Total 07:15 AM :30 AM :45 AM Total *** BREAK ***
47 08:00 AM :15 AM :30 AM *** BREAK *** Total :00 PM :15 PM :30 PM :45 PM Total :00 PM :15 PM :30 PM Grand Total Apprch % Total % Unshifted % Unshifted Bank % Bank CMT, Inc Columbus, Ohio Centered in Value Shroyer at Hadley City of Oakwood File Name : Not Named 5 Site Code : Start Date : 2/9/2016 Page No : 1 Shroyer From North Hadley From East Groups Printed- Unshifted - Bank 1 Shroyer From South Hadley From West Start Time Right Thru Left Peds App. Total Right Thru Left Peds App. Total Right Thru Left Peds App. Total Right Thru Left Peds App. Total Int. Total 07:15 AM :30 AM :45 AM Total *** BREAK ***
48 08:00 AM :15 AM :30 AM *** BREAK *** Total :00 PM :15 PM :30 PM :45 PM Total :00 PM :15 PM :30 PM Grand Total Apprch % Total % Unshifted % Unshifted Bank % Bank CMT, Inc Columbus, Ohio Centered in Value Shroyer at Corona City of Oakwood File Name : Not Named 6 Site Code : Start Date : 2/10/2016 Page No : 1 CORONA From North A From East Groups Printed- Unshifted - Bank 1 CORONA From South A From West Start Time Right Thru Left Peds App. Total Right Thru Left Peds App. Total Right Thru Left Peds App. Total Right Thru Left Peds App. Total Int. Total 07:30 AM :45 AM Total *** BREAK ***
49 08:00 AM :15 AM :30 AM *** BREAK *** Total :00 PM :15 PM :30 PM :45 PM Total :00 PM :15 PM :30 PM :45 PM Total Grand Total Apprch % Total % Unshifted % Unshifted Bank % Bank CMT, Inc Columbus, Ohio Centered in Value Shroyer at Wiltshire City of Oakwood File Name : Not Named 7 Site Code : Start Date : 2/11/2016 Page No : 1 S From North WILT From East Groups Printed- Unshifted - Bank 1 S From South WILT From West Start Time Right Thru Left Peds App. Total Right Thru Left Peds App. Total Right Thru Left Peds App. Total Right Thru Left Peds App. Total Int. Total 07:15 AM :30 AM :45 AM Total *** BREAK ***
50 08:00 AM :15 AM :30 AM *** BREAK *** Total :00 PM :15 PM :30 PM :45 PM Total :00 PM :15 PM :30 PM :45 PM Total Grand Total Apprch % Total % Unshifted % Unshifted Bank % Bank CMT, Inc Columbus, Ohio Centered in Value Shroyer at Telford City of Oakwood File Name : Not Named 4 Site Code : Start Date : 12/15/2015 Page No : 1 SHR From North TEL From East Groups Printed- Unshifted - Bank 1 SHR From South TEL From West Start Time Right Thru Left Peds App. Total Right Thru Left Peds App. Total Right Thru Left Peds App. Total Right Thru Left Peds App. Total Int. Total 07:15 AM :30 AM :45 AM Total *** BREAK ***
51 08:00 AM :15 AM :30 AM *** BREAK *** Total :00 PM :15 PM :30 PM :45 PM Total :00 PM :15 PM :30 PM :45 PM Total Grand Total Apprch % Total % Unshifted % Unshifted Bank % Bank CMT, Inc Columbus, Ohio Centered in Value Shroyer at Aberdeen City of Oakwood File Name : Not Named 9 Site Code : Start Date : 1/26/2016 Page No : 1 SHROY From North AABER From East Groups Printed- Unshifted - Bank 1 SHROY From South AABER From West Start Time Right Thru Left Peds App. Total Right Thru Left Peds App. Total Right Thru Left Peds App. Total Right Thru Left Peds App. Total Int. Total 07:15 AM :30 AM :45 AM Total *** BREAK ***
52 08:00 AM :15 AM :30 AM *** BREAK *** Total :00 PM :15 PM :30 PM :45 PM Total :00 PM :15 PM :30 PM :45 PM Total Grand Total Apprch % Total % Unshifted % Unshifted Bank % Bank CMT, Inc Columbus, Ohio Centered in Value Shroyer at Forrer City of Oakwood File Name : Not Named 6 Site Code : Start Date : 2/16/2016 Page No : 1 SHROYER From North FORRER From East Groups Printed- Unshifted - Bank 1 SHROYER From South FORRER From West Start Time Right Thru Left Peds App. Total Right Thru Left Peds App. Total Right Thru Left Peds App. Total Right Thru Left Peds App. Total Int. Total 07:15 AM :30 AM :45 AM Total *** BREAK ***
53 CMT, Inc Columbus, Ohio Centered in Value Shroyer at Lonsdale Cit of Oakwood File Name : Not Named 7 Site Code : Start Date : 2/17/2016 Page No : 1 Groups Printed- Unshifted - Bank 1 SHR From North LONSDALE From East SHR From South LONSDALE From West Start Time Right Thru Left Peds App. Total Right Thru Left Peds App. Total Right Thru Left Peds App. Total Right Thru Left Peds App. Total Int. Total 07:15 AM :30 AM :45 AM Total :00 AM :15 AM :30 AM *** BREAK *** Total *** BREAK *** 04:00 PM :15 PM :30 PM :45 PM Total :00 PM :15 PM :30 PM :45 PM Total Grand Total Apprch % Total % Unshifted % Unshifted Bank % Bank
54 08:00 AM :15 AM :30 AM Grand Total Apprch % Total % Unshifted % Unshifted Bank % Bank CMT, Inc Columbus, Ohio Centered in Value Shroyer at Greenmount City of Oakwood File Name : Not Named 8 Site Code : Start Date : 1/21/2016 Page No : 1 GRN From North GRN From East Groups Printed- Unshifted - Bank 1 GRN From South GRN From West Start Time Right Thru Left Peds App. Total Right Thru Left Peds App. Total Right Thru Left Peds App. Total Right Thru Left Peds App. Total Int. Total 07:15 AM :30 AM :45 AM Total
55 CMT, Inc Columbus, Ohio Centered in Value Greenmount/Acorn at Shroyer File Name : Not Named 1 Site Code : Start Date : 12/9/2015 Page No : 1 SHR From North GREE From East Groups Printed- Unshifted - Bank 1 SHR From South GREE From West Start Time Right Thru Left Peds App. Total Right Thru Left Peds App. Total Right Thru Left Peds App. Total Right Thru Left Peds App. Total Int. Total 04:30 PM :45 PM Total :00 PM :15 PM :30 PM :45 PM Total :00 PM :15 PM Grand Total Apprch % Total % Unshifted % Unshifted Bank % Bank
56 08:00 AM :15 AM :30 AM *** BREAK *** Total :00 PM :15 PM :30 PM :45 PM Total :00 PM :15 PM :30 PM :45 PM Total Grand Total Apprch % Total % Unshifted % Unshifted Bank % Bank CMT, Inc Columbus, Ohio Centered in Value Shroyer at Dellwood City of Oakwood File Name : Not Named 6 Site Code : Start Date : 12/17/2015 Page No : 1 SHR From North DELL From East Groups Printed- Unshifted - Bank 1 SHR From South DELL From West Start Time Right Thru Left Peds App. Total Right Thru Left Peds App. Total Right Thru Left Peds App. Total Right Thru Left Peds App. Total Int. Total 07:15 AM :30 AM :45 AM Total *** BREAK ***
57 Shroyer Road Safety Study APPENDIX C: 24-HOUR TRAFFIC DATA (SPEED AND VOLUME)
58 75 ft north of East Site Code: EAST Station ID: Untitled S Date Start: 31-Jan-16 Date End: 08-Feb-16 SB Shroyer Start Pace Number Time Total Speed in Pace 02/01/ : : : : : : : : : : : PM : : : : : : : : : : : Total Percent 4.1% 0.1% 0.8% 4.8% 28.7% 38.4% 19.7% 3.3% 0.1% 0.0% 0.0% 0.0% 0.0% 0.0% AM Peak 08:00 09:00 10:00 09:00 07:00 07:00 07:00 07:00 01:00 08:00 07:00 Vol PM Peak 17:00 14:00 16:00 19:00 17:00 17:00 17:00 14:00 17:00 14:00 15:00 17:00 Vol CMT Columbus, Ohio Page 2
59 75 ft north of East Site Code: EAST Station ID: Untitled S Date Start: 31-Jan-16 Date End: 08-Feb-16 SB Shroyer Start Pace Number Time Total Speed in Pace 02/02/ : : : : : : : : : : : PM : : : : : : : : : : : Total Percent 4.5% 0.2% 1.0% 4.5% 28.4% 40.5% 18.5% 2.2% 0.2% 0.0% 0.0% 0.0% 0.0% 0.0% AM Peak 07:00 09:00 08:00 11:00 07:00 07:00 10:00 07:00 08:00 01:00 01:00 01:00 07:00 Vol PM Peak 17:00 20:00 18:00 18:00 17:00 17:00 17:00 17:00 17:00 13:00 17:00 Vol CMT Columbus, Ohio Page 3
60 75 ft north of East Site Code: EAST Station ID: Untitled S Date Start: 31-Jan-16 Date End: 08-Feb-16 SB Shroyer Start Pace Number Time Total Speed in Pace 02/03/ : : : : : : : : : : : PM : : : : : : : : : : : Total Percent 4.6% 0.2% 1.0% 4.6% 24.9% 39.8% 21.0% 3.4% 0.4% 0.0% 0.0% 0.0% 0.0% 0.0% AM Peak 07:00 07:00 10:00 08:00 08:00 07:00 07:00 11:00 10:00 11:00 07:00 Vol PM Peak 17:00 17:00 12:00 18:00 17:00 17:00 15:00 14:00 15:00 16:00 15:00 17:00 Vol CMT Columbus, Ohio Page 4
61 75 ft north of East Site Code: EAST Station ID: Untitled S Date Start: 31-Jan-16 Date End: 08-Feb-16 SB Shroyer Start Pace Number Time Total Speed in Pace 02/04/ : : : : : : : : : : : PM : : : : : : : : : : : Total Percent 5.0% 0.1% 0.9% 4.8% 31.8% 38.9% 15.4% 2.5% 0.5% 0.0% 0.0% 0.0% 0.0% 0.1% AM Peak 07:00 09:00 08:00 10:00 10:00 08:00 11:00 07:00 11:00 07:00 Vol PM Peak 15:00 13:00 16:00 14:00 17:00 17:00 17:00 12:00 12:00 14:00 15:00 17:00 Vol CMT Columbus, Ohio Page 5
62 75 ft north of East Site Code: EAST Station ID: Untitled S Date Start: 31-Jan-16 Date End: 08-Feb-16 SB Shroyer Start Pace Number Time Total Speed in Pace 02/05/ : : : : : : : : : : : PM : : : : : : : : : : : Total Percent 5.3% 0.1% 1.3% 4.5% 26.8% 39.9% 18.7% 2.8% 0.4% 0.1% 0.1% 0.0% 0.0% 0.0% AM Peak 07:00 10:00 11:00 07:00 07:00 11:00 10:00 11:00 07:00 07:00 06:00 08:00 07:00 Vol PM Peak 16:00 16:00 16:00 19:00 17:00 17:00 15:00 15:00 16:00 14:00 14:00 16:00 17:00 Vol CMT Columbus, Ohio Page 6
63 75 ft north of East Site Code: EAST Station ID: Untitled S Date Start: 31-Jan-16 Date End: 08-Feb-16 SB Shroyer Start Pace Number Time Total Speed in Pace 02/08/ * * 01: * * 02: * * 03: * * 04: * * 05: * * 06: * * 07: * * 08: * * 09:00 * * * * * * * * * * * * * * * * * 10:00 * * * * * * * * * * * * * * * * * 11:00 * * * * * * * * * * * * * * * * * 12 PM * * * * * * * * * * * * * * * * * 13:00 * * * * * * * * * * * * * * * * * 14:00 * * * * * * * * * * * * * * * * * 15:00 * * * * * * * * * * * * * * * * * 16:00 * * * * * * * * * * * * * * * * * 17:00 * * * * * * * * * * * * * * * * * 18:00 * * * * * * * * * * * * * * * * * 19:00 * * * * * * * * * * * * * * * * * 20:00 * * * * * * * * * * * * * * * * * 21:00 * * * * * * * * * * * * * * * * * 22:00 * * * * * * * * * * * * * * * * * 23:00 * * * * * * * * * * * * * * * * * Total Percent 0.0% 0.0% 0.0% 0.0% 0.0% 0.0% 0.0% 0.0% 0.0% 0.0% 0.0% 0.0% 0.0% 0.0% AM Peak Vol. PM Peak Vol. Total Percent 4.6% 0.1% 1.1% 4.6% 28.2% 39.6% 18.6% 2.8% 0.3% 0.0% 0.0% 0.0% 0.0% 0.0% 15th Percentile : 30 MPH 50th Percentile : 36 MPH 85th Percentile : 41 MPH 95th Percentile : 44 MPH CMT Columbus, Ohio Page 9 Stats 10 MPH Pace Speed : MPH Number in Pace : Percent in Pace : 67.8% Number of Vehicles > 35 MPH : Percent of Vehicles > 35 MPH : 61.4% Mean Speed(Average) : 36 MPH
64 75 ft north of East Site Code: EAST Station ID: Untitled S Date Start: 31-Jan-16 Date End: 08-Feb-16 NB Shroyer Start Pace Number Time Total Speed in Pace 02/01/ : : : : : : : : : : : PM : : : : : : : : : : : Total Percent 3.2% 0.1% 0.6% 2.2% 19.1% 56.9% 16.4% 1.1% 0.2% 0.0% 0.0% 0.0% 0.0% 0.0% AM Peak 07:00 05:00 08:00 07:00 07:00 07:00 07:00 10:00 10:00 10:00 07:00 Vol PM Peak 17:00 15:00 19:00 18:00 18:00 17:00 16:00 13:00 15:00 12:00 12:00 20:00 18:00 17:00 Vol CMT Columbus, Ohio Page 11
65 75 ft north of East Site Code: EAST Station ID: Untitled S Date Start: 31-Jan-16 Date End: 08-Feb-16 NB Shroyer Start Pace Number Time Total Speed in Pace 02/02/ : : : : : : : : : : : PM : : : : : : : : : : : Total Percent 3.4% 0.0% 0.5% 1.9% 17.7% 54.3% 20.5% 1.4% 0.3% 0.0% 0.0% 0.0% 0.0% 0.0% AM Peak 07:00 05:00 07:00 07:00 07:00 07:00 07:00 11:00 07:00 07:00 08:00 07:00 Vol PM Peak 17:00 15:00 17:00 15:00 16:00 16:00 17:00 13:00 14:00 15:00 12:00 15:00 16:00 Vol CMT Columbus, Ohio Page 12
66 75 ft north of East Site Code: EAST Station ID: Untitled S Date Start: 31-Jan-16 Date End: 08-Feb-16 NB Shroyer Start Pace Number Time Total Speed in Pace 02/03/ : : : : : : : : : : : PM : : : : : : : : : : : Total Percent 3.5% 0.2% 0.5% 1.9% 14.6% 53.2% 23.7% 2.2% 0.1% 0.0% 0.0% 0.0% 0.0% 0.1% AM Peak 07:00 08:00 07:00 07:00 08:00 07:00 07:00 07:00 07:00 08:00 07:00 07:00 Vol PM Peak 17:00 17:00 17:00 17:00 17:00 17:00 12:00 12:00 12:00 12:00 16:00 17:00 17:00 Vol CMT Columbus, Ohio Page 13
67 75 ft north of East Site Code: EAST Station ID: Untitled S Date Start: 31-Jan-16 Date End: 08-Feb-16 NB Shroyer Start Pace Number Time Total Speed in Pace 02/04/ : : : : : : : : : : : PM : : : : : : : : : : : Total Percent 4.3% 0.1% 0.5% 1.9% 15.9% 53.7% 21.2% 2.0% 0.3% 0.1% 0.0% 0.0% 0.0% 0.0% AM Peak 07:00 08:00 08:00 07:00 11:00 07:00 07:00 07:00 09:00 07:00 07:00 08:00 07:00 Vol PM Peak 17:00 15:00 12:00 15:00 15:00 17:00 16:00 12:00 15:00 13:00 18:00 17:00 17:00 Vol CMT Columbus, Ohio Page 14
68 75 ft north of East Site Code: EAST Station ID: Untitled S Date Start: 31-Jan-16 Date End: 08-Feb-16 NB Shroyer Start Pace Number Time Total Speed in Pace 02/05/ : : : : : : : : : : : PM : : : : : : : : : : : Total Percent 3.6% 0.1% 0.5% 1.6% 12.2% 51.4% 27.2% 2.9% 0.3% 0.1% 0.0% 0.0% 0.0% 0.0% AM Peak 08:00 05:00 06:00 07:00 07:00 08:00 07:00 07:00 09:00 07:00 07:00 07:00 Vol PM Peak 16:00 17:00 14:00 16:00 17:00 17:00 12:00 15:00 13:00 17:00 15:00 16:00 16:00 Vol CMT Columbus, Ohio Page 15
69 75 ft north of East Site Code: EAST Station ID: Untitled S Date Start: 31-Jan-16 Date End: 08-Feb-16 NB Shroyer Start Pace Number Time Total Speed in Pace 02/08/ * * 01: * * 02: * * 03: * * 04: * * 05: * * 06: * * 07: * * 08: * * 09:00 * * * * * * * * * * * * * * * * * 10:00 * * * * * * * * * * * * * * * * * 11:00 * * * * * * * * * * * * * * * * * 12 PM * * * * * * * * * * * * * * * * * 13:00 * * * * * * * * * * * * * * * * * 14:00 * * * * * * * * * * * * * * * * * 15:00 * * * * * * * * * * * * * * * * * 16:00 * * * * * * * * * * * * * * * * * 17:00 * * * * * * * * * * * * * * * * * 18:00 * * * * * * * * * * * * * * * * * 19:00 * * * * * * * * * * * * * * * * * 20:00 * * * * * * * * * * * * * * * * * 21:00 * * * * * * * * * * * * * * * * * 22:00 * * * * * * * * * * * * * * * * * 23:00 * * * * * * * * * * * * * * * * * Total Percent 0.0% 0.0% 0.0% 0.0% 0.0% 0.0% 0.0% 0.0% 0.0% 0.0% 0.0% 0.0% 0.0% 0.0% AM Peak Vol. PM Peak Vol. Total Percent 3.5% 0.1% 0.5% 1.9% 16.0% 53.7% 21.9% 2.0% 0.2% 0.0% 0.0% 0.0% 0.0% 0.0% 15th Percentile : 32 MPH 50th Percentile : 37 MPH 85th Percentile : 42 MPH 95th Percentile : 44 MPH CMT Columbus, Ohio Page 18 Stats 10 MPH Pace Speed : MPH Number in Pace : Percent in Pace : 75.6% Number of Vehicles > 35 MPH : Percent of Vehicles > 35 MPH : 78.0% Mean Speed(Average) : 37 MPH
70 75 ft north of East Site Code: EAST Station ID: Untitled S Date Start: 31-Jan-16 Date End: 08-Feb-16 SB Shroyer, NB Shroyer Start Pace Number Time Total Speed in Pace 02/01/ : : : : : : : : : : : PM : : : : : : : : : : : Total Percent 3.6% 0.1% 0.7% 3.4% 23.8% 47.8% 18.0% 2.2% 0.2% 0.0% 0.0% 0.0% 0.0% 0.0% AM Peak 07:00 05:00 09:00 10:00 07:00 07:00 07:00 07:00 07:00 10:00 01:00 08:00 07:00 Vol PM Peak 17:00 14:00 15:00 15:00 17:00 17:00 17:00 14:00 14:00 12:00 12:00 20:00 18:00 17:00 Vol CMT Columbus, Ohio Page 20
71 75 ft north of East Site Code: EAST Station ID: Untitled S Date Start: 31-Jan-16 Date End: 08-Feb-16 SB Shroyer, NB Shroyer Start Pace Number Time Total Speed in Pace 02/02/ : : : : : : : : : : : PM : : : : : : : : : : : Total Percent 3.9% 0.1% 0.8% 3.1% 22.9% 47.6% 19.5% 1.8% 0.2% 0.0% 0.0% 0.0% 0.0% 0.0% AM Peak 07:00 09:00 11:00 07:00 07:00 07:00 07:00 07:00 08:00 07:00 01:00 01:00 01:00 07:00 Vol PM Peak 17:00 20:00 17:00 19:00 16:00 17:00 17:00 14:00 17:00 15:00 12:00 13:00 17:00 Vol CMT Columbus, Ohio Page 21
72 75 ft north of East Site Code: EAST Station ID: Untitled S Date Start: 31-Jan-16 Date End: 08-Feb-16 SB Shroyer, NB Shroyer Start Pace Number Time Total Speed in Pace 02/03/ : : : : : : : : : : : PM : : : : : : : : : : : Total Percent 4.0% 0.2% 0.8% 3.2% 19.6% 46.7% 22.4% 2.8% 0.3% 0.0% 0.0% 0.0% 0.0% 0.0% AM Peak 07:00 08:00 11:00 08:00 08:00 07:00 07:00 07:00 07:00 11:00 08:00 07:00 07:00 Vol PM Peak 17:00 17:00 17:00 17:00 17:00 17:00 15:00 14:00 15:00 12:00 16:00 15:00 17:00 Vol CMT Columbus, Ohio Page 22
73 75 ft north of East Site Code: EAST Station ID: Untitled S Date Start: 31-Jan-16 Date End: 08-Feb-16 SB Shroyer, NB Shroyer Start Pace Number Time Total Speed in Pace 02/04/ : : : : : : : : : : : PM : : : : : : : : : : : Total Percent 4.6% 0.1% 0.7% 3.3% 23.5% 46.6% 18.4% 2.2% 0.4% 0.0% 0.0% 0.0% 0.0% 0.1% AM Peak 07:00 08:00 08:00 10:00 08:00 07:00 07:00 07:00 11:00 07:00 07:00 08:00 07:00 Vol PM Peak 17:00 15:00 16:00 15:00 17:00 17:00 16:00 12:00 12:00 13:00 18:00 15:00 17:00 Vol CMT Columbus, Ohio Page 23
74 75 ft north of East Site Code: EAST Station ID: Untitled S Date Start: 31-Jan-16 Date End: 08-Feb-16 SB Shroyer, NB Shroyer Start Pace Number Time Total Speed in Pace 02/05/ : : : : : : : : : : : PM : : : : : : : : : : : Total Percent 4.4% 0.1% 0.9% 3.0% 19.3% 45.8% 23.1% 2.9% 0.3% 0.1% 0.0% 0.0% 0.0% 0.0% AM Peak 07:00 05:00 10:00 07:00 07:00 08:00 07:00 10:00 11:00 07:00 07:00 06:00 08:00 07:00 Vol PM Peak 16:00 16:00 16:00 19:00 17:00 17:00 15:00 15:00 15:00 14:00 14:00 15:00 16:00 17:00 Vol CMT Columbus, Ohio Page 24
75 75 ft north of East Site Code: EAST Station ID: Untitled S Date Start: 31-Jan-16 Date End: 08-Feb-16 SB Shroyer, NB Shroyer Start Pace Number Time Total Speed in Pace 02/08/ * * 01: * * 02: * * 03: * * 04: * * 05: * * 06: * * 07: * * 08: * * 09:00 * * * * * * * * * * * * * * * * * 10:00 * * * * * * * * * * * * * * * * * 11:00 * * * * * * * * * * * * * * * * * 12 PM * * * * * * * * * * * * * * * * * 13:00 * * * * * * * * * * * * * * * * * 14:00 * * * * * * * * * * * * * * * * * 15:00 * * * * * * * * * * * * * * * * * 16:00 * * * * * * * * * * * * * * * * * 17:00 * * * * * * * * * * * * * * * * * 18:00 * * * * * * * * * * * * * * * * * 19:00 * * * * * * * * * * * * * * * * * 20:00 * * * * * * * * * * * * * * * * * 21:00 * * * * * * * * * * * * * * * * * 22:00 * * * * * * * * * * * * * * * * * 23:00 * * * * * * * * * * * * * * * * * Total Percent 0.0% 0.0% 0.0% 0.0% 0.0% 0.0% 0.0% 0.0% 0.0% 0.0% 0.0% 0.0% 0.0% 0.0% AM Peak Vol. PM Peak Vol. Total Percent 4.0% 0.1% 0.8% 3.2% 21.9% 46.9% 20.3% 2.4% 0.3% 0.0% 0.0% 0.0% 0.0% 0.0% 15th Percentile : 31 MPH 50th Percentile : 37 MPH 85th Percentile : 41 MPH 95th Percentile : 44 MPH CMT Columbus, Ohio Page 27 Stats 10 MPH Pace Speed : MPH Number in Pace : Percent in Pace : 68.8% Number of Vehicles > 35 MPH : Percent of Vehicles > 35 MPH : 69.9% Mean Speed(Average) : 37 MPH
76 CMT Columbus, Ohio Page 2 Site Code: LONSDALESENAL Station ID: Untitled Vo Date Start: 31-Jan-16 Date End: 08-Feb-16 Start 01-Feb-16 SB Shroyer Hour Totals NB Shroyer Hour Totals Combined Totals Time Mon Morning Afternoon Morning Afternoon Morning Afternoon Morning Afternoon Morning Afternoon 12: : : : : : : : : : : : : : : : : : : : : : : : : : : : : : : : : : : : : : : : : : : : : : : : Total Percent 32.9% 67.1% 36.6% 63.4% 34.8% 65.2%
77 CMT Columbus, Ohio Page 3 Site Code: LONSDALESENAL Station ID: Untitled Vo Date Start: 31-Jan-16 Date End: 08-Feb-16 Start 02-Feb-16 SB Shroyer Hour Totals NB Shroyer Hour Totals Combined Totals Time Tue Morning Afternoon Morning Afternoon Morning Afternoon Morning Afternoon Morning Afternoon 12: : : : : : : : : : : : : : : : : : : : : : : : : : : : : : : : : : : : : : : : : : : : : : : : Total Percent 31.9% 68.1% 37.6% 62.4% 34.8% 65.2%
78 CMT Columbus, Ohio Page 4 Site Code: LONSDALESENAL Station ID: Untitled Vo Date Start: 31-Jan-16 Date End: 08-Feb-16 Start 03-Feb-16 SB Shroyer Hour Totals NB Shroyer Hour Totals Combined Totals Time Wed Morning Afternoon Morning Afternoon Morning Afternoon Morning Afternoon Morning Afternoon 12: : : : : : : : : : : : : : : : : : : : : : : : : : : : : : : : : : : : : : : : : : : : : : : : Total Percent 32.3% 67.7% 36.3% 63.7% 34.4% 65.6%
79 CMT Columbus, Ohio Page 5 Site Code: LONSDALESENAL Station ID: Untitled Vo Date Start: 31-Jan-16 Date End: 08-Feb-16 Start 04-Feb-16 SB Shroyer Hour Totals NB Shroyer Hour Totals Combined Totals Time Thu Morning Afternoon Morning Afternoon Morning Afternoon Morning Afternoon Morning Afternoon 12: : : : : : : : : : : : : : : : : : : : : : : : : : : : : : : : : : : : : : : : : : : : : : : : Total Percent 32.4% 67.6% 37.3% 62.7% 34.9% 65.1%
80 CMT Columbus, Ohio Page 6 Site Code: LONSDALESENAL Station ID: Untitled Vo Date Start: 31-Jan-16 Date End: 08-Feb-16 Start 05-Feb-16 SB Shroyer Hour Totals NB Shroyer Hour Totals Combined Totals Time Fri Morning Afternoon Morning Afternoon Morning Afternoon Morning Afternoon Morning Afternoon 12: : : : : : : : : : : : : : : : : : : : : : : : : : : : : : : : : : : : : : : : : : : : : : : : Total Percent 31.4% 68.6% 34.2% 65.8% 32.8% 67.2%
81 75ft north of Lonsdale Site Code: LONSDALE Station ID: Untitled S Date Start: 31-Jan-16 Date End: 08-Feb-16 NB Shroyer Start Pace Number Time Total Speed in Pace 02/01/ : : : : : : : : : : : PM : : : : : : : : : : : Total Percent 0.6% 0.1% 0.3% 1.7% 7.3% 32.3% 40.1% 14.8% 2.4% 0.3% 0.1% 0.0% 0.0% 0.1% AM Peak 07:00 09:00 09:00 11:00 07:00 07:00 07:00 08:00 08:00 07:00 06:00 01:00 07:00 07:00 Vol PM Peak 12:00 13:00 12:00 14:00 17:00 17:00 15:00 15:00 15:00 17:00 17:00 12:00 17:00 Vol CMT Columbus, Ohio Page 2
82 75ft north of Lonsdale Site Code: LONSDALE Station ID: Untitled S Date Start: 31-Jan-16 Date End: 08-Feb-16 NB Shroyer Start Pace Number Time Total Speed in Pace 02/02/ : : : : : : : : : : : PM : : : : : : : : : : : Total Percent 0.9% 0.1% 0.3% 1.8% 7.7% 26.7% 39.6% 18.0% 4.1% 0.5% 0.1% 0.0% 0.0% 0.1% AM Peak 07:00 11:00 08:00 11:00 07:00 07:00 07:00 07:00 07:00 07:00 11:00 06:00 01:00 08:00 07:00 Vol PM Peak 16:00 16:00 16:00 16:00 16:00 17:00 17:00 15:00 17:00 21:00 13:00 14:00 12:00 18:00 17:00 Vol CMT Columbus, Ohio Page 3
83 75ft north of Lonsdale Site Code: LONSDALE Station ID: Untitled S Date Start: 31-Jan-16 Date End: 08-Feb-16 NB Shroyer Start Pace Number Time Total Speed in Pace 02/03/ : : : : : : : : : : : PM : : : : : : : : : : : Total Percent 1.3% 1.0% 1.0% 2.7% 6.8% 26.0% 39.1% 18.1% 3.3% 0.5% 0.1% 0.0% 0.0% 0.1% AM Peak 07:00 00:00 11:00 11:00 07:00 07:00 07:00 07:00 11:00 08:00 11:00 06:00 08:00 07:00 Vol PM Peak 17:00 16:00 16:00 16:00 16:00 17:00 15:00 15:00 15:00 14:00 12:00 18:00 19:00 12:00 17:00 Vol CMT Columbus, Ohio Page 4
84 75ft north of Lonsdale Site Code: LONSDALE Station ID: Untitled S Date Start: 31-Jan-16 Date End: 08-Feb-16 NB Shroyer Start Pace Number Time Total Speed in Pace 02/04/ : : : : : : : : : : : PM : : : : : : : : : : : Total Percent 1.6% 0.1% 0.3% 1.9% 7.9% 29.1% 38.1% 16.7% 3.3% 0.6% 0.1% 0.1% 0.0% 0.1% AM Peak 07:00 10:00 07:00 10:00 10:00 07:00 07:00 07:00 11:00 11:00 06:00 11:00 08:00 07:00 Vol PM Peak 18:00 15:00 12:00 12:00 17:00 17:00 16:00 15:00 15:00 13:00 13:00 16:00 23:00 17:00 17:00 Vol CMT Columbus, Ohio Page 5
85 75ft north of Lonsdale Site Code: LONSDALE Station ID: Untitled S Date Start: 31-Jan-16 Date End: 08-Feb-16 NB Shroyer Start Pace Number Time Total Speed in Pace 02/05/ : : : : : : : : : : : PM : : : : : : : : : : : Total Percent 1.1% 0.1% 0.4% 1.5% 6.6% 26.0% 38.4% 19.7% 4.9% 0.8% 0.2% 0.1% 0.0% 0.2% AM Peak 07:00 07:00 10:00 10:00 07:00 07:00 07:00 07:00 07:00 08:00 05:00 07:00 08:00 07:00 07:00 Vol PM Peak 16:00 12:00 15:00 15:00 17:00 17:00 15:00 13:00 13:00 13:00 16:00 12:00 19:00 15:00 17:00 Vol CMT Columbus, Ohio Page 6
86 75ft north of Lonsdale Site Code: LONSDALE Station ID: Untitled S Date Start: 31-Jan-16 Date End: 08-Feb-16 NB Shroyer Start Pace Number Time Total Speed in Pace 02/08/ * * 01: * * 02: * * 03: * * 04: * * 05: * * 06: * * 07: * * 08: * * 09: * * 10:00 * * * * * * * * * * * * * * * * * 11:00 * * * * * * * * * * * * * * * * * 12 PM * * * * * * * * * * * * * * * * * 13:00 * * * * * * * * * * * * * * * * * 14:00 * * * * * * * * * * * * * * * * * 15:00 * * * * * * * * * * * * * * * * * 16:00 * * * * * * * * * * * * * * * * * 17:00 * * * * * * * * * * * * * * * * * 18:00 * * * * * * * * * * * * * * * * * 19:00 * * * * * * * * * * * * * * * * * 20:00 * * * * * * * * * * * * * * * * * 21:00 * * * * * * * * * * * * * * * * * 22:00 * * * * * * * * * * * * * * * * * 23:00 * * * * * * * * * * * * * * * * * Total Percent 0.0% 0.0% 0.0% 0.0% 0.0% 0.0% 0.0% 0.0% 0.0% 0.0% 0.0% 0.0% 0.0% 0.0% AM Peak Vol. PM Peak Vol. Total Percent 1.0% 0.2% 0.5% 1.9% 7.1% 28.0% 39.1% 17.5% 3.6% 0.6% 0.1% 0.1% 0.0% 0.2% 15th Percentile : 35 MPH 50th Percentile : 41 MPH 85th Percentile : 46 MPH 95th Percentile : 49 MPH CMT Columbus, Ohio Page 9 Stats 10 MPH Pace Speed : MPH Number in Pace : Percent in Pace : 67.1% Number of Vehicles > 35 MPH : Percent of Vehicles > 35 MPH : 89.2% Mean Speed(Average) : 41 MPH
87 75ft north of Lonsdale Site Code: LONSDALE Station ID: Untitled S Date Start: 31-Jan-16 Date End: 08-Feb-16 SB Shroyer Start Pace Number Time Total Speed in Pace 02/01/ : : : : : : : : : : : PM : : : : : : : : : : : Total Percent 0.5% 0.2% 0.5% 2.7% 13.0% 40.1% 34.2% 8.0% 0.7% 0.0% 0.0% 0.0% 0.0% 0.0% AM Peak 07:00 05:00 08:00 07:00 07:00 07:00 07:00 10:00 10:00 10:00 07:00 Vol PM Peak 17:00 16:00 16:00 12:00 17:00 17:00 15:00 15:00 12:00 14:00 14:00 17:00 17:00 Vol CMT Columbus, Ohio Page 11
88 75ft north of Lonsdale Site Code: LONSDALE Station ID: Untitled S Date Start: 31-Jan-16 Date End: 08-Feb-16 SB Shroyer Start Pace Number Time Total Speed in Pace 02/02/ : : : : : : : : : : : PM : : : : : : : : : : : Total Percent 0.6% 0.1% 0.7% 2.0% 11.1% 34.5% 37.6% 11.5% 1.5% 0.3% 0.0% 0.0% 0.0% 0.0% AM Peak 11:00 11:00 07:00 07:00 07:00 11:00 10:00 07:00 09:00 10:00 07:00 Vol PM Peak 16:00 15:00 16:00 16:00 16:00 16:00 17:00 14:00 13:00 13:00 12:00 23:00 16:00 Vol CMT Columbus, Ohio Page 12
89 75ft north of Lonsdale Site Code: LONSDALE Station ID: Untitled S Date Start: 31-Jan-16 Date End: 08-Feb-16 SB Shroyer Start Pace Number Time Total Speed in Pace 02/03/ : : : : : : : : : : : PM : : : : : : : : : : : Total Percent 0.4% 0.1% 0.7% 3.0% 10.9% 29.7% 36.5% 15.6% 2.6% 0.3% 0.1% 0.0% 0.0% 0.1% AM Peak 07:00 08:00 05:00 09:00 11:00 07:00 07:00 07:00 11:00 08:00 03:00 07:00 07:00 Vol PM Peak 17:00 18:00 16:00 16:00 16:00 17:00 15:00 12:00 12:00 12:00 15:00 22:00 17:00 Vol CMT Columbus, Ohio Page 13
90 75ft north of Lonsdale Site Code: LONSDALE Station ID: Untitled S Date Start: 31-Jan-16 Date End: 08-Feb-16 SB Shroyer Start Pace Number Time Total Speed in Pace 02/04/ : : : : : : : : : : : PM : : : : : : : : : : : Total Percent 0.5% 0.1% 0.6% 4.5% 16.5% 39.1% 28.1% 7.3% 1.5% 0.5% 0.6% 0.2% 0.2% 0.3% AM Peak 07:00 07:00 07:00 11:00 07:00 07:00 07:00 07:00 09:00 11:00 07:00 09:00 06:00 11:00 07:00 Vol PM Peak 17:00 14:00 16:00 18:00 17:00 17:00 16:00 15:00 20:00 17:00 19:00 16:00 16:00 16:00 16:00 Vol CMT Columbus, Ohio Page 14
91 75ft north of Lonsdale Site Code: LONSDALE Station ID: Untitled S Date Start: 31-Jan-16 Date End: 08-Feb-16 SB Shroyer Start Pace Number Time Total Speed in Pace 02/05/ : : : : : : : : : : : PM : : : : : : : : : : : Total Percent 0.6% 0.3% 0.7% 2.8% 12.2% 33.1% 34.2% 12.5% 1.9% 0.6% 0.3% 0.3% 0.1% 0.2% AM Peak 07:00 08:00 09:00 07:00 07:00 11:00 11:00 11:00 10:00 08:00 08:00 09:00 08:00 08:00 11:00 Vol PM Peak 15:00 17:00 14:00 17:00 17:00 16:00 16:00 13:00 12:00 12:00 22:00 22:00 15:00 22:00 16:00 Vol CMT Columbus, Ohio Page 15
92 75ft north of Lonsdale Site Code: LONSDALE Station ID: Untitled S Date Start: 31-Jan-16 Date End: 08-Feb-16 SB Shroyer Start Pace Number Time Total Speed in Pace 02/08/ * * 01: * * 02: * * 03: * * 04: * * 05: * * 06: * * 07: * * 08: * * 09: * * 10:00 * * * * * * * * * * * * * * * * * 11:00 * * * * * * * * * * * * * * * * * 12 PM * * * * * * * * * * * * * * * * * 13:00 * * * * * * * * * * * * * * * * * 14:00 * * * * * * * * * * * * * * * * * 15:00 * * * * * * * * * * * * * * * * * 16:00 * * * * * * * * * * * * * * * * * 17:00 * * * * * * * * * * * * * * * * * 18:00 * * * * * * * * * * * * * * * * * 19:00 * * * * * * * * * * * * * * * * * 20:00 * * * * * * * * * * * * * * * * * 21:00 * * * * * * * * * * * * * * * * * 22:00 * * * * * * * * * * * * * * * * * 23:00 * * * * * * * * * * * * * * * * * Total Percent 0.0% 0.0% 0.0% 0.0% 0.0% 0.0% 0.0% 0.0% 0.0% 0.0% 0.0% 0.0% 0.0% 0.0% AM Peak Vol. PM Peak Vol. Total Percent 0.5% 0.2% 0.6% 3.0% 12.9% 35.5% 33.9% 10.8% 1.6% 0.4% 0.2% 0.1% 0.1% 0.1% 15th Percentile : 34 MPH 50th Percentile : 39 MPH 85th Percentile : 44 MPH 95th Percentile : 48 MPH CMT Columbus, Ohio Page 18 Stats 10 MPH Pace Speed : MPH Number in Pace : Percent in Pace : 69.4% Number of Vehicles > 35 MPH : Percent of Vehicles > 35 MPH : 82.7% Mean Speed(Average) : 40 MPH
93 75ft north of Lonsdale Site Code: LONSDALE Station ID: Untitled S Date Start: 31-Jan-16 Date End: 08-Feb-16 NB Shroyer, SB Shroyer Start Pace Number Time Total Speed in Pace 02/01/ : : : : : : : : : : : PM : : : : : : : : : : : Total Percent 0.6% 0.1% 0.4% 2.2% 10.0% 36.1% 37.2% 11.5% 1.6% 0.2% 0.1% 0.0% 0.0% 0.1% AM Peak 07:00 05:00 09:00 11:00 07:00 07:00 07:00 10:00 10:00 07:00 10:00 01:00 07:00 07:00 Vol PM Peak 17:00 16:00 12:00 17:00 17:00 17:00 15:00 15:00 15:00 17:00 17:00 17:00 17:00 Vol CMT Columbus, Ohio Page 20
94 75ft north of Lonsdale Site Code: LONSDALE Station ID: Untitled S Date Start: 31-Jan-16 Date End: 08-Feb-16 NB Shroyer, SB Shroyer Start Pace Number Time Total Speed in Pace 02/02/ : : : : : : : : : : : PM : : : : : : : : : : : Total Percent 0.8% 0.1% 0.5% 1.9% 9.3% 30.5% 38.6% 14.8% 2.8% 0.4% 0.1% 0.0% 0.0% 0.1% AM Peak 07:00 11:00 08:00 07:00 07:00 07:00 07:00 07:00 07:00 03:00 11:00 06:00 01:00 08:00 07:00 Vol PM Peak 16:00 15:00 16:00 16:00 16:00 16:00 17:00 14:00 14:00 21:00 21:00 14:00 12:00 18:00 16:00 Vol CMT Columbus, Ohio Page 21
95 75ft north of Lonsdale Site Code: LONSDALE Station ID: Untitled S Date Start: 31-Jan-16 Date End: 08-Feb-16 NB Shroyer, SB Shroyer Start Pace Number Time Total Speed in Pace 02/03/ : : : : : : : : : : : PM : : : : : : : : : : : Total Percent 0.8% 0.6% 0.8% 2.9% 8.9% 27.9% 37.8% 16.8% 3.0% 0.4% 0.1% 0.0% 0.0% 0.1% AM Peak 07:00 11:00 11:00 11:00 07:00 07:00 07:00 07:00 11:00 08:00 11:00 06:00 08:00 07:00 Vol PM Peak 17:00 16:00 16:00 16:00 16:00 17:00 15:00 12:00 15:00 14:00 12:00 18:00 19:00 12:00 17:00 Vol CMT Columbus, Ohio Page 22
96 75ft north of Lonsdale Site Code: LONSDALE Station ID: Untitled S Date Start: 31-Jan-16 Date End: 08-Feb-16 NB Shroyer, SB Shroyer Start Pace Number Time Total Speed in Pace 02/04/ : : : : : : : : : : : PM : : : : : : : : : : : Total Percent 1.1% 0.1% 0.4% 3.1% 11.9% 33.8% 33.4% 12.3% 2.5% 0.5% 0.4% 0.2% 0.1% 0.2% AM Peak 07:00 07:00 07:00 11:00 07:00 07:00 07:00 07:00 11:00 11:00 06:00 11:00 06:00 09:00 07:00 Vol PM Peak 17:00 14:00 16:00 18:00 17:00 17:00 16:00 15:00 13:00 13:00 17:00 16:00 16:00 16:00 16:00 Vol CMT Columbus, Ohio Page 23
97 75ft north of Lonsdale Site Code: LONSDALE Station ID: Untitled S Date Start: 31-Jan-16 Date End: 08-Feb-16 NB Shroyer, SB Shroyer Start Pace Number Time Total Speed in Pace 02/05/ : : : : : : : : : : : PM : : : : : : : : : : : Total Percent 0.8% 0.2% 0.6% 2.1% 9.2% 29.3% 36.5% 16.4% 3.5% 0.7% 0.2% 0.2% 0.1% 0.2% AM Peak 07:00 07:00 05:00 07:00 07:00 07:00 11:00 11:00 07:00 08:00 08:00 09:00 08:00 07:00 11:00 Vol PM Peak 16:00 12:00 16:00 17:00 17:00 17:00 16:00 13:00 13:00 13:00 22:00 22:00 15:00 17:00 16:00 Vol CMT Columbus, Ohio Page 24
98 75ft north of Lonsdale Site Code: LONSDALE Station ID: Untitled S Date Start: 31-Jan-16 Date End: 08-Feb-16 NB Shroyer, SB Shroyer Start Pace Number Time Total Speed in Pace 02/08/ * * 01: * * 02: * * 03: * * 04: * * 05: * * 06: * * 07: * * 08: * * 09: * * 10:00 * * * * * * * * * * * * * * * * * 11:00 * * * * * * * * * * * * * * * * * 12 PM * * * * * * * * * * * * * * * * * 13:00 * * * * * * * * * * * * * * * * * 14:00 * * * * * * * * * * * * * * * * * 15:00 * * * * * * * * * * * * * * * * * 16:00 * * * * * * * * * * * * * * * * * 17:00 * * * * * * * * * * * * * * * * * 18:00 * * * * * * * * * * * * * * * * * 19:00 * * * * * * * * * * * * * * * * * 20:00 * * * * * * * * * * * * * * * * * 21:00 * * * * * * * * * * * * * * * * * 22:00 * * * * * * * * * * * * * * * * * 23:00 * * * * * * * * * * * * * * * * * Total Percent 0.0% 0.0% 0.0% 0.0% 0.0% 0.0% 0.0% 0.0% 0.0% 0.0% 0.0% 0.0% 0.0% 0.0% AM Peak Vol. PM Peak Vol. Total Percent 0.8% 0.2% 0.5% 2.4% 9.9% 31.6% 36.6% 14.3% 2.7% 0.5% 0.2% 0.1% 0.0% 0.1% 15th Percentile : 35 MPH 50th Percentile : 40 MPH 85th Percentile : 45 MPH 95th Percentile : 49 MPH CMT Columbus, Ohio Page 27 Stats 10 MPH Pace Speed : MPH Number in Pace : Percent in Pace : 68.2% Number of Vehicles > 35 MPH : Percent of Vehicles > 35 MPH : 86.1% Mean Speed(Average) : 41 MPH
99 CMT Columbus, Ohio Page 2 Site Code: 25EAST Station ID: SHROYERLONSDALE_VOL Date Start: 31-Jan-16 Date End: 08-Feb-16 Start 01-Feb-16 NB Shroyer Hour Totals SB Shroyer Hour Totals Combined Totals Time Mon Morning Afternoon Morning Afternoon Morning Afternoon Morning Afternoon Morning Afternoon 12: : : : : : : : : : : : : : : : : : : : : : : : : : : : : : : : : : : : : : : : : : : : : : : : Total Percent 38.6% 61.4% 33.1% 66.9% 35.9% 64.1%
100 CMT Columbus, Ohio Page 3 Site Code: 25EAST Station ID: SHROYERLONSDALE_VOL Date Start: 31-Jan-16 Date End: 08-Feb-16 Start 02-Feb-16 NB Shroyer Hour Totals SB Shroyer Hour Totals Combined Totals Time Tue Morning Afternoon Morning Afternoon Morning Afternoon Morning Afternoon Morning Afternoon 12: : : : : : : : : : : : : : : : : : : : : : : : : : : : : : : : : : : : : : : : : : : : : : : : Total Percent 38.0% 62.0% 32.3% 67.7% 35.2% 64.8%
101 CMT Columbus, Ohio Page 4 Site Code: 25EAST Station ID: SHROYERLONSDALE_VOL Date Start: 31-Jan-16 Date End: 08-Feb-16 Start 03-Feb-16 NB Shroyer Hour Totals SB Shroyer Hour Totals Combined Totals Time Wed Morning Afternoon Morning Afternoon Morning Afternoon Morning Afternoon Morning Afternoon 12: : : : : : : : : : : : : : : : : : : : : : : : : : : : : : : : : : : : : : : : : : : : : : : : Total Percent 38.0% 62.0% 33.1% 66.9% 35.5% 64.5%
102 CMT Columbus, Ohio Page 5 Site Code: 25EAST Station ID: SHROYERLONSDALE_VOL Date Start: 31-Jan-16 Date End: 08-Feb-16 Start 04-Feb-16 NB Shroyer Hour Totals SB Shroyer Hour Totals Combined Totals Time Thu Morning Afternoon Morning Afternoon Morning Afternoon Morning Afternoon Morning Afternoon 12: : : : : : : : : : : : : : : : : : : : : : : : : : : : : : : : : : : : : : : : : : : : : : : : Total Percent 38.0% 62.0% 34.2% 65.8% 36.2% 63.8%
103 CMT Columbus, Ohio Page 6 Site Code: 25EAST Station ID: SHROYERLONSDALE_VOL Date Start: 31-Jan-16 Date End: 08-Feb-16 Start 05-Feb-16 NB Shroyer Hour Totals SB Shroyer Hour Totals Combined Totals Time Fri Morning Afternoon Morning Afternoon Morning Afternoon Morning Afternoon Morning Afternoon 12: : : : : : : : : : : : : : : : : : : : : : : : : : : : : : : : : : : : : : : : : : : : : : : : Total Percent 36.8% 63.2% 23.8% 76.2% 30.8% 69.2%
104 Shroyer Road Safety Study APPENDIX D: CRASH DIAGRAMS

105 Location Map Dorothy Lane PDO - 08:00 WED 03/27/2013 CD PDO - 11:00 MON 07/11/2011 CD INJ - 14:00 TUE 05/29/2012 CD PDO - 18:00 THU 10/24/2013 CW PDO - 13:00 WED 02/26/2014 CD INJ - 15:00 SAT 10/12/2013 CD PDO - 14:00 MON 04/27/2014 CD INJ - 07:00 MON 11/04/2013 CD INJ - 10:00 THU 02/21/2013 CD PDO - 20:00 FRI 11/15/2013 CD PDO - 17:00 FRI 10/28/2011 CD INJ - 20:00 MON 09/15/2014 RW INJ - 12:00 SAT 04/06/2011 RW PDO - 12:00 FRI 09/22/2011 CD PDO - 15:00 FRI 12/03/2010 CD PDO - 17:00 TUE 03/11/2014 CD PDO - 11:00 WED 12/31/2014 CD PDO - 13:00 THU 09/21/2014 CD PDO - 22:00 THU 09/12/2011 CD INJ - 09:00 SAT 02/18/2 PDO - 19:00 WED 07/12/2010 CD PDO - 13:00 TUE 09/06/2011 CD PDO - 08:00 WED 08/04/2010 CD PDO - 15:00 THU 08/08/2013 CD Shroyer Road Shroyer Road INJ - 12:00 MON 09/12/2014 CD PDO - 07:00 TUE 03/12/2011 CD PDO - 13:00 THU 09/22/2010 CD PDO - 20:00 WED 10/02/2013 CD PDO - 19:00 FRI 08/27/2010 CD INJ - 07:00 MON 06/09/2014 CD INJ - 07:00 WED 01/13/2010 CD PDO - 12:00 MON 09/29/2014 CD PDO - 14:00 WED 12/15/2 PDO - 08:00 SAT 07/30/2011 CW PDO - 02:00 THU 12/27/2012 SS PDO - 21:00 FR PDO - 16:00 TUE 06/21/2011 RW PDO - 09:00 S INJ - 21:00 MON 06/13/2011 CD PDO - 08:00 FRI 09/06/2013 CD PDO - 17:00 TUE 11/29/2011 RW PDO - 15:00 SUN 08/08/2010 CD PDO - 12:00 WED 05/22/2012 CD PDO - 00:00 SAT 09/14/2013 CD PDO - 17:00 THU 10/24/2013 CW INJ - 18:00 PDO - 18:00 SUN 04/24/2011 RW PDO - 2 PDO - 15:00 FRI 02/14/2014 SS PDO - 11:00 WED 08/11/2010 CW PDO - 20:00 MON 11/28/2011 RW PDO - 11:00 FRI 06/12/2012 RW PDO - 16:00 THU 12/15/2011 CD PDO INJ - 08:00 SAT 09/06/2014 CD PDO - 23:00 FRI 10/26/2012 RW PDO - 18:00 MON 04/11/2011 CW PDO - 17:00 SAT 07/16/2011 CD INJ - 14:00 MON 07/29/2013 CD INJ - 18:00 MON 12/17/2012 CW PDO - 09:00 THU 07/10/2014 CD INJ - 14:00 MON 04/01/2013 CD INJ - 16:00 FRI 02/12/2013 CD PDO - 07:00 TUE 09/22/2014 RW INJ - 16:00 SUN 09/19/2010 DC PDO - 09:00 TUE 10/18/2011 CD PDO - 12:00 SAT 09/15/2012 CD PDO - 15:00 SUN 09/22/2012 CW PDO - 12:00 WED 12/02/2010 CD PDO - 18:00 FRI 11/18/2011 CD INJ - 12:00 TUE 06/08/2010 CD PDO - 12:00 FRI 08/23/2013 CD PDO - 13:00 FRI 08/29/2014 CD PDO - 07:00 WED 12/17/2014 CW PDO - 13:00 MON 10/08/2012 CD PDO - 18:00 MON 11/28/2011 RW Dorothy Lane PDO - 07:00 MON 11/18/2013 CD PDO - 12:00 TUE 05/08/2012 CD INJ - 14:00 MON 04/12/2013 CD ACCIDENT COUNT 27 - Property Damage Crash 14 - Injury Crash 0 - Fatal Crash 4 RW 13 RW LEGEND TYPES OF CRASHES SYMBOLS WEATHER CONDITION Rear End Right Angle Side Swipe Out of Control Left Turn Head On * Moving Vehicle Stopped Vehicle Bicycle Pedstrian X C R S Not Stated Clear Rain Snow Animal Vehicle at Fault F H Fog Heavy Wind X D W S ROAD CONDITION Not Stated Dry Wet Snow SEVERITY PDO - Property Damage Only INJ - Injury FAT - Fatal I M Ice Mud/Sand Service Layer Credits: Sources: Esri, HERE, DeLorme, Intermap, increment P Corp., GEBCO, USGS, FAO, NPS, NRCAN, GeoBase, IGN, Kadaster NL, Ordnance Survey, Esri Japan, METI, Esri China (Hong Kong), swisstopo, MapmyIndia, OpenStreetMap contributors, and the GIS User Community CRASH DIAGRAM LOG POINT TO PERIOD 5 Years FROM 2010 TO 2014 JURISDICTION Kettering / Oakwood ROUTE NAME / NUMBER Dorothy Lane / CR-612 Crawford, Murphy & Tilly Engineers & Consultants, Suite 150 Columbus, OH DATE: December 15, 2015 PAGE: 01 of 11
106 INJ - 14:00 TUE 05/29/2012 CD PDO - 14:00 MON 04/27/2014 CD INJ - 07:00 MON 11/04/2013 CD PDO - 13:00 WED 02/26/2014 CD INJ - 15:00 SAT 10/12/2013 CD PDO - 09:00 TUE 10/18/2011 CD PDO - 12:00 SAT 09/15/2012 CD Location Map Dorothy Lane 436 PDO - 11:00 MON 07/11/2011 CD PDO - 08:00 WED 03/27/2013 CD PDO - 18:00 THU 10/24/2013 CW 437 Brydon Road Shroyer Road PDO - 18:00 TUE 08/06/2013 CD PDO - 17:00 FRI 08/22/2014 RW INJ - 13:00 SAT 07/06/2013 RW PDO - 17:00 TUE 11/29/2011 RW PDO - 15:00 SUN 08/08/2010 CD PDO - 12:00 WED 05/22/2012 CD PDO - 15:00 FRI 02/14/2014 SS PDO - 11:00 WED 08/11/2010 CW PDO - 18:00 MON 04/11/2011 CW PDO - 20:00 MON 11/28/2011 RW PDO - 11:00 FRI 06/12/2012 RW PDO - 12:00 FRI 09/22/2011 CD INJ - 12:00 SAT 04/06/2011 RW INJ - 07:00 MON 06/09/2014 CD INJ - 07:00 WED 01/13/2010 CD PDO - 19:00 FRI 08/27/2010 CD INJ - 16:00 FRI 02/12/2013 CD PDO - 13:00 THU 09/22/2010 CD PDO - 20:00 WED 10/02/2013 CD PDO - 09:00 THU 07/10/2014 CD INJ - 14:00 MON 04/01/2013 CD PDO - 15:00 THU 08/08/2013 CD INJ - 08:00 SAT 09/06/2014 CD PDO - 23:00 FRI 10/26/2012 RW PDO - 17:00 FRI 10/28/2011 CD INJ - 20:00 MON 09/15/2014 RW INJ - 10:00 THU 02/21/2013 CD PDO - 20:00 FRI 11/15/2013 CD PDO - 08:00 FRI 09/06/2013 CD PDO - 08:00 WED 08/04/2010 CD INJ - 21:00 MON 06/13/2011 CD PDO - 16:00 TUE 06/21/2011 RW PDO - 17:00 THU 10/24/2013 CW PDO - 18:00 SUN 04/24/2011 RW INJ - 14:00 MON 07/29/2013 CD INJ - 12:00 MON 09/12/2014 CD PDO - 16:00 THU 12/15/2011 CD PDO - 17:00 SAT 07/16/2011 CD PDO - 13:00 THU 09/21/2014 CD PDO - 12:00 MON 09/29/2014 CD PDO - 13:00 TUE 09/06/2011 CD PDO - 02:00 THU 12/27/2012 SS PDO - 00:00 SAT 09/14/2013 CD PDO - 17:00 TUE 03/11/2014 CD PDO - 08:00 SAT 07/30/2011 CW PDO - 11:00 WED 12/31/2014 CD PDO - 15:00 FRI 12/03/2010 CD PDO - 07:00 TUE 03/12/2011 CD PDO - 14:00 WED 12/15/2010 CD PDO - 21:00 FRI 08/09/2013 CD PDO - 09:00 SAT 08/27/2011 CD INJ - 18:00 TUE 03/26/2013 CD PDO - 21:00 FRI 05/18/2012 CD PDO - 22:00 THU 09/12/2011 CD INJ - 09:00 SAT 02/18/2012 CD PDO - 19:00 WED 07/12/2010 CD PDO - 22:00 FRI 11/13/2012 RW PDO - 18:00 THU 12/02/2011 SS PDO - 18:00 FRI 12/03/2010 CD PDO - 16:00 THR 10/27/2011 CD PDO - 07:00 FRI 08/15/2014 CD INJ - 18:00 MON 12/17/2012 CW 3030 PDO - 12:00 WED 12/02/2010 CD PDO - 15:00 SUN 09/22/2012 CW INJ - 16:00 SUN 09/19/2010 DC PDO - 07:00 TUE 09/22/2014 RW PDO - 12:00 FR INJ - 12:00 TUE 06/08/2010 CD PDO - 18:00 FRI 11/18/2011 CD ACCIDENT COUNT 36 - Property Damage Crash Injury Crash - Fatal Crash LEGEND TYPES OF CRASHES SYMBOLS WEATHER CONDITION Rear End Right Angle Side Swipe Out of Control Left Turn Head On * Moving Vehicle Stopped Vehicle Bicycle Pedstrian X C R S Not Stated Clear Rain Snow Animal Vehicle at Fault F H Fog Heavy Wind X D W S ROAD CONDITION Not Stated Dry Wet Snow SEVERITY PDO - Property Damage Only INJ - Injury FAT - Fatal I M Ice Mud/Sand Service Layer Credits: Sources: Esri, HERE, DeLorme, Intermap, increment P Corp., GEBCO, USGS, FAO, NPS, NRCAN, GeoBase, IGN, Kadaster NL, Ordnance Survey, Esri Japan, METI, Esri China (Hong Kong), swisstopo, MapmyIndia, OpenStreetMap contributors, and the GIS User Community CRASH DIAGRAM LOG POINT TO PERIOD 5 Years FROM 2010 TO 2014 JURISDICTION Kettering / Oakwood ROUTE NAME / NUMBER Shroyer Road / CR-609 Crawford, Murphy & Tilly Engineers & Consultants, Suite 150 Columbus, OH DATE: December 15, 2015 PAGE: 02 of 11

107 Location Map East Drive Claranna Avenue Shroyer Road PDO - 17:00 WED 09/14/2011 CD PDO - 17:00 SAT 08/06/2011 CD INJ - 12:00 FRI 09/30/2011 CD PDO - 16:00 MON 06/02/2014 RW PDO - 08:00 TUE 12/17/2013 CW PDO - 13:00 SUN 01/08/2012 CD PDO - 14:00 WED 03/27/2013 CD PDO - 11:00 FRI 04/04/2014 CW INJ - 13:00 SUN 05/01/2011 RW PDO - 13:00 SAT 03/30/2013 CD PDO - 14:00 FRI 06/06/2014 CD PDO - 14:00 TUE 12/11/2012 CD ACCIDENT COUNT 10 - Property Damage Crash 2 - Injury Crash 0 - Fatal Crash LEGEND TYPES OF CRASHES SYMBOLS WEATHER CONDITION Rear End Right Angle Side Swipe Out of Control Left Turn Head On * Moving Vehicle Stopped Vehicle Bicycle Pedstrian X C R S Not Stated Clear Rain Snow Animal Vehicle at Fault F H Fog Heavy Wind X D W S ROAD CONDITION Not Stated Dry Wet Snow SEVERITY PDO - Property Damage Only INJ - Injury FAT - Fatal I M Ice Mud/Sand Service Layer Credits: Sources: Esri, HERE, DeLorme, Intermap, increment P Corp., GEBCO, USGS, FAO, NPS, NRCAN, GeoBase, IGN, Kadaster NL, Ordnance Survey, Esri Japan, METI, Esri China (Hong Kong), swisstopo, MapmyIndia, OpenStreetMap contributors, and the GIS User Community CRASH DIAGRAM LOG POINT TO PERIOD 5 Years FROM 2010 TO 2014 JURISDICTION Kettering / Oakwood ROUTE NAME / NUMBER Shroyer Road / CR-609 Crawford, Murphy & Tilly Engineers & Consultants, Suite 150 Columbus, OH DATE: December 15, 2015 PAGE: 03 of 11

108 PDO - 07:00 FRI 02/04/2011 CD Location Map Wonderly Avenue Shroyer Road PDO - 19:00 FRI 12/10/2010 CD PDO - 15:00 TUE 08/05/2014 CD PDO - 15:00 SUN 06/06/2010 CD PDO - 15:00 WED 06/26/2013 CD PDO - 15:00 WED 06/26/2013 CD PDO - 12:00 WED 06/20/2012 CD INJ - 10:00 FRI 12/13/2013 CD PDO - 15:00 SUN 11/24/2013 CD PDO - 16:00 TUE 06/18/2013 CD PDO - 15:00 WED 07/30/2014 CW PDO - 16:00 FRI 05/14/2010 CD PDO - 12:00 MON 09/30/2013 RW PDO - 14:00 FRI 06/25/2010 CD Broad Blvd ACCIDENT COUNT 13 - Property Damage Crash 1 - Injury Crash 0 - Fatal Crash LEGEND TYPES OF CRASHES SYMBOLS WEATHER CONDITION Rear End Right Angle Side Swipe Out of Control Left Turn Head On * Moving Vehicle Stopped Vehicle Bicycle Pedstrian X C R S Not Stated Clear Rain Snow Animal Vehicle at Fault F H Fog Heavy Wind X D W S ROAD CONDITION Not Stated Dry Wet Snow SEVERITY PDO - Property Damage Only INJ - Injury FAT - Fatal I M Ice Mud/Sand Service Layer Credits: Sources: Esri, HERE, DeLorme, Intermap, increment P Corp., GEBCO, USGS, FAO, NPS, NRCAN, GeoBase, IGN, Kadaster NL, Ordnance Survey, Esri Japan, METI, Esri China (Hong Kong), swisstopo, MapmyIndia, OpenStreetMap contributors, and the GIS User Community CRASH DIAGRAM LOG POINT TO PERIOD 5 Years FROM 2010 TO 2014 JURISDICTION Kettering / Oakwood ROUTE NAME / NUMBER Shroyer Road / CR-609 Crawford, Murphy & Tilly Engineers & Consultants, Suite 150 Columbus, OH DATE: December 15, 2015 PAGE: 04 of 11

109 Location Map Triangle Avenue Shroyer Road PDO - 01:00 FRI 08/10/2012 RW PDO - 15:00 FRI 01/31/2014 CW W INJ - 11:00 THU 10/03/2013 CW PDO - 15:00 WED 12/01/2010 RW PDO - 20:00 SAT 08/06/2011 CD PDO - 15:00 MON 06/20/2011 CW PDO - 17:00 SAT 08/13/2011 CD 2330 Orchard Drive ACCIDENT COUNT 4 - Property Damage Crash 3 - Injury Crash 0 - Fatal Crash LEGEND TYPES OF CRASHES SYMBOLS WEATHER CONDITION Rear End Right Angle Side Swipe Out of Control Left Turn Head On * Moving Vehicle Stopped Vehicle Bicycle Pedstrian X C R S Not Stated Clear Rain Snow Animal Vehicle at Fault F H Fog Heavy Wind X D W S ROAD CONDITION Not Stated Dry Wet Snow SEVERITY PDO - Property Damage Only INJ - Injury FAT - Fatal I M Ice Mud/Sand Service Layer Credits: Sources: Esri, HERE, DeLorme, Intermap, increment P Corp., GEBCO, USGS, FAO, NPS, NRCAN, GeoBase, IGN, Kadaster NL, Ordnance Survey, Esri Japan, METI, Esri China (Hong Kong), swisstopo, MapmyIndia, OpenStreetMap contributors, and the GIS User Community CRASH DIAGRAM LOG POINT TO PERIOD 5 Years FROM 2010 TO 2014 JURISDICTION Kettering / Oakwood ROUTE NAME / NUMBER Shroyer Road / CR-609 Crawford, Murphy & Tilly Engineers & Consultants, Suite 150 Columbus, OH DATE: December 15, 2015 PAGE: 05 of 11

110 PDO - 08:00 WED 05/04/2011 CW INJ - 11:00 SAT 01/18/2014 CD Location Map Monteray Avenue Shroyer Road PDO - 07:00 SAT 11/16/2013 UU PDO - 10:00 THU 08/26/2010 CD INJ - 17:00 WED 12/03/2014 CD PDO - 15:00 SUN 0/24/2011 CW PDO - 22:00 THU 12/09/2010 CD INJ - 13:00 WED 12/12/2012 CD PDO - 17:00 FRI 01/13/2012 SS PDO - 13:00 TUE 06/24/2014 CD PDO - 02:00 WED 11/26/2014 CD PDO - 03:00 SUN 08/03/2014 CD Peach Orchard Road ACCIDENT COUNT 9 - Property Damage Crash 3 - Injury Crash 0 - Fatal Crash LEGEND TYPES OF CRASHES SYMBOLS WEATHER CONDITION Rear End Right Angle Side Swipe Out of Control Left Turn Head On * Moving Vehicle Stopped Vehicle Bicycle Pedstrian X C R S Not Stated Clear Rain Snow Animal Vehicle at Fault F H Fog Heavy Wind X D W S ROAD CONDITION Not Stated Dry Wet Snow SEVERITY PDO - Property Damage Only INJ - Injury FAT - Fatal I M Ice Mud/Sand Service Layer Credits: Sources: Esri, HERE, DeLorme, Intermap, increment P Corp., GEBCO, USGS, FAO, NPS, NRCAN, GeoBase, IGN, Kadaster NL, Ordnance Survey, Esri Japan, METI, Esri China (Hong Kong), swisstopo, MapmyIndia, OpenStreetMap contributors, and the GIS User Community CRASH DIAGRAM LOG POINT TO PERIOD 5 Years FROM 2010 TO 2014 JURISDICTION Kettering / Oakwood ROUTE NAME / NUMBER Shroyer Road / CR-609 Crawford, Murphy & Tilly Engineers & Consultants, Suite 150 Columbus, OH DATE: December 15, 2015 PAGE: 06 of 11

111 Location Map Corona Avenue Shroyer Road PDO - 18:00 THU 11/18/2010 CD PDO - 18:00 WED 09/19/2012 CD PDO - 14:00 MON 11/22/2010 CD PDO - 12:00 THU 08/08/2013 CD PDO - 13:00 SAT 06/29/2013 CD PDO - 15:00 sat 08/20/2011 CD 2100 Hadley Avenue PDO - 02:00 SUN 12/22/2013 CD ACCIDENT COUNT 6 - Property Damage Crash 1 - Injury Crash 0 - Fatal Crash LEGEND TYPES OF CRASHES SYMBOLS WEATHER CONDITION Rear End Right Angle Side Swipe Out of Control Left Turn Head On * Moving Vehicle Stopped Vehicle Bicycle Pedstrian X C R S Not Stated Clear Rain Snow Animal Vehicle at Fault F H Fog Heavy Wind X D W S ROAD CONDITION Not Stated Dry Wet Snow SEVERITY PDO - Property Damage Only INJ - Injury FAT - Fatal I M Ice Mud/Sand Service Layer Credits: Sources: Esri, HERE, DeLorme, Intermap, increment P Corp., GEBCO, USGS, FAO, NPS, NRCAN, GeoBase, IGN, Kadaster NL, Ordnance Survey, Esri Japan, METI, Esri China (Hong Kong), swisstopo, MapmyIndia, OpenStreetMap contributors, and the GIS User Community CRASH DIAGRAM LOG POINT TO PERIOD 5 Years FROM 2010 TO 2014 JURISDICTION Kettering / Oakwood ROUTE NAME / NUMBER Shroyer Road / CR-609 Crawford, Murphy & Tilly Engineers & Consultants, Suite 150 Columbus, OH DATE: December 15, 2015 PAGE: 07 of 11

112 Location Map 1901 Telford Avenue INJ - 13:00 TUE 12/16/2014 CD Shroyer Road PDO - 08:00 TUE 09/20/2011 CW INJ - 16:00 SUN 04/21/2013 CD INJ - 16:00 FRI 09/05/2014 CD INJ - 14:00 SAT 05/21/2011 CD INJ - 17:00 TUE 05/06/2014 CD PDO - 17:00 TUE 11/11/2014 RW PDO - 18:00 FRI 12/21/2012 RW INJ - 15:00 FRI 04/29/2011 CD PDO - 21:00 FRI 05/14/2010 CD PDO - 17:00 THU 11/03/2011 RW 1912 Wiltshire Blvd ACCIDENT COUNT 6 - Property Damage Crash 5 - Injury Crash 0 - Fatal Crash LEGEND TYPES OF CRASHES SYMBOLS WEATHER CONDITION Rear End Right Angle Side Swipe Out of Control Left Turn Head On * Moving Vehicle Stopped Vehicle Bicycle Pedstrian X C R S Not Stated Clear Rain Snow Animal Vehicle at Fault F H Fog Heavy Wind X D W S ROAD CONDITION Not Stated Dry Wet Snow SEVERITY PDO - Property Damage Only INJ - Injury FAT - Fatal I M Ice Mud/Sand Service Layer Credits: Sources: Esri, HERE, DeLorme, Intermap, increment P Corp., GEBCO, USGS, FAO, NPS, NRCAN, GeoBase, IGN, Kadaster NL, Ordnance Survey, Esri Japan, METI, Esri China (Hong Kong), swisstopo, MapmyIndia, OpenStreetMap contributors, and the GIS User Community CRASH DIAGRAM LOG POINT TO PERIOD 5 Years FROM 2010 TO 2014 JURISDICTION Kettering / Oakwood ROUTE NAME / NUMBER Shroyer Road / CR-609 Crawford, Murphy & Tilly Engineers & Consultants, Suite 150 Columbus, OH DATE: December 15, 2015 PAGE: 08 of 11

113 INJ - 23:00 FRI 02/17/2012 CD Location Map Forrer Blvd Shroyer Road INJ - 11:00 SAT 08/05/2014 CD INJ - 13:00 TUE 08/31/2010 CD PDO - 11:00 WED 05/05/2010 CD PDO - 15:00 THU 05/26/2011 RW PDO - 15:00 WED 12/11/2013 CD PDO - 15:00 WED 09/11/2013 CD INJ - 19:00 TUE 06/08/2010 RW PDO - 17:00 MON 06/21/2010 CD INJ - 17:00 FRI 03/18/2011 RW PDO - 07:00 TUE 02/21/2012 CD Aberdeen Avenue ACCIDENT COUNT 6 - Property Damage Crash 5 - Injury Crash 0 - Fatal Crash LEGEND TYPES OF CRASHES SYMBOLS WEATHER CONDITION Rear End Right Angle Side Swipe Out of Control Left Turn Head On * Moving Vehicle Stopped Vehicle Bicycle Pedstrian X C R S Not Stated Clear Rain Snow Animal Vehicle at Fault F H Fog Heavy Wind X D W S ROAD CONDITION Not Stated Dry Wet Snow SEVERITY PDO - Property Damage Only INJ - Injury FAT - Fatal I M Ice Mud/Sand Service Layer Credits: Sources: Esri, HERE, DeLorme, Intermap, increment P Corp., GEBCO, USGS, FAO, NPS, NRCAN, GeoBase, IGN, Kadaster NL, Ordnance Survey, Esri Japan, METI, Esri China (Hong Kong), swisstopo, MapmyIndia, OpenStreetMap contributors, and the GIS User Community CRASH DIAGRAM LOG POINT TO PERIOD 5 Years FROM 2010 TO 2014 JURISDICTION Kettering / Oakwood ROUTE NAME / NUMBER Shroyer Road / CR-609 Crawford, Murphy & Tilly Engineers & Consultants, Suite 150 Columbus, OH DATE: December 15, 2015 PAGE: 09 of 11

114 Location Map Lonsdale Avenue Shroyer Road PDO - 08:00 WED 05/02/2011 CW PDO - 14:00 TUE 04/10/2012 CD INJ - 15:00 WED 07/07/2010 CD PDO - 01:00 SAT 08/07/2010 CD PDO - 17:00 THU 11/13/2014 CD PDO - 17:00 THU 10/07/2010 CW Forrer Blvd. 504 ACCIDENT COUNT 5 - Property Damage Crash 1 - Injury Crash 0 - Fatal Crash LEGEND TYPES OF CRASHES SYMBOLS WEATHER CONDITION Rear End Right Angle Side Swipe Out of Control Left Turn Head On * Moving Vehicle Stopped Vehicle Bicycle Pedstrian X C R S Not Stated Clear Rain Snow Animal Vehicle at Fault F H Fog Heavy Wind X D W S ROAD CONDITION Not Stated Dry Wet Snow SEVERITY PDO - Property Damage Only INJ - Injury FAT - Fatal I M Ice Mud/Sand Service Layer Credits: Sources: Esri, HERE, DeLorme, Intermap, increment P Corp., GEBCO, USGS, FAO, NPS, NRCAN, GeoBase, IGN, Kadaster NL, Ordnance Survey, Esri Japan, METI, Esri China (Hong Kong), swisstopo, MapmyIndia, OpenStreetMap contributors, and the GIS User Community CRASH DIAGRAM LOG POINT TO PERIOD 5 Years FROM 2010 TO 2014 JURISDICTION Kettering / Oakwood ROUTE NAME / NUMBER Shroyer Road / CR-609 Crawford, Murphy & Tilly Engineers & Consultants, Suite 150 Columbus, OH DATE: December 15, 2015 PAGE: 10 of 11

115 Acorn Drive INJ - 15:00 TUE 08/13/2013 CD Location Map Acorn Drive Dellwood Avenue PDO - 18:00 FRI 01/17/2014 CS PDO - 16:00 TUE 12/23/2014 CW INJ - 17:00 SAT 11/16/2013 CD PDO - 14:00 THU 10/24/2013 RW Shroyer Road INJ - 12:00 TUE 04/09/2013 CD PDO - 12:00 THU 11/01/2012 CD PDO - 17:00 WED 08/31/2011 CD PDO - 13:00 SUN 07/13/2014 CD INJ - 21:00 FRI 01/10/2014 CW ACCIDENT COUNT 5 - Property Damage Crash 1 - Injury Crash 0 - Fatal Crash LEGEND TYPES OF CRASHES SYMBOLS WEATHER CONDITION Rear End Right Angle Side Swipe Out of Control Left Turn Head On * Moving Vehicle Stopped Vehicle Bicycle Pedstrian X C R S Not Stated Clear Rain Snow Animal Vehicle at Fault F H Fog Heavy Wind X D W S ROAD CONDITION Not Stated Dry Wet Snow SEVERITY PDO - Property Damage Only INJ - Injury FAT - Fatal I M Ice Mud/Sand Service Layer Credits: Sources: Esri, HERE, DeLorme, Intermap, increment P Corp., GEBCO, USGS, FAO, NPS, NRCAN, GeoBase, IGN, Kadaster NL, Ordnance Survey, Esri Japan, METI, Esri China (Hong Kong), swisstopo, MapmyIndia, OpenStreetMap contributors, and the GIS User Community CRASH DIAGRAM LOG POINT TO PERIOD 5 Years FROM 2010 TO 2014 JURISDICTION Kettering / Oakwood ROUTE NAME / NUMBER Shroyer Road / CR-609 Crawford, Murphy & Tilly Engineers & Consultants, Suite 150 Columbus, OH DATE: December 15, 2015 PAGE: 11 of 11
Figure 1 Map of intersection of SR 44 (Ravenna Rd) and Butternut Rd
 and Butternut Rd") Abbreviated Study District: 12 County: Geauga Route: SR 44 Section: 1.58 GEA 44 1.58 213 HSP # 47 (Rural Intersection) Prepared April 23, 215 By Bryan Emery Existing Conditions This study contains the
Abbreviated Study District: 12 County: Geauga Route: SR 44 Section: 1.58 GEA 44 1.58 213 HSP # 47 (Rural Intersection) Prepared April 23, 215 By Bryan Emery Existing Conditions This study contains the
Traffic Engineering Study
 Traffic Engineering Study Bellaire Boulevard Prepared For: International Management District Technical Services, Inc. Texas Registered Engineering Firm F-3580 November 2009 Executive Summary has been requested
Traffic Impact Study Speedway Gas Station Redevelopment
 Traffic Impact Study Speedway Gas Station Redevelopment Warrenville, Illinois Prepared For: Prepared By: April 11, 2018 Table of Contents 1. Introduction... 1 2. Existing Conditions... 4 Site Location...
Table of Contents INTRODUCTION... 3 PROJECT STUDY AREA Figure 1 Vicinity Map Study Area... 4 EXISTING CONDITIONS... 5 TRAFFIC OPERATIONS...
 Crosshaven Drive Corridor Study City of Vestavia Hills, Alabama Table of Contents INTRODUCTION... 3 PROJECT STUDY AREA... 3 Figure 1 Vicinity Map Study Area... 4 EXISTING CONDITIONS... 5 TRAFFIC OPERATIONS...
TRAFFIC IMPACT ANALYSIS FOR. McDONALD S RESTAURANT IN CARMICAEL Sacramento County, CA. Prepared For:
 TRAFFIC IMPACT ANALYSIS FOR McDONALD S RESTAURANT IN CARMICAEL Sacramento County, CA Prepared For: McDonald s USA, LLC Pacific Sierra Region 2999 Oak Road, Suite 900 Walnut Creek, CA 94597 Prepared By:
Lacey Gateway Residential Phase 1
 Lacey Gateway Residential Phase Transportation Impact Study April 23, 203 Prepared for: Gateway 850 LLC 5 Lake Bellevue Drive Suite 02 Bellevue, WA 98005 Prepared by: TENW Transportation Engineering West
LAWRENCE TRANSIT CENTER LOCATION ANALYSIS 9 TH STREET & ROCKLEDGE ROAD / 21 ST STREET & IOWA STREET LAWRENCE, KANSAS
 LAWRENCE TRANSIT CENTER LOCATION ANALYSIS 9 TH STREET & ROCKLEDGE ROAD / 21 ST STREET & IOWA STREET LAWRENCE, KANSAS TRAFFIC IMPACT STUDY FEBRUARY 214 OA Project No. 213-542 TABLE OF CONTENTS 1. INTRODUCTION...
APPENDIX E. Traffic Analysis Report
 APPENDIX E Traffic Analysis Report THIS PAGE INTENTIONALLY BLANK EAGLE RIVER TRAFFIC MITIGATION PHASE I OLD GLENN HIGHWAY/EAGLE RIVER ROAD INTERSECTION IMPROVEMENTS TRAFFIC ANALYSIS Eagle River, Alaska
Bennett Pit. Traffic Impact Study. J&T Consulting, Inc. Weld County, Colorado. March 3, 2017
 Bennett Pit Traffic Impact Study J&T Consulting, Inc. Weld County, Colorado March 3, 217 Prepared By: Sustainable Traffic Solutions, Inc. http://www.sustainabletrafficsolutions.com/ Joseph L. Henderson,
Traffic Analysis for Bon Air Bridge Mitigation Magnolia Storm Water Quality Project
 Memo To: Paul DiDonato, ATI Architects and Engineers From: David Parisi, PE and Ashley Tam, EIT Date: February 23, 216 Subject: Traffic Analysis for Bon Air Bridge Mitigation Magnolia Storm Water Quality
CUY SAFETY STUDY KINSMAN RD (US 422) AT E. 93 RD ST CLEVELAND, OHIO - ODOT DISTRICT 12. October 13, LJB Inc.
 AT E. 93 RD ST CLEVELAND, OHIO - ODOT DISTRICT 12. October 13, LJB Inc.") CUY-422-4.34 SAFETY STUDY KINSMAN RD (US 422) AT E. 93 RD ST CLEVELAND, OHIO - ODOT DISTRICT 12 October 13, 2014 PREPARED BY: LJB Inc. 2500 Newmark Drive Miamisburg, OH 45342 (937) 259-5000 Elizabeth L.
CUY-422-4.34 SAFETY STUDY KINSMAN RD (US 422) AT E. 93 RD ST CLEVELAND, OHIO - ODOT DISTRICT 12 October 13, 2014 PREPARED BY: LJB Inc. 2500 Newmark Drive Miamisburg, OH 45342 (937) 259-5000 Elizabeth L.
TRAFFIC SIGNAL DESIGN REPORT KING OF PRUSSIA ROAD & RAIDER ROAD RADNOR TOWNSHIP PENNSYLVANIA
 TRAFFIC SIGNAL DESIGN REPORT KING OF PRUSSIA ROAD & RAIDER ROAD RADNOR TOWNSHIP PENNSYLVANIA PREPARED FOR: UNIVERSITY OF PENNSYLVANIA HEALTH SYSTEM 34 CIVIC CENTER BOULEVARD PHILADELPHIA, PA 1987 (61)
TIMBERVINE TRANSPORTATION IMPACT STUDY FORT COLLINS, COLORADO JANUARY Prepared for:
 TIMBERVINE TRANSPORTATION IMPACT STUDY FORT COLLINS, COLORADO JANUARY 2014 Prepared for: Hartford Companies 1218 W. Ash Street Suite A Windsor, Co 80550 Prepared by: DELICH ASSOCIATES 2272 Glen Haven Drive
Appendix C-5: Proposed Refinements Rail Operations and Maintenance Facility (ROMF) Traffic Impact Analysis. Durham-Orange Light Rail Transit Project
 Traffic Impact Analysis. Durham-Orange Light Rail Transit Project") Appendix C-5: Proposed Refinements Rail Operations and Maintenance Facility (ROMF) Traffic Impact Analysis Durham-Orange Light Rail Transit Project July 25, 218 ROMF Transportation Impact Analysis Version
Appendix C-5: Proposed Refinements Rail Operations and Maintenance Facility (ROMF) Traffic Impact Analysis Durham-Orange Light Rail Transit Project July 25, 218 ROMF Transportation Impact Analysis Version
MEMO VIA . Ms. Amy Roth DPS Director, City of Three Rivers. To:
 MEMO To: Ms. Amy Roth DPS Director, City of Three Rivers VIA EMAIL From: Michael J. Labadie, PE Julie M. Kroll, PE, PTOE Brandon Hayes, PE, P.Eng. Fleis & VandenBrink Date: January 5, 2017 Re: Proposed
INTERSECTION ANALYSIS PARK AVENUE AND BRADDOCK ROAD (FROSTBURG, MD) FOR LENHART TRAFFIC CONSULTING, INC.
 FOR LENHART TRAFFIC CONSULTING, INC.") INTERSECTION ANALYSIS FOR PARK AVENUE AND BRADDOCK ROAD (FROSTBURG, MD) Prepared for: City of Frostburg, Maryland & Allegany County Commissioners Prepared by: LENHART TRAFFIC CONSULTING, INC. TRAFFIC ENGINEERING
INTERSECTION ANALYSIS FOR PARK AVENUE AND BRADDOCK ROAD (FROSTBURG, MD) Prepared for: City of Frostburg, Maryland & Allegany County Commissioners Prepared by: LENHART TRAFFIC CONSULTING, INC. TRAFFIC ENGINEERING
County State Aid Highway 32 (Cliff Road) and Dodd Road Intersection Study
 and Dodd Road Intersection Study") County State Aid Highway 32 (Cliff Road) and Dodd Road Intersection Study City of Eagan, Dakota County, Minnesota Date: March 2012 Project No. 14957.000 444 Cedar Street, Suite 1500 Saint Paul, MN 55101
County State Aid Highway 32 (Cliff Road) and Dodd Road Intersection Study City of Eagan, Dakota County, Minnesota Date: March 2012 Project No. 14957.000 444 Cedar Street, Suite 1500 Saint Paul, MN 55101
Craig Scheffler, P.E., PTOE HNTB North Carolina, P.C. HNTB Project File: Subject
 TECHNICAL MEMORANDUM To Kumar Neppalli Traffic Engineering Manager Town of Chapel Hill From Craig Scheffler, P.E., PTOE HNTB North Carolina, P.C. Cc HNTB Project File: 38435 Subject Obey Creek TIS 2022
City of Marina. Regional Roundabout Study Utilizing Caltrans Intersection Control Evaluation Section 4: Transportation Agency for Monterey County
 Regional Roundabout Study Utilizing Caltrans Intersection Control Evaluation Section 4: City of Marina Study Intersections: RESERVATION ROAD AT BEACH ROAD RESERVATION ROAD AT DEFOREST ROAD CARDOZA AVENUE
EXCEPTION TO STANDARDS REPORT
 EXCEPTION TO STANDARDS REPORT PROJECT DESCRIPTION AND NEED The project is located in Section 6, Township 23 North, Range 9 East and Section 31 Township 24 North, Range 9 East, in the Town of Stockton,
Memorandum. To: Sue Polka, City Engineer, City of Arden Hills. From: Sean Delmore, PE, PTOE. Date: June 21, 2017
 Memorandum engineering planning environmental construction 701 Xenia Avenue South Suite 300 Minneapolis, MN 55416 Tel: 763-541-4800 Fax: 763-541-1700 To: Sue Polka, City Engineer, City of Arden Hills From:
Roundabout Feasibility Study SR 44 at Grand Avenue TABLE OF CONTENTS
 Roundabout Feasibility Study SR 44 at Grand Avenue TABLE OF CONTENTS Introduction and Executive Summary... 1 Existing Conditions... 3 Intersection Volume Conditions... 5 Intersection Operations... 9 Safety
TRAFFIC IMPACT ANALYSIS
 TRAFFIC IMPACT ANALYSIS Emerald Isle Commercial Development Prepared by SEPI Engineering & Construction Prepared for Ark Consulting Group, PLLC March 2016 I. Executive Summary A. Site Location The Emerald
MERIVALE PRIORITY SQUARE 2852 MERIVALE ROAD CITY OF OTTAWA TRANSPORTATION BRIEF. Prepared for: ONT Inc. 25 Winding Way Nepean, Ontario K2C 3H1
 MERIVALE PRIORITY SQUARE 2852 MERIVALE ROAD CITY OF OTTAWA TRANSPORTATION BRIEF Prepared for: 2190986ONT Inc. 25 Winding Way Nepean, Ontario K2C 3H1 October 6, 2010 110-502 Report_1.doc D. J. Halpenny
RICHMOND OAKS HEALTH CENTRE 6265 PERTH STREET OTTAWA, ONTARIO TRANSPORTATION BRIEF. Prepared for: Guycoki (Eastern) Limited.
 Limited.") RICHMOND OAKS HEALTH CENTRE 6265 PERTH STREET OTTAWA, ONTARIO TRANSPORTATION BRIEF Prepared for: Guycoki (Eastern) Limited June 16, 2016 116-638 Brief_1.doc D. J. Halpenny & Associates Ltd. Consulting
RICHMOND OAKS HEALTH CENTRE 6265 PERTH STREET OTTAWA, ONTARIO TRANSPORTATION BRIEF Prepared for: Guycoki (Eastern) Limited June 16, 2016 116-638 Brief_1.doc D. J. Halpenny & Associates Ltd. Consulting
V. DEVELOPMENT OF CONCEPTS
 Martin Luther King, Jr. Drive Extension FINAL Feasibility Study Page 9 V. DEVELOPMENT OF CONCEPTS Throughout the study process several alternative alignments were developed and eliminated. Initial discussion
King Soopers #116 Thornton, Colorado
 Traffic Impact Study King Soopers #116 Thornton, Colorado Prepared for: Galloway & Company, Inc. T R A F F I C I M P A C T S T U D Y King Soopers #116 Thornton, Colorado Prepared for Galloway & Company
South Lexington Transportation Study Lexington, Massachusetts
 South Lexington Transportation Study Lexington, Massachusetts Preliminary Findings and Options for Consideration Businesses Meeting 10/10/13 Town of Lexington Engineering and Planning Departments Meeting
INTERSECTION CONTROL EVALUATION
 INTERSECTION CONTROL EVALUATION Trunk Highway 22 and CSAH 21 (E Hill Street/Shanaska Creek Road) Kasota, Le Sueur County, Minnesota November 2018 Trunk Highway 22 and Le Sueur CSAH 21 (E Hill Street/Shanaska
County State Aid Highway 30 (Diffley Road) and Dodd Road Intersection Study
 and Dodd Road Intersection Study") County State Aid Highway 30 (Diffley Road) and Dodd Road Intersection Study City of Eagan, Dakota County, Minnesota Date: March 2012 Project No. 14957.000 444 Cedar Street, Suite 1500 Saint Paul, MN 55101
County State Aid Highway 30 (Diffley Road) and Dodd Road Intersection Study City of Eagan, Dakota County, Minnesota Date: March 2012 Project No. 14957.000 444 Cedar Street, Suite 1500 Saint Paul, MN 55101
Proposed location of Camp Parkway Commerce Center. Vicinity map of Camp Parkway Commerce Center Southampton County, VA
 Proposed location of Camp Parkway Commerce Center Vicinity map of Camp Parkway Commerce Center Southampton County, VA Camp Parkway Commerce Center is a proposed distribution and industrial center to be
EXECUTIVE SUMMARY. The following is an outline of the traffic analysis performed by Hales Engineering for the traffic conditions of this project.
 EXECUTIVE SUMMARY This study addresses the traffic impacts associated with the proposed Shopko redevelopment located in Sugarhouse, Utah. The Shopko redevelopment project is located between 1300 East and
King County Metro. Columbia Street Transit Priority Improvements Alternative Analysis. Downtown Southend Transit Study. May 2014.
 King County Metro Columbia Street Transit Priority Improvements Alternative Analysis Downtown Southend Transit Study May 2014 Parametrix Table of Contents Introduction... 1 Methodology... 1 Study Area...
CUY Safety Study Final Report
 CUY-175-7.30 Safety Study Final Report Beachwood/Lyndhurst, OH Urban Non-Freeway Intersection Ranking #26 ODOT District 12 5500 Transportation Boulevard Garfield Heights, OH 44125 March 18, 2016 6612 Singletree
INDUSTRIAL DEVELOPMENT
 INDUSTRIAL DEVELOPMENT Traffic Impact Study Plainfield, Illinois August 2018 Prepared for: Seefried Industrial Properties, Inc. TABLE OF CONTENTS Executive Summary 2 Introduction 3 Existing Conditions
IMPROVEMENT CONCEPTS
 IMPROVEMENT CONCEPTS for the South Novato Transit Hub Study Prepared by: January 11, 2010 DKS Associates With Wilbur Smith Associates IMPROVEMENT CONCEPTS Chapter 1: Introduction 1. INTRODUCTION The strategic
INTERCHANGE OPERTIONS STUDY Interstate 77 / Wallings Road Interchange
 INTERCHANGE OPERTIONS STUDY Interstate 77 / Wallings Road Interchange City of Broadview Heights, Cuyahoga County, Ohio Prepared For: City of Broadview Heights Department of Engineering 9543 Broadview Road
2.0 Development Driveways. Movin Out June 2017
 Movin Out June 2017 1.0 Introduction The proposed Movin Out development is a mixed use development in the northeast quadrant of the intersection of West Broadway and Fayette Avenue in the City of Madison.
APPENDIX C1 TRAFFIC ANALYSIS DESIGN YEAR TRAFFIC ANALYSIS
 APPENDIX C1 TRAFFIC ANALYSIS DESIGN YEAR TRAFFIC ANALYSIS DESIGN YEAR TRAFFIC ANALYSIS February 2018 Highway & Bridge Project PIN 6754.12 Route 13 Connector Road Chemung County February 2018 Appendix
Southern Windsor County 2016 Traffic Count Program Summary April 2017
 Southern Windsor County 2016 Traffic Count Program Summary April 2017 The Southern Windsor County Regional Planning Commission (the RPC ) has been monitoring traffic at 19 locations throughout the southern
BROWARD BOULEVARD CORRIDOR TRANSIT STUDY
 BROWARD BOULEVARD CORRIDOR TRANSIT STUDY FM # 42802411201 EXECUTIVE SUMMARY July 2012 GOBROWARD Broward Boulevard Corridor Transit Study FM # 42802411201 Executive Summary Prepared For: Ms. Khalilah Ffrench,
BARRHAVEN FELLOWSHIP CRC 3058 JOCKVALE ROAD OTTAWA, ONTARIO TRANSPORTATION BRIEF. Prepared for:
 BARRHAVEN FELLOWSHIP CRC 3058 JOCKVALE ROAD OTTAWA, ONTARIO TRANSPORTATION BRIEF Prepared for: Barrhaven Fellowship CRC 3058 Jockvale Road Ottawa, ON K2J 2W7 December 7, 2016 116-649 Report_1.doc D. J.
Alpine Highway to North County Boulevard Connector Study
 Alpine Highway to North County Boulevard Connector Study prepared by Avenue Consultants March 16, 2017 North County Boulevard Connector Study March 16, 2017 Table of Contents 1 Summary of Findings... 1
MINERVA PARK SITE TRAFFIC IMPACT STUDY M/I HOMES. September 2, 2015
 5500 New Albany Road Columbus, Ohio 43054 Phone: 614.775.4500 Fax: 614.775.4800 Toll Free: 1-888-775-EMHT emht.com 2015-1008 MINERVA PARK SITE TRAFFIC IMPACT STUDY M/I HOMES September 2, 2015 Engineers
Corridor Analysis. For COUNTY LINE ROAD (S.R. 1001) CORRIDOR. located in. File No March 2019
 CORRIDOR. located in. File No March 2019") Corridor Analysis For COUNTY LINE ROAD (S.R. 1001) CORRIDOR located in Radnor Township Delaware County Lower Merion Township Montgomery County File No. 16-11060-02 March 2019 Prepared For: Radnor Township
Corridor Analysis For COUNTY LINE ROAD (S.R. 1001) CORRIDOR located in Radnor Township Delaware County Lower Merion Township Montgomery County File No. 16-11060-02 March 2019 Prepared For: Radnor Township
The Jack A. Markell Trail Delaware s Bicycle Highway New England Bike- Walk Summit
 The Jack A. Markell Trail Delaware s Bicycle Highway 2018 New England Bike- Walk Summit The Jack A. Markell Trail Sometimes a very difficult project, including significant investment and perseverance,
Traffic Impact Study for the proposed. Town of Allegany, New York. August Project No Prepared For:
 Appendix B SRF Traffic Study (Revised November 2005) Draft Environmental Impact Statement University Commons Town of Allegany, Cattaraugus County, NY December 2005 Traffic Impact Study for the proposed
Peachtree Streetscape Atlanta, Georgia
 Operational Analysis reetscape Atlanta, Georgia Prepared for: Central Atlanta Progress Prepared by: Kimley-Horn and Associates, Inc. Kimley-Horn and Associates, Inc. November 26 192812 reetscape Operational
Traffic Impact Analysis West Street Garden Plots Improvements and DuPage River Park Garden Plots Development Naperville, Illinois
 Traffic Impact Analysis West Street Garden Plots Improvements and DuPage River Park Garden Plots Development Naperville, Illinois Submitted by April 9, 2009 Introduction Kenig, Lindgren, O Hara, Aboona,
Traffic Impact Analysis. Alliance Cole Avenue Residential Site Dallas, Texas. Kimley-Horn and Associates, Inc. Dallas, Texas.
 Traffic Impact Analysis Alliance Cole Avenue Residential Site Dallas, Texas February 15, 2018 Kimley-Horn and Associates, Inc. Dallas, Texas Project #064524900 Registered Firm F-928 Traffic Impact Analysis
GASOLINE SERVICE STATION 1618, 1622 ROGER STEVENS DRIVE OTTAWA, ONTARIO TRANSPORTATION IMPACT ASSESSMENT. Prepared for:
 GASOLINE SERVICE STATION 1618, 1622 ROGER STEVENS DRIVE OTTAWA, ONTARIO TRANSPORTATION IMPACT ASSESSMENT Prepared for: Invecta Development (Ottawa) Corporation 758 Shanks Height Milton, ON L9T 7P7 May
DEVELOPMENT PROPERTY 1627 MAXIME STREET CITY OF OTTAWA TRANSPORTATION OVERVIEW. Prepared for: Subhas Bhargava. July 9, Overview_1.
 DEVELOPMENT PROPERTY 1627 MAXIME STREET CITY OF OTTAWA TRANSPORTATION OVERVIEW Prepared for: Subhas Bhargava July 9, 2015 115-620 Overview_1.doc D. J. Halpenny & Associates Ltd. Consulting Transportation
RTE. 1 at RTE. 637 & RTE. 639
 INTERSECTION SAFETY STUDY Prepared for: Virginia Department of Transportation Central Region Operations Traffic Engineering (UPC #81378, TO 12-092) DAVENPORT Project Number: 13-368 / /2014 RTE. 1 at RTE.
Revised Evaluation Scores. System Preservation
 Revised Evaluation s System Preservation This page provides a summary of any revisions made to the draft scores presented at the October th Attributable Funds mmittee meeting. The information below highlights
Traffic Management Plan and Queuing Analysis Lakehill Preparatory School Z Hillside Drive, Dallas, TX October 27, 2015
 Traffic Management Plan and Queuing Analysis Lakehill Preparatory School Z145-235 2720 Hillside Drive, Dallas, TX October 27, 2015 Introduction: The Lakehill Preparatory School is located on the northeast
STH 60 Northern Reliever Route Feasibility Study Report
 #233087 v3 STH 60 Northern Reliever Route Feasibility Study Report Washington County Public Works Committee Meeting September 28, 2016 1 STH 60 Northern Reliever Route Feasibility Study Hartford Area Development
Proposed Inn at Bellefield Traffic Impact Assessment
 Proposed Inn at Bellefield Traffic Impact Assessment Town of Hyde Park Dutchess County, New York Prepared for: T-Rex Hyde Park Owner LLC 500 Mamroneck Avenue, Suite 300 Harrison, NY 10528 June 21, 2017
Transit City Etobicoke - Finch West LRT
 Delcan Corporation Transit City Etobicoke - Finch West LRT APPENDIX D Microsimulation Traffic Modeling Report March 2010 March 2010 Appendix D CONTENTS 1.0 STUDY CONTEXT... 2 Figure 1 Study Limits... 2
TRAFFIC IMPACT STUDY. USD #497 Warehouse and Bus Site
 TRAFFIC IMPACT STUDY for USD #497 Warehouse and Bus Site Prepared by: Jason Hoskinson, PE, PTOE BG Project No. 16-12L July 8, 216 145 Wakarusa Drive Lawrence, Kansas 6649 T: 785.749.4474 F: 785.749.734
TECHNICAL MEMORANDUM. Part A: Introduction
 TECHNICAL MEMORANDUM To: David J. Decker Decker Properties, Inc. 5950 Seminole Centre Ct. Suite 200 Madison, Wisconsin 53711 608-663-1218 Fax: 608-663-1226 www.klengineering.com From: Mike Scarmon, P.E.,
Proposed CVS/pharmacy
 Traffic Impact and Access Study Proposed CVS/pharmacy West Main Street (Route 1) at Hull Street Clinton, Connecticut PREPARED FOR Arista Development LLC 520 Providence Highway, Suite 9 Norwood, Massachusetts
Evaluation Considerations and Geometric Nuances of Reduced Conflict U-Turn Intersections (RCUTs)
") Evaluation Considerations and Geometric Nuances of Reduced Conflict U-Turn Intersections (RCUTs) 26 th Annual Transportation Research Conference Saint Paul RiverCentre May 20, 2015 Presentation Outline
Evaluation Considerations and Geometric Nuances of Reduced Conflict U-Turn Intersections (RCUTs) 26 th Annual Transportation Research Conference Saint Paul RiverCentre May 20, 2015 Presentation Outline
City of Pacific Grove
 Regional Study Utilizing Caltrans Intersection Evaluation Section 7: City of Pacific Grove s: FIRST STREET AT CENTRAL AVENUE Transportation Agency for Monterey County Prepared by Transportation Agency
Speed measurements were taken at the following three locations on October 13 and 14, 2016 (See Location Map in Exhibit 1):
:") 2709 McGraw Drive Bloomington, Illinois 61704 p 309.663.8435 f 309.663.1571 www.f-w.com www.greennavigation.com November 4, 2016 Mr. Kevin Kothe, PE City Engineer City of Bloomington Public Works Department
2709 McGraw Drive Bloomington, Illinois 61704 p 309.663.8435 f 309.663.1571 www.f-w.com www.greennavigation.com November 4, 2016 Mr. Kevin Kothe, PE City Engineer City of Bloomington Public Works Department
ANDERSON PROPERTY SITE ANALYSIS
 ANDERSON PROPERTY SITE ANALYSIS Introduction The Montgomery County Department of Transportation (MCDOT) initiated a feasibility study in the fall of 2012 to evaluate the need for transit service expansion
To: File From: Adrian Soo, P. Eng. Markham, ON File: Date: August 18, 2015
 Memo To: From: Adrian Soo, P. Eng. Markham, ON : 165620021 Date: Reference: E.C. Row Expressway, Dominion Boulevard Interchange, Dougall Avenue Interchange, and Howard 1. Review of Interchange Geometry
One Harbor Point Residential
 Residential Gig Harbor, WA Transportation Impact Analysis January 23, 2017 Prepared for: Neil Walter Company PO Box 2181 Tacoma, WA 98401 Prepared by: TENW Transportation Engineering NorthWest 11400 SE
Traffic Impact Analysis Update
 Willow Bend Traffic Impact Analysis Update TABLE OF CONTENTS Page I. INTRODUCTION -------------------------------------------------------------------------------------------- 1 II. EXISTING CONDITIONS
Traffic Impact Statement (TIS)
") Traffic Impact Statement (TIS) Vincentian PUDA Collier County, FL 10/18/2013 Prepared for: Global Properties of Naples Prepared by: Trebilcock Consulting Solutions, PA 2614 Tamiami Trail N, Suite 615 1205
Traffic Impact Statement (TIS) Vincentian PUDA Collier County, FL 10/18/2013 Prepared for: Global Properties of Naples Prepared by: Trebilcock Consulting Solutions, PA 2614 Tamiami Trail N, Suite 615 1205
METRO Orange Line BRT American Boulevard Station Options
 METRO Orange Line BRT American Boulevard Station Options Bloomington City Council Work Session November 18, 2013 Christina Morrison BRT/Small Starts Project Office Coordinating Planning and Design AMERICAN
Interstate Operations Study: Fargo-Moorhead Metropolitan Area Simulation Results
 NDSU Dept #2880 PO Box 6050 Fargo, ND 58108-6050 Tel 701-231-8058 Fax 701-231-6265 www.ugpti.org www.atacenter.org Interstate Operations Study: Fargo-Moorhead Metropolitan Area 2025 Simulation Results
Letter of Transmittal
 Letter of Transmittal To: Chris Lovell City of Richmond Hill Date: 5/2/6 Job 2582 Re: Richmond Hill-South Bryan County Transportation STudy WE ARE SENDING YOU THE FOLLOWING ITEMS ( attached) ( under separate
MILLERSVILLE PARK TRAFFIC IMPACT ANALYSIS ANNE ARUNDEL COUNTY, MARYLAND
 MILLERSVILLE PARK TRAFFIC IMPACT ANALYSIS ANNE ARUNDEL COUNTY, MARYLAND Prepared for: Department of Public Works Anne Arundel County Prepared by: URS Corporation 4 North Park Drive, Suite 3 Hunt Valley,
Access Management Standards
 Access Management Standards This section replaces Access Control Standards on Page number 300-4 of the Engineering Standards passed February 11, 2002 and is an abridged version of the Access Management
VOA Vista Drive Residential housing Development TIA Project #13915 TABLE OF CONTENTS
 VOA Vista Drive Residential housing Development TIA Project #13915 TABLE OF CONTENTS Executive Summary... 2 Project Background... 2 Conditions... 2 Findings... 3 Recommendations... 4 Introduction... 6
TALMONT TOWNHOMES MADISON KENNETH SPA TRAFFIC IMPACT STUDY. Sacramento, CA. Prepared For: MBK Homes. Prepared By:
 TALMONT TOWNHOMES MADISON KENNETH SPA TRAFFIC IMPACT STUDY Sacramento, CA Prepared For: MBK Homes Prepared By: KD Anderson & Associates 3853 Taylor Road, Suite G Loomis, California 95650 (916) 660-1555
Highway 18 BNSF Railroad Overpass Feasibility Study Craighead County. Executive Summary
 Highway 18 BNSF Railroad Overpass Feasibility Study Craighead County Executive Summary October 2014 Highway 18 BNSF Railroad Overpass Feasibility Study Craighead County Executive Summary October 2014 Prepared
Major Widening/New Roadway
 Revised Evaluation s Major Widening/New Roadway This page provides a summary of any revisions made to the draft scores presented at the October th Attributable Funds Committee meeting. The information
December 5, Red Bank Planning Board Municipal Building 90 Monmouth Street Red Bank, NJ 07701
 Dynamic Traffic, LLC www.dynamic-traffic.com 1904 Main Street Lake Como, NJ 07719 T. 732.681.0760 December 5, 2016 Red Bank Planning Board Municipal Building 90 Monmouth Street Red Bank, NJ 07701 Re: Traffic
3.15 SAFETY AND SECURITY
 3.15 SAFETY AND SECURITY Introduction This section describes the environmental setting and potential effects of the alternatives analyzed in this EIR with regard to safety and security in the SantaClara-Alum
TRAFFIC IMPACT ANALYSIS FOR THE 630/650 SOUTH STREET RETAIL DEVELOPMENT WRENTHAM, MASSACHUSETTS
 PARE PROJECT NO. 17120.00 REPORT TRAFFIC IMPACT ANALYSIS FOR THE 630/650 SOUTH STREET RETAIL DEVELOPMENT WRENTHAM, MASSACHUSETTS SUBMITTED TO: GEORGETOWN CAPITAL MANAGEMENT PO BOX 369 GEORGETOWN, MA 01833
Existing Traffic Conditions
 May 14, 2014 Ms. Lorraine Weiss City of San Mateo 330 West 20 th Avenue San Mateo, CA 94403 Subject: Traffic Operational Study for the Proposed Tilton Avenue Residential Development in San Mateo, California
L1TILE BEARS DAY CARE TRANSPORTATION IMPACT STUDY FORT COLLINS, COLORADO MAY Prepared for:
 L1TILE BEARS DAY CARE TRANSPORTATION IMPACT STUDY FORT COLLINS, COLORADO MAY 2012 Prepared for: Hillside Construction, Inc. 216 Hemlock Street, Suite B Fort Collins, CO 80534 Prepared by: DELICH ASSOCIATES
TRAFFIC IMPACT STUDY FOR SONIC DRIVE-IN RESTAURANT. Vallejo, CA. Prepared For:
 TRAFFIC IMPACT STUDY FOR SONIC DRIVE-IN RESTAURANT Vallejo, CA Prepared For: ELITE DRIVE-INS, INC. 2190 Meridian Park Blvd, Suite G Concord, CA 94520 Prepared By: KD Anderson & Associates 3853 Taylor Road,
Metropolitan Freeway System 2007 Congestion Report
 Metropolitan Freeway System 2007 Congestion Report Minnesota Department of Transportation Office of Traffic, Safety and Operations Freeway Operations Section Regional Transportation Management Center March
Speed Limit Study: Traffic Engineering Report
 Speed Limit Study: Traffic Engineering Report This report documents the engineering and traffic investigation required by Vermont Statutes Annotated Title 23, Chapter 13 1007 for a municipal legislative
RE: A Traffic Impact Statement for a proposed development on Quinpool Road
 James J. Copeland, P.Eng. GRIFFIN transportation group inc. 30 Bonny View Drive Fall River, NS B2T 1R2 May 31, 2018 Ellen O Hara, P.Eng. Project Engineer DesignPoint Engineering & Surveying Ltd. 200 Waterfront
Safety Assessment. Intersection of Route 29 (Seminole Trail) and Ashwood Blvd (Route 1670). Albemarle County
 and Ashwood Blvd (Route 1670). Albemarle County") Safety Assessment for Intersection of Route 29 (Seminole Trail) and Ashwood Blvd (Route 1670). Albemarle County Prepared by: VIRGINIA DEPARTMENT OF TRANSPORTATION Northwestern Regional Operations - Traffic
Safety Assessment for Intersection of Route 29 (Seminole Trail) and Ashwood Blvd (Route 1670). Albemarle County Prepared by: VIRGINIA DEPARTMENT OF TRANSPORTATION Northwestern Regional Operations - Traffic
Section 5.0 Traffic Information
 Section 5.0 Traffic Information 10.0 TRANSPORTATION MDM Transportation Consultants, Inc. (MDM) has prepared an evaluation of transportation impacts for the proposed evaluation for the expansion of the
Volume 1 Traffic Impact Analysis Turtle Creek Boulevard Dallas, Texas. Kimley-Horn and Associates, Inc. Dallas, Texas.
 Volume 1 Traffic Impact Analysis 2727 Dallas, Texas June 18, 2018 Kimley-Horn and Associates, Inc. Dallas, Texas Project #064523000 Registered Firm F-928 Traffic Impact Analysis 2727 Dallas, Texas Prepared
CONTENTS I. INTRODUCTION... 2 II. SPEED HUMP INSTALLATION POLICY... 3 III. SPEED HUMP INSTALLATION PROCEDURE... 7 APPENDIX A... 9 APPENDIX B...
 Speed Hump Program CONTENTS I. INTRODUCTION... 2 II. SPEED HUMP INSTALLATION POLICY... 3 1. GENERAL... 3 2. ELIGIBILITY REQUIREMENTS... 3 A. PETITION... 3 B. OPERATIONAL AND GEOMETRIC CHARACTERISTICS OF
4131 Chain Bridge Road
 Traffic Impact Study 4131 Chain Bridge Road City of Fairfax, VA 05/04/16 May 4, 2016 Prepared for: Paradigm 1415 North Taft Street Suite 100 Arlington, VA 22201 This report is printed on environmentally
Oakbrook Village Plaza City of Laguna Hills
 Oakbrook Village Plaza City of Laguna Hills Traffic Impact Analysis Prepared by: HDR Engineering 3230 El Camino Real, Suite 200 Irvine, CA 92602 October 2012 Revision 3 D-1 Oakbrook Village Plaza Laguna
Public Information Workshop
 Public Information Workshop Charlotte County-Punta Gorda MPO - Meeting Rooms A and B March 29, 2018 Welcome to the Public Information Workshop for Harborview Road Project Development and Environment (PD&E)
Traffic Feasibility Study
 Traffic Feasibility Study Town Center South Robbinsville Township, Mercer County, New Jersey December 19, 2017 Prepared For Robbinsville Township Department of Community Development 2298 Route 33 Robbinsville,
Downtown One Way Street Conversion Technical Feasibility Report
 Downtown One Way Street Conversion Technical Feasibility Report As part of the City s Transportation Master Plan, this report reviews the technical feasibility of the proposed conversion of the current
November 1, Mr. Jafar Tabrizi President, Tabrizi Rugs 180 Bedford Highway. Traffic Impact Statement BH-1 and BH-2, Southgate Drive, Bedford, NS
 161-12598 Mr. Jafar Tabrizi President, Tabrizi Rugs 180 Bedford Highway Bedford, NS B4A 1C1 [Via Email: tabrizi@tabrizi.com] RE: Traffic Impact Statement Dear Mr. Tabrizi: Plans are being prepared for
2. ELIGIBILITY REQUIREMENTS
 Speed Hump Policy 1. GENERAL The purpose of this policy is to provide guidelines for the application of speed humps. A "speed hump" is a gradual rise and fall of pavement surface across the width of the
CHAPTER 9: VEHICULAR ACCESS CONTROL Introduction and Goals Administration Standards
 9.00 Introduction and Goals 9.01 Administration 9.02 Standards 9.1 9.00 INTRODUCTION AND GOALS City streets serve two purposes that are often in conflict moving traffic and accessing property. The higher
Table Existing Traffic Conditions for Arterial Segments along Construction Access Route. Daily
 5.8 TRAFFIC, ACCESS, AND CIRCULATION This section describes existing traffic conditions in the project area; summarizes applicable regulations; and analyzes the potential traffic, access, and circulation