MILLERSVILLE PARK TRAFFIC IMPACT ANALYSIS ANNE ARUNDEL COUNTY, MARYLAND
|
|
|
- Tracy Carpenter
- 5 years ago
- Views:
Transcription

1 MILLERSVILLE PARK TRAFFIC IMPACT ANALYSIS ANNE ARUNDEL COUNTY, MARYLAND Prepared for: Department of Public Works Anne Arundel County Prepared by: URS Corporation 4 North Park Drive, Suite 3 Hunt Valley, Maryland 213 February 23, 218
2 TABLE OF CONTENTS Page I. INTRODUCTION... 1 II. STUDY OBJECTIVES AND METHODOLOGY... 1 Evaluation of Existing Conditions:... 1 Future Background Conditions without Development:... 2 Future Background Conditions with Development:... 2 III. EXISTING CONDITIONS... 4 Site Access... 6 Vehicular Traffic Counts... 6 Existing Weekend Volumes... 6 Existing Level of Service... 8 Crash Data Analysis... 9 IV. FUTURE BACKGROUND CONDITIONS Background Developments Trip Generation and Distribution for Background Developments Background Condition Traffic Forecasts Future Background Conditions Level of Service Analysis V. FUTURE CONDITIONS ANALYSIS WITH DEVELOPMENT Site Vehicle-Trip Generation Analysis Site Traffic Assignment... 2 Future Condition Traffic Forecasts... 2 Total Future Levels of Service VI. SUMMARY LIST OF FIGURES 1 Site Location Map Existing Lane Use and Traffic Control Existing Conditions AM, PM, and Saturday Peak Hour Vehicular Traffic Volumes Pipeline Developments AM, PM, and Saturday Peak Hour Vehicular Traffic Volumes Background Conditions AM, PM, and Saturday Peak Hour Vehicular Traffic Volumes Site Trip Distribution Site Generated AM, PM, and Saturday Peak Hour Vehicular Traffic Volumes Total Future Conditions AM, PM, and Saturday Peak Hour Vehicular Traffic Volumes...25 MILLERSVILLE PARK TRAFFIC IMPACT ANALYSIS ANNE ARUNDEL COUNTY, MARYLAND February 23, 218 i
3 LIST OF TABLES Table 1 Existing Conditions Intersection Levels of Service Summary...1 Table 2a Existing Crash Data (Millersville Road & Waterbury Road)...12 Table 2b Existing Crash Data (Millersville Road & Cecil Avenue)...12 Table 3 Background Developments Trip Generation Summary...15 Table 4 Background Conditions Intersection Levels of Service Summary...19 Table 5 Millersville Park Trip Generation Analysis...21 Table 6 Total Future Conditions Intersection Levels of Service Summary...26 LIST OF APPENDICES A B C D E F G H I J K Existing Traffic Volume Information from Gambrills Royal Farms Study Existing Turning Movement Counts Existing Weekend Turning Movement Counts Existing Road Tube Counts Saturday Volumes Sunday Volumes Existing CLV Spreadsheets Existing Crash Data Background Development Information and Intersection Turning Movement Volume Spreadsheets Background CLV Spreadsheets Future CLV Spreadsheets MILLERSVILLE PARK TRAFFIC IMPACT ANALYSIS ANNE ARUNDEL COUNTY, MARYLAND February 23, 218 ii
4 I. INTRODUCTION This report presents the results of a Traffic Impact Analysis (TIA) for the proposed Millersville Park, in Millersville, Maryland. This is a feasibility study to evaluate the traffic impacts of the proposed tennis center facility and recommend transportation improvements, if any. Design of the proposed site driveway is not addressed in this report. Roadway improvements such as adding a deceleration or turn lane will be developed based on the site development during the next phase of work. As shown on Figure 1, the proposed facility is located at the Millersville Park site, between I-97 and Millersville Road and northwest of Waterbury Road in Anne Arundel County. The proposed tennis center facility will include 26 tennis courts. This report analyzes the existing conditions compared to future conditions with and without the subject development in the year 22. II. STUDY OBJECTIVES AND METHODOLOGY This traffic analysis was conducted in accordance with the Anne Arundel County Guidelines for Traffic Impact Studies ( Guidelines ) and scope of services for this project. Intersection capacity analyses for existing, background, and total future conditions have been conducted using the Critical Lane Volume (CLV) technique. Per the information provided in the Guidelines on Impact Limits, the following study intersections were identified for the purposes of this traffic analysis: MD 175 (Annapolis Road) at MD 3 Southbound Millersville Road at MD 3 Northbound Millersville Road at Cecil Avenue Millersville Road at Proposed Site Driveway Millersville Road at Waterbury Road Millersville Road at MD 178 (Generals Highway) Sources of data for this analysis included 213 traffic counts conducted by Traffic Concepts, Inc. that were included in the Gambrills Royal Farms traffic impact study provided by the Anne Arundel County Office of Planning and Zoning, road tube traffic counts on Millersville Road just east and west of Cecil Avenue, provided by the Anne Arundel County Traffic Engineering Division, and weekend turning movement counts conducted for this Study in December 216 by O.R. George and Associates. The following tasks were undertaken as part of this study: Evaluation of Existing Conditions: A field reconnaissance of the existing roadway and intersection geometrics was conducted, including traffic controls, traffic signal phasing/timings, and speed limits. Existing traffic data at the study intersections from previously approved traffic studies was collected. Supplementary data collection efforts for the additional study intersections included in the scoping services agreement were performed. MILLERSVILLE PARK TRAFFIC IMPACT ANALYSIS ANNE ARUNDEL COUNTY, MARYLAND February 23, 218 1
5 Weekend volumes were developed from weekend turning movement counts and weekend road tube counts. Level of Service (LOS) analysis for existing conditions was performed. Future Background Conditions without Development: Estimates were prepared for trips generated from background developments, based on previously approved traffic studies and/or the Institute of Transportation Engineers (ITE) Trip Generation Manual (9 th Edition) rates/equations. Estimates were prepared for background traffic volumes based on existing traffic volumes, traffic from approved developments, and a natural growth rate of 1.5 percent. Analyses were performed for background conditions LOS based on background traffic forecasts, existing traffic controls and existing intersection lane use. Future Background Conditions with Development: Estimates were prepared for site generated trips in the AM, PM, Saturday, and Sunday peak hours using the rates/equations established in the ITE Trip Generation Manual and feedback from the Tennis Alliance of Anne Arundel County. A determination was made for site trip distribution based on the existing traffic patterns and on knowledge of surroundings. Estimates were prepared for total future traffic based on background traffic forecasts plus site traffic assignments. Analyses were performed for total future conditions LOS based on total future traffic forecasts, existing traffic controls, and existing intersection lane use. MILLERSVILLE PARK TRAFFIC IMPACT ANALYSIS ANNE ARUNDEL COUNTY, MARYLAND February 23, 218 2

6 Figure 1: Site Location Map MILLERSVILLE PARK TRAFFIC IMPACT ANALYSIS ANNE ARUNDEL COUNTY, MARYLAND February 23, 218 3
7 III. EXISTING CONDITIONS Regional access to the proposed facility is provided from MD 175 and MD 3. Locally, access is provided via Millersville Road, Cecil Avenue, MD 178 (Generals Highway), and Waterbury Road. Existing intersection lane use and traffic control at the study intersections are shown on Figure 2. MD 175/Annapolis Road, which is within the vicinity of the site, is a two-lane principal arterial roadway with auxiliary turn lanes at major intersections. This roadway segment has a posted speed limit of 4 mph and serves both commercial and residential uses in the area. MD 3/Crain Highway, which is within the vicinity of the site, is a four-lane principal arterial roadway with auxiliary turn lanes at major intersections. This roadway segment has a posted speed limit of 5 mph and serves both commercial and residential uses in the area. Millersville Road is a two-lane undivided minor arterial roadway that extends from MD 3 to MD 178 (Generals Highway). This roadway segment has a posted speed limit of 35 mph and serves residential uses in the area. Waterbury Road is a two-lane collector roadway that extends from Millersville Road to MD 178 (Generals Highway). It has a posted speed limit of 35 mph and serves the residential uses in the area. MD 178 (Generals Highway) in the vicinity of the site is a two-lane undivided minor arterial roadway with a posted speed limit of 4 mph and serves residential and commercial uses in the area. Cecil Avenue is a two-lane undivided local roadway that extends from Severn Chapel Road to north of Millersville Road. This roadway segment has a posted speed limit of 35 mph (25 mph north of Millersville Road) and primarily serves residential uses in the area. MILLERSVILLE PARK TRAFFIC IMPACT ANALYSIS ANNE ARUNDEL COUNTY, MARYLAND February 23, 218 4
8 MD 3 NB MD 3 SB MD 3 SB MD 3 NB Cecil Avenue Cecil Avenue Millersville Road Indian Landing Road Waterbury Road Millersville Road MD 178 MD 178 Indian Landing Road 6 SITE MD 175 MD Millersville Road 5 Waterbury Road 3 Millersville Road 1 2 Cecil Avenue Millersville Road Millersville Road MD 175 Millersville Road C:\Users\shourie_kondagari\Desktop\north-arrow-3-symbols-arrows-free-autocad-blocks-3_dwg.png N.T.S Legend Proposed Site Driveway (Future) Figure 2 Existing Lane Use and Traffic Control
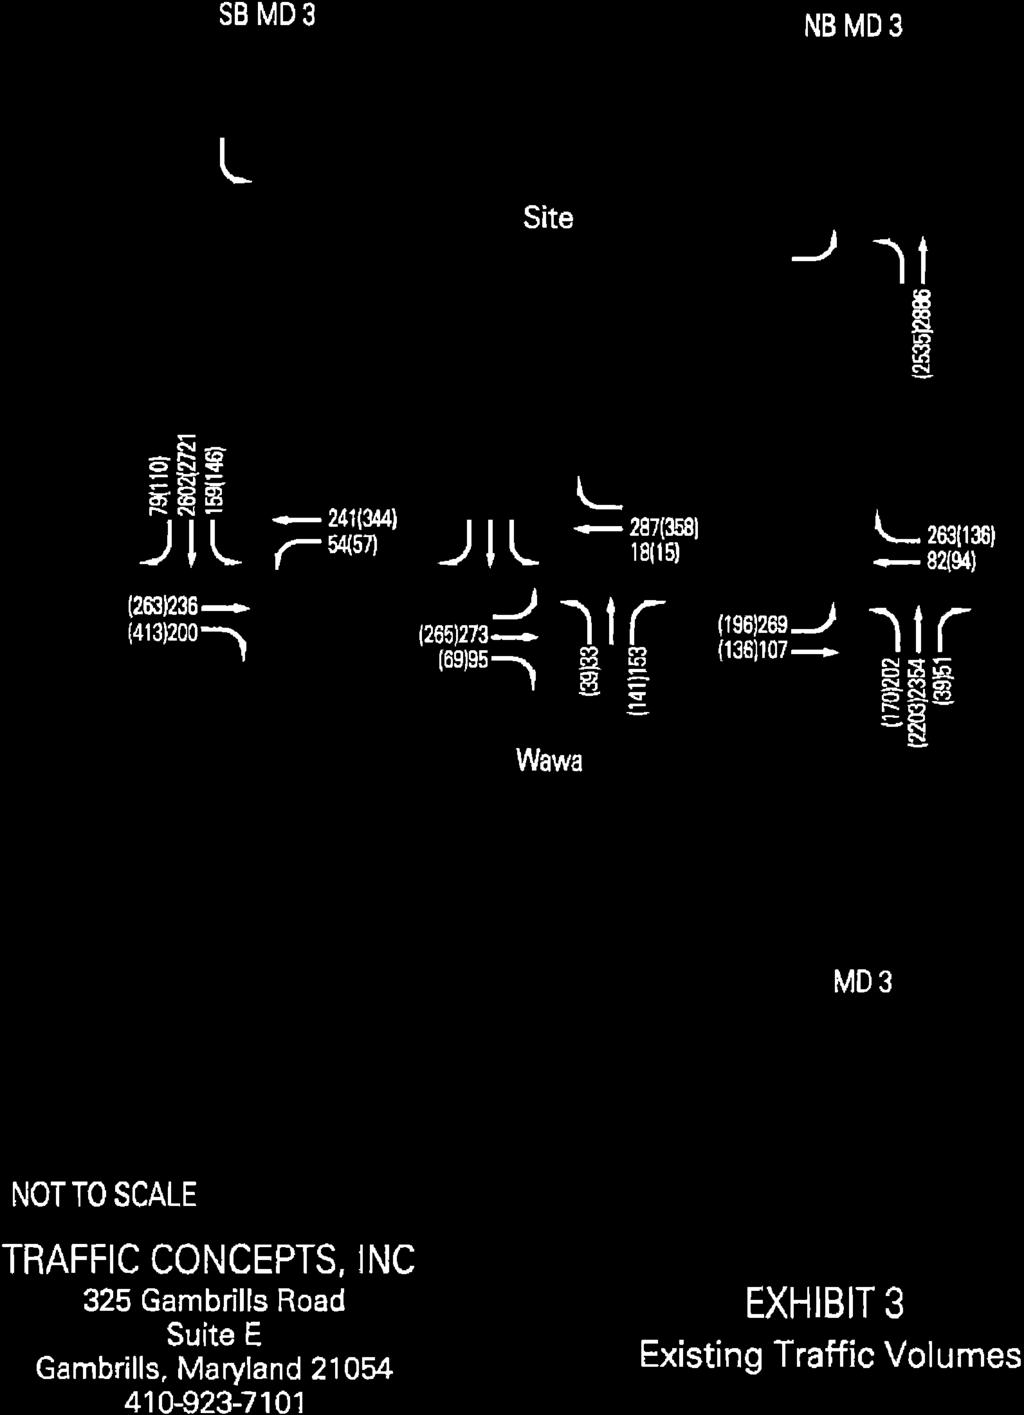
9 Site Access Access to the site will be provided via a proposed driveway connecting to Millersville Road. The proposed access is anticipated to include one (1) entering lane and two (2) exiting lanes. Vehicular Traffic Counts Existing weekday AM and PM peak hour vehicular traffic counts for the following study intersections were obtained from the 213 Gambrills Royal Farm Study by Traffic Concepts, Inc.: MD 175 (Annapolis Road) at MD 3 Southbound Millersville Road at MD 3 Northbound Figure 3 shows the existing turning movement counts. Additional information obtained from the Gambrills Royal Farms Study is included in Appendix A. Traffic counts for the remaining three intersections listed below were performed on Thursday, February 25, 216 from 6 AM to 9AM and 4 PM to 7 PM. The counts are shown in Appendix B. These intersections include: Millersville Road at Cecil Avenue Millersville Road at Waterbury Road Millersville Road at MD 178 (Generals Highway) Weekend turning movement counts were performed on Saturday, December 2, 217 and Sunday, December 3, 217 from 8 AM to 2 PM by O.R. George and Associates at the five intersections listed above. The counts are shown in Appendix C. Existing road tube traffic counts, provided by the Anne Arundel County Traffic Engineering Division, were performed from Wednesday, September 17, 214 to Monday, September 22, 214, on Millersville Road just east and west of Cecil Avenue. The counts are shown in Appendix D. Existing Weekend Volumes The 214 road tube counts had an eastbound peak hour volume that was dramatically higher than those found in the 217 turning movement counts. Therefore, in order to allow for analysis of a worst case scenario, the road tube volume was distributed along eastbound Millersville Rd, using the turning movement counts splits. All other movements used the weekend counts, which had a system peak of 12:15 PM to 1:15 PM on Saturday and 12: PM to 1: PM on Sunday. The Saturday and Sunday Volumes are shown in Appendix E and Appendix F. MILLERSVILLE PARK TRAFFIC IMPACT ANALYSIS ANNE ARUNDEL COUNTY, MARYLAND February 23, 218 6
10 MD 3 NB MD 3 SB CECIL AVENUE MD 3 NB MD 3 SB PROPOSED SITE DRIVEWAY CECIL AVENUE 3(1)[]:3: 27(21)[28]:62: WATERBURY ROAD 35(4)[26]:22: 19(34)[15]:18: MILLERSVILLE ROAD INDIAN LANDING ROAD 3(51)[59]:82: 12(16)[21]:35: MD (42)[14]:1: 37(37)[229]:192: 113(124)[29]:71: 14(17)[1]:16: 17(18)[16]:15: 22(28)[19]:21: 19(18)[12]:8: 364(33)[263]:288: 9(78)[88]:19: 43(92)[259]:249: MD 178 Indian Landing Road 6 SITE MD (263)[373]:329: 2(413)[398]:32: 159(146)[168]:247: 262(2721)[221]:1779: 79(11)[146]:129: 241(344)[253]:247: 54(57)[68]:82: MD MILLERSVILLE ROAD MILLERSVILLE ROAD 127(154)[443]:428: SEE NOTE 1 223(177)[14]:185: 4 Millersville Road 167(116)[114]:163: 47(89)[19]:32: MILLERSVILLE ROAD 5 Waterbury Road MILLERSVILLE ROAD 69(121)[324]:348: 28(25)[19]:8: 2 Cecil Avenue 1 MD (196)[266]:226: 17(136)[275]:35: 22(17)[213]:181: 2354(223)[1979]:162: MILLERSVILLE ROAD 51(39)[169]:143: 263(136)[94]:147: 82(94)[18]:148: 2(5)[3]:5: 98(131)[398]:363: 51(72)[43]:125: 2(2)[7]:3: 3()[1]:3: 8(4)[2]:15: MILLERSVILLE ROAD 153(14)[8]:149: (5)[4]:1: 176(127)[12]:131: 47(45)[16]:53: MILLERSVILLE ROAD C:\Users\shourie_kondagari\Desktop\north-arrow-3-symbols-arrows-free-autocad-blocks-3_dwg.png N.T.S Legend AM(PM)[SAT]:SUN: Proposed Site Driveway (Future) Notes: 1.Traffic volumes for the intersection of Millersville Road and the Proposed Site Driveway were pulled from the intersection of Millersville Road and Cecil Avenue Figure 3 Existing Conditions AM, PM, Saturday, and Sunday Peak Hour Vehicular Traffic Volumes
11 Existing Level of Service In this report, the existing condition operational analyses were performed at the following intersections: MD 175 (Annapolis Road) at MD 3 Southbound Millersville Road at MD 3 Northbound Millersville Road at Cecil Avenue Millersville Road at Waterbury Road Millersville Road at MD 178 (Generals Highway) The operational analysis for the aforementioned intersections was based on the review of existing lane use, traffic control, and traffic counts. The analyses were conducted using the CLV methodology. A summary of the results of the intersection analyses is presented in Table 1. Copies of the analyses are included in Appendix G. As shown in Table 1, each of the two signalized intersections on MD 3 currently operate at overall LOS E or better during the weekday AM, weekday PM, Saturday, and Sunday peak hours. The remaining three intersections currently operate at overall LOS A during the weekday AM, weekday PM, Saturday, and Sunday peak hours. The peak hour is defined as the hour with highest volume, by intersection, during the weekday AM peak (considered 6-9 AM), weekday PM peak (4-7 PM), and weekend peak (9 AM-2PM). MILLERSVILLE PARK TRAFFIC IMPACT ANALYSIS ANNE ARUNDEL COUNTY, MARYLAND February 23, 218 8
12 Existing Conditions Intersection Levels of Service Summary Existing Intersection Movement AM PM SAT SUN 1. MD 175 (Annapolis Road) & MD 3 (Crain Highway) SB CLV V/C LOS D E D B 2. Millersville Road & MD 3 (Crain Highway) NB CLV V/C LOS D C C B 3. Millersville Road & Cecil Avenue CLV V/C LOS A A A A 4. Millersville Road & Proposed Site Driveway CLV N/A N/A N/A N/A V/C N/A N/A N/A N/A LOS N/A N/A N/A N/A 5. Millersville Road & Waterbury Road CLV V/C LOS A A A A 6. Millersville Road & MD 178 (Generals Highway) CLV V/C LOS A A A A Crash Data Analysis Existing crash data was obtained for the following intersections: Millersville Road at Cecil Avenue Millersville Road at Waterbury Road Tables 2a and 2b show a breakdown of the crashes at each of these intersections. Raw crash data is shown in Appendix H. As shown in Tables 2a and 2b, the intersection of Millersville Road and Waterbury Road experienced an average of 3.4 crashes per year between 211 and 215; the intersection of Millersville Road and Cecil Avenue experienced an average of 2.5 crashes per year between the years 211 and 214. Crash data was not obtained for the other three intersections, due to the intersections being located far from the proposed entrance. MILLERSVILLE PARK TRAFFIC IMPACT ANALYSIS ANNE ARUNDEL COUNTY, MARYLAND February 23, 218 9
13 Table 2a: Existing Crash Data (Millersville Road & Waterbury Road) Table 2b: Existing Crash Data (Millersville Road & Cecil Avenue) MILLERSVILLE PARK TRAFFIC IMPACT ANALYSIS ANNE ARUNDEL COUNTY, MARYLAND February 23, 218 1
14 IV. FUTURE BACKGROUND CONDITIONS The future background conditions without the subject development were analyzed. The future background conditions are defined to be the compilation of the: Existing Conditions Natural growth rate of 1.5 percent over four years (from 216, when the weekend turning movement counts were conducted to 22 horizon year) Anticipated traffic from background developments listed below The inclusion of the 1.5 percent natural annual growth rate was recommended by Anne Arundel County Planning and Zoning, Long Range Planning Division to account for added cut-through traffic not reflected in the background developments. Background Developments The background developments included in the 213 Gambrills Royal Farms Study were also considered in this study due to their close proximity to the proposed tennis center. Below is the list of background developments taken into account: Subway Auto Body Kiddie Academy Gambrills Business Park EZ Storage Knollwood Manor Summerfield Village Waugh Chapel South Wilson Grove Dollar General Auto Zone Trip Generation and Distribution for Background Developments Weekday trip generation for the above referenced background developments was obtained from previously approved traffic studies and/or the standard rates or equations found in the ITE Trip Generation Manual. As shown in Table 3, these background developments will add a total of 997 AM peak hour trips and 1,366 PM peak hour trips to the roadway network. Separate trip generation/distribution analyses were not performed for Saturday and Sunday conditions; instead, it was assumed that the weekend volumes were to be the summation of AM and PM volumes. The distribution of peak hour trips that would be generated by the approved background projects was determined based on information in the 213 Gambrills Royal Farms Study. This information is included in Appendix I. The trips generated by the background projects shown in Table 3 were assigned to the network, and the resulting traffic assignments are shown in Figure 4. MILLERSVILLE PARK TRAFFIC IMPACT ANALYSIS ANNE ARUNDEL COUNTY, MARYLAND February 23,
15 Table 3: Background Developments Trip Generation Summary MILLERSVILLE PARK TRAFFIC IMPACT ANALYSIS ANNE ARUNDEL COUNTY, MARYLAND February 23,
16 MD 3 SB MD 3 NB 2(11)[13]:13: CECIL AVENUE MD 3 NB MD 3 SB PROPOSED SITE DRIVEWAY CECIL AVENUE 15(13)[28]:28: ()[]:: ()[]:: WATERBURY ROAD 3(3)[6]:6: ()[]:: MILLERSVILLE ROAD INDIAN LANDING ROAD 4(6)[1]:1: 1(2)[3]:3: 5(1)[15]:15: MD 178 ()[]:: ()[]:: 7(5)[12]:12: ()[]:: 1(1)[2]:2: ()[]:: ()[]:: ()[]:: 6(3)[9]:9: MD 178 Indian Landing Road 6 SITE 17(12)[29]:29: MD 175 2(28)[48]:48: 24(18)[42]:42: ()[]:: 92(146)[238]:238: 4(4)[8]:8: 38(51)[89]:89: 82(74)[156]:156: MD MILLERSVILLE ROAD 14(22)[36]:36: MILLERSVILLE ROAD 4 Millersville Road 14(9)[23]:23: ()[]:: MILLERSVILLE ROAD 5 Waterbury Road MILLERSVILLE ROAD 1(18)[28]:28: 4(4)[8]:8: 2 Cecil Avenue 1 MD (62)[121]:121: 156(168)[324]:324: ()[]:: ()[]:: ()[]:: ()[]:: 17(12)[29]:29: ()[]:: MILLERSVILLE ROAD 2(4)[6]:6: 19(24)[43]:43: 8(9)[17]:17: 24(16)[4]:4: MILLERSVILLE ROAD MILLERSVILLE ROAD (1)[1]:1: 14(22)[36]:36: 7(12)[19]:19: C:\Users\shourie_kondagari\Desktop\north-arrow-3-symbols-arrows-free-autocad-blocks-3_dwg.png N.T.S Legend AM(PM)[SAT]:SUN: Proposed Site Driveway (Future) Notes: 1.Weekend traffic volumes for the pipeline developments were not available. To perform a conservative analysis, the weekend volumes were assumed to be a summation of the AM and PM volumes. Figure 4 Pipeline Developments AM, PM, Saturday, and Sunday Peak Hour Vehicular Traffic Volumes
17 Background Condition Traffic Forecasts Background future traffic volumes were estimated by adding existing traffic volumes (see Figure 3), traffic assignments from the background developments (see Figure 4), and a 1.5 percent annual growth rate to the existing volumes to account for background development not captured by the identified developments. The 1.5 percent growth factor was recommended by Anne Arundel County Planning and Zoning, Long Range Planning Division based on growth rates of similar roadway types near the study area in the Baltimore Metropolitan Council s travel demand model. The resulting background condition traffic forecasts are shown on Figure 5. Individual traffic assignments at each of the study intersections are also shown in the intersection turning movement volume spreadsheets in Appendix I. MILLERSVILLE PARK TRAFFIC IMPACT ANALYSIS ANNE ARUNDEL COUNTY, MARYLAND February 23,
18 MD 3 SB MD 3 SB MD 3 NB CECIL AVENUE MD 3 NB PROPOSED SITE DRIVEWAY CECIL AVENUE 4(2)[]:4: 29(23)[3]:65: WATERBURY ROAD 41(46)[34]:3: 21(37)[16]:19: MILLERSVILLE ROAD INDIAN LANDING ROAD 36(61)[72]:96: 14(19)[25]:4: MD (45)[15]:11: 393(393)[24]:21: 127(137)[43]:87: 15(19)[11]:17: 2(21)[19]:18: 24(3)[2]:22: 21(2)[13]:9: 387(351)[276]:32: 12(86)[12]:123: 51(18)[288]:276: MD 178 Indian Landing Road 6 SITE MD (38)[44]:393: 237(457)[459]:358: 169(155)[176]:259: 2854(334)[254]:299: 88(121)[161]:143: 294(417)[355]:348: 14(135)[228]:242: MD MILLERSVILLE ROAD 149(186)[491]:485: 254(2)[178]:224: MILLERSVILLE ROAD 4 Millersville Road 192(133)[144]:194: 5(95)[2]:34: MILLERSVILLE ROAD 5 Waterbury Road MILLERSVILLE ROAD 84(147)[369]:393: 34(31)[122]:92: 2 Cecil Avenue 1 MD (213)[285]:243: 133(169)[332]:41: 274(243)[344]:311: 2655(257)[2394]:218: MILLERSVILLE ROAD 57(53)[19]:163: 288(154)[116]:171: 112(116)[155]:195: 3(7)[5]:7: 119(162)[453]:416: 62(89)[64]:15: 3(3)[8]:4: 4()[2]:4: 9(5)[3]:16: MILLERSVILLE ROAD 178(162)[112]:184: (6)[5]:2: 24(147)[156]:166: 5(48)[17]:56: MILLERSVILLE ROAD Legend AM(PM)[SAT]:SUN: Proposed Site Driveway (Future) C:\Users\shourie_kondagari\Desktop\north-arrow-3-symbols-arrows-free-autocad-blocks-3_dwg.png N.T.S Figure 5 Background Conditions AM, PM, Saturday, and Sunday Peak Hour Vehicular Traffic Volumes
19 Future Background Conditions Level of Service Analysis Background Conditions Levels of Service (LOS) at the study intersections were computed based on the existing lane use and traffic control shown on Figure 2 and background peak hour traffic volumes shown on Figure 5. CLV methodology was used to determine operational capacity of these intersections. The results of the capacity analyses are summarized in Table 4. Copies of the CLV analyses conducted for background conditions are included in Appendix J. As indicated in Table 4: MD 3 (SB) at MD 175 will go from a LOS D to a LOS E during the weekday AM peak hour. During the weekday PM peak hour, the MD 3 (SB) at MD 175 intersection will go from a LOS E to a LOS F. During the Saturday peak hour, the MD 3 (SB) at MD 175 intersection will go from a LOS D to a LOS F. During the Sunday peak hour, the MD 3 (SB) at MD 175 intersection will go from a LOS B to a LOS E. MD 3 (NB) at Millersville Road will go from a LOS D to a LOS F during the weekday AM peak hour, and from a LOS C to a LOS D during the weekday PM peak hour. During the Saturday peak hour, the MD 3 (NB) at Millersville Road intersection will go from a LOS C to a LOS E. During the Sunday peak hour, the MD 3 (NB) at Millersville Road intersection will go from a LOS B to a LOS D. Millersville Road at MD 178 (Generals Highway) will go from a LOS A to a LOS B during the Sunday peak hour. The LOS at the remaining peaks will remain LOS A. The remaining two intersections will continue to operate at overall LOS A during the weekday AM, weekday PM, Saturday, and Sunday peak hours. MILLERSVILLE PARK TRAFFIC IMPACT ANALYSIS ANNE ARUNDEL COUNTY, MARYLAND February 23,
20 Table 4: Background Conditions Intersection Levels of Service Summary Intersection Movement Existing Background AM PM SAT SUN AM PM SAT SUN 1. MD 175 (Annapolis Road) & MD 3 (Crain Highway) SB CLV V/C LOS D E D B E F F E 2. Millersville Road & MD 3 (Crain Highway) NB CLV V/C LOS D C C B F D E D 3. Millersville Road & Cecil Avenue CLV V/C LOS A A A A A A A A 4. Millersville Road & Proposed Site Driveway CLV N/A N/A N/A N/A N/A N/A N/A N/A V/C N/A N/A N/A N/A N/A N/A N/A N/A LOS N/A N/A N/A N/A N/A N/A N/A N/A 5. Millersville Road & Waterbury Road CLV V/C LOS A A A A A A A A 6. Millersville Road & MD 178 (Generals Highway) CLV V/C LOS A A A A A A A B MILLERSVILLE PARK TRAFFIC IMPACT ANALYSIS ANNE ARUNDEL COUNTY, MARYLAND February 23,
21 V. FUTURE CONDITIONS ANALYSIS WITH DEVELOPMENT Site Vehicle-Trip Generation Analysis The proposed Millersville Park will include 26 tennis courts. The AM, PM, Saturday, and Sunday peak trips generated from the proposed development were estimated using the rates/equations established in the ITE Trip Generation Manual (9 th Edition) and feedback from the Tennis Alliance of Anne Arundel County. For this analysis, ITE Land Use Code 491 was utilized (Racquet/Tennis Club). In addition, the Tennis Alliance provided the County with estimates for the number of players that would be anticipated to use the facility based on the time of day, day of the week, and time of the year. The volumes from these analyses are shown in Table 5. It is important to note that one player does not necessarily equal one vehicle. As shown in Table 5, the highlighted numbers are those that were used for the Critical Lane Volume Analysis. The Tennis Alliance estimated number of players in the summer is the worst case scenario. An 8 percent factor was used to adjust these figures from a worst case scenario to a scenario likely to be found on a recurring basis during the summer. The resulting figures are shown in Table 5 under Summer 8% applied. Not all players will drive alone, but this conservative number was used for this number of trips to account for spectators, other users of Millersville Park, and employees. The higher volume from each method (ITE, Tennis Alliance- Winter, and Tennis Alliance- 8% Summer Condition) was used for the Critical Lane Volume Analysis. MILLERSVILLE PARK TRAFFIC IMPACT ANALYSIS ANNE ARUNDEL COUNTY, MARYLAND February 23,
22 Table 5: Millersville Park Trip Generation Analysis ITE Trip Generation 1 ITE AM Peak Hour PM Peak Hour SAT Peak Hour SUN Peak Hour Land Use Land Use Size Units Code In Out Total In Out Total In Out Total In Out Total Tennis Club 26 Courts Tennis Alliance Trip Generation Winter: AM Peak Hour PM Peak Hour SAT Peak Hour SUN Peak Hour Land Use Size Units In Out Total In Out Total In Out Total In Out Total Tennis Club Summer (Worst Case Scenario): AM Peak Hour PM Peak Hour SAT Peak Hour SUN Peak Hour Land Use Size Units In Out Total In Out Total In Out Total In Out Total Tennis Club Summer (8% applied): AM Peak Hour PM Peak Hour SAT Peak Hour SUN Peak Hour Land Use Size Units In Out Total In Out Total In Out Total In Out Total Tennis Club Overall (Maximum of ITE and Tennis Alliance Projection) Land Use Tennis Club AM Peak Hour PM Peak Hour SAT Peak Hour SUN Peak Hour Size Units In Out Total In Out Total In Out Total In Out Total Source: ITE Trip Generation Manual (9 th Edition) Land Use Code 491 MILLERSVILLE PARK TRAFFIC IMPACT ANALYSIS ANNE ARUNDEL COUNTY, MARYLAND February 23,
23 Site Traffic Assignment The site distribution was based on a review of existing traffic volumes and knowledge of the surrounding area. The site trip distribution is shown in Figure 6. The resultant site-generated traffic assignments are shown in Figure 7. Future Condition Traffic Forecasts The site trips generated by the proposed development, shown in Figure 7, were added to the background traffic forecasts (Figure 5) to yield total future traffic forecasts. The resulting total future traffic forecasts are presented in Figure 8. MILLERSVILLE PARK TRAFFIC IMPACT ANALYSIS ANNE ARUNDEL COUNTY, MARYLAND February 23, 218 2
24 1% Indian Landing Road 5% 6 5% SITE 25% 5%* 4 Millersville Road 5 5% Waterbury Road 3 5%* 2 1% Cecil Avenue 3% 1 C:\Users\shourie_kondagari\Desktop\north-arrow-3-symbols-arrows-free-autocad-blocks-3_dwg.png Legend Proposed Site Driveway (Future) N.T.S Note: * Represents trip distribution from the residential development along Millersville Road Figure 6 Site Trip Distribution
25 MD 3 SB MD 3 SB MD 3 NB MD 3 NB ()[]:: ()[]:: 5(6)[5]:2: PROPOSED SITE DRIVEWAY CECIL AVENUE CECIL AVENUE ()[]:: ()[]:: 5(6)[5]:4: WATERBURY ROAD 3(3)[3]:2: ()[]:: INDIAN LANDING ROAD MILLERSVILLE ROAD 1(3)[3]:2: ()[]:: (3)[3]:2: MD 178 ()[]:: ()[]:: ()[]:: ()[]:: ()[]:: 2(3)[2]:1: ()[]:: ()[]:: 2(3)[2]:2: MD 178 Indian Landing Road 6 MD (18)[18]:12: ()[]:: 12(15)[12]:1: ()[]:: ()[]:: 5(17)[17]:12: 4(15)[13]:1: MD MILLERSVILLE ROAD 41(49)[42]:29: ()[]:: 14(5)[45]:31: 2(9)[9]:6: 7(9)[7]:5: ()[]:: MILLERSVILLE ROAD SITE 4 Millersville Road ()[]:: 4(6)[4]:3: MILLERSVILLE ROAD 5 Waterbury Road MILLERSVILLE ROAD 1 2 Cecil Avenue ()[]:: 31(39)[35]:24: ()[]:: 2(3)[2]:1: ()[1]:: ()[]:: MILLERSVILLE ROAD 1(3)[3]:2: 1(38)[36]:25: 2(6)[6]:4: MILLERSVILLE ROAD 1(6)[6]:4: 1(3)[3]:2: MD 175 ()[]:: 26(33)[3]:22: 1(6)[6]:3: 9(32)[3]:22: MILLERSVILLE ROAD Legend AM(PM)[SAT] Proposed Site Driveway (Future) C:\Users\shourie_kondagari\Desktop\north-arrow-3-symbols-arrows-free-autocad-blocks-3_dwg.png N.T.S Figure 7 Site Generated AM, PM, Saturday, and Sunday Peak Hour Vehicular Traffic Volumes
26 MD 3 SB MD 3 NB MD 3 SB MD 3 NB PROPOSED SITE DRIVEWAY CECIL AVENUE CECIL AVENUE 4(2)[]:4: 34(29)[35]:69: WATERBURY ROAD 44(49)[37]:32: 21(37)[16]:19: MILLERSVILLE ROAD INDIAN LANDING ROAD 37(64)[75]:98: 14(19)[25]:4: MD (45)[15]:11: 393(393)[24]:21: 129(14)[45]:88: 15(19)[11]:17: 2(21)[19]:18: 24(3)[2]:22: 21(2)[13]:9: 387(351)[276]:32: 14(89)[14]:125: 51(111)[291]:278: MD 178 Indian Landing Road 6 MD (326)[458]:45: 237(457)[459]:358: 181(17)[188]:269: 2854(334)[254]:299: 88(121)[161]:143: 299(434)[372]:36: 144(15)[241]:252: MD MILLERSVILLE ROAD 41(49)[42]:29: 149(186)[491]:485: 2(9)[9]:6: 14(5)[45]:31: 7(9)[7]:5: 254(2)[178]:224: MILLERSVILLE ROAD SITE 4 Millersville Road 196(139)[148]:197: 5(95)[2]:34: MILLERSVILLE ROAD 5 Waterbury Road MILLERSVILLE ROAD 85(153)[375]:397: 35(34)[125]:94: 2 Cecil Avenue 1 MD (213)[285]:243: 159(22)[362]:432: 274(243)[344]:311: 2655(257)[2394]:218: MILLERSVILLE ROAD 62(59)[195]:165: 289(16)[122]:174: 121(148)[185]:217: 3(7)[5]:7: 15(21)[488]:44: 5(6)[1]:5: 4()[3]:5: 9(5)[3]:16: MILLERSVILLE ROAD 62(89)[64]:15: 178(162)[112]:184: 1(9)[8]:4: 214(185)[192]:191: 52(54)[23]:6: MILLERSVILLE ROAD Legend AM(PM)[SAT] Proposed Site Driveway (Future) C:\Users\shourie_kondagari\Desktop\north-arrow-3-symbols-arrows-free-autocad-blocks-3_dwg.png N.T.S Figure 8 Total Future Conditions AM, PM, Saturday, and Sunday Peak Hour Vehicular Traffic Volumes
27 Total Future Levels of Service Total future peak hour Levels of Service with the proposed developments were computed at the study intersections based on the existing lane use and traffic control shown on Figure 2, total future traffic volumes shown on Figure 8, and the CLV analysis procedures. The results are summarized in Table 6. Copies of the CLV analysis conducted for total future conditions are included in Appendix K. As indicated in Table 6 comparing Background and Total Future conditions: MD 3 (SB) at MD 175 will remain at the same level of service under all hours analyzed (weekday AM peak, weekday PM peak, Saturday peak and Sunday peak). MD 3 (NB) at Millersville Road will remain at the same level of service under all hours analyzed, with the exception of the Sunday peak. During that hour, level of service is expected to drop from LOS D to LOS E, with volume-to-capacity ratio increasing slightly, from.88 to.91. Millersville Road at MD 178 (Generals Highway) will remain at the same level of service under all hours analyzed (weekday AM peak, weekday PM peak, Saturday peak and Sunday peak). The remaining two existing intersections will continue to operate at overall LOS A during the weekday AM, weekday PM, Saturday, and Sunday peak hours. The Millersville Road & Proposed Site Driveway intersection is expected to operate at overall LOS A during the weekday AM, weekday PM, Saturday, and Sunday peak hours. Table 6: Total Future Conditions Intersection Levels of Service Summary Intersection Movement Existing Background Total Future AM PM SAT SUN AM PM SAT SUN AM PM SAT SUN 1. MD 175 (Annapolis Road) & MD 3 (Crain Highway) SB CLV V/C LOS D E D B E F F E E F F E 2. Millersville Road & MD 3 (Crain Highway) NB CLV V/C LOS D C C B F D E D F D E E 3. Millersville Road & Cecil Avenue CLV V/C LOS A A A A A A A A A A A A 4. Millersville Road & Proposed Site Driveway CLV N/A N/A N/A N/A N/A N/A N/A N/A V/C N/A N/A N/A N/A N/A N/A N/A N/A LOS N/A N/A N/A N/A N/A N/A N/A N/A A A A A 5. Millersville Road & Waterbury Road CLV V/C LOS A A A A A A A A A A A A 6. Millersville Road & MD 178 (Generals Highway) CLV V/C LOS A A A A A A A B A A A B VI. SUMMARY In conclusion, the proposed site is not expected to have a significant impact on traffic within the study area. When comparing the Total Future scenario and the Background scenario, as indicated in Table 6, although the CLV would increase slightly with the proposed development, the LOS does not deteriorate compared to the Future Background Conditions for any of the intersections within the MILLERSVILLE PARK TRAFFIC IMPACT ANALYSIS ANNE ARUNDEL COUNTY, MARYLAND February 23,
28 study area, with the exception of MD 3 (NB) at Millersville Road, which is expected to drop during the Sunday peak hour from LOS D to LOS E, with volume-to-capacity ratio increasing slightly, from.88 to.91. MILLERSVILLE PARK TRAFFIC IMPACT ANALYSIS ANNE ARUNDEL COUNTY, MARYLAND February 23,
29 Appendix A Existing Traffic Volume Information from Gambrills Royal Farms Study
30
31 Appendix B Existing Turning Movement Counts
32 Day of Week, Date: Thursday, 2/25/16 Weather: PC, 55 o Intersection: Millersville Rd (EB/WB) / Cecil Ave (NB/SB) Counted by: George B Direction NB NB NB EB EB EB SB SB SB WB WB WB Movement Left Thru Right Left Thru Right Left Thru Right Left Thru Right Mvnt # Ending Time TOTAL 6:15 AM :3 AM :45 AM : AM :15 AM :3 AM :45 AM : AM :15 AM :3 AM :45 AM : AM TOTAL PEAK HOUR Direction NB NB NB EB EB EB SB SB SB WB WB WB Movement Left Thru Right Left Thru Right Left Thru Right Left Thru Right Mvnt # Ending Time TOTAL 4:15 PM :3 PM :45 PM : PM :15 PM :3 PM :45 PM : PM :15 PM :3 PM :45 PM : PM TOTAL PEAK HOUR
33 Day of Week, Date: Thursday, 2/25/16 Weather: PC, 55 o Intersection: Millersville Rd (NB/SB) / Waterbury Rd (WB) Counted by: Tim H Direction NB NB NB EB EB EB SB SB SB WB WB WB Movement Left Thru Right Left Thru Right Left Thru Right Left Thru Right Mvnt # Ending Time TOTAL 6:15 AM :3 AM :45 AM : AM :15 AM :3 AM :45 AM : AM :15 AM :3 AM :45 AM : AM TOTAL PEAK HOUR Direction NB NB NB EB EB EB SB SB SB WB WB WB Movement Left Thru Right Left Thru Right Left Thru Right Left Thru Right Mvnt # Ending Time TOTAL 4:15 PM :3 PM :45 PM : PM :15 PM :3 PM :45 PM : PM :15 PM :3 PM :45 PM : PM TOTAL PEAK HOUR
34 Day of Week, Date: Thursday, 2/25/16 Weather: PC, 55 o Intersection: Millersville Rd (NB/SB) / MD 178 (EB/WB) Counted by: Brian L Direction NB NB NB EB EB EB SB SB SB WB WB WB Movement Left Thru Right Left Thru Right Left Thru Right Left Thru Right Mvnt # Ending Time TOTAL 6:15 AM :3 AM :45 AM : AM :15 AM :3 AM :45 AM : AM :15 AM :3 AM :45 AM : AM TOTAL PEAK HOUR Direction NB NB NB EB EB EB SB SB SB WB WB WB Movement Left Thru Right Left Thru Right Left Thru Right Left Thru Right Mvnt # Ending Time TOTAL 4:15 PM :3 PM :45 PM : PM :15 PM :3 PM :45 PM : PM :15 PM :3 PM :45 PM : PM TOTAL PEAK HOUR
35 Appendix C Existing Weekend Turning Movement Counts
36 ANNE ARUNDEL COUNTY DEPARTMENT OF PUBLIC WORKS & TRANSPORTATION MILLERSVILLE PARK MASTER PLAN STUDY INTERSECTION TURNING MOVEMENT COUNT DATA SHEET (6-HOUR: 8: AM - 2: PM) Location: MD 3 SB at MD 175 City/Area: Millersville Technician: ORGA-AL/MD Weather: Clear/Cold Time Period (Ending) Left Thru Right U-Turn Total Left Thru Right U-Turn Total Left Thru Right U-Turn Total Left Thru Right U-Turn Total 8: : : : : : : : : : : : : : : : : : : : : : : : Peak Hour Total SATURDAY (12/2/217) All Vehicles MD 3 MD 3 MD 175 MD 175 From North From South From East From West 88 2, , ,349 Interval Total Period Total , , ,376 1, ,931 2,881 17,133 Time Period (Ending) Left Thru Right U-Turn Total Left Thru Right U-Turn Total Left Thru Right U-Turn Total Left Thru Right U-Turn Total 8: : : : : : : : : : : : : : : : : : : : : : : : Peak Hour Total SUNDAY (12/3/217) All Vehicles MD3 MD 3 MD 175 MD 175 From North From South 134 1, , ,851 From East From West Interval Total Period Total 613 9, , ,156 1, ,363 2,253 13,866 Data Collection by: O. R. George & Associates, Inc.
37 ANNE ARUNDEL COUNTY DEPARTMENT OF PUBLIC WORKS & TRANSPORTATION MILLERSVILLE PARK MASTER PLAN STUDY INTERSECTION TURNING MOVEMENT COUNT DATA SHEET (6-HOUR: 8: AM - 2: PM) Location: MD 3 NB at MD 175/Millersville Road City/Area: Millersville Technician: ORGA-AL/MD Weather: Clear/Cold Time Period (Ending) Left Thru Right U-Turn Total Left Thru Right U-Turn Total Left Thru Right U-Turn Total Left Thru Right U-Turn Total 8: : : : : : : : : : : : : : : : : : : : : : : : Peak Hour Total MD 3 From North MD 3 From South SATURDAY (12/2/217) All Vehicles Millersville Road 213 1, , ,82 From East MD 175 From West Interval Total Period Total 1,18 1, , , ,883 14,466 Time Period (Ending) Left Thru Right U-Turn Total Left Thru Right U-Turn Total Left Thru Right U-Turn Total Left Thru Right U-Turn Total 8: : : : : : : : : : : : : : : : : : : : : : : : Peak Hour Total SUNDAY (12/3/217) All Vehicles MD 3 MD 3 Millersville Road MD 175 From North From South From East From West 181 1, , ,547 Interval Total Period Total 872 8, , ,154 1, ,11 12,541 Data Collection by: O. R. George & Associates, Inc.
38 ANNE ARUNDEL COUNTY DEPARTMENT OF PUBLIC WORKS & TRANSPORTATION MILLERSVILLE PARK MASTER PLAN STUDY INTERSECTION TURNING MOVEMENT COUNT DATA SHEET (6-HOUR: 8: AM - 2: PM) Location: Millersville Road at Cecil Avenue City/Area: Millersville Technician: ORGA-AL/MD Weather: Clear/Cold Time Period (Ending) Left Thru Right U-Turn Total Left Thru Right U-Turn Total Left Thru Right U-Turn Total Left Thru Right U-Turn Total 8: : : : : : : : : : : : : : : : : : : : : : : : Peak Hour Total Cecil Avenue Cecil Avenue SATURDAY (12/2/217) All Vehicles Millersville Road Millersville Road From North From South From East From West Interval Total Period Total ,811 Time Period (Ending) Left Thru Right U-Turn Total Left Thru Right U-Turn Total Left Thru Right U-Turn Total Left Thru Right U-Turn Total 8: : : : : : : : : : : : : : : : : : : : : : : : Peak Hour Total SUNDAY (12/3/217) All Vehicles Cecil Avenue Cecil Avenue Millersville Road Millersville Road From North From South From East From West Interval Total Period Total ,144 2,631 Data Collection by: O. R. George & Associates, Inc.
39 ANNE ARUNDEL COUNTY DEPARTMENT OF PUBLIC WORKS & TRANSPORTATION MILLERSVILLE PARK MASTER PLAN STUDY INTERSECTION TURNING MOVEMENT COUNT DATA SHEET (6-HOUR: 8: AM - 2: PM) Location: Millersville Road at Waterbury Road City/Area: Millersville Technician: ORGA-AL/MD Weather: Clear/Cold Time Period (Ending) Left Thru Right U-Turn Total Left Thru Right U-Turn Total Left Thru Right U-Turn Total Left Thru Right U-Turn Total 8: : : : : : : : : : : : : : : : : : : : : : : : Peak Hour Total SATURDAY (12/2/217) All Vehicles Waterbury Road Millersville Road Millersville Road From North From South From East From West Interval Total Period Total ,251 Time Period (Ending) Left Thru Right U-Turn Total Left Thru Right U-Turn Total Left Thru Right U-Turn Total Left Thru Right U-Turn Total 8: : : : : : : : : : : : : : : : : : : : : : : : Peak Hour Total From North SUNDAY (12/3/217) All Vehicles Waterburry Road Millersville Road Millersville Road From South From East From West Interval Total Period Total ,38 Data Collection by: O. R. George & Associates, Inc.
40 ANNE ARUNDEL COUNTY DEPARTMENT OF PUBLIC WORKS & TRANSPORTATION MILLERSVILLE PARK MASTER PLAN STUDY INTERSECTION TURNING MOVEMENT COUNT DATA SHEET (6-HOUR: 8: AM - 2: PM) Location: MD 178 at Millersville Road City/Area: Millersville Technician: ORGA-AL/MD Weather: Clear/Cold Time Period (Ending) Left Thru Right U-Turn Total Left Thru Right U-Turn Total Left Thru Right U-Turn Total Left Thru Right U-Turn Total 8: : : : : : : : : : : : : : : : : : : : : : : : Peak Hour Total MD 178 (Generals Hwy) MD 178 (Generals Hwy) SATURDAY (12/2/217) All Vehicles Indian Landing Road Millersville Road From North From South From East From West Interval Total Period Total 75 1, , , , ,926 Time Period (Ending) Left Thru Right U-Turn Total Left Thru Right U-Turn Total Left Thru Right U-Turn Total Left Thru Right U-Turn Total 8: : : : : : : : : : : : : : : : : : : : : : : : Peak Hour Total SUNDAY (12/3/217) All Vehicles MD 178 (Generals Hwy) MD 178 (Generals Hwy) Indian Landing Road Millersville Road From North From South From East From West Interval Total Period Total 122 1, , , , ,927 Data Collection by: O. R. George & Associates, Inc.
41 Appendix D Existing Road Tube Counts
42 MetroCount Traffic Executive Weekly Vehicle Counts WeeklyVehicle English (ENU) Datasets: Site: [Counter 4 (GQ755HFM)] Millersville Rd east of Cecil Ave, <35 mph> Attribute: <35 mph> Direction: 2 - East bound, A trigger first. Lane: Survey Duration: 8: Tuesday, September 16, 214 => 14:15 Monday, September 22, 214, Zone: File: Counter 4 (GQ755HFM) EC (Plus ) Identifier: GQ755HFM MC56-L5 [MC55] (c)microcom 19Oct4 Algorithm: Factory default axle (v4.5) Data type: Axle sensors - Paired (Class/Speed/Count) Profile: Filter time: : Wednesday, September 17, 214 => : Monday, September 22, 214 (5) Included classes: 1, 2, 3, 4, 5, 6, 7, 8, 9, 1, 11, 12 Speed range: 6-99 mph. Direction: East (bound), P = East Separation: Headway > sec, Span ft Name: Default Profile Scheme: Vehicle classification (Scheme F3) Units: Non metric (ft, mi, ft/s, mph, lb, ton) In profile: Vehicles = / (45.32%)
43 Weekly Vehicle Counts WeeklyVehicle-12 Site: Counter 4 (GQ755HFM)..E Description: Millersville Rd east of Cecil Ave, <35 mph> Filter time: : Wednesday, September 17, 214 => : Monday, September 22, 214 Scheme: Vehicle classification (Scheme F3) Filter: Cls( ) Dir(E) Sp(6,99) Headway(>) Span( ) Mon Tue Wed Thu Fri Sat Sun Averages 15 Sep 16 Sep 17 Sep 18 Sep 19 Sep 2 Sep 21 Sep Hour -1 * * * * * * * * * * * * * * * * * * * * * * * * * * * * * * * * * * * * * * * * * * * * * * * * Totals 7-19 * * * * * * * * AM Peak * * * * PM Peak * * * * * - No data.
44 Weekly Vehicle Counts WeeklyVehicle-12 Site: Counter 4 (GQ755HFM)..E Description: Millersville Rd east of Cecil Ave, <35 mph> Filter time: : Wednesday, September 17, 214 => : Monday, September 22, 214 Scheme: Vehicle classification (Scheme F3) Filter: Cls( ) Dir(W) Sp(6,99) Headway(>) Span( ) Mon Tue Wed Thu Fri Sat Sun Averages 15 Sep 16 Sep 17 Sep 18 Sep 19 Sep 2 Sep 21 Sep Hour -1 * * * * * * * * * * * * * * * * * * * * * * * * * * * * * * * * * * * * * * * * * * * * * * * * Totals 7-19 * * * * * * * * AM Peak * * * * PM Peak * * * * * - No data.
45 Weekly Vehicle Counts WeeklyVehicle-12 Site: Counter 4 (GQ755HFM)..E Description: Millersville Rd east of Cecil Ave, <35 mph> Filter time: : Wednesday, September 17, 214 => : Monday, September 22, 214 Scheme: Vehicle classification (Scheme F3) Filter: Cls( ) Dir(EW) Sp(6,99) Headway(>) Span( ) Mon Tue Wed Thu Fri Sat Sun Averages 15 Sep 16 Sep 17 Sep 18 Sep 19 Sep 2 Sep 21 Sep Hour -1 * * * * * * * * * * * * * * * * * * * * * * * * * * * * * * * * * * * * * * * * * * * * * * * * Totals 7-19 * * * * * * * * AM Peak * * * * PM Peak * * * * * - No data.
46 MetroCount Traffic Executive Weekly Vehicle Counts WeeklyVehicle English (ENU) Datasets: Site: [Counter 3 (GQ34GK9V)] Millersville Rd west of Cecil Ave, <35 mph> Attribute: <35 mph> Direction: 2 - East bound, A trigger first. Lane: Survey Duration: 8: Tuesday, September 16, 214 => 14:5 Monday, September 22, 214, Zone: File: Counter 3 (GQ34GK9V) EC (Plus ) Identifier: GQ34GK9V MC56-L5 [MC55] (c)microcom 19Oct4 Algorithm: Factory default axle (v4.5) Data type: Axle sensors - Paired (Class/Speed/Count) Profile: Filter time: : Wednesday, September 17, 214 => : Monday, September 22, 214 (5) Included classes: 1, 2, 3, 4, 5, 6, 7, 8, 9, 1, 11, 12 Speed range: 6-99 mph. Direction: East (bound), P = East Separation: Headway > sec, Span ft Name: Default Profile Scheme: Vehicle classification (Scheme F3) Units: Non metric (ft, mi, ft/s, mph, lb, ton) In profile: Vehicles = / 3428 (36.73%)
47 Weekly Vehicle Counts WeeklyVehicle-117 Site: Counter 3 (GQ34GK9V)..E Description: Millersville Rd west of Cecil Ave, <35 mph> Filter time: : Wednesday, September 17, 214 => : Monday, September 22, 214 Scheme: Vehicle classification (Scheme F3) Filter: Cls( ) Dir(E) Sp(6,99) Headway(>) Span( ) Mon Tue Wed Thu Fri Sat Sun Averages 15 Sep 16 Sep 17 Sep 18 Sep 19 Sep 2 Sep 21 Sep Hour -1 * * * * * * * * * * * * * * * * * * * * * * * * * * * * * * * * * * * * * * * * * * * * * * * * Totals 7-19 * * * * * * * * AM Peak * * * * PM Peak * * * * * - No data.
48 Weekly Vehicle Counts WeeklyVehicle-118 Site: Counter 3 (GQ34GK9V)..E Description: Millersville Rd west of Cecil Ave, <35 mph> Filter time: : Wednesday, September 17, 214 => : Monday, September 22, 214 Scheme: Vehicle classification (Scheme F3) Filter: Cls( ) Dir(W) Sp(6,99) Headway(>) Span( ) Mon Tue Wed Thu Fri Sat Sun Averages 15 Sep 16 Sep 17 Sep 18 Sep 19 Sep 2 Sep 21 Sep Hour -1 * * * * * * * * * * * * * * * * * * * * * * * * * * * * * * * * * * * * * * * * * * * * * * * * Totals 7-19 * * * * * * * * AM Peak * * * * PM Peak * * * * * - No data.
49 Weekly Vehicle Counts WeeklyVehicle-117 Site: Counter 3 (GQ34GK9V)..E Description: Millersville Rd west of Cecil Ave, <35 mph> Filter time: : Wednesday, September 17, 214 => : Monday, September 22, 214 Scheme: Vehicle classification (Scheme F3) Filter: Cls( ) Dir(EW) Sp(6,99) Headway(>) Span( ) Mon Tue Wed Thu Fri Sat Sun Averages 15 Sep 16 Sep 17 Sep 18 Sep 19 Sep 2 Sep 21 Sep Hour -1 * * * * * * * * * * * * * * * * * * * * * * * * * * * * * * * * * * * * * * * * * * * * * * * * Totals 7-19 * * * * * * * * AM Peak * * * * PM Peak * * * * * - No data.
50 Appendix E Saturday Volumes
51 .15 Existing (Balanced) 118 Intersection 6 Indian Landing Road SAT SAT R T L SAT 14 L R 12 MD T T 263 MD R L 88 L T R SAT MD 3 SB MD 3 NB Cecil Ave TA Entrance In Indian LandOut Intersection 1 Intersection 2 Intersection 3 Intersection 4 Intersection SAT SAT SAT SAT SAT SAT R T L SAT SAT R T L SAT SAT R T L SAT SAT R T L SAT SAT R T L L R 321 In L R In L R 4 14 In 433 L R 14 In L 373 T T 253 Millersville Rd 275 T T 18 Millersville Rd 398 T T 12 Millersville Rd 433 T T 14 Millersville Rd T 398 R L Out 321 R L 444 Out R L Out 14 R L 433 Out R L T R L T R L T R L T R SAT SAT SAT 8 28 SAT Cecil Ave Waterbury Road
52 .15 Existing (Balanced) + Growth Rate Intersection 6 Indian Landing Road SAT SAT R T L SAT 15 L R 13 MD T T 276 MD R L 93 L T R SAT MD 3 SB MD 3 NB Cecil Ave TA Entrance In Indian LandOut Intersection 1 Intersection 2 Intersection 3 Intersection 4 Intersection SAT SAT SAT SAT SAT SAT R T L SAT SAT R T L SAT SAT R T L SAT SAT R T L SAT SAT R T L L R 338 In L R In L R In 455 L R 149 In L 392 T T 266 Millersville Rd 289 T T 115 Millersville Rd 417 T T 127 Millersville Rd 455 T T 149 Millersville Rd T 417 R L Out 338 R L 466 Out R L Out 149 R L 455 Out R L T R L T R L T R L T R SAT SAT SAT 84 3 SAT Cecil Ave Waterbury Road
53 .15 Growth Rate Intersection 6 Indian Landing Road SAT SAT R T L SAT 1 L R 1 MD T T 13 MD R L 5 L T R SAT MD 3 SB MD 3 NB Cecil Ave TA Entrance In Indian LandOut Intersection 1 Intersection 2 Intersection 3 Intersection 4 Intersection SAT SAT SAT SAT SAT 7 1 SAT R T L SAT SAT R T L SAT SAT R T L SAT SAT R T L SAT SAT R T L L R 17 In L R 5 12 In 22 1 L R 1 9 In 22 L R 9 In L 19 T T 13 Millersville Rd 14 T T 7 Millersville Rd 19 T T 7 Millersville Rd 22 T T 9 Millersville Rd T 19 R L 4 27 Out 17 R L 22 Out 12 2 R L 1 22 Out 9 R L 22 Out 9 5 R L T R L T R L T R L T R SAT SAT SAT 4 2 SAT 2 1 Cecil Ave Waterbury Road
54 Pipeline Developments Intersection 6 Indian Landing Road SAT 2 SAT R T L SAT L R MD 178 T T MD R L 9 L T R SAT MD 3 SB MD 3 NB Cecil Ave TA Entrance In Indian LandOut Intersection 1 Intersection 2 Intersection 3 Intersection 4 Intersection SAT SAT SAT SAT SAT 23 SAT R T L SAT 84 SAT R T L SAT SAT R T L SAT SAT R T L SAT SAT R T L L R 245 In 49 6 L R In 56 1 L R 29 In 36 L R 29 In L 48 T T 89 Millersville Rd 43 T T 4 Millersville Rd 36 T T 29 Millersville Rd 36 T T 29 Millersville Rd T 42 R L Out 161 R L 56 Out R L 36 Out 29 R L 36 Out 29 8 R L T R -1 L T R L T R L T R SAT SAT SAT 28 SAT 6 Cecil Ave Waterbury Road
55 Site Generated Intersection 6 Indian Landing Road SAT SAT R T L SAT L R MD 178 T T MD R L 2 L T R SAT MD 3 SB MD 3 NB Cecil Ave TA Entrance In Indian LandOut Intersection 1 Intersection 2 Intersection 3 Intersection 4 Intersection SAT 12 SAT SAT 1 2 SAT 45 9 SAT 4 SAT R T L SAT SAT R T L SAT SAT R T L SAT SAT R T L SAT SAT R T L L R 3 In 3 L R 6 36 In 35 L R 3 45 In L R 7 7 In 9 6 L 18 T T 17 Millersville Rd 3 T T 3 Millersville Rd 35 T T 36 Millersville Rd T T Millersville Rd T R L 13 3 Out 3 R L 35 Out 36 R L 6 42 Out 45 R L 9 Out 7 3 R L T R L T R L T R L T R SAT SAT 5 SAT 5 SAT 3 Cecil Ave Waterbury Road
56 Total Background Intersection 6 Indian Landing Road SAT SAT R T L SAT 15 L R 13 MD T T 276 MD R L 12 L T R SAT MD 3 SB MD 3 NB Cecil Ave TA Entrance In Indian LandOut Intersection 1 Intersection 2 Intersection 3 Intersection 4 Intersection SAT SAT SAT SAT SAT SAT R T L SAT 84 SAT R T L SAT SAT R T L SAT SAT R T L SAT SAT R T L L R 583 In L R In L R In 491 L R 178 In L 44 T T 355 Millersville Rd 332 T T 155 Millersville Rd 453 T T 156 Millersville Rd 491 T T 178 Millersville Rd T 459 R L Out 499 R L 522 Out R L Out 178 R L 491 Out R L T R -1 L T R L T R L T R SAT SAT SAT SAT Cecil Ave Waterbury Road
57 Total Future Intersection 6 Indian Landing Road SAT SAT R T L SAT 15 L R 13 MD T T 276 MD R L 14 L T R SAT MD 3 SB MD 3 NB Cecil Ave TA Entrance In Indian LandOut Intersection 1 Intersection 2 Intersection 3 Intersection 4 Intersection SAT SAT SAT SAT 45 9 SAT SAT R T L SAT 84 SAT R T L SAT SAT R T L SAT SAT R T L SAT SAT R T L L R 613 In L R In L R In L R In L 458 T T 372 Millersville Rd 362 T T 185 Millersville Rd 488 T T 192 Millersville Rd 491 T T 178 Millersville Rd T 459 R L Out 529 R L 557 Out R L Out 223 R L 5 Out R L T R -1 L T R L T R L T R SAT SAT SAT SAT Cecil Ave Waterbury Road
58 Appendix F Sunday Volumes
59 .15 Existing (Balanced) 118 Intersection 6 Indian Landing Road SUN SUN R T L SUN 1 L R 8 MD T T 288 MD R L 19 L T R SUN MD 3 SB MD 3 NB Cecil Ave TA Entrance In Indian LandOut Intersection 1 Intersection 2 Intersection 3 Intersection 4 Intersection SUN SUN SUN SUN SUN SUN R T L SUN SUN R T L SUN SUN R T L SUN SUN R T L SUN SUN R T L L R 329 In L R In L R In 428 L R 185 In L 329 T T 247 Millersville Rd 35 T T 148 Millersville Rd 363 T T 131 Millersville Rd 428 T T 185 Millersville Rd T 32 R L Out 329 R L 493 Out R L Out 185 R L 428 Out R L T R L T R L T R L T R SUN SUN SUN SUN Cecil Ave Waterbury Road
60 .15 Existing (Balanced) + Growth Rate Intersection 6 Indian Landing Road SUN SUN R T L SUN 11 L R 9 MD T T 32 MD R L 114 L T R SUN MD 3 SB MD 3 NB Cecil Ave TA Entrance In Indian LandOut Intersection 1 Intersection 2 Intersection 3 Intersection 4 Intersection SUN SUN SUN SUN SUN SUN R T L SUN SUN R T L SUN SUN R T L SUN SUN R T L SUN SUN R T L L R 345 In L R In L R In 449 L R 195 In L 345 T T 259 Millersville Rd 367 T T 155 Millersville Rd 38 T T 137 Millersville Rd 449 T T 195 Millersville Rd T 316 R L Out 345 R L 517 Out R L Out 195 R L 449 Out R L T R L T R L T R L T R SUN SUN SUN SUN Cecil Ave Waterbury Road
61 .15 Growth Rate Intersection 6 Indian Landing Road SUN SUN R T L SUN 1 L R 1 MD T T 14 MD R L 5 L T R SUN MD 3 SB MD 3 NB Cecil Ave TA Entrance In Indian LandOut Intersection 1 Intersection 2 Intersection 3 Intersection 4 Intersection SUN SUN SUN SUN SUN 8 2 SUN R T L SUN SUN R T L SUN SUN R T L SUN SUN R T L SUN SUN R T L L R 16 In L R 7 14 In 24 1 L R 1 1 In 21 L R 1 In L 16 T T 12 Millersville Rd 17 T T 7 Millersville Rd 17 T T 6 Millersville Rd 21 T T 1 Millersville Rd T 14 R L 4 28 Out 16 R L 24 Out 14 6 R L 3 21 Out 1 R L 21 Out 1 4 R L T R L T R L T R L T R SUN SUN SUN SUN 2 1 Cecil Ave Waterbury Road
62 Pipeline Developments Intersection 6 Indian Landing Road SUN 2 SUN R T L SUN L R MD 178 T T MD R L 9 L T R SUN MD 3 SB MD 3 NB Cecil Ave TA Entrance In Indian LandOut Intersection 1 Intersection 2 Intersection 3 Intersection 4 Intersection SUN SUN SUN SUN SUN 23 SUN R T L SUN 84 SUN R T L SUN SUN R T L SUN SUN R T L SUN SUN R T L L R 245 In 49 6 L R In 56 1 L R 29 In 36 L R 29 In L 48 T T 89 Millersville Rd 43 T T 4 Millersville Rd 36 T T 29 Millersville Rd 36 T T 29 Millersville Rd T 42 R L Out 161 R L 56 Out R L 36 Out 29 R L 36 Out 29 8 R L T R -1 L T R L T R L T R SUN SUN SUN 28 SUN 6 Cecil Ave Waterbury Road
63 Site Generated Intersection 6 Indian Landing Road SUN SUN R T L SUN L R MD 178 T T MD R L 2 L T R SUN MD 3 SB MD 3 NB Cecil Ave TA Entrance In Indian LandOut Intersection 1 Intersection 2 Intersection 3 Intersection 4 Intersection SUN 1 SUN SUN 1 1 SUN 31 6 SUN 3 SUN R T L SUN SUN R T L SUN SUN R T L SUN SUN R T L SUN SUN R T L L R 22 In 22 L R 3 25 In 24 L R 2 31 In L R 5 5 In 6 4 L 12 T T 12 Millersville Rd 22 T T 22 Millersville Rd 24 T T 25 Millersville Rd T T Millersville Rd T R L 1 22 Out 22 R L 24 Out 25 R L 4 29 Out 31 R L 6 Out 5 2 R L T R L T R L T R L T R SUN SUN 2 SUN 4 SUN 2 Cecil Ave Waterbury Road
64 Total Background Intersection 6 Indian Landing Road SUN SUN R T L SUN 11 L R 9 MD T T 32 MD R L 123 L T R SUN MD 3 SB MD 3 NB Cecil Ave TA Entrance In Indian LandOut Intersection 1 Intersection 2 Intersection 3 Intersection 4 Intersection SUN SUN SUN SUN SUN SUN R T L SUN 84 SUN R T L SUN SUN R T L SUN SUN R T L SUN SUN R T L L R 59 In L R In L R In 485 L R 224 In L 393 T T 348 Millersville Rd 41 T T 195 Millersville Rd 416 T T 166 Millersville Rd 485 T T 224 Millersville Rd T 358 R L Out 56 R L 573 Out R L Out 224 R L 485 Out R L T R -1 L T R L T R L T R SUN SUN SUN SUN 3 19 Cecil Ave Waterbury Road
65 Total Future Intersection 6 Indian Landing Road SUN SUN R T L SUN 11 L R 9 MD T T 32 MD R L 125 L T R SUN MD 3 SB MD 3 NB Cecil Ave TA Entrance In Indian LandOut Intersection 1 Intersection 2 Intersection 3 Intersection 4 Intersection SUN SUN SUN SUN 31 6 SUN SUN R T L SUN 84 SUN R T L SUN SUN R T L SUN SUN R T L SUN SUN R T L L R 612 In L R In L R In L R In L 45 T T 36 Millersville Rd 432 T T 217 Millersville Rd 44 T T 191 Millersville Rd 485 T T 224 Millersville Rd T 358 R L Out 528 R L 597 Out R L Out 255 R L 491 Out R L T R -1 L T R L T R L T R SUN SUN SUN SUN Cecil Ave Waterbury Road
66 Appendix G Existing CLV Spreadsheets
67 Turning Movement Summary and Level of Service Count Date: N/A Location: Annapolis Condition: Existing MD 3 SB Design Year: Computed by: MDP Date: 5/4/217 Checked by: TAR Date: 5/8/217 URS AM PEAK HOUR: PM PEAK HOUR: Annapolis Rd. MD 3 SB N (3) (3) (4) (4) (1) Annapolis Rd. (1) (3) (3) (4) (4) (1) (1) MD 3 SB 3191 No. of Lane Use Level of Critical Lane Opposing Phasing (F ) Intersection Control Type: Lanes Factor Service Vol. Total Volume Signal X Stop Ways 1 = 1. A < 1 (vph) PCE 2 =.55 B < 115 < =.4 C < 13 < =.3 D < 145 < Dble. Left =.6 E < 16 < Trpl. Left =.45 F > 16 > 1 5. Lefts Critical Lefts Critical Lane Use Lane Opposing Lane Use Left Lane Lane Use Lane Opposing Lane Use Left Lane F Movement Volume Factor Volume Lefts Factor Volume Volume * F Movement Volume Factor Volume Lefts Factor Volume Volume * (1) (2) (1)*(2)=(3) (4) (5) (4)*(5)=(6) (3)+(6) (1) (2) (1)*(2)=(3) (4) (5) (4)*(5)=(6) (3)+(6) SBT * SBT * WBT WBT EBT * EBR * AM TOTAL 1331 PM TOTAL 1558 v/c =.83 v/c =.97 LOS D LOS E * Critical Volume. * Critical Volume. File: _AA County Tennis Center CLA.xls, Tab: Int.1 (Existing AM & PM) Printed: 1/26/218, 2:59 PM
68 Turning Movement Summary and Level of Service Count Date: Saturday, December 2, 217 Location: Annapolis Condition: Existing MD 3 SB Design Year: Computed by: MCM Date: 1/24/217 Checked by: TAR Date: 1/25/218 URS SAT PEAK HOUR: 12:15-13: Annapolis Rd. MD 3 SB N 399 (3) (3) (4) (4) (1) Annapolis Rd. (1) (3) (3) (4) (4) (1) (1) MD 3 SB No. of Lane Use Level of Critical Lane Opposing Phasing (F ) Intersection Control Type: Lanes Factor Service Vol. Total Volume Signal X Stop Ways 1 = 1. A < 1 (vph) PCE 2 =.55 B < 115 < =.4 C < 13 < =.3 D < 145 < Dble. Left =.6 E < 16 < Trpl. Left =.45 F > 16 > 1 5. Lefts Critical Lefts Critical Lane Use Lane Opposing Lane Use Left Lane Lane Use Lane Opposing Lane Use Left Lane F Movement Volume Factor Volume Lefts Factor Volume Volume * F Movement Volume Factor Volume Lefts Factor Volume Volume * (1) (2) (1)*(2)=(3) (4) (5) (4)*(5)=(6) (3)+(6) (1) (2) (1)*(2)=(3) (4) (5) (4)*(5)=(6) (3)+(6) SBT * WBT * EBL * * SAT TOTAL 1346 PM TOTAL v/c =.84 v/c = LOS D * Critical Volume. * Critical Volume.. LOS A File: _AA County Tennis Center CLA.xls, Tab: Int.1 (Existing SAT) Printed: 1/26/218, 2:59 PM
69 Turning Movement Summary and Level of Service Count Date: Sunday, December 3, 217 Location: Annapolis Condition: Existing MD 3 SB Design Year: Computed by: MCM Date: 1/24/217 Checked by: TAR Date: 1/25/217 URS SUN PEAK HOUR: 12: - 13: Annapolis Rd. MD 3 SB N 376 (3) (3) (4) (4) (1) Annapolis Rd. (1) (3) (3) (4) (4) (1) (1) MD 3 SB No. of Lane Use Level of Critical Lane Opposing Phasing (F ) Intersection Control Type: Lanes Factor Service Vol. Total Volume Signal X Stop Ways 1 = 1. A < 1 (vph) PCE 2 =.55 B < 115 < =.4 C < 13 < =.3 D < 145 < Dble. Left =.6 E < 16 < Trpl. Left =.45 F > 16 > 1 5. Lefts Critical Lefts Critical Lane Use Lane Opposing Lane Use Left Lane Lane Use Lane Opposing Lane Use Left Lane F Movement Volume Factor Volume Lefts Factor Volume Volume * F Movement Volume Factor Volume Lefts Factor Volume Volume * (1) (2) (1)*(2)=(3) (4) (5) (4)*(5)=(6) (3)+(6) (1) (2) (1)*(2)=(3) (4) (5) (4)*(5)=(6) (3)+(6) SBT * WBT * EBT * * SAT TOTAL 1123 PM TOTAL v/c =.7 v/c = LOS B * Critical Volume. * Critical Volume.. LOS A File: _AA County Tennis Center CLA.xls, Tab: Int.1 (Existing SUN) Printed: 1/26/218, 2:59 PM
70 Turning Movement Summary and Level of Service Count Date: N/A Location: Millersville Condition: Existing MD 3 NB Design Year: Computed by: MDP Date: 5/4/217 Checked by: TAR Date: 5/8/217 URS AM PEAK HOUR: PM PEAK HOUR: 2886 MD 3NB N 2535 Annapolis Rd (3) (3) (4) (4) (1) Millersville Rd (1) (3) (3) (4) (4) (1) (1) MD 3NB No. of Lane Use Level of Critical Lane Opposing Phasing (F ) Intersection Control Type: Lanes Factor Service Vol. Total Volume Signal X Stop Ways 1 = 1. A < 1 (vph) PCE 2 =.55 B < 115 < =.4 C < 13 < =.3 D < 145 < Dble. Left =.6 E < 16 < Trpl. Left =.45 F > 16 > 1 5. Lefts Critical Lefts Critical Lane Use Lane Opposing Lane Use Left Lane Lane Use Lane Opposing Lane Use Left Lane F Movement Volume Factor Volume Lefts Factor Volume Volume * F Movement Volume Factor Volume Lefts Factor Volume Volume * (1) (2) (1)*(2)=(3) (4) (5) (4)*(5)=(6) (3)+(6) (1) (2) (1)*(2)=(3) (4) (5) (4)*(5)=(6) (3)+(6) NBT * NBT * WBR * WBR * EBTL * EBTL * AM TOTAL 1431 PM TOTAL 1216 v/c =.89 v/c =.76 LOS D LOS C * Critical Volume. * Critical Volume. File: _AA County Tennis Center CLA.xls, Tab: Int.2 (Existing AM & PM) Printed: 1/26/218, 2:59 PM
71 Turning Movement Summary and Level of Service Count Date: Saturday, December 2, 217 Location: Millersville Condition: Existing MD 3 NB Design Year: Computed by: MCM Date: 1/24/217 Checked by: TAR Date: 1/25/218 URS SAT PEAK HOUR: 12:15-13: MD 3NB N Annapolis Rd (3) (3) (4) (4) 444 (1) Millersville Rd (1) (3) (3) (4) (4) (1) (1) MD 3NB No. of Lane Use Level of Critical Lane Opposing Phasing (F ) Intersection Control Type: Lanes Factor Service Vol. Total Volume Signal X Stop Ways 1 = 1. A < 1 (vph) PCE 2 =.55 B < 115 < =.4 C < 13 < =.3 D < 145 < Dble. Left =.6 E < 16 < Trpl. Left =.45 F > 16 > 1 5. Lefts Critical Lefts Critical Lane Use Lane Opposing Lane Use Left Lane Lane Use Lane Opposing Lane Use Left Lane F Movement Volume Factor Volume Lefts Factor Volume Volume * F Movement Volume Factor Volume Lefts Factor Volume Volume * (1) (2) (1)*(2)=(3) (4) (5) (4)*(5)=(6) (3)+(6) (1) (2) (1)*(2)=(3) (4) (5) (4)*(5)=(6) (3)+(6) NBT WBT * * * EBTL * * SAT TOTAL 1224 PM TOTAL v/c =.77 v/c = LOS C * Critical Volume. * Critical Volume.. LOS A File: _AA County Tennis Center CLA.xls, Tab: Int.2 (Existing SAT) Printed: 1/26/218, 2:59 PM
72 Turning Movement Summary and Level of Service Count Date: Sunday, December 3, 217 Location: Millersville Condition: Existing MD 3 NB Design Year: Computed by: MCM Date: 1/24/217 Checked by: TAR Date: 1/25/218 URS SUN PEAK HOUR: 12: - 13: 1993 MD 3NB N Annapolis Rd (3) (3) (4) (4) 493 (1) Millersville Rd (1) (3) (3) (4) (4) (1) (1) MD 3NB No. of Lane Use Level of Critical Lane Opposing Phasing (F ) Intersection Control Type: Lanes Factor Service Vol. Total Volume Signal X Stop Ways 1 = 1. A < 1 (vph) PCE 2 =.55 B < 115 < =.4 C < 13 < =.3 D < 145 < Dble. Left =.6 E < 16 < Trpl. Left =.45 F > 16 > 1 5. Lefts Critical Lefts Critical Lane Use Lane Opposing Lane Use Left Lane Lane Use Lane Opposing Lane Use Left Lane F Movement Volume Factor Volume Lefts Factor Volume Volume * F Movement Volume Factor Volume Lefts Factor Volume Volume * (1) (2) (1)*(2)=(3) (4) (5) (4)*(5)=(6) (3)+(6) (1) (2) (1)*(2)=(3) (4) (5) (4)*(5)=(6) (3)+(6) NBT WBT * * * EBT * * SAT TOTAL 1146 PM TOTAL v/c =.72 v/c = LOS B * Critical Volume. * Critical Volume.. LOS A File: _AA County Tennis Center CLA.xls, Tab: Int.2 (Existing SUN) Printed: 1/26/218, 2:59 PM
73 Turning Movement Summary and Level of Service Count Date: Condition: Design Year: Computed by: Thursday, February 25, 216 Existing MDP Date: 5/4/217 Location: Checked by: Millersville Cecil Ave. TAR Date: 5/8/217 URS AM PEAK HOUR: 8: - 9: PM PEAK HOUR: 4:3-5: Millersville Rd. STOP (3) (3) (4) (4) STOP (1) Millersville Rd. (1) (3) (3) (4) (4) (1) (1) Cecil Ave. Cecil Ave. N No. of Lane Use Level of Critical Lane Opposing Phasing (F ) Intersection Control Type: Lanes Factor Service Vol. Total Volume Signal Stop X Ways 2 1 = 1. A < 1 (vph) PCE 2 =.55 B < 115 < =.4 C < 13 < =.3 D < 145 < Dble. Left =.6 E < 16 < Trpl. Left =.45 F > 16 > 1 5. Lefts Critical Lefts Critical Lane Use Lane Opposing Lane Use Left Lane Lane Use Lane Opposing Lane Use Left Lane F Movement Volume (1) Factor (2) Volume (1)*(2)=(3) Lefts (4) Factor (5) Volume (4)*(5)=(6) Volume (3)+(6) * F Movement Volume (1) Factor (2) Volume (1)*(2)=(3) Lefts (4) Factor (5) Volume (4)*(5)=(6) Volume (3)+(6) * EBLTR EBLTR * WBLTR NBLTR * * WBLTR NBLTR * SBLTR * SBLTR * AM TOTAL 426 PM TOTAL 422 EBLTR: (2*1.1) = 151 EBLRT: (5*1.1) = 29 WBLTR: (47*1.1) = 228 v/c =.27 WBLTR: (45*1.1) = 182 v/c =.26 LOS A LOS A * Critical Volume. * Critical Volume. File: _AA County Tennis Center CLA.xls, Tab: Int.3 (Existing AM & PM) Printed: 1/26/218, 2:59 PM
74 Turning Movement Summary and Level of Service Count Date: Saturday, December 2, 217 Location: Millersville Condition: Existing Cecil Ave. Design Year: Computed by: MCM Date: 1/24/217 Checked by: TAR Date: 1/25/218 URS SAT PEAK HOUR: 9: - 1: 7 N 2 STOP 22 4 (3) (3) (4) (4) STOP (1) Millersville Rd. (1) (3) (3) (4) (4) (1) (1) Millersville Rd. Cecil Ave. Cecil Ave. No. of Lane Use Level of Critical Lane Opposing Phasing (F ) Intersection Control Type: Lanes Factor Service Vol. Total Volume Signal Stop X Ways 2 1 = 1. A < 1 (vph) PCE 2 =.55 B < 115 < =.4 C < 13 < =.3 D < 145 < Dble. Left =.6 E < 16 < Trpl. Left =.45 F > 16 > 1 5. Lefts Critical Lefts Critical Lane Use Lane Opposing Lane Use Left Lane Lane Use Lane Opposing Lane Use Left Lane F Movement Volume Factor Volume Lefts Factor Volume Volume * F Movement Volume Factor Volume Lefts Factor Volume Volume * (1) (2) (1)*(2)=(3) (4) (5) (4)*(5)=(6) (3)+(6) (1) (2) (1)*(2)=(3) (4) (5) (4)*(5)=(6) (3)+(6) EBLTR * WBLTR * NBLTR SBLTR * * * SAT TOTAL 578 PM TOTAL EBLTR: (3*1.1) = 444 WBLTR: (16*2.) = 156 v/c =.36 v/c =. LOS A LOS * Critical Volume. * Critical Volume. A File: _AA County Tennis Center CLA.xls, Tab: Int.3 (Existing SAT) Printed: 1/26/218, 2:59 PM
75 Turning Movement Summary and Level of Service Count Date: Sunday, December 3, 217 Location: Millersville Condition: Existing Cecil Ave. Design Year: Computed by: MCM Date: 1/24/217 Checked by: TAR Date: 1/25/218 URS SUN PEAK HOUR: 9: - 1: 9 N Millersville Rd. STOP (3) (3) (4) (4) STOP 181 (1) Millersville Rd. (1) (3) (3) (4) (4) (1) (1) Cecil Ave. Cecil Ave. No. of Lane Use Level of Critical Lane Opposing Phasing (F ) Intersection Control Type: Lanes Factor Service Vol. Total Volume Signal Stop X Ways 2 1 = 1. A < 1 (vph) PCE 2 =.55 B < 115 < =.4 C < 13 < =.3 D < 145 < Dble. Left =.6 E < 16 < Trpl. Left =.45 F > 16 > 1 5. Lefts Critical Lefts Critical Lane Use Lane Opposing Lane Use Left Lane Lane Use Lane Opposing Lane Use Left Lane F Movement Volume Factor Volume Lefts Factor Volume Volume * F Movement Volume Factor Volume Lefts Factor Volume Volume * (1) (2) (1)*(2)=(3) (4) (5) (4)*(5)=(6) (3)+(6) (1) (2) (1)*(2)=(3) (4) (5) (4)*(5)=(6) (3)+(6) EBLTR * WBLTR * NBLTR SBLTR * * * SUN TOTAL 782 PM TOTAL EBLTR: (5*1.1) = 494 WBLTR: (53*2.) = 238 v/c =.49 v/c =. LOS A LOS * Critical Volume. * Critical Volume. A File: _AA County Tennis Center CLA.xls, Tab: Int.3 (Existing SUN) Printed: 1/26/218, 2:59 PM
76 Turning Movement Summary and Level of Service Count Date: Thursday, February 25, 216 Location: Millersville Condition: Existing Waterbury Rd. Design Year: Computed by: MDP Date: 5/4/217 Checked by: TAR Date: 5/8/217 URS AM PEAK HOUR: PM PEAK HOUR: 8: - 9: 4:3-5: Millersville Rd. Millersville Rd. N (3) 69 (3) (4) 146 (4) STOP 75 (1) (1) (3) (3) (4) (4) (1) (1) Waterbury Rd No. of Lane Use Level of Critical Lane Opposing Phasing (F ) Intersection Control Type: Lanes Factor Service Vol. Total Volume Signal Stop X Ways 1 1 = 1. A < 1 (vph) PCE 2 =.55 B < 115 < =.4 C < 13 < =.3 D < 145 < Dble. Left =.6 E < 16 < Trpl. Left =.45 F > 16 > 1 5. Lefts Critical Lefts Critical Lane Use Lane Opposing Lane Use Left Lane Lane Use Lane Opposing Lane Use Left Lane F Movement Volume Factor Volume Lefts Factor Volume Volume * F Movement Volume Factor Volume Lefts Factor Volume Volume * (1) (2) (1)*(2)=(3) (4) (5) (4)*(5)=(6) (3)+(6) (1) (2) (1)*(2)=(3) (4) (5) (4)*(5)=(6) (3)+(6) NBLT * NBLT * EBLR EBLR SBTR * SBTR * AM TOTAL 273 PM TOTAL 288 SBTR: (47*1.1) = 219 SBTR: (89*1.1) = 214 v/c =.17 v/c =.18 LOS A LOS A * Critical Volume. * Critical Volume. File: _AA County Tennis Center CLA.xls, Tab: Int.5 (Existing AM & PM) Printed: 1/26/218, 2:59 PM
77 Turning Movement Summary and Level of Service Count Date: Saturday, December 2, 217 Location: Millersville Condition: Existing Waterbury Rd. Design Year: Computed by: MCM Date: 1/24/217 Checked by: TAR Date: 1/25/218 URS SAT PEAK HOUR: 9: - 1: Millersville Rd. Millersville Rd. N 14 (3) 324 (3) 433 (4) (4) 19 STOP 128 (1) (1) (3) (3) (4) (4) (1) (1) Waterbury Rd. No. of Lane Use Level of Critical Lane Opposing Phasing (F ) Intersection Control Type: Lanes Factor Service Vol. Total Volume Signal Stop X Ways 1 1 = 1. A < 1 (vph) PCE 2 =.55 B < 115 < =.4 C < 13 < =.3 D < 145 < Dble. Left =.6 E < 16 < Trpl. Left =.45 F > 16 > 1 5. Lefts Critical Lefts Critical Lane Use Lane Opposing Lane Use Left Lane Lane Use Lane Opposing Lane Use Left Lane F Movement Volume Factor Volume Lefts Factor Volume Volume * F Movement Volume Factor Volume Lefts Factor Volume Volume * (1) (2) (1)*(2)=(3) (4) (5) (4)*(5)=(6) (3)+(6) (1) (2) (1)*(2)=(3) (4) (5) (4)*(5)=(6) (3)+(6) NBLT EBLR SBTR * * NBLT EBLR SBTR * * SAT TOTAL 493 PM TOTAL SBTR: (19*2.) = 152 v/c =.31 v/c =. LOS A LOS * Critical Volume. * Critical Volume. A File: _AA County Tennis Center CLA.xls, Tab: Int.5 (Existing SAT) Printed: 1/26/218, 2:59 PM
78 Turning Movement Summary and Level of Service Count Date: Sunday, December 3, 217 Location: Millersville Condition: Existing Waterbury Rd. Design Year: Computed by: MCM Date: 1/24/217 Checked by: TAR Date: 1/25/218 URS SUN PEAK HOUR: 9: - 1: Millersville Rd. Millersville Rd. N 185 (3) 348 (3) 428 (4) (4) 8 STOP 112 (1) (1) (3) (3) (4) (4) (1) (1) Waterbury Rd. No. of Lane Use Level of Critical Lane Opposing Phasing (F ) Intersection Control Type: Lanes Factor Service Vol. Total Volume Signal Stop X Ways 1 1 = 1. A < 1 (vph) PCE 2 =.55 B < 115 < =.4 C < 13 < =.3 D < 145 < Dble. Left =.6 E < 16 < Trpl. Left =.45 F > 16 > 1 5. Lefts Critical Lefts Critical Lane Use Lane Opposing Lane Use Left Lane Lane Use Lane Opposing Lane Use Left Lane F Movement Volume Factor Volume Lefts Factor Volume Volume * F Movement Volume Factor Volume Lefts Factor Volume Volume * (1) (2) (1)*(2)=(3) (4) (5) (4)*(5)=(6) (3)+(6) (1) (2) (1)*(2)=(3) (4) (5) (4)*(5)=(6) (3)+(6) NBLT EBLR SBTR * * NBLT EBLR SBTR * * SUN TOTAL 5 PM TOTAL SBTR: (32*2.) = 227 v/c =.31 v/c =. LOS A LOS * Critical Volume. * Critical Volume. A File: _AA County Tennis Center CLA.xls, Tab: Int.5 (Existing SUN) Printed: 1/26/218, 2:59 PM
79 Turning Movement Summary and Level of Service Count Date: Thursday, February 25, 216 Location: Millersville Condition: Existing MD 178 Design Year: Computed by: MDP Date: 5/4/217 Checked by: TAR Date: 5/8/217 URS AM PEAK HOUR: PM PEAK HOUR: 7:45-8:45 4:15-5: MD 178 Indian Landing Rd. N (3) (3) (4) (4) (1) MD 178 (1) (3) (3) (4) (4) (1) (1) Millersville Rd No. of Lane Use Level of Critical Lane Opposing Phasing (F ) Intersection Control Type: Lanes Factor Service Vol. Total Volume Signal X Stop Ways 1 = 1. A < 1 (vph) PCE 2 =.55 B < 115 < =.4 C < 13 < =.3 D < 145 < Dble. Left =.6 E < 16 < Trpl. Left =.45 F > 16 > 1 5. Lefts Critical Lefts Critical Lane Use Lane Opposing Lane Use Left Lane Lane Use Lane Opposing Lane Use Left Lane F Movement Volume Factor Volume Lefts Factor Volume Volume * F Movement Volume Factor Volume Lefts Factor Volume Volume * (1) (2) (1)*(2)=(3) (4) (5) (4)*(5)=(6) (3)+(6) (1) (2) (1)*(2)=(3) (4) (5) (4)*(5)=(6) (3)+(6) EBLTR * EBLTR * WBLTR WBLTR NBLTR * NBLTR * SBLTR SBLTR AM TOTAL 717 PM TOTAL 837 EBLTR: (21*2.) = 525 NBLTR: (3*1.1)+12+43= 88 EBLTR: (42*2.) = 578 NBLTR: (51*1.1) = 164 WBLTR: (9*2.) = 563 SBLTR: (14*1.1) = 54 v/c =.45 WBLTR: (78*2.) = 54 SBLTR: (17*1.1) = 65 v/c =.52 LOS A LOS A * Critical Volume. * Critical Volume. File: _AA County Tennis Center CLA.xls, Tab: Int.6 (Existing AM & PM) Printed: 1/26/218, 2:59 PM
80 Turning Movement Summary and Level of Service Count Date: Saturday, December 2, 217 Location: Millersville Condition: Existing MD 178 Design Year: Computed by: MCM Date: 1/24/217 Checked by: TAR Date: 1/25/218 URS SAT PEAK HOUR: 9: - 1: MD 178 Indian Landing Rd. N (3) (3) (4) (4) (1) MD 178 (1) (3) (3) (4) (4) (1) (1) Millersville Rd. No. of Lane Use Level of Critical Lane Opposing Phasing (F ) Intersection Control Type: Lanes Factor Service Vol. Total Volume Signal X Stop Ways 1 = 1. A < 1 (vph) PCE 2 =.55 B < 115 < =.4 C < 13 < =.3 D < 145 < Dble. Left =.6 E < 16 < Trpl. Left =.45 F > 16 > 1 5. Lefts Critical Lefts Critical Lane Use Lane Opposing Lane Use Left Lane Lane Use Lane Opposing Lane Use Left Lane F Movement Volume Factor Volume Lefts Factor Volume Volume * F Movement Volume Factor Volume Lefts Factor Volume Volume * (1) (2) (1)*(2)=(3) (4) (5) (4)*(5)=(6) (3)+(6) (1) (2) (1)*(2)=(3) (4) (5) (4)*(5)=(6) (3)+(6) EBLTR WBLTR * * NBLTR * SBLTR * SAT TOTAL 82 PM TOTAL EBLTR: (19*2.) = 353 NBLTR: (77*1.1) = 382 WBLTR: (68*2.) = 34 SBLTR: (2*2.) = 15 v/c =.51 v/c =. LOS A LOS * Critical Volume. * Critical Volume. A File: _AA County Tennis Center CLA.xls, Tab: Int.6 (Existing SAT) Printed: 1/26/218, 2:59 PM
81 Turning Movement Summary and Level of Service Count Date: Sunday, December 3, 217 Location: Millersville Condition: Existing MD 178 Design Year: Computed by: MCM Date: 1/24/217 Checked by: TAR Date: 1/25/218 URS SUN PEAK HOUR: 9: - 1: MD 178 Indian Landing Rd. N (3) (3) (4) (4) (1) MD 178 (1) (3) (3) (4) (4) (1) (1) Millersville Rd. No. of Lane Use Level of Critical Lane Opposing Phasing (F ) Intersection Control Type: Lanes Factor Service Vol. Total Volume Signal X Stop Ways 1 = 1. A < 1 (vph) PCE 2 =.55 B < 115 < =.4 C < 13 < =.3 D < 145 < Dble. Left =.6 E < 16 < Trpl. Left =.45 F > 16 > 1 5. Lefts Critical Lefts Critical Lane Use Lane Opposing Lane Use Left Lane Lane Use Lane Opposing Lane Use Left Lane F Movement Volume Factor Volume Lefts Factor Volume Volume * F Movement Volume Factor Volume Lefts Factor Volume Volume * (1) (2) (1)*(2)=(3) (4) (5) (4)*(5)=(6) (3)+(6) (1) (2) (1)*(2)=(3) (4) (5) (4)*(5)=(6) (3)+(6) EBLTR WBLTR * * NBLTR * SBLTR * SUN TOTAL 914 PM TOTAL EBLTR: (1*2.) = 283 NBLTR: (82*1.1) = 374 WBLTR: (19*2.) = 514 SBLTR: (16*2.) = 68 v/c =.57 v/c =. LOS A LOS * Critical Volume. * Critical Volume. A File: _AA County Tennis Center CLA.xls, Tab: Int.6 (Existing SUN) Printed: 1/26/218, 2:59 PM
82 Appendix H Existing Crash Data
83 Traffic Accidents and DWI/DUI 1/1/211 to 7/5/215 MILLERSVILLE RD/WATERBURY RD Total 82 Accident - Person Injured Accident - Property Damage Accident - Other 3 3 Total REPORT DATE Heirarchy District LOCATION /7/ Accident - Property Damage 5 WATERBURY RD/MILLERSVILLE RD /21/ Accident - Person Injured 5 MILLERSVILLE RD/WATERBURY RD /25/ Accident - Property Damage 5 MILLERSVILLE RD/WATERBURY RD /4/ Accident - Person Injured 5 MILLERSVILLE RD/WATERBURY RD /16/ Accident - Property Damage 5 MILLERSVILLE RD/WATERBURY RD /12/ Accident - Property Damage 5 MILLERSVILLE RD/WATERBURY RD /28/ Accident - Person Injured 5 MILLERSVILLE RD/WATERBURY RD /25/ Accident - Property Damage 5 MILLERSVILLE RD/WATERBURY RD /11/ Accident - Person Injured 5 MILLERSVILLE RD/WATERBURY RD /12/ Accident - Property Damage 5 MILLERSVILLE RD/WATERBURY RD /27/ Accident - Property Damage 5 MILLERSVILLE RD/WATERBURY RD /26/ Accident - Property Damage 5 MILLERSVILLE RD/WATERBURY RD /4/ Accident - Person Injured 5 MILLERSVILLE RD/WATERBURY RD /15/ Accident - Property Damage 5 MILLERSVILLE RD/WATERBURY RD /3/ Accident - Other 5 MILLERSVILLE RD/WATERBURY RD /24/ Accident - Other 5 MILLERSVILLE RD/WATERBURY RD /25/ Accident - Other 5 MILLERSVILLE RD/WATERBURY RD
84 Traffic Accidents and DWI/DUI 1/1/211 to 7/5/215 MILLERSVILLE RD/WATERBURY RD
85 Incidents at an Intersection Date Range 1/1/211 to 9/12/214 Name: Millersville Rd or Millersville and Cecil Total 82 Accident - Person Injured Accident - Property Damage Accident - Other 1 1 Total Report ReportDate Incident Location /3/ Accident - Other CECIL AV S/MILLERSVILLE RD /25/ Accident - Person Injured CECIL AV S/MILLERSVILLE RD /6/ Accident - Property Damage CECIL AV S/MILLERSVILLE RD /2/ Accident - Property Damage MILLERSVILLE RD/CECIL AV S /11/ Accident - Person Injured MILLERSVILLE RD/CECIL AV S /31/ Accident - Person Injured MILLERSVILLE RD/CECIL AV S /6/ Accident - Property Damage MILLERSVILLE RD/CECIL AV S /3/ Accident - Person Injured MILLERSVILLE RD/CECIL AV S /17/ Accident - Person Injured MILLERSVILLE RD/CECIL AV S /13/ Accident - Person Injured MILLERSVILLE RD/CECIL AV S
86 Appendix I Background Development Information and Intersection Turning Movement Volume Spreadsheets


87

88

89
90
91

92

93


94

95
APPENDIX C1 TRAFFIC ANALYSIS DESIGN YEAR TRAFFIC ANALYSIS
 APPENDIX C1 TRAFFIC ANALYSIS DESIGN YEAR TRAFFIC ANALYSIS DESIGN YEAR TRAFFIC ANALYSIS February 2018 Highway & Bridge Project PIN 6754.12 Route 13 Connector Road Chemung County February 2018 Appendix
Transportation & Traffic Engineering
 Transportation & Traffic Engineering 1) Project Description This report presents a summary of findings for a Traffic Impact Analysis (TIA) performed by A+ Engineering, Inc. for the Hill Country Family
EXECUTIVE SUMMARY. The following is an outline of the traffic analysis performed by Hales Engineering for the traffic conditions of this project.
 EXECUTIVE SUMMARY This study addresses the traffic impacts associated with the proposed Shopko redevelopment located in Sugarhouse, Utah. The Shopko redevelopment project is located between 1300 East and
Bennett Pit. Traffic Impact Study. J&T Consulting, Inc. Weld County, Colorado. March 3, 2017
 Bennett Pit Traffic Impact Study J&T Consulting, Inc. Weld County, Colorado March 3, 217 Prepared By: Sustainable Traffic Solutions, Inc. http://www.sustainabletrafficsolutions.com/ Joseph L. Henderson,
Clean Harbors Canada, Inc.
 Clean Harbors Canada, Inc. Proposed Lambton Landfill Expansion Environmental Assessment Terms of Reference Transportation Assessment St. Clair Township, Ontario September 2009 itrans Consulting Inc. 260
Traffic Impact Analysis. Alliance Cole Avenue Residential Site Dallas, Texas. Kimley-Horn and Associates, Inc. Dallas, Texas.
 Traffic Impact Analysis Alliance Cole Avenue Residential Site Dallas, Texas February 15, 2018 Kimley-Horn and Associates, Inc. Dallas, Texas Project #064524900 Registered Firm F-928 Traffic Impact Analysis
MEMO VIA . Ms. Amy Roth DPS Director, City of Three Rivers. To:
 MEMO To: Ms. Amy Roth DPS Director, City of Three Rivers VIA EMAIL From: Michael J. Labadie, PE Julie M. Kroll, PE, PTOE Brandon Hayes, PE, P.Eng. Fleis & VandenBrink Date: January 5, 2017 Re: Proposed
LAWRENCE TRANSIT CENTER LOCATION ANALYSIS 9 TH STREET & ROCKLEDGE ROAD / 21 ST STREET & IOWA STREET LAWRENCE, KANSAS
 LAWRENCE TRANSIT CENTER LOCATION ANALYSIS 9 TH STREET & ROCKLEDGE ROAD / 21 ST STREET & IOWA STREET LAWRENCE, KANSAS TRAFFIC IMPACT STUDY FEBRUARY 214 OA Project No. 213-542 TABLE OF CONTENTS 1. INTRODUCTION...
Lacey Gateway Residential Phase 1
 Lacey Gateway Residential Phase Transportation Impact Study April 23, 203 Prepared for: Gateway 850 LLC 5 Lake Bellevue Drive Suite 02 Bellevue, WA 98005 Prepared by: TENW Transportation Engineering West
Traffic Impact Statement (TIS)
") Traffic Impact Statement (TIS) Vincentian PUDA Collier County, FL 10/18/2013 Prepared for: Global Properties of Naples Prepared by: Trebilcock Consulting Solutions, PA 2614 Tamiami Trail N, Suite 615 1205
Traffic Impact Statement (TIS) Vincentian PUDA Collier County, FL 10/18/2013 Prepared for: Global Properties of Naples Prepared by: Trebilcock Consulting Solutions, PA 2614 Tamiami Trail N, Suite 615 1205
Appendix C-5: Proposed Refinements Rail Operations and Maintenance Facility (ROMF) Traffic Impact Analysis. Durham-Orange Light Rail Transit Project
 Traffic Impact Analysis. Durham-Orange Light Rail Transit Project") Appendix C-5: Proposed Refinements Rail Operations and Maintenance Facility (ROMF) Traffic Impact Analysis Durham-Orange Light Rail Transit Project July 25, 218 ROMF Transportation Impact Analysis Version
Appendix C-5: Proposed Refinements Rail Operations and Maintenance Facility (ROMF) Traffic Impact Analysis Durham-Orange Light Rail Transit Project July 25, 218 ROMF Transportation Impact Analysis Version
Section 5.0 Traffic Information
 Section 5.0 Traffic Information 10.0 TRANSPORTATION MDM Transportation Consultants, Inc. (MDM) has prepared an evaluation of transportation impacts for the proposed evaluation for the expansion of the
Proposed location of Camp Parkway Commerce Center. Vicinity map of Camp Parkway Commerce Center Southampton County, VA
 Proposed location of Camp Parkway Commerce Center Vicinity map of Camp Parkway Commerce Center Southampton County, VA Camp Parkway Commerce Center is a proposed distribution and industrial center to be
Volume 1 Traffic Impact Analysis Turtle Creek Boulevard Dallas, Texas. Kimley-Horn and Associates, Inc. Dallas, Texas.
 Volume 1 Traffic Impact Analysis 2727 Dallas, Texas June 18, 2018 Kimley-Horn and Associates, Inc. Dallas, Texas Project #064523000 Registered Firm F-928 Traffic Impact Analysis 2727 Dallas, Texas Prepared
King Soopers #116 Thornton, Colorado
 Traffic Impact Study King Soopers #116 Thornton, Colorado Prepared for: Galloway & Company, Inc. T R A F F I C I M P A C T S T U D Y King Soopers #116 Thornton, Colorado Prepared for Galloway & Company
Appendix J Traffic Impact Study
 MRI May 2012 Appendix J Traffic Impact Study Level 2 Traffic Assessment Limited Impact Review Appendix J [This page was left blank intentionally.] www.sgm-inc.com Figure 1. Site Driveway and Trail Crossing
TRAFFIC SIGNAL DESIGN REPORT KING OF PRUSSIA ROAD & RAIDER ROAD RADNOR TOWNSHIP PENNSYLVANIA
 TRAFFIC SIGNAL DESIGN REPORT KING OF PRUSSIA ROAD & RAIDER ROAD RADNOR TOWNSHIP PENNSYLVANIA PREPARED FOR: UNIVERSITY OF PENNSYLVANIA HEALTH SYSTEM 34 CIVIC CENTER BOULEVARD PHILADELPHIA, PA 1987 (61)
Traffic Feasibility Study
 Traffic Feasibility Study Town Center South Robbinsville Township, Mercer County, New Jersey December 19, 2017 Prepared For Robbinsville Township Department of Community Development 2298 Route 33 Robbinsville,
Craig Scheffler, P.E., PTOE HNTB North Carolina, P.C. HNTB Project File: Subject
 TECHNICAL MEMORANDUM To Kumar Neppalli Traffic Engineering Manager Town of Chapel Hill From Craig Scheffler, P.E., PTOE HNTB North Carolina, P.C. Cc HNTB Project File: 38435 Subject Obey Creek TIS 2022
TRAFFIC IMPACT STUDY DERRY GREEN CORPORATE BUSINESS PARK MILTON SECONDARY PLAN MODIFICATION
 TRAFFIC IMPACT STUDY DERRY GREEN CORPORATE BUSINESS PARK MILTON SECONDARY PLAN MODIFICATION TRAFFIC IMPACT STUDY DERRY GREEN CORPORATE BUSINESS PARK MILTON SECONDARY PLAN MODIFICATION DECEMBER 24 UPDATED
TRAFFIC IMPACT ANALYSIS
 TRAFFIC IMPACT ANALYSIS Emerald Isle Commercial Development Prepared by SEPI Engineering & Construction Prepared for Ark Consulting Group, PLLC March 2016 I. Executive Summary A. Site Location The Emerald
V. DEVELOPMENT OF CONCEPTS
 Martin Luther King, Jr. Drive Extension FINAL Feasibility Study Page 9 V. DEVELOPMENT OF CONCEPTS Throughout the study process several alternative alignments were developed and eliminated. Initial discussion
TIMBERVINE TRANSPORTATION IMPACT STUDY FORT COLLINS, COLORADO JANUARY Prepared for:
 TIMBERVINE TRANSPORTATION IMPACT STUDY FORT COLLINS, COLORADO JANUARY 2014 Prepared for: Hartford Companies 1218 W. Ash Street Suite A Windsor, Co 80550 Prepared by: DELICH ASSOCIATES 2272 Glen Haven Drive
INDUSTRIAL DEVELOPMENT
 INDUSTRIAL DEVELOPMENT Traffic Impact Study Plainfield, Illinois August 2018 Prepared for: Seefried Industrial Properties, Inc. TABLE OF CONTENTS Executive Summary 2 Introduction 3 Existing Conditions
Alpine Highway to North County Boulevard Connector Study
 Alpine Highway to North County Boulevard Connector Study prepared by Avenue Consultants March 16, 2017 North County Boulevard Connector Study March 16, 2017 Table of Contents 1 Summary of Findings... 1
Traffic Engineering Study
 Traffic Engineering Study Bellaire Boulevard Prepared For: International Management District Technical Services, Inc. Texas Registered Engineering Firm F-3580 November 2009 Executive Summary has been requested
BARRHAVEN FELLOWSHIP CRC 3058 JOCKVALE ROAD OTTAWA, ONTARIO TRANSPORTATION BRIEF. Prepared for:
 BARRHAVEN FELLOWSHIP CRC 3058 JOCKVALE ROAD OTTAWA, ONTARIO TRANSPORTATION BRIEF Prepared for: Barrhaven Fellowship CRC 3058 Jockvale Road Ottawa, ON K2J 2W7 December 7, 2016 116-649 Report_1.doc D. J.
West Hills Shopping Centre Lowe s Expansion Traffic Impact Study
 West Hills Shopping Centre Lowe s Expansion Traffic Impact Study Prepared for: Armel Corporation January 2015 Paradigm Transportation Solutions Ltd. 22 King Street South, Suite 300 Waterloo ON N2J 1N8
Proposed Inn at Bellefield Traffic Impact Assessment
 Proposed Inn at Bellefield Traffic Impact Assessment Town of Hyde Park Dutchess County, New York Prepared for: T-Rex Hyde Park Owner LLC 500 Mamroneck Avenue, Suite 300 Harrison, NY 10528 June 21, 2017
PROJECT: Wilkinson Road Corridor Improvement Traffic Management Planning Project SUBJECT: Traffic Analysis
 TECHNICAL MEMORANDUM DATE: September 10, 2014 PROJECT 5861.03 NO: PROJECT: Wilkinson Road Corridor Improvement Traffic Management Planning Project SUBJECT: Traffic Analysis TO: Steve Holroyd - District
Traffic Impact Analysis West Street Garden Plots Improvements and DuPage River Park Garden Plots Development Naperville, Illinois
 Traffic Impact Analysis West Street Garden Plots Improvements and DuPage River Park Garden Plots Development Naperville, Illinois Submitted by April 9, 2009 Introduction Kenig, Lindgren, O Hara, Aboona,
Traffic Impact Study for the proposed. Town of Allegany, New York. August Project No Prepared For:
 Appendix B SRF Traffic Study (Revised November 2005) Draft Environmental Impact Statement University Commons Town of Allegany, Cattaraugus County, NY December 2005 Traffic Impact Study for the proposed
TRAFFIC IMPACT STUDY FOR SONIC DRIVE-IN RESTAURANT. Vallejo, CA. Prepared For:
 TRAFFIC IMPACT STUDY FOR SONIC DRIVE-IN RESTAURANT Vallejo, CA Prepared For: ELITE DRIVE-INS, INC. 2190 Meridian Park Blvd, Suite G Concord, CA 94520 Prepared By: KD Anderson & Associates 3853 Taylor Road,
Traffic Impact Study Speedway Gas Station Redevelopment
 Traffic Impact Study Speedway Gas Station Redevelopment Warrenville, Illinois Prepared For: Prepared By: April 11, 2018 Table of Contents 1. Introduction... 1 2. Existing Conditions... 4 Site Location...
Table of Contents INTRODUCTION... 3 PROJECT STUDY AREA Figure 1 Vicinity Map Study Area... 4 EXISTING CONDITIONS... 5 TRAFFIC OPERATIONS...
 Crosshaven Drive Corridor Study City of Vestavia Hills, Alabama Table of Contents INTRODUCTION... 3 PROJECT STUDY AREA... 3 Figure 1 Vicinity Map Study Area... 4 EXISTING CONDITIONS... 5 TRAFFIC OPERATIONS...
2.0 Development Driveways. Movin Out June 2017
 Movin Out June 2017 1.0 Introduction The proposed Movin Out development is a mixed use development in the northeast quadrant of the intersection of West Broadway and Fayette Avenue in the City of Madison.
THE CORNERSTONE APARTMENTS TRAFFIC IMPACT STUDY R&M PROJECT NO
 THE CORNERSTONE APARTMENTS SITUATED AT N/E/C OF STAUDERMAN AVENUE AND FOREST AVENUE VILLAGE OF LYNBROOK NASSAU COUNTY, NEW YORK TRAFFIC IMPACT STUDY R&M PROJECT NO. 2018-089 September 2018 50 Elm Street,
MERIVALE PRIORITY SQUARE 2852 MERIVALE ROAD CITY OF OTTAWA TRANSPORTATION BRIEF. Prepared for: ONT Inc. 25 Winding Way Nepean, Ontario K2C 3H1
 MERIVALE PRIORITY SQUARE 2852 MERIVALE ROAD CITY OF OTTAWA TRANSPORTATION BRIEF Prepared for: 2190986ONT Inc. 25 Winding Way Nepean, Ontario K2C 3H1 October 6, 2010 110-502 Report_1.doc D. J. Halpenny
105 Toronto Street South, Markdale Transportation Impact Study. Paradigm Transportation Solutions Limited
 105 Toronto Street South, Markdale Transportation Impact Study Paradigm Transportation Solutions Limited December 2016 Project Summary Project Number 162060 December 2016 Client Zelinka Priamo Ltd 318
Per Revised Concept Plan Residential Condo/Townhouse. Proposed Land Use per TIS
 January 2, 2018 Mr. Paul DeBotton Marple Associates, L.P. 1604 Walnut Street, 4 th Floor Philadelphia, PA 19103 RE: Langford Run Road Traffic Analysis Proposed Mid County Shopping Center Marple Township,
DEVELOPMENT PROPERTY 1627 MAXIME STREET CITY OF OTTAWA TRANSPORTATION OVERVIEW. Prepared for: Subhas Bhargava. July 9, Overview_1.
 DEVELOPMENT PROPERTY 1627 MAXIME STREET CITY OF OTTAWA TRANSPORTATION OVERVIEW Prepared for: Subhas Bhargava July 9, 2015 115-620 Overview_1.doc D. J. Halpenny & Associates Ltd. Consulting Transportation
Traffic Impact Analysis 5742 BEACH BOULEVARD MIXED USE PROJECT
 Traffic Impact Analysis 5742 BEACH BOULEVARD MIXED USE PROJECT CITY OF BUENA PARK Prepared by Project No. 14139 000 April 17 th, 2015 DKS Associates Jeffrey Heald, P.E. Rohit Itadkar, T.E. 2677 North Main
APPENDIX G TRAFFIC STUDY TECHNICAL MEMORANDUM
 APPENDIX G TRAFFIC STUDY TECHNICAL MEMORANDUM TECHNICAL MEMORANDUM To: From: Date: Subject: Jerry Flores - AECOM Brian A. Marchetti, AICP September 9, 5 DRAFT Traffic Study LABOE Channel 5 Studio Relocation
INTERSECTION ANALYSIS PARK AVENUE AND BRADDOCK ROAD (FROSTBURG, MD) FOR LENHART TRAFFIC CONSULTING, INC.
 FOR LENHART TRAFFIC CONSULTING, INC.") INTERSECTION ANALYSIS FOR PARK AVENUE AND BRADDOCK ROAD (FROSTBURG, MD) Prepared for: City of Frostburg, Maryland & Allegany County Commissioners Prepared by: LENHART TRAFFIC CONSULTING, INC. TRAFFIC ENGINEERING
INTERSECTION ANALYSIS FOR PARK AVENUE AND BRADDOCK ROAD (FROSTBURG, MD) Prepared for: City of Frostburg, Maryland & Allegany County Commissioners Prepared by: LENHART TRAFFIC CONSULTING, INC. TRAFFIC ENGINEERING
Proposed Hotel and Restaurant Development
 Traffic Impact Study Proposed Hotel and Restaurant Development Marbledale Road Tuckahoe, NY PREPARED FOR BILLWIN DEVELOPMENT AFFILIATES, LLC 365 WHITE PLAINS ROAD EASTCHESTER, NY. 10709 PREPARED BY Engineering
Table of Contents. Traffic Impact Analysis Capital One Building at Schilling Place
 Traffic Impact Analysis Capital One Building at Schilling Place Table of Contents Executive Summary... 1 1. Introduction... 4 2. Project Description... 4 3. Background Information... 4 4. Study Scope...
TALMONT TOWNHOMES MADISON KENNETH SPA TRAFFIC IMPACT STUDY. Sacramento, CA. Prepared For: MBK Homes. Prepared By:
 TALMONT TOWNHOMES MADISON KENNETH SPA TRAFFIC IMPACT STUDY Sacramento, CA Prepared For: MBK Homes Prepared By: KD Anderson & Associates 3853 Taylor Road, Suite G Loomis, California 95650 (916) 660-1555
APPENDIX E. Traffic Analysis Report
 APPENDIX E Traffic Analysis Report THIS PAGE INTENTIONALLY BLANK EAGLE RIVER TRAFFIC MITIGATION PHASE I OLD GLENN HIGHWAY/EAGLE RIVER ROAD INTERSECTION IMPROVEMENTS TRAFFIC ANALYSIS Eagle River, Alaska
HIGHWAY 28 FUNCTIONAL DESIGN
 HIGHWAY 28 FUNCTIONAL DESIGN PUBLIC OPEN HOUSE #1 WEDNESDAY, MARCH 12, 2014 Stantec Presenters: Brad Vander Heyden, Project Engineer Neal Cormack, Project Manager Dave Parker, Project Engineer Beth Thola,
The major roadways in the study area are State Route 166 and State Route 33, which are shown on Figure 1-1 and described below:
 3.5 TRAFFIC AND CIRCULATION 3.5.1 Existing Conditions 3.5.1.1 Street Network DRAFT ENVIRONMENTAL IMPACT REPORT The major roadways in the study area are State Route 166 and State Route 33, which are shown
L1TILE BEARS DAY CARE TRANSPORTATION IMPACT STUDY FORT COLLINS, COLORADO MAY Prepared for:
 L1TILE BEARS DAY CARE TRANSPORTATION IMPACT STUDY FORT COLLINS, COLORADO MAY 2012 Prepared for: Hillside Construction, Inc. 216 Hemlock Street, Suite B Fort Collins, CO 80534 Prepared by: DELICH ASSOCIATES
Appendix C. Traffic Study
 Appendix C Traffic Study TABLE OF CONTENTS SECTION Executive Summary PAGE 1.0 Introduction... 1 1.1 Scope of Work... 1 1.2 Study Area... 2 2.0 Project Description... 3 2.1 Site Access... 4 2.2 Pedestrian
Date: February 7, 2017 John Doyle, Z-Best Products Robert Del Rio. T.E. Z-Best Traffic Operations and Site Access Analysis
 Memorandum Date: February 7, 07 To: From: Subject: John Doyle, Z-Best Products Robert Del Rio. T.E. Z-Best Traffic Operations and Site Access Analysis Introduction Hexagon Transportation Consultants, Inc.
Parks and Transportation System Development Charge Methodology
 City of Sandy Parks and Transportation System Development Charge Methodology March, 2016 Background In order to implement a City Council goal the City of Sandy engaged FCS Group in January of 2015 to update
Trafalgar Road & Lower Base Line Transportation Study Ontario Inc.
 Trafalgar Road & Lower Base Line Transportation Study 1255723 Ontario Inc. Trafalgar Road & Lower Base Line Transportation Study 1255723 Ontario Inc. 1465 Pickering Parkway Suite 200 Pickering ON L1V 7G7
December 5, Red Bank Planning Board Municipal Building 90 Monmouth Street Red Bank, NJ 07701
 Dynamic Traffic, LLC www.dynamic-traffic.com 1904 Main Street Lake Como, NJ 07719 T. 732.681.0760 December 5, 2016 Red Bank Planning Board Municipal Building 90 Monmouth Street Red Bank, NJ 07701 Re: Traffic
Interstate Operations Study: Fargo-Moorhead Metropolitan Area Simulation Output
 NDSU Dept #2880 PO Box 6050 Fargo, ND 58108-6050 Tel 701-231-8058 Fax 701-231-6265 www.ugpti.org www.atacenter.org Interstate Operations Study: Fargo-Moorhead Metropolitan Area 2015 Simulation Output Technical
Southern Windsor County 2016 Traffic Count Program Summary April 2017
 Southern Windsor County 2016 Traffic Count Program Summary April 2017 The Southern Windsor County Regional Planning Commission (the RPC ) has been monitoring traffic at 19 locations throughout the southern
APPENDIX B Traffic Analysis
 APPENDIX B Traffic Analysis Rim of the World Unified School District Reconfiguration Prepared for: Rim of the World School District 27315 North Bay Road, Blue Jay, CA 92317 Prepared by: 400 Oceangate,
TRAFFIC IMPACT STUDY. USD #497 Warehouse and Bus Site
 TRAFFIC IMPACT STUDY for USD #497 Warehouse and Bus Site Prepared by: Jason Hoskinson, PE, PTOE BG Project No. 16-12L July 8, 216 145 Wakarusa Drive Lawrence, Kansas 6649 T: 785.749.4474 F: 785.749.734
Downtown One Way Street Conversion Technical Feasibility Report
 Downtown One Way Street Conversion Technical Feasibility Report As part of the City s Transportation Master Plan, this report reviews the technical feasibility of the proposed conversion of the current
Appendix H TRAFFIC IMPACT ANALYSIS
 Appendix H TRAFFIC IMPACT ANALYSIS Teichert Boca Quarry Expansion Traffic Impact Analysis Prepared for Teichert Aggregates Prepared by TRANSPORTATION CONSULTANTS, INC. LSC Transportation Consultants, Inc.
LCPS Valley Service Center
 Traffic Impact Study LCPS Valley Service Center Loudoun County, Virginia November 4, 2015 Prepared For: Loudoun County Public Schools 21000 Education Court Ashburn, VA 20148 Prepared by: 1140 Connecticut
4.14 TRANSPORTATION AND CIRCULATION
 4.14 TRANSPORTATION AND CIRCULATION 4.14.1 Summary Table 4.14-1 summarizes the identified environmental impacts, proposed mitigation measures, and residual impacts of the proposed project with regard to
RICHMOND OAKS HEALTH CENTRE 6265 PERTH STREET OTTAWA, ONTARIO TRANSPORTATION BRIEF. Prepared for: Guycoki (Eastern) Limited.
 Limited.") RICHMOND OAKS HEALTH CENTRE 6265 PERTH STREET OTTAWA, ONTARIO TRANSPORTATION BRIEF Prepared for: Guycoki (Eastern) Limited June 16, 2016 116-638 Brief_1.doc D. J. Halpenny & Associates Ltd. Consulting
RICHMOND OAKS HEALTH CENTRE 6265 PERTH STREET OTTAWA, ONTARIO TRANSPORTATION BRIEF Prepared for: Guycoki (Eastern) Limited June 16, 2016 116-638 Brief_1.doc D. J. Halpenny & Associates Ltd. Consulting
TRAFFIC IMPACT ANALYSIS RIZZO CONFERENCE CENTER EXPANSION FINAL REPORT
 TRAFFIC IMPACT ANALYSIS RIZZO CONFERENCE CENTER EXPANSION Chapel Hill, North Carolina FINAL REPORT Prepared for: The Town of Chapel Hill, NC Prepared by: Architects-Engineers-Planners, Inc. December 2010
Interstate Operations Study: Fargo-Moorhead Metropolitan Area Simulation Results
 NDSU Dept #2880 PO Box 6050 Fargo, ND 58108-6050 Tel 701-231-8058 Fax 701-231-6265 www.ugpti.org www.atacenter.org Interstate Operations Study: Fargo-Moorhead Metropolitan Area 2025 Simulation Results
RTE. 1 at RTE. 637 & RTE. 639
 INTERSECTION SAFETY STUDY Prepared for: Virginia Department of Transportation Central Region Operations Traffic Engineering (UPC #81378, TO 12-092) DAVENPORT Project Number: 13-368 / /2014 RTE. 1 at RTE.
Appendix Q Traffic Study
 Appendices Appendix Q Traffic Study Crummer Site Subdivision Draft EIR City of Malibu Appendices This page intentionally left blank. The Planning Center April 2013 TRAFFIC IMPACT ANALYSIS Photo z here
April 7, Mr. Blake Shutler Compass Homes Development LLC Summit Homes Construction, LLC PO Box 6539 Dillon, CO 80435
 Compass Homes Development LLC Summit Homes Construction, LLC PO Box 6539 Dillon, CO 80435 Re: Trip Generation Comparison West Hills Townhomes Keystone, Colorado FHU Reference No. 116388-01 Dear Mr. Shutler:
Construction Realty Co.
 MEMORANDUM TO: FROM : Jeff Pickus Construction Realty Co. Luay R. Aboona, PE Principal 9575 West Higgins Road, Suite 400 Rosemont, Illinois 60018 p: 847-518-9990 f: 847-518-9987 DATE: May 22, 2014 SUBJECT:
HUMC/Mountainside Hospital Redevelopment Plan
 Traffic and Parking Analysis HUMC/Mountainside Hospital Redevelopment Plan in Glen Ridge Borough and Montclair Township PREPARED FOR H2M 119 Cherry Hill Road, Suite 110 Parsippany, NJ 07054 862.207.5900
GLEBE 672 TRAFFIC IMPACT ANALYSIS ARLINGTON COUNTY, VIRGINIA. Section 1 INTRODUCTION 1
 GLEBE 672 TRAFFIC IMPACT ANALYSIS ARLINGTON COUNTY, VIRGINIA TABLE OF CONTENTS Page Section 1 INTRODUCTION 1 Section 2 BACKGROUND INFORMATION 6 Public Road Network... 6 Non Auto Facilities and Services...
144&176 John St. and 200 John St. & 588 Charlotte St. Hotel and Residential Subdivision Development
 Solmar Development Corp. 144&176 John St. and 2 John St. & 588 Charlotte St. Hotel and Residential Subdivision Development TRANSPORTATION IMPACT STUDY 18145 November 217 LEA Consulting Ltd. Consulting
Prepared For: Toronto Transit Commission 1138 Bathurst Street Toronto, Ontario M5R 3H2. Prepared By:
 TRAFFIC IMPACT STUDY FOR THE TTC MCNICOLL BUS GARAGE CITY OF TORONTO Prepared For: Toronto Transit Commission 1138 Bathurst Street Toronto, Ontario M5R 3H2 Prepared By: Canada Inc. 4th Floor, 3 Leek Crescent
Escondido Marriott Hotel and Mixed-Use Condominium Project TRAFFIC IMPACT ANALYSIS REPORT
 Escondido Marriott Hotel and Mixed-Use Condominium Project TRAFFIC IMPACT ANALYSIS REPORT Prepared for Phelps Program Management 420 Sixth Avenue, Greeley, CO 80632 Prepared by 5050 Avenida Encinas, Suite
GASOLINE SERVICE STATION 1618, 1622 ROGER STEVENS DRIVE OTTAWA, ONTARIO TRANSPORTATION IMPACT ASSESSMENT. Prepared for:
 GASOLINE SERVICE STATION 1618, 1622 ROGER STEVENS DRIVE OTTAWA, ONTARIO TRANSPORTATION IMPACT ASSESSMENT Prepared for: Invecta Development (Ottawa) Corporation 758 Shanks Height Milton, ON L9T 7P7 May
IV. REVISIONS TO THE DRAFT IS/MND
 IV. REVISIONS TO THE DRAFT IS/MND 1. REVISIONS TO THE DRAFT IS/MND This section presents corrections and clarifications that have been made to the text of the Draft IS/MND. These changes include revisions
TRANSPORTATION STUDY FOR THE 8899 BEVERLY BOULEVARD PROJECT
 DRAFT TRANSPORTATION STUDY FOR THE 8899 BEVERLY BOULEVARD PROJECT WEST HOLLYWOOD, CALIFORNIA NOVEMBER 2013 PREPARED FOR BEVERLY BOULEVARD ASSOCIATION PREPARED BY DRAFT TRANSPORTATION STUDY FOR THE 8899
Figure 1 Map of intersection of SR 44 (Ravenna Rd) and Butternut Rd
 and Butternut Rd") Abbreviated Study District: 12 County: Geauga Route: SR 44 Section: 1.58 GEA 44 1.58 213 HSP # 47 (Rural Intersection) Prepared April 23, 215 By Bryan Emery Existing Conditions This study contains the
Abbreviated Study District: 12 County: Geauga Route: SR 44 Section: 1.58 GEA 44 1.58 213 HSP # 47 (Rural Intersection) Prepared April 23, 215 By Bryan Emery Existing Conditions This study contains the
Mountain Area Transportation Study Model Methodology and Assumptions Final
 Model Methodology and Assumptions Final February 19, 2017 Submitted to: 17J17-1768.17 Prepared by Iteris, Inc. Innovating Through Informatics TABLE OF CONTENTS 1.0 OVERVIEW... 1 1.1 Project Objective and
Roundabout Feasibility Study SR 44 at Grand Avenue TABLE OF CONTENTS
 Roundabout Feasibility Study SR 44 at Grand Avenue TABLE OF CONTENTS Introduction and Executive Summary... 1 Existing Conditions... 3 Intersection Volume Conditions... 5 Intersection Operations... 9 Safety
MINERVA PARK SITE TRAFFIC IMPACT STUDY M/I HOMES. September 2, 2015
 5500 New Albany Road Columbus, Ohio 43054 Phone: 614.775.4500 Fax: 614.775.4800 Toll Free: 1-888-775-EMHT emht.com 2015-1008 MINERVA PARK SITE TRAFFIC IMPACT STUDY M/I HOMES September 2, 2015 Engineers
ZINFANDEL LANE / SILVERADO TRAIL INTERSECTION TRAFFIC ANALYSIS
 ZINFANDEL LANE / SILVERADO TRAIL INTERSECTION TRAFFIC ANALYSIS UPDATED TRAFFIC STUDY FOR THE PROPOSED RAYMOND VINEYARDS WINERY USE PERMIT MODIFICATION #P11-00156 AUGUST 5, 2014 PREPARED BY: OMNI-MEANS,
Mineola Village Green
 Traffic Impact Analysis Report Mineola Village Green 199 2 nd Street Mineola, New York Prepared for Mineola Metro LLC c/o Lalezarian Properties 1999 Marcus Avenue, Suite 310 Lake Success, NY 11042 Prepared
Oakbrook Village Plaza City of Laguna Hills
 Oakbrook Village Plaza City of Laguna Hills Traffic Impact Analysis Prepared by: HDR Engineering 3230 El Camino Real, Suite 200 Irvine, CA 92602 October 2012 Revision 3 D-1 Oakbrook Village Plaza Laguna
Speed measurements were taken at the following three locations on October 13 and 14, 2016 (See Location Map in Exhibit 1):
:") 2709 McGraw Drive Bloomington, Illinois 61704 p 309.663.8435 f 309.663.1571 www.f-w.com www.greennavigation.com November 4, 2016 Mr. Kevin Kothe, PE City Engineer City of Bloomington Public Works Department
2709 McGraw Drive Bloomington, Illinois 61704 p 309.663.8435 f 309.663.1571 www.f-w.com www.greennavigation.com November 4, 2016 Mr. Kevin Kothe, PE City Engineer City of Bloomington Public Works Department
TRAFFIC IMPACT STUDY VICDOM BROCK ROAD PIT EXPANSION
 TRAFFIC IMPACT STUDY VICDOM BROCK ROAD PIT EXPANSION TOWNSHIP OF UXBRIDGE P/N 05-1993 June 2011 Revised -August 2011 Prepared by: Skelton, Brumwell & Associates Inc. 93 Bell Farm Road, Suite 107 Barrie,
TECHNICAL MEMORANDUM. Part A: Introduction
 TECHNICAL MEMORANDUM To: David J. Decker Decker Properties, Inc. 5950 Seminole Centre Ct. Suite 200 Madison, Wisconsin 53711 608-663-1218 Fax: 608-663-1226 www.klengineering.com From: Mike Scarmon, P.E.,
Re: Addendum No. 4 Transportation Overview 146 Mountshannon Drive Ottawa, Ontario
 April 18 th, 2017 Mr. Kevin Yemm Vice President, Land Development Richraft Group of Companies 2280 St. Laurent Boulevard, Suite 201 Ottawa, Ontario (Tel: 613.739.7111 / e-mail: keviny@richcraft.com) Re:
Ingraham High School Parking and Traffic Analysis
 Parking and Traffic Analysis Seattle, WA Prepared for: URS Corporation 1501 4th Avenue, Suite 1400 Seattle, WA 98101-1616 Mirai Transportation Planning & Engineering 11410 NE 122nd Way, Suite 320 Kirkland,
Traffic Impact Analysis Update
 Willow Bend Traffic Impact Analysis Update TABLE OF CONTENTS Page I. INTRODUCTION -------------------------------------------------------------------------------------------- 1 II. EXISTING CONDITIONS
Proposed CVS/pharmacy
 Traffic Impact and Access Study Proposed CVS/pharmacy West Main Street (Route 1) at Hull Street Clinton, Connecticut PREPARED FOR Arista Development LLC 520 Providence Highway, Suite 9 Norwood, Massachusetts
TRAFFIC IMPACT ANALYSIS FOR THE 630/650 SOUTH STREET RETAIL DEVELOPMENT WRENTHAM, MASSACHUSETTS
 PARE PROJECT NO. 17120.00 REPORT TRAFFIC IMPACT ANALYSIS FOR THE 630/650 SOUTH STREET RETAIL DEVELOPMENT WRENTHAM, MASSACHUSETTS SUBMITTED TO: GEORGETOWN CAPITAL MANAGEMENT PO BOX 369 GEORGETOWN, MA 01833
Table 1 - Land Use Comparisons - Proposed King s Wharf Development. Retail (SF) Office (SF) 354 6,000 10, Land Uses 1
 Office (SF) 354 6,000 10, Land Uses 1") Ref. No. 171-6694 Phase 2 November 23, 217 Mr. David Quilichini, Vice President Fares & Co. Developments Inc. 31 Place Keelson Sales Centre DARTMOUTH NS B2Y C1 Sent Via Email to David@faresinc.com RE:
Ref. No. 171-6694 Phase 2 November 23, 217 Mr. David Quilichini, Vice President Fares & Co. Developments Inc. 31 Place Keelson Sales Centre DARTMOUTH NS B2Y C1 Sent Via Email to David@faresinc.com RE:
APPENDIX J LAKE WOHLFORD DAM REPLACEMENT PROJECT TRAFFIC IMPACT ANALYSIS (DAM REPLACEMENT) Lake Wohlford Dam Replacement Project EIR
 Lake Wohlford Dam Replacement Project EIR") APPENDIX J LAKE WOHLFORD DAM REPLACEMENT PROJECT TRAFFIC IMPACT ANALYSIS (DAM REPLACEMENT) Replacement Project EIR Appendices TRAFFIC IMPACT ANALYSIS LAKE WOHLFORD DAM Escondido, California December 19,
APPENDIX J LAKE WOHLFORD DAM REPLACEMENT PROJECT TRAFFIC IMPACT ANALYSIS (DAM REPLACEMENT) Replacement Project EIR Appendices TRAFFIC IMPACT ANALYSIS LAKE WOHLFORD DAM Escondido, California December 19,
 Traffic Analysis For Approved Uses within the St. Lucie West DRI Aldi Port St. Lucie, FL Prepared for: Bohler Engineering, LLC 1000 Corporate Drive Suite 250 Fort Lauderdale, FL 33334 Prepared by: 10795
Subarea Study. Manning Avenue (CSAH 15) Corridor Management and Safety Improvement Project. Final Version 1. Washington County.
 Corridor Management and Safety Improvement Project. Final Version 1. Washington County.") Subarea Study Manning Avenue (CSAH 15) Corridor Management and Safety Improvement Project Final Version 1 Washington County June 12, 214 SRF No. 138141 Table of Contents Introduction... 1 Forecast Methodology
Subarea Study Manning Avenue (CSAH 15) Corridor Management and Safety Improvement Project Final Version 1 Washington County June 12, 214 SRF No. 138141 Table of Contents Introduction... 1 Forecast Methodology
Appendix G Traffic Study Methodology
 REVISED DRAFT ENVIRONMENTAL IMPACT REPORT/ Appendix G Traffic Forecasting Model Methodology In addition to the existing/baseline condition (year 2005), a level of service (LOS) analysis was conducted for
County State Aid Highway 30 (Diffley Road) and Dodd Road Intersection Study
 and Dodd Road Intersection Study") County State Aid Highway 30 (Diffley Road) and Dodd Road Intersection Study City of Eagan, Dakota County, Minnesota Date: March 2012 Project No. 14957.000 444 Cedar Street, Suite 1500 Saint Paul, MN 55101
County State Aid Highway 30 (Diffley Road) and Dodd Road Intersection Study City of Eagan, Dakota County, Minnesota Date: March 2012 Project No. 14957.000 444 Cedar Street, Suite 1500 Saint Paul, MN 55101