ABSTRACT KIM, KYUNG JUN. DEVELOPMENT OF RESISTANCE FACTORS FOR AXIAL. CAPACITY OF DRIVEN PILES IN NORTH CAROLINA. (under the direction of Dr.
|
|
|
- Philippa Ellis
- 5 years ago
- Views:
Transcription
1 ABSTRACT KIM, KYUNG JUN. DEVELOPMENT OF RESISTANCE FACTORS FOR AXIAL CAPACITY OF DRIVEN PILES IN NORTH CAROLINA. (under the direction of Dr. Mohammed A. Gabr and Dr. M. Shamimur Rahman) Resistance factors were developed in the framework of reliability theory for the Load and Resistance Factor Design (LRFD) of driven pile s axial capacity in North Carolina utilizing pile load test data available from the North Carolina Department of Transportation. A total of 140 Pile Driving Analyzer (PDA) data and 35 static load test data were compiled and grouped into different design categories based on four pile types and two geologic regions. Resistance statistics were evaluated for each design category in terms of bias factors. Bayesian updating was employed to improve the statistics of the resistance bias factors, which were derived from a limited number of pile load test data. Load statistics presented in the current AASHTO LRFD Bridge Design Specifications were used in the reliability analysis and the calibration of the resistance factors. Reliability analysis of the current NCDOT practice of pile foundation design was performed to evaluate the level of safety and to select the target reliability indices. Resistance factor calibration was performed for the three methods of static pile capacity analysis commonly used in the NCDOT: the Vesic, the Nordlund, and the Meyerhof methods. Two types of First Order Reliability Methods (Mean Value First Order Second Moment method and Advanced First Order Second Moment method) were employed for
2 the reliability analysis and the calibration of the resistance factors. Recommended resistance factors are presented for the three methods of static pile capacity analysis and for seven different design categories of pile types and geologic regions. The resistance factors developed and recommended from this research are specific for the pile foundation design by the three static capacity analysis methods and for the distinct soil type of the geologic regions of North Carolina. The methodology of the resistance factor calibration developed from this research can be applied to the resistance factor calibration for other foundation types.
3 DEVELOPMENT OF RESISTANCE FACTORS FOR AXIAL CAPACITY OF DRIVEN PILES IN NORTH CAROLINA by KYUNG JUN KIM A dissertation submitted to the Graduate Faculty of North Carolina State University in partial fulfillment of the requirements for the Degree of Doctor of Philosophy Department of Civil Engineering Raleigh, North Carolina October, 2002 APPROVED BY: Dr. Mohammed A. Gabr Chair of Advisory Committee Dr. M. Shamimur Rahman Co-Chair of Advisory Committee Dr. Roy H. Borden Dr. C. C. Tung
4 BIOGRAPHY Kyung Jun Kim was born in Pusan, Korea. He entered Seoul National University in March 1974 and graduated in February 1978 with a B. S. in Civil Engineering. He continued his study at the graduate school of Pusan National University while working with Korea Electric Power Company as a civil engineer. He received a Master s degree in Civil Engineering from Pusan National University in February In January 1982, he moved to Miryung Construction Corporation and worked there as a project engineer until December In January 1984, he immigrated to the United States with his wife and son. He began his study at the graduate school of the University of Texas at Arlington in June 1984 and received a Master s degree in Civil Engineering in December He continued his study in the Ph.D. program at the University of Texas at Arlington until May He moved to North Carolina with his family and began his career at the North Carolina Department of Transportation in October While employed at the North Carolina Department of Transportation, he pursued his Ph.D. at the North Carolina State University on a part-time basis. He is currently a project manager for geotechnical engineering at the North Carolina Department of Transportation. ii
5 ACKNOWLEDGEMENTS I sincerely thank my advisor Dr. Mohammed A. Gabr and co-advisor Dr. M. Shamimur Rahman for providing me the guidance and support, and for their tireless advice during the course of my study for this dissertation. I also thank Dr. Roy H. Borden and Dr. C. C. Tung for reviewing my work and providing the valuable input to this dissertation. The assistance of Mr. Sahadht Hossain and Ms. Rabia Sarica, the graduate students at NCSU, throughout the research is also very much appreciated. I sincerely thank my employer, the North Carolina Department of Transportation, for giving me the opportunity to study and to participate in the research. The support and encouragement of my colleagues and the management is greatly appreciated. I would like to express my special thanks to my wife, Hyeri, for many years of her endurance, sacrifice, assistance, and encouragement, which made this accomplishment possible. The encouragement and support of my son Steve is also acknowledged. I also thank my parents-in-law, brothers and sisters, brothers-in-law and sisters-in-law, and all of my friends who helped me in many ways to accomplish this. I miss very much my parents and younger brother who would have been very happy to hear about this dissertation, if they were alive. I dedicate this dissertation to my deceased parents. iii
6 TABLE OF CONTENTS Page LIST OF TABLES viii LIST OF FIGURES xi 1.0 INTRODUCTION BACKGROUND A BRIEF HISTORY OF LRFD FOR STRUCTURAL DESIGN A BRIEF HISTORY OF LRFD FOR GEOTECHNICAL DESIGN PROBLEM STATEMENT RESEARCH SCOPE AND OBJECTIVES STATIC ANALYSIS OF AXIAL CAPACITY OF DRIVEN PILES INTRODUCTION ALLOWABLE STRENGTH DESIGN (ASD) LOAD AND RESISTANCE FACTOR DESIGN (LRFD) THE VESIC METHOD THE NORDLUND METHOD THE MEYERHOF METHOD PILE LOAD TEST DATA 28 iv
7 3.1 GENERAL DESCRIPTION OF NORTH CAROLINA GEOLOGY Coastal Region Piedmont Region Mountain Region PILE DRIVING ANALYZER (PDA) DATA Case Pile Wave Analysis Program (CAPWAP) Coastal Area Concrete Square Piles Jetting Effects Coastal Area Steel HP Piles Coastal Area Steel Pipe Piles Coastal Area Concrete Cylinder Piles Piedmont Area Concrete Square Piles Piedmont Area Steel HP Piles STATIC LOAD TEST DATA RELIABILITY ANALYSIS INTRODUCTION LOAD STATISTICS RESISTANCE STATISTICS Bias Factor Bayesian Updating of the Bias Factors 58 v
8 4.4 FIRST ORDER SECOND MOMENT (FOSM) ANALYSIS ADVANCED FIRST ORDER SECOND MOMENT () ANALYSIS RELIABILITY ESTIMATE OF THE CURRENT DESIGN PRACTICE Introduction The Vesic Method The Nordlund Method The Meyerhof Method TARGET RELIABILITY INDEX SUMMARY OF RELIABILITY ANALYSIS CALIBRATION OF RESISTANCE FACTORS INTRODUCTION THE METHOD THE METHOD RESISTANCE FACTORS FOR THE VESIC METHOD RESISTANCE FACTORS FOR THE NORDLUND METHOD RESISTANCE FACTORS FOR THE MEYERHOF METHOD EFFECTS OF JETTING ON THE RESISTANCE FACTORS EFFECTS OF L/D RATIO ON THE RESISTANCE FACTORS SUMMARY OF RESISTANCE FACTOR CALIBRATION COMPARISON OF ASD AND LRFD EXAMPLES 141 vi
9 7.0 CONCLUSIONS AND RECOMMENDATIONS 145 REFERENCES 153 APPENDIX A: STATIC PILE CAPACITY ANALYSIS EXAMPLES 160 APPENDIX B: PDA/CAPWAP DATA SUMMARY SHEETS 170 APPENDIX C: RESISTANCE BIAS FACTOR STATISTICS 182 APPENDIX D: COMPUTER PROGRAM ADVREL 267 APPENDIX E: COMPUTER PROGRAM RFCAL 272 vii
10 LIST OF TABLES Table 1-1. AASHTO Resistance Factors for Axially Loaded Piles 9 Table 2-1. Bearing Capacity Factors (N c and N σ ) for the Vesic Method 20 Table 2-2. Coefficient of Adhesion for Clay Soils 22 Table 3-1. PDA EOD Coastal Concrete Square Piles 34 Table 3-2. PDA BOR Coastal Concrete Square Piles 36 Table 3-3. Coastal Concrete Square Piles PDA BOR / PDA EOD (Set-Up) 37 Table 3-4. PDA EOD Coastal Steel HP Piles 41 Table 3-5. PDA BOR Coastal Steel HP Piles 42 Table 3-6. PDA EOD Coastal Steel Pipe Piles 42 Table 3-7. PDA BOR Coastal Steel Pipe Piles 43 Table 3-8. PDA EOD Coastal Concrete Cylinder Piles 44 Table 3-9. PDA EOD Piedmont Concrete Square Piles 44 Table PDA EOD Piedmont Steel HP Piles 45 Table Static Pile Load Test Data 46 Table 4-1. Statistics of Bridge Load Components 52 Table 4-2. Bias Factor Statistics for Coastal Steel HP Piles Vesic Method 53 Table 4-3. Summary of Bias Factor Statistics Coastal Concrete Square Pile 56 Table 4-4. Summary of Bias Factor Statistics Coastal Steel HP Pile 56 Table 4-5. Summary of Bias Factor Statistics Coastal Steel Pipe Pile 57 Table 4-6. Summary of Bias Factor Statistics Coastal Concrete Cylinder Pile 57 viii
11 Table 4-7. Summary of Bias Factor Statistics Piedmont Concrete Square Pile 58 Table 4-8. Summary of Bias Factor Statistics Piedmont Steel HP Pile 58 Table 4-9. Bayesian Updating: Coastal Concrete Square Pile, Total Capacity 60 Table Bayesian Updating: Coastal Steel HP Pile, Total Capacity 60 Table Bayesian Updating: Coastal Steel Pipe Pile, Total Capacity 61 Table Bayesian Updating: Coastal Concrete Cylinder Pile, Total Capacity 61 Table Summary of Reliability Analyses: Coastal Concrete Square Pile, Vesic 68 Table Summary of Reliability Analyses: Coastal Steel HP Pile, Vesic 70 Table Summary of Reliability Analyses: Coastal Steel Pipe Pile, Vesic 72 Table Summary of Reliability Analyses: Coastal Concrete Cylinder Pile, Vesic 74 Table Summary of Reliability Analyses: Piedmont Concrete Square Pile, Vesic 75 Table Summary of Reliability Analyses: Piedmont Steel HP Pile, Vesic 76 Table Summary of Reliability Analyses: Coastal Concrete Square Pile, Nordlund 77 Table Summary of Reliability Analyses: Coastal Steel HP Pile, Nordlund 79 Table Summary of Reliability Analyses: Coastal Steel Pipe Pile, Nordlund 81 Table Summary of Reliability Analyses: Coastal Concrete Cylinder Pile, Nordlund 83 Table Summary of Reliability Analyses: Piedmont Concrete Square Pile, Nordlund 84 Table Summary of Reliability Analyses: Piedmont Steel HP Pile, Nordlund 85 Table Summary of Reliability Analyses: Coastal Concrete Square Pile, Meyerhof 86 Table Summary of Reliability Analyses: Coastal Steel HP Pile, Meyerhof 88 Table Summary of Reliability Analyses: Coastal Steel Pipe Pile, Meyerhof 90 Table Summary of Reliability Analyses: Coastal Concrete Cylinder Pile, Meyerhof 92 Table Summary of Reliability Analyses: Piedmont Concrete Square Pile, Meyerhof 92 ix
12 Table Summary of Reliability Analyses: Piedmont Steel HP Pile, Meyerhof 94 Table 5-1. Calibration for PDA BOR Coastal Concrete Square Pile, Vesic 99 Table 5-2. Resistance Factors for Coastal Concrete Square Pile, Vesic 104 Table 5-3. Resistance Factors for Coastal Steel HP Pile, Vesic 105 Table 5-4. Resistance Factors for Coastal Steel Pipe Pile, Vesic 108 Table 5-5. Resistance Factors for Coastal Concrete Cylinder Pile, Vesic 109 Table 5-6. Resistance Factors for Piedmont Concrete Square Pile, Vesic 111 Table 5-7. Resistance Factors for Piedmont Steel HP Pile, Vesic 111 Table 5-8. Resistance Factors for Coastal Concrete Square Pile, Nordlund 113 Table 5-9. Resistance Factors for Coastal Steel HP Pile, Nordlund 115 Table Resistance Factors for Coastal Steel Pipe Pile, Nordlund 117 Table Resistance Factors for Coastal Concrete Cylinder Pile, Nordlund 119 Table Resistance Factors for Piedmont Concrete Square Pile, Nordlund 121 Table Resistance Factors for Piedmont Steel HP Pile, Nordlund 121 Table Resistance Factors for Coastal Concrete Square Pile, Meyerhof 123 Table Resistance Factors for Coastal Steel HP Pile, Meyerhof 126 Table Resistance Factors for Coastal Steel Pipe Pile, Meyerhof 128 Table Resistance Factors for Coastal Concrete Cylinder Pile, Meyerhof 130 Table Resistance Factors for Piedmont Concrete Square Pile, Meyerhof 130 Table Resistance Factors for Piedmont Steel HP Pile, Meyerhof 132 Table Jetting Effects on Resistance Factors 133 Table Effects of L/D Ratio on Resistance Factors 137 Table 7-1. Recommended Resistance Factors 149 x
13 LIST OF FIGURES Figure 2-1. Distribution of Load and Resistance 14 Figure 2-2. Relationship between Standard Penetration Resistance, Relative Density, and Effective Overburden Pressure 18 Figure 2-3. Relationship between Mean Normal Ground Stress, Relative Density, and Rigidity Index 19 Figure 2-4. Relationship between Maximum Unit Toe Resistance and Friction Angle 27 Figure 3-1. North Carolina Geologic Map 28 Figure 3-2. Coastal Concrete Square Piles Setup Effect (Total Capacity) 38 Figure 3-3. Coastal Concrete Square Piles Setup Effect (Skin Capacity) 39 Figure 3-4. Coastal Concrete Square Piles Setup Effect (Toe Capacity) 39 Figure 3-5. Davisson s Failure Criteria 48 Figure 4-1. Reliability Analysis of Vesic Method for Coastal Concrete 69 Square Pile (Total Capacity) Figure 4-2. Reliability Analysis of Vesic Method for Coastal Steel 71 HP Pile (Total Capacity) Figure 4-3. Reliability Analysis of Vesic Method for Coastal Steel 72 Pipe Pile (Total Capacity) Figure 4-4. Reliability Analysis of Vesic Method for Coastal Concrete 73 Cylinder Pile (Total Capacity) Figure 4-5. Reliability Analysis of Vesic Method for Piedmont Concrete 75 Square Pile (Total Capacity) Figure 4-6. Reliability Analysis of Vesic Method for Piedmont Steel 76 HP Pile (Total Capacity) xi
14 Figure 4-7. Reliability Analysis of Nordlund Method for Coastal Concrete 78 Square Pile (Total Capacity) Figure 4-8. Reliability Analysis of Nordlund Method for Coastal Steel 80 HP Pile (Total Capacity) Figure 4-9. Reliability Analysis of Nordlund Method for Coastal Steel 81 Pipe Pile (Total Capacity) Figure Reliability Analysis of Nordlund Method for Coastal Concrete 82 Cylinder Pile (Total Capacity) Figure Reliability Analysis of Nordlund Method for Piedmont Concrete 84 Square Pile (Total Capacity) Figure Reliability Analysis of Nordlund Method for Piedmont Steel 85 HP Pile (Total Capacity) Figure Reliability Analysis of Meyerhof Method for Coastal Concrete 87 Square Pile (Total Capacity) Figure Reliability Analysis of Meyerhof Method for Coastal Steel 89 HP Pile (Total Capacity) Figure Reliability Analysis of Meyerhof Method for Coastal Steel 90 Pipe Pile (Total Capacity) Figure Reliability Analysis of Meyerhof Method for Coastal Concrete 91 Cylinder Pile (Total Capacity) Figure Reliability Analysis of Meyerhof Method for Piedmont Concrete 93 Square Pile (Total Capacity) Figure Reliability Analysis of Meyerhof Method for Piedmont Steel 94 HP Pile (Total Capacity) Figure 5-1. Calibration Graphical Output 101 Figure 5-2. Resistance Factors for Coastal Concrete Square Pile, 103 Vesic Method Figure 5-3. Resistance Factors for Coastal Concrete Square Pile, 103 Vesic Method Figure 5-4. Resistance Factors for Coastal Steel HP Pile, Vesic Method 106 xii
15 Figure 5-5. Resistance Factors for Coastal Steel Pipe Pile, Vesic Method 107 Figure 5-6. Resistance Factors for Coastal Concrete Cylinder Pile, Vesic Method 109 Figure 5-7. Resistance Factors for Piedmont Concrete Square Pile, Vesic Method 110 Figure 5-8. Resistance Factors for Piedmont Steel HP Pile, Vesic Method 112 Figure 5-9. Resistance Factors for Coastal Concrete Square Pile, 114 Nordlund Method Figure Resistance Factors for Coastal Concrete Square Pile, 114 Nordlund Method Figure Resistance Factors for Coastal Steel HP Pile, Nordlund Method 116 Figure Resistance Factors for Coastal Steel Pipe Pile, Nordlund Method 117 Figure Resistance Factors for Coastal Concrete Cylinder Pile, Nordlund Method 119 Figure Resistance Factors for Piedmont Concrete Square Pile, Nordlund Method 120 Figure Resistance Factors for Piedmont Steel HP Pile, Nordlund Method 122 Figure Resistance Factors for Coastal Concrete Square Pile, 124 Meyerhof Method Figure Resistance Factors for Coastal Concrete Square Pile, 124 Meyerhof Method Figure Resistance Factors for Coastal Steel HP Pile, Meyerhof Method 126 Figure Resistance Factors for Coastal Steel Pipe Pile, Meyerhof Method 128 Figure Resistance Factors for Coastal Concrete Cylinder Pile, Meyerhof Method 129 Figure Resistance Factors for Piedmont Concrete Square Pile, Meyerhof Method 131 Figure Resistance Factors for Piedmont Steel HP Pile, Meyerhof Method 132 Figure Jetting Effect on Resistance Factor for Vesic Method 135 (Coastal Concrete Square Pile, β T = 2.0) Figure Jetting Effect on Resistance Factor for Nordlund Method 135 (Coastal Concrete Square Pile, β T = 2.0) xiii
16 Figure Jetting Effect on Resistance Factor for Meyerhof Method 136 (Coastal Concrete Square Pile, β T = 2.0) Figure Effect of L/D Ratio on Resistance Factor for Vesic Method 138 (Coastal Concrete Square Pile, β T = 2.0) Figure Effect of L/D Ratio on Resistance Factor for Nordlund Method 138 (Coastal Concrete Square Pile, β T = 2.0) Figure Effect of L/D Ratio on Resistance Factor for Meyerhof Method 139 (Coastal Concrete Square Pile, β T = 2.0) xiv
17 CHAPTER 1. INTRODUCTION 1.1 BACKGROUND Driven piles are one of the main elements of bridge foundations. Currently, the North Carolina Department of Transportation (NCDOT) uses static methods of design of the foundation piles with the conventional factor of safety (referred to as Allowable Strength Design). In addition, Wave Equation Analysis is used to provide the pile driving criteria, which show the required hammer blow counts for achieving the pile design capacity. Static load tests and Pile Driving Analyzer (PDA) are sometimes used to verify the design. The American Association of State Highway and Transportation Officials (AASHTO) has called for the implementation of Load and Resistance Factor Design (LRFD) for bridges including their foundations. Presently, virtually all reinforced concrete superstructures are designed using the LRFD method, and steel design is in the completion process of transition from the Allowable Strength Design (ASD) code to the newer LRFD code. Over the past 18 years there has been a general move toward the increased use of LRFD in structural and geotechnical design practice. In order to achieve a consistent design for both the superstructures and the foundations, many state DOT s are now moving to the implementation of the AASHTO LRFD Specifications. The LRFD approach requires that the load and resistance factors be defined. For the geotechnical design of driven piles, AASHTO guidelines provide the resistance factors for general soil conditions and for several static pile capacity analysis methods as shown in Table
18 However, the AASHTO factors are not available for other pile capacity analysis methods such as the Vesic method, nor appropriate for specific local geologic conditions. The available literature indicates that several users found the AASHTO-recommended factors led to inappropriate design conflicting with their experiences (Goble, 1999). A recent study team organized by the Federal Highway Administration (FHWA) reviewed the developments in load and resistance factor design methods in Canada, Germany, France, Denmark, Norway, and Sweden (DiMaggio et al, 1999). The main recommendation of the team was the need for calibration of resistance factors for different geotechnical applications utilizing existing databases. 1.2 A BRIEF HISTORY OF LRFD FOR STRUCTURAL DESIGN The earliest use of LRFD was in the American Concrete Institute (ACI) Building Code Requirements for Reinforced Concrete, adopted in 1956 by ACI Committee 318 (ACI 1956). The document was brief, and the design method was called Ultimate Strength Design. In this code, resistance factor concept was not introduced; all of the safety factors were embedded in the load factors. However, the load factors were different for different load types and also for different load combinations. In the next version of the ACI 318 Code (ACI 1963), a complete LRFD format was used including resistance factors. The design method was still known as Ultimate Strength Design, but it was identical in format with the LRFD concept. However, both the load and resistance factors in the ACI Codes were not selected based on a rational analysis, but by the intuition and judgment of the committee members. 2
19 Cornell (1969) presented a paper A Probability Based Structural Code in the ACI journal proposing probability based design codes. Cornell outlined the framework of probability-based structural design codes and discussed the detailed procedures to develop the resistance and load factors. Ellingwood et al. (1980) presented in the National Bureau of Standards (NBS) Report #577 the development of load factors for design of buildings based on a probabilistic analysis. The basic concepts of probability theory application for load factor calibration were presented in the paper. The American Institute of Steel Construction (AISC) conducted an extensive calibration study to develop resistance factors for various steel structural elements. AISC adopted the load factors presented in NBS Report #577 when they published the LRFD Specification in 1986 (AISC 1986). The bridge design code adopted by AASHTO in 1977 contained a design procedure called Load Factor Design (LFD) along with the conventional ASD procedure. Both working loads and factored loads were included, and either method could be used in design. In 1994 AASHTO adopted a LRFD code developed from the National Cooperative Highway Research Program (NCHRP) Project (Nowak, 1992). Interim specifications have been adopted and the new design procedure is now being implemented into practice. Most government agencies as well as private firms are now using LRFD procedures for the bridge superstructure design, and they are in the process of adopting the LRFD procedures for the substructure elements. 3
20 1.3 A BRIEF HISTORY OF LRFD FOR GEOTECHNICAL DESIGN In the 1950 s the Danish Geotechnical Institute investigated a limit state design method for geotechnical applications. Hansen (1966) presented a limit state code for foundation engineering, which was adopted by the Danish Engineering Association. This code used factors on both the load and the resistance and appears to be the first attempt of LRFD for geotechnical design. These factors were derived from previous Danish experience, and the resistance factors were applied to the soil properties rather than directly to the resistance. The Danish Code published by the Danish Geotechnical Institute (1985) is the successor of the original limit state code developed by Hansen. It dealt with the design of both shallow and deep foundations, and specific procedures for earth pressure calculations were included. The province of Ontario in Canada adopted LRFD for bridge design in 1979 with the publication of Ontario Highway Bridge Design Code and Commentary. In 1983, the second edition of the LRFD Code with Commentary was adopted in Ontario and its use became mandatory. This code was developed based on a reliability index of 3.5 for superstructure elements. The corresponding results of using a similar reliability index in geotechnical engineering were not encouraging, because the foundation elements generally became larger and the design became more conservative. The third edition of the Ontario Bridge Code with Commentary, which was adopted in 1992, yielded more reasonable design of foundations, but was still more conservative than the previous AASHTO-based ASD method. When the LRFD method was adopted for the new AASHTO bridge design specification in 1994, it was necessary to include a LRFD version for foundation design. 4
21 Barker et al. (1991) presented an extensive research effort for the development of LRFD for bridge foundation design. Their research led to NCHRP Report 343, which became the basis for the foundation design part of the 1994 AASHTO Bridge Design Specifications. The research utilized the rational probabilistic approach towards model variability and the inherent spatial variability of soil properties. However, it did not account for site variability. Goble (1999) presented his findings from a survey of 38 state DOT s practices of LRFD for geotechnical design. Several users of the AASHTO specifications reported that the resistance factors for the foundation design did not agree with their design practice and resulted in an over-conservative design. Withiam et al. (1998) authored a manual titled LRFD for Highway Bridge Substructures published by the Federal Highway Administration (FHWA). Using this manual, FHWA offered a National Highway Institute (NHI) training course to many of the state DOTs in an effort to implement LRFD for foundation design. In 1997 the Florida Department of Transportation (FDOT) developed a LRFD Code for their bridge design (Passe, 1997). The Code was developed using the AASHTO-recommended load combinations and load factors. The reliability index was calculated for the safety factor used in their ASD practice, and a target reliability index was chosen. The resistance factors were then calibrated for the target reliability index. Although no probabilistic analysis was performed in the calibration process, FDOT was a pioneer among the state DOT s in implementing the LRFD for geotechnical applications. 5
22 1.4 PROBLEM STATEMENT NCDOT is currently using static design methods for estimating the axial capacity of pile foundations based on the allowable strength design (ASD) principles with a predetermined factor of safety. The factor of safety used in the axial pile capacity analysis is the same for all pile types, soil conditions and static design methods. This practice does not consider any variation in uncertainties regarding pile types, subsurface conditions, or design methods. AASHTO has mandated the implementation of LRFD for all bridge structures including foundations beginning year FHWA also has called for LRFD in all federally-funded projects from year NCDOT s transition from ASD to LRFD is inevitable in order to meet the mandates of AASHTO and FHWA and to provide geotechnical design measures, which are more consistent with the bridge superstructure design. NCDOT has been using the Vesic method (Vesic, 1977) as the main tool for static analysis of a pile s bearing capacity, supplemented by other methods such as the Nordlund method and the Meyerhof s SPT method. The Vesic method has been proven effective based on the many years of experience and a previous study conducted by Keane (1990). However, this method was not included in any of the previous studies conducted to develop the resistance factors for driven piles axial capacity. Hence, the resistance factors for the Vesic method are not available in the literature including the AASHTO LRFD Bridge Design Specifications. In addition, the factor of safety used in the NCDOT practice, based on the many years of pile foundation design and construction 6
23 experience, is different from the factor of safety used in the calibration of the resistance factors recommended in the current AASHTO LRFD Specifications. There are several factors that can influence the prediction of a pile s axial capacity. Among them are the static analysis model, the site geology, the in-situ and laboratory tests for estimating soil strength parameters, and the designer s judgment and experience. Therefore, it is important to consider all these design aspects in the development of resistance factors. The resistance factors in the AASHTO LRFD Specifications are based on nationwide general geologic conditions and do not address local specific conditions. It has been proven that the AASHTO resistance factors do not provide a reasonable foundation design that conforms to local experiences (Goble, 1999). It is necessary and urgent to determine resistance factors for the axial capacity of driven piles in North Carolina. These factors must be developed for the unique soil types of the region, in which the piles are used, incorporating the many years of pile design and construction experience. 1.5 RESEARCH SCOPE AND OBJECTIVES The main objective of this research is to develop the resistance factors for the design of driven piles in North Carolina. The resistance factors are developed for the different static pile capacity analysis methods, for the different pile types, and for the unique geologic coastal and piedmont regions of the state. These factors are developed within the framework of reliability theory utilizing the Pile Driving Analyzer (PDA) test and static load test data embodying the uncertainties associated with the capacity prediction model, the pile type and geometry, and the soil parameters. The form of 7
24 probability distribution function describing the pile capacity is studied, and the associated parameters are quantified. The first order reliability method (FORM) is used to evaluate the reliability index of the current design methods and to select the target reliability index, which is then used to develop the resistance factors. Specifically, the following objectives are achieved: i. Review the NCDOT s current design practice for the bearing capacity of driven piles along with the geologic characteristics of the different regions of the state. ii. Review and compile the PDA and static load test data maintained by NCDOT, and perform the static analysis of pile bearing capacity for each test data using the three different analysis methods (Vesic, Nordlund, and Meyerhof). iii. Perform the statistical analysis of the pile s predicted and measured bearing capacities and establish the resistance statistics, including the probability distribution and parameters. iv. Perform the reliability analysis of the current design practice using the First Order Reliability Methods (both and ) and select the target reliability index. v. Calibrate the resistance factors for the different static analysis methods, for the different pile types (concrete square, steel HP, steel pipe, and concrete cylinder piles) and geometry, and for the different geologic regions (coastal and piedmont) of North Carolina. vi. Perform parametric and comparative studies to evaluate the influence of the pile length over diameter ratio, the effect of jetting, and the set-up or relaxation effect on the resistance factors. 8
25 vii. Recommend the resistance factors for axial capacity of driven piles in North Carolina and compare the design by the LRFD procedures with the design by the current ASD methods. Table 1-1. AASHTO Resistance Factors for Axially Loaded Piles (AASHTO, 1998) 9
26 CHAPTER 2. STATIC ANALYSIS OF AXIAL CAPACITY OF DRIVEN PILES 2.1 INTRODUCTION There are many static analysis methods available to estimate the required pile lengths and the number of piles for a given set of applied loads to the substructure. Some of them, such as the Meyerhof method, the α-method and the CPT method are mainly empirical, and others, such as the Nordlund method, the β-method, and the Vesic method are semi-empirical. There are some advantages and disadvantages in each method, and the selection of the most appropriate method depends on the site geology, pile type, availability of soil parameters, and the designer s experience. NCDOT has traditionally been using the Vesic method as the main model for the driven pile s axial capacity analysis, supplemented by the Nordlund method and the Meyerhof method. Each of the three methods has a provision in its algorithm that employs the Tomlinson method for the section of the pile in a soft to medium dense clay layer. The resistance factors developed in this study are for these three models: the Vesic, Nordlund, and Meyerhof methods. The ultimate capacity of a single pile is the sum of skin and toe resistances (R U = R S + R T ). The calculation assumes that the skin and toe resistances can be determined separately and these two values do not affect each other. The ultimate load on a pile is the load that can cause failure of either the pile or the soil. The pile failure condition may govern the design where pile points penetrate dense sand or rock, but in most situations, 10
27 ultimate load is determined by the soil failure. Axial capacity of a pile is greatly affected by the assumed distribution of the soil parameters and the soil-pile interaction. Gabr (1993) listed the uncertainties in parameters affecting the axial capacity including physical soil properties, characterization of the interface side friction, pile material and geometry, and loading conditions. Sensitivity study of the cyclic axial capacity of a single pile also indicated the variation in the level of contribution of these parameters as a function of pile deformation (Nadim et al., 1989). In broad terms, there are two methods of design in current use: the working stress design, referred to by AISC as Allowable Strength Design (ASD) and limit state design, referred to as Load and Resistance Factor Design (LRFD). ASD has been the principal method of design used during the past 100 years. During the past 20 years or so, design has been moving toward more rational approach of LRFD, in which the reliability of the design is ensured in a rational framework. In the following, these two types of design methods and the three static analysis methods are presented. 2.2 ALLOWABLE STRENGTH DESIGN (ASD) Considering R to represent the capacity or resistance of a system and Q (=ΣQ i ) the demand or load acting on it, safety is ensured in the design by use of a factor of safety (F) in the following equation: R/F = Q (2-1) The reason for using a factor of safety to reduce the nominal resistance is the uncertainty associated with the evaluation of both R and Q. Meyerhof (1970) presented a very good discussion of safety factors in geotechnical engineering. The following should provide 11
28 an insight into the way in which a value for safety factor is arrived at. Suppose the actual pile load is expected to exceed the service load by an amount Q, and the actual resistance is less than the evaluated resistance by an amount R. A pile that is just adequate would have R R = Q + Q or, R(1 - R/R) = Q(1 + Q/Q) (2-2) The safety factor, F as defined above, can be written as F = R/Q = (1 + Q/Q) / (1 - R/R) (2-3) The above equation illustrates the effect of over-load ( Q/Q) and under-strength ( R/R) on the safety factor without identifying the factors contributing to either. In order to arrive at a numerical value of safety factor, numerical estimates of over-load and under-strength have to be made according to judgment and prior experience. For example, if one assumes that the occasional over-load may be 20% and that the occasional under-strength may be 30%, the safety factor will then be given as: F = (1+0.2) / (1-0.3) = 1.72 (2-4) The advantage of ASD is its simplicity; however, the shortcomings of this approach are: The degree of uncertainty associated with R and Q is not incorporated in a systematic way. The factor of safety as used here is not a good measure of reliability. For a system designed by this method, different probabilities of failure may correspond to the same factor of safety. The factor of safety is selected on the basis of experience and judgment, and therefore tends to be subjective and arbitrary. 12
29 Additional information through intensive soil exploration, improved testing techniques, or better correlation studies cannot be incorporated in the evaluation of the uncertainty and subsequent reduction of the required factor of safety for design. 2.3 Load and Resistance Factor Design (LRFD) In the LRFD procedure, margins for safety are incorporated through load factors and resistance factors. Goble (1996) illustrated the load and resistance factor design (LRFD) bridge specification that was accepted by the AASHTO Bridge Committee. He tested the design procedure for driven pile foundations using a hypothetical example and concluded that the AASHTO LRFD specification would work effectively, but the resistance factors should be modified to be more effective through further research. The basic requirements for LRFD-based design can be expressed as: φr = Σ γ i Q i (2-5) where φ is a resistance factor and γ i are load factors. The idea here is to reduce the resistance and increase the load in order to account for the uncertainty associated with both of them. However, in this method, these factors can be systematically developed in the framework of reliability theory. The uncertainties associated with both the resistance and the load may be fully defined through their probability distributions. The probability of failure may be considered through the extent of overlap (Figure 2-1) between the distributions of the resistance and the load. This area of overlap depends on three factors: (i) the relative position of the two curves, represented by the means (µ R, µ Q ) of the two variables, (ii) the dispersion of the two curves, represented by the standard deviations (σ R, 13
30 σ Q ) of the two variables, and (iii) the shapes of the two curves, represented by their probability density functions f R (r) and f Q (q). Probability Density Function f Q (q) Failure Region f R (r) µ Q µ Qn R R n R, Q Figure 2-1. Distribution of Load and Resistance (Haldar, 2000) The objective of safe design can be achieved by selecting the design variables in such a way that the area of overlap is as small as possible, so that the underlying risk is not compromised within the constraints of economy. In ASD method, this objective is achieved by shifting the positions of the curves through the use of safety factors. A more rational approach would be to compute the risk by accounting for all three factors of the overlap and to select the design variables so that an acceptable risk of failure is achieved. This is the basis of the risk-based design concept. The advantages of this approach are: 14
31 The uncertainties associated with the design parameters are handled in a rational framework of probability theory. The reliability, or risk, is quantified through a consistent measure, and a consistent level of safety can be assured. Additional information can be incorporated in the evaluation of uncertainty and subsequent updating of the load and resistance factors. LRFD is being widely adopted in practice, and the adoption of this approach for pile design will be consistent with the design of other components of a civil engineering system. The rationality of LRFD is attractive, and it will also lead to a safer and more economical design. LRFD provides the framework to handle unusual loads that may not be covered by the specifications. The design may have uncertainty relating to the resistance of a pile, in which case the resistance factors may be modified. Future adjustments in the calibration of load and resistance factors can be made without much complication. The disadvantages of the LRFD are: The reliability analysis to develop and adjust load and resistance factors for individual situations requires considerable amounts of statistical data and probabilistic design algorithms. The quality of data can influence the developed factors significantly. Implementation requires some degree of training and understanding of the LRFD methodologies and a change in design procedures. 15
32 2.4 THE VESIC METHOD Vesic (1977) presented his design method for pile foundations in the NCHRP Synthesis #42. This is a semi-empirical method based on a number of field test data from several locations in the U.S. and abroad. The Vesic method has been used most widely in NCDOT to predict a driven pile s bearing capacity. Keane (1990) reported that the Vesic method predicted the pile s bearing capacity most closely to the measured values from the 13 static load tests performed in the past by NCDOT. In the early 1990, NCDOT coded a computer program PILECAP following the general algorithm of the Vesic method. PILECAP calculates a pile s bearing capacities and pile toe settlements at predetermined depth intervals. An example PILECAP output is included in Appendix A. The Vesic method equates the ultimate bearing capacity to the sum of total skin resistance and total toe resistance. Unit skin resistance, f s, consists of two parts as shown in the following equation. f s = c a + q s tanδ (2-6) In the equation, δ and tanδ represents the friction angle and the coefficient of friction between soil and pile, respectively. Tanδ can be taken equal to tanφ, the coefficient of friction of the remolded soil in terms of effective stresses (φ is the soil s angle of frictional resistance). The pile-soil cohesion (c a ) is normally small for granular soils and is neglected in the design. The normal stress on the skin (q s ) is related to the effective vertical stress (q v ) at the point of interest and the coefficient of lateral earth pressure (K), and Equation 2-6 can be rewritten as follows. f s = K tanφ q v = N s q v (2-7) 16
33 Vesic reported the measured N s values for driven piles in very dense sand varying from about 2 for very short piles to about 0.4 for very long piles. In loose sand N s can be as low as 0.1 with no obvious decrease with increasing pile length. Vesic also reported that for piles in medium to dense sand, f s reaches a quasi-constant limit value after some penetration into the sand stratum, which is a function of only the initial sand density and the overconsolidation ratio of the deposit. He proposed the following simple formula for unit skin resistance of piles in a granular soil deposit in terms of the soil s relative density (Dr) in each layer. f s = (1.5) (0.08) (10) 1.5Dr^4 tsf for driven piles (2-8) f s = (1.5) (0.025) (10) 1.5Dr^4 tsf for bored or jacked piles (2-9) The relative density can be represented as a function of the effective overburden pressure (q v ) and the soil s strength parameters. Figure 2-2 shows the relationship between the relative density, the effective overburden pressure, and the standard penetration test (SPT) blow counts (N). This is the figure NCDOT uses along with the Equations 2-8 and 2-9 to compute the unit skin resistance. NCDOT limits the maximum f s to 1 tsf and the minimum to tsf. Total skin resistance is simply the summation of the unit skin resistance multiplied by the surface area of the pile from all of the soil layers. The unit toe resistance is represented by the following equation. q t = c N c + q v N q (2-10) in which, c represents the strength intercept (cohesion) of the assumed straight line Mohr envelope and q v, the effective vertical stress in the ground at the depth of consideration. 17
34 Effective Overburden Pressure, qv (ksf) Standard Penetration Resistance, N Dr=20% Dr=30% Dr=40% Dr=50% Dr=60% Dr=70% Dr=80% Dr=90% 9 10 Figure 2-2. Relationship between Standard Penetration Resistance, Relative Density, and Effective Overburden Pressure (Schultze, 1965) N c and N q are dimensionless bearing capacity factors, related to each other by the equation. N c = (N q 1) cot φ (2-11) where φ is the soil s angle of frictional resistance. Vesic confirmed that the toe resistance is governed not by the vertical effective stress (q v ) but by the mean normal ground stress (σ o ), which is related to q v by the following expression. σ o = [(1 + 2 K o ) / 3] q v (2-12) 18
35 in which, K o represents the coefficient of at-rest lateral earth pressure. Thus, Equation 2-10 can be revised to the following form. q t = c N c + σ o N σ (2-13) in which, N σ is a bearing capacity factor and is a function of the soil s angle of frictional resistance and the rigidity index (I r ). The rigidity index can be determined by the mean normal ground stress and the soil s relative density using Figure 2-3. The bearing capacity factors (N c and N σ ) can be obtained from Table 2-1 for ranges of φ and I r values. 250 Rigidity Index (Ir) Dr=90% Dr=80% Dr=50% Dr=20% Mean Normal Ground Stress (tsf) Figure 2-3. Relationship between Mean Normal Ground Stress, Relative Density, and Rigidity Index (Schultze, 1965) NCDOT uses SPT blow counts (N values) as the standard in-situ test data to obtain the soil s strength parameters, the cohesion (c) and the angle of frictional resistance (φ). The N values collected from the field tests are converted to N (corrected blow counts) to account for the effects of the overburden pressure at the depth of each layer using the following equation. 19
36 Table 2-1. Bearing Capacity Factors (N c and N σ ) for the Vesic Method (Vesic, 1977) I r φ (deg) 26 Nc Nσ
37 N = 0.77 log (20 / q v ) N (2-14) in which q v is the effective overburden pressure in tsf. N is bounded by two times N, regardless of q v. When, as is usually the case, there is no laboratory test data available for the angle of frictional resistance, φ is estimated using N in the equation. φ = 0.3 (N + 90) degrees (2-15) The N value used in Equation 2-14 is the average N value for each layer. When jetting or predrilling is used to install the piles to a required depth, the soil is severely disturbed and loses its strengths considerably. To account for the effect of jetting or predrilling, the N value of unity was used in this study regardless of the original SPT blow counts for the soil layers where jetting or predrilling was used. It is important to note that the toe resistance is influenced by the soil within a certain distance from the toe. This influence zone depends on several factors including the pile type, the soil type near the toe and the capacity prediction model. Photos in the Vesic s paper (1977) show the displacements of the soil near the pile toe, which indicate the toe influence zone; however, the exact extent of the influence zone for the Vesic method is not available in the literature. Based on the comparison of the measured toe capacities from the PDA/CAPWAP data and the predicted toe capacities by the Vesic method, the influence zone is selected in this study to be 3D above the toe to 3D below the toe, where D is the pile diameter or width. When a steel pipe pile or HP pile is driven into soils, especially into a clay soil, the effects of soil plugging must be considered. However, it is very difficult to quantify the amount of plugging without a load test. Also it should be noted that the movement required to mobilize the toe resistance is several times greater than that required to mobilize the skin resistance. Therefore, the toe 21
38 resistance contribution to the ultimate pile capacity of a steel pipe pile or HP pile is usually very small. For piles in a soft to medium stiff clay, a total stress analysis is more appropriate due to the fact that the soil is in an undrained condition with excess pore water pressure developed by the pile driving. In this case, the skin resistance is independent of effective overburden pressure, and Vesic proposed Equation 2-16 to estimate the unit skin resistance. f s = α S u (2-16) This is identical to the α-method equation proposed by others including Tomlinson, in which α is an empirical adhesion factor. However, the adhesion factors proposed by Vesic, which vary from 0.2 to 1.5 for different pile types and soil conditions, are different from those proposed by others. The experience within NCDOT has found that the Vesic s adhesion factors do not predict the skin resistance adequately for clay soils in North Carolina. Instead of using the adhesion factors proposed by Vesic, NCDOT has a provision in the Vesic method that uses the adhesion factors shown in Table 2-2 to predict the skin resistance in a soft to medium stiff clay layer. NCDOT adopted these α values from the research results by Tomlinson (1980). S u is the undrained shear strength of the soil and can be estimated from SPT N values as shown in Equation Table 2-2. Coefficient of Adhesion for Clay Soils (NCDOT, 1995; after Tomlinson, 1980) Value of S u (psf) α for Non-Displace Piles α for Displacement Piles 0 S u <S u <S u <S u
39 S u = 100 N psf (2-17) Here, N cannot be greater than 20, and the values of α decrease with increasing undrained shear strength as shown in Table 2-2. The unit toe resistance for clay soil in a total stress analysis is expressed as: q t = S u N c (2-18) in which, N c is usually taken as 9. Many researchers including Vesic (1977) found that the behavior of piles in stiff clay is frictional in nature and fundamentally similar to that of piles in dense sand. In the NCDOT s practice, a clay soil with the SPT N value over 20 is usually treated as a granular soil for bearing capacity analysis. 2.5 THE NORDLUND METHOD Nordlund (1963) presented his method for computing ultimate bearing capacity of a pile and the results of the field test programs, in which several pile types including timber, steel HP, closed-end pipe, monotubes, and Raymond step taper piles were used. The Nordlund method (1963, 1979) is a semi-empirical model based on the field load tests in cohesionless soils and considers the shape of pile taper and the soil displacement in calculating skin resistance. Blue-Six Software, Inc. coded the computer program DRIVEN in 1997 under a contract with FHWA, which follows the methods and equations of Nordlund (1963, 1979), Thurman (1964), Meyerhof (1976), and Tomlinson (1980). DRIVEN Version 1.1 was used in this study to predict the pile bearing capacity by the Nordlund method. The program has a provision to use the Tomlinson (1980) method for a total stress analysis, and this method is applied to the sections of piles embedded in a soft to medium stiff clay layer with the average N value not more than 20. Nordlund proposed the following equation for calculating total skin resistance. 23
40 d L Q s = = = d 0 K δ C F P d sin(δ+ω) sec(ω) C d d (2-19) in which, d: depth L: embedded pile length K δ : coefficient of lateral earth pressure C F : correction factor for K δ when δ φ P d : effective overburden pressure at depth d δ: friction angle between pile and soil ω: angle of pile taper from vertical φ: soil friction angle C d : pile perimeter at depth d d: length of pile segment For a pile with a uniform cross section (ω = 0), the equation simplifies as follows. d L Q s = = = d 0 K δ C F P d sin(δ) C d d (2-20) The soil friction angle φ influences most the bearing capacity in the Nordlund method. In the absence of laboratory test data, φ is estimated from corrected SPT blow counts (N ) in a similar way as in the Vesic method. The estimated φ values from the Nordlund method are very much identical to those from the Vesic method, except that the Nordlund method gives slightly lower values than the Vesic method for N over 35. The ratio δ/φ depends on the amount of soil displaced by pile driving and the pile type. It increases as the displaced soil volume increases, but it is always less than one for timber piles, precast concrete piles, steel HP piles, and closed-end and open-end steel pipe piles. 24
41 The coefficient of lateral earth pressure (K δ ) is determined for a given φ value, the displaced soil volume, and the pile taper angle. When δ and φ are different, a correction factor (C F ) needs to be applied to K δ. The Nordlund method computes total toe resistance in the following manner. Q t = α N q A t q t (2-21) in which, α: dimensionless factor dependent on φ and pile embedment depth over width ratio N q : bearing capacity factor, which is a function of φ q t : effective overburden pressure at pile toe A t : pile cross sectional area at toe Both α and N q are determined for φ at the pile toe, which can be estimated from the corrected SPT values (N ). As mentioned in the Vesic method, the N value is selected as the average value within the toe influence zone. Hannigan et al. (1996) recommended the toe influence zone for the Nordlund method as from pile toe to 3-pile width/diameter (D) below the pile toe. However, the influence of the soil above the pile toe on the toe capacity must also be considered as in the cases of the Vesic method and the Meyerhof method. A personal conversation with several researchers also informed that the toe influence zone of 2D to 3D above the pile toe to 2D to 3D below the pile toe was used in their research. For these reasons and to be consistent with the Vesic method, the toe influence zone for the Nordlund method is selected as from 3D above the toe to 3D below the toe. If DRIVEN computes a pile toe resistance exceeding the limiting value suggested by Meyerhof (1976), then the program gives the limiting value as the output value. Figure 2-4 shows the Meyerhof s limiting unit toe resistance for a range of φ 25
42 values. Also, the program has an option to account for the soil plugging effects. An example output of DRIVEN is included in Appendix A. 2.6 THE MEYERHOF METHOD Meyerhof (1976) made empirical correlations between SPT results and static pile load tests performed in a variety of cohesionless soil deposits. He reported that unit skin resistance, f s, of driven displacement piles such as precast concrete piles and closed-end steel pipe piles is: f s = 0.02 N tsf 1 tsf (2-22) Unit skin resistance of driven non-displacement piles such as steel HP piles is: f s = 0.01 N tsf 1 tsf (2-23) N is the corrected N value using Equation Total skin resistance is f s multiplied by the total pile skin surface area. Soil plugging needs to be considered in the skin surface calculation for non-displacement piles. Unit toe resistance, q t, is computed in the following equations. q t = 0.4 N t (L/D) 4 N t tsf for sand and gravel (2-24) q t = 0.3 N t (L/D) 3 N t tsf for non-plastic silts (2-25) in which, L is the pile embedment depth to the toe and D is the pile diameter or width. N t is the average corrected SPT blow count within the toe influence zone. Meyerhof (1976) suggested the toe influence zone to be from 4D above the toe to 1D below the toe, which is used in this study for the Meyerhof method. In this study, the above procedures of computing the bearing capacity by the Meyerhof method have been coded in a spreadsheet format using the computer program Excel to accelerate the calculation process. As in the case of the other two methods 26
43 described above, the spreadsheet includes the Tomlinson (1980) method to compute the bearing capacity of the sections of a pile in a soft to medium stiff clay layer with the average N value not more than 20. The computed unit toe resistance is limited to the maximum value for the soil friction angle as shown in Figure 2-4, in the same way as in the Nordlund method. To estimate the limiting unit toe resistance, the corrected N value from the toe influence zone (N t ) is converted to the friction angle φ using Equation An example spreadsheet for the Meyerhof method is included in Appendix A Limiting Unit Toe Resistance (tsf) Angle of Internal Frcition (degree) Figure 2-4. Relationship between Maximum Unit Toe Resistance and Friction Angle (Meyerhof, 1976) 27

44 CHAPTER 3. PILE LOAD TEST DATA 3.1 GENERAL DESCRIPTION OF NORTH CAROLINA GEOLOGY North Carolina is divided into three distinct geologic regions: mountain, piedmont and coastal. Soil types are quite distinctive between these regions, and it is logical to compile and evaluate the pile load test data separately for each geologic region. A North Carolina geologic map and a brief description of the general geology in each region are presented below (NCGS, 1988). Figure 3-1. North Carolina Geologic Map (NCGS, 1985) Coastal Region This region is characterized by low relief and large formations of shallow sea depositional units of sand, sandstone, silty/sandy clay and clay. The southeast coastal margin has a few units of limestones and indurated shell deposits, and there are several areas of phosphate deposition. Along the coastal margin, sounds and tidewaters may 28
45 contain high organic levels. The extreme east and northeast parts of the region contain large swamps, sounds and estuary areas, which have deposited surficial unconsolidated sands, silts, clays, peat and muck. The vertical soil profile in this region is generally mixed soils with more granular soil deposits than fine grained soils. Four distinct geologic sub-formations within this region are Black Creek, Peedee, Yorktown, and Undifferentiated formations. The Black Creek Formation consists typically of sands and clays that vary abruptly with sand predominating in some places and clay in others. Soils in this formation were laid down either in shallow sea water as in bays or estuaries or in deeper marine waters. The Peedee Formation crops out in a belt east of the Black Creek formation with a width ranging from 3 to 25 miles. The thickness of this formation varies from 220 to 700 feet in Craven and Dare counties and to 900 feet near Wilmington. The Peedee was laid down in shallow open marine waters and consists of sands and impure limestone. Dark marine clay layers are found amongst the sand deposits. The Yorktown Formation was deposited in the Miocene age and is exposed over most of the western half of the coastal region north of the Neuse River. The formation was laid down in shallow marine waters with its typical thickness of 200 feet. It consists of clay, sand and shell marl. A blue clay that varies from arenaceous to calcareous is the dominant feature in this formation. The clay contains lenses of sand and shell marl. The Undifferentiated Formation encompasses all sediments in the coastal region younger than the Miocene age. The deposits consist of fine to coarse sand, silty sand, sandy silt and interbedded clay. The deposits are usually less than 30 feet thick, but some deposits are much thicker. 29
46 3.1.2 Piedmont Region This region encompasses rock types from plutonic granite intrusions and gneisses to high metamorphic grade slates, mudstones and volcanic rocks. Outcrops are most common in stream bottoms and on the steeper slopes, and conversely deep weathering is most common on the uplands. In many locales, the thickness of weathered material can vary greatly over a few tens of feet. Some rock types such as argillite in the Carolina Slate belt are not deeply weathered, which results in shallow soil and saprolite layers. This central region is also defined by the Durham Triassic basins. Soils in this region are deeply weathered into sandy silts, silty clays and clays. The vertical soil profile in this region is generally mixed soils with more fine-grained soils than granular soils Mountain Region The vast majority of rock cuts in North Carolina are in this region and involves rock types consisting of gneisses, schists and metamorphosed sand, silt and mudstones. Discontinuity orientations are rarely orthogonal or predictable because of the tectonic history. Faster erosion rates limit deep weathering of the rock. Residual soils are generally silty sands and clays are very limited, usually forming along narrow alluvial floodplains. Many rocks weather into saprolite, which is usually a 20 to 100 SPT blow count soil material and retains its rock structure. This allows it to fail in planar fashion like rock or in a circular fashion like a soil, or a combination of both. A distinct feature of this region are colluvium deposits, which are usually wet deposits of landslide obviously jumbled into a mass of unconsolidated material consisting of everything from sand to car-sized rock blocks. Few pile load tests have been done by NCDOT in this 30
47 region due to the fact that piles are usually driven into shallow depths of dense soil or rock layers without a significant concern of the bearing capacity. 3.2 PILE DRIVING ANALYZER (PDA) DATA NCDOT has performed many pile driving analyzer (PDA) tests over the past 16 years to measure the actual performance of pile driving. PDA is a computerized system that applies Case Method (Goble, et al., 1975) equations on measured pile dynamic data in order to determine, among other quantities, the pile s ultimate bearing capacity. The wave propagation data are received from piezoelectric accelerometers and strain transducers attached near the top of the pile. The most useful and convenient quantities for measurement are force and acceleration at the pile top. Forces are measured from the strain transducers. As the transducer is deformed by the passing stress wave, signals proportional to the strain magnitude are generated. Acceleration measurements can be made using any of a number of commercially available accelerometers modified to be attached to the pile. The results of the measurement activity are matching records of force and velocity along the pile in the ground. These two quantities are particularly useful in the application of one-dimensional wave mechanics to the analysis of pile driving. In addition, since force and velocity are known to be proportional as long as wave propagation is in one direction only, a check of this proportionality provides a verification of the correctness of the two independent measurements. When a pile is driven into the soil, the soil is greatly disturbed. As the soil surrounding the pile recovers from the driving disturbance, a time dependent change in pile capacity often occurs. The pile capacity may increase with time due to soil setup 31
48 effects or decrease due to soil relaxation. Therefore, actual pile capacity should be measured a sufficient time after pile driving to account for soil setup or relaxation effects. For this reason, PDA tests are often performed with restrike of the piles that have already been installed. However, this is not always the case due to the practical restrictions of construction schedule or cost considerations. All of the NCDOT bridge construction projects in which a PDA test was performed were reviewed. One hundred and forty (140) PDA/CAPWAP cases were found to be usable in this study. The summary of PDA/CAPWAP data is included in Appendix B. One hundred twenty nine (129) of the case studies are from the coastal area and the remaining eleven (11) are from the piedmont area. There are no PDA data available for the mountain area, and therefore the mountain area is not considered in this study. The majority of the PDA were performed on prestressed concrete square piles in the coastal area. The sizes of the concrete piles ranged from 12 square to 30 square. Details of the data for each region and pile type are described in the following sections of this chapter Case Pile Wave Analysis Program (CAPWAP) The PDA data are further evaluated by the rigorous numerical analysis program CAPWAP (Hannigan, 1990) to determine static bearing capacity, and to distinguish between the toe resistance and the distribution of the skin resistance along the pile. In the analysis of pile driving, there are three unknowns: pile forces, pile motion and boundary conditions. If two of the three are known, the third can be calculated. It is not possible to determine the soil response from the measured force and velocity records. However, it is possible to analyze a pile under the action of either the force or the velocity record, with 32
49 an assumed soil model. The other unused record is then plotted and compared against an equivalent computed plot. Differences between the measured and the computed curves lead an experienced engineer to conclusions regarding the differences between the actual soil behavior and the assumed set of soil parameters. He may then modify these parameters to obtain a better match in a second iteration. CAPWAP was written to facilitate this type of analysis. Soil reaction forces can be accurately expressed as a function of pile motion only. It is generally assumed that the soil reaction consists of an elasto-plastic component, and a linear viscous component. In this way, the soil model has at each point three unknowns: the ultimate static resistance, the quake or elastic soil deformation, and a damping constant. An error minimization procedure is used to assess the differences between the measured and computed curves, and quantify the sum of these differences with the so-called Match Quality Number (MQN). MQN = SUM ( ABS (f jc f jm ) / Fi ) where, f jc and f jm are the computed and the measured pile top variables at time step j, respectively. SUM stands for a summation over a time period and Fi is the pile top force at the time of the maximum pile top velocity. Reducing the MQN to a minimum value subject to several constraints will result in a unique solution Coastal Area Concrete Square Piles There are 85 end-of-driving (EOD) and 26 beginning-of-restrike (BOR) PDA data available under this category from 32 different project sites. The summary of EOD and BOR data is shown in Table 3-1 and Table 3-2, respectively. Twenty of the PDA tests have both EOD and BOR data for the same pile, and they are marked by an asterisk (*) after the File Number in Tables 3-1 and 3-2. The size of pile ranges from 12 to 30 33
50 Table 3-1. PDA EOD Coastal Concrete Square Piles File Design Load Pile Width SPT N PDA Total PDA Skin PDA Toe Number (Ton) (inch) at Toe (Ton) (Ton) (Ton) 85* * C* * * * B B* * A* * * A* * * B A* *
51 Table 3-1. PDA EOD Coastal Concrete Square Piles (Continued) File Design Load Pile Width SPT N PDA Total PDA Skin PDA Toe Number (Ton) (inch) at Toe (Ton) (Ton) (Ton) * * * * A B
52 Table 3-2. PDA BOR Coastal Concrete Square Piles File Design Load Pile Width SPT N PDA Total PDA Skin PDA Toe Number (Ton) (inch) at Toe (Ton) (Ton) (Ton) 85* * C* * * * * A* * * A* * * * A* * * * * * square, and the embedded pile lengths range from 11 feet to 125 feet. This results in a pile length over width ratio (L/D) from 6.6 to 61. The SPT blow count (N) at the pile toe varies from 4 to 100. The toe blow count may affect the pile capacity evaluation significantly because mobilization of the toe resistance is greatly influenced by the stiffness of the soil near the pile toe. The effect of N value at the pile toe, on both the 36
53 measured and predicted pile capacities, was investigated in this study. Accordingly, the PDA data were sub-grouped for N less than or equal to 40 and for N greater than 40. The comparison of the pile capacities from the 20 EOD and BOR data indicates a significant increase in the capacity with time (setup) as shown in Table 3-3. The setup effects were further evaluated by regression analyses as shown in Figures 3-2, 3-3 and 3-4 for the total, skin, and toe capacities, respectively. The setup effect on the skin File No. Design Load (Ton) Pile Width (inch) Table 3-3. Coastal Concrete Square Piles PDA BOR / PDA EOD (Set-Up) BOR (Ton) PDA Total PDA Skin PDA Toe EOD BOR/ BOR EOD BOR/ BOR EOD (Ton) EOD (Ton) (Ton) EOD (Ton) (Ton) BOR/ EOD 1* A* C* * * * * * A* * * * * * * * * * * A* Mean 1.79 Mean 2.73 Mean 1.46 STD 0.81 STD 1.90 STD 1.17 COV 0.45 COV 0.70 COV
54 resistance is more significant than that on the toe resistance. This is probably due to the fact that a larger soil displacement was needed to mobilize the toe resistance, and the hammer impact energy was not sufficient to activate full toe resistance during the restrike y PDA-BOR Capacity (Ton) Total y = x R 2 = R: correlation coefficient PDA-EOD Capacity (Ton) x Figure 3-2. Coastal Concrete Square Piles Setup Effect (Total Capacity) 38
55 1000 y PDA-BOR Capacity (Ton) y = x R 2 = Skin R: correlation coefficient PDA-EOD Capacity (Ton) x Figure 3-3. Coastal Concrete Square Piles Setup Effect (Skin Capacity) 500 y PDA-BOR Capacity (Ton) Toe y = x R 2 = PDA-EOD Capacity (Ton) R: correlation coefficient x Figure 3-4. Coastal Concrete Square Piles Setup Effect (Toe Capacity) 39
56 3.2.3 Jetting Effects Piles are sometimes jetted to a prescribed depth in order to attain the pile penetration depths required for lateral stability of the structure. The use of jetting results in a severe soil disturbance, and its effect on both the measured and predicted pile capacities should be considered. However, there is no rational means to quantify the percentage of pile capacity reduction due to jetting, other than a pile load test. For this reason, the PDA data were sub-grouped for the piles driven with jetting and those without jetting in order to consider the jetting effects on the ratio of the measured capacity over the predicted capacity. In the pile capacity prediction using the static analysis methods, the SPT N value of unity (1) was assumed for the soil layers where pile penetration was performed with jetting. Actual SPT blow count of the soil disturbed by jetting may be more than one. But it would not be much larger than one, because piles usually penetrate into the disturbed ground by their own weights when jetting is used. This assumption is justified for the Vesic method, in which a minimum unit skin resistance of ton per square foot (tsf) is used regardless of the SPT blow counts or the relative density of the soil. This assumption is also justified for the Nordlund method because the low range N- values (say, less than 5) would make little difference in the correlation of the N-values with the soil friction angle (φ). This assumption may underpredict the pile skin capacity to some degree in the Meyerhof method; however, it will be accounted for in the bias factor evaluation and in the process of the resistance factor calibration. Of the 85 EOD PDA data, 50 piles were initially installed with jetting, and 15 piles, out of the 26 PDA restrike data, were initially installed with jetting. 40
57 3.2.4 Coastal Area Steel HP Piles Seventeen PDA EOD and only three restrike (BOR) PDA data are available for this category, and they are summarized in Tables 3-4 and 3-5. Two of the data files marked by an asterisk (*) in Tables 3-4 and 3-5 have both EOD and BOR data for the same pile. Most of the HP piles in this category are HP 12X53, and the other four are HP 14X73 piles. The embedded length of these HP piles ranges from 19 feet to 76 feet. The SPT blow count (N) at the pile toe varies from 12 to 100. As in the case of the coastal area concrete square piles, the effect of N value at the pile toe, on both measured and predicted pile capacities, was investigated in this study, and the PDA data were subgrouped for N less than or equal to 40 and for N more than 40. Table 3-4. PDA EOD Coastal Steel HP Piles File Design Load Pile Type SPT N PDA Total PDA Skin PDA Toe Number (Ton) & Size at Toe (Ton) (Ton) (Ton) 10* 40 HP 12 X * 45 HP 12 X HP 12 X HP 14 X HP 12 X HP 12 X HP 12 X HP 12 X HP 12 X HP 12 X HP 14 X HP 14 X HP 14 X HP 12 X HP 12 X HP 12 X HP 12 X
58 Table 3-5. PDA BOR Coastal Steel HP Piles File Design Load Pile Type SPT N PDA Total PDA Skin PDA Toe Number (Ton) & Size at Toe (Ton) (Ton) (Ton) 10* 40 HP 12 X * 45 HP 12 X HP 12 X Coastal Area Steel Pipe Piles Seven PDA EOD and 15 BOR data are available for this category. The pile restrike was performed about 24 hours after the end of initial driving for the most BOR data. All but one of these piles were driven as open-ended. All of the piles had a 24 outside diameter, except one that was a 18 diameter pile. The 24 and 18 pipe piles had a wall thickness of and 0.5 inches, respectively. The summary of EOD and BOR data is shown in Table 3-6 and Table 3-7, respectively. The PDA EOD data files that also have BOR data are marked by an asterisk (*) in Tables 3-6 and 3-7. All but two of the test piles were driven at the same project site with the pile embedment lengths of 52 feet to 78 feet. The SPT blow count (N) at the pile toe varies from 12 to 65, and all but two are less than 40. Table 3-6. PDA EOD Coastal Steel Pipe Piles File Design Load Pile Diameter SPT N PDA Total PDA Skin PDA Toe Number (Ton) & End Type at Toe (Ton) (Ton) (Ton) 125* Open Ended * Open Ended Open Ended * Open Ended * Open Ended Close Ended * Open Ended
59 Table 3-7. PDA BOR Coastal Steel Pipe Piles File Design Load Pile Diameter SPT N PDA Total PDA Skin PDA Toe Number (Ton) & End Type at Toe (Ton) (Ton) (Ton) 125* Open Ended * Open Ended Open Ended Open Ended Open Ended * Open Ended * Open Ended Open Ended Open Ended Open Ended * Open Ended Open Ended Open Ended Open Ended Open Ended Coastal Area Concrete Cylinder Piles There are only three PDA/CAPWAP data cases available for this category, which is not sufficient for a statistical evaluation of the pile capacity predictions and the resistance factor calibration. However, five static load test data are available for the same category, which may be combined with the PDA/CAPWAP data for calibration of the resistance factors. Table 3-8 shows the three PDA data cases: two 54 diameter cylinder piles with the wall thickness of 5 inches, and a 66 diameter cylinder pile with 6 inch thick wall. The 54 diameter piles were driven 75 and 87 feet into the ground, and the 66 one was embedded 105 feet. 43
60 Table 3-8. PDA EOD Coastal Concrete Cylinder Piles File Design Load Pile Diameter SPT N PDA Total PDA Skin PDA Toe Number (Ton) (inch) at Toe (Ton) (Ton) (Ton) Piedmont Area Concrete Square Piles Six PDA EOD data are available for this category as shown in Table 3-9. There is no PDA restrike data for this category. The size of pile ranges from 12 to 20 square, and the embedded pile lengths are from 12 feet to 45 feet. This results in the pile length over width ratio (L/D) of 7.2 to 45. The SPT blow count (N) at the pile toe varies from 16 to 34. The pile sizes, lengths, and the site soil profiles for this category are relatively uniform. Table 3-9. PDA EOD Piedmont Concrete Square Piles File Design Load Pile Width SPT N PDA Total PDA Skin PDA Toe Number (Ton) (inch) at Toe (Ton) (Ton) (Ton) Piedmont Area Steel HP Piles Five PDA EOD data, with no restrike, are available for this category as shown in Table All of them are HP 12X53 piles with the embedded length ranging from 25 44
61 to 68 feet. The SPT blow count (N) at the pile toe varies from 13 to 100. It should be noted that the database size is not large enough to represent the actual variation of the measured or predicted pile capacities. Table PDA EOD Piedmont Steel HP Piles File Design Load Pile Type SPT N PDA Total PDA Skin PDA Toe Number (Ton) & Size at Toe (Ton) (Ton) (Ton) HP 12 X HP 12 X A 40 HP 12 X B 40 HP 12 X HP 12 X STATIC LOAD TEST DATA NCDOT has performed static load tests on driven piles in selected bridge construction projects to verify the pile s bearing capacity. Due to its high cost, this type of test is warranted only for large bridge projects, in which pile foundations are subjected to unusually high loads or when the pile foundation cost is significant. In this study, 35 static load test data were synthesized from the NCDOT project files. The data set are summarized in Table Thirty-one of the load test piles were driven in the coastal region, and only four static load test data are from the piles driven in the piedmont region that are three steel HP piles and a prestressed concrete pile. Twenty-two of the coastal region test piles are prestressed concrete piles, whose width ranges from 12 inches to 30 inches. Also, five concrete cylinder piles, two steel HP piles, a steel pipe pile with tip, and a timber pile are included in the coastal region data. All of the static load tests were 45
62 performed in accordance with ASTM D1143 Piles Under Static Axial Compressive Load using the quick load test method. Table Static Pile Load Test Data Static File No. PDA File No. Project Name Region + County Pile Type ++ Pile Length (ft) Design Load (ton) Failure Load (ton) # Vesic Ult (ton) Nordlund Meyerhof Ult (ton) Ult (ton) S1 116 NCSU P Wake 12" CSP S2 4A B-1098 C Carteret 24" CSP S3 4C B-1098 C Carteret 20" CSP S4 26 B-2060 C Onslow 54" CCP S5 B-1098 C Carteret 24" CSP S6 1 B-900 C Martin 20" CSP S7 107A B-2023 C Dare 20" CSP S8 B-2531A C Craven 20" CSP S9 B-2023 C Dare 20" CSP S10 B-2023 C Dare 20" CSP S11 B-2023 C Dare 20" CSP S12 B-646 C Chowan 20" CSP S13 B-646 C Chowan 24" CSP S14 B-646 C Chowan 24" CSP S15 B-646 C Chowan 24" CSP S16 B-646 C Chowan 24" CSP S17 19 B-1310 C Onslow 24" CSP S18 B-626 C Brunswick 20" CSP S19 42 M-103 C Craven 24" SPP S20 R-2551 C Dare 54" CCP S21 R-538 C Bladen HP 14x S22 B-627 C Brunswick 20" CSP S23 B-41 C Carteret 54" CCP
63 Table Static Pile Load Test Data (Continued) Static File No. PDA File No. Project Name Region + County Pile Type ++ Pile Length (ft) Design Load (ton) Failure Load (ton) # Vesic Ult (ton) Nordlund Meyerhof Ult (ton) Ult (ton) S P Wake HP 12x S P Wake HP 12x S C Duplin Timber S27 R-2551 C Dare 30" CSP S28 B-824 C Tyrrell 20" CSP S X-3BA C Sampson HP 12x S30 85 R-2551 C Dare 30" CSP S31 41 I-900AA P Forsyth HP 12x S B-2500 C Dare 66" CCP S33 91 R-2512A C Chowan 20" CSP S34 89 R-2512A C Chowan 30" CSP S35 R-2512A C Chowan 66" CCP P: piedmont region C: coastal region ++ CSP: concrete square pile CCP: concrete cylinder pile SPP: steel pipe pile # Failure Load: Davisson Failure Criteria Test Method: ASTM Quick Load Test The failure load for each static load test pile was determined by the Davisson Method (1972). The Davisson failure load is defined as the load corresponding to the pile s axial displacement that exceeds the elastic compression of the pile by 0.15 inches plus the pile diameter or width in inches divided by 120. During the load test, relative displacement of the pile was measured and recorded with each successive load increment until the pile failed or the practical limit of the loading system was reached. The failure load was then determined by using the following procedure: A graph is constructed with 47
64 the movement of the pile in inches on the x-axis and the load in tons on the y-axis. The elastic compression line is drawn as a straight line for a linear equation P = A*E*δ/L, in which P is the load applied on the pile, A is the cross-sectional area of the pile, E is the pile s modulus of elasticity, δ is the axial compression of the pile, and L is the length of the pile. A line is drawn parallel to the elastic compression line at an offset of D/120, where D is the pile diameter or width in inches. The movements corresponding to the loads recorded from the load test are then plotted on the graph, and the data points are connected with a smooth line. The intersection of the offset line with the load-movement curve is defined as the failure load as shown in Figure 3-5. Failure Load Load (Tons) x x = D/120 P = AEδ / L Movement (inches) Figure 3-5. Davisson's Failure Criteria (Davisson, 1972) 48
65 The pile type and properties, soil profiles and the load test data for each load test pile were reviewed for the purpose of extracting information to be used in the reliability analysis. The soils at each test site were characterized based on the available geotechnical reports. Static analysis of the bearing capacity for each test pile was performed using the three methods (Vesic, Nordlund, and Meyerhof) presented in Chapter 2. The predicted static pile capacities were then compared with the load test results, and a bias factor, which is the ratio of the measured capacity over the predicted capacity, was computed for each data case. A Bayesian updating technique was utilized to improve the statistics of the bias factors, where appropriate. The statistical parameters of the bias factors were incorporated in the calibration of the resistance factors. Details of the bias factors and the Bayesian updating will be presented in the following chapter. 49
66 CHAPTER 4. RELIABILITY ANALYSIS 4.1 INTRODUCTION The first step in evaluating the reliability or probability of failure of a pile foundation is to decide on specific performance criteria in terms of a limit state function and the relevant load and resistance parameters. Assume that there are two basic random variables, the load (Q) and the resistance (R). The limit state function can be defined as g(r, Q) = 0, which can be a linear or nonlinear function of R and Q. Failure occurs when g(r, Q) < 0 and the probability of failure, P f, is expressed by the integral (Haldar, et al., 2000) P f = g<0 f drdq (4-1) R, Q ( r, q) in which, f R,Q (r,q) is the joint probability density function for the basic random variables R and Q, and the integration is performed over the failure region, that is, g < 0. If the random variables are statistically independent, then the joint probability density function may be replaced by the product of the individual probability density functions (PDFs) in the integral. Equation 4-1 is considered to be the basic equation of reliability analysis, and the computation of P f by the integration is called the full distributional approach. In general, the joint probability density function of random variables is practically not possible to obtain, and the PDF of an individual random variable may not always be available in explicit form. Even if this information is available, evaluating the multiple integral is very difficult. Therefore, analytical approximations of this integral are employed to 50
67 simplify the computation of the reliability or the probability of failure. These methods of approximations are First Order Reliability Methods (FORM) and Second Order Reliability Methods (SORM). In this study, two types of FORM - Mean Value First Order Second Moment () method and Advanced First Order Second Moment () method - are used to evaluate the reliability of the current allowable strength design methods for axial capacity of driven piles. In the FORM, the reliability or the probability of failure is expressed in terms of reliability index (β), which can be computed using the statistics of the loads and resistance. 4.2 LOAD STATISTICS This study employed the load statistics and the load factors from the current AASHTO LRFD Specifications (1998) to make the pile foundation design consistent with the bridge superstructure design. The load combination of dead load (QD) and live load (QL) for the Strength Case I (AASHTO, 1998) was chosen for the reliability analysis, because this combination usually becomes the governing design load case for bridge design, and thus it is considered the most conservative for the calibration of the resistance factors. The load factors used in the reliability analysis are 1.25 for dead load and 1.75 for live load. The load statistics are presented in terms of mean and coefficient of variation (COV) of the bias factors. The bias factor is defined as the ratio of the observed actual load over the nominal load. Nowak (1992) presented the results of statistical analysis of highway dead and live loads, as summarized in Table 4-1. The largest variation is the weight of the asphalt wearing surface placed on the bridge deck. 51
68 However, this is a very small percent of the total bridge dead load and can be ignored in the calculation of the mean and COV of the overall bias factor of the dead load. Table 4-1. Statistics of Bridge Load Components (Nowak, 1992) Load Component Bias Factor Mean Bias Factor COV Dead Load Factory Made Cast-In-Place Asphalt Wearing Surface Live Load Thus, according to Withiam, et al (1998), the mean and the coefficient of variation of bias factor for the dead load are: λ QD = 1.03 x 1.05 = 1.08 COV QD = ( ) 0.5 = 0.13 The mean bias factor and COV for the live load are taken as 1.15 and 0.18, respectively. The distribution of the bias factors of both dead and live loads is assumed to be lognormal considering that all of these values are positive. Lognormal distribution of the loads was also assumed by Barker, et al (1991b) in the calibration of the resistance factors for bridge foundations adopted by AASHTO (1994). 4.3 RESISTANCE STATISTICS Bias Factor The resistance statistics were represented in terms of the bias factors. The bias factor is defined as the ratio of the measured pile capacity over the predicted pile capacity. Once the measured pile capacities from the PDA/CAPWAP and the static load 52
69 test data were compiled, as presented in Chapter 3, the predicted pile capacities were evaluated for the same pile type, length, soil condition and the installation methods using the three static analysis methods presented in Chapter 2. The computer program PILECAP (NCDOT, 1995) was used for the Vesic method, the program DRIVEN (Mathias, 1998) was used for the Nordlund method, and an Excel spreadsheet was utilized to speed up the calculation process of the Meyerhof method. The bias factor was computed for each data set, and the statistics of the bias factors were evaluated. An example of the bias factor statistics is shown in Table 4-2. Table 4-2. Bias Factor Statistics for Coastal Steel HP Piles Vesic Method File No. Pile Type Total Skin Toe PDA Vesic λ PDA Vesic λ PDA Vesic λ 10 HP 12 X HP 12 X HP 12 X HP 14 X HP 12 X HP 12 X HP 12 X HP 12 X HP 12 X HP 12 X HP 14 X HP 14 X HP 14 X HP 12 X HP 12 X HP 12 X HP 12 X Mean 1.02 Mean 0.97 Mean 1.60 Stdev Stdev Stdev COV 0.50 COV 0.63 COV
70 In Table 4-2, the bias factor (λ) is the ratio of the PDA (measured capacity from PDA/CAPWAP) over Vesic (predicted capacity by the Vesic method). This bias factor accounts for all of the uncertainties from various sources of errors such as model uncertainty, SPT blow count error, spatial variability of the SPT measurement, load test error, errors in the strength parameter correlations with the SPT blow counts, and so on. There is a basic assumption in this study that the statistics of the bias factors will represent all the sources of errors including SPT testing, pile load tests, and the static pile capacity prediction models. The bias factor statistics were evaluated separately for the total, skin and toe pile capacities from the PDA/CAPWAP data. For the static load test data, the bias factor statistics for total capacity only were calculated because the static load tests do not separate the skin and toe resistance components. The bias factor statistics for all categories of the data for the reliability analysis and the resistance factor calibration are tabulated and included in Appendix C. Summaries of the bias factor statistics for the six categories (coastal concrete square pile, coastal steel HP pile, coastal steel pipe pile, coastal concrete cylinder pile, piedmont concrete square pile, and piedmont steel HP pile) are presented in Tables 4-3 through 4-8. The distribution of the bias factors for each category was examined by the Kolmogorov-Smirnov test (Ang, et al., 1975) using the computer program MATLAB. The lognormal distribution was found to represent the bias factor distributions most closely for all the categories. Accordingly, the lognormal distribution was assumed in the reliability analysis and the resistance factor calibrations. The bias factor statistics are influenced by the size of the data set for each category and the variation in the bias factors. Extremely outlying data points may not be representative of the resistance due to 54
71 the large error in either the measured capacity or the predicted capacity. Therefore, it is reasonable to remove the far-outlying data points from the bias factor statistics. The bias factor values outside the boundaries defined by the mean plus or minus two times the standard deviation were discarded. The statistical parameters were evaluated for every available database corresponding to the study categories. The concrete square piles and the steel HP piles in the coastal region provide data for both the PDA initial driving (EOD) and the PDA restrike (BOR) as well as the static load tests. The coastal steel pipe piles provide data for both the PDA EOD and BOR, but not for static load tests. The coastal concrete cylinder piles and the piedmont steel HP piles provide data for the PDA EOD and the static load tests. The piedmont concrete square piles provide data for the PDA EOD only. It is observed from Table 4-3 for coastal concrete square piles that the Vesic method generally over-predicts the pile capacity except the skin resistance compared to the PDA restrike (BOR) measurements. Also, the Nordlund method over-predicts the skin resistance consistently, and the Meyerhof method generally under-predicts the pile capacity except for cases. Table 4-4 shows that for coastal steel HP piles, all three methods estimate the pile total capacity reasonably close to the measured capacity, but the estimated toe resistances are extremely low compared to the PDA restrike measurements. Table 4-5 shows that for coastal steel pipe piles, all three methods generally under-predict the pile total capacity; especially, the toe resistances predicted by the Meyerhof method are extremely conservative. The high values of λ for the toe capacity, especially the Meyerhof method, suggest that the piles have plugged. 55
72 Table 4-3. Summary of Bias Factor Statistics Coastal Concrete Square Pile Coastal Region Vesic Nordlund Meyerhof Concrete Square Pile λ Mean λ COV λ Mean λ COV λ Mean λ COV Total PDA Skin EOD Toe Total PDA Skin EOD Toe Total Total PDA Skin EOD Toe Total PDA Skin BOR Toe Total PDA Skin BOR Toe Not Enough Data Available for Evaluation Total Total PDA Skin BOR Toe Static Load Test Table 4-4. Summary of Bias Factor Statistics Coastal Steel HP Pile Coastal Region Vesic Nordlund Meyerhof Steel HP Pile λ Mean λ COV λ Mean λ COV λ Mean λ COV Total PDA Skin EOD Toe Total PDA Skin EOD Toe Total Total PDA Skin EOD Toe Total Total PDA Skin BOR Toe
73 Table 4-5. Summary of Bias Factor Statistics Coastal Steel Pipe Pile Coastal Region Vesic Nordlund Meyerhof Steel Pipe Pile λ Mean λ COV λ Mean λ COV λ Mean λ COV Total Total PDA Skin EOD Toe Total Total PDA Skin BOR Toe It is observed from Table 4-6 that for coastal concrete cylinder piles, the Vesic and Nordlund methods over-predict the pile capacity, whereas the Meyerhof method under-predicts it. Also, it is believed that the measured pile capacities from the PDA initial driving were probably lower than the actual ultimate capacities due to the large pile sizes and the high design loads, which required a larger hammer energy than that used for the pile driving to mobilize the full resistances. Table 4-7 shows that for piedmont concrete square piles, all three methods under-predict the pile capacity to some degree. If a pile capacity gain due to set-up effects were considered, under-prediction of the pile capacity would be more significant. Table 4-8 shows that the predicted pile capacity by the three methods is reasonably close to the measured capacity from the PDA initial driving. However, the static load test data show that all three methods under-predict the pile capacity to some degree. Table 4-6. Summary of Bias Factor Statistics Coastal Concrete Cylinder Pile Coastal Region Vesic Nordlund Meyerhof Concrete Cylinder Pile λ Mean λ COV λ Mean λ COV λ Mean λ COV Total Total PDA Skin EOD Toe Static Load Test
74 Table 4-7. Summary of Bias Factor Statistics Piedmont Concrete Square Pile Piedmont Region Vesic Nordlund Meyerhof Concrete Square Pile λ Mean λ COV λ Mean λ COV λ Mean λ COV Total Total PDA Skin EOD Toe Table 4-8. Summary of Bias Factor Statistics Piedmont Steel HP Pile Piedmont Region Vesic Nordlund Meyerhof Steel HP Pile λ Mean λ COV λ Mean λ COV λ Mean λ COV Total Total PDA Skin EOD Toe Static Load Test Bayesian Updating of the Bias Factors The resistance statistics used in the reliability analysis and the calibration of the resistance factors must be based on the measured pile capacities that are ultimate in nature. It is known that the pile bearing capacity measured from the PDA EOD very often does not represent the actual ultimate capacity because the bearing capacity is not fully mobilized at the time of the initial driving of the pile. Many researchers, including Svinkin, et al. (1994), reported that the pile capacity changes with time. This was verified in this study as presented in Figures 3-2 to 3-4. Also, Likins, et al. (1996) reported that the pile capacities from PDA restrike showed an excellent correlation with the static pile load test data. Therefore, PDA restrike data and the static load test data should be used, wherever available, for verification of ultimate pile capacity estimates. 58
75 However, the databases for the PDA restrike (BOR) and the static load tests are not large enough to represent the resistance statistics, except for the coastal region concrete square piles. To supplement the limited sizes of the databases, Bayesian updating was employed using the available pile load test data for each category. To apply Bayesian updating in this study, the bias factor distribution for the PDA EOD data was treated as the prior distribution, and the bias factor distribution for the PDA BOR or static load test data was treated as the likelihood distribution. As mentioned earlier, the resistance statistics were found to follow a lognormal distribution. To facilitate Bayesian updating, the lognormal distributions were converted to normal distributions using a natural logarithmic transformation before conducting the updating. Based on the converted normal distributions of the prior information (PDA EOD data) and the likelihood information (PDA BOR or static load test data), Bayesian updating yields the mean and the variance of the updated (posterior) distribution as the following formula (Ang, et al., 1975). µ p. σ l + µ l. σ p µ u = 2 2 σ + σ σ 2 σ p σ l u = 2 2 σ + σ p p l l 2 (4-2) (4-3) where, µ stands for mean and σ for standard deviation. Subscripts p, l and u stand for prior, likelihood and updated (posterior) estimate, respectively. After the updated mean and variance of the converted normal distributions are obtained, they can be converted back to the mean and variance of the updated statistics of the bias factors using the following transformations: 59
76 µ λ = exp(µ u * σ 2 u ) (4-4) σ 2 λ = µ 2 λ (exp(σ 2 u ) 1) (4-5) The updated statistics of the bias factors for the pile total capacities are summarized in Tables 4-9 through Table 4-9. Bayesian Updating: Coastal Concrete Square Pile, Total Capacity Coastal Region Vesic Nordlund Meyerhof Concrete Square Pile Mean COV Mean COV Mean COV N@Toe<=40 Prior Prior: PDA EOD Likelihood Likelihood: PDA BOR Updated N@Toe>40 Prior Prior: PDA EOD Likelihood Data Not Likelihood: PDA BOR Updated Available PDA Total Prior Prior: PDA EOD Likelihood Likelihood: PDA BOR Updated Table Bayesian Updating: Coastal Steel HP Pile, Total Capacity Coastal Region Vesic Nordlund Meyerhof Steel HP Pile Mean COV Mean COV Mean COV N@Toe<=40 Prior Prior: PDA EOD Likelihood Likelihood: PDA BOR Updated N@Toe>40 Prior Prior: PDA EOD Likelihood Likelihood: PDA BOR Updated PDA Total Prior Prior: PDA EOD Likelihood Likelihood: PDA BOR Updated
77 Table Bayesian Updating: Coastal Steel Pipe Pile, Total Capacity Coastal Region Vesic Nordlund Meyerhof Steel Pipe Pile Mean COV Mean COV Mean COV PDA Total Prior Prior: PDA EOD Likelihood Likelihood: PDA BOR Updated Table Bayesian Updating: Coastal Concrete Cylinder Pile, Total Capacity Coastal Region Vesic Nordlund Meyerhof Concrete Cylinder Pile Mean COV Mean COV Mean COV PDA Total Prior Prior: PDA EOD Likelihood Likelihood: Static Load Test Updated FIRST ORDER SECOND MOMENT (FOSM) ANALYSIS The FOSM analysis is also referred to as the Mean Value First Order Second Moment () analysis in the literature. The analysis derives its name from the fact that it is based on a first-order Taylor series approximation of the limit state function linearized at the mean values of the random variables, and it uses only secondmoment statistics (means and standard deviations) of the random variables. In this study, two random variables, the load (Q) and the resistance (R), are considered and they are assumed to be lognormally distributed. The limit state function in this case is defined as: g (R, Q) = ln (R) ln (Q) = ln (R/Q) (4-6) It is logical to assume that R and Q are mutually independent. Since R and Q are lognormally distributed, ln(r) and ln(q) are normal distribution. Thus, the mean value of g (R, Q) can be expressed as: 61
78 g = ln(r ) - ln(q ) (4-7) 1 where, ln(r ) = ln( R ) - ln(1+cov 2 R ) = ln( R ) - ln(1+cov 2 R ) ln(r ) = ln R 2 1+ COVR (4-8) 1 ln(q ) = ln(q ) - ln(1+cov 2 Q ) = ln(q ) - ln(1+cov 2 Q ) ln(q ) = ln Q 2 1+ COVQ (4-9) From Equations 4-7, 4-8, and 4-9, R g = ln R 2 1+ COVR - ln Q 2 1+ COVQ = ln 1+ COV Q 1+ COV 2 R 2 Q = ln ( Q R 1+ COV 1+ COV 2 Q 2 R ) or, g = ln R Q 1+ COV 1+ COV 2 Q 2 R (4-10) And its standard deviation is: ζ g = 2 σ 2 σ + (4-11) ln( R ) ln( Q) where, σ 2 = ln (1+COV 2 ln(r ) R ) (4-12) σ 2 = ln (1+COV 2 ln(q ) Q ) (4-13) From Equations 4-11, 4-12, and 4-13, 62
79 2 2 ζ g = ln(1 + COV R ) + ln(1 + COV Q ) 2 2 or, ζ g = ln [(1 COV )(1 + )] + R COV Q (4-14) where, R, Q : mean values of the resistance and load COV R, COV Q : coefficients of variation of R and Q By definition, the reliability index (β) is the ratio of g over ζ g (Haldar, et al., 2000), and from Equations 4-10 and 4-14, it can be expressed in the following equation. β = 2 ln ( R / Q) (1 COVQ ) /(1 COV + + ln[(1 + COV 2 R )(1 + COV 2 Q )] 2 R ) (4-15) The mean values of the load and resistance can be expressed in terms of nominal load and resistance and their respective bias factors such that: Q = λ Q Q n and R = λ R R n And Equation (4-15) can be rewritten as: β = 2 ln ( R Rn / QQn ) (1 COVQ ) /(1 COV λ λ + + ln[(1 + COV 2 R )(1 + COV 2 Q )] 2 R ) (4-16) R n and Q n can be expressed in terms of factor of safety (FS) such that R n = FS * Q n. Consider the load combination of dead load (QD) and live load (QL) for AASHTO Strength I Case. Then, λ Q Q n = λ QD QD + λ QL QL and R n = FS (QD + QL). Also, QD and QL are assumed to be mutually independent and COV 2 Q = COV 2 QD + COV 2 QL. Therefore, Equation (4-16) can be rewritten in the following format. 63
80 β = λr FS( QD + QL) ln λqdqd + λqlql ln[(1 + COV (1 + COV 2 R 2 QD )(1 + COV + COV 2 QD 2 QL + COV ) /(1 + COV 2 QL )] 2 R ) (4-17) or, β = λr FS( QD / QL + 1) ln λqdqd / QL + λql ln[(1 + COV (1 + COV 2 R 2 QD )(1 + COV + COV 2 QD 2 QL + COV ) /(1 + COV 2 QL )] 2 R ) (4-18) It is seen from this equation that the reliability index is a function of FS, QD/QL, the load statistics (λ QD, λ QL, COV QD, COV QL ) and the resistance statistics (λ R, COV R ). The ratio of dead load over live load (QD/QL) is a function of bridge span length. Withiam, et al. (1998) tabulated the relationship between QD/QL ratio and bridge span length using Hansell and Viest (1971) s empirical formula. This relationship is adopted for the reliability analysis and the resistance factor calibrations in this study. In the analysis, the limit state function (g) is linearized at the mean values of the random variables rather than at a point on the failure surface. When g is non-linear, as in the case of g = ln (R/Q), a significant error may be introduced by neglecting higher order terms. Also, the reliability index may not be constant for different but mechanically equivalent formulations of the same limit state function. To overcome these deficiencies of the approach, the Advanced First Order Second Moment () analysis is also carried out in this study. 4.5 ADVANCED FIRST ORDER SECOND MOMENT () ANALYSIS The basic concepts and analytical procedures of the methods were developed by Ditlevsen (1974), Ellingwood, et al. (1980), Hasofer and Lind (1974), and 64
81 Rackwitz and Fiessler (1978) to improve the mean value methods. In the analysis, the limit state function is linearized at a point on the failure surface. If the limit state function is linear and if all of the random variables are mutually independent and normally distributed, then the methods give an identical reliability index as the methods. But this may not be true for all other cases. This study employed the iteration algorithm of the Rackwitz and Fiessler s method considering that the random variables in this study follow a lognormal distribution and the limit state function is non-linear. A computer program AdvRel was coded in the MATLAB environment to facilitate the iteration processes. The following is the step-by-step procedure of the analysis written into the computer program to compute the reliability index. Step 1. Define the Limit State Function g in terms of the random variables λ R, λ QD and λ QL. FS * λr *( QD / QL + 1) g = ln( ) λ * QD / QL + λ QD Step 2. Assume an initial value of the Reliability Index β. Any value of β can be assumed. Step 3. Assume the initial values of the design points (dp). The initial design points can be assumed to be at the mean values of the random variables. Step 4. Compute the mean and standard deviation at the design point of the equivalent normal distribution for the random variables that are lognormal. 2 lognormal standard deviation: ξ = ln(1 + COV ) 2 mean: λ = ln( µ ) 0.5* ξ QL 65
82 N equivalent normal standard deviation: σ = ξ dp x * N x mean: µ = dp *(1 ln(dp) + λ) Step 5. Compute the partial derivatives evaluated at the design points. g pder = x x= dp Step 6. Compute the direction cosines α at the design points. α = n i g N * σ x x g * σ x N x 2 x= dp Step 7. Compute the new values for the design points as: dp = µ N x α * β * Repeat the steps 4 through 7 until the direction cosines (α) converge to a specified tolerance value of Step 8. Once α 's converge, the new design points can be expressed in terms of β as the unknown parameter. These new design points must satisfy the limit state function. Substitute the random variables in the limit state function with these new design points and solve g for β. Step 9. Repeat the steps 3 through 8 until β converges to a tolerance value of σ N x 4.6 RELIABILITY ESTIMATE OF THE CURRENT DESIGN PRACTICE Introduction Reliability indices of the NCDOT s current allowable strength design practice on the pile foundation design were evaluated using the two reliability analysis methods 66
83 described above. The reliability analysis was performed on all the compiled databases of the resistance statistics for the six different categories of the pile type and region combinations: (i) coastal area concrete square pile, (ii) coastal area steel HP pile, (iii) coastal area steel pipe pile, (iv) coastal area concrete cylinder pile, (v) piedmont area concrete square pile, and (vi) piedmont area steel HP pile. Also, the three static pile capacity analysis methods (Vesic, Nordlund, Meyerhof) were evaluated for each category. In the NCDOT practice, a minimum factor of safety (FS) of two (2) is used for the design bearing capacity of pile foundations. Therefore, the reliability analysis was performed for FS of 2, 2.5 and 3. The results of the reliability analyses are summarized in Tables 4-13 through 4-18 for the Vesic method, Tables 4-19 through 4-24 for the Nordlund method, and Tables 4-25 through 4-30 for the Meyerhof method The Vesic Method Coastal Concrete Square Piles: Table 4-13 shows the reliability indices computed for the seven different databases available for this category. There are large variations in the reliability indices between the PDA EOD and the PDA BOR and between the skin and toe resistance components. Clearly the PDA restrike (BOR) data show a higher reliability than the PDA initial driving (EOD) data, except for the toe capacities. This can be explained by the fact that the PDA restrike mobilized a larger set-up in the skin resistance, but the toe resistance mobilized during the restrike of the many test piles was less than that mobilized during the initial driving as shown in Table 4-3. Reliability indices from the static load test data are between those from the PDA EOD and those from the PDA BOR as shown in Figure 4-1. As expected, the reliability indices reflect the bias factor 67
84 statistics shown in Table 4-3. On the average, resulted in a higher reliability index than by approximately 14% for the total capacity, 5% for the skin capacity, and 7% for the toe capacity. The reliability indices for the toe capacity are not realistic and should not be considered for the resistance factor calibration. The reliability indices for the total capacity range from 0.3 to 1.6 for FS of 2, 0.3 to 2.4 for FS of 2.5, and 0.7 to 3.1 for FS of 3. Table Summary of Reliability Analyses: Coastal Concrete Square Pile, Vesic Vesic Method Total Skin Toe Coastal Concrete Square Piles FS Reliability Index from Reliability Index from Reliability Index from Reliability Index from Reliability Index from Reliability Index from PDA EOD N@Toe<= PDA EOD N@Toe> PDA EOD All PDA BOR N@Toe<= PDA BOR N@Toe> PDA BOR All Static Load Tests
85 Some of the reliability indices shown in Table 4-13 are negative values. In this study, both the loads and resistance were assumed to be lognormally distributed, and the reliability index was defined in a natural logarithmic form as shown in Equation When the mean bias factor of the resistance statistics (λ R ) is very small and COV R is very large, the computed value inside the braces of natural logarithm in Equation 4-18 can be less than unity; this results in a negative reliability index (β). Since the reliability index cannot be negative theoretically, the negative values of the reliability indices in Table 4-13 simply mean that the reliability is extremely low approaching zero. This explanation is applied to all negative values of the reliability indices shown in Tables 4-16, 4-19, 4-22, and Reliability Index Factor of Safety PDA BOR All PDA BOR All Static Load Test Static Load Test PDA EOD PDA EOD Figure 4-1. Reliability Analysis of Vesic Method for Coastal Concrete Square Pile (Total Capacity) 69
86 Coastal Steel HP Piles: Table 4-14 shows the reliability indices computed for the four different databases available for this category. There is a large increase in the reliability indices between the PDA EOD and the PDA BOR as shown in Figure 4-2. PDA BOR yields a larger increase in the reliability indices for the skin resistance than the toe resistance, probably due to a larger set-up in the skin resistance than in the toe resistance from the PDA restrike. As expected, the reliability indices reflect the bias factor statistics shown in Table 4-4. Also, it is observed that the difference in the computed reliability indices between the N@Toe<=40 database and the N@Toe>40 database is greater for the toe resistance component than for the skin resistance component. On the average, resulted in a higher reliability index than by about 15% for the total capacity, 18% for the skin capacity, and 3% for the toe capacity. The reliability indices for the total capacity range from 0.9 to 3.6 for FS of 2, 1.4 to 4.4 for FS of 2.5, and 1.8 to 5.1 for FS of 3. Table Summary of Reliability Analyses: Coastal Steel HP Pile, Vesic Vesic Method Total Skin Toe Coastal Steel HP Piles FS Reliability Index from Reliability Index from Reliability Index from Reliability Index from Reliability Index from Reliability Index from PDA EOD N@Toe<= PDA EOD N@Toe> PDA EOD All PDA BOR All
87 Reliability Index PDA BOR All PDA BOR All PDA EOD All PDA EOD All Factor of Safety Figure 4-2. Reliability Analysis of Vesic Method for Coastal Steel HP Pile (Total Capacity) Coastal Steel Pipe Piles: Table 4-15 shows the reliability indices computed for the two databases available for this category. There is a large increase in the reliability indices between the PDA EOD and the PDA BOR for the total and skin capacities, which reflects the set-up effects. But the reliability indices for the toe capacity are less for the BOR than for the EOD. This probably implies that the toe capacity was not fully mobilized during the PDA restrikes. On the average, resulted in a higher reliability index than by about 23% for the total capacity, 12% for the skin capacity, and 4% for the toe capacity. The reliability indices for the total capacity range from 1.8 to 4.9 for FS of 2, 2.3 to 6.0 for FS of 2.5, and 2.6 to 6.8 for FS of 3. These relatively high reliability indices reflect the fact that most of the piles for this category were from the same project 71
88 site, thus there are relatively small variations in the bias factor statistics as shown in Table 4-5. Figure 4-3 demonstrates the large increase in reliability indices between PDA EOD and BOR data, as well as the difference between the results of and analyses. Table Summary of Reliability Analyses: Coastal Steel Pipe Pile, Vesic Vesic Method Total Skin Toe Coastal Steel Pipe Piles FS Reliability Index from Reliability Index from Reliability Index from Reliability Index from Reliability Index from Reliability Index from PDA EOD All PDA BOR All Reliability Index PDA BOR All PDA BOR All PDA EOD All PDA EOD Factor of Safety Figure 4-3. Reliability Analysis of Vesic Method for Coastal Steel Pipe Pile (Total Capacity) 72
89 Coastal Concrete Cylinder Piles: Table 4-16 shows the reliability indices computed for the two databases available for this category. The reliability indices for the toe capacity from the PDA EOD database are not realistic, probably because the toe capacities measured from the PDA are not reliable. Also, the PDA database size is not large enough to provide reliable resistance statistics. The very large reliability indices for the skin resistance suggest that the Vesic method for the concrete cylinder pile s skin capacity is very conservative and may need to be revised. Figure 4-4 compares the reliability indices for the total capacity from and analyses of the static load test and PDA EOD data. The static load test data appear to be more reliable than the PDA data. On the average, shows about 7% higher reliability index than for the static load test database. 2.4 Reliability Index Static Load Test Static Load Test PDA EOD All PDA EOD Factor of Safety Figure 4-4. Reliability Analysis of Vesic Method for Coastal Concrete Cylinder Pile (Total Capacity) 73
90 Table Summary of Reliability Analyses: Coastal Concrete Cylinder Pile, Vesic Vesic Method Total Skin Toe Coastal Concrete Cylinder Piles FS Reliability Index from Reliability Index from Reliability Index from Reliability Index from Reliability Index from Reliability Index from PDA EOD All Static Load Tests Piedmont Concrete Square Piles: There is only one database available for this category s reliability analysis as shown in Table The computed reliability indices reflect the bias factor statistics shown in Table 4-7; the reliability indices for the total capacity are much larger than those for the skin and toe capacities. This is probably due to the averaging effects in the total capacity variations by combining the variations of the skin and toe capacities. The difference in the computed reliability indices between and is also much more significant for the total capacity than for the skin or toe capacity. Figure 4-5 shows the comparison of the reliability indices for the total capacity between and analyses. On the average, resulted in a higher reliability index than by 34% for the total capacity, 2% for the skin capacity, and 1% for the toe capacity. 74
91 Table Summary of Reliability Analyses: Piedmont Concrete Square Pile, Vesic Vesic Method Total Skin Toe Piedmont Concrete Square Piles FS Reliability Index from Reliability Index from Reliability Index from Reliability Index from Reliability Index from Reliability Index from PDA EOD All Reliability Index PDA EOD All PDA EOD All Factor of Safety Figure 4-5. Reliability Analysis of Vesic Method for Piedmont Concrete Square Pile (Total Capacity) Piedmont Steel HP Piles: Two databases are available for this category s reliability analysis as shown in Table The computed reliability indices reflect the bias factor statistics shown in Table 4-8. The reliability indices for the skin capacity are much larger than those for the toe capacities because of the much less COV of the skin capacity than COV of the toe capacity. The difference in the computed reliability indices between and 75
92 is also much more significant for the skin capacity than for the toe capacity. On the average, resulted in a higher reliability index than by 30% for the total capacity, 93% for the skin capacity, and 4% for the toe capacity. Figure 4-6 shows that the differences in the reliability indices between and analyses are more significant for the PDA EOD data than for the static load tests data. Table Summary of Reliability Analyses: Piedmont Steel HP Pile, Vesic Vesic Method Total Skin Toe Piedmont Steel HP Piles FS Reliability Index from Reliability Index from Reliability Index from Reliability Index from Reliability Index from Reliability Index from PDA EOD All Static Load Tests Reliability Index PDA EOD All PDA EOD All Static Load Test Static Load Test Factor of Safety Figure 4-6. Reliability Analysis of Vesic Method for Piedmont Steel HP Pile (Total Capacity) 76
93 4.6.3 The Nordlund Method Coastal Concrete Square Piles: Table 4-19 shows the reliability indices computed for the seven different databases available for this category. As for the Vesic method, there are large variations in the reliability indices between the PDA EOD and the PDA BOR and between the skin and toe resistances. As expected, the reliability indices reflect the bias factor statistics Table Summary of Reliability Analyses: Coastal Concrete Square Pile, Nordlund Nordlund Method Total Skin Toe Coastal Concrete Square Piles FS Reliability Index from Reliability Index from Reliability Index from Reliability Index from Reliability Index from Reliability Index from PDA EOD PDA EOD PDA EOD All PDA BOR PDA BOR PDA BOR All Static Load Tests
94 shown in Table 4-3. The reliability indices from the static load test data are about 1.1 for FS of 2, 1.5 for FS of 2.5, and 1.9 for FS of 3; which are a little less than those from the PDA BOR data. Figure 4-7 shows that the reliability indices from the PDA EOD data are much less than those from the PDA BOR data or the static load test data. The reliability indices from the PDA EOD N@Toe>40 database are unrealistically low, reflecting the extremely low means and the large COV s of the bias factors in Table 4-3. The reliability indices for the skin capacity are all very low, which implies that the Nordlund method overpredicts the skin resistance of coastal concrete square piles. The difference in the computed reliability indices between and is relatively small in this category. On the average, shows 4%, 10%, and 3% higher than for the total, skin, and toe capacity, respectively. 3.0 Reliability Index PDA BOR All PDA BOR All Static Load Test Static Load Test PDA EOD All PDA EOD All Factor of Safety Figure 4-7. Reliability Analysis of Nordlund Method for Coastal Concrete Square Pile (Total Capacity) 78
95 Coastal Steel HP Piles: Table 4-20 shows the reliability indices computed for the four different databases available for this category. There is a large increase in the reliability indices between the PDA EOD and the PDA BOR, especially for the skin resistance. This is probably due to a much larger set-up in the skin resistance than in the toe resistance from the PDA restrike. The reliability indices for the skin and toe resistances are quite different between N@Toe<=40 and N@toe>40 of the PDA EOD databases: the reliability indices from the N@Toe<=40 database show larger values for the toe than the skin, whereas the N@Toe>40 database resulted in larger reliability indices for the skin than for the toe. This is consistent with the bias factor statistics shown in Table 4-4. On the average, resulted in a higher reliability index than by about 10% for the total capacity, 9% for the skin, and 1% for the toe capacity. The reliability indices for the total capacity range from 1.0 to 3.3 for FS of 2, 1.4 to 3.9 for FS of 2.5, and 1.8 to 4.5 for FS Table Summary of Reliability Analyses: Coastal Steel HP Pile, Nordlund Nordlund Method Total Skin Toe Coastal Steel HP Piles FS Reliability Index from Reliability Index from Reliability Index from Reliability Index from Reliability Index from Reliability Index from PDA EOD N@Toe<= PDA EOD N@Toe> PDA EOD All PDA BOR All
96 of 3. Figure 4-8 compares the reliability indices between the PDA EOD and BOR data and between and analyses Reliability Index PDA BOR All PDA BOR All PDA EOD All PDA EOD All Factor of Safety Figure 4-8. Reliability Analysis of Nordlund Method for Coastal Steel HP Pile (Total Capacity) Coastal Steel Pipe Piles: Table 4-21 shows the reliability indices computed for the two databases available for this category. There is a large increase in the reliability indices between the PDA EOD and the PDA BOR for the skin capacities, which reflects the set-up effects. But the PDA BOR database gives much lower reliability indices for the toe capacity than the PDA EOD. This probably implies that the toe capacity was not fully mobilized during the PDA restrikes. On the average, resulted in a higher reliability index than by about 13% for the total capacity, 18% for the skin capacity, and 3% for the toe capacity. The reliability indices for the total capacity are graphically displayed in Figure 4-9, ranging from 1.1 to 2.1 for FS of 2, from 1.6 to 2.8 for FS of 2.5, and from 80
97 2.0 to 3.4 for FS of 3. These reliability indices are generally lower than those for the Vesic method by a considerable margin. Table Summary of Reliability Analyses: Coastal Steel Pipe Pile, Nordlund Nordlund Total Skin Toe Coastal Steel Pipe Piles FS Reliability Index from Reliability Index from Reliability Index from Reliability Index from Reliability Index from Reliability Index from PDA EOD All PDA BOR All Reliability Index PDA BOR All PDA BOR All PDA EOD All PDA EOD All Factor of Safety Figure 4-9. Reliability Analysis of Nordlund Method for Coastal Steel Pipe Pile (Total Capacity) 81
98 Coastal Concrete Cylinder Piles: Table 4-22 shows the reliability indices computed for the two databases available for this category. Also, the reliability indices for the total capacity are presented graphically in Figure All of the reliability indices computed for this category are extremely low and unrealistic, reflecting the extremely low mean values and the variances of the bias factors shown in Table 4-6. Also, the PDA database size is not large enough to provide reliable resistance statistics. The reliability indices presented in Table 4-22 suggest that the Nordlund method should not be used for the static capacity prediction of the concrete cylinder piles, unless a significant modification is made in the method. 0.5 Reliability Index Static Load Test Static Load Test PDA EOD PDA EOD Factor of Safety Figure Reliability Analysis of Nordlund Method for Coastal Concrete Cylinder Pile (Total Capacity) 82
99 Table Summary of Reliability Analyses: Coastal Concrete Cylinder Pile, Nordlund Nordlund Method Total Skin Toe Coastal Concrete Cylinder Piles FS Reliability Index from Reliability Index from Reliability Index from Reliability Index from Reliability Index from Reliability Index from PDA EOD All Static Load Tests Piedmont Concrete Square Piles: There is only one database available for this category s reliability analysis as shown in Table The computed reliability indices reflect the bias factor statistics shown in Table 4-7; the reliability indices for the total capacity are larger than those for the skin and toe capacities. This is probably due to the averaging effects in the total capacity variations by combining the variations of the skin and toe capacities. The reliability indices computed for this category are relatively high because of the limited number of the load test data. The difference in the computed reliability indices between and is also much more significant for the total capacity than for the skin or toe capacity. Figure 4-11 shows the comparison of the reliability indices for the total capacity between and analyses. On the average, resulted in a higher reliability index than by 18% for the total capacity, 9% for the skin capacity, and 3% for the toe capacity. 83
100 Table Summary of Reliability Analyses: Piedmont Concrete Square Pile, Nordlund Nordlund Method Total Skin Toe Piedmont Concrete Square Pile FS Reliability Index from Reliability Index from Reliability Index from Reliability Index from Reliability Index from Reliability Index from PDA EOD All Reliability Index PDA EOD All PDA EOD All Factor of Safety Figure Reliability Analysis of Nordlund Method for Piedmont Concrete Square Pile (Total Capacity) Piedmont Steel HP Piles: Two databases are available for this category s reliability analysis as shown in Table The computed reliability indices reflect the bias factor statistics shown in Table 4-8. Contrary to the Vesic method, the Nordlund method yields reliability indices for the toe capacity that are larger than those for the skin capacity because the mean bias factor of the skin capacity is much smaller than that of the toe capacity. The difference in 84
101 the computed reliability indices between and is also much more significant for the skin capacity than for the toe capacity. The reliability indices for the total capacity range from 1.0 to 1.4 for FS of 2, 1.5 to 1.8 for FS of 2.5, and 1.9 to 2.1 for FS of 3 as shown in Figure Table Summary of Reliability Analyses: Piedmont Steel HP Pile, Nordlund Nordlund Method Total Skin Toe Piedmont Steel HP Piles FS Reliability Index from Reliability Index from Reliability Index from Reliability Index from Reliability Index from Reliability Index from PDA EOD All Static Load Tests Reliability Index Static Load Test Static Load Test PDA EOD All PDA EOD All Factor of Safety Figure Reliability Analysis of Nordlund Method for Piedmont Steel HP Pile (Total Capacity) 85
102 4.6.4 The Meyerhof Method Coastal Concrete Square Piles: Table 4-25 shows the reliability indices computed for the six different databases available for this category. Overall, the Meyerhof method gives the largest reliability indices for this category, followed by the Vesic method. Clearly the PDA restrike (BOR) data show a much higher reliability than the PDA initial driving (EOD) data. Figure 4-13 shows that the reliability indices from the static load test data are about 2.2 for FS of 2, 2.6 for FS of 2.5, and 2.9 for FS of 3, which are between those values obtained from the PDA EOD data and those from the PDA BOR data. As expected, the reliability indices reflect the bias factor statistics shown in Table 4-3. Table Summary of Reliability Analyses: Coastal Concrete Square Pile, Meyerhof Meyerhof Method Total Skin Toe Coastal Concrete Square Piles FS Reliability Index from Reliability Index from Reliability Index from Reliability Index from Reliability Index from Reliability Index from PDA EOD N@Toe<= PDA EOD N@Toe> PDA EOD All PDA BOR N@Toe<= PDA BOR All Static Load Tests
103 The reliability indices for the toe capacity from the PDA EOD database are very low, and it is probably because only a small percentage of the ultimate toe resistance was mobilized during the initial PDA operation of the many test piles. The difference in the computed reliability indices between and is relatively small in this category. On the average, shows 5%, 3%, and 4% higher than for the total, skin, and toe capacity, respectively. 5.0 Reliability Index PDA BOR All PDA BOR All Static Load Test Static Load Test PDA EOD All PDA EOD All Factor of Safety Figure Reliability Analysis of Meyerhof Method for Coastal Concrete Square Pile (Total Capacity) Coastal Steel HP Piles: Table 4-26 shows the reliability indices computed for the four different databases available for this category. As in the cases of both the Vesic method and the Nordlund method, there is a large increase in the reliability indices between the PDA EOD and the PDA BOR, especially for the skin resistance. This is probably due to a much larger set- 87
104 up in the skin resistance than in the toe resistance from the PDA restrike. As expected, the reliability indices reflect the bias factor statistics shown in Table 4-4. The computed reliability indices for the skin capacity are relatively low, and it implies that the Meyerhof method overpredicts the skin resistance. On the average, resulted in a higher reliability index than by about 10% for the total capacity, 8% for the skin, and 2% for the toe capacity. The reliability indices for the total capacity range from 1.1 to 2.1 for FS of 2, 1.6 to 2.7 for FS of 2.5, and 2.0 to 3.1 for FS of 3 as shown in Figure Table Summary of Reliability Analyses: Coastal Steel HP Pile, Meyerhof Meyerhof Method Total Skin Toe Coastal Steel HP Piles FS Reliability Index from Reliability Index from Reliability Index from Reliability Index from Reliability Index from Reliability Index from PDA EOD N@Toe<= PDA EOD N@Toe> PDA EOD All PDA BOR All
105 4.0 Reliability Index PDA BOR All PDA BOR All PDA EOD All PDA EOD All Factor of Safety Figure Reliability Analysis of Meyerhof Method for Coastal Steel HP Pile (Total Capacity) Coastal Steel Pipe Piles: Table 4-27 shows the reliability indices computed for the two databases available for this category. There is a large increase in the reliability indices between the PDA EOD and the PDA BOR for the total and skin capacities, which reflects the large set-up effects. But the reliability indices for the toe capacity are not much different between the EOD and the BOR. This probably implies that the toe capacity was not fully mobilized during the PDA restrikes. On the average, resulted in a higher reliability index than by about 20% for the total capacity, 25% for the skin capacity, and 3% for the toe capacity. Figure 4-15 shows that the reliability indices for the total capacity range from 1.8 to 4.7 for FS of 2, 2.4 to 5.6 for FS of 2.5, and 2.8 to 6.3 for FS of 3. These reliability indices are generally higher than those for the Nordlund method by a considerable margin, but similar to those for the Vesic method. 89
106 Table Summary of Reliability Analyses: Coastal Steel Pipe Pile, Meyerhof Meyerhof Method Total Skin Toe Coastal Steel Pipe Piles FS Reliability Index from Reliability Index from Reliability Index from Reliability Index from Reliability Index from Reliability Index from PDA EOD All PDA BOR All Reliability Index PDA BOR All PDA BOR All PDA EOD All PDA EOD All Factor of Safety Figure Reliability Analysis of Meyerhof Method for Coastal Steel Pipe Pile (Total Capacity) Coastal Concrete Cylinder Piles: Table 4-28 and Figure 4-16 show the reliability indices computed for the two databases available for this category. The reliability indices for the toe capacity from the 90
107 PDA EOD database are very low, as expected by the low mean and the large COV values of this database shown in Table 4-6. Also, the PDA database size is not large enough to provide reliable resistance statistics. The reliability indices from the static load test data are 2.5 for FS of 2, 2.9 for FS of 2.5, and 3.2 for FS of 3, and these are more reliable than those from the PDA data. On the average, shows about 4% higher reliability indices than for the static load test database Reliability Index PDA EOD All PDA EOD All Static Load Test Static Load Test Factor of Safety Figure Reliability Analysis of Meyerhof Method for Coastal Concrete Cylinder Pile (Total Capacity) 91
108 Table Summary of Reliability Analyses: Coastal Concrete Cylinder Pile, Meyerhof Meyerhof Method Total Skin Toe Coastal Concrete Cylinder Piles FS Reliability Index from Reliability Index from Reliability Index from Reliability Index from Reliability Index from Reliability Index from PDA EOD All Static Load Tests Piedmont Concrete Square Piles: There is only one database available for this category s reliability analysis, and the results are presented in Table 4-29 and Figure The computed reliability indices reflect the bias factor statistics shown in Table 4-7; the reliability indices for the skin capacity are larger than those for the toe capacity, and the reliability indices for the total capacity are between the skin and the toe. On the average, resulted in a higher reliability index than by 3% for the total capacity, 4% for the skin capacity, and 1% for the toe capacity. Table Summary of Reliability Analyses: Piedmont Concrete Square Pile, Meyerhof Meyerhof Method Total Skin Toe Piedmont Concrete Square Piles FS Reliability Index from Reliability Index from Reliability Index from Reliability Index from Reliability Index from Reliability Index from PDA EOD All
109 3.0 Reliability Index PDA EOD All PDA EOD All Factor of Safety Figure Reliability Analysis of Meyerhof Method for Piedmont Concrete Square Pile (Total Capacity) Piedmont Steel HP Piles: Two databases are available for this category s reliability analysis as shown in Table The computed reliability indices reflect the bias factor statistics shown in Table 4-8. The reliability indices for the skin capacity are much larger than those for the toe capacities because of the much less COV of the skin capacity than COV of the toe capacity. The difference in the computed reliability indices between and is also much more significant for the skin capacity than for the toe capacity. On the average, resulted in a higher reliability index than by 11% for the total capacity, 53% for the skin capacity, and 1% for the toe capacity. Figure 4-18 shows that the differences in the reliability indices between and analyses are more significant for the PDA EOD data than for the static load tests data. 93
110 Table Summary of Reliability Analyses: Piedmont Steel HP Pile, Meyerhof Meyerhof Method Total Skin Toe Piedmont Steel HP Piles FS Reliability Index from Reliability Index from Reliability Index from Reliability Index from Reliability Index from Reliability Index from PDA EOD All Static Load Tests Reliability Index PDA EOD All PDA EOD All Static Load Test Static Load Test Factor of Safety Figure Reliability Analysis of Meyerhof Method for Piedmont Steel HP Pile (Total Capacity) 4.7 TARGET RELIABILITY INDEX The reliability analysis on the current design practice shows a large variation in the reliability index among the three different analysis methods and for the different pile 94
111 types and regions. This indicates that the NCDOT s current practice of pile foundation design applies different levels of safety to the different design methods, pile types, or regions. The level of safety should be consistent in the LRFD-based pile foundation design, and a constant target reliability index should be used in the calibration of the resistance factors. Barker, el al. (1991b) selected a target reliability index (β T ) of 2.0 to 2.5 in their resistance factor calibration for driven piles, and Withiam, el al. (1998) confirmed that this range of target reliability index is reasonable for a single pile design considering that piles are usually used in groups. β T of 2.0 to 2.5 is within a reasonable conformity with the reliability indices evaluated for the current design practice. The reliability index of 2.0 to 2.5 corresponds to the probability of failure of approximately 0.1 (10%) to 0.01 (1%). This range of failure probability is acceptable for piles that are used in groups due to the redundancy in each pile s probability of failure. Thus, the target reliability indices of 2.0 and 2.5 are selected for the calibration of the resistance factors in this study. 4.8 SUMMARY OF RELIABILITY ANALYSIS This chapter presented the load statistics, resistance statistics and the Bayesian updating of some of the resistance bias factors, and the two types of first order reliability ( and ) analyses of the current allowable strength design practice of driven pile axial capacity. The computed reliability indices of the three design methods (Vesic, Nordlund, and Meyerhof) for the six different categories of pile type and geologic region were presented in tables and graphs. The reliability indices vary widely among the six design categories as well as among the three design methods. This means that the 95
112 Vesic, Nordlund, and Meyerhof methods provide different levels of reliability for the same factor of safety, and therefore they should have different set of resistance factors for the load and resistance factor design. Also, reliability indices should be developed for the six different design categories of pile type and geologic region. The reliability analysis results show significant differences between and analyses. resulted in a higher reliability index than by 3 to 34 perecnt, except for the Nordlund method of coastal concrete cylinder pile case. The target reliability indices of 2.0 and 2.5 were chosen for the resistance factor calibration. 96
113 CHAPTER 5. CALIBRATION OF RESISTANCE FACTORS 5.1 INTRODUCTION Information from load statistics, resistance statistics, and the reliability analysis are used for calibration process of resistance factors. Calibration is the process of assigning values to the resistance factors or the load factors. In this study, calibration was performed only for the resistance factors because predetermined load factors in the current AASHTO LRFD specifications will be used. This research was focused on developing the resistance factors in the LRFD approach of the axial capacity of driven piles. Calibration was performed based on the three static pile capacity analysis methods (Vesic, Nordlund, and Meyerhof) for each of the six categories of the resistance statistics: coastal concrete square pile, coastal steel HP pile, coastal steel pipe pile, coastal concrete cylinder pile, piedmont concrete square pile, and piedmont steel HP pile. The resistance factors for total, skin, and toe capacities were calibrated separately. Also, calibration was performed on every available database of the resistance statistics from the PDA initial driving (EOD), the PDA restrike (BOR), the static load test, and the Bayesian updating. In chapter 4, two types of the first order reliability methods were utilized for the reliability analysis: and. Results show some difference in the computed reliability indices between the two methods. This warrants that the two methods be used for the calibration of the resistance factors. Calibration of the resistance factors was performed for two target reliability indices of 2.0 and 2.5, using the two reliability methods. A brief description of each of the reliability method is presented 97
114 below, followed by the results of the resistance factor calibration for the three pile bearing capacity analysis methods. 5.2 THE METHOD The basic equation for LRFD was expressed as Equation 2-5 in Chapter 2 and is rewritten here in the following format. φ = Σ γ i Q i / R (5-1) The nominal resistance R can be replaced by the mean value ( R ) and the resistance bias factor (λ R ). Then, φ = λ Σγ R ( i Qi ) R (5-2) From Equation 4-9, R can be replaced by the following equation. R = Q exp( β ln[(1 + COV (1 + COV 2 Q 2 R )(1 + COV ) /(1 + COV 2 R ) 2 Q )]) (5-3) And Equation 5-2 can be rewritten in the following form. φ = λ ( Σγ Q ) R i i (1 + COV 2 Q Q exp( β ln[(1 + COV 2 R ) /(1 + COV )(1 + COV 2 Q 2 R ) )]) (5-4) Q can be expressed in terms of nominal load (Q) and its bias factor (λ Q ), such that, Q = λ Q * Q. We consider only the dead load and live load combination (Strength I case), and Equation 5-4 can be rewritten as: φ = λ ( γ QD R QD QD + γ QL QL QL) (1 + COV 2 QD ( λ QD + λ QL)exp( β ln[(1 + COV + COV 2 R 2 QL )(1 + COV ) /(1 + COV 2 QD 2 R + COV ) 2 QL )]) (5-5) 98
115 Dividing the numerator and the denominator by QL, and replacing β with the target reliability index β T, Equation 5-5 becomes: φ = ( λ QD QD QL λ ( γ R + λ QL QD QD QL )exp{ β T + γ QL ) 1+ COV ln[(1 + COV 1+ COV 2 R 2 QD + COV 2 R )(1 + COV 2 QL 2 QD + COV 2 QL )]} (5-6) Equation 5-6 is then used for calibration of the resistance factors. It can be seen from this equation that the resistance factor is a function of the load statistics, the load factors, the resistance statistics, the dead load over live load ratio, and the target reliability index. All the elements of the information required for the resistance factor calibration are as presented in Chapter 4. Table 5-1 shows an example Excel spreadsheet that was used in the calculation of φ using Equation 5-6. The ratio of dead load over live load (QD/QL) varies with bridge span length as presented in the publication by Withiam, et al. (1998). Table 5-1. Calibration for PDA BOR Coastal Concrete Square Pile, Vesic Span (ft) QD/QL γ D γ L λ QD λ QL COV QD COV QL λ R COV R β T φ
116 5.3 THE METHOD The basic algorithm of the for the resistance factor calibration is similar to that of the reliability analysis presented in Chapter 4. The limit state function is defined as: g = lnr ln(σq i ) = ln R ΣQ i (5-7) If we consider only the dead and live loads, the limit state function can be rewritten in terms of the bias factors of the load and the resistance as follows: g = ln λr R λ QD + λ QD QL QL (5-8) Equation 2-5 can be rewritten as follow in terms of the dead and live loads. φ R = γ QD QD + γ QL QL (5-9) Substituting R from Equation 5-9 into Equation 5-8 yields the following limit state function. g = ln λ ( γ R QD QD + γ QL) φ( λ QD + λ QL) QD QL QL (5-10) Divide the numerator and the denominator by QL and the Equation 5-10 becomes: g = ln λ ( γ R φ( λ QD QD QD / QL + γ QD / QL + λ QL QL ) ) (5-11) This is the limit state function used in the calibration of the resistance factors. A computer program was developed in the MATLAB environment to facilitate the iteration process for the calculation of the resistance factors. The program output provides graphical data showing the relationship between the reliability indices and the calibrated resistance factors. Three examples of calibration output graphs are shown in 100
117 Figures 5-1. This figure shows that the resistance factor can be more than unity for a low reliability index. The resistance factors corresponding to the target reliability indices of 2.0 and 2.5 can be found by using the spline interpolant fitting method available in the EXCEL program. As shown in Table 5-1, the resistance factors do not vary significantly for the different bridge span lengths, and applying a different resistance factor for the different span length will be cumbersome in the pile foundation design practice. It was found that the bridge span lengths in the range of 90 feet are most frequently used in the NCDOT practice. The span length of 90 feet corresponds to the QD/QL ratio of 1.5. Therefore, it was determined that a single resistance factor based on QD/QL ratio of 1.5 will be recommended for all span lengths. All of the resistance factors presented in the following are based on the QD/QL ratio of Vesic Total Capacity C-C-SQ Pile BOR All Nordlund Total Capacity PS HP EOD All Meyerhof Total Capacity CS HP BOR All Resistance Factor Reliability Index Figure 5-1. Calibration Graphical Output 101
118 5.4 RESISTANCE FACTORS FOR THE VESIC METHOD Coastal Concrete Square Piles: Calibration was performed on the 10 cases of the resistance statistics for this category and the results are summarized in Table 5-2. The resistance statistics for this category are from 85 PDA EOD, 26 PDA BOR, and 22 static load test data. The PDA data were divided into and as presented in Chapter 3. Figures 5-2 and 5-3 show the computed resistance factors graphically for and cases, respectively. The resistance factors calibrated on the data are somewhat larger than those calibrated on the data. Bayesian updating on the resistance statistics was also performed, as presented in Chapter 4, and the resistance factors calibrated on the updated statistics for pile total capacity are included in Table 5-2. There is a significant difference in the resistance factors between the PDA EOD and the PDA BOR, which is consistent with the reliability analysis results presented in Chapter 4. The resistance factors calibrated with the Bayesian updated PDA data are much closer to those calibrated with the PDA BOR data than those calibrated with the PDA EOD data. The resistance factors calibrated with the static load test data are somewhat smaller than those calibrated with the Bayesian updated PDA data for N@Toe<=40 case, but slightly larger for N@Toe>40 case. The resistance factors for pile skin capacity are consistently larger than those for toe capacity. Table 5-2 shows two negative resistance factors for toe capacity of PDA BOR N@Toe>40 case from method. The method gave these negative resistance factors as the result of the 102
119 Resistance Factor T=2.0 T=2.0 T=2.5 T=2.5 PDA BOR Bayesian Static Load Test PDA EOD 0.0 Analysis Method and Target Beta Figure 5-2. Resistance Factors for Coastal Concrete Square Pile, Vesic Method Resistance Factor T=2.0 T=2.0 T=2.5 T=2.5 Static Load Test PDA BOR Bayesian PDA EOD Analysis Method and Target Beta Figure 5-3. Resistance Factors for Coastal Concrete Square Pile, Vesic Method 103
120 iteration process of its algorithm due to the small mean and the very large COV of the resistance bias factors as shown in Table 4-3. Since the resistance factors cannot be negative theoretically, these negative values have no meaning other than that the computed resistance factors are extremely low and approaching zero. The analysis gave larger resistance factors than the by about 4% to 13%, except the small resistance factors for the toe capacity based on the PDA BOR data. The resistance factors for pile total capacity are in the range of 0.27 to 0.67 for β T of 2.0, and 0.21 to 0.58 for β T of 2.5. Table 5-2. Resistance Factors for Coastal Concrete Square Pile, Vesic Vesic Method Total Skin Toe Coastal Concrete Square Piles β Τ φ from φ from φ from φ from φ from φ from PDA EOD N@Toe<= PDA EOD N@Toe> PDA EOD ALL PDA BOR N@Toe<= PDA BOR N@Toe> PDA BOR ALL Bayesian N@Toe<= Bayesian N@Toe> Bayesian All Static Load Tests
121 Coastal Steel HP Piles: Calibration was performed on the seven cases of the resistance statistics for this category and the results are summarized in Table 5-3. The resistance statistics for this category are from 17 PDA EOD and 3 PDA BOR data. The PDA EOD data were divided into N@Toe<=40 and N@Toe>40 as presented in Chapter 3. The difference in the resistance factors between the N@Toe<=40 data and the N@Toe>40 data is not significant in this category. However, there is a significant difference in the resistance factors between the PDA EOD and the PDA BOR, which is consistent with the reliability analysis results presented in Chapter 4. Bayesian updating on the resistance statistics was also performed as presented in Chapter 4, and the resistance factors calibrated on the updated statistics for pile total capacity are included in Table 5-3. The resistance factors calibrated on the updated resistance statistics are much closer to the factors from the PDA Table 5-3. Resistance Factors for Coastal Steel HP Pile, Vesic Vesic Method Total Skin Toe Coastal Steel HP Piles β Τ φ from φ from φ from φ from φ from φ from PDA EOD N@Toe<= PDA EOD N@Toe> PDA EOD ALL PDA BOR ALL Bayesian N@Toe<= Bayesian N@Toe> Bayesian All
122 BOR data than those from the PDA EOD data, as shown in Figure 5-4. As the size of the PDA BOR database (total 3) is not large enough to draw a reliable statistics on the resistance, it is reasonable to combine the PDA EOD and BOR in the selection of the resistance factors for this category. The resistance factors for pile toe capacity are consistently larger than those for skin capacity. The analysis gave larger resistance factors than the by about 4% to 15%. The resistance factors for pile total capacity are in the range of 0.43 to 1.06 for β T of 2.0, and 0.33 to 0.91 for β T of Resistance Factor T=2.0 T=2.0 T=2.5 T=2.5 PDA BOR All Bayesian All PDA EOD All Analysis Method and Target Beta Figure 5-4. Resistance Factors for Coastal Steel HP Pile, Vesic Method Coastal Steel Pipe Piles: Calibration was performed on the three cases of the resistance statistics for this category and the results are summarized in Table 5-4. The resistance statistics for this category are from 7 PDA EOD and 15 PDA BOR data. Bayesian updating on the resistance statistics was also performed as presented in Chapter 4, and the resistance factors calibrated on the updated statistics for the pile total capacity are included in Table 106
123 5-4. There is a significant difference in the resistance factors between the PDA EOD and the PDA BOR. However, there is no consistency in the change of the resistance factors for skin and toe capacities between the PDA EOD and BOR. Figure 5-5 shows that the resistance factors calibrated on the Bayesian updated data are very close to those calibrated on the PDA BOR data for target reliability index (β T ) of 2.0, but they are about the average of those calibrated on the PDA EOD data and those on the BOR data for β T of 2.5. The calibrated resistance factors are relatively large, probably because of the fact that most of the PDA data were collected from the same project site and this resulted in relatively low variation in the resistance bias factors. The analysis gave larger resistance factors than the analysis by about 5% to 12%. The resistance factors for pile total capacity are in the range of 0.65 to 1.33 for β T of 2.0, and 0.51 to 1.16 for β T of Resistance Factor T=2.0 T=2.0 T=2.5 T=2.5 PDA BOR Bayesian PDA EOD Analysis Method and Target Beta Figure 5-5. Resistance Factors for Coastal Steel Pipe Pile, Vesic Method 107
124 Table 5-4. Resistance Factors for Coastal Steel Pipe Pile, Vesic Vesic Method Total Skin Toe Coastal Steel Pipe Piles β Τ φ from φ from φ from φ from φ from φ from PDA EOD ALL PDA BOR ALL Bayesian All Coastal Concrete Cylinder Piles: Calibration was performed on the three cases of the resistance statistics for this category and the results are summarized in Table 5-5. The resistance statistics for this category are from 3 PDA EOD and 5 static load test data. Bayesian updating on the resistance statistics was also performed, as presented in Chapter 4, and the resistance factors calibrated on the updated statistics for pile total capacity are included in Table 5-5. The resistance factors calibrated on the Bayesian updated data appear to represent reasonably the resistance statistics of both the PDA data and the static load test data. The resistance factors for skin capacity are very large, while the resistance factors for toe capacity are extremely small. This implies that the Vesic method underestimates skin capacity and overestimates toe capacity of coastal concrete cylinder piles to a great degree. The negative resistance factor for toe capacity in Table 5-5 is theoretically incorrect as discussed before, and it should be interpreted as a very small positive value. It is noted that the database of the resistance statistics for this category is relatively small. The analysis gave larger resistance factors than the by about 8% to 108
125 12%, except for toe capacity. The resistance factors for pile total capacity are shown graphically in Figure 5-6. Table 5-5. Resistance Factors for Coastal Concrete Cylinder Pile, Vesic Vesic Method Total Skin Toe Coastal Conc Cylinder Piles β Τ φ from φ from φ from φ from φ from φ from PDA EOD ALL Static Load Tests Bayesian All Resistance Factor T=2.0 T=2.0 T=2.5 T=2.5 Static Load Test Bayesian PDA EOD Analysis Method and Target Beta Figure 5-6. Resistance Factors for Coastal Concrete Cylinder Pile, Vesic Method 109
126 Piedmont Concrete Square Piles: There is only one case of the resistance statistics for this category, which was derived from six PDA EOD data. The calibrated resistance factors are shown in Table 5-6 and Figure 5-7. The resistance factors for both skin and toe capacities are smaller than those for total capacity, which means that a reasonable combination of skin and toe resistance factors that is equivalent to a resistance factor for total capacity is not possible. It appears that the calibrated resistance factors are relatively large for the PDA EOD data. This is probably due to the small number of the data points for this category, which resulted in the low COV of the bias factors as shown in Table 4-7. The analysis gave larger resistance factors than the by about 5% to 11%. The resistance factors for pile total capacity are in the range of 0.81 to 0.89 for β T of 2.0, and 0.70 to 0.78 for β T of Resistance Factor T=2.0 T=2.0 T=2.5 T=2.5 PDA EOD Analysis Method and Target Beta Figure 5-7. Resistance Factors for Piedmont Concrete Square Pile, Vesic Method 110
127 Table 5-6. Resistance Factors for Piedmont Concrete Square Pile, Vesic Vesic Method Total Skin Toe Piedmont Concrete Square Piles β Τ φ from φ from φ from φ from φ from φ from PDA EOD ALL Piedmont Steel HP Piles: Calibration was performed on the two cases of the resistance statistics for this category and the results are summarized in Table 5-7. The resistance statistics for this category are from 5 PDA EOD and 3 static load test data. As shown in Figure 5-8, the resistance factors calibrated on the PDA data are very close to those calibrated on the static load test data, which eliminated the need for the Bayesian updating. It appears that the calibrated resistance factors are quite large for the PDA EOD data. This is probably due to the relatively small number of the data points for this category and the low COV of the bias factors as shown in Table 4-8. The analysis gave larger resistance factors than the by about 6% to 11%. The resistance factors for pile total capacity are in the range of 0.90 to 0.99 for β T of 2.0, and 0.70 to 0.87 for β T of 2.5. Table 5-7. Resistance Factors for Piedmont Steel HP Pile, Vesic Vesic Method Total Skin Toe Piedmont Steel HP Piles β Τ φ from φ from φ from φ from φ from φ from PDA EOD ALL Static Load Tests
128 Resistance Factor T=2.0 T=2.0 T=2.5 T=2.5 Static Load Test PDA EOD Analysis Method and Target Beta Figure 5-8. Resistance Factors for Piedmont Steel HP Pile, Vesic Method 5.5 RESISTANCE FACTORS FOR THE NORDLUND METHOD Coastal Concrete Square Piles: Calibration was performed on the 10 cases of the resistance statistics for this category and the results are summarized in Table 5-8. The resistance statistics for this category are from 85 PDA EOD, 26 PDA BOR, and 22 static load test data. The PDA data were divided into and as presented in Chapter 3. Figures 5-9 and 5-10 show the computed resistance factors graphically for and cases, respectively. The resistance factors calibrated on the data are somewhat larger than those calibrated on the data. Bayesian updating on the resistance statistics was also performed as presented in Chapter 4, and the resistance factors calibrated on the updated statistics for pile total capacity are included in 112
129 Table 5-8. Resistance Factors for Coastal Concrete Square Pile, Nordlund Nordlund Method Total Skin Toe Coastal Concrete Square Piles β Τ φ from φ from φ from φ from φ from φ from PDA EOD PDA EOD PDA EOD ALL PDA BOR PDA BOR PDA BOR ALL Bayesian Bayesian Bayesian All Static Load Tests Table 5-8. There is a significant difference in the resistance factors between the PDA EOD and the PDA BOR, which is consistent with the reliability analysis results presented in Chapter 4. The resistance factors calibrated with the static load test data are somewhat smaller than those calibrated with the PDA BOR data for N@Toe<=40 case, but slightly larger for N@Toe>40 case. The resistance factors for pile toe capacity are consistently much larger than those for skin capacity. The analysis gave larger resistance factors than the, but the percentage of increase varies from 0% to 11%. The 113
130 resistance factors for pile total capacity are in the range of 0.22 to 0.64 for β T of 2.0, and 0.18 to 0.54 for β T of Resistance Factor T=2.0 T=2.0 T=2.5 T=2.5 Bayesian PDA BOR Static Load Test PDA EOD Analysis Method and Target Beta Figure 5-9. Resistance Factors for Coastal Concrete Square Pile, N@Toe<=40, Nordlund Method Resistance Factor Static Load Test PDA BOR Bayesian PDA EOD T=2.0 T=2.0 T=2.5 Analysis Method and Target Beta T=2.5 Figure Resistance Factors for Coastal Concrete Square Pile, N@Toe>40, Nordlund Method 114
131 Coastal Steel HP Piles: Calibration was performed on the seven cases of the resistance statistics for this category and the results are summarized in Table 5-9. The resistance statistics for this category are from 17 PDA EOD and 3 PDA BOR data. The PDA EOD data were divided into N@Toe<=40 and N@Toe>40, as presented in Chapter 3. The resistance factors from the PDA EOD N@Toe>40 data are larger than those from the N@Toe<=40 data for total and skin capacities for this category. For toe capacity, the resistance factors from the N@Toe>40 data are much smaller than those from the N@Toe<=40 data. The resistance factors are significantly greater from the PDA BOR data than from the PDA EOD data. Bayesian updating on the resistance statistics was performed as presented in Table 5-9. Resistance Factors for Coastal Steel HP Pile, Nordlund Nordlund Method Total Skin Toe Coastal Steel HP Piles β Τ φ from φ from φ from φ from φ from φ from PDA EOD N@Toe<= PDA EOD N@Toe> PDA EOD ALL PDA BOR ALL Bayesian N@Toe<= Bayesian N@Toe> Bayesian All
132 Chapter 4, and the resistance factors calibrated on the updated statistics for pile total capacity are included in Table 5-9. The resistance factors calibrated on the updated resistance statistics are much closer to the factors from the PDA BOR data than those from the PDA EOD data, as shown in Figure As the size of the PDA BOR database (total 3) is not large enough to draw reliable statistics on the resistance, it is reasonable to combine the PDA EOD and BOR in the selection of the resistance factors for this category. The analysis gave larger resistance factors than the by about 3% to 13%. The resistance factors for pile total capacity are in the range of 0.43 to 1.12 for β T of 2.0, and 0.33 to 0.94 for β T of Resistance Factor T=2.0 T=2.0 T=2.5 T=2.5 PDA BOR Bayesian PDA EOD Analysis Method and Target Beta Figure Resistance Factors for Coastal Steel HP Pile, Nordlund Method Coastal Steel Pipe Piles: Calibration was performed on the three cases of the resistance statistics for this category and the results are summarized in Table The resistance statistics for this 116
133 category are from 7 PDA EOD and 15 PDA BOR data. Bayesian updating on the resistance statistics was performed as presented in Chapter 4, and the resistance factors calibrated on the updated statistics for pile total capacity are included in Table The resistance factors from the PDA BOR data are larger than those from the PDA EOD data for total and skin capacities for this category. However, toe capacity has much smaller Table Resistance Factors for Coastal Steel Pipe Pile, Nordlund Nordlund Method Total Skin Toe Coastal Steel Pipe Piles β Τ φ from φ from φ from φ from φ from φ from PDA EOD ALL PDA BOR ALL Bayesian All Resistance Factor T=2.0 T=2.0 T=2.5 T=2.5 Bayesian PDA BOR PDA EOD 0.0 Analysis Method and Target Beta Figure Resistance Factors for Coastal Steel Pipe Pile, Nordlund Method 117
134 resistance factors from the restrike data than from the PDA EOD data. The resistance factors calibrated on the Bayesian updated data are almost identical to those calibrated on the PDA BOR data, as shown in Figure It is noted that most of the PDA data for this category were collected from the same project site and this resulted in relatively low variation in the resistance bias factors. The analysis gave larger resistance factors than the by about 5% to 14%. The resistance factors for pile total capacity are in the range of 0.47 to 0.75 for β T of 2.0, and 0.37 to 0.65 for β T of 2.5. Coastal Concrete Cylinder Piles: Calibration was performed on the three cases of the resistance statistics for this category and the results are summarized in Table The resistance statistics for this category are from 3 PDA EOD and 5 static load test data. Bayesian updating on the resistance statistics was performed as presented in Chapter 4, and the resistance factors calibrated on the updated statistics for pile total capacity are included in Table The resistance factors calibrated on the Bayesian updated data are slightly larger than those from both the PDA data and the static load test data, as shown in Figure However, all of the resistance factors presented in Table 5-11 are very small, and the validity of the calibrated resistance factors for this category is questionable. Also, it is noted that the database of the resistance statistics for this category is relatively small. Comparison of the resistance factors between and reveals an interesting trend: The φ values from the method are larger than those from the method for the φ values greater than or equal to But, for the φ values less than 0.18, the method gave a resistance factor smaller than or equal to that from 118
135 the method. The resistance factors for pile total capacity are in the range of 0.14 to 0.20 for β T of 2.0, and 0.09 to 0.16 for β T of 2.5. Table Resistance Factors for Coastal Concrete Cylinder Pile, Nordlund Nordlund Method Total Skin Toe Coastal Conc Cylinder Piles β Τ φ from φ from φ from φ from φ from φ from PDA EOD ALL Static Load Tests Bayesian All Resistance Factor T=2.0 T=2.0 T=2.5 T=2.5 Bayesian PDA EOD Static Load Test 0.0 Analysis Method and Target Beta Figure Resistance Factors for Coastal Concrete Cylinder Pile, Nordlund Method 119
136 Piedmont Concrete Square Piles: There is only one case of the resistance statistics for this category, which was derived from six PDA EOD data. The calibrated resistance factors are shown in Table 5-12 and Figure The resistance factors for both skin and toe capacities are smaller than those for total capacity, which means that a reasonable combination of skin and toe resistance factors that is equivalent to a resistance factor for total capacity is not possible. The calibrated resistance factors are very large considering that the calibration was based on the PDA EOD data. This implies that the Nordlund method underestimates the capacity of piedmont concrete square piles. The analysis gave larger resistance factors than the analysis by about 5% to 14%. The resistance factors for pile total capacity are in the range of 1.00 to 1.11 for β T of 2.0, and 0.84 to 0.96 for β T of Resistance Factor T=2.0 T=2.0 T=2.5 T=2.5 PDA EOD Analysis Method and Target Beta Figure Resistance Factors for Piedmont Concrete Square Pile, Nordlund Method 120
137 Table Resistance Factors for Piedmont Concrete Square Pile, Nordlund Nordlund Method Total Skin Toe Piedmont Concrete Square Piles β Τ φ from φ from φ from φ from φ from φ from PDA EOD ALL Piedmont Steel HP Piles: Calibration was performed on the two cases of the resistance statistics for this category and the results are summarized in Table The resistance statistics for this category are from 5 PDA EOD and 3 static load test data. As shown in Figure 5-15, the resistance factors calibrated on the PDA data are very close to those calibrated on the static load test data, which eliminated the need for the Bayesian updating. The resistance factors for both skin and toe capacities are smaller than those for total capacity, which means that a reasonable combination of skin and toe resistance factors that is equivalent to a resistance factor for total capacity is not possible. The analysis resulted in larger resistance factors than the analysis by about 3% to 11%. The resistance factors for pile total capacity are in the range of 0.46 to 0.52 for β T of 2.0, and 0.37 to 0.41 for β T of 2.5. Table Resistance Factors for Piedmont Steel HP Pile, Nordlund Nordlund Method Total Skin Toe Piedmont Steel HP Piles β Τ φ from φ from φ from φ from φ from φ from PDA EOD ALL Static Load Tests
138 Resistance Factor T=2.0 T=2.0 T=2.5 T=2.5 Static Load Test PDA EOD Analysis Method and Target Beta Figure Resistance Factors for Piedmont Steel HP Pile, Nordlund Method 5.6 RESISTANCE FACTORS FOR THE MEYERHOF METHOD Coastal Concrete Square Piles: Calibration was performed on the 8 cases of the resistance statistics for this category and the results are summarized in Table The resistance statistics for this category are from 85 PDA EOD, 26 PDA BOR, and 22 static load test data. The PDA EOD data were divided into N@Toe<=40 and N@Toe>40, as presented in Chapter 3. Figures 5-16 and 5-17 show the computed resistance factors graphically for N@Toe<=40 and N@Toe>40 cases, respectively. There is no N@Toe>40 case of the PDA BOR data for the Meyerhof method due to the insufficient supply of data points. The resistance factors calibrated on the PDA EOD N@Toe<=40 data case are larger than those calibrated on the N@Toe>40 data case for total and toe capacities. But, N@Toe<=40 122
139 data case resulted in smaller resistance factors than data case for skin capacity. Bayesian updating on the resistance statistics was also performed as presented in Chapter 4, and the resistance factors calibrated on the updated statistics for pile total capacity are included in Table There is a significant difference in the resistance factors between the PDA EOD and the PDA BOR, which is consistent with the reliability analysis results presented in Chapter 4. The resistance factors calibrated with the Bayesian updated PDA data are closer to those calibrated with the PDA BOR data than those calibrated with the PDA EOD data. The resistance factors calibrated with the static load test data are somewhat smaller than those calibrated with the Bayesian updated PDA data for N@Toe<=40 case. It is noted that the static load test data represent the statistics Table Resistance Factors for Coastal Concrete Square Pile, Meyerhof Meyerhof Method Total Skin Toe Coastal Concrete Square Piles β Τ φ from φ from φ from φ from φ from φ from PDA EOD N@Toe<= PDA EOD N@Toe> PDA EOD ALL PDA BOR N@Toe<= PDA BOR ALL Bayesian N@Toe<= Bayesian All Static Load Tests
140 Resistance Factor βt=2.0 βt=2.0 βt=2.5 βt=2.5 PDA BOR Bayesian Static Load Test PDA EOD Analysis Method and Target Beta Figure Resistance Factors for Coastal Concrete Square Pile, Meyerhof Method Resistance Factor βt=2.0 βt=2.0 βt=2.5 βt=2.5 Static Load Test PDA EOD Analysis Method and Target Beta Figure Resistance Factors for Coastal Concrete Square Pile, Meyerhof Method 124
141 of the total data points for both and cases. This must be considered in the selection of the recommended resistance factors. The analysis resulted in larger resistance factors than the, with the percentage of increase varying from 4% to 15%. The resistance factors for pile total capacity are in the range of 0.34 to 1.28 for β T of 2.0, and 0.27 to 0.98 for β T of 2.5. Coastal Steel HP Piles: Calibration was performed on the seven cases of the resistance statistics for this category and the results are summarized in Table The resistance statistics for this category are from 17 PDA EOD and 3 PDA BOR data. The PDA EOD data were divided into N@Toe<=40 and N@Toe>40, as presented in Chapter 3. The resistance factors from the PDA EOD N@Toe>40 data case are close to those from the N@Toe<=40 data case for total and skin capacities for this category. Toe capacity has much smaller resistance factors from the N@Toe>40 data case than from the N@Toe<=40 data case. The PDA BOR show larger resistance factors than the PDA EOD, most significantly for toe capacity. Bayesian updating on the resistance statistics was also performed as presented in Chapter 4, and the resistance factors calibrated on the updated statistics for pile total capacity are included in Table Figure 5-18 shows that the resistance factors calibrated on the updated resistance statistics are almost identical to the factors from the PDA BOR data case. As the size of the PDA BOR data (total 3) is not large enough to draw a reliable statistics on the resistance, it is reasonable to combine the PDA EOD and BOR in the selection of the resistance factors for this category. The analysis gave larger resistance factors than the by 125
142 Table Resistance Factors for Coastal Steel HP Pile, Meyerhof Meyerhof Method Total Skin Toe Coastal Steel HP Piles β Τ φ from φ from φ from φ from φ from φ from PDA EOD PDA EOD PDA EOD ALL PDA BOR ALL Bayesian Bayesian Bayesian All Resistance Factor βt=2.0 βt=2.0 βt=2.5 βt=2.5 PDA BOR Bayesian PDA EOD 0.0 Analysis Method and Target Beta Figure Resistance Factors for Coastal Steel HP Pile, Meyerhof Method 126
143 approximately 4% to 13%. The resistance factors for pile total capacity are in the range of 0.47 to 0.78 for β T of 2.0, and 0.37 to 0.64 for β T of 2.5. Coastal Steel Pipe Piles: Calibration was performed on the three cases of the resistance statistics for this category and the results are summarized in Table The resistance statistics for this category are from 7 PDA EOD and 15 PDA BOR data. Bayesian updating on the resistance statistics was also performed as presented in Chapter 4, and the resistance factors calibrated on the updated statistics for pile total capacity are included in Table There is a significant increase in the resistance factors for total and skin capacities from the PDA EOD data to the PDA BOR data. However, there is little difference in the resistance factors for toe capacity between the PDA EOD and BOR. The resistance factors calibrated on the Bayesian updated data are very close to those calibrated on the PDA BOR data, as shown in Figure As in the Vesic method, the calibrated resistance factors are very large, which indicates that both the Vesic and the Meyerhof methods underestimate the capacity of coastal steel pipe piles. It is noted that the skin capacity was estimated based on only the outside surface area of the steel pipe piles and the toe capacity was predicted without considering the effect of pile plugging for all the three static analysis methods used in this study. The large resistance factors are also due to the fact that most of the PDA data were collected from the same project site, and this resulted in relatively low variation in the resistance bias factors. The analysis gave larger resistance factors than the analysis by about 3% to 13%. The resistance factors for pile total capacity are in the range of 0.67 to 1.38 for β T of 2.0, and 0.54 to 1.19 for β T of
144 Table Resistance Factors for Coastal Steel Pipe Pile, Meyerhof Meyerhof Method Total Skin Toe Coastal Steel Pipe Piles β Τ φ from φ from φ from φ from φ from φ from PDA EOD ALL PDA BOR ALL Bayesian All Resistance Factor βt=2.0 βt=2.0 βt=2.5 βt=2.5 PDA BOR Bayesian PDA EOD Analysis Method and Target Beta Figure Resistance Factors for Coastal Steel Pipe Pile, Meyerhof Method Coastal Concrete Cylinder Piles: Calibration was performed on the three cases of the resistance statistics for this category and the results are summarized in Table The resistance statistics for this category are from 3 PDA EOD and 5 static load test data. Bayesian updating on the 128
145 resistance statistics was also performed as presented in Chapter 4, and the resistance factors calibrated on the updated statistics for pile total capacity are included in Table Figure 5-20 shows that there is not much difference in the resistance factors calibrated from all the three cases. The resistance factors for skin capacity are very large, while the resistance factors for toe capacity are very small. This implies that the Meyerhof method underestimates skin capacity and overestimates toe capacity of coastal concrete cylinder piles to a great degree. It is noted that the database of the resistance statistics for this category is relatively small. The analysis gave larger resistance factors than the by about 4% to 10%. The resistance factors for pile total capacity are in the range of 0.79 to 0.98 for β T of 2.0, and 0.68 to 0.81 for β T of Resistance Factor βt=2.0 βt=2.0 βt=2.5 βt=2.5 Static Load Test Bayesian PDA EOD 0.0 Analysis Method and Target Beta Figure Resistance Factors for Coastal Concrete Cylinder Pile, Meyerhof Method 129
146 Table Resistance Factors for Coastal Concrete Cylinder Pile, Meyerhof Meyerhof Method Total Skin Toe Coastal Conc Cylinder Piles β Τ φ from φ from φ from φ from φ from φ from PDA EOD ALL Static Load Tests Bayesian All Piedmont Concrete Square Piles: There is only one case of the resistance statistics for this category, which was derived from six PDA EOD data. The calibrated resistance factors are shown in Table The resistance factors in this table are relatively small compare to the resistance factors calibrated for the Vesic and the Nordlund methods. This implies that the Meyerhof method over-predicts pile capacity to some degree, especially toe capacity. The analysis gave larger resistance factors than the analysis by about 4% to 9%. The resistance factors for pile total capacity are in the range of 0.46 to 0.49 for β T of 2.0, and 0.34 to 0.37 for β T of 2.5, as shown in Figure Table Resistance Factors for Piedmont Concrete Square Pile, Meyerhof Meyerhof Method Total Skin Toe Piedmont Concrete Square Piles β Τ φ from φ from φ from φ from φ from φ from PDA EOD ALL
147 0.6 Resistance Factor T=2.0 T=2.0 T=2.5 T=2.5 PDA EOD Analysis Method and Target Beta Figure Resistance Factors for Piedmont Concrete Square Pile, Meyerhof Method Piedmont Steel HP Piles: Calibration was performed on the two cases of the resistance statistics for this category and the results are summarized in Table The resistance statistics for this category are from 5 PDA EOD and 3 static load test data. As Figure 5-22 shows, the resistance factors calibrated with the PDA data are very close to those calibrated with the static load test data, which eliminated the need for the Bayesian updating. The resistance factors for both skin and toe capacities are smaller than those for total capacity, which means that a reasonable combination of skin and toe resistance factors that is equivalent to a resistance factor for total capacity is not possible. The analysis gave larger resistance factors than the analysis by about 7% to 15%. The resistance factors for pile total capacity are in the range of 0.79 to 0.89 for β T of 2.0, and 0.60 to 0.77 for β T of
148 Table Resistance Factors for Piedmont Steel HP Pile, Meyerhof Meyerhof Method Total Skin Toe Piedmont Steel HP Piles β Τ φ from φ from φ from φ from φ from φ from PDA EOD ALL Static Load Tests Resistance Factor T=2.0 T=2.0 T=2.5 T=2.5 Static Load Test PDA EOD 0.2 Analysis Method and Target Beta Figure Resistance Factors for Piedmont Steel HP Pile, Meyerhof Method 5.7 EFFECTS OF JETTING ON THE RESISTANCE FACTORS As mentioned in Chapter 3, SPT N-value of unity was assumed for the prediction of skin resistance for the section of piles installed with jetting. To evaluate the effects of jetting on the resistance factors for the coastal concrete square piles, the PDA/CAPWAP 132
149 data were sub-grouped to piles driven with jetting and those driven without jetting. Statistical evaluation of the resistance bias factors for each subgroup was performed, and the resistance factors for a target reliability index (β T ) of 2.0 were computed separately for the two subgroups using the method. Table 5-20 shows the effects of jetting on the calibrated resistance factors. In the table, All means all the PDA/CAPWAP data points without consideration of jetting effects. Jetting means the subgroup of the piles driven with jetting, and No Jetting means the subgroup of the piles driven without jetting. Table Jetting Effects on Resistance Factors (Resistance Factors are from Method for β T = 2.0) Coastal Concrete Vesic Nordlund Meyerhof Square Piles Total Skin Toe Total Skin Toe Total Skin Toe All PDA EOD N@Toe<=40 Jetting No Jetting All PDA EOD N@Toe>40 Jetting No Jetting PDA BOR ALL All Jetting No Jetting Generally the effect of jetting is not consistent for the three static pile capacity analysis methods, or for total, skin and toe capacities. For the Vesic method, the jetting effect on toe resistance is more significant than on skin resistance. Figures 5-23 and 5-24 show that for total capacity of the Vesic and the Nordlund methods, the resistance factors for the jetting subgroup are somewhat lower than those for the no-jetting subgroup. One possible reason for the lower resistance factors for the jetting subgroup is higher model 133
150 uncertainty and higher variation in the PDA capacity measurements due to inconsistent jetting operations. There has been no specific guidance for the jetting procedures in NCDOT, and the degree of disturbance of the surrounding soil by jetting varies widely from project to project depending on the individual contractor s operation. The resistance factors for both skin and toe capacities of the Nordlund method show somewhat lower values for the jetting subgroup than for the no-jetting subgroup, except for toe capacity of the PDA BOR case. But the resistance factors for total capacity of the jetting subgroup are very close to those for All data case. The Meyerhof method shows more inconsistency in the jetting effects on the resistance factors. Figure 5-25 shows that for the two PDA EOD cases, the resistance factors for the jetting subgroup are lower than those for the no-jetting subgroup; however, the opposite is true for the PDA BOR case. This can be explained by the fact that the soils disturbed by jetting resettle around the pile and recover their lost density and strength to some degree sometime after jetting. Therefore, the test piles driven with jetting achieved more capacity gain at the time of PDA restrike than those driven without jetting. However, this explanation is not conclusive because the same trend is not observed for the Vesic and Nordlund methods. From the observations discussed above, it is concluded that jetting appears to have some influence on the resistance factor calibration, but it is not clear enough to warrant any adjustments in the calibrated resistance factors. Further study on the effects of jetting on the pile bearing capacity and the resistance factors is recommended. 134
151 Resistance Factor PDA EOD PDA EOD PDA BOR All No Jetting Piles All Piles Jetting Piles Data Case Figure Jetting Effect on Resistance Factor for Vesic Method (Coastal Concrete Square Pile, β T = 2.0) Resistance Factor PDA EOD N@Toe<=40 PDA EOD N@Toe>40 PDA BOR All No Jetting Piles All Piles Jetting Piles Data Case Figure Jetting Effect on Resistance Factor for Nordlund Method (Coastal Concrete Square Pile, β T = 2.0) 135
152 Resistance Factor PDA EOD PDA EOD PDA BOR All No Jetting Piles All Piles Jetting Piles 0.0 Data Case Figure Jetting Effect on Resistance Factor for Meyerhof Method (Coastal Concrete Square Pile, β T = 2.0) 5.8 EFFECTS OF L/D RATIO ON THE RESISTANCE FACTORS As shown in Equations 2-24 and 2-25 of the Meyerhof method for axial pile capacity prediction and as discussed by Tomlinson (1980) and others, the pile length (L) over width or diameter (D) ratio may influence pile capacity and subsequently affect the resistance factors. To investigate the effects of L/D ratio on the resistance factors, the PDA/CAPWAP data of the coastal concrete square piles were sub-grouped to piles with L/D less than or equal to 20 and those with L/D more than 20. Statistical evaluation of the resistance bias factors for each subgroup was performed, and the resistance factors for a target reliability index (β T ) of 2.0 were computed separately for the two subgroups using the method. Table 5-21 shows the effects of L/D ratio on the calibrated resistance factors. 136
153 PDA EOD Table Effects of L/D Ratio on Resistance Factors (Resistance Factors are from Method for β T = 2.0) Coastal Concrete Vesic Nordlund Meyerhof Square Piles Total Skin Toe Total Skin Toe Total Skin Toe All L/D<= L/D> All L/D<= PDA EOD N@Toe>40 PDA BOR ALL L/D> All L/D<= L/D> Figures 5-26 and 5-27 show the L/D ratio effects on the resistance factors calibrated for the total capacity of the Vesic method and the Nordlund method, respectively. Piles with L/D less than or equal to 20 yield higher resistance factors than those with L/D ratio more than 20. This is probably because the Vesic and Nordlund methods generally over-predict the skin capacity more significantly than the toe capacity, and the piles with L/D<=20 have more toe contribution to the total capacity than the piles with L/D>20. There are not much difference in the resistance factors between L/D>20 group and All pile group, and an adjustment of the resistance factors for piles with L/D>20 is not warranted. However, it is warranted to increase the resistance factors for the Vesic and Nordlund methods for piles with L/D<=20 by 0.10 for N@Toe<=40 case and by 0.05 for N@Toe>40 case. Figure 5-28 shows the L/D ratio effects on the resistance factors calibrated for the total capacity of the Meyerhof method. Contrary to the cases of the Vesic and Nordlund methods, piles with L/D less than or equal to 20 yield lower resistance factors than those with L/D ratio more than 20. This is probably because the Meyerhof method generally 137
154 Resistance Factor PDA EOD PDA EOD PDA BOR All Piles with L/D<=20 All Piles Piles with L/D>20 Data Case Figure Effect of L/D Ratio on Resistance Factor for Vesic Method (Coastal Concrete Square Pile, β T = 2.0) Resistance Factor PDA EOD N@Toe<=40 PDA EOD N@Toe>40 PDA BOR All Piles with L/D<=20 All Piles Piles with L/D>20 Data Case Figure Effect of L/D Ratio on Resistance Factor for Nordlund Method (Coastal Concrete Square Pile, β T = 2.0) 138
155 Resistance Factor PDA EOD PDA BOR All Piles with L/D<=20 All Piles Piles with L/D> PDA EOD 0.0 Data Case Figure Effect of L/D Ratio on Resistance Factor for Meyerhof Method (Coastal Concrete Square Pile, β T = 2.0) under-predicts the skin capacity more significantly than the toe capacity, and the piles with L/D<=20 have more toe contribution to the total capacity than the piles with L/D>20. It is warranted to reduce the resistance factors for the Meyerhof method for piles with L/D<=20 by 0.10 for both N@Toe<=40 and N@Toe>40 cases. Any adjustment of the resistance factors for the Meyerhof method for piles with L/D>20 is not recommended. 5.9 SUMMARY OF RESISTANCE FACTOR CALIBRATION This chapter presented the procedures of the resistance factor calibration and the resistance factors developed for the three static pile capacity analysis methods (Vesic, Nordlund, and Meyerhof) for the six design categories of driven pile foundation in North 139
156 Carolina coastal concrete square pile, coastal steel HP pile, coastal steel pipe pile, coastal concrete cylinder pile, piedmont concrete square pile, and piedmont steel HP pile. Two types of first order reliability method and were utilized in the resistance factor calibration, and a computer program was coded to facilitate the calibration process. The resistance factors from the analysis are larger than those from the analysis by 5 to 13 percent. Pile capacity gain with time (setup) has a significant effect on the resistance factor calibration. Jetting effects on the resistance factors were investigated for the coastal concrete square piles. Jetting is found to reduce the resistance factors slightly, except the PDA BOR case of the Meyerhof s method. However, the effect of jetting is not significant or conclusive to adjust the resistance factors. The effects of the pile length over width ratio (L/D) on the resistance factors were also investigated for the coastal concrete square piles, and minor adjustments of the resistance factors for the L/D ratio were found to be warranted for all three pile capacity prediction methods. 140
157 CHAPTER 6. COMPARISON OF ASD AND LRFD - EXAMPLES Three design cases are selected to illustrate the Load and Resistance Factor Design (LRFD) procedure to determine the pile length for the required axial pile capacity in comparison with the Allowable Strength Design (ASD) procedure. All three design cases are from the PDA data files compiled for this study. A coastal concrete square pile for the Vesic method is presented below as Example 1. A piedmont concrete square pile for the Nordlund method is presented below as Example 2. And a coastal steel HP pile for the Meyerhof method is presented below as Example 3. Example 1: 20 square concrete piles were designed to support the interior bents of the bridge in Dare County. The bridge span length was 90 feet, which corresponds to the dead load over live load ratio (QD/QL) of 1.5. The program PILECAP was used for the Vesic method to compute the bearing capacity of the pile for each pile length increment. The computer program output is included in Appendix A. In ASD, assume FS = 2. The unfactored design load is given as 85 tons per pile. Then, the required ultimate pile capacity is 170 tons (Q ULT = Q DESIGN x FS). From the PILECAP output in Appendix A, the required pile length is estimated as 29 feet. In LRFD, assume β T = 2.0. From Table 7-1, the recommended resistance factor is 0.6 for coastal concrete square piles with SPT N-value at toe of 23. The basic LRFD equation can be written as: 0.6 R = 1.25 QD QL (6-1) 141
158 Since QD/QL = 1.5, QD = 1.5 QL, or QD = 0.6 Q and QL = 0.4 Q, where Q = QD + QL. Equation (6-1) can be rewritten as: 0.6 R = 1.25 (0.6 Q) (0.4 Q) = 1.45 Q From this, R = 1.45Q 1.45*85 = = 205 tons, which corresponds to a factor of safety of 205/85 or From the PILECAP output in Appendix A, the required pile length is estimated as 32 feet. The required pile length from LRFD is longer than that from ASD by three feet. Example 2: 12 square concrete piles were designed to support the end bents of the bridge in Polk County (R-99BA). The bridge span length was 50 feet, which corresponds to the dead load over live load ratio (QD/QL) of 1.0. The program DRIVEN was used for the Nordlund method to compute the bearing capacity of the pile for each pile length increment. The computer program output is included in Appendix A. In ASD, assume FS = 2. The unfactored design load is given as 50 tons per pile. Then, the required ultimate pile capacity is 100 tons (Q ULT = Q DESIGN x FS). From the DRIVEN output in Appendix A, the required pile length is estimated as 28 feet. In LRFD, assume β T = 2.0. From Table 7-1, the recommended resistance factor is 0.9 for piedmont concrete square piles. The basic LRFD equation can be written as: 0.9 R = 1.25 QD QL (6-2) Since QD/QL = 1.0, QD = QL, or QD = 0.5 Q and QL = 0.5 Q, where Q = QD + QL. Equation (6-2) can be rewritten as: 142
159 0.9 R = 1.25 (0.5 Q) (0.5 Q) = 1.5 Q From this, R = 1.5Q 1.5*50 = = 83 tons, which corresponds to a factor of safety of 83/50 or From the DRIVEN output in Appendix A, the required pile length is estimated as 25 feet. The required pile length from LRFD is shorter than that from ASD by three feet. Example 3: HP 12x53 steel piles were designed to support the interior bent footings of the bridge in Onslow County. The bridge span length was 60 feet, which corresponds to the dead load over live load ratio (QD/QL) of 1.0. The Excel spreadsheet program was used for the Meyerhof method to compute the bearing capacity of the pile. The Excel spreadsheet output is included in Appendix A. In ASD, assume FS = 2. The unfactored design load is given as 50 tons per pile. Then, the required ultimate pile capacity is 100 tons (Q ULT = Q DESIGN x FS). From the Excel spreadsheet output in Appendix A, the required pile length is estimated as 58.5 feet. In LRFD, assume β T = 2.0. From Table 7-1, the recommended resistance factor is 0.65 for coastal steel HP piles. The basic LRFD equation can be written as: 0.65 R = 1.25 QD QL (6-3) Since QD/QL = 1.0, QD = QL, or QD = 0.5 Q and QL = 0.5 Q, where Q = QD + QL. Equation (6-3) can be rewritten as: 0.65 R = 1.25 (0.5 Q) (0.5 Q) = 1.5 Q 143
160 From this, R = 1.5Q 1.5*50 = = 115 tons, which corresponds to a factor of safety of The required pile length is estimated as 62 feet. The required pile length from LRFD is longer than that from ASD by 3.5 feet. 144
161 CHAPTER 7. CONCLUSIONS AND RECOMMENDATIONS The resistance factors were calibrated in Chapter 5 using all the available databases of the resistance bias factors presented in Chapter 4. For the categories of coastal concrete square piles and coastal steel HP piles, the resistance factors were evaluated separately for the two different subgroups of the data points based on the SPT N-value at the pile toe: N@Toe<=40 and N@Toe>40. For coastal steel HP piles, the difference in the calibrated resistance factors between the two subgroups is insignificant. Thus, only one set of the resistance factors is recommended for this category. For coastal concrete square piles, it is warranted to recommend a separate set of resistance factors for each N-value case. In Chapter 5, the resistance factors were calibrated separately for total, skin and toe capacities in an attempt to develop a correlation between the three resistance factors for each design category. In many cases, however, the resistance factor for total capacity is larger than both the skin and toe resistance factors. Thus, the combination of the skin and toe resistance factors does not yield a factored resistance equivalent to that by the total capacity resistance factor. One probable reason for this is the averaging effect of the variations in skin and toe capacities when they are combined to total pile capacity. Also, most of driven piles develop both skin and toe resistances, but the percentage of skin or toe capacity to total capacity is not constant. For these reasons, the resistance factors for only total capacity are recommended. There are seven design categories for which the resistance factors are recommended for each of the three static pile capacity analysis methods. These are 145
162 coastal concrete square pile with coastal concrete square pile with coastal steel HP pile, coastal steel pipe pile, coastal concrete cylinder pile, piedmont concrete square pile, and piedmont steel HP pile. The resistance factors calibrated in Chapter 5 were based on many different sizes of pile load test databases with different degrees of variety in pile sizes and lengths, test locations and soil types. This variation in the databases is considered and some degree of judgment is exercised in the selection of the recommended resistance factors from the calibrated resistance factors for each design category. Calibration was performed using both the PDA EOD databases and the PDA BOR databases as well as the Bayesian updated databases, whenever the databases were available. The resistance factors calibrated using the static load test databases are compared with those calibrated using the PDA databases, and all of the calibrated resistance factors are considered in the selection of the recommended resistance factors for each design category. For the coastal concrete square piles, the pile capacities measured in the PDA restrikes (BOR) are considered to represent the ultimate pile capacity more accurately than those measured in the PDA initial driving (EOD). For N@Toe<=40 cases, the resistance factors calibrated with the static load test data are somewhat smaller than those calibrated with the PDA BOR data. However, they are slightly larger for N@Toe>40 cases. This is consistent with the bias factor statistics shown in Table 4-3. The static load tests appear to have underestimated the ultimate pile capacity to some degree, probably due to the conservatism in the ultimate capacity estimate by the Davisson s failure criteria. The statistics of the resistance bias factors for the static load tests in Table 4-3 are based on the total data points of both N@Toe<=40 and N@Toe>40 cases. 146
163 This must be considered in the comparison of the calibrated resistance factors and in the selection of the recommended resistance factors. The resistance factors calibrated using the Bayesian updated PDA databases are given most weight in the selection of the recommended resistance factors. As an example, for the Vesic method of 40 and β T =2.0 total capacity case, method gave φ of 0.43, 0.67, 0.62, and 0.55 from PDA EOD, PDA BOR, Bayesian updated PDA, and static load test database, respectively (see Table 5-2). The recommended resistance factor is selected as 0.60 based on φ of 0.62 from the Bayesian updated PDA database and considering φ of 0.55 from the static load test database. For the coastal steel HP piles, the increase in the calibrated resistance factors from PDA EOD to PDA BOR due to the capacity gain with time (setup) is significant. However, the PDA BOR databases are very small and considered less reliable than the PDA EOD databases. Therefore, the recommended resistance factors are selected by weighing the calibrated resistance factors from the two databases equally, though the resistance factors calibrated using the Bayesian updated databases are much closer to those calibrated using the PDA BOR databases. As an example, for the Meyerhof method of β T =2.0 total capacity case, method gave φ of 0.5, 0.75, and 0.74 from PDA EOD ALL, PDA BOR ALL, and Bayesian updated PDA database, respectively (see Table 5-15). The recommended resistance factor is selected as 0.65 from the average of 0.5 (PDA EOD) and 0.75 (PDA BOR). The setup effects for the coastal steel pipe piles are also significant, and the size of the PDA restrike database is considered large enough to produce reliable statistics. However, all except one PDA data for the coastal steel pipe piles are from the same 147
164 project site, and this probably contributed to the resistance statistics. More variation in the resistance bias factors is expected if the PDA data were from more diverse project sites, which would result in smaller resistance factors. The recommended resistance factors are selected conservatively considering this effect. As an example, for the Nordlund method of β T =2.5 total capacity case, method gave φ of 0.65 from the Bayesian updated PDA database. The recommended resistance factor is selected as The resistance factors for the coastal concrete cylinder piles are based on the least amount of the pile load test data, and therefore least reliable. The resistance factors calibrated for the Nordlund method are extremely small and are not recommended for practical use. The static load test data are considered more reliable than the PDA EOD data, and the recommended resistance factors for the Vesic and Meyerhof methods are selected based on the Bayesian updated data. There is only one database available for the piedmont concrete square piles, and the resistance factors for this category were calibrated based on this database. Conservatism is applied in the selection of the recommended resistance factors due to the limited number of the data points in this only available database. It is interesting to note that the calibrated resistance factors for the piedmont concrete square pile category of the Meyerhof method are quite small compared to those for other categories of the Meyerhof method or those for the same category of the Vesic and Nordlund methods. It is probably due to the large COV of the resistance bias factors for the Meyerhof method as shown in Table 4-7. Recalibration is recommended for this category when more PDA data become available. Calibration was carried out for the two databases of the piedmont steel HP 148
165 piles. The calibrated resistance factors from the PDA EOD database are very close to those from the static load test database. resulted in larger resistance factors than by 5 to 13 percent for the total capacity, except for the coastal concrete cylinder pile category of the Nordlund method. Since method is more accurate than method, the results from are used in the selection of the recommended resistance factors. The resistance factors are recommended for the target reliability index (β T ) of 2.0 and 2.5, which corresponds to the approximate probability of failure of 10% and 1%, respectively. All the recommended resistance factors are rounded to the nearest 0.05 and summarized in Table 7-1. Table 7-1. Recommended Resistance Factors Pile Type and Region Vesic Nordlund Meyerhof (Design Category) β Τ = 2.0 β Τ = 2.5 β Τ = 2.0 β Τ = 2.5 β Τ = 2.0 β Τ = 2.5 Coastal Concrete Square Pile N@Toe<=40 Coastal Concrete Square Pile N@Toe> Coastal Steel HP Pile Coastal Steel Pipe Pile Coastal Concrete Cylinder Pile Piedmont Concrete Square Pile * 0.10* Piedmont Steel HP Pile * These resistance factors are displayed for future reference only and are not recommended for practical use. 149
166 The recommended resistance factors in Table 7-1 should be used with the following conditions: 1. The pile capacity prediction by the Vesic method should be performed using the computer program PILECAP and following the procedures presented in Chapter 2 of this paper. 2. The pile capacity prediction by the Nordlund method should be performed using the computer program DRIVEN and following the procedures presented in Chapter 2 of this paper. 3. The pile capacity prediction by the Meyerhof method should be performed following the procedures presented in Chapter 2 of this paper. 4. Pile plugging is not considered in the capacity prediction by all the three methods. Therefore, the net cross sectional area of the pile should be used for the toe capacity prediction. For the skin capacity of steel HP piles, the total surface area of the pile should be used. For the skin capacity of steel pipe piles and concrete cylinder piles, only the outside surface area of the pile should be used. 5. Regardless of the actual SPT blow counts, the SPT N value of unity should be used for the skin capacity of the section of the pile installed with jetting. 6. The average SPT N value from the toe influence zone should be used for the toe capacity prediction. The toe influence zone for the Vesic and Nordlund methods is from 3D above the toe to 3D below the toe. The toe influence zone for the Meyerhof method is from 4D above the toe to 1D below the toe, where D is the pile width or diameter. 150
167 7. Clay soils with the SPT N value of more than 20 should be treated as a granular soil for the pile capacity prediction by all the three methods. Also, this study summarizes the following findings and conclusions: The three static pile capacity analysis methods (Vesic, Nordlund, and Meyerhof) of the current allowable strength design do not provide the same level of reliability for the same factor of safety. The statistics of the resistance bias factors, which indicate the degree of conservatism in the capacity predictions, vary widely among the Vesic, Nordlund, and Meyerhof methods as well as among the different pile types and the geologic regions for the total, skin, and toe capacities. The two first order reliability methods ( and ) yield significant difference in the computed reliability indices for a nonlinear limit state function. method is recommended for the reliability analysis and the calibration of resistance factors when the limit state function is nonlinear. PDA restrikes of coastal concrete piles often do not mobilize full toe resistance and provide less toe capacity than PDA initial driving. Jetting effect on the resistance factors of coastal concrete square piles is not significant or conclusive, and no adjustment of the resistance factors for jetting is recommended. Pile length over width ratio (L/D) of coastal concrete square piles has some effects on the resistance factors. It is warranted to increase the resistance factors for the Vesic and Nordlund methods for piles with L/D<=20 by 0.10 for N@Toe<=40 case and by 0.05 for N@Toe>40 case. Also, it is warranted to 151
168 reduce the resistance factors for the Meyerhof method for piles with L/D<=20 by 0.10 for both and cases. However, adjustments of the resistance factors for piles with L/D>20 are not recommended for all three methods. Periodic updating of the resistance factors presented in Table 7-1 is recommended when more pile load test data become available. 152
169 REFERENCES American Association of State Highway and Transportation Officials, Washington, D.C AASHTO Standard Specifications for Highway Bridges, 12 th edition AASHTO LRFD Bridge Design Specifications, 1 st edition AASHTO LRFD Bridge Design Specifications, 2 nd edition. American Concrete Institute, Detroit, Michigan Building Code Requirements for Reinforced Concrete, ACI Building Code Requirements for Reinforced Concrete, ACI Building Code Requirements for Reinforced Concrete, ACI American Institute of Steel Construction, Inc., Load and Resistance Factor Design Specification for Structural Steel Buildings, Chicago, Illinois. Ang, H. S. and W. H. Tang, Probability Concepts in Engineering Planning and Design, Vol. I, Basic Principles, John Wiley & Sons, New York. Barker, R. M., J. M. Duncan, K. B. Rojiani, S.K. Ooi, C. K. Tan, and S. G. Kim, 1991a. NCHRP Report 343: Manuals for the Design of Bridge Foundations. Transportation Research Board, Washington, D.C. Barker, R. M., J. M. Duncan, K. B. Rojiani, S. K. Ooi, C. K. Tan, and S. G. Kim, 1991b. NCHRP Project 24-4, Final Report: Load Factor Design Criteria for Highway Structure Foundations. Virginia Polytechnic Institute and State University, Blacksburg, VA. 153
170 Benjamin, J. R. and C. A. Cornell, Probability, Statistics, and Decision for Civil Engineers, McGraw-Hill Inc., New York. Berger, J. O Statistical Decision Theory and Bayesian Analysis, 2 nd edition, Springer-Verlag Inc., New York. Cornell, C. A., A Probability-Based Structural Code. Journal of American Concrete Institute, Vol. 66, pp Danish Geotechnical Institute, Code of Practice for Foundation Engineering, DGI Bulletin No. 36, Lyngby, Denmark. Davisson, M. T., 1972, High Capacity Piles, Proceedings of the Lecture Series on Innovation in Foundation Construction, pp , ASCE Illinois Section, Chicago, Illinois. DiMaggio, J., T. Saad, T. Allen, B. R. Christoper, A. Dimillio, G. Goble, P. Passe, T. Shike, and G. Person Geotechnical Engineering Practices in Canada and Europe, Report No. FHWA-PL , Office of International Program, Federal Highway Administration, Washington, D.C. Ditlevsin, O., Generalized Second Moment Reliability Index, Journal of Structural Division, Vol. 7, No. 4, pp , American Society of Civil Engineers. Ellingwood, B, T. V. Galambos, J. G. MacGregor and C. A. Cornell, Development of a Probability Based Load Criterion for American National Standard A58 Building Code Requirements for Minimum Design Loads in Buildings and Other Structures, National Bureau of Standards, Washington, D.C. Fellenius, B. H., The Analysis of Results from Routine Pile Load Tests, Ground Engineering, Vol. 13, No. 6 pp , Foundations Publications, Ltd. 154
171 Gabr, M. A., Model for Capacity of Single Piles in Sand Using Fuzzy Sets, Discussion of Paper by Juang et al., Journal of Geotechnical Engineering, Vol. 119(1), pp , American Society of Civil Engineers. Gibbs, H. J. and Holtz, W. G., Research on Determining the Density of Sands by Spoon Penetration Testing, Proceedings, 4 th International Conference on Soil Mechanics and Foundation Engineering, Vol. I, London, UK. Goble, G. G., Likins, G. E., and Rausche, F., Bearing Capacity of Piles from Dynamic Measurements, Final Report, Department of Civil Engineering, Case Western Reserve University, Cleveland, Ohio. Goble, G. G Load And Resistance Factor Design of Driven Piles, Transportation Research Record No. 1546, pp , Transportation Research Board, Washington, D.C. Goble, G. G Geotechnical Related Development and Implementation of Load and Resistance Factor Design (LRFD) Methods. NCHRP Program, Synthesis of Highway Practice 276, Transportation Research Board, Washington, D.C. Goble, G. G., LRFD in Foundation Design Practice Advantages and Limitations, presentation at 2001 TRB Meeting, Transportation Research Board, Washington, D.C. Goble, G. G, F. Moses and R. Snyder, Pile Design and Installation Specification Based on Load Factor Concept, Transportation Research Record 749, pp , Transportation Research Board, Washington, D.C. Haldar, A., and S. Mahadevan, Probability, Reliability and Statistical Methods in Engineering Design, John Wiley and Sons, New York. 155
172 Hannigan, P. J., Dynamic Monitoring and Analysis of Pile Foundation Installations, A Continuing Education Short Course Text, Deep Foundations Institute, Sparta, New Jersey. Hannigan, P. J., G. G. Goble, G. Thendean, G. E. Likins and F. Rausche, Design and Construction of Driven Pile Foundations, Vol.1, Federal Highway Administration, Washington, D.C. Hansen, J. B., Code of Practice for Foundation Engineering, Bulletin No. 22, Danish Geotechnical Institute, Copenhagen, Denmark. Hasofer, A. M. and N. C. Lind, Exact and Invariant Second-Moment Code Format, Journal of Engineering Mechanics Division, Vol. 100, No. EM1, pp , American Society of Civil Engineers. Hohenbichler, M., S. Gollwitzer, W. Kruse, and R. Rackwitz, New Light on First and Second Order Reliability Methods, Structural Safety, Vol. 4, pp Keane, P. A., Comparison of Pile Capacity Predictions to Load Test Results in Eastern North Carolina, Report of Special Civil Engineering Project, Department of Civil Engineering, North Carolina State University, Raleigh, North Carolina. Likins, G., F. Rausche, G. Thendean, and M. Svinkin, CAPWAP Correlation Studies, Proceedings of 5 th International Conference on the Application of Stress- Wave Theory on Piles, Orlando, Florida. Mathias, D. and M. Cribbs, DRIVEN 1.0 User s Manual, Blue-Six Software, Inc., Federal Highway Administration, Washington, D.C. 156
173 Myerhof, G. G Safety Factors in Soil Mechanics, Canadian Geotechnical Journal, Vol. 7, pp Myerhof, G. G Bearing Capacity and Settlement of Pile Foundations, Journal of Geotechnical Engineering Division, Vol. 102, No. GT3, pp , American Society of Civil Engineers. Nadim, F., M. A. Gabr and B. Hansen, Sensitivity Study of the Cyclic Axial Capacity of a Single Pile, Proceedings of the ASCE Foundation Engineering Congress, Vol. 2, June, pp , Evanston, Illinois. Nguygen, T., M. C. McVay, B. Birgisson, and C. Kuo, Uncertainty in LRFD Phi, φ, Factors for Driven Prestressed Concrete Piles, Draft for Presentation at 2002 TRB Annual Meeting, Transportation Research Board, Washington, D.C. Nordlund, R. L., Bearing Capacity of Piles in Cohesionless Soils, Journal of the Soil Mechanics and Foundations Division, Vol. 89, No. SM3, pp. 1-35, American Society of Civil Engineers. Nordlund, R.L., Point Bearing and Shaft Friction of Piles in Sand, 5 th Annual Fundamentals of Deep Foundation Design, University of Missouri-Rolla. North Carolina Department of Transportation, Pile Bearing Capacity Analysis (PILECAP) User s Manual, Raleigh, North Carolina. North Carolina Geological Survey, Geologic Map of North Carolina, 1 sheet, scale 1:500,000, N. C. Geological Survey, Raleigh, North Carolina. North Carolina Geological Survey, Preliminary Explanatory Text for the 1985 Geological Map of North Carolina, Contractual Report 88-1, N. C. Geological Survey, Raleigh, North Carolina. 157
174 Nowak, A. S., NCHRP Project 12-33: Calibration of LRFD Bridge Design Code, Transportation Research Board, Washington, D.C. Nowak, A. S., NCHRP Report 368: Calibration of LRFD Bridge Design Code, Transportation Research Board, Washington, D.C. Ontario Ministry of Transportation and Communication, Ontario Highway Bridge Design Code and Commentary, 1 st edition Ontario Highway Bridge Design Code and Commentary, 2 nd edition Ontario Highway Bridge Design Code and Commentary, 3 rd edition. Passe, P Florida s Move to the AASHTO LRFD Code, STGEC 97, Chattanooga. Tennessee. Rackwitz, R. and B. Fiessier, Structural Reliability under Combined Random Load Sequences, Computers and Structures, Vol. 9, pp Rausche, F., G. G. Goble, and G. E. Likins, Dynamic Determination of Pile Capacity, Journal of Geotechnical Engineering, Vol. 111, No. 3, pp , American Society of Civil Engineers. Ronold, K. O. and P. Bjerager, Model Uncertainty Representation in Geotechnical Reliability Analyses, Journal of Geotechnical Engineering, Vol. 118, No. 3, pp , American Society of Civil Engineers. Schultze, E. and K. J. Melzer, The Determination of Density and Modulus of Compressibility of Non-Cohesive Soils by Soundings, Proceedings, 6 th International Conference on Soil Mechanics and Foundation Engineering. 158
175 Schultze, E. and E. Menzenbach, Standard Penetration Test on Compressibility of Soils, Proceedings, 5 th International Conference on Soil Mechanics and Foundation Engineering. Suzanne, L., Uncertainty in Offshore Geotechnical Engineering: Deterministic and Probabilistic Analysis of Axial Capacity of Single Pile, Norwegian Geotechnical Institute, Oslo, Norway. Svinkin, M. R., C. M. Morgano, and M. Morvant, Pile Capacity as a Function of Time in Clayey and Sandy Soils, Proceedings of International Conference and Exhibition on Piling and Deep Foundation, DFI, Westrade Fairs Ltd., Bruges, Belgium. Tomlinson, M. J., Foundation Design and Construction, 4 th Edition, Pitman Advanced Publishing Program, Boston, Massachusetts. Thurman, A. G., Discussion of Bearing Capacity of Piles in Cohesionless Soils, Journal of the Soil Mechanics and Foundation Engineering, SM 1, pp , American Society of Civil Engineers. Vesic, A. S NCHRP Synthesis of Highway Practice 42: Design of Pile Foundations, Transportation Research Board, Washington, D.C. Withiam, J. L., E. P. Voytko, R. M. Barker, J. M. Duncan, B. C. Kelly, S. C. Musser and V. Elias, Load and Resistance Factor Design (LRFD) of Highway Bridge Substructures. FHWA Publication No. HI , Federal Highway Administration, Washington, D.C. Zhang, L. and W. H. Tang, Use of Load Tests for Reducing Pile Length, Draft for 2002 ASCE-GI International Deep Foundations Congress, Orlando, Florida. 159
176 APPENDIX A Static Pile Capacity Analysis Examples The Vesic Method The Nordlund Method The Meyerhof Method 160
177 161
178 162
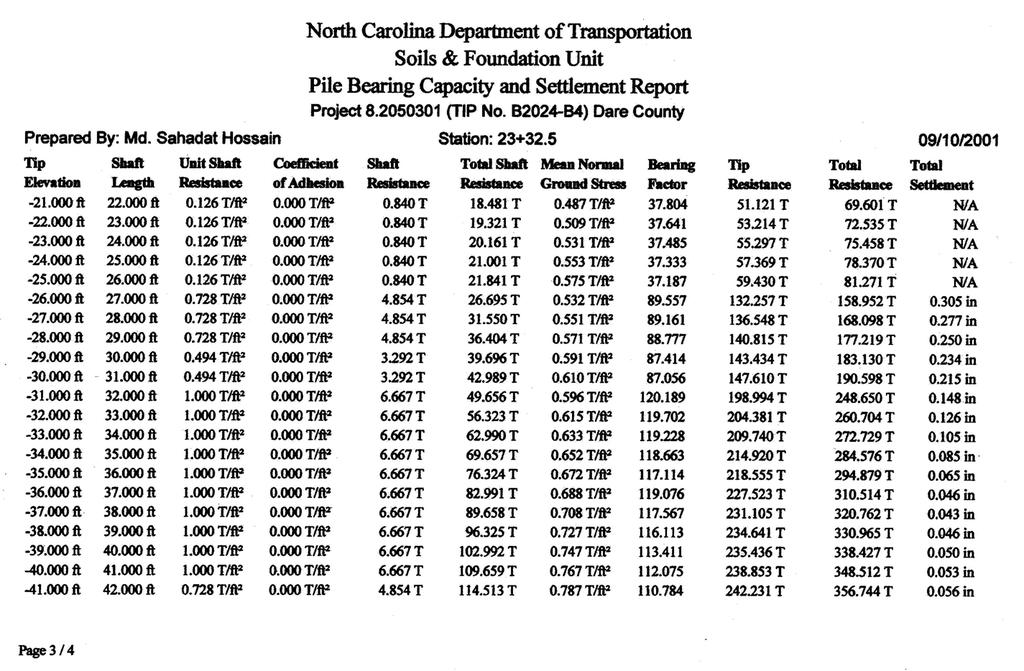
179 163
180 164
181 165
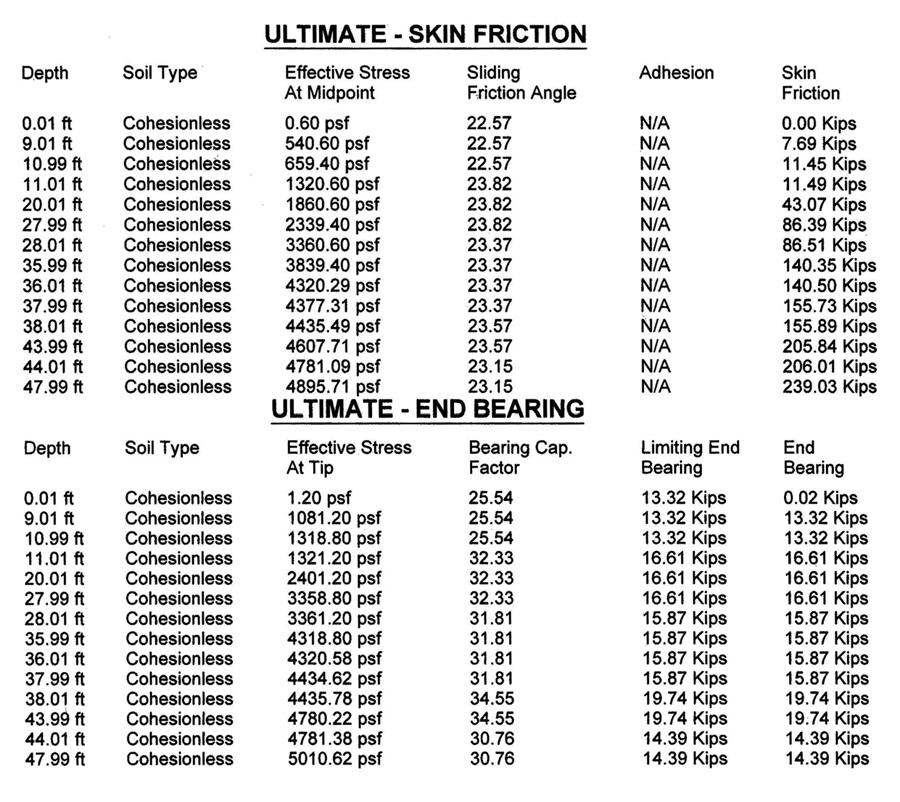
182 166
Evaluation of Pile Setup using Dynamic Restrike Analysis in Alabama Soils
 45 th STGEC - Mobile, AL Oct. 29, 2014 CE Pile 360 Setup Spring AL 13 Evaluation of Pile Setup using Dynamic Restrike Analysis in Alabama Soils Eric Steward, Ph.D. Assistant Professor University of South
Manual for Assessing Safety Hardware
 American Association of State Highway and Transportation Officials Manual for Assessing Safety Hardware 2009 vii PREFACE Effective traffic barrier systems, end treatments, crash cushions, breakaway devices,
Opportunities and Challenges for the. Friday September 24,
 LRFD Facts and Misconceptions: Opportunities and Challenges for the Micropile il Community Friday September 24, 2010 By Jerry A. DiMaggio, PE, M.ASCE Email: jdimaggio2@verizon.net Email: jdimaggio@nas.edu
DYNAMIC PILE TESTING 10/26/ General.
 te: The MoDOT LRFD Bridge Design Manual indicates that the frequency of dynamic pile testing should be 1 to 10% of the number of piles. Additionally, the frequency of initial driving tests and restrike
Reliability-Based Bridge Load Posting
 Reliability-Based Bridge Load Posting The LRFR Approach 2013 Louisiana Transportation conference February 17-20, 2013 Lubin Gao, Ph.D., P.E. Senior Bridge Engineer Load Rating Office of Bridge Technology
A Model for the Characterization of the Scrap Tire Bale Interface. B. J. Freilich1 and J. G. Zornberg2
 GeoFlorida 21: Advances in Analysis, Modeling & Design 2933 A Model for the Characterization of the Scrap Tire Bale Interface B. J. Freilich1 and J. G. Zornberg2 1 Graduate Research Assistant, Department
Racing Tires in Formula SAE Suspension Development
 The University of Western Ontario Department of Mechanical and Materials Engineering MME419 Mechanical Engineering Project MME499 Mechanical Engineering Design (Industrial) Racing Tires in Formula SAE
Development of Emission Control Technology to Reduce Levels of NO x and Fuel Consumption in Marine Diesel Engines
 Vol. 44 No. 1 211 Development of Emission Control Technology to Reduce Levels of NO x and Fuel Consumption in Marine Diesel Engines TAGAI Tetsuya : Doctor of Engineering, Research and Development, Engineering
GOPALAN COLLEGE OF ENGINEERING AND MANAGEMENT Department of Civil Engineering COURSE PLAN
 Appendix - C GOPALAN COLLEGE OF ENGINEERING AND MANAGEMENT Department of Civil Engineering Academic Year: 2016-17 Semester: EVEN COURSE PLAN Semester: VI Subject Code& Name: 10CV64 & Geotechnical Engineering-II
A Proposed Modification of the Bridge Gross Weight Formula
 14 MID-CONTINENT TRANSPORTATION SYMPOSIUM PROCEEDINGS A Proposed Modification of the Bridge Gross Weight Formula CARL E. KURT A study was conducted using 1 different truck configurations and the entire
Probability based Load Rating
 Probability based Load Rating Dennis R. Mertz, Ph.D., P.E. Center for Innovative Bridge Engineering University of Delaware Fundamentals of LRFR Part 1 Introduction to Load Rating of Highway Bridges 1-2
Traffic Signal Volume Warrants A Delay Perspective
 Traffic Signal Volume Warrants A Delay Perspective The Manual on Uniform Traffic Introduction The 2009 Manual on Uniform Traffic Control Devices (MUTCD) Control Devices (MUTCD) 1 is widely used to help
TABLE OF CONTENTS. Table of contents. Page ABSTRACT ACKNOWLEDGEMENTS TABLE OF TABLES TABLE OF FIGURES
 Table of contents TABLE OF CONTENTS Page ABSTRACT ACKNOWLEDGEMENTS TABLE OF CONTENTS TABLE OF TABLES TABLE OF FIGURES INTRODUCTION I.1. Motivations I.2. Objectives I.3. Contents and structure I.4. Contributions
POST-WELD TREATMENT OF A WELDED BRIDGE GIRDER BY ULTRASONIC IMPACT TREATMENT
 POST-WELD TREATMENT OF A WELDED BRIDGE GIRDER BY ULTRASONIC IMPACT TREATMENT BY William Wright, PE Research Structural Engineer Federal Highway Administration Turner-Fairbank Highway Research Center 6300
Depth of Bury Tables 9B-5. A. General. B. Rigid Pipe Assumptions. Design Manual Chapter 9 - Utilities 9B - Trench Design
 Design Manual Chapter 9 - Utilities 9B - Trench Design 9B-5 Depth of Bury Tables A. General The depth of bury tables on the following pages are based upon the design methodology from the various pipe material
RELIABILITY-BASED EVALUATION OF BRIDGE LIVE LOAD CARRYING CAPACITY IN THE UNITED STATES. Lubin Gao 1
 RELIABILITY-BASED EVALUATION OF BRIDGE LIVE LOAD CARRYING CAPACITY IN THE UNITED STATES Abstract Lubin Gao 1 In accordance with the National Bridge Inspection Standards (NBIS), each bridge must be load
ANALYSIS OF OVERCURRENT PROTECTION RELAY SETTINGS OF A COMMERCIAL BUILDING NURUL SYAQIRAH BINTI MOHD SUFI UNIVERSITI MALAYSIA PAHANG
 ANALYSIS OF OVERCURRENT PROTECTION RELAY SETTINGS OF A COMMERCIAL BUILDING NURUL SYAQIRAH BINTI MOHD SUFI UNIVERSITI MALAYSIA PAHANG ANALYSIS OF OVERCURRENT PROTECTION RELAY SETTINGS OF A COMMERCIAL BUILDING
COMPUTATIONAL ANALYSIS OF TWO DIMENSIONAL FLOWS ON A CONVERTIBLE CAR ROOF ABDULLAH B. MUHAMAD NAWI
 COMPUTATIONAL ANALYSIS OF TWO DIMENSIONAL FLOWS ON A CONVERTIBLE CAR ROOF ABDULLAH B. MUHAMAD NAWI Report submitted in partial of the requirements for the award of the degree of Bachelor of Mechanical
EFFECT OF PAVEMENT CONDITIONS ON FUEL CONSUMPTION, TIRE WEAR AND REPAIR AND MAINTENANCE COSTS
 EFFECT OF PAVEMENT CONDITIONS ON FUEL CONSUMPTION, TIRE WEAR AND REPAIR AND MAINTENANCE COSTS Graduate of Polytechnic School of Tunisia, 200. Completed a master degree in 200 in applied math to computer
Influence of cross beam spacing on load distribution factor at girder bridges
 Influence of cross beam spacing on load distribution factor at girder bridges * Hyo-Gyoung Kwak 1) and Joung Rae Kim 2) 1), 2) Department of Civil Engineering, KAIST, Daejeon 305-600, Korea 1) kwakhg@kaist.ac.kr
The Value of Travel-Time: Estimates of the Hourly Value of Time for Vehicles in Oregon 2007
 The Value of Travel-Time: Estimates of the Hourly Value of Time for Vehicles in Oregon 2007 Oregon Department of Transportation Long Range Planning Unit June 2008 For questions contact: Denise Whitney
Performance Based Design for Bridge Piers Impacted by Heavy Trucks
 Performance Based Design for Bridge Piers Impacted by Heavy Trucks Anil K. Agrawal, Ph.D., P.E., Ran Cao and Xiaochen Xu The City College of New York, New York, NY Sherif El-Tawil, Ph.D. University of
FHWA/IN/JTRP-2000/23. Final Report. Sedat Gulen John Nagle John Weaver Victor Gallivan
 FHWA/IN/JTRP-2000/23 Final Report DETERMINATION OF PRACTICAL ESALS PER TRUCK VALUES ON INDIANA ROADS Sedat Gulen John Nagle John Weaver Victor Gallivan December 2000 Final Report FHWA/IN/JTRP-2000/23 DETERMINATION
Semi-Active Suspension for an Automobile
 Semi-Active Suspension for an Automobile Pavan Kumar.G 1 Mechanical Engineering PESIT Bangalore, India M. Sambasiva Rao 2 Mechanical Engineering PESIT Bangalore, India Abstract Handling characteristics
LONG RANGE PERFORMANCE REPORT. Study Objectives: 1. To determine annually an index of statewide turkey populations and production success in Georgia.
 State: Georgia Grant Number: 08-953 Study Number: 6 LONG RANGE PERFORMANCE REPORT Grant Title: State Funded Wildlife Survey Period Covered: July 1, 2010 - June 30, 2011 Study Title: Wild Turkey Production
FDOT S CRITERIA FOR WIND ON PARTIALLY CONSTRUCTED BRIDGES
 FDOT S CRITERIA FOR WIND ON PARTIALLY CONSTRUCTED BRIDGES DENNIS GOLABEK CHRISTINA FREEMAN BIOGRAPHY Mr. Golabek has recently joined Kisinger Campo & Associates and is the Chief Structures Engineer. He
Lateral Resistance Characteristics of Sleepers in Railway Ballasted Tracks from Laboratory Model Tests
 1st China Japan Mini Workshop Lateral Resistance Characteristics of Sleepers in Railway Ballasted Tracks from Laboratory Model Tests Kimitoshi Hayano (Yokohama National University) Contents 1) Effects
Design Analysis and Optimization of Disc Brake
 Design Analysis and Optimization of Disc Brake Assembly of A 4- Wheeler Race C ar Avijit Singh Gangwar B.E. Automobile Engineer Manipal Institute Of Technology Abstract-A disc brake is a wheel brake which
Development and Validation of a Finite Element Model of an Energy-absorbing Guardrail End Terminal
 Development and Validation of a Finite Element Model of an Energy-absorbing Guardrail End Terminal Yunzhu Meng 1, Costin Untaroiu 1 1 Department of Biomedical Engineering and Virginia Tech, Blacksburg,
MODELING SUSPENSION DAMPER MODULES USING LS-DYNA
 MODELING SUSPENSION DAMPER MODULES USING LS-DYNA Jason J. Tao Delphi Automotive Systems Energy & Chassis Systems Division 435 Cincinnati Street Dayton, OH 4548 Telephone: (937) 455-6298 E-mail: Jason.J.Tao@Delphiauto.com
DEVELOPMENT OF COMPRESSED AIR POWERED ENGINE SYSTEM BASED ON SUBARU EA71 MODEL CHEN RUI
 DEVELOPMENT OF COMPRESSED AIR POWERED ENGINE SYSTEM BASED ON SUBARU EA71 MODEL CHEN RUI A project report submitted in partial fulfillment of the requirements for the award of the degree of Bachelor of
Measurement methods for skid resistance of road surfaces
 Measurement methods for skid resistance of road surfaces Presented by Martin Greene (TRL) and Veronique Cerezo (IFSTTAR) 11 October 2016 Background and requirements for Common Scale 1 Background Measurement
Conventional Approach
 Session 6 Jack Broz, PE, HR Green May 5-7, 2010 Conventional Approach Classification required by Federal law General Categories: Arterial Collector Local 6-1 Functional Classifications Changing Road Classification
LONG RANGE PERFORMANCE REPORT. Study Objectives: 1. To determine annually an index of statewide turkey populations and production success in Georgia.
 State: Georgia Grant Number: 8-1 Study Number: 6 LONG RANGE PERFORMANCE REPORT Grant Title: State Funded Wildlife Survey Period Covered: July 1, 1998 - June 30, 1999 Study Title: Wild Turkey Production
Comparison of Live Load Effects for the Design of Bridges
 J. Environ. Treat. Tech. ISSN: 2309-1185 Journal weblink: http://www.jett.dormaj.com Comparison of Live Load Effects for the Design of Bridges I. Shahid 1, S. H. Farooq 1, A.K. Noman 2, A. Arshad 3 1-Associate
COST ANALYSIS FOR BRIDGE AND CULVERT. Essam A. Mostafa
 Seventh International Water Technology Conference IWTC7 Cairo 1-3 April 2003 357 COST ANALYSIS FOR BRIDGE AND CULVERT Essam A. Mostafa Associate Professor, Irrigation & Hydraulics Department, Faculty of
Workshop Agenda. I. Introductions II. III. IV. Load Rating Basics General Equations Load Rating Procedure V. Incorporating Member Distress VI.
 Workshop Agenda I. Introductions II. III. IV. Load Rating Basics General Equations Load Rating Procedure V. Incorporating Member Distress VI. Posting, SHV s and Permitting VII. Load Rating Example #1 Simple
TITLE: EVALUATING SHEAR FORCES ALONG HIGHWAY BRIDGES DUE TO TRUCKS, USING INFLUENCE LINES
 EGS 2310 Engineering Analysis Statics Mock Term Project Report TITLE: EVALUATING SHEAR FORCES ALONG HIGHWAY RIDGES DUE TO TRUCKS, USING INFLUENCE LINES y Kwabena Ofosu Introduction The impact of trucks
Non-contact Deflection Measurement at High Speed
 Non-contact Deflection Measurement at High Speed S.Rasmussen Delft University of Technology Department of Civil Engineering Stevinweg 1 NL-2628 CN Delft The Netherlands J.A.Krarup Greenwood Engineering
Assessing the Methodology for Testing Body Armor
 Assessing the Methodology for Testing Body Armor Ronald D. Fricker, Jr. Naval Postgraduate School and Alyson G. Wilson Iowa State University August 1, 2010 Background Armor manufactured from various materials
Impact of Heavy Loads on State and Parish Bridges. Aziz Saber, Ph.D., P.E. Program Chair Civil Engineering Louisiana Tech University
 Impact of Heavy Loads on State and Parish Bridges Aziz Saber, Ph.D., P.E. Program Chair Civil Engineering Louisiana Tech University Acknowledgement Funds from Louisiana Transportation Research Center LA
Master of Engineering
 STUDIES OF FAULT CURRENT LIMITERS FOR POWER SYSTEMS PROTECTION A Project Report Submitted in partial fulfilment of the requirements for the Degree of Master of Engineering In INFORMATION AND TELECOMMUNICATION
Terminology, Shaft Comparison & General Discussion
 Helical Foundation Systems: Topics We Will Cover Considerations for the Design and Installation of Helical Pile Foundations Presented by: Kyle Olson, PE Senior Structural Engineer Foundation Supportworks,
PREDICTION OF FUEL CONSUMPTION
 PREDICTION OF FUEL CONSUMPTION OF AGRICULTURAL TRACTORS S. C. Kim, K. U. Kim, D. C. Kim ABSTRACT. A mathematical model was developed to predict fuel consumption of agricultural tractors using their official
DeltaStud - Lightweight Steel Framing
 DeltaStud - Lightweight Steel Framing B C H A t P Load Tables for Wind Bearing and Combined Wind & Axial Load Bearing Condition January 2014 Table of Contents Commentary Introduction...3 Product Identification...3
Prerequisites for Increasing the Axle Load on Railway Tracks in the Czech Republic M. Lidmila, L. Horníček, H. Krejčiříková, P.
 Prerequisites for Increasing the Axle Load on Railway Tracks in the Czech Republic M. Lidmila, L. Horníček, H. Krejčiříková, P. Tyc This paper deals with problems of increasing the axle load on Czech Railways
TITLE 16. TRANSPORTATION CHAPTER 27. TRAFFIC REGULATIONS AND TRAFFIC CONTROL DEVICES
 NOTE: This is a courtesy copy of this rule. The official version can be found in the New Jersey Administrative Code. Should there be any discrepancies between this text and the official version, the official
ESTIMATION OF VEHICLE KILOMETERS TRAVELLED IN SRI LANKA. Darshika Anojani Samarakoon Jayasekera
 ESTIMATION OF VEHICLE KILOMETERS TRAVELLED IN SRI LANKA Darshika Anojani Samarakoon Jayasekera (108610J) Degree of Master of Engineering in Highway & Traffic Engineering Department of Civil Engineering
EXPERIMENT AND ANALYSIS OF MOTORCYCLE EXHAUST DESIGN ABDUL MUIZ BIN JAAFAR
 EXPERIMENT AND ANALYSIS OF MOTORCYCLE EXHAUST DESIGN ABDUL MUIZ BIN JAAFAR Report submitted in partial fulfilment of the requirement for the award of the degree of Bachelor of Mechanical Engineering with
Flounder (Platichthys flesus) in Subarea 4 and Division 3.a (North Sea, Skagerrak and Kattegat)
 in Subarea 4 and Division 3.a (North Sea, Skagerrak and Kattegat)") ICES Advice on fishing opportunities, catch, and effort Greater North Sea Ecoregion Published 30 June 2017 DOI: 10.17895/ices.pub.3113 Flounder (Platichthys flesus) in Subarea 4 and Division 3.a (North
ICES Advice on fishing opportunities, catch, and effort Greater North Sea Ecoregion Published 30 June 2017 DOI: 10.17895/ices.pub.3113 Flounder (Platichthys flesus) in Subarea 4 and Division 3.a (North
Optimal Power Flow Formulation in Market of Retail Wheeling
 Optimal Power Flow Formulation in Market of Retail Wheeling Taiyou Yong, Student Member, IEEE Robert Lasseter, Fellow, IEEE Department of Electrical and Computer Engineering, University of Wisconsin at
Darwin-ME Status and Implementation Efforts_IAC09
 Darwin-ME Status and Implementation Efforts_IAC9 What s Being Used (7 survey) Asphalt Design: MEPDG Darwin-ME Status and Implementation Efforts Idaho Asphalt Conference October, 9 Does SHA Use or Plan
Oregon DOT Slow-Speed Weigh-in-Motion (SWIM) Project: Analysis of Initial Weight Data
 Project: Analysis of Initial Weight Data") Portland State University PDXScholar Center for Urban Studies Publications and Reports Center for Urban Studies 7-1997 Oregon DOT Slow-Speed Weigh-in-Motion (SWIM) Project: Analysis of Initial Weight Data
Portland State University PDXScholar Center for Urban Studies Publications and Reports Center for Urban Studies 7-1997 Oregon DOT Slow-Speed Weigh-in-Motion (SWIM) Project: Analysis of Initial Weight Data
Damping Ratio Estimation of an Existing 8-story Building Considering Soil-Structure Interaction Using Strong Motion Observation Data.
 Damping Ratio Estimation of an Existing -story Building Considering Soil-Structure Interaction Using Strong Motion Observation Data by Koichi Morita ABSTRACT In this study, damping ratio of an exiting
Subject: Dr. Witczak s letter to AASHTO Subcommittee on Materials and AASHTO Joint Technical Committee on Pavements
 Subject: Dr. Witczak s letter to AASHTO Subcommittee on Materials and AASHTO Joint Technical Committee on Pavements Issue: Dr. Witczak questioning the validity of dynamic complex modulus ( E* ) measurements
COMMERCIAL SCHEME Approval No
 COMMERCIAL SCHEME Approval No. 12806 MADE at the City of Calgary, in the Province of Alberta, on ALBERTA ENERGY REGULATOR IN THE MATTER of a commercial scheme of Imperial Oil Resources Ventures Limited
EFFECT OF SURFACE ROUGHNESS ON PERFORMANCE OF WIND TURBINE
 Chapter-5 EFFECT OF SURFACE ROUGHNESS ON PERFORMANCE OF WIND TURBINE 5.1 Introduction The development of modern airfoil, for their use in wind turbines was initiated in the year 1980. The requirements
Proportion of the vehicle fleet meeting certain emission standards
 The rate of penetration of new technologies is highly correlated with the average life-time of vehicles and the average age of the fleet. Estimates based on the numbers of cars fitted with catalytic converter
TRAFFIC SIMULATION IN REGIONAL MODELING: APPLICATION TO THE INTERSTATEE INFRASTRUCTURE NEAR THE TOLEDO SEA PORT
 MICHIGAN OHIO UNIVERSITY TRANSPORTATION CENTER Alternate energy and system mobility to stimulate economic development. Report No: MIOH UTC TS41p1-2 2012-Final TRAFFIC SIMULATION IN REGIONAL MODELING: APPLICATION
Transverse Distribution Calculation and Analysis of Strengthened Yingjing Bridge
 Modern Applied Science; Vol. 8, No. 3; 4 ISSN 93-844 E-ISSN 93-85 Published by Canadian Center of Science and Education Transverse Distribution Calculation and Analysis of Strengthened Yingjing Bridge
GIBRALTAR ERDF OPERATIONAL PROGRAMME POST ADOPTION STATEMENT
 Intended for Government of Gibraltar Document type Report Date January 2015 GIBRALTAR ERDF OPERATIONAL PROGRAMME 2014-2020 POST ADOPTION STATEMENT GIBRALTAR ERDF OPERATIONAL PROGRAMME 2014-2020 POST ADOPTION
Hydraulic Drive Head Performance Curves For Prediction of Helical Pile Capacity
 Hydraulic Drive Head Performance Curves For Prediction of Helical Pile Capacity Don Deardorff, P.E. Senior Application Engineer Abstract Helical piles often rely on the final installation torque for ultimate
Abstract. 1. Introduction. 1.1 object. Road safety data: collection and analysis for target setting and monitoring performances and progress
 Road Traffic Accident Involvement Rate by Accident and Violation Records: New Methodology for Driver Education Based on Integrated Road Traffic Accident Database Yasushi Nishida National Research Institute
Overburden drilling catalogue
 Atlas Copco Ground Engineering Products Overburden catalogue Symmetrix overburden systems Overburden Drilling Catalogue Atlas Copco Overburden Drilling System... 3 The Symmetrix System... 4 Drilling overburden...
PASSING ABILITY OF SCC IMPROVED METHOD BASED ON THE P-RING
 PASSING ABILITY OF SCC IMPROVED METHOD BASED ON THE P-RING K D Chan*, Leppo Concrete Sdn Bhd, Malaysia K C G Ong, National University of Singapore, Singapore C T Tam, National University of Singapore,
Accelerating the Development of Expandable Liner Hanger Systems using Abaqus
 Accelerating the Development of Expandable Liner Hanger Systems using Abaqus Ganesh Nanaware, Tony Foster, Leo Gomez Baker Hughes Incorporated Abstract: Developing an expandable liner hanger system for
ALTERNATIVE SYSTEMS FOR ROAD SURFACE CPX MEASUREMENTS
 ALTERNATIVE SYSTEMS FOR ROAD SURFACE CPX MEASUREMENTS Stephen Chiles NZ Transport Agency, Wellington, New Zealand Email: stephen.chiles@nzta.govt.nz Abstract Road surface noise can be measured by microphones
AIR POLLUTION AND ENERGY EFFICIENCY. Mandatory reporting of attained EEDI values. Submitted by Japan, Norway, ICS, BIMCO, CLIA, IPTA and WSC SUMMARY
 E MARINE ENVIRONMENT PROTECTION COMMITTEE 73rd session Agenda item 5 MEPC 73/5/5 9 August 2018 Original: ENGLISH AIR POLLUTION AND ENERGY EFFICIENCY Mandatory reporting of attained EEDI values Submitted
A Cost Benefit Analysis of Faster Transmission System Protection Schemes and Ground Grid Design
 A Cost Benefit Analysis of Faster Transmission System Protection Schemes and Ground Grid Design Presented at the 2018 Transmission and Substation Design and Operation Symposium Revision presented at the
Reduction of vehicle noise at lower speeds due to a porous open-graded asphalt pavement
 Reduction of vehicle noise at lower speeds due to a porous open-graded asphalt pavement Paul Donavan 1 1 Illingworth & Rodkin, Inc., USA ABSTRACT Vehicle noise measurements were made on an arterial roadway
A REPORT ON THE STATISTICAL CHARACTERISTICS of the Highlands Ability Battery CD
 A REPORT ON THE STATISTICAL CHARACTERISTICS of the Highlands Ability Battery CD Prepared by F. Jay Breyer Jonathan Katz Michael Duran November 21, 2002 TABLE OF CONTENTS Introduction... 1 Data Determination
Transmission Error in Screw Compressor Rotors
 Purdue University Purdue e-pubs International Compressor Engineering Conference School of Mechanical Engineering 2008 Transmission Error in Screw Compressor Rotors Jack Sauls Trane Follow this and additional
Adaptive Power Flow Method for Distribution Systems With Dispersed Generation
 822 IEEE TRANSACTIONS ON POWER DELIVERY, VOL. 17, NO. 3, JULY 2002 Adaptive Power Flow Method for Distribution Systems With Dispersed Generation Y. Zhu and K. Tomsovic Abstract Recently, there has been
POTENTIALITY OF INTRODUCING ABSORPTION CHILLER SYSTEMS TO IMPROVE THE DIESEL POWER PLANT PERFORMANCE IN SRI LANKA A
 POTENTIALITY OF INTRODUCING ABSORPTION CHILLER SYSTEMS TO IMPROVE THE DIESEL POWER PLANT PERFORMANCE IN SRI LANKA MTN Albert Master of Engineering 118351A Department of Mechanical Engineering University
DRIVER SPEED COMPLIANCE WITHIN SCHOOL ZONES AND EFFECTS OF 40 PAINTED SPEED LIMIT ON DRIVER SPEED BEHAVIOURS Tony Radalj Main Roads Western Australia
 DRIVER SPEED COMPLIANCE WITHIN SCHOOL ZONES AND EFFECTS OF 4 PAINTED SPEED LIMIT ON DRIVER SPEED BEHAVIOURS Tony Radalj Main Roads Western Australia ABSTRACT Two speed surveys were conducted on nineteen
June Safety Measurement System Changes
 June 2012 Safety Measurement System Changes The Federal Motor Carrier Safety Administration s (FMCSA) Safety Measurement System (SMS) quantifies the on-road safety performance and compliance history of
STIFFNESS CHARACTERISTICS OF MAIN BEARINGS FOUNDATION OF MARINE ENGINE
 Journal of KONES Powertrain and Transport, Vol. 23, No. 1 2016 STIFFNESS CHARACTERISTICS OF MAIN BEARINGS FOUNDATION OF MARINE ENGINE Lech Murawski Gdynia Maritime University, Faculty of Marine Engineering
MARINE FOUR-STROKE DIESEL ENGINE CRANKSHAFT MAIN BEARING OIL FILM LUBRICATION CHARACTERISTIC ANALYSIS
 POLISH MARITIME RESEARCH Special Issue 2018 S2 (98) 2018 Vol. 25; pp. 30-34 10.2478/pomr-2018-0070 MARINE FOUR-STROKE DIESEL ENGINE CRANKSHAFT MAIN BEARING OIL FILM LUBRICATION CHARACTERISTIC ANALYSIS
1962: HRCS Circular 482 one-page document, specified vehicle mass, impact speed, and approach angle for crash tests.
 1 2 3 1962: HRCS Circular 482 one-page document, specified vehicle mass, impact speed, and approach angle for crash tests. 1973: NCHRP Report 153 16-page document, based on technical input from 70+ individuals
Cost Benefit Analysis of Faster Transmission System Protection Systems
 Cost Benefit Analysis of Faster Transmission System Protection Systems Presented at the 71st Annual Conference for Protective Engineers Brian Ehsani, Black & Veatch Jason Hulme, Black & Veatch Abstract
1. INTRODUCTION 3 2. COST COMPONENTS 17
 CONTENTS - i TABLE OF CONTENTS PART I BACKGROUND 1. INTRODUCTION 3 1.1. JUSTIFICATION OF MACHINERY 4 1.2. MANAGERIAL APPROACH 5 1.3. MACHINERY MANAGEMENT 5 1.4. THE MECHANICAL SIDE 6 1.5. AN ECONOMICAL
LESSON Transmission of Power Introduction
 LESSON 3 3.0 Transmission of Power 3.0.1 Introduction Earlier in our previous course units in Agricultural and Biosystems Engineering, we introduced ourselves to the concept of support and process systems
Motorcoach Census. A Study of the Size and Activity of the Motorcoach Industry in the United States and Canada in 2015
 Motorcoach Census A Study of the Size and Activity of the Motorcoach Industry in the United States and Canada in 2015 Prepared for the American Bus Association Foundation by John Dunham & Associates October
SUBSIDIARY BODY FOR SCIENTIFIC AND TECHNOLOGICAL ADVICE Fourteenth session Bonn, July 2001 Item 3 (b) of the provisional agenda
 of the provisional agenda") UNITED NATIONS Distr. GENERAL 11 July 2001 ENGLISH ONLY SUBSIDIARY BODY FOR SCIENTIFIC AND TECHNOLOGICAL ADVICE Fourteenth session Bonn, 16-27 July 2001 Item 3 (b) of the provisional agenda REPORTS ON
UNITED NATIONS Distr. GENERAL 11 July 2001 ENGLISH ONLY SUBSIDIARY BODY FOR SCIENTIFIC AND TECHNOLOGICAL ADVICE Fourteenth session Bonn, 16-27 July 2001 Item 3 (b) of the provisional agenda REPORTS ON
Transportation Statistical Data Development Report BAY COUNTY 2035 LONG RANGE TRANSPORTATION PLAN
 Transportation Statistical Data Development Report BAY COUNTY 2035 LONG RANGE TRANSPORTATION PLAN Prepared for Bay County Transportation Planning Organization and The Florida Department of Transportation,
DIRECT TORQUE CONTROL OF A THREE PHASE INDUCTION MOTOR USING HYBRID CONTROLLER. RAJESHWARI JADI (Reg.No: M070105EE)
") DIRECT TORQUE CONTROL OF A THREE PHASE INDUCTION MOTOR USING HYBRID CONTROLLER A THESIS Submitted by RAJESHWARI JADI (Reg.No: M070105EE) In partial fulfillment for the award of the Degree of MASTER OF
DIRECT TORQUE CONTROL OF A THREE PHASE INDUCTION MOTOR USING HYBRID CONTROLLER A THESIS Submitted by RAJESHWARI JADI (Reg.No: M070105EE) In partial fulfillment for the award of the Degree of MASTER OF
Dynamic characteristics of railway concrete sleepers using impact excitation techniques and model analysis
 Dynamic characteristics of railway concrete sleepers using impact excitation techniques and model analysis Akira Aikawa *, Fumihiro Urakawa *, Kazuhisa Abe **, Akira Namura * * Railway Technical Research
PROCEDURES FOR ESTIMATING THE TOTAL LOAD EXPERIENCE OF A HIGHWAY AS CONTRIBUTED BY CARGO VEHICLES
 PROCEDURES FOR ESTIMATING THE TOTAL LOAD EXPERIENCE OF A HIGHWAY AS CONTRIBUTED BY CARGO VEHICLES SUMMARY REPORT of Research Report 131-2F Research Study Number 2-10-68-131 A Cooperative Research Program
By Edmund Hughes, Technical Officer, Marine Environment Division, IMO
 A new chapter for MARPOL Annex VI requirements for technical and operational measures to improve the energy efficiency of international shipping By Edmund Hughes, Technical Officer, Marine Environment
A Recommended Approach to Pipe Stress Analysis to Avoid Compressor Piping Integrity Risk
 A Recommended Approach to Pipe Stress Analysis to Avoid Compressor Piping Integrity Risk by: Kelly Eberle, P.Eng. Beta Machinery Analysis Calgary, AB Canada keberle@betamachinery.com keywords: reciprocating
Sepulveda Pass Corridor Systems Planning Study Final Compendium Report. Connecting the San Fernando Valley and the Westside
 Los Angeles County Metropolitan Transportation Authority November 2012 Connecting the San Fernando Valley and the Westside Interstate 405 Sepulveda Pass THIS PAGE INTENTIONALLY LEFT BLANK Sepulveda Pass
COUNCIL OF THE EUROPEAN UNION. Brussels, 11 December /3/06 REV 3 ADD 1. Interinstitutional File: 2003/ 0153(COD) ENT 84 CODEC 561
 ENT 84 CODEC 561") COUNCIL OF THE EUROPEAN UNION Brussels, 11 December 2006 Interinstitutional File: 2003/ 0153(COD) 9911/3/06 REV 3 ADD 1 T 84 CODEC 561 STATEMT OF THE COUNCIL'S REASONS Subject : Common Position adopted
COUNCIL OF THE EUROPEAN UNION Brussels, 11 December 2006 Interinstitutional File: 2003/ 0153(COD) 9911/3/06 REV 3 ADD 1 T 84 CODEC 561 STATEMT OF THE COUNCIL'S REASONS Subject : Common Position adopted
The Evolution of Side Crash Compatibility Between Cars, Light Trucks and Vans
 2003-01-0899 The Evolution of Side Crash Compatibility Between Cars, Light Trucks and Vans Hampton C. Gabler Rowan University Copyright 2003 SAE International ABSTRACT Several research studies have concluded
Mr. Kyle Zimmerman, PE, CFM, PTOE County Engineer
 Los Alamos County Engineering Division 1925 Trinity Drive, Suite B Los Alamos, NM 87544 Attention: County Engineer Dear Kyle: Re: NM 502 Transportation Corridor Study and Plan Peer Review Los Alamos, New
Turbo boost. ACTUS is ABB s new simulation software for large turbocharged combustion engines
 Turbo boost ACTUS is ABB s new simulation software for large turbocharged combustion engines THOMAS BÖHME, ROMAN MÖLLER, HERVÉ MARTIN The performance of turbocharged combustion engines depends heavily
ASTM D4169 Truck Profile Update Rationale Revision Date: September 22, 2016
 Over the past 10 to 15 years, many truck measurement studies have been performed characterizing various over the road environment(s) and much of the truck measurement data is available in the public domain.
345. Fellenius, B.H., Plugging effect of opentoe pipe piles in sandy soil. Discussion. Canadian Geotechnical Journal 52(5):
:") 345. Fellenius, B.H., 215. Plugging effect of opentoe pipe piles in sandy soil. Discussion. Canadian Geotechnical Journal 52(5): 664-667.. Fellenius 215 [Canadian Geotechnical Journal 52(5) 664-667] Plugging
345. Fellenius, B.H., 215. Plugging effect of opentoe pipe piles in sandy soil. Discussion. Canadian Geotechnical Journal 52(5): 664-667.. Fellenius 215 [Canadian Geotechnical Journal 52(5) 664-667] Plugging
ST. VINCENT AND THE GRENADINES
 ST. VINCENT AND THE GRENADINES MARITIME ADMINISTRATION CIRCULAR N POL 022 FUEL OIL CONSUMPTION DATA COLLECTION SYSTEM Amendments to MARPOL Annex VI, MEPC.278(70) TO: APPLICABLE TO: EFFECTIVE AS FROM: SHIPOWNERS,
EXECUTIVE SUMMARY. The following is an outline of the traffic analysis performed by Hales Engineering for the traffic conditions of this project.
 EXECUTIVE SUMMARY This study addresses the traffic impacts associated with the proposed Shopko redevelopment located in Sugarhouse, Utah. The Shopko redevelopment project is located between 1300 East and
SOCIO-ECONOMIC and LAND USE DATA
 SOCIO-ECONOMIC and LAND USE DATA FUTURE CONDITIONS January CHATHAM URBAN TRANSPORTATION STUDY - 1 - Table of Contents Introduction 3 TAZ - Municipality - Map Index...8 2005 Socio-economic and Land Use