The Fundamental Law of Highway Congestion: Evidence from the US
|
|
|
- Tyler Hoover
- 6 years ago
- Views:
Transcription

1 The Fundamental Law of Highway Congestion: Evidence from the US Gilles Duranton and Matthew A. Turner
2 Objective Assess the effects of transportation infrastructure, roads and public transit in particular, on the total vehicle kilometers travelled.
3 Main results The fundamental law of highway congestion (Downs, 1962, 1992): Elasticity of highway VKT to highway lane kilometers is close to one. Because more highways lead to: More individual driving. Relocations. More commercial driving. The demand for highway VKT is flat.
4 Transportation is important #1 Very significant resources allocated to personal transportation: American household were spending 162 person minutes in passenger vehicles in % increase since 1995
5 Transportation is important #2 Numerous claims by advocacy groups: American Road and Transport Builders Association adding highway capacity is key to helping to reduce traffic congestion. American Public Transit Association without new investment in public transit, highways will become so congested that they will no longer work.
6 Transportation is important #3 Road transport is a major source of carbon emission. The effects of changes in the road infrastructure need to be assessed in this light.
7 Related literature Long tradition of analysis at the facility level (Jorgensen, 1947) Some work at the area level (Hansen and Huang, 1997, Fulton, Noland, Meszler, and Thomas, 2000, Noland, 2001, Cervero and Hansen, 2002, Cervero, 2003) Existing analysis at the area level differ in their findings and face three problems: Data: coverage and resolution Identification Interpretation and welfare
8 Theory
9 P AC(K) P AC(K ) 0 I I VKT Figure 1. Equilibrium VKT.
10 Determined at the city level AC(.) is an upward-sloping supply curve Shifts to the right with higher capacities Demand has 3 main components Equilibrium likely to be suboptimal Objective: estimate ρk I Meaning of a unitary elasticity
11 Traffic in US MSAs
12 Table 1. Summary statistics for our main HPMS variables (averaged over MSAs). ear: Mean daily VKT (highways, 000 km) 5,020 8,093 10,745 (10,705) (16,229) (20,709) Mean daily VKT (all major roads, 000 km) 11,644 15,531 (25,091) (32,156) Mean AADT (highways) 4,828 7,194 9,409 (2,699) (3,386) (4,080) Mean AADT (all major roads) 6,048 7,805 (2,801) (3,537) Mean lane km (highways) (1,066) (1,160) (1,220) Mean lane km (all major roads) 1,387 1,465 (1,931) (2,023) Mean lane km (highways, per 10,000 pop) (15.4) (13.3) (11.8) Mean lane km (all major roads, per 10,000 pop) (21.4) (19.1) Number MSAs
13 The elasticity of VKT to lane kilometers
14 Table 2. Interstate and Major Road VKT as a function of lane kilometers, OLS. Interstate VKT Major Road VKT ear: [1] [2] [3] [4] [5] [6] [7] [8] [9] [10] [11] [12] [13] [14] ln(lane km) 1.26 a 0.91 a 0.92 a 0.89 a 1.27 a 0.67 a 0.71 a 0.70 a 1.24 a 0.64 a 0.69 a 0.70 a 0.58 a 0.54 a (0.04) (0.06) (0.06) (0.06) (0.02) (0.05) (0.04) (0.04) (0.02) (0.05) (0.04) (0.04) (0.05) (0.05) ln(pop) 0.44 a 0.43 a 1.03 a 0.58 a 0.54 a 0.50 b 0.57 a 0.52 a a 0.49 (0.04) (0.05) (0.37) (0.04) (0.04) (0.25) (0.04) (0.04) (0.32) (0.22) (0.34) Elev. range (0.06) (0.05) (0.05) (0.05) (0.05) (0.05) (0.04) (0.04) Ruggedness 6.25 c b c (3.38) (3.18) (2.78) (2.95) (2.78) (3.02) (2.41) (2.75) Heating d.d a a a a a a a a (0.00) (0.00) (0.00) (0.00) (0.00) (0.00) (0.00) (0.00) Cooling d.d c b a b a a a a (0.01) (0.01) (0.01) (0.01) (0.01) (0.01) (0.01) (0.01) Sprawl c c c (0.00) (0.00) (0.00) (0.00) (0.00) (0.00) (0.00) (0.00) Census div. Hist. pop. Socio-econ. char. R All regressions include a constant. Robust standard errors in parentheses. 228 observations for each regression. a, b, c: significant at 1%, 5%, 10%.
15 Table 3. Change in Interstate and Major Road VKT as a function of change in lane kilometers, OLS. Interstate VKT Major Road VKT Period: 93/83 93/83 93/83 93/83 93/83 03/93 03/93 03/93 03/93 03/93 03/93 03/93 [1] [2] [3] [4] [5] [6] [7] [8] [9] [10] [11] [12] 93/83 ln(lane km) 1.09 a 1.03 a 1.09 a 1.08 a 0.85 a (0.06) (0.05) (0.06) (0.06) (0.08) 90/80 ln(pop) 0.42 b 0.51 a 0.61 b 0.71 b 0.94 a (0.18) (0.16) (0.24) (0.30) (0.30) ln(vkt 1983) a a (0.02) (0.05) 03/93 ln(lane km) 0.84 a 0.79 a 0.81 a 0.80 a 0.79 a (0.13) (0.13) (0.13) (0.13) (0.12) 00/90 ln(pop) 0.35 a 0.39 a 0.32 b 0.45 b 0.46 b 0.46 a 0.43 b (0.10) (0.10) (0.14) (0.20) (0.20) (0.08) (0.17) ln(vkt 1993) a (0.01) (0.03) 03/93 ln(lane km MR) 0.71 a 0.72 a (0.10) (0.11) Geography Census div. Socio-econ. char. Hist. Pop. N R All regressions include a constant. Robust standard errors in parentheses.
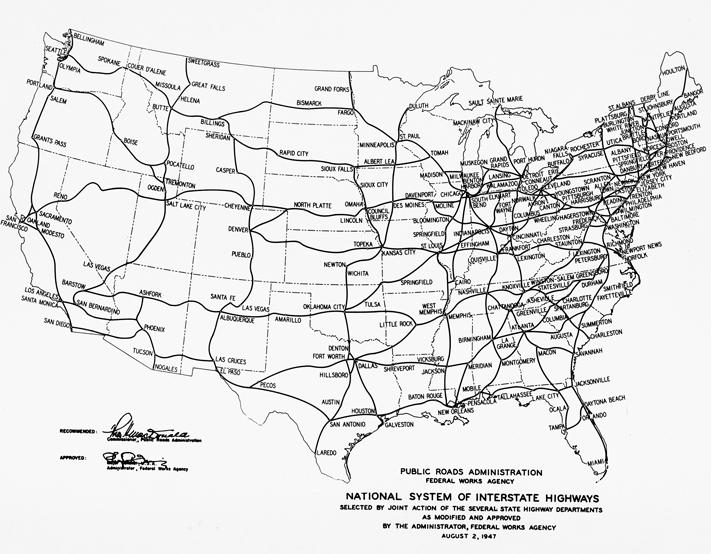
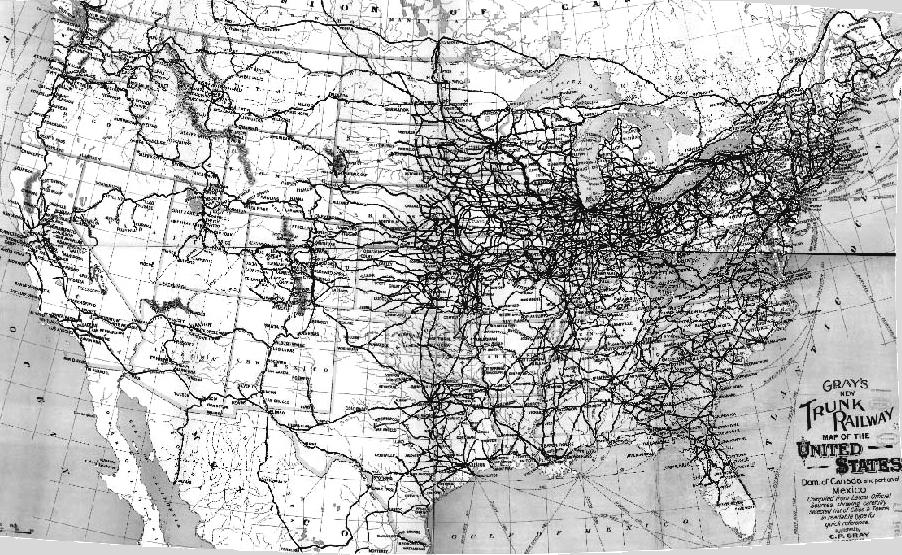
16 Possible simultaneity of lane kilometers and VKT Estimate: ln(i i ) = A 0 + ρ I K ln(k i ) + A 2 X i + ɛ i (1) ln(k i ) = B 0 + B 1 X i + B 2 Z i + µ i. (2) where Z = {log km of 1947 planned interstate highways, log km of 1898 railroads}
17
18
19 Relevance Old railroads and planned interstates predict contemporaneous interstates (Duranton and Turner, 2008)
20 Table 4. First stage: Interstate and Major Road km as a function of 1947 highway and 1898 rail, OLS. Interstate VKT Major Road VKT ear: [1] [2] [3] [4] [5] [6] [7] [8] [9] [10] [11] [12] [13] [14] ln(1898 rail) 0.21 b b c b b (0.09) (0.05) (0.06) (0.07) (0.10) (0.04) (0.04) (0.06) (0.10) (0.04) (0.04) (0.06) (0.04) (0.05) ln(1947 hwy) 0.30 a 0.20 a 0.16 a 0.16 a 0.29 a 0.14 a 0.11 a 0.11 a 0.29 a 0.14 a 0.12 a 0.15 a a a (0.04) (0.04) (0.04) (0.04) (0.04) (0.03) (0.03) (0.03) (0.04) (0.03) (0.03) (0.03) (0.02) (0.02) ln(pop) 0.45 a 0.55 a 1.34 a 0.55 a 0.64 a a 0.62 a (0.05) (0.05) (0.44) (0.03) (0.04) (0.41) (0.03) (0.04) (0.64) (0.35) (0.60) Geography Census div. Hist. pop. R Partial R First-stage F All regressions include a constant. Robust standard errors in parentheses. 228 observations for each regression. a, b, c: significant at 1%, 5%, 10%.
21 Exogeneity of planned interstates The 1947 Interstate plan was drawn: To accommodate traffic between cities (and not within) for post-war America (and not forward-looking). Planned interstate km were proportional to 1947 population. Other city correlates at the origin of the 1947 plan that may drive contemporaneous traffic? Appropriate controls needed: geography and historical population
22 Exogeneity of old railroads 19th century railroads were built: In a very different economy, For short-run profit. Controls also matter Two instruments with a different rationale allow for meaningful overidentification tests.
23 Table 5. Interstate and Major Road VKT as a function of lane kilometers, TSLS. Interstate VKT Major Road VKT ear: [1] [2] [3] [4] [5] [6] [7] [8] [9] [10] [11] [12] [13] [14] ln(lane km) 1.41 a 1.10 a 1.20 a 1.22 a 1.35 a 0.99 a 1.16 a 1.15 a 1.27 a 0.83 a 0.95 a 0.99 a 1.07 a 0.96 a (0.04) (0.10) (0.12) (0.13) (0.05) (0.14) (0.18) (0.17) (0.05) (0.11) (0.13) (0.13) (0.23) (0.21) ln(pop) 0.32 a 0.22 b a a 0.32 a b 0.75 (0.07) (0.10) (0.44) (0.10) (0.14) (0.36) (0.08) (0.10) (0.38) (0.30) (0.47) Elev. range c (0.07) (0.07) (0.07) (0.06) (0.05) (0.05) (0.06) (0.05) Ruggedness 7.92 c 6.89 c 7.07 c c b 5.58 (4.12) (3.99) (3.79) (3.55) (3.27) (3.31) (3.67) (3.55) Heating d.d a a a a a a a a (0.01) (0.01) (0.00) (0.00) (0.00) (0.00) (0.00) (0.00) Cooling d.d b b b a b a a a (0.01) (0.01) (0.01) (0.01) (0.01) (0.01) (0.01) (0.01) Sprawl (0.00) (0.00) (0.00) (0.00) (0.00) (0.00) (0.00) (0.00) Census div. Hist. pop. Overid First stage F All regressions include a constant.robust standard errors in parentheses. 228 observations for each regression. a, b, c: significant at 1%, 5%, 10%. Instruments are ln(1947 planned interstate km) and ln(1898 railroad km).
24 Where does all the traffic come from?
25 Table 6. Summary statistics for our main NPTS variables (averaged over individuals or hh). ear: NPTS vehicle survey Mean vehicle km (person) 12,435 12,202 (7,737) (8,398) Mean vehicle km (HH) 32,546 (19,672) 30,352 (20,198) Mean vehicle km (vehicle) 19,560 (9,355) 17,573 (9,030) NPTS person survey Minutes drive to work 22.4 (17.3) 21.3 (16.3) Distance to work (km) 20.4 (21.6) 19.4 (20.2) Speed to work (21.1) (22.1) NPTS trip survey Total HH km (119.9) (160.9) Total HH minutes (132.7) (133.9) Mean HH km/h 48.4 (12.2) 43.9 (15.1) Number MSAs
26 Table 7. Individual travel as a function of lane kilometers, OLS. Commute Distance HH Daily VKT HH Annual VKT [1] [2] [3] [4] [5] [6] [7] [8] [9] 1995: ln(lane km 1995) a a c 0.24 a 0.25 a 0.16 a 0.48 a 0.39 a 0.24 a (0.02) (0.02) (0.02) (0.07) (0.08) (0.03) (0.11) (0.10) (0.05) ln(pop. 1990) a b b a a a 0.46 (0.02) (0.02) (0.16) (0.06) (0.06) (0.24) (0.09) (0.08) (0.32) N R : ln(lane km 2001) 0.10 a 0.11 a a (0.03) (0.03) (0.02) (0.04) (0.03) (0.03) (0.05) (0.03) (0.03) ln(pop. 2000) b (0.02) (0.02) (0.09) (0.03) (0.03) (0.12) (0.04) (0.03) (0.14) N R Other controls: Sample demographics Geography Census div. Hist. Pop. All regressions include a constant. Standard errors in parentheses, clustered by MSA. a, b, c: significant at 1%, 5%, 10%.
27 Table 8. Changes in VKT, roads, and traffic as a function of their initial level, OLS. Change in Change in Change in VKT lane km daily traffic Period: Roads: I I MR I I MR I I MR [1] [2] [3] [4] [5] [6] [7] [8] [9] Initial level a a b a b (0.06) (0.01) (0.01) (0.09) (0.01) (0.01) (0.03) (0.04) (0.01) R I denotes Interstates and MR all major roads. All regressions include a constant. Robust standard errors in parentheses. 228 observations for each regression. a, b, c: significant at 1%, 5%, 10%.
28 Table 9. Conditional convergence in daily traffic. Change in daily traffic Period: Roads: I I MR I I MR I I MR [1] [2] [3] [4] [5] [6] [7] [8] [9] OLS OLS OLS OLS OLS OLS TSLS TSLS TSLS Initial level a a b a a b a a c (0.03) (0.04) (0.01) (0.03) (0.04) (0.02) (0.03) (0.06) (0.03) ln(pop) 0.40 a 0.74 a 0.35 a 0.58 a 0.95 a 0.43 a 0.92 b 2.44 b 0.96 (0.13) (0.18) (0.09) (0.16) (0.22) (0.11) (0.42) (1.21) (0.60) Geography Census div. Initial Share Manuf. R 2 First stage F I denotes Interstates and MR all major roads. All regressions include a constant. Robust standard errors in parentheses. 228 observations for each regression. a, b, c: significant at 1%, 5%, 10%. Instrument is expected population growth based on initial composition of economic activity.
29 Table 10. log MSA share of trucking and warehousing employment as a function of log lane kilometers OLS OLS OLS TSLS OLS OLS OLS TSLS OLS OLS OLS TSLS [1] [2] [3] [4] [5] [6] [7] [8] [9] [10] [11] [12] ln(lane km) 0.12 a 0.12 b 0.13 b a 0.24 a 0.20 b a 0.14 b 0.15 b 0.24 (0.05) (0.05) (0.05) (0.19) (0.08) (0.08) (0.09) (0.25) (0.06) (0.06) (0.07) (0.17) ln(pop.) 1.00 a 1.02 a 1.54 a 1.50 a 0.87 a 0.89 a 1.13 b 1.18 a 0.88 a 0.91 a 2.93 a 2.93 a (0.04) (0.05) (0.43) (0.43) (0.06) (0.08) (0.45) (0.44) (0.04) (0.06) (0.64) (0.60) Geography Census div. Socio-econ. char. Hist. pop. R Overid First-stage F All regressions include a constant. Robust standard errors in parentheses. 228 observations for each regression. a, b, c: significant at 1%, 5%, 10%. Instruments are ln(1947 planned interstate km) and ln(1898 railroad km).
30 Table truck interstate VKT as a function of lane kilometers. OLS OLS OLS OLS TSLS TSLS [1] [2] [3] [4] [5] [6] ln(lane km) 1.19 a 0.90 a 0.91 a 0.78 a 1.54 a 1.73 a (0.05) (0.14) (0.16) (0.16) (0.30) (0.48) ln(pop) 0.27 b 0.26 c (0.13) (0.15) (1.98) (0.26) (1.97) R Overid First stage F All regressions include a constant. Robust standard errors in parentheses. 86 observations for each regression. a, b, c: significant at 1%, 5%, 10%. Instruments are ln(1947 planned interstate km) and ln(1898 railroad km).
31 Will public transport help reduce VKT?
32 Table 12. Interstate and Major road VKT as a function of lane kilometers and bus service OLS OLS OLS LIML OLS OLS OLS LIML OLS OLS OLS LIML [1] [2] [3] [4] [5] [6] [7] [8] [9] [10] [11] [12] Interstates: ln(lane km) 0.91 a 0.93 a 0.90 a 1.29 a 0.67 a 0.71 a 0.72 a 1.14 a 0.64 a 0.69 a 0.70 a 1.00 a (0.06) (0.06) (0.06) (0.17) (0.05) (0.05) (0.04) (0.15) (0.05) (0.04) (0.04) (0.14) ln(max bus) b b c b 0.17 c c (0.02) (0.02) (0.03) (0.15) (0.02) (0.02) (0.02) (0.10) (0.02) (0.03) (0.03) (0.12) ln(pop) 0.35 a 1.03 a a 0.43 c a (0.07) (0.36) (0.53) (0.05) (0.25) (0.39) (0.06) (0.33) (0.44) R Overid Kleibergen-Paap All Major Roads: ln(lane km) 0.54 a 0.58 a 0.59 a 1.11 a 0.49 a 0.53 a 0.56 a 1.03 a (0.05) (0.05) (0.05) (0.22) (0.05) (0.05) (0.05) (0.23) ln(max bus) (0.01) (0.01) (0.01) (0.07) (0.02) (0.02) (0.02) (0.09) ln(pop) 0.50 a 0.89 a 0.49 c 0.54 a (0.05) (0.20) (0.39) (0.29) (0.34) (0.48) R Overid Kleibergen-Paap Other controls: Geography Census div. Socio-econ. char. Hist. pop. All regressions include a constant. Robust standard errors in parentheses. 228 observations for each regression. a, b, c: significant at 1%, 5%, 10%. Instruments are ln(1947 planned interstate km), ln(1898 railroad km), and 1972 share democratic vote.
33 Welfare implications
34 P AC(K) AC(K ) P(I) P(I ) 0 I I VKT Figure 2. Second best surplus from change in VKT.
35 Assume: K = 1.01K ρ P(I) K Then = log P(I) log K I (1 + ρk I /100)I ( P(I ) 1 + ρ P(I) ) K /100 P(I) Change in Welfare: W I I + I 2 ( = [ 1 + ρi K 200 ] P(I) P(I ) ) I ρp(i) K P(I). 100
36 Using: ρ P(I) K = ρ P(I) I ρk I Marginal highway welfare gain associated with an additional lane kilometer of highway: w I ρ P(I) I ρ I K P(I) ( 1 + ρi K 200 ) I K.
37 More highway km also affect driving on other roads: ( ) w O ρ P(O) I ρk I P(O) 1 + ρo K O 200 K, Total marginal welfare gain from an additional lane kilometer of highway: w = w I + w O.
38 Too many terms cannot be estimated. But an upper bound for w is available: Assume ρ I K > ρo K From the data: O 3 I P(R) [3P(O) + P(I)] /4 ρ P(R) ( I 3ρ P(O) I + ρ P(I) ) I /4 Assume P(O) > P(I) Assume ρ P(I) I > ρ P(O) I ( ) w < ρk I 4I 1 + ρi K K 200 ( P(R) ρ P(R) ) I. With ρ I K = 1: ( w < 4.02AADT P(R) ρ P(R) ) I.
39 Computing P(R) Time-in-vehicle and vehicle-operating costs: For TC(R): ρ P(R) I P(R) ρ TC(R) I TC(R) + ρ VOC(R) I VOC(R), Hours per kilometer for each MSA from NPTS MSA household income from census data Hours worked per household from the ATUS Ajustment factor of 50% and inflation to get 2008 figures Median MSA value: h/km $/h adjusted by 50% factor and inflation: $ 0.26 per km
40 Very small effects Vehicle operating costs
41 Table 13. Time cost of traffic as a function of MSA VKT. Dependent variable: ln(hours per km) for commutes [1] [2] [3] [4] [5] [6] [7] [8] [9] [10] [11] [12] OLS OLS OLS OLS TSLS TSLS TSLS TSLS OLS OLS TSLS TSLS 1995: ln(i VKT) c c a (0.01) (0.03) (0.03) (0.03) (0.02) (0.05) (0.05) (0.06) ln(mr VKT) c c (0.01) (0.04) (0.02) (0.10) R Overid First-stage F : ln(i VKT) c b b b b (0.01) (0.02) (0.02) (0.02) (0.01) (0.04) (0.04) (0.05) ln(mr VKT) b a (0.01) (0.03) (0.02) (0.07) R Overid First-stage F Other controls: Person charac. Current pop. Geography Census div. Hist. pop. Socio-econ. char. I denotes Interstates and MR all major roads. All regressions include a constant. Robust standard errors in parentheses. 225 observations for 1995 and 227 for a, b, c: significant at 1%, 5%, 10%.
42 Baseline value: ρ TC(R) I = 0.04
43 Calculations and highway costs MSA mean for the upper bound of w: $ 152,000 per year Lowest values < $30,000 (Great Falls MT, Casper W, Lawton OK) Highest values > $400,000 (Chicago, Miami, DC, San Francisco, West Palm Beach) Costs: Maintenance: $100,000 per lane km year (Duranton and Turner, 2008) Construction: between m$ 3.64 and m$ per lane km depending on city size (Ng and Small, 2008) Cost of capital 5% Mean MSA annual cost: $ 419,000
44 Sensitivity: With ρ TC(R) I = 0.08, Upper bound w - costs = 116,000 Only 30 MSAs with a positive difference With ρ TC(R) I = 0.12, Upper bound w - costs 0
45 Conclusions Fundamental law of traffic congestion: ρk I 1 Because more capacity leads to More individual driving In-migration More commercial driving Public transportation provides no relief The demand for VKT is quite flat: Congestion needs to be priced
46 References Cervero, Robert Road expansion, urban growth, and induced travel: A path analysis. Journal of the American Planning Association 69(2): Cervero, Robert and Mark Hansen Induced travel demand and induced road investment: A simultaneous equation analysis. Journal of Transport Economics and Policy 36(3): Downs, Anthony The law of peak-hour express-way congestion. Traffic Quarterly 16(3): Downs, Anthony Stuck in Traffic: Coping With Peak-Hour Traffic Congestion. Washington D.C.: Brookings Institution Press. Duranton, Gilles and Matthew A. Turner Urban growth and transportation. Processed, University of Toronto.
47 Fulton, Lewis M., Robert B. Noland, Daniel J. Meszler, and John V. Thomas A statistical analysis of induced travel effects in the U.S. Mid-Atlantic region. Journal of Transportation Statistics 3(1):1 14. Hansen, Mark and uanlin Huang Road supply and traffic in California urban areas. Transportation Research A 21(3): Jorgensen, Roy E Influence of expressways in diverting traffic from alternate routes and in generating new traffic. Highway Research Board Proceedings, Traffic and Operations 27(0): Ng, Chen Feng and Kenneth A. Small Tradeoffs among free-flow speed, capcity, cost, and environmental footprint in highway designs. Processed, University of California at Irvine. Noland, Robert B Relationship between highway capacity and vehicle travel. Transportation Research A 35(1):47 72.
NEW YORK SUBURBAN RAIL SUMMARY (COMMUTER RAIL, REGIONAL RAIL)
") NEW YORK SUBURBAN RAIL SUMMARY (COMMUTER RAIL, REGIONAL RAIL) October 2003 New York: The New York commuter rail service area consists of 20.3 million people, spread over 4,700 square miles at an average
NEW YORK SUBURBAN RAIL SUMMARY (COMMUTER RAIL, REGIONAL RAIL) October 2003 New York: The New York commuter rail service area consists of 20.3 million people, spread over 4,700 square miles at an average
Japanese Facts on Car Demand & others
 Japanese Facts on Car Demand & others Tetsuro HYODO Professor, Tokyo University of Marine Science and Technology contact address Household (HH) Infrastructure Population more Total distance of expressway
THE WILSHIRE CORRIDOR: RAIL AND ITS ALTERNATIVES. Prepared By: Jacki Murdock Transportation and Environmental Planner
 THE WILSHIRE CORRIDOR: RAIL AND ITS ALTERNATIVES Prepared By: Jacki Murdock Transportation and Environmental Planner December 13 th, 2012 Overview Characteristics of Wilshire Boulevard Overview of the
Economy. 38% of GDP in 1970; 33% of GDP in 1998 Most significant decline in Manufacturing 47% to 29%
 Economy MCMA as important, but declining, force in national economy 38% of GDP in 1970; 33% of GDP in 1998 Most significant decline in Manufacturing 47% to 29% Relatively constant contribution of Financial
RIETI BBL Seminar Handout
 Research Institute of Economy, Trade and Industry (RIETI) RIETI BBL Seminar Handout Autonomous Vehicles, Infrastructure Policy, and Economic Growth September 25, 2018 Speaker: Clifford Winston https://www.rieti.go.jp/jp/index.html
2 VALUE PROPOSITION VALUE PROPOSITION DEVELOPMENT
 2 VALUE PROPOSITION The purpose of the Value Proposition is to define a number of metrics or interesting facts that clearly demonstrate the value of the existing Xpress system to external audiences including
UTA Transportation Equity Study and Staff Analysis. Board Workshop January 6, 2018
 UTA Transportation Equity Study and Staff Analysis Board Workshop January 6, 2018 1 Executive Summary UTA ranks DART 6 th out of top 20 Transit Agencies in the country for ridership. UTA Study confirms
Online Appendix for Subways, Strikes, and Slowdowns: The Impacts of Public Transit on Traffic Congestion
 Online Appendix for Subways, Strikes, and Slowdowns: The Impacts of Public Transit on Traffic Congestion ByMICHAELL.ANDERSON AI. Mathematical Appendix Distance to nearest bus line: Suppose that bus lines
EXPERIENCE IN A COMPANY-WIDE LONG DISTANCE CARPOOL PROGRAM IN SOUTH KOREA
 EXPERIENCE IN A COMPANY-WIDE LONG DISTANCE CARPOOL PROGRAM IN SOUTH KOREA JB s Social Club Presented at TRB 94th Annual Meeting on Jan 12, 2015 Louis Berger Kyeongsu Kim Land & Housing Institute (LHI)
Transit Fares for Multi-modal Transportation Systems
 Transit Fares for Multi-modal Transportation Systems Dr. Jeffrey M. Casello Associate Professor School of Planning Department of Civil and Environmental Engineering University of Waterloo Transport Futures
Parking Pricing As a TDM Strategy
 Parking Pricing As a TDM Strategy Wei-Shiuen Ng Postdoctoral Scholar Precourt Energy Efficiency Center Stanford University ACT Northern California Transportation Research Symposium April 30, 2015 Parking
PHILADELPHIA SUBURBAN RAIL SUMMARY (COMMUTER RAIL, REGIONAL RAIL)
") PHILADELPHIA SUBURBAN RAIL SUMMARY (COMMUTER RAIL, REGIONAL RAIL) October 2003 The Philadelphia commuter rail service area consists of 5.1 million people, spread over 1,800 square miles at an average population
PHILADELPHIA SUBURBAN RAIL SUMMARY (COMMUTER RAIL, REGIONAL RAIL) October 2003 The Philadelphia commuter rail service area consists of 5.1 million people, spread over 1,800 square miles at an average population
Sustainable Urban Transport Index (SUTI)
") Sustainable Urban Transport Index (SUTI) City Comparisons & Way Forward PROF. H.M SHIVANAND SWAMY, CEPT UNIVERSITY DHAKA SEPTEMBER 12, 2018 Purpose Discussion of Results from 5 Cities Reflections on the
Sustainable Urban Transport Index (SUTI) City Comparisons & Way Forward PROF. H.M SHIVANAND SWAMY, CEPT UNIVERSITY DHAKA SEPTEMBER 12, 2018 Purpose Discussion of Results from 5 Cities Reflections on the
Vehicle Miles Traveled in Massachusetts: Who is driving and where are they going?
 Vehicle Miles Traveled in Massachusetts: Who is driving and where are they going? A presentation to the House Committee on Global Warming and Climate Change Representative Frank Smizik, Chair April 13,
The USDOT Congestion Pricing Program: A New Era for Congestion Management
 The USDOT Congestion Pricing Program: A New Era for Congestion Management Patrick DeCorla-Souza, AICP Federal Highway Administration Presentation at Congestion Pricing Discovery Workshop Los Angeles, CA
The Environmental Benefits and Opportunity of Shared Mobility
 The Environmental Benefits and Opportunity of Shared Mobility Sharon Feigon Executive Director November 17, 2014 SUMC: Our Mission and Founders 2 Mission: Scale the Benefits of Shared Mobility for Everyone
The Truth About Light Trucks
 RISK Despite critics claims, SUVs are saving lives. The Truth About Light Trucks The american love affair with the automobile has grown to include the class of vehicles known as light trucks, which includes
Econ 5021 Macroeconomic Theory
 Econ 5021 Macroeconomic Theory Introduction Yin-Chi Wang The Chinese University of Hong Kong September 10, 2012 Yin-Chi Wang (CUHK) Econ 5021 Introduction September 10, 2012 1 / 30 Differences Across Countries
Still Stuck in traffic
 Still Stuck in traffic Traffic congestion is considered bad from many aspects. However, according to report from the Brookings Institution, peak hour traffic congestion plays an essential and positive
Travel Demand Modeling at NCTCOG
 Travel Demand Modeling at NCTCOG Arash Mirzaei North Central Texas Council Of Governments for Southern Methodist University The ASCE Student Chapter October 24, 2005 Contents NCTCOG DFW Regional Model
Presentation A Blue Slides 1-5.
 Presentation A Blue Slides 1-5. 1 Presentation A Blue Slides 1-5. 2 Presentation A Blue Slides 1-5. 3 Presentation A Blue Slides 1-5. 4 Presentation A Blue Slides 1-5. 5 Transit Service right. service
TRAFFIC IMPACT STUDY VICDOM BROCK ROAD PIT EXPANSION
 TRAFFIC IMPACT STUDY VICDOM BROCK ROAD PIT EXPANSION TOWNSHIP OF UXBRIDGE P/N 05-1993 June 2011 Revised -August 2011 Prepared by: Skelton, Brumwell & Associates Inc. 93 Bell Farm Road, Suite 107 Barrie,
2030 Multimodal Transportation Study
 2030 Multimodal Transportation Study City of Jacksonville Planning and Development Department Prepared by Ghyabi & Associates April 29,2010 Introduction Presentation Components 1. Study Basis 2. Study
Submission to Greater Cambridge City Deal
 What Transport for Cambridge? 2 1 Submission to Greater Cambridge City Deal By Professor Marcial Echenique OBE ScD RIBA RTPI and Jonathan Barker Introduction Cambridge Futures was founded in 1997 as a
Jeffrey Busby A/Director, Infrastructure Program Management TransLink Urban Sustainability Accelerator
 TransLink: A multi-modal, integrated transport and operations system Jeffrey Busby A/Director, Infrastructure Program Management TransLink Urban Sustainability Accelerator Is the Grass Greener? Transportation
Needs and Community Characteristics
 Needs and Community Characteristics Anticipate Population and Job Growth in the City Strongest density of population and jobs in Ann Arbor are within the Study Area Population expected to grow 8.4% by
AMTRAK ENVISIONS WORLD CLASS HIGH-SPEED RAIL Washington to Boston in about three hours at up to 220 mph (354 kph)
") FOR IMMEDIATE RELEASE September 28, 2010 ATK-10-130a Contact: Media Relations 202 906.3860 AMTRAK ENVISIONS WORLD CLASS HIGH-SPEED RAIL Washington to Boston in about three hours at up to 220 mph (354 kph)
FOR IMMEDIATE RELEASE September 28, 2010 ATK-10-130a Contact: Media Relations 202 906.3860 AMTRAK ENVISIONS WORLD CLASS HIGH-SPEED RAIL Washington to Boston in about three hours at up to 220 mph (354 kph)
DEVELOPMENT OF RIDERSHIP FORECASTS FOR THE SAN BERNARDINO INFRASTRUCTURE IMPROVEMENT STUDY
 APPENDIX 1 DEVELOPMENT OF RIDERSHIP FORECASTS FOR THE SAN BERNARDINO INFRASTRUCTURE IMPROVEMENT STUDY INTRODUCTION: This Appendix presents a general description of the analysis method used in forecasting
Economic Viability and Environmental Sustainability Dimensions of Passenger Rail Service Integration for Commuter and Casino Traffic on the Gulf Coast
 Economic Viability and Environmental Sustainability Dimensions of Passenger Rail Service Integration for Commuter and Casino Traffic on the Gulf Coast ITS 3C Summit: Mobile, Alabama, September 14-17, 2014
Economics - Primary Track (
 Economics 1 Economics Majors from the Department of Economics pursue careers in business, banking and finance, government, and consulting. They are also prepared to enter graduate or professional programs
ESTIMATION OF VEHICLE KILOMETERS TRAVELLED IN SRI LANKA. Darshika Anojani Samarakoon Jayasekera
 ESTIMATION OF VEHICLE KILOMETERS TRAVELLED IN SRI LANKA Darshika Anojani Samarakoon Jayasekera (108610J) Degree of Master of Engineering in Highway & Traffic Engineering Department of Civil Engineering
Ministry of Infrastructure and Watermanagement
 Ministry of Infrastructure and Watermanagement User characteristics and trip patterns of e-bike use in the Netherlands Results from the Dutch National Travel Survey and the Mobility Panel Netherlands Maarten
Transit Access Study
 West of Hudson Regional Transit Access Study Open House presentation July 20, 2010 1 Agenda Progress To date Summary of Level 2 Alternatives and Screening Service Plans Bus and Rail Operating and Capital
Automated and Connected Vehicles: Planning for Uncertainty
 Automated and Connected Vehicles: Planning for Uncertainty Tim Burkhardt APA Minnesota 9/28/2017 PLANNING IMPLICATIONS We plan for 20 years (or more) We design for 50 years (or more) o Elon Musk is not
ECONOMICS-ECON (ECON)
") Economics-ECON (ECON) 1 ECONOMICS-ECON (ECON) Courses ECON 101 Economics of Social Issues (GT-SS1) Credits: Economic analysis of poverty, crime, education, and other social issues. Basics of micro, macro,
Economics-ECON (ECON) 1 ECONOMICS-ECON (ECON) Courses ECON 101 Economics of Social Issues (GT-SS1) Credits: Economic analysis of poverty, crime, education, and other social issues. Basics of micro, macro,
Public Transit in America:
 Public Transit in America: Findings from the 1995 Nationwide Personal Transportation Survey September 1998 Center for Urban Transportation Research University of South Florida 4202 East Fowler Avenue,
Green Line Long-Term Investments
 Enhancements Short-term improvements to keep Austin moving. Investments Long-term projects to support our future. Mobility Hubs MetroRapid MetroRail MetroExpress Connectors Circulators Project Connect
APPLICATION OF A PARCEL-BASED SUSTAINABILITY TOOL TO ANALYZE GHG EMISSIONS
 APPLICATION OF A PARCEL-BASED SUSTAINABILITY TOOL TO ANALYZE GHG EMISSIONS Jung Seo, Hsi-Hwa Hu, Frank Wen, Simon Choi, Cheol-Ho Lee Research & Analysis Southern California Association of Governments 2012
Road Tolls and Road Pricing Innovative Methods to Charge for the Use of Road Systems
 Road Tolls and Road Pricing Innovative Methods to Charge for the Use of Road Systems by Daphnée Benayoun & René P. Cousin The Louis Berger Group, Inc. Introduction Major challenges facing now the road
TRAVEL DEMAND FORECASTS
 Jiangxi Ji an Sustainable Urban Transport Project (RRP PRC 45022) TRAVEL DEMAND FORECASTS A. Introduction 1. The purpose of the travel demand forecasts is to assess the impact of the project components
Factors Affecting Vehicle Use in Multiple-Vehicle Households
 Factors Affecting Vehicle Use in Multiple-Vehicle Households Rachel West and Don Pickrell 2009 NHTS Workshop June 6, 2011 Road Map Prevalence of multiple-vehicle households Contributions to total fleet,
Yonge-Eglinton. Mobility Hub Profile. September 19, 2012 YONGE- EGLINTON
 September 19, 2012 PEEL YORK HALTON DURHAM HAMILTON TORONTO YONGE- EGLINTON MOBILITY HUBS: places of connectivity between regional and rapid transit services, where different modes of transportation come
Urban Transport systems in major cities in China. Sun Kechao Senior Engineer China Academy of Transportation Sciences, Beijing, China
 Urban Transport systems in major cities in China Sun Kechao Senior Engineer China Academy of Transportation Sciences, Beijing, China Part 1 Part 2 Part 3 Part 4 Introduction Urban transport policies Urban
The Boston South Station HSIPR Expansion Project Cost-Benefit Analysis. High Speed Intercity Passenger Rail Technical Appendix
 The Boston South Station HSIPR Expansion Project Cost-Benefit Analysis High Speed Intercity Passenger Rail Technical Appendix Prepared by HDR August 5, 2010 The Boston South Station HSIPR Expansion Project
HAS MOTORIZATION IN THE U.S. PEAKED? PART 2: USE OF LIGHT-DUTY VEHICLES
 UMTRI-2013-20 JULY 2013 HAS MOTORIZATION IN THE U.S. PEAKED? PART 2: USE OF LIGHT-DUTY VEHICLES MICHAEL SIVAK HAS MOTORIZATION IN THE U.S. PEAKED? PART 2: USE OF LIGHT-DUTY VEHICLES Michael Sivak The University
ConnectGreaterWashington: Can the Region Grow Differently?
 Washington Metropolitan Area Transit Authority ConnectGreaterWashington: Can the Region Grow Differently? Transportation Planning Board (TPB) Travel Forecasting Subcommittee July 17, 2015 1 Alternatives
The hidden prices of parking David King Graduate School of Architecture, Planning and Preservation Columbia University
 The hidden prices of parking David King Graduate School of Architecture, Planning and Preservation Columbia University Planning of the automobile city focuses on saving time. Planning for the accessible
I-26 Fixed Guideway Alternatives Analysis
 I-26 Fixed Guideway Alternatives Analysis Steering & Technical Advisory Committees Joint Meeting January 15, 2016 @ 10:00 AM SC/TAC Meeting Winter 2016 Agenda I. Welcome & Introductions II. III. Project
Subarea Study. Manning Avenue (CSAH 15) Corridor Management and Safety Improvement Project. Final Version 1. Washington County.
 Corridor Management and Safety Improvement Project. Final Version 1. Washington County.") Subarea Study Manning Avenue (CSAH 15) Corridor Management and Safety Improvement Project Final Version 1 Washington County June 12, 214 SRF No. 138141 Table of Contents Introduction... 1 Forecast Methodology
Subarea Study Manning Avenue (CSAH 15) Corridor Management and Safety Improvement Project Final Version 1 Washington County June 12, 214 SRF No. 138141 Table of Contents Introduction... 1 Forecast Methodology
Facts and Figures. October 2006 List Release Special Edition BWC National Benefits and Related Facts October, 2006 (Previous Versions Obsolete)
") Facts and Figures Date October 2006 List Release Special Edition BWC National Benefits and Related Facts October, 2006 (Previous Versions Obsolete) Best Workplaces for Commuters - Environmental and Energy
Facts and Figures Date October 2006 List Release Special Edition BWC National Benefits and Related Facts October, 2006 (Previous Versions Obsolete) Best Workplaces for Commuters - Environmental and Energy
The Community of Yesteryear
 The Community of Yesteryear Charles, Calvert, & St. Mary s County are generally considered Southern Maryland. In years past, residents made a living growing tobacco or working the waters of the Chesapeake.
Use of National Household Travel Survey (NHTS) Data in Assessment of Impacts of PHEVs on Greenhouse Gas (GHG) Emissions and Electricity Demand
 Data in Assessment of Impacts of PHEVs on Greenhouse Gas (GHG) Emissions and Electricity Demand") Use of National Household Travel Survey (NHTS) Data in Assessment of Impacts of PHEVs on Greenhouse Gas (GHG) Emissions and Electricity Demand By Yan Zhou and Anant Vyas Center for Transportation Research
Use of National Household Travel Survey (NHTS) Data in Assessment of Impacts of PHEVs on Greenhouse Gas (GHG) Emissions and Electricity Demand By Yan Zhou and Anant Vyas Center for Transportation Research
8.2 ROUTE CHOICE BEHAVIOUR:
 8.2 ROUTE CHOICE BEHAVIOUR: The most fundamental element of any traffic assignment is to select a criterion which explains the choice by driver of one route between an origin-destination pair from among
Vehicle Scrappage and Gasoline Policy. Online Appendix. Alternative First Stage and Reduced Form Specifications
 Vehicle Scrappage and Gasoline Policy By Mark R. Jacobsen and Arthur A. van Benthem Online Appendix Appendix A Alternative First Stage and Reduced Form Specifications Reduced Form Using MPG Quartiles The
Attachment C: Benefit-Cost Analysis Spreadsheet
 Attachment C: Benefit-Cost Analysis Spreadsheet TIGER VII Application Collier Blvd. Corridor Improvements June 5 th, 2015 Collier Blvd BCA Summary The Collier Boulevard Benefit Cost Analysis (BCA) has
Portland Area Mainline Needs Assessment DRAFT. Alternative 4 Public Transportation: New or Improved Interstate Bus Service
 Portland Area Mainline Needs Assessment DRAFT Alternative 4 Public Transportation: New or Improved Interstate Bus Service HNTB Corporation April 2018 Table of Contents 4.1 Overview... 4-1 4.2 Key Assumptions...
Appendix F Model Development Report
 Appendix F Model Development Report This page intentionally left blank. Westside Mobility Plan Model Development Report December 2015 WESTSIDE MOBILITY PLAN MODEL DEVELOPMENT REPORT December 2015 Originally
Istanbul METROBUS BRT. Adapted from Presentations by World Resources Institute/EMBARQ s Sibel Koyluoglu and Dario Hidalgo
 Istanbul METROBUS BRT Adapted from Presentations by World Resources Institute/EMBARQ s Sibel Koyluoglu and Dario Hidalgo Historic Istanbul Modern Istanbul Istanbul Among World s most historic and rapidly
Case Study Congestion Charges in Singapore
 Case Study Congestion Charges in Singapore Chapter 11 (p. 449-451) in Transportation Economics summarized the basic argument for congestion pricing under the assumption that capacity is fixed. From an
car2go Toronto Proposal for on-street parking pilot project
 car2go Toronto Proposal for on-street parking pilot project Public Works & Infrastructure Committee June 18, 2014 Car2go Overview car2go is currently operating in 14 cities in North America, 12 cities
The Green Dividend. Cities facilitate less driving, saving money and stimulating the local economy. Joseph Cortright, Impresa September 2007
 The Green Dividend Cities facilitate less driving, saving money and stimulating the local economy Joseph Cortright, Impresa September 2007 Does being green pay? Is conservation just noble self-sacrifice;
APPENDIX C1 TRAFFIC ANALYSIS DESIGN YEAR TRAFFIC ANALYSIS
 APPENDIX C1 TRAFFIC ANALYSIS DESIGN YEAR TRAFFIC ANALYSIS DESIGN YEAR TRAFFIC ANALYSIS February 2018 Highway & Bridge Project PIN 6754.12 Route 13 Connector Road Chemung County February 2018 Appendix
Public Transportation Problems and Solutions in the Historical Center of Quito
 TRANSPORTATION RESEARCH RECORD 1266 205 Public Transportation Problems and Solutions in the Historical Center of Quito JACOB GREENSTEIN, Lours BERGER, AND AMIRAM STRULOV Quito, the capital of Ecuador,
Step on It: Driving Behavior and Vehicle Fuel Economy
 Step on It: Driving Behavior and Vehicle Fuel Economy Ashley Langer and Shaun McRae University of Arizona and University of Michigan November 1, 2014 How do we decrease gasoline use? Drive more efficient
US 29 Bus Rapid Transit Planning Board Briefing. February 16, 2017
 US 29 Bus Rapid Transit Planning Board Briefing February 16, 2017 Project Goals Improve the quality of transit service Improve mobility opportunities and choices Enhance quality of life Support master
Key Outcomes. The key outcomes of the preliminary study:
 Key Outcomes The key outcomes of the preliminary study: Outcome 1: Baseline studies on Demand side Management (DSM) on Transport Sector. Outcome 2: Identification of Focus and Boundary setting for full
Center for Energy Studies. Lauren Lee Stuart. Louisiana State University
 Center for Energy Studies Lauren Lee Stuart Center for Energy Studies Louisiana State University lstuar3@lsu.edu Overview Transportation Economics Mobility Demand Management Definitions Examples Applications
DOE s Focus on Energy Efficient Mobility Systems
 DOE s Focus on Energy Efficient Mobility Systems David L. Anderson Energy Efficient Mobility Systems Program Vehicle Technologies Office Automated Vehicle Symposium San Francisco, California July 13, 2017
Do U.S. Households Favor High Fuel Economy Vehicles When Gasoline Prices Increase? A Discrete Choice Analysis
 Do U.S. Households Favor High Fuel Economy Vehicles When Gasoline Prices Increase? A Discrete Choice Analysis Valerie J. Karplus MIT Joint Program on the Science and Policy of Global Change Using National
Department for Transport. Transport Analysis Guidance (TAG) Unit Values of Time and Operating Costs
 Unit Values of Time and Operating Costs") Department for Transport Transport Analysis Guidance (TAG) Unit 3.5.6 Values of Time and Operating Costs September 2006 1 Contents 1. Values of Time and Operating Costs 3 1.1 Introduction 3 1.2 Values
Department for Transport Transport Analysis Guidance (TAG) Unit 3.5.6 Values of Time and Operating Costs September 2006 1 Contents 1. Values of Time and Operating Costs 3 1.1 Introduction 3 1.2 Values
Safer or Cheaper? Household Safety Concerns, Vehicle Choices, and the Costs of Fuel Economy Standards
 Safer or Cheaper? Household Safety Concerns, Vehicle Choices, and the Costs of Fuel Economy Standards Yoon-Young Choi, PhD candidate at University of Connecticut, yoon-young.choi@uconn.edu Yizao Liu, Assistant
Road Map for Sustainable Transport Strategy for Colombo Metropolitan Region with Cleaner Air, through Experience
 Workshop on Air Quality and Environmentally Sustainable Transport April 28 th 2011 Don S. Jayaweera Road Map for Sustainable Transport Strategy for Colombo Metropolitan Region with Cleaner Air, through
West Broadway Transit Study. Community Advisory Committee September 17, 2015
 West Broadway Transit Study Community Advisory Committee September 17, 2015 Introductions Community Engagement Summer Outreach Fall Outreach Technical Analysis Process Update Alternatives Review Economic
Breakout Session. The Mobility Challenges of Our Growing & Sprawling Upstate
 Breakout Session The Mobility Challenges of Our Growing & Sprawling Upstate The Mobility Challenges of Our Growing & Sprawling Upstate Why is our suburban and sprawling development pattern a challenge
Minimum parking requirements create more parking than is needed.
 Do Cities Have Too Much Parking? A N D R E W M. F R A S E R, M I K H A I L V. C H E S T E R, J U A N M. M AT U T E, A N D R A M P E N D YA L A Minimum parking requirements create more parking than is needed.
San Francisco Transportation Plan Update
 San Francisco Transportation Plan Update SPUR August 1, 2011 www.sfcta.org/movesmartsf twitter.com/sanfranciscota www.facebook.com/movesmartsf How does the RTP relate to the SFTP? Regional Transportation
US 81 Bypass of Chickasha Environmental Assessment Public Meeting
 US 81 Bypass of Chickasha Environmental Assessment Public Meeting March 14, 2013 Introductions ODOT FHWA SAIC Meeting Purpose Present need for bypass Provide responses to 10/04/11 public meeting comments
Attachment D Environmental Justice and Outreach
 Attachment D Environmental Justice and Outreach ATTACHMENT D Environmental Justice and Outreach Indicate whether the project will have disproportionately high and adverse impacts on minority or low income
Sales and Use Transportation Tax Implementation Plan
 Sales and Use Transportation Tax Implementation Plan Transportation is more than just a way of getting from here to there. Reliable, safe transportation is necessary for commerce, economic development,
The Georgia CMAQ Program. Practice Makes Perfect
 The Georgia CMAQ Program Practice Makes Perfect Outline Georgia s Air Quality Georgia s CMAQ Process Prioritized Projects Project Mix Georgia and Air Quality Out of the 6 pollutants measured by EPA, Georgia
Funding Scenario Descriptions & Performance
 Funding Scenario Descriptions & Performance These scenarios were developed based on direction set by the Task Force at previous meetings. They represent approaches for funding to further Task Force discussion
Spatial and Temporal Analysis of Real-World Empirical Fuel Use and Emissions
 Spatial and Temporal Analysis of Real-World Empirical Fuel Use and Emissions Extended Abstract 27-A-285-AWMA H. Christopher Frey, Kaishan Zhang Department of Civil, Construction and Environmental Engineering,
Transportation and Energy
 Transportation and Energy Randall Guensler Michael D. Meyer, P.E. Georgia Transportation Institute January 2013 Ford Model T (1909 Model) (The 4 Seater Tin Lizzie ) Source: Ed Clark, Time Life Pictures
Transportation 2040: Plan Performance. Transportation Policy Board September 14, 2017
 Transportation 2040: Plan Performance Transportation Policy Board September 14, 2017 Today Background Plan Performance Today s Meeting Background Board and Committee Direction 2016-2017 Transportation
Rural Speed and Crash Risk. Kloeden CN, McLean AJ Road Accident Research Unit, Adelaide University 5005 ABSTRACT
 Rural Speed and Crash Risk Kloeden CN, McLean AJ Road Accident Research Unit, Adelaide University 5005 ABSTRACT The relationship between free travelling speed and the risk of involvement in a casualty
The Built Environment and Motor Vehicle Ownership & Use. Outline
 The Built Environment and Motor Vehicle Ownership & Use Evidence from Santiago de Chile Chris Zegras Assistant Professor Dept. of Urban Studies and Planning MIT czegras@mit.edu Outline Built Environment
Outline. Research Questions. Electric Scooters in Viet Nam and India: Factors Influencing (lack of) Adoption and Environmental Implications 11/4/2009
 Adoption and Environmental Implications 11/4/2009") Electric Scooters in Viet Nam and India: Factors Influencing (lack of) Adoption and Environmental Implications Christopher Cherry Assistant Professor-Civil and Environmental Engineering Luke Jones PhD
Electric Scooters in Viet Nam and India: Factors Influencing (lack of) Adoption and Environmental Implications Christopher Cherry Assistant Professor-Civil and Environmental Engineering Luke Jones PhD
Michigan/Grand River Avenue Transportation Study TECHNICAL MEMORANDUM #18 PROJECTED CARBON DIOXIDE (CO 2 ) EMISSIONS
 EMISSIONS") TECHNICAL MEMORANDUM #18 PROJECTED CARBON DIOXIDE (CO 2 ) EMISSIONS Michigan / Grand River Avenue TECHNICAL MEMORANDUM #18 From: URS Consultant Team To: CATA Project Staff and Technical Committee Topic:
TECHNICAL MEMORANDUM #18 PROJECTED CARBON DIOXIDE (CO 2 ) EMISSIONS Michigan / Grand River Avenue TECHNICAL MEMORANDUM #18 From: URS Consultant Team To: CATA Project Staff and Technical Committee Topic:
GTA West Corridor Planning and EA Study Stage 1
 GTA West Corridor Planning and EA Study Stage 1 Draft Development Strategy Presentation to Peel Goods Movement Task Force April 8 2011 Study Areas 2 Unique Approach Unprecedented two-stage EA process:
Measuring Accessibility. Andrew Owen Director, Accessibility Observatory May 17, 2017
 Measuring Accessibility Andrew Owen Director, Accessibility Observatory May 17, 2017 1. Overview 2. Methodology 3. Reporting Accessibility 4. Policy Implications 1. Overview What is Accessibility? Accessibility
Transportation Cost and Benefit Analysis II Traffic Services Victoria Transport Policy Institute (www.vtpi.org)
") 5.8 Traffic Services This chapter explores the costs of public services for vehicle traffic, including law enforcement, emergency services and street lighting. These costs are mostly funded through general
5.8 Traffic Services This chapter explores the costs of public services for vehicle traffic, including law enforcement, emergency services and street lighting. These costs are mostly funded through general
IMPROVING CITIES THROUGH PUBLIC-PRIVATE PARTNERSHIPS. Toronto Forum For Global Cities December 2008
 IMPROVING CITIES THROUGH PUBLIC-PRIVATE PARTNERSHIPS Toronto Forum For Global Cities December 2008 TORONTO S CHALLENGE GTA suffers from traffic congestion The average Torontonian spends seven hours a week
Planning of the HSR Network
 Engineering Services Department A Global Solution in Public Works Project China s High Speed Rail Network Susan Pan, P.E., Manager of Engineering County of Ventura, Planning of the HSR Network Planning
Bus and coach transport for greening mobility
 Bus and coach transport for greening mobility Contribution to the European Bus and Coach Forum 2011 The great challenge of decarbonizing transport requires low-carbon technology and decoupling 120% EU-27
Interstate Freight in Australia,
 Interstate Freight in Australia, 1972 2005 Leo Soames, Afzal Hossain and David Gargett Bureau of Transport and Regional Economics, Department of Transport and Regional Services, Canberra, ACT, Australia
The Strategies and Revelation of Free Buses in Chengdu
 The Strategies and Revelation of Free Buses in Chengdu Chen,She ChengduAcademyofSocial Sciences,Sichuan,China November6,2014 The Introduction of Chengdu Buses Chengdu, located in the central area of Sichuan
Clearing the Air in West Oakland: Port Impacts, Freight Transport & Environmental Justice
 Clearing the Air in West Oakland: Port Impacts, Freight Transport & Environmental Justice Swati Prakash, Pacific Institute (Community Strategies for Sustainability & Justice) & Ditching Dirty Diesel Collaborative
MPO Transit Study. Transit Concept for 2050 November 5, Transit Technologies
 Hillsborough County MPO Transit Study Transit Concept for 2050 November 5, 2007 Transit Technologies 1 Technologies Considered Bus Light Rail Commuter Rail Bus Standard or articulated high-capacity vehicles
Electric Power Transmission: Research Needs to Sustain a Critical National Infrastructure
 Electric Power Transmission: Research Needs to Sustain a Critical National Infrastructure Robert J. Thomas Cornell University Energy Council s 2003 Federal Energy and Environmental Matters Conference March
Lauren Lee Stuart Center for Energy Studies Louisiana State University
 Lauren Lee Stuart Center for Energy Studies Louisiana State University lstuar3@lsu.edu Overview Transportation Economics Mobility Demand Management Definitions Examples Applications LSU Case Study Background