Transportation Modeling for the Environment
|
|
|
- Kristopher Gordon Lawrence
- 6 years ago
- Views:
Transcription
1 CALIFORNIA PATH PROGRAM INSTITUTE OF TRANSPORTATION STUDIES UNIVERSITY OF CALIFORNIA, BERKELEY Transportation Modeling for the Environment Matthew J. Barth Joseph M. Norbeck University of California, Riverside California PATH Research Report UCB-ITS-PRR This work was performed as part of the California PATH Program of the University of California, in cooperation with the State of California Business, Transportation, and Housing Agency, Department of Transportation; and the United States Department of Transportation, Federal Highway Administration. The contents of this report reflect the views of the authors who are responsible for the facts and the accuracy of the data presented herein. The contents do not necessarily reflect the official views or policies of the State of California. This report does not constitute a standard, specification, or regulation. Report for MOU 105 December 1994 ISSN CALIFORNIA PARTNERS FOR ADVANCED TRANSIT AND HIGHWAYS
2 Preface This interim research report has been prepared for the California PATH Program, MOU #105, entitled Transportation Modeling for the Environment. This report covers the work that has been performed in the first year of a two year research project. Contributions to this report have been made by Joseph Norbeck, Ramakrishna Tadi, Rosa Fitzgerald, Robert Frankle, Gary Zheng, and Eric Johnston. Comments made by the reviewers of the original draft document were very useful. It is also important to acknowledge David Chock and James Butler from Ford Motor Company, who have provided considerable data and information on vehicle emissions. Parts of this report have been taken from other research reports written at the Center for Environmental Research and Technology. i
3 Abstract Transportation Modeling for the Environment Matthew J. Barth and Joseph M. Norbeck College of Engineering Center for Environmental Research and Technology University of California, Riverside, CA May, 1994 Intelligent Transportation Systems (ITS) offer the potential to improve highway safety, reduce highway congestion, and increase economic productivity. However, it is not clear what the effect ITS will have on air quality, specifically, vehicle emissions. As a result of various ITS technological bundles, average vehicle emissions should decrease due to smoother traffic flow and less congestion. In contrast, the transportation system may become more attractive, inducing greater travel demand and higher VMT (vehicle-miles traveled), resulting in an increase of emissions. In this research report, we describe preliminary research dealing with vehicle emissions associated directly with 1) Automated Highway Systems (AHS) and 2) ramp metering. In performing this analysis, a power-demand modal emissions model has been integrated with several transportation simulation models in order to quantitatively determine the effects of ITS technology on vehicle emissions. For AHS, a steady-state speed/emissions comparison has been conducted between vehicles that are platooned and non-platooned. Due to the reduction of aerodynamic drag while platooning (the drafting effect), the emissions for the platoon are significantly lower at higher steady-state speeds. Further, a comparison has been made between a platoon under optimized and non-optimized CICC (Coordinated Intelligent Cruise Control) and AICC (Autonomous Intelligent Cruise Control) control laws. For ramp metering, an initial evaluation has been conducted concentrating on the effect of vehicle emissions. Three components of ramp metering were evaluated independently: 1) the effect of freeway traffic smoothing; 2) ramp and surface street congestion; and 3) hard accelerations from the ramp meters. KEY WORDS: environmental impacts, emissions, transportation simulation modeling, Automated Highway Systems (AHS), platooning, ramp metering ii
4 Executive Summary Intelligent Transportation Systems (ITS, formerly IVHS) have generated considerable enthusiasm in the transportation community as potential methods to improve highway safety, reduce highway congestion, enhance the mobility of people and goods, and to promote the economic productivity in the country s transportation system. However, it is uncertain what effect ITS will have on air quality, specifically, vehicle emissions. There are primarily two influential factors: 1) Potentially, vehicle emissions can be reduced through the implementation of several ITS technological bundles. Advanced Vehicle Control Systems (AVCS) implemented at the vehicle level will safely smooth the traffic flow, minimizing the stop-and-go effect that leads to higher emissions. Advanced Traffic Management/Information Systems (ATMIS) will minimize congestion and subsequently emissions, for example by allowing dynamic re-routing to take place on the roadway network, and aiding in trip-chaining practices. 2) In contrast, the implementation of ITS technologies may induce traffic demand that leads to an increase of total vehicle miles traveled (VMT) by making the transportation system more desirable. For example, if ITS allows smoother flow and higher speeds on the roadways, people may choose to live farther away from work while still commuting in the same amount of time. In this research, we have begun to evaluate the direct impact of ITS traffic operation on vehicle emissions. We concentrate on the actual implementations of proposed strategies, and do not consider the effect of potential induced traffic demand as outlined above. In order to determine the direct impact of ITS technologies on air quality, significant improvements must be made in traffic simulation and travel demand models by closely integrating vehicle emission models. Existing traffic, emissions, and planning models have been developed independently of each other and are difficult to integrate together when determining accurate air quality impacts. Current emission models (i.e., MOBILE, developed by the US Environmental Protection Agency (EPA) and EMFAC, developed by the California Air Resources Board (CARB)) functionally relate emissions to average vehicle speed and density, and are not appropriate for analyzing ITS scenarios. Under ITS conditions, the dynamic behavior of vehicles will be very different compared to today s traffic conditions, upon which the current emissions models are based. As a result, modal emissions data (i.e., emissions data associated with vehicle modes, e.g., idle, acceleration, cruise, deceleration, etc.) can be used with microscale traffic simulations to obtain more realistic results. We have begun to integrate a power-demand modal emissions model with several simulation models in order to quantitatively determine the effects of ITS technology on vehicle emissions. iii
5 The vehicle dynamics equations and load-based emissions used in this study have been calibrated to a modern, closed-loop emission controlled vehicle (1991 Ford Taurus). As further modal emission data becomes available for other vehicles, they can easily be incorporated into the models when determining a more complete, comprehensive emissions estimate. Even though the preliminary results in this report are based on a single vehicle, trends are seen and important conclusions can be made regarding the importance of linking modal emissions with dynamic vehicle activity. In the first year of work, we have enhanced previously developed transportation/emission models to study: 1) vehicle platooning that will take place within an Automated Highway System (AHS), and 2) ramp metering used to smooth traffic flow on the freeways. For AHS, a steady-state speed/emissions comparison has been conducted between vehicles that are platooned and non-platooned. Due to the reduction of aerodynamic drag while platooning (the drafting effect), the emissions for the platoon are significantly lower at higher steady-state speeds. Preliminary results indicate that with AHS s approximate four-fold increase of capacity, emissions will increase over current manual conditions by a factor of two if the system is used at full capacity (~8000 vehicles/hour-lane), stay the same at half capacity (~4000 vehicles/hourlane), and will decrease by half at current traffic volumes (~2000 vehicles/hour-lane). Further, a comparison has been made between a platoon under optimized and non-optimized CICC (Coordinated Intelligent Cruise Control) control laws. In the optimized case, control constants are set at their optimized values for best maintaining intraplatoon spacing. For the non-optimized case, these control constants are perturbed and the resulting emissions are compared to the optimized case. At high speeds under high load conditions, the non-optimized case tends to produce higher emissions. Finally, various driving cycles (velocity profiles of on-road vehicle motion) have been simulated for both CICC and AICC (Autonomous Intelligent Cruise Control) platoon operations. Although platoons will be operated smoothly in a typical AHS, more aggressive driving cycles were used in simulation in order to identify potential emission producing events. For specific velocity transients, hard accelerations and decelerations were often required of follower vehicles to maintain proper platoon formation. These accelerations often lead to short bursts of high emissions during the driving cycles, depending on the control laws governing intraplatoon spacing. A comparison of total emissions has been carried out using CICC and AICC control laws. The results indicate no significant difference in emissions produced. For ramp metering, an initial evaluation has been conducted concentrating on the effect of vehicle emissions. Three components of ramp metering were evaluated independently: 1) the iv
6 effect of freeway traffic smoothing; 2) ramp and surface street congestion; and 3) hard accelerations from the ramp meters. Through the use of simulation, it has been shown that the mainline freeway average traffic speed decreases as the traffic volume of a freeway on-ramp increases. Further, if ramp metering is used, it has been shown that the mainline traffic speeds increase as a function of the ramp meter cycle time. Based on the assumptions and models used in this report, emissions for the mainline freeway tend to reach a maximum for a ramp meter cycle time near two seconds, but then fall as the cycle time increases. Similarly, total emissions associated with vehicles on the ramp waiting to enter the freeway decrease with an increase in ramp meter cycle times. Finally, emissions corresponding to hard accelerations from the meter to the freeway merge point can be significant if the required acceleration places a high power demand on the individual vehicle engines. A comparison was also made of the velocity and acceleration profiles from a ramp acceleration simulation model with profiles that were measured in the field. It was shown that the ramp acceleration model which assumed a constant power delivery from the engine generated velocity/acceleration profiles that do not match very well with actual velocity/accelerations measured in the field. This preliminary evaluation of AHS and ATMIS strategies (such as ramp metering) on vehicle emissions will continue into the second year with a higher level of detail and further testing using more extensive data. v
7 vi
8 Table of Contents 1 Introduction Emissions Modeling Transportation Modeling Integrated Transportation/Emission Model Summary Project Task Outline Task 1: Transportation/Emissions Model Enhancement for ITS Task 2: Initial Study of AVCS Strategies Task 3: Initial Study of ATMIS Strategies Automated Highway System (AHS) Vehicle Emissions Uninterrupted Traffic Flow Platooning Platoon Simulation Model Vehicle Dynamics Longitudinal Control Platoon Generation Simulation Flow Graphical User Interface Steady-State Velocity Emissions Transient Velocity Emissions Optimized vs. Non-Optimized CICC comparison CICC vs. AICC comparison Vehicle Emissions due to Ramp Metering Mainline Traffic Smoothing FRESIM Summary Simulation Setup vii
9 3.1.3 Mainline Speed Reduction from High Ramp Volumes Mainline Speed Increase from Ramp Metering Ramp Queuing Hard Ramp Accelerations Conclusions and Future Work AHS Vehicle Emissions Ramp Meter Emissions References Appendix A...A1 viii
10 List of Tables and Figures Figure 1.1. Current Emission Inventory Process...2 Figure 1.2. Hybrid macroscopic / microscopic modeling approach of ITEM...8 Figure 2.1. Flow, density, and speed relationship of uninterrupted traffic flow Figure 2.2. Flow-density relationship for manual traffic Figure 2.3. Platoons of vehicles on a highway Figure 2.4. Traffic Flow-density relationship for manual and automated driving Figure 2.5. Overall flowchart of platoon simulation Figure 2.6. Graphical user interface of platoon simulation Figure 2.7a. Velocity CO emission rates for 20 vehicles platooned and non-platooned Figure 2.7b. Velocity HC emission rates for 20 vehicles platooned and non-platooned Figure 2.7c. Velocity NOx emission rates for 20 vehicles platooned and non-platooned Figure 2.8a. Total CO emissions versus traffic flow for manual and automated traffic Figure 2.8b. Total HC emissions versus traffic flow for manual and automated traffic Figure 2.8c. Total NOx emissions versus traffic flow for manual and automated traffic Figure 2.9. Velocity profiles for a four vehicle platoon under CICC control Figure Acceleration profiles for a four vehicle platoon under CICC control Figure CO emissions versus time for a four vehicle platoon under CICC control Figure NOx emissions versus time for a four vehicle platoon under CICC control Figure Velocity profiles for a four vehicle platoon under perturbed CICC control Figure Acceleration profiles for a 4 vehicle platoon under perturbed CICC control Figure CO emissions vs. time for a 4 vehicle platoon under perturbed CICC control.. 32 Figure NOx emissions vs. time for a 4 vehicle platoon under perturbed CICC control 33 Figure Accumulative CO emissions for perturbed and non-perturbed control cases Figure Accumulative NOx emissions for perturbed and non-perturbed control cases. 34 Figure Velocity profiles for a four vehicle platoon under AICC control Figure Acceleration profiles for a four vehicle platoon under AICC control ix
11 Figure CO emissions versus time for a four vehicle platoon under AICC control Figure NOx emissions versus time for a four vehicle platoon under AICC control Figure 3.1. Freeway geometry for FRESIM ramp meter experiment Figure 3.2. Average mainline freeway speed vs. traffic volume on a non-metered ramp Figure 3.3. Average mainline freeway speed vs. ramp meter cycle time Figure 3.4. CO emissions rate per mile versus ramp meter cycle time Figure 3.5. HC emissions rate per mile versus ramp meter cycle time Figure 3.6. NOx emissions rate per mile versus ramp meter cycle time Figure 3.7. Vehicle density versus ramp meter cycle time Figure 3.8. Average vehicle speed on ramp versus ramp meter cycle time Figure 3.9. Emissions versus ramp meter cycle time Figure Average wait time versus ramp meter cycle time Figure CO, HC and NOx emissions for constant length and varying grade Figure Velocity vs. time for zero grade, accelerating from 10 to 55 mph Figure Acceleration vs. time for zero grade, accelerating from 10 to 55 mph Figure Sample velocity profiles for example ramp from CalPoly study Figure Sample acceleration profile for example ramp from CalPoly study TABLES Table 2.1. Specifications of 1991 Ford Taurus Table 2.2. Environmental constants used in calculations x
12 1 Introduction Two central research questions pertaining to air quality exist for Intelligent Transportation Systems (ITS): Potential vehicle emission reductions through the application of advanced technology, and potential induced traffic demand. Potential Vehicle Emission Reductions ITS has the potential to reduce vehicle emissions through several of its technological bundles (see, for example, (ITE 1990) for an overview of ITS). Advanced Vehicle Control Systems (AVCS) implemented at the vehicle level are intended to safely smooth traffic flow on the roadways by minimizing the stop-and-go effect of vehicles in congestion, and increase overall throughput. The heavy acceleration and deceleration components of vehicle trips can be eliminated, minimizing energy consumption and associated emissions of these vehicle operating modes. Advanced Traffic Management / Information Systems (ATMIS) will allow dynamic re-routing to take place on the roadway network, minimizing congestion and subsequently emissions. Further, navigational systems will allow users to reduce unnecessary driving and avoid congestion (SCAQMD 1993). Potential Induced Traffic Demand In contrast, the implementation of some ITS technologies may lead to an increase of total vehicle miles traveled (VMT). If ITS allows smoother flow and higher speeds on the roadways, people may choose to live farther away from work while still commuting in the same amount of time thereby increasing VMT. Farther, attractive trip-ends will become reachable, again increasing VMT. Further, advanced navigational technology may divert travelers from higher-occupancy modes such as buses and carpools to single-occupant vehicles. In general, if travel becomes easier due to advanced technology, VMT will likely increase. In order to determine the impact of ITS on air quality, significant improvements must be made in traffic simulation and travel demand models by closely integrating vehicle emission models. Existing traffic, emissions, and planning models have been developed independently of each other and are difficult to integrate together when determining accurate air quality impacts. Current emission models (i.e., MOBILE, EMFAC (Maldonado 1991; Maldonado 1992; Eisinger 1993) ) functionally relate emissions to average vehicle speed and density, and are not appropriate for analyzing ITS scenarios. Under ITS conditions, the dynamic behavior of vehicles will be very different compared to today s traffic conditions, upon which the current emissions models are based. As a result, modal emissions data (i.e., emissions data associated with vehicle 1
13 modes, e.g., idle, acceleration, cruise, deceleration, etc.) should be used with microscale traffic simulations to obtain more realistic results. In this research, we have begun to evaluate the direct impact on vehicle emissions of ITS traffic operation. We concentrate on the actual implementations of proposed strategies, and do not consider the effect of potential induced traffic demand as outlined above. In this introduction, we first describe the problems associated with current emission models, particularly with their use in evaluating ITS scenarios. A description of transportation modeling and an integrated (transportation/emissions) approach are then briefly described, followed by a summary of the project tasks. 1.1 EMISSIONS MODELING The common modeling approach (specifically the MOBILE model, developed by the US Environmental Protection Agency (EPA) (Eisinger 1993) and EMFAC, developed by the California Air Resources Board (CARB) (Maldonado 1991; Maldonado 1992) ) used to produce a mobile source emission inventory is based on two processing steps, as shown in figure 1.1. The first step consists of determining a set of emission factors which specifies the rate at which emissions are generated, and the second step is to produce an estimate of vehicle activity. The emission inventory is then calculated by multiplying the results of these two steps together. vehicle procurement FTP driving cycle off-cycle testing dynamometer testing dynamometer testing bag emission data speed correction factors emission factor model emission factors macroscopic transportation model activity factors (speed, VMT) Emission Inventory Figure 1.1. Current Emission Inventory Process The current methods used for determining emission factors are based on laboratory-established emission profiles for a wide range of vehicles with different types of emission control technologies. The emission factors are produced based on average driving characteristics embodied in a pre-determined driving cycle, known as the Federal Test Procedure (FTP 1989). This test cycle was originally developed in 1972 as a certification test and has a specified driving trace of speed versus time, which is intended to reflect actual driving conditions both on arterial roads and freeways. Emissions of carbon monoxide (CO), oxides of nitrogen (NO x ), and 2
14 hydrocarbons (HC) are integrated and collected for three sections of the cycle (called bags) and are used as base emission rates. Adjustments are then made to the base emission rates through a set of correction factors. There are correction factors for each bag, which are used to adjust the basic emission rates to reflect the observed differences between the different modes of operation. There are also temperature correction factors and speed correction factors, used to adjust the emission rates for non-ftp speeds. These speed correction factors are derived from limited off-cycle testing (speeds greater than 57 mi/h (92 km/hr), accelerations greater than 3.3 mi/h-s (5.3 km/hr-s)) performed on laboratory dynamometers. Vehicle activity data used for the emission inventory can come from a number of sources, although it is typically produced from a macroscopic transportation model. Traffic activity data is generated regarding vehicle miles traveled (VMT), number of vehicles, number of trips, and speed distribution on a region specific basis. Along with using an estimate of vehicle mix, the key variables of VMT and associated speed distribution are then multiplied with the emissions factors, producing a final emissions inventory. This methodology for calculating an emission inventory has several shortcomings, a few are outlined below: 1) Inaccurate characterization of actual driving behavior One of the underlying problems is that the standardized driving cycle of the Federal Test Procedure, which is used to certify vehicles for compliance of emission standards and from which most of the emissions data are based, was established over two decades ago (FTP 1989). At the time, the FTP was intended to exercise a vehicle in a manner similar to how a typical in-use urban vehicle would operate, however it did not include off-cycle vehicle operation which consist of speeds in excess of 57 mi/h and acceleration rates above 3.3 mi/h-s, common events in today s traffic operation. It has been shown in a number of studies that the FTP does not accurately characterize today s actual driving behavior (Cadle et al. 1991; Cadle et al. 1993). 2) The methodology of emissions factor calculation is flawed The non-representative nature of the FTP driving cycle tests is exacerbated by the procedure used for collecting and analyzing emissions. As mentioned before, the FTP is divided into three segments in which emissions are collected into separate bags. The emissions from these three segments are then used by the emission models to statistically reconstruct the relationship between emission rates and average vehicle speeds. Thus the models statistically smooth the effect of accelerations and decelerations. In simple terms, two vehicle trips can have the same average speed, but may have different speed profiles that consist of drastically different modal 3
15 characteristics (acceleration, deceleration, idle, etc.) and thus drastically different emissions output. This is particularly true for current closed-loop emission control systems where it has been shown that dynamic operations of the vehicle are an important variable in predicting vehicle emissions (Cadle et al. 1991; Cadle et al. 1993; St. Denis et al. 1993). Further, the speed correction factors used as the model input are derived from nine transient tests (not steady-speed tests) including the FTP. The tests span a series of average speeds up to 65 mi/h. Running the nine cycles and scaling them to construct the speed correction curves may not accurately mimic real-world driving conditions. 3) Estimates of traffic activity lack sufficient depth and are often in error After emissions data have been collected through FTP testing, this data set is multiplied by the data produced by models of traffic activity. Unfortunately, the traffic density and vehicle speed information is out-of-date in most areas, VMT is consistently under-predicted (CARB 1991), and traffic activity information has not been properly validated. The technical community has recognized that vehicles are often operated at off-cycle speeds and accelerations, and several studies are on-going to better characterize in-use driving behavior and to obtain real-time, in-situ emission measurements (Cadle et al. 1991; Cadle et al. 1993). Several instrumented vehicle projects are evaluating on-road vehicle performance by collecting realtime, in-situ vehicle operation parameters while simultaneously measuring emission data on a second-by-second basis (Butler 1992; Kelly et al. 1993). With data from these instrumented vehicles, it is possible to examine the direct relationships between dynamic vehicle operation and emission output. In addition, a new generation of chassis dynamometers has recently become available. Over the last several years, a joint task force comprised of EPA, CARB, and, at that time, the Motor Vehicle Manufacturers Association has investigated the feasibility of replacing the 8.65 inch twin-roll hydrokinetic chassis dynamometer with an electric dynamometer, for the purpose of improving system reliability and reducing emissions test variability. After several comparative programs it was found that a 48 inch single-roll electric dynamometer provided a better match to the road than the 20 inch twin-roll, coupled dynamometer. In addition, there were significant increases in emissions and a decrease in fuel economy using the 48 inch single roll dynamometer compared to the standard chassis dynamometer. Most importantly, the 48 inch single roll dynamometer allowed for the accurate testing of severe transient events (hard accelerations and decelerations greater than 6 mph/second) previously unattainable with the old generation dynamometers. The load applied to the vehicle can be dynamically controlled in real-time, 4
16 allowing the proper real-world simulation of road loads, aerodynamic drag, and road grade. By using emission analysis equipment capable of measuring emission species every second, again, the direct relationship between dynamic operation and emission output can be formulated with considerably increased accuracy. With these instrumented vehicle projects and similar second-by-second dynamometer emissions tests, it is possible to improve our understanding of what types and what amounts of emissions are resulting in relation to the measured vehicle parameters, and build up a modal emissions data set, i.e., emissions as a function of vehicle operating modes, such as idle, light-, medium-, and hard-accelerations, steady -state cruise, etc. With these highly time resolved emission and vehicle data, modal emission models can be established so that given a certain set of vehicle operating conditions or modes, an instantaneous emission output can be predicted. This is particularly important for the evaluation of various ITS scenarios, where driving conditions will not be similar to the conditions of the FTP, but rather be composed of diverse operating conditions that can only be evaluated using such a modal emissions modeling approach. 1.2 TRANSPORTATION MODELING In general, transportation modeling consists of several integrated models that are used together to define the transportation planning process. These components are described in detail in the literature (e.g., Warner 1985) ), and are briefly outlined below: Trip Generation Models: This initial component is concerned with the causes of trips, i.e., what environmental circumstances lead to the production or attraction of traffic. This is usually based on demographic variables such as household size, income, and number of vehicles per household. Trip generation models estimate the number of total trips based on trip purpose on an area-by-area basis. Trip Distribution Models: After estimating the traffic demand generated in each area, trip distribution models determine the destinations of the outflows and the origins of the inflows for the different areas. Modal Choice Models: This component deals with what transportation modes will the anticipated flows use: private car, bus, train, etc. These models estimate the distribution of the transportation flows over the various transportation modes. 5
17 Trip Assignment Models: This final component is concerned with what route the transportation flows will take. With a network of different transportation routes, trip assignment models predict the paths of travel for the distribution of transportation flows. These network loading models usually are based on the assumption that users will always use the quickest route. Once all of these components are in place, traffic can be simulated on a transportation network, usually composed of links and nodes. The links represent road segments and nodes represent potential turning points. Based on the demand database consisting of sources, destinations, volumes, and types of vehicles determined by the first three components described above, the traffic simulation predicts the traffic operation over the network as a function of time using the trip assignment component. The traffic simulation can illustrate such things as congestion due to inadequate road systems, construction, accidents, or similar factors. Transportation simulation models typically fall into one of two categories, microscale and macroscale. Microscale models typically model at the vehicle level and have high accuracy, but require extensive data on the system under study and require more computing power than macroscale models for problems of the same scope. Macroscale models often require less detailed data, but they sacrifice detail in order to enable the modeling of larger areas using computers with modest power. Transportation simulation models are used for analyzing various operating environments of the road system. These operating environments include signalized intersections, arterial networks, freeway corridors, and rural highways. Some examples of microscale performance models are TRAF-NETSIM (FHWA 1989, for arterial networks) and FRESIM (Halati et al. 1991, for the freeways). Macroscale models that are based on analytic flow models include FREFLOW (May 1990), TRANSYT-7F (FHWA 1986) and HCS (TRB 1985). Many of these models were developed before the introduction of efficient and cost-effective mini- and micro-computers. The models have been enhanced over the years, and many are powerful and effective. However, most are difficult to maintain and modify, contain bugs even after over a decade of development, and have rigid input/output routines structured around the punched card concept. Therefore, newer traffic models are being developed in recent years that take advantage of the many developments of modeling, software engineering, and hardware platforms which have occurred over the past decade. For example, the THOREAU model (McGurrin et al. 1991) makes use of object-oriented programming for greater flexibility, and is based on event-stepped simulation rather than time-stepped, resulting in greater speed performance. Another recently developed transportation model is the model INTEGRATION (Van Aerde 1992). These more 6
18 recent models are better suited for simulating various ITS scenarios, since they have greater flexibility and greater level of detail that are required for simulating new transportation technologies. Other specific transportation simulation models have been developed in particular for the evaluation of ITS, such as the simulators SmartPath (Eskafi et al. 1992; Hongola et al. 1993) and SmartLink (Rao et al. 1994) developed within the PATH program. Few of these transportation models have been combined with vehicle emission models, and those that do simply predict vehicle density and speed as a function of link and time to be integrated with current speed-emissions data. Although this is a step in the right direction, much better emission estimates can be achieved using transportation models that can predict dynamic vehicle operating characteristics such as acceleration and deceleration, and combining these with a modal-based emissions model. 1.3 INTEGRATED TRANSPORTATION/EMISSION MODEL SUMMARY As part of a larger research program, we are developing a new modeling approach for mobile source emission estimation, using a power demand-based modal emissions model, described in appendix A. This modal emissions model is being integrated with a set of transportation simulation models that attempt to portray true traffic behavior. By modeling in this fashion, emission rates are closely related to dynamic vehicle behavior and have the potential to provide a better overall estimate of total emissions. Because of the tight coupling between transportation simulation and modal emission modeling, we refer to our modeling set as the Integrated Transportation/Emission Modeling (ITEM) set (Barth et al. 1993). ITEM is based on a hybrid macroscale/microscale modeling approach, illustrated in figure 1.2. Detailed vehicle activity is determined through microscale simulation modules which are stratified by road facility type. A macroscale model (referred to as the wide area model) capable of simulating regional areas is then used to integrate all of the microscale simulation models together. There is strong interaction between the macroscale model and the microscale modules, indicated by two-way arrows in figure 1.2. Transportation parameters determined by the macroscale wide-area model are used to drive the input parameters of the modules. In addition, information sent back from the microscale modules is used as feedback to the wide-area model, which helps improve the system s overall traffic estimation. Currently, ITEM has implemented an uninterrupted flow simulation model, which can simulate various levels of congestion on a freeway facility. Also, an acceleration module was developed to predict vehicle emissions directed related to specified velocity/acceleration profiles. Further, 7
19 an arterial congestion model is currently being developed, along with a rural highway model capable of predicting emissions for passing events. At this stage of development, ITEM cannot be used to calculate a comprehensive mobile source emissions inventory. It operates at a high level of detail, however it currently lacks the breadth of emission measurements for a large range of vehicles, and can only simulate a limited range of traffic scenarios. Rather, this approach to emissions modeling attempts to avoid the potential problems and shortcomings of current emissions modeling and establishes a foundation for future emission inventory procedures. Wide-Area macroscopic model uninterrupted flow (freeway) sub-model freeway ramp sub-model signalized intersection sub-model rural highway sub-model other sub-models (future phases) freeway network arterial network Figure 1.2. Hybrid macroscopic / microscopic modeling approach of ITEM. 1.4 PROJECT TASK OUTLINE In the first year s work, the Integrated Transportation/Emission Modeling set has been enhanced so that several ITS scenarios can be evaluated. After the enhancement, initial studies of Advanced Vehicle Control System (AVCS) and Advanced Traffic Management and Information System (ATMIS) strategies have been performed. The specific tasks are outlined below: Task 1: Transportation/Emissions Model Enhancement for ITS In order to evaluate the effect on total vehicle emissions from specific ITS strategies, traffic simulation models are being integrated with the modal emission component of ITEM. In this first year, we have investigated vehicle emissions associated with two specific cases of ITS: 1) vehicle platooning that will take place within an Automated Highway System (AHS), and 2) ramp metering used to smooth the flow on the freeways. 8
20 Vehicle Platooning: In an automated highway system, vehicles will most likely travel in platoons, where a platoon consists of a number of vehicles (approximately 5 to 30), separated by very short distances (on the order of a meter), traveling at high speeds (100 km/hr +). As a starting point, we have taken the microscale uninterrupted flow (freeway) simulation module of ITEM and modified it by eliminating the human driving behavior components corresponding to car-following and lanechanging logic. These components have been replaced with the control laws for automated driving. Two types of car-following logic within a platoon are being considered: 1) Coordinated Intelligent Cruise Control (CICC) where a platoon leader has a rearward-looking transponder or other means of transmitting information on vehicle dynamics to the following vehicles, and 2) Autonomous Intelligent Cruise Control (AICC) where a following vehicle can only measure a preceding vehicle s position and velocity. These control laws are being adapted from the PATH literature, specifically (Sheikholeslam 1991) for CICC and (Ioannou et al. 1992) for AICC. In addition, the graphical user interface for the simulations is being modified for platoon generation. The AHS simulator SmartPath (Eskafi et al. 1992; Hongola et al. 1993), developed within PATH, is being evaluated to determine whether the simulator can be used for emissions analysis. Ramp Metering: In addition to evaluating vehicle platooning emissions, we are analyzing the effect of advanced traffic management; specifically, the effect of ramp metering on vehicle emissions. Ramp metering has three basic effects on vehicle emissions: 1) smoothing of freeway traffic, leading to lower emissions, 2) increased ramp and surface street congestion, possibly leading to higher emissions, and 3) induced hard accelerations from the meters on the ramps, leading to higher emissions. These three effects are obviously interrelated and vary as a function of traffic demand, ramp meter cycle time, and ramp meter placement. In this first year of work, these three effects have been modeled and evaluated independently with no interaction between them. A large concentration of work has been on the induced hard accelerations. The ramp-acceleration module of ITEM has been adapted to predict the amount of vehicle emissions during hard accelerations on freeway on-ramps. These ramp accelerations have been compared to data measured in the 1993 Caltrans project Vehicle Speeds and Accelerations Along On-Ramps: Inputs to Determine the Emissions Effects of Ramp Metering performed by Cal Poly (Sullivan et al. 1993). 9
21 1.4.2 Task 2: Initial Study of AVCS Strategies As an initial study of AVCS strategies, total emissions from platoons in an AHS scenario have been evaluated. Specifically, the following evaluations have been conducted: Steady-state speed/emissions comparison The emissions for a 20 vehicle platoon are calculated at different steady state speeds. These emissions are then compared to 20 vehicles driven manually (i.e., no platooning), with no intervehicle interaction for the same set of velocities. Due to the reduction of aerodynamic drag while platooning (the drafting effect), the emissions for the platoon are significantly lower at higher steadystate speeds. Optimized vs. non-optimized CICC comparison A comparison has been made between a platoon under optimized and non-optimized CICC control laws. In the optimized case, control constants are set at their optimized values for best maintaining intraplatoon spacing. For the non-optimized case, these control constants are perturbed and the resulting emissions are compared to the optimized case. At high speeds under high load conditions, the non-optimized case tends to produce higher emissions. CICC vs. AICC comparison Various driving cycles (velocity profiles of on-road vehicle motion) have been simulated for both CICC and AICC platoon operation. Although platoons will be operated smoothly in a typical AHS, more aggressive driving cycles were used in simulation in order to identify potential emission producing events. For specific velocity transients, hard accelerations and decelerations were often required of follower vehicles to maintain proper platoon formation. These accelerations often lead to short bursts of high emissions during the driving cycles, depending on the control laws governing intraplatoon spacing. A comparison of total emissions have been carried out using CICC and AICC control laws. A description of this preliminary AHS evaluation is given in chapter Task 3: Initial Study of ATMIS Strategies An initial evaluation has been conducted of ramp metering and its effect of vehicle emissions. Three components of ramp metering were evaluated independently: 1) The effect of freeway traffic smoothing; 2) Ramp and surface street congestion; and 3) Hard accelerations from the ramp meters. The freeway smoothing effect has been evaluated using the model FRESIM (Halati 10
22 et al. 1991) for different scenarios of ramp metering. Ramp congestion has been analyzed using a microscale simulation model of a single lane ramp. The ramp-acceleration module of ITEM has been adapted to predict the amount of emissions during hard accelerations on freeway onramps. A description of this preliminary ramp metering evaluation is given in chapter 3. 11
23 12
24 2 Automated Highway System (AHS) Vehicle Emissions Automated Highway Systems (AHS) offer the potential for a substantial increase in performance and safety on the nation s highways. Research conducted at PATH has shown conceptually that an AHS can provide safe, efficient movement of vehicles on the highway (e.g., Karaaslan et al. 1990; Varaiya et al. 1991; Rockwell 1992; Zhang et al. 1994). However, an AHS is a complex system and must be capable of performing a wide range of operations, such as network traffic management, route planning and guidance, coordination of vehicle movements, and automated vehicle maneuver control. Each of these operations will have an effect on vehicle emissions. In this research project, we have begun to evaluate the impact of AHS on vehicle emissions using simulation modeling. In this first year, we have concentrated on automated vehicle control, specifically on the operation of platooning implemented using longitudinal control. A fully automated highway system will consist of automated traffic in several lanes using both longitudinal and lateral control, with numerous platoon maneuvers such as platoon splitting, merging, etc. (see, e.g., Hsu et al. 1991; Varaiya et al. 1991). The impact of these maneuvers on vehicle emissions is not considered in this first year s work, but will be addressed in the second year using more sophisticated simulation models. Principles of uninterrupted traffic flow are first reviewed, followed by a brief description of platooning concepts. A platoon simulation model developed in this first year s work is then described. Using the platoon simulation model, steady-state emissions are evaluated and compared to manual traffic emissions, followed by a preliminary analysis of transient emissions from platooned vehicles. 2.1 UNINTERRUPTED TRAFFIC FLOW Current highway traffic (i.e., uninterrupted traffic flow) can be characterized by the traffic volume (v), average vehicle speed (S), and vehicle density (D). These terms are generally related by the product v = S D (TRB 1985). Further constraints operate on these parameters which restrict the type of flow conditions on a highway link. The general form of these constraints is shown in figure 2.1, which illustrates some key points of uninterrupted traffic flow: Zero rate of flow occurs in two distinct cases: 1) when there are no vehicles on the roadway, and 2) when the density is so high that all vehicles are stopped and cannot move. In the first case, the density is zero, thus the flow rate is zero, and the speed in this case is assumed to be the driver s desired speed (i.e., vehicle free speed). In the second case the density is at its 13
25 maximum and the vehicle speed is zero. The density at which this occurs is called the jam density. As density increases from zero, the traffic flow increases due to the increased number of vehicles. The average vehicle speed is reduced to maintain safety during higher density conditions. Traffic flow is maximized at a specific critical density. As density increases above the critical density point, speed drops off at a faster rate. Traffic flow tends to become unstable in this region due to perturbations from lane change maneuvers, merging, or any external variables (e.g., debris in roadway, accident in adjoining roadway, etc.). These perturbations can create disturbances that are not damped or dissipated in the flow. These unstable, forced flow regions in the curves are characterized by stop-and-go congestion. flow flow density stable flow forced flow critical density critical density density critical speed speed critical speed speed Figure 2.1. Flow, density, and speed relationship of uninterrupted traffic flow flow vs. density l l l 48 l 40 l 20 l flow (veh/hr) density (veh/km) Figure 2.2. Flow-density relationship for manual traffic. Velocity values (km/hr) are annotated on the curve. 14
26 Human driver flow-density-speed relationships can be approximated mathematically by specifying the spacing, or gap, between vehicles required for safe stopping if one car suddenly brakes, and after a time lag, the second car also brakes without collision. The flow-density curve in figure 2.2 was produced for the case when the first car brakes at 0.9 g (8.82 meters/second 2 ) and the second car brakes at 0.6 g (5.88 meters/second 2 ) after a one second time lag. This curve (after Rockwell 1992) is for a single lane and is similar to curves predicted by the Highway Capacity Manual (TRB 1985). 2.2 PLATOONING In order to improve the flow rate on the highway, ITS technology in the form of AVCS can be applied to control vehicle motion so that vehicles can operate in platoons, i.e., follow each other very closely at high speeds, while still maintaining a high safety margin. This has several implications: 1) traffic flow will increase dramatically over current highway conditions due to denser traffic traveling at higher speeds; 2) congestion should decrease since the stop-and-go effect caused by relatively long human reaction delays will be eliminated and accidents will be minimized. A similar mathematical formulation to that above can be developed for the flow-density-speed characteristics of an automated highway system. Within a platoon of vehicles, the spacings are much smaller and closely regulated by automated controls. Therefore, platooned vehicles can travel faster at higher densities, thus improving the traffic throughput. If we consider a single lane of platooned traffic as shown in figure 2.3, we can mathematically approximate the flowdensity-speed characteristics. Using the notation given in figure 2.3, the vehicle density for an automated lane is given as: D = n +nl+δ ( ) δ (2-1) n δ platoon 2 platoon 1 n n... 1 L δ intraplatoon spacing interplatoon spacing L length of vehicle n number of cars in platoon Figure 2.3. Platoons of vehicles on a highway. 15
27 The interplatoon spacing is determined as described before, i.e., requiring safe stops if one platoon suddenly brakes, and after a time lag, the second platoon (leader) also brakes. In the automated scenario, the time lag is much shorter than that for human drivers. The resulting flowdensity curve in figure 2.4 was produced for the more restrictive case when the first platoon brakes at 2 g (19.6 meters/second 2 ), and after a 0.3 second time lag, the second platoon (leader) brakes at 0.3 g (2.94 meters/second 2 ). It is assumed that the intraplatoon spacing is precisely controlled and can also perform safe stops under these specified stopping conditions. In the mathematical formulation, the intraplatoon spacing is set to one meter, the car length is five meters, the number of vehicles in each platoon is 20 vehicles, and the vehicle free speed is 120 km/hr. The difference between the flow for manual driving and automated driving is substantial. The maximum traffic flow for this automated case is roughly four times that of the manual driving case. The maximum flow for the automated case occurs at an average speed of 103 km/hr, and for the manual case it occurs at 48 km/hr automated flow vs. density 120 l 103 l 80 l 60 l l flow (veh/hr) l l 60 l 48 l 40 l 20 l 1000 manual density (veh/km) Figure 2.4. Flow-density relationship of traffic for both manual driving and automated driving. Velocity values (km/hr) are annotated on the curves. 2.3 PLATOON SIMULATION MODEL In order to study the emissions effect of vehicles traveling in platoons, a computer simulation model was developed. This microscale platooning model simulates individual vehicle behavior on a freeway and integrates each vehicle s calculated operating parameters to determine an emissions output, based on modal emissions model described in appendix A. Although multiple lanes have been implemented in the simulation, control has been implemented only in the longitudinal direction; lateral control for lane changing, platoon merging, and platoon splitting have not been implemented. 16
28 2.3.1 Vehicle Dynamics This simulation model considers at the fundamental level each vehicle s acceleration performance. The acceleration performance (in the longitudinal direction) is limited by the engine power and the traction limits on the drive wheels. Engine power is modeled in detailed using torque curves that vary with RPM (Gillespie 1992). For a more detailed estimation of engine power transferred to the road, a power train model was also developed. Vehicle acceleration due to engine power is modeled as follows (from Gillespie 1992) : a ep = 76.2 g HP V W (2-2) where g is the gravitational constant (9.8 m/sec 2 ), HP is the engine horsepower, V is the vehicle velocity (m/sec) and W is the weight of the vehicle (kg). The constant 76.2 converts from horsepower to m-kg/sec. This is the vehicle s acceleration, given in m/sec 2, due only to engine power. The effect of rolling resistance is based on the equation (after Gillespie 1992) : a rr = f r g (2-3) where f r is the rolling resistance coefficient, and again g is the gravitational constant. Note that this term is negative since the resistance results in negative acceleration. This rolling resistance coefficient takes into account energy due to deflection of the tire sidewall near the contact area, energy loss due to deflection of the road elements, scrubbing in the contact patch, tire slip in the longitudinal and lateral directions, deflection of the road surface, air drag on the inside and outside of the tire, and energy loss on bumps (Gillespie 1992). Changes in vehicle weight alters this relationship, but not significantly and therefore will not be considered. The effect of aerodynamic drag on acceleration is significant at high speeds. The drag depends on the dynamic pressure, and is proportional to the square of the speed. Acceleration loss due to aerodynamic drag is given as (Gillespie 1992) : a ad = ρ 2 gc D AV2 W (2-4) where ρ is the air density, C D is the aerodynamic drag coefficient, A is the frontal area of the vehicle, W is the vehicle weight, and V is the vehicle velocity. Again, this is a resistive force to the vehicle, and thus the acceleration is negative. 17
29 Because the follower vehicles within a platoon have very small intraplatoon spacings (e.g., on the order of one meter), the aerodynamic drag coefficient of each follower is significantly reduced due to the drafting effect (Zabat et al. 1993). Using preliminary aerodynamic drag reduction data for vehicles in platoons (Zabat et al. 1993), the calculated load on the engine is significantly smaller at higher speeds. Based on the data, even the lead vehicle of a platoon has its aerodynamic drag coefficient reduced due to the vehicle following closely behind. Therefore, when a vehicle travels in a platoon in the simulation, the aerodynamic drag coefficient is reduced by an adjustment factor derived from the results of (Zabat et al. 1993). Finally, the influence of road grade on acceleration is considered. This is a simple relationship which depends on the sine of the grade angle: a rg = g sin(θ) (2-5) If all of these equations are now put together to get the total vehicle acceleration, the result is: a total = a ep + a rr + a ad + a rg = 76.2 g HP V W f g ρ r 2 gc Dadj AV2 g sin(θ) W (2-6) where C Dadj is the adjusted aerodynamic drag coefficient due to drafting within the platoon. With this equation, it is possible to determine acceleration as a function of velocity, along with several constants. In the simulation, each vehicle was modeled as a 1991 Ford Taurus, which has the following characteristics: maximum horsepower 140 hp weight 2020 kg rolling resistance coefficient aerodynamic drag coefficient 0.42 frontal area 3.1 m 2 Table 2.1. Specifications of 1991 Ford Taurus. These values are combined with the following constants: 18
30 gravitational constant g 9.8 m/sec 2 air density ρ grade θ 0 Table 2.2. Environmental constants used in calculations. The vehicle dynamics of coasting (little or no engine power applied) are based on the rolling resistance and aerodynamic forces applied to each vehicle. The coasting acceleration (which is negative in this case, a deceleration) is given as: a coast = f r g ρ 2 gc D AV2 W g sin(θ) (2-7) The vehicle dynamics of braking are also considered, where it is assumed that a constant braking force F b is applied to the vehicle, resulting in negative acceleration. Thus, a braking term is introduced in the acceleration equation: a brake = F b g W f r g ρ 2 gc D AV2 W g sin(θ) (2-8) F b is the total of all braking forces, i.e., front axle braking force, rear axle braking force, and engine braking. If F b exceeds a certain threshold, then wheel lockup occurs, and the vehicle deceleration is dependent on the effective coefficient of friction at the tire-pavement contact surface Longitudinal Control In the simulation, it is assumed that longitudinal control for a platoon lead vehicle is based on the car following equation * : ẋ n+1 (t + t n+1 ) = S n+1 [ẋ n (t) ẋ n+1 (t)] [x n (t) x n+1 (t)] (2-9) where t n+1 is the reaction delay of vehicle n+1 and S n+1 is the sensitivity of vehicle n+1. Note that this equation bases the acceleration directly proportional to relative velocity (originally from Forbes theory (May 1990)) and inversely proportional to the distance headway (originally from * The longitudinal control of the platoon lead vehicle will likely be automated, using information based on link characteristics. However, in order to simulate safe gaps between platoons, a simple car-following equation is used. 19
31 Pipes theory (Pipes 1953) ). The sensitivity and reaction delay factors are stochastically assigned based on Gaussian probability densities derived from the literature (Barth et al. 1993). Longitudinal control for a follower vehicle in a platoon has been implemented using control laws for Coordinated Intelligent Cruise Control (CICC), and Autonomous Intelligent Cruise Control (AICC). The CICC algorithm is based on the work carried out by Desoer and Sheikholeslam (see, e.g., Sheikholeslam 1991) for the PATH program. The AICC algorithm is based on the work carried out by Ioannou et al. (Ioannou et al. 1992). * Platoon Generation The microscopic platoon model simulates a highway link that has a specified length, a specified number of lanes, and a specific grade. Given these input parameters, platoons are generated independently in each lane. The simulation models the generation of platoons on each lane as a modified Markov process. In a normal Markov process, times between generations have an exponential distribution with infinite support. In order to avoid extreme behavior in the simulation, inter-generation times which are extremely high (above five standard deviations) are eliminated and the remaining sample is shifted accordingly. The generation rate is given by: T next = log(u) mtbg V master (2-10) where T next is the calculated generation time, u is a uniformly distributed random variable between 0 and 1, mtbg is the mean time between generations of vehicles set by the front control panel of the simulation, and V master is a master volume constant for calibration (normally at 1) Simulation Flow The simulation flowchart is shown in figure 2.5. The simulation begins with the specified parameters of number of lanes, input density and speed, output density and speed, link length, and link grade. The simulation is first initialized, checking input from the front panel. Execution is halted if the quit button is pushed. The simulation has a master clock or simulation clock which is initially compared to the simulation time, or length of the current simulation. Platoons * The details of these control algorithms are extensive and thus are not given here. The reader is referred to the corresponding citations for each control algorithm. 20
32 can be generated manually or by an independent process, and if it is time to generate a platoon in any lane, the simulation processes the platoon leader generation. In the generation process, initial acceleration and velocity parameters are determined, after which the behavior parameters are set. At the end of the generation process, the next platoon generation time in the current lane is scheduled. Beginning with the first vehicle in each lane, the simulation runs through and updates each vehicle. Each lane is considered simultaneously, i.e., vehicles are updated based on their longitudinal position on the road, not just within their lane. If the current position of a vehicle is beyond the link length, then that vehicle is deleted from the vehicle list, and the updates continue with the next vehicle. When updating a vehicle, the car-following logic described previously is assigned for platoon leaders, or if a follower vehicle, the automated control algorithm is used. This updating continues until the last vehicle is updated. The simulation clock is then incremented, and the process repeats. This is an event-based simulation that schedules vehicle generations based on the generation process described above. The incrementing of the simulation is also based on events, where each update occurs at predetermined update rate. The current update rate is every 100 milliseconds. initialize simulation Start Quit? Y N Y clock > simulation time? N generate new platoon? Y N point to first vehicle pointing at last car? Y N End initialize acceleration & velocity Delete vehicle from list Y position link length? N generate response time, sensitivity, desired velocity apply car-following logic if leader compute time to next platoon generation apply automated control logic if follower increment simulation clock advance to next vehicle Figure 2.5. Overall flowchart of platoon simulation. 21
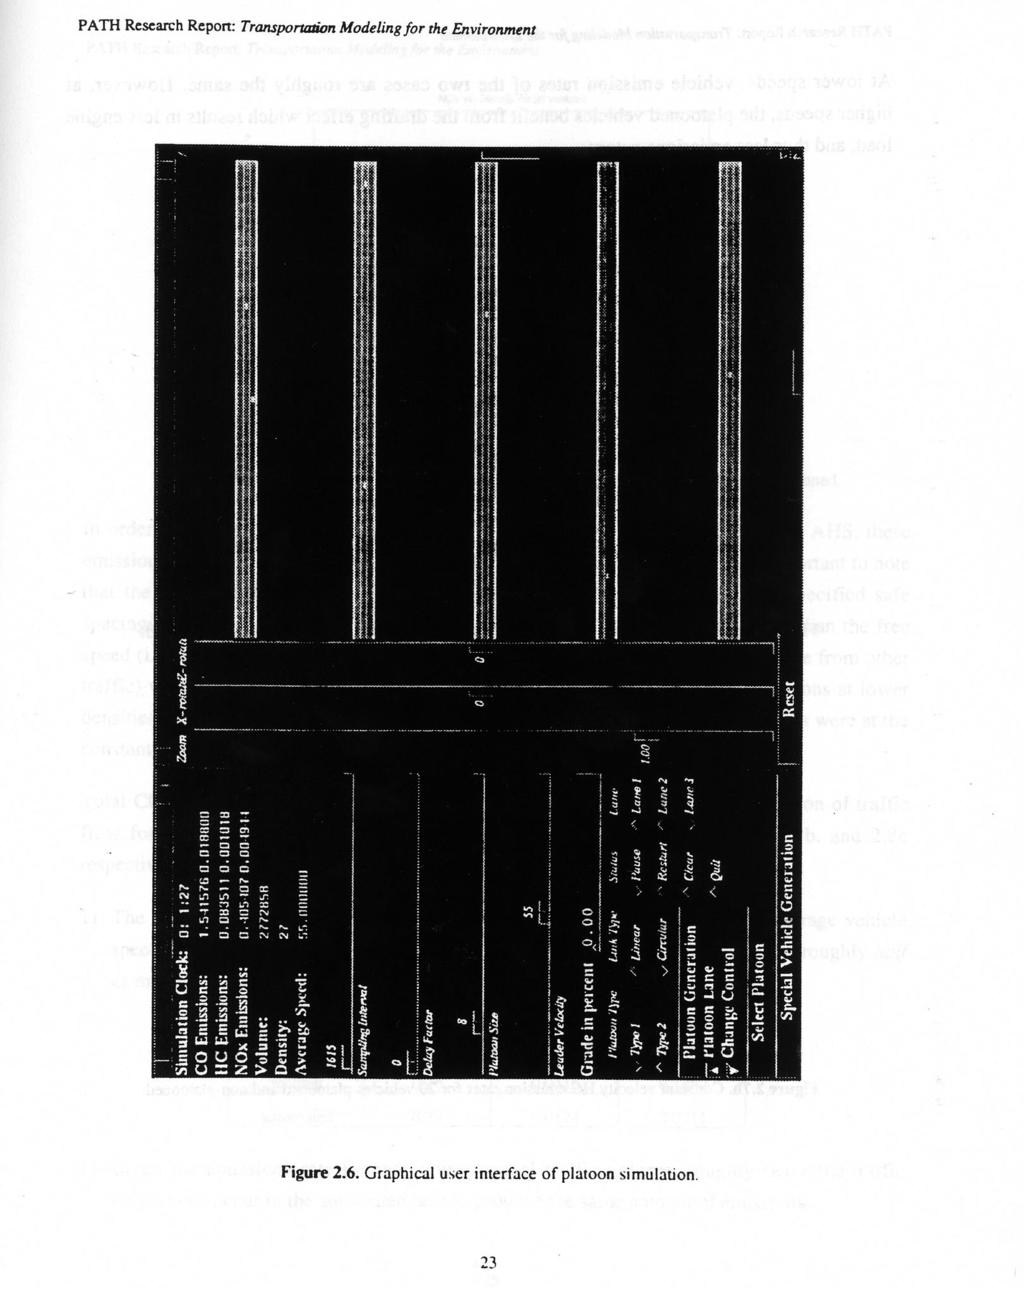
33 2.3.5 Graphical User Interface The graphical user interface of the platoon simulation model is shown in figure 2.6. The controls of the simulation are on the left, and the view area of the simulation is shown on the right. In the view area, platoons of vehicles are generated on the lanes starting in the upper left corner. The lanes go left to right, and wrap around to the next level. The vehicles reach the end of the link in the lower right corner, where they disappear from the screen. The link can also be made circular so that platoons continue from the end of the link back onto the beginning of the link. The roadway and platoons are represented with 3D graphics and can be viewed from any 3D vantage point. The 3D is useful to see the effect of road grade. The colors of the vehicles indicate whether a vehicle is a platoon leader or a follower vehicle. The simulation clock is shown in the upper right of the control section, followed by second-bysecond emission values for CO, HC, and NO x. The emission values are given as link totals and as average vehicle values. The density and average speed of the link are also shown. The simulation time is controlled by the sampling interval, and the delay factor determines how quickly the simulation runs. The size of the platoon can be set manually, or set randomly within the simulation. The leader velocity of each platoon can be set via an external driving cycle file, or can be controlled manually by selecting the platoon and using the leader velocity slider. The type of control (i.e., AICC, CICC) for the platoons can be selected with the platoon type button. Platoons can be generated manually with the platoon generation button, or can be generated randomly within the simulation. Buttons near the bottom allow the simulation to advance, halt, pause, restart, and clear. The entire simulation can be stopped with the quit button. 2.4 STEADY-STATE SPEED EMISSIONS In order to determine emissions associated with platooning, we first only consider steady-state vehicle speeds and the associated emissions. Traffic at steady-state speeds implies that there is little or no traffic interaction, vehicles are traveling near their assigned free speeds, and there are no variations in velocity (i.e., no congestion stop-and-go). Using the power-demand emissions model in conjunction with the platoon simulator described earlier, experiments were carried out to determine average emission rates of platoons at different steady-state velocities. Emissions from a platoon of 20 vehicles are compared directly to that of 20 non-platooned vehicles (i.e., manually driven vehicles). The emission rates at different velocities are shown in figures 2.7a, 2.7b, and 2.7c. 22
34
Transportation Modeling for the Environment: Final Report
 CALIFORNIA PATH PROGRAM INSTITUTE OF TRANSPORTATION STUDIES UNIVERSITY OF CALIFORNIA, BERKELEY Transportation Modeling for the Environment: Final Report Matthew J. Barth Joseph M. Norbeck University of
Fleet Penetration of Automated Vehicles: A Microsimulation Analysis
 Fleet Penetration of Automated Vehicles: A Microsimulation Analysis Corresponding Author: Elliot Huang, P.E. Co-Authors: David Stanek, P.E. Allen Wang 2017 ITE Western District Annual Meeting San Diego,
What do autonomous vehicles mean to traffic congestion and crash? Network traffic flow modeling and simulation for autonomous vehicles
 What do autonomous vehicles mean to traffic congestion and crash? Network traffic flow modeling and simulation for autonomous vehicles FINAL RESEARCH REPORT Sean Qian (PI), Shuguan Yang (RA) Contract No.
LARGE source of greenhouse gas emissions, and therefore a large
 TRAFFIC CONGESTION AND GREENHOUSE GA SES B Y M AT T H E W B A R T H A N D K A N O K B O R I B O O N S O M S I N SU R F A C E T R A N S P O R T A T I O N I N T H E U N I T E D S T A T E S I S A LARGE source
A Review on Cooperative Adaptive Cruise Control (CACC) Systems: Architectures, Controls, and Applications
 Systems: Architectures, Controls, and Applications") A Review on Cooperative Adaptive Cruise Control (CACC) Systems: Architectures, Controls, and Applications Ziran Wang (presenter), Guoyuan Wu, and Matthew J. Barth University of California, Riverside Nov.
A Review on Cooperative Adaptive Cruise Control (CACC) Systems: Architectures, Controls, and Applications Ziran Wang (presenter), Guoyuan Wu, and Matthew J. Barth University of California, Riverside Nov.
Spatial and Temporal Analysis of Real-World Empirical Fuel Use and Emissions
 Spatial and Temporal Analysis of Real-World Empirical Fuel Use and Emissions Extended Abstract 27-A-285-AWMA H. Christopher Frey, Kaishan Zhang Department of Civil, Construction and Environmental Engineering,
Acceleration Behavior of Drivers in a Platoon
 University of Iowa Iowa Research Online Driving Assessment Conference 2001 Driving Assessment Conference Aug 1th, :00 AM Acceleration Behavior of Drivers in a Platoon Ghulam H. Bham University of Illinois
Developing a Platoon-Wide Eco-Cooperative Adaptive Cruise Control (CACC) System
 System") Developing a Platoon-Wide Eco-Cooperative Adaptive Cruise Control (CACC) System 2017 Los Angeles Environmental Forum August 28th Ziran Wang ( 王子然 ), Guoyuan Wu, Peng Hao, Kanok Boriboonsomsin, and Matthew
Developing a Platoon-Wide Eco-Cooperative Adaptive Cruise Control (CACC) System 2017 Los Angeles Environmental Forum August 28th Ziran Wang ( 王子然 ), Guoyuan Wu, Peng Hao, Kanok Boriboonsomsin, and Matthew
Alpine Highway to North County Boulevard Connector Study
 Alpine Highway to North County Boulevard Connector Study prepared by Avenue Consultants March 16, 2017 North County Boulevard Connector Study March 16, 2017 Table of Contents 1 Summary of Findings... 1
Estimating Emissions and Fuel Consumption for Different Levels of Freeway Congestion
 TRANSPORTATION RESEARCH RECORD 1664 Paper No. 99-1339 47 Estimating Emissions and Fuel Consumption for Different Levels of Freeway Congestion MATTHEW BARTH, GEORGE SCORA, AND THEODORE YOUNGLOVE To improve
Funding Scenario Descriptions & Performance
 Funding Scenario Descriptions & Performance These scenarios were developed based on direction set by the Task Force at previous meetings. They represent approaches for funding to further Task Force discussion
Measuring Autonomous Vehicle Impacts on Congested Networks Using Simulation
 0 Measuring Autonomous Vehicle Impacts on Congested Networks Using Simulation Corresponding Author: David Stanek, PE Fehr & Peers 0 K Street, rd Floor, Sacramento, CA Tel: () -; Fax: () -0; Email: D.Stanek@fehrandpeers.com
Simulating Trucks in CORSIM
 Simulating Trucks in CORSIM Minnesota Department of Transportation September 13, 2004 Simulating Trucks in CORSIM. Table of Contents 1.0 Overview... 3 2.0 Acquiring Truck Count Information... 5 3.0 Data
University Of California, Berkeley Department of Mechanical Engineering. ME 131 Vehicle Dynamics & Control (4 units)
") CATALOG DESCRIPTION University Of California, Berkeley Department of Mechanical Engineering ME 131 Vehicle Dynamics & Control (4 units) Undergraduate Elective Syllabus Physical understanding of automotive
CATALOG DESCRIPTION University Of California, Berkeley Department of Mechanical Engineering ME 131 Vehicle Dynamics & Control (4 units) Undergraduate Elective Syllabus Physical understanding of automotive
Level of Service Classification for Urban Heterogeneous Traffic: A Case Study of Kanapur Metropolis
 Level of Service Classification for Urban Heterogeneous Traffic: A Case Study of Kanapur Metropolis B.R. MARWAH Professor, Department of Civil Engineering, I.I.T. Kanpur BHUVANESH SINGH Professional Research
AND CHANGES IN URBAN MOBILITY PATTERNS
 TECHNOLOGY-ENABLED MOBILITY: Virtual TEsting of Autonomous Vehicles AND CHANGES IN URBAN MOBILITY PATTERNS Technology-Enabled Mobility In the era of the digital revolution everything is inter-connected.
Research Challenges for Automated Vehicles
 Research Challenges for Automated Vehicles Steven E. Shladover, Sc.D. University of California, Berkeley October 10, 2005 1 Overview Reasons for automating vehicles How automation can improve efficiency
The Role of Vehicle Automation and Intelligent Transportation Systems in Sustainable Transportation
 The Role of Vehicle Automation and Intelligent Transportation Systems in Sustainable Transportation Barth Memorial Symposium May 15, 2015 Matthew Barth Yeager Families Chair Director, Center for Environmental
DOE s Focus on Energy Efficient Mobility Systems
 DOE s Focus on Energy Efficient Mobility Systems David L. Anderson Energy Efficient Mobility Systems Program Vehicle Technologies Office Automated Vehicle Symposium San Francisco, California July 13, 2017
Vehicle Performance. Pierre Duysinx. Research Center in Sustainable Automotive Technologies of University of Liege Academic Year
 Vehicle Performance Pierre Duysinx Research Center in Sustainable Automotive Technologies of University of Liege Academic Year 2015-2016 1 Lesson 4: Fuel consumption and emissions 2 Outline FUEL CONSUMPTION
Travel Time Savings Memorandum
 04-05-2018 TABLE OF CONTENTS 1 Background 3 Methodology 3 Inputs and Calculation 3 Assumptions 4 Light Rail Transit (LRT) Travel Times 5 Auto Travel Times 5 Bus Travel Times 6 Findings 7 Generalized Cost
The Evolution of Side Crash Compatibility Between Cars, Light Trucks and Vans
 2003-01-0899 The Evolution of Side Crash Compatibility Between Cars, Light Trucks and Vans Hampton C. Gabler Rowan University Copyright 2003 SAE International ABSTRACT Several research studies have concluded
Control Design of an Automated Highway System (Roberto Horowitz and Pravin Varaiya) Presentation: Erik Wernholt
 Presentation: Erik Wernholt") Control Design of an Automated Highway System (Roberto Horowitz and Pravin Varaiya) Presentation: Erik Wernholt 2001-05-11 1 Contents Introduction What is an AHS? Why use an AHS? System architecture Layers
Control Design of an Automated Highway System (Roberto Horowitz and Pravin Varaiya) Presentation: Erik Wernholt 2001-05-11 1 Contents Introduction What is an AHS? Why use an AHS? System architecture Layers
Development of a Drayage Truck Chassis Dynamometer Test Cycle. Report FINAL
 Development of a Drayage Truck Chassis Dynamometer Test Cycle Report FINAL Prepared for: Port of Long Beach/ Contract HD-7188 Port of Los Angeles/ Tetra Tech September 2011 Prepared by Patrick Couch Jon
FIELD APPLICATIONS OF CORSIM: I-40 FREEWAY DESIGN EVALUATION, OKLAHOMA CITY, OK. Michelle Thomas
 Proceedings of the 1998 Winter Simulation Conference D.J. Medeiros, E.F. Watson, J.S. Carson and M.S. Manivannan, eds. FIELD APPLICATIONS OF CORSIM: I-40 FREEWAY DESIGN EVALUATION, OKLAHOMA CITY, OK Gene
Manual for Assessing Safety Hardware
 American Association of State Highway and Transportation Officials Manual for Assessing Safety Hardware 2009 vii PREFACE Effective traffic barrier systems, end treatments, crash cushions, breakaway devices,
Partial Automation for Truck Platooning
 Partial Automation for Truck Platooning Observations and Lessons Learned to Date from California's Experience with Truck Platooning Matt Hanson 2017 ITS CA Conference September 18, 2017 Burlingame, CA
Technical Memorandum Analysis Procedures and Mobility Performance Measures 100 Most Congested Texas Road Sections What s New for 2015
 Technical Memorandum Analysis Procedures and Mobility Performance Measures 100 Most Congested Texas Road Sections Prepared by Texas A&M Transportation Institute August 2015 This memo documents the analysis
Interstate Operations Study: Fargo-Moorhead Metropolitan Area Simulation Results
 NDSU Dept #2880 PO Box 6050 Fargo, ND 58108-6050 Tel 701-231-8058 Fax 701-231-6265 www.ugpti.org www.atacenter.org Interstate Operations Study: Fargo-Moorhead Metropolitan Area 2025 Simulation Results
Reducing Energy Consumption and Emissions Through Congestion Management
 Reducing Energy Consumption and Emissions Through Congestion Management Kanok Boriboonsomsin University of California Riverside The Transportation - Land Use - Environment Connection UCLA Conference Center
EXECUTIVE SUMMARY. The following is an outline of the traffic analysis performed by Hales Engineering for the traffic conditions of this project.
 EXECUTIVE SUMMARY This study addresses the traffic impacts associated with the proposed Shopko redevelopment located in Sugarhouse, Utah. The Shopko redevelopment project is located between 1300 East and
Traffic Management through C-ITS and Automation: a perspective from the U.S.
 Traffic Management through C-ITS and Automation: a perspective from the U.S. Matthew Barth University of California-Riverside Yeager Families Professor Director, Center for Environmental Research and Technology
IMAGE PROCESSING ANALYSIS OF MOTORCYCLE ORIENTED MIXED TRAFFIC FLOW IN VIETNAM
 IMAGE PROCESSING ANALYSIS OF MOTORCYCLE ORIENTED MIXED TRAFFIC FLOW IN VIETNAM Nobuyuki MATSUHASHI Graduate Student Dept. of Info. Engineering and Logistics Tokyo University of Marine Science and Technology
The Boston South Station HSIPR Expansion Project Cost-Benefit Analysis. High Speed Intercity Passenger Rail Technical Appendix
 The Boston South Station HSIPR Expansion Project Cost-Benefit Analysis High Speed Intercity Passenger Rail Technical Appendix Prepared by HDR August 5, 2010 The Boston South Station HSIPR Expansion Project
CALIBRATING FUEL CONSUMPTION AND EMISSION MODELS FOR MODERN VEHICLES
 CALIBRATING FUEL CONSUMPTION AND EMISSION MODELS FOR MODERN VEHICLES Rahmi Akçelik Robin Smit Mark Besley IPENZ Transportation Group Conference March 2012 sidrasolutions.com sidrasolutions.com/forums youtube.com/sidrasolutions
2012 Air Emissions Inventory
 SECTION 6 HEAVY-DUTY VEHICLES This section presents emissions estimates for the heavy-duty vehicles (HDV) source category, including source description (6.1), geographical delineation (6.2), data and information
WHITE PAPER. Preventing Collisions and Reducing Fleet Costs While Using the Zendrive Dashboard
 WHITE PAPER Preventing Collisions and Reducing Fleet Costs While Using the Zendrive Dashboard August 2017 Introduction The term accident, even in a collision sense, often has the connotation of being an
IMPACT OF AUTOMATED HIGHWAY SYSTEMS ON INTELLIGENT TRANSPORTATION SYSTEMS RESEARCH.
 IMPACT OF AUTOMATED HIGHWAY SYSTEMS ON INTELLIGENT TRANSPORTATION SYSTEMS RESEARCH. Submitted by NIKHIL MENON (B060496CE) Guide Dr.K.Krishnamurthy (CED) CONTENTS TIMELINE of AHS Chronological Developments.
Are Roundabout Environmentally Friendly? An Evaluation for Uniform Approach Demands
 1 2 3 4 5 6 7 8 9 10 11 12 13 14 15 16 17 18 19 20 21 22 23 24 25 Are Roundabout Environmentally Friendly? An Evaluation for Uniform Approach Demands Meredith Jackson Charles E. Via, Jr. Department of
2016 Congestion Report
 2016 Congestion Report Metropolitan Freeway System May 2017 2016 Congestion Report 1 Table of Contents Purpose and Need...3 Introduction...3 Methodology...4 2016 Results...5 Explanation of Percentage Miles
Vehicle Dynamics and Control
 Rajesh Rajamani Vehicle Dynamics and Control Springer Contents Dedication Preface Acknowledgments v ix xxv 1. INTRODUCTION 1 1.1 Driver Assistance Systems 2 1.2 Active Stabiüty Control Systems 2 1.3 RideQuality
A Cost Benefit Analysis of Faster Transmission System Protection Schemes and Ground Grid Design
 A Cost Benefit Analysis of Faster Transmission System Protection Schemes and Ground Grid Design Presented at the 2018 Transmission and Substation Design and Operation Symposium Revision presented at the
CAPTURING THE SENSITIVITY OF TRANSIT BUS EMISSIONS TO CONGESTION, GRADE, PASSENGER LOADING, AND FUELS
 CAPTURING THE SENSITIVITY OF TRANSIT BUS EMISSIONS TO CONGESTION, GRADE, PASSENGER LOADING, AND FUELS Ahsan Alam and Marianne Hatzopoulou, McGill University, Canada Introduction Transit is considered as
The Status of Transportation Funding, Road Charge and Vehicle Miles Traveled in California
 The Status of Transportation Funding, Road Charge and Vehicle Miles Traveled in California Long-Term Policy Options for Sustainable Transportation Options NCSL State Transportation Leaders Symposium October
Air Quality Impacts of Advance Transit s Fixed Route Bus Service
 Air Quality Impacts of Advance Transit s Fixed Route Bus Service Final Report Prepared by: Upper Valley Lake Sunapee Regional Planning Commission 10 Water Street, Suite 225 Lebanon, NH 03766 Prepared for:
The major roadways in the study area are State Route 166 and State Route 33, which are shown on Figure 1-1 and described below:
 3.5 TRAFFIC AND CIRCULATION 3.5.1 Existing Conditions 3.5.1.1 Street Network DRAFT ENVIRONMENTAL IMPACT REPORT The major roadways in the study area are State Route 166 and State Route 33, which are shown
MECA DEMONSTRATION PROGRAM OF ADVANCED EMISSION CONTROL SYSTEMS FOR LIGHT-DUTY VEHICLES FINAL REPORT
 MECA DEMONSTRATION PROGRAM OF ADVANCED EMISSION CONTROL SYSTEMS FOR LIGHT-DUTY VEHICLES FINAL REPORT May 1999 THE MANUFACTURERS OF EMISSION CONTROLS ASSOCIATION 1660 L Street NW Suite 1100 Washington,
Metropolitan Freeway System 2013 Congestion Report
 Metropolitan Freeway System 2013 Congestion Report Metro District Office of Operations and Maintenance Regional Transportation Management Center May 2014 Table of Contents PURPOSE AND NEED... 1 INTRODUCTION...
APPENDIX C ROADWAY BEFORE-AND-AFTER STUDY
 APPENDIX C ROADWAY BEFORE-AND-AFTER STUDY The benefits to pedestrians and bus patrons are numerous when a bus bay is replaced with a bus bulb. Buses should operate more efficiently at the stop when not
MEMORANDUM. Proposed Town of Chapel Hill Green Fleets Policy
 AGENDA #4k MEMORANDUM TO: FROM: SUBJECT: Mayor and Town Council W. Calvin Horton, Town Manager Proposed Town of Chapel Hill Green Fleets Policy DATE: June 15, 2005 The attached resolution would adopt the
Sight Distance. A fundamental principle of good design is that
 Session 9 Jack Broz, PE, HR Green May 5-7, 2010 Sight Distance A fundamental principle of good design is that the alignment and cross section should provide adequate sight lines for drivers operating their
Fueling Savings: Higher Fuel Economy Standards Result In Big Savings for Consumers
 Fueling Savings: Higher Fuel Economy Standards Result In Big Savings for Consumers Prepared for Consumers Union September 7, 2016 AUTHORS Tyler Comings Avi Allison Frank Ackerman, PhD 485 Massachusetts
FREQUENTLY ASKED QUESTIONS
 FREQUENTLY ASKED QUESTIONS 2018 What is the More MARTA Atlanta program? The More MARTA Atlanta program is a collaborative partnership between MARTA and the City of Atlanta to develop and implement a program
Performance Measure Summary - Fresno CA. Performance Measures and Definition of Terms
 Performance Measure Summary - Fresno CA There are several inventory and performance measures listed in the pages of this Urban Area Report for the years from 1982 to 2014. There is no single performance
Eco-Signal Operations Concept of Operations
 Eco-Signal Operations Concept of Operations Applications for the Environment: Real-Time Information Synthesis (AERIS) Adapted from the Eco-Signal Operations Concept of Operations Document AERIS Operational
Traffic and Toll Revenue Estimates
 The results of WSA s assessment of traffic and toll revenue characteristics of the proposed LBJ (MLs) are presented in this chapter. As discussed in Chapter 1, Alternatives 2 and 6 were selected as the
Performance Measure Summary - Pensacola FL-AL. Performance Measures and Definition of Terms
 Performance Measure Summary - Pensacola FL-AL There are several inventory and performance measures listed in the pages of this Urban Area Report for the years from 1982 to 2014. There is no single performance
WHITE PAPER Autonomous Driving A Bird s Eye View
 WHITE PAPER www.visteon.com Autonomous Driving A Bird s Eye View Autonomous Driving A Bird s Eye View How it all started? Over decades, assisted and autonomous driving has been envisioned as the future
Opportunities to Leverage Advances in Driverless Car Technology to Evolve Conventional Bus Transit Systems
 Opportunities to Leverage Advances in Driverless Car Technology to Evolve Conventional Bus Transit Systems Podcar City 7 Symposium Emerging Transportation Technologies R&D George Mason University, October
NEW HAVEN HARTFORD SPRINGFIELD RAIL PROGRAM
 NEW HAVEN HARTFORD SPRINGFIELD RAIL PROGRAM Hartford Rail Alternatives Analysis www.nhhsrail.com What Is This Study About? The Connecticut Department of Transportation (CTDOT) conducted an Alternatives
An Innovative Approach
 Traffic Flow Theory and its Applications in Urban Environments An Innovative Approach Presented by Dr. Jin Cao 30.01.18 1 Traffic issues in urban environments Pedestrian 30.01.18 Safety Environment 2 Traffic
REALIZING THE AIR QUALITY BENEFITS OF PORT INFRASTRUCTURE PROJECTS. A Case Study of the Alameda Corridor
 REALIZING THE AIR QUALITY BENEFITS OF PORT INFRASTRUCTURE PROJECTS A Case Study of the Alameda Corridor April 29, 25 Dr. Margaret Lobnitz, Weston Solutions, Inc. 1 BACKGROUND In mid-198 s, growing concern
Performance Measure Summary - Large Area Sum. Performance Measures and Definition of Terms
 Performance Measure Summary - Large Area Sum There are several inventory and performance measures listed in the pages of this Urban Area Report for the years from 1982 to 2014. There is no single performance
Performance Measure Summary - Medium Area Sum. Performance Measures and Definition of Terms
 Performance Measure Summary - Medium Area Sum There are several inventory and performance measures listed in the pages of this Urban Area Report for the years from 1982 to 2014. There is no single performance
Appendix B CTA Transit Data Supporting Documentation
 RED ED-PURPLE BYPASS PROJECT ENVIRONMENTAL ASSESSMENT AND SECTION 4(F) EVALUATION Appendix B CTA Transit Data Supporting Documentation 4( Memorandum Date: May 14, 2015 Subject: Chicago Transit Authority
Modeling Multi-Objective Optimization Algorithms for Autonomous Vehicles to Enhance Safety and Energy Efficiency
 2015 NDIA GROUND VEHICLE SYSTEMS ENGINEERING AND TECHNOLOGY SYMPOSIUM MODELING & SIMULATION, TESTING AND VALIDATION (MSTV) TECHNICAL SESSION AUGUST 4-6, 2015 - NOVI, MICHIGAN Modeling Multi-Objective Optimization
Appendix A.1 Calculations of Engine Exhaust Gas Composition...9
 Foreword...xi Acknowledgments...xiii Introduction... xv Chapter 1 Engine Emissions...1 1.1 Characteristics of Engine Exhaust Gas...1 1.1.1 Major Components of Engine Exhaust Gas...1 1.1.2 Units Used for
Efficiency Matters for Mobility. Presented at A3PS ECO MOBILITY 2018 Vienna, Austria November 12 th and 13 th, 2018
 Efficiency Matters for Mobility High-Performance, Ann M. Schlenker Agent-Based Director, Simulation Center for of Transportation Travelers Research and Transportation Argonne National Laboratory Systems
Online Appendix for Subways, Strikes, and Slowdowns: The Impacts of Public Transit on Traffic Congestion
 Online Appendix for Subways, Strikes, and Slowdowns: The Impacts of Public Transit on Traffic Congestion ByMICHAELL.ANDERSON AI. Mathematical Appendix Distance to nearest bus line: Suppose that bus lines
Performance Measures and Definition of Terms
 Performance Measure Summary - All 471 Areas Sum There are several inventory and performance measures listed in the pages of this Urban Area Report for the years from 1982 to 2014. There is no single performance
Update Heavy-Duty Engine Emission Conversion Factors for MOBILE6
 United States Environmental Protection Agency Air and Radiation EPA420-R-02-005 January 2002 M6.HDE.004 Update Heavy-Duty Engine Emission Conversion Factors for MOBILE6 Analysis of BSFCs and Calculation
National Road Safety Action Plan in China
 Sixth SHRP 2 Safety Research Symposium National Road Safety Action Plan in China Dr. Yan Wang July 14, 2011 Washington DC, USA Outline 1 Initiative of Road Safety Action Plan 2 Phase I 3 For Next Phase?
Engineering Dept. Highways & Transportation Engineering
 The University College of Applied Sciences UCAS Engineering Dept. Highways & Transportation Engineering (BENG 4326) Instructors: Dr. Y. R. Sarraj Chapter 4 Traffic Engineering Studies Reference: Traffic
Interstate Operations Study: Fargo-Moorhead Metropolitan Area Simulation Output
 NDSU Dept #2880 PO Box 6050 Fargo, ND 58108-6050 Tel 701-231-8058 Fax 701-231-6265 www.ugpti.org www.atacenter.org Interstate Operations Study: Fargo-Moorhead Metropolitan Area 2015 Simulation Output Technical
Functional Algorithm for Automated Pedestrian Collision Avoidance System
 Functional Algorithm for Automated Pedestrian Collision Avoidance System Customer: Mr. David Agnew, Director Advanced Engineering of Mobis NA Sep 2016 Overview of Need: Autonomous or Highly Automated driving
Development of Turning Templates for Various Design Vehicles
 Transportation Kentucky Transportation Center Research Report University of Kentucky Year 1991 Development of Turning Templates for Various Design Vehicles Kenneth R. Agent Jerry G. Pigman University of
Conventional Approach
 Session 6 Jack Broz, PE, HR Green May 5-7, 2010 Conventional Approach Classification required by Federal law General Categories: Arterial Collector Local 6-1 Functional Classifications Changing Road Classification
Performance Measure Summary - Austin TX. Performance Measures and Definition of Terms
 Performance Measure Summary - Austin TX There are several inventory and performance measures listed in the pages of this Urban Area Report for the years from 1982 to 2014. There is no single performance
Performance Measure Summary - Pittsburgh PA. Performance Measures and Definition of Terms
 Performance Measure Summary - Pittsburgh PA There are several inventory and performance measures listed in the pages of this Urban Area Report for the years from 1982 to 2014. There is no single performance
Performance Measure Summary - New Orleans LA. Performance Measures and Definition of Terms
 Performance Measure Summary - New Orleans LA There are several inventory and performance measures listed in the pages of this Urban Area Report for the years from 1982 to 2014. There is no single performance
Performance Measure Summary - Portland OR-WA. Performance Measures and Definition of Terms
 Performance Measure Summary - Portland OR-WA There are several inventory and performance measures listed in the pages of this Urban Area Report for the years from 1982 to 2014. There is no single performance
Performance Measure Summary - Oklahoma City OK. Performance Measures and Definition of Terms
 Performance Measure Summary - Oklahoma City OK There are several inventory and performance measures listed in the pages of this Urban Area Report for the years from 1982 to 2014. There is no single performance
Performance Measure Summary - Seattle WA. Performance Measures and Definition of Terms
 Performance Measure Summary - Seattle WA There are several inventory and performance measures listed in the pages of this Urban Area Report for the years from 1982 to 2014. There is no single performance
Performance Measure Summary - Buffalo NY. Performance Measures and Definition of Terms
 Performance Measure Summary - Buffalo NY There are several inventory and performance measures listed in the pages of this Urban Area Report for the years from 1982 to 2014. There is no single performance
NCHRP PROJECT VEHICLE EMISSIONS DATABASE
 NCHRP PROJECT 25-11 VEHICLE EMISSIONS DATABASE INTRODUCTION An extensive vehicle emissions testing program was conducted from April 1996 to September 1998 at the College of Engineering-Center for Environmental
Performance Measure Summary - Hartford CT. Performance Measures and Definition of Terms
 Performance Measure Summary - Hartford CT There are several inventory and performance measures listed in the pages of this Urban Area Report for the years from 1982 to 2014. There is no single performance
Performance Measure Summary - Boise ID. Performance Measures and Definition of Terms
 Performance Measure Summary - Boise ID There are several inventory and performance measures listed in the pages of this Urban Area Report for the years from 1982 to 2014. There is no single performance
Performance Measure Summary - Tucson AZ. Performance Measures and Definition of Terms
 Performance Measure Summary - Tucson AZ There are several inventory and performance measures listed in the pages of this Urban Area Report for the years from 1982 to 2014. There is no single performance
Route-Based Energy Management for PHEVs: A Simulation Framework for Large-Scale Evaluation
 Transportation Technology R&D Center Route-Based Energy Management for PHEVs: A Simulation Framework for Large-Scale Evaluation Dominik Karbowski, Namwook Kim, Aymeric Rousseau Argonne National Laboratory,
Performance Measure Summary - Wichita KS. Performance Measures and Definition of Terms
 Performance Measure Summary - Wichita KS There are several inventory and performance measures listed in the pages of this Urban Area Report for the years from 1982 to 2014. There is no single performance
Performance Measure Summary - Spokane WA. Performance Measures and Definition of Terms
 Performance Measure Summary - Spokane WA There are several inventory and performance measures listed in the pages of this Urban Area Report for the years from 1982 to 2014. There is no single performance
TITLE 16. TRANSPORTATION CHAPTER 27. TRAFFIC REGULATIONS AND TRAFFIC CONTROL DEVICES
 NOTE: This is a courtesy copy of this rule. The official version can be found in the New Jersey Administrative Code. Should there be any discrepancies between this text and the official version, the official
JCE 4600 Basic Freeway Segments
 JCE 4600 Basic Freeway Segments HCM Applications What is a Freeway? divided highway with full control of access two or more lanes for the exclusive use of traffic in each direction no signalized or stop-controlled
Lecture 4: Capacity and Level of Service (LoS) of Freeways Basic Segments. Prof. Responsável: Filipe Moura
 of Freeways Basic Segments. Prof. Responsável: Filipe Moura") Lecture 4: Capacity and Level of Service (LoS) of Freeways Basic Segments Prof. Responsável: Filipe Moura Engenharia de Tráfego Rodoviário Lecture 4 - Basic Freeway segments 1 CAPACITY AND LEVEL OF SERVICE
Lecture 4: Capacity and Level of Service (LoS) of Freeways Basic Segments Prof. Responsável: Filipe Moura Engenharia de Tráfego Rodoviário Lecture 4 - Basic Freeway segments 1 CAPACITY AND LEVEL OF SERVICE
Traffic Signal Volume Warrants A Delay Perspective
 Traffic Signal Volume Warrants A Delay Perspective The Manual on Uniform Traffic Introduction The 2009 Manual on Uniform Traffic Control Devices (MUTCD) Control Devices (MUTCD) 1 is widely used to help
REAL WORLD DRIVING. Fuel Efficiency & Emissions Testing. Prepared for the Australian Automobile Association
 REAL WORLD DRIVING Fuel Efficiency & Emissions Testing Prepared for the Australian Automobile Association - 2016 2016 ABMARC Disclaimer By accepting this report from ABMARC you acknowledge and agree to
Performance Measure Summary - Grand Rapids MI. Performance Measures and Definition of Terms
 Performance Measure Summary - Grand Rapids MI There are several inventory and performance measures listed in the pages of this Urban Area Report for the years from 1982 to 2014. There is no single performance
FE151 Aluminum Association Inc. Impact of Vehicle Weight Reduction on a Class 8 Truck for Fuel Economy Benefits
 FE151 Aluminum Association Inc. Impact of Vehicle Weight Reduction on a Class 8 Truck for Fuel Economy Benefits 08 February, 2010 www.ricardo.com Agenda Scope and Approach Vehicle Modeling in MSC.EASY5
Performance Measure Summary - Washington DC-VA-MD. Performance Measures and Definition of Terms
 Performance Measure Summary - Washington DC-VA-MD There are several inventory and performance measures listed in the pages of this Urban Area Report for the years from 1982 to 2014. There is no single
Analyzing Crash Risk Using Automatic Traffic Recorder Speed Data
 Analyzing Crash Risk Using Automatic Traffic Recorder Speed Data Thomas B. Stout Center for Transportation Research and Education Iowa State University 2901 S. Loop Drive Ames, IA 50010 stouttom@iastate.edu