2 nd Quarter of FY05/10 Results Meeting Presentation
|
|
|
- Imogene Bradley
- 5 years ago
- Views:
Transcription

1 表紙 VV 2 nd Quarter of FY05/10 Results Meeting Presentation
2 Note: Any current plans, forecasts, strategy projections, expressions of confidence and other statements made by us in these materials are premised on the information that was available at the moment of the initial publication and on models that depend on uncertain factors that could impact future earnings. As the actual results may substantially differ from the projections represented herein due to a variety of reasons, we urge you not to rely solely on these materials. These materials are not a solicitation to invest. Please rely on your own judgment when making investment decisions.
3 PL(Consolidated) Income Statement Cons.Act. Cons.Act. Cons.Est. FY05/09 FY05/10 (Million Yen) Q1 Q2 Q3 Q4 Q1 Q2 Q3 Q4 Sales 7,343 7,462 10,739 7,682 8,630 8,273 10,352 10,385 SG&A 2,270 2,723 2,798 2,831 2,799 2,879 3,148 3,301 Labor 995 1,094 1,150 1,198 1,248 1,246 1,438 1,380 Rent Depreciation Operating Profit , , Recurring Profit , ,118 1,026 Net Profit Sales YoY 16.2% 21.5% 35.6% 5.3% 17.5% 10.9% -3.6% 35.2% SG&A YoY 22.2% 33.5% 30.1% 28.9% 23.3% 5.7% 12.5% 16.6% Labor YoY 19.9% 23.9% 27.4% 30.2% 25.4% 13.9% 25.0% 15.2% Rent YoY 17.7% 22.0% 24.9% 19.9% 19.1% 12.6% -1.9% 13.0% Depreciation YoY -9.2% 69.6% 50.0% 41.3% 47.8% 13.7% 21.3% 18.6% Operating Profit YoY 8.0% -31.8% 9.4% 23.2% 9.3% 46.5% -1.3% 15.2% Recurring Profit YoY 9.4% -30.8% 8.9% 20.0% 8.1% 43.5% -4.0% 18.9% Net Profit YoY 8.4% -30.5% 1.3% 148.9% 11.6% 39.7% 6.4% 22.0% Operating Profit Margin 10.0% 5.0% 10.7% 11.3% 9.3% 6.6% 11.0% 9.6% Recurring Profit Margin 10.3% 5.2% 10.8% 11.2% 9.4% 6.8% 10.8% 9.9% Net Profit Margin 5.6% 2.9% 5.6% 6.1% 5.4% 3.6% 6.2% 5.5% The figures for Q3 and Q4 of FY05/09 are calculated based on the revised plan post Jan. 9, 2009 earnings revision.
4 BS(Consolidated) Balance Sheet Cons.Act. Cons.Act. Cons.Est. FY05/09 FY05/10 (Million Yen) Q1 Q2 Q3 Q4 Q1 Q2 Q3 Q4 Cash & Deposit 2,750 2,387 3,011 3,078 2,685 2,957 2,677 3,436 Inventories 11,340 13,711 13,881 14,131 15,003 15,928 15,889 16,384 Other 2,421 2,372 2,225 2,486 2,601 2,345 2,458 2,607 Current Assets 16,512 18,470 19,119 19,695 20,290 21,231 21,025 22,428 Fixed Assets 3,299 4,218 4,227 4,383 4,440 4,519 4,329 4,455 Total Assets 19,812 22,688 23,347 24,076 24,731 25,750 25,342 26,884 Current Liabilities 6,586 8,361 6,933 7,525 8,053 8,214 7,305 8,587 Fixed Liabilities 2,068 2,955 4,436 4,108 3,824 4,382 4,240 3,929 Total Liabilities 8,654 11,316 11,369 11,633 11,877 12,596 11,545 12,516 Shareholders' Equity 11,157 11,372 11,976 12,445 12,853 13,153 13,796 14,367
5 CF(Consolidated) Cash Flow Statement Cons.Act. Cons.Act. Cons.Est. FY05/09 FY05/10 (Million Yen) Q1 Q2 Q3 Q4 Q1 Q2 Q3 Q4 Operating Cash Flow , ,133 Change in Inventories ,783-2,953-3, ,796-1,757-2,253 Other -6 2,250 1,194 2, ,650 1,033 3,386 Investment Cash Flow ,182-1,497-1, Change in Fixed Assets , Change in Other Assets Financing Cash Flow 422 1,119 3,284 2, Operating CF + Investment CF ,715-3,255-2, ,
6 Parent Company Village Vanguard Corporation K.K.


7 What We Do Village Vanguard Diner Burger shop modeled after an American diner. new style For 30 year-olds with unique tastes. QK Exciting book store for kids Not only toys. Kids Entertainment for kids. Online Book, accessories, CDs 2,500 items.

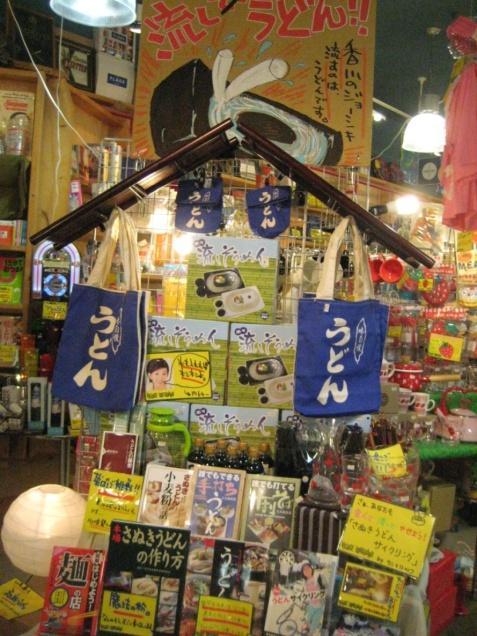
8 Examples of Our Merchandising Approach (1) BAR JAZZ CD Compilation to invoke a bar atmosphere Set for making cocktails You are not going home tonight, my Darling! Cocktail Book To the Bar Selection of 64 bars across Japan is introduced Rolling Coaster Pour someone a drink and roller-skate it to a person across the counter Portable Charcoal Stove to warm one s sake for a lonely night drink Glasses for Shochu liquor 米 麦 芋 Handbook of Shochu and Awamori Special Selection of Real Shochu Gourmet Around Town The Soul of John Bull I wanna be an old man like this! A book of snacks


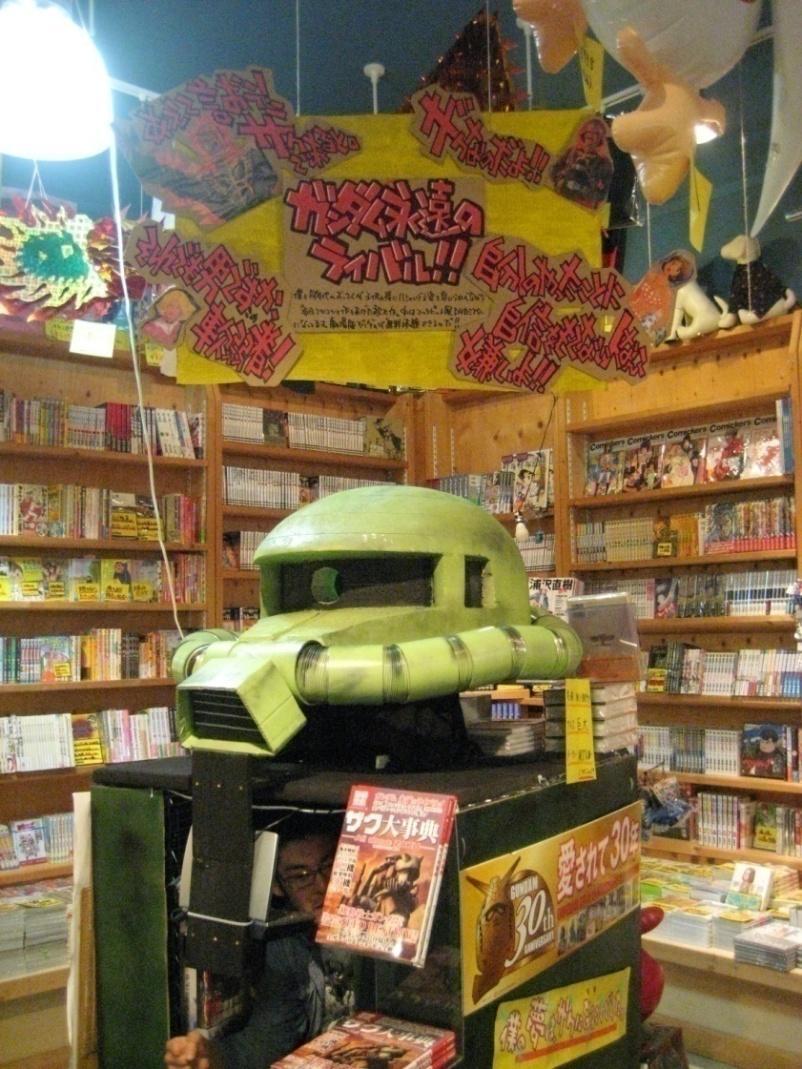
9 Examples of Our Merchandising Approach (2) A store manager built this Gundam Suit in his free time! He is actually inside there!

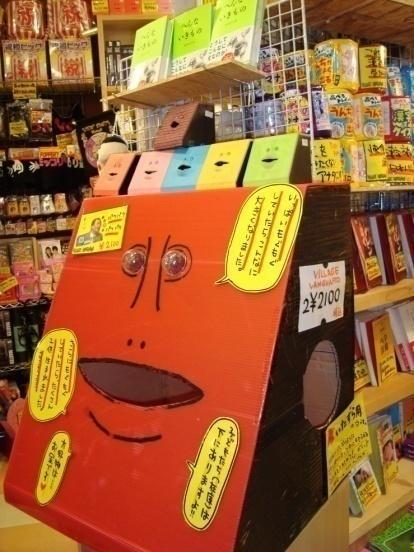
10 How We Sell? We delegate both purchasing and sales decisions to the store level Marketing Purchasing Store manager has the absolute discretion Store Merchandising and Display We create sales spaces that answer unique customer needs store by store, in real time Store level ideas driving buying impulse and customer loyalty
11 Hiring Strategy Customer Temp Staff Full Time Employee We hire people who really understand what we do Even temporary staff are allowed to make purchasing decisions Real On-the-Job training that spans years
12 Store Openings (Parent) Nationwide 326 DM 299 VV 253 new style 26 QK 10 Diner 10 FC 27 Kyushu & Okinawa DM 45 FC 4 Fukuoka Saga 17 5 Oita Nagasaki 3 3 Kumamoto 7 Yamaguchi 4 (1) Chugoku & Shikoku DM 37 FC 1 Figures: Directly Managed, (Franchise Stores) Hokkaido 20(2) Ishikawa 3 Fukui Tottori 2 Kyoto Shimane 2 Hyogo 3 Shiga Okayama Hiroshima Osaka Mie Kagawa Nara Tokushima Wakayama Ehime 4 Kochi 2 Kansai (Osaka) Hokkaido DM 18 FC 2 Hokuriku Akita 4 Aomori 5 Iwate 5 Miyagi 6(1) DM 11 Niigata 5 Fukushima Toyama Gunma 2 Tochigi 2 4(3) Nagano 4(2) Ibaraki Saitama Gifu (2) 6(5) Yamanashi Chiba 1 Kanagawa Aichi 16 34(5) Shizuoka 10(1) 9 Chubu (Nagoya) Tohoku DM 21 FC 1 Yamagata Tokyo 29 (1) Kanto (Tokyo) DM 82 FC 9 Miyazaki DM 44 4(1) FC 10 Kagoshima Okinawa DM 41 4(3) 6 * Store Data as of November 2009 End
13 Parent Income Statement Income Statement Cons.Act. Cons.Act. Cons.Est. FY05/09 FY05/10 (Million Yen) Q1 Q2 Q3 Q4 Q1 Q2 Q3 Q4 Sales 7,343 7,462 10,739 7,682 8,630 8,273 10,352 10,385 SG&A 2,270 2,723 2,798 2,831 2,799 2,879 3,148 3,301 Labor 995 1,094 1,150 1,198 1,248 1,246 1,438 1,380 Rent Depreciation Operating Profit , , Recurring Profit , ,118 1,026 Net Profit Sales YoY 16.2% 21.5% 35.6% 5.3% 17.5% 10.9% -3.6% 35.2% SG&A YoY 22.2% 33.5% 30.1% 28.9% 23.3% 5.7% 12.5% 16.6% Labor YoY 19.9% 23.9% 27.4% 30.2% 25.4% 13.9% 25.0% 15.2% Rent YoY 17.7% 22.0% 24.9% 19.9% 19.1% 12.6% -1.9% 13.0% Depreciation YoY -9.2% 69.6% 50.0% 41.3% 47.8% 13.7% 21.3% 18.6% Operating Profit YoY 8.0% -31.8% 9.4% 23.2% 9.3% 46.5% -1.3% 15.2% Recurring Profit YoY 9.4% -30.8% 8.9% 20.0% 8.1% 43.5% -4.0% 18.9% Net Profit YoY 8.4% -30.5% 1.3% 148.9% 11.6% 39.7% 6.4% 22.0% Operating Profit Margin 10.0% 5.0% 10.7% 11.3% 9.3% 6.6% 11.0% 9.6% Recurring Profit Margin 10.3% 5.2% 10.8% 11.2% 9.4% 6.8% 10.8% 9.9% Net Profit Margin 5.6% 2.9% 5.6% 6.1% 5.4% 3.6% 6.2% 5.5% Versus plan Sales 103.1% 101.0% 99.8% SG&A 98.0% 100.9% 98.1% Operating Profit 166.9% 104.2% 105.6% Recurring Profit 167.4% 105.0% 108.1% Net Income 180.1% 106.0% 100.7% Source: Company Data Processed by SR Inc.
14 Jun-08 Jul-08 Aug-08 Sep-08 Oct-08 Nov-08 Dec-08 Jan-09 Feb-09 Mar-09 Apr-09 May-09 Jun-09 Jul-09 Aug-09 Sep-09 Oct-09 Nov-09 Dec-09 Comparable Store Sales 10.0% 8.0% 6.0% 4.0% 3.1% 7.4% 4.6% Comparable-Store (FY05/09) Comparable-Store (FY05/10) 2.0% 0.0% 1.0% 0.3% 0.0% 1.0% -2.0% -4.0% -6.0% -8.0% -10.0% -12.0% -1.4% -1.3% -3.4% -3.2% -3.4% -4.5% -4.7% -5.4% -6.1% -7.0% -7.6% 08/9 Negative after 90 months of positive -9.8%
15 Comparable Store Sales Analysis 30.0% 20.0% 10.0% FY05/10 Existing comp sales were flat to down slightly over last year s level 0.0% -10.0% -20.0% -30.0% -40.0% New comp sales data impacted by initial store opening promotions. December comp sales indicate a recovery in the trend December 2009 New Comps: -1.6% Existing Comps: -3.7% Total Comps: -3.4% Total Existing comps New comp stores New comp stores stores which were included in the comparable store data since the start of the fiscal year Existing comps stores included in the comparable store data before the fiscal year began Total Comp stores - stores added as they matured to 13 months of sales
16 Category Sales Sales by Category FY05/08 FY05/09 (Million Yen) Q1 Q2 Q3 Q4 Q1 Q2 Q3 Q4 Q1 Q2 Q3 Q4 SPICE (Parent) 4,304 4,077 5,546 5,011 5,109 5,243 7,102 6,310 6,193 5,926 Books (Parent) 1, ,118 1,044 1,038 1,041 1,171 1,087 1, NW (Parent) Other (Parent) Sales 6,117 5,928 7,715 7,097 7,096 7,142 9,438 8,397 8,271 7,825 Composition SPICE (Parent) 70.4% 68.8% 71.9% 70.6% 72.0% 73.4% 75.2% 75.1% 74.9% 75.7% Books (Parent) 16.8% 16.7% 14.5% 14.7% 14.6% 14.6% 12.4% 12.9% 12.6% 12.7% NW (Parent) 11.0% 12.5% 11.8% 12.7% 11.4% 10.1% 10.6% 9.5% 10.2% 8.5% Other (Parent) 1.9% 2.0% 1.8% 2.0% 2.0% 1.9% 1.8% 2.4% 2.3% 3.0% FY05/10
17 Store Age Sales YoY Store Age Analysis <1 (Directly Managed Stores) Number of Stores * Stores with record sales ** YoY Sales (%) -8.1% -1.3% -4.6% -2.1% -12.9% - *excluding online and closed stores ** monthly stores with all-time high sales as of Dec ( 1) excludes online and closed stores ( 2) Number of stores with all time high sales on a monthly basis in Dec. 2009
18 OP Analysis 1,600 (Millions of yen) 1,500 1,400 Profit from new stores (<13 months in operation) 607 million yen 31 Other Sales (sales to FCs, subs)31m yen HQ overhead-170 1,300 Decline in OP from Comps -253m yen 1,200 1,100 (largest reasons for decline) Lower profitability of Comps -146m yen Decline due to store closures -107m yen Contr. from New stores 607 Decline in OP due to increase in expenses other than store expenses -170m yen (reasons) HQ staff increase -60m yen Logistics, audit, inventory taking, commissions -32m yen 1,000 Contr. from comps -253 This year OP 900 Last year OP1, 前期営業利益既存店売上新店売上その他売上本部経費今期営業利益 前期営業利益既存店売上新店売上その他売上本部経費今期営業利益
19 Openings New Openings & Closures FY05/08Act FY05/09Act FY05/10CoE Full-Year Full-Year 1H 2H Full-Year Openings Village Vanguard new style QK Diner Titicaca Total New Openings Closures Village Vanguard new style QK Diner Titicaca Total Closures


20 Initiatives Strengthening Imported Merchandise Problem Could not source enough imported merchandise (normally high GPM) GPMs for HQ sourcing team merchandise contracted. 65.0% Overall gross profitability continues rising... Due to more items sold by the HQ sourcing team; those are relatively high margin 60.0% 55.0% 62.9% HQ Sourcing Team Merchandise GPM 59.1% 59.7% 59.6% 59.5% 57.5% 56.4% 55.7% 50.0% Gross profitability of items sold by HQ sourcing team continues to fall... Due to inability to source enough imported items which are higher margin 45.0% 40.0% 35.0% 37.8% 38.3% 38.2% Overall GPM 39.2% 39.0% 39.0% 40.1% 40.1% Will attempt to grow overall gross profitability further by pursuing both internal (HQ) sourcing and margin improvement 30.0% 06/5 期 Q4 07/5 期 Q2 07/5 期 Q4 08/5 期 Q2 08/5 期 Q4 GPM Trends 09/5 期 Q2 09/5 期 Q4 10/5 期 Q2 Note: GPM data only reflects retail sales, Diner and FC not included. Solution Increase the ratio of procurement and sales of imported items drive GPM higher
21 Initiatives Existing Store Inventory Trends Inventory Turnover Inventory change per existing store 2.8 during the term /5 期 Q2 05/5 期 Q4 06/5 期 Q2 Data provided is unaudited, and is for illustrative purposes only. Inventory Control 06/5 期 Q4 FY05/0 8 Q2 07/5 期 Q2 FY05/0 8 Q4 07/5 期 Q4 08/5 期 Q2 FY05/0 9Q1 08/5 期 Q4 FY05/0 9 Q2 09/5 期 Q1 FY05/0 9 Q3 09/5 期 Q2 FY05/09 Q4 09/5 期 Q3 FY05/10 Q1 09/5 期 Q4 10/5 期 Q1 FY05/10 Q2 Cash Flows From Operations 459 1, , Net Income Before Tax 1,276 2, ,116 2,276 3, ,320 Net Increase (Decrease) In Inventories -1,055-1, ,768-2,900-3, ,711 Existing Stores ,006 New Stores ,901 2,082 2, Other Stores Valuation Charge Other ,084-1, Cash Flow from Investments ,102-1,379-1, Cash Flow from Financing ,044 2, Free Cash Flow ,667-3,073-2, Reference Number of existing stores Inventory Turnover (Millions of yen) Declining 10/5 期 Q2

22 Consolidated Subsidiary
23 Results Achieved RP targets fewer stores opened, lower expenses. Titicaca Subsidiary Income Statement (Million Yen) Q1 FY05/09 Q2 Q3 Q4 Q1 FY05/10 Q2 Q3 Q4 Sales Operating Profit Recurring Profit Net Profit Sales YoY 43.8% 47.2% 57.5% 53.8% Operating Profit YoY 130.0% 111.5% -28.6% % Recurring Profit YoY 150.0% 138.1% % -66.7% Net Profit YoY 125.0% 140.0% 33.3% -87.5% Operating Profit Margins 4.0% 8.1% 2.3% -2.3% 6.4% 11.6% 1.0% 0.2% Recurring Profit Margins 3.2% 6.5% 1.6% -3.0% 5.5% 10.5% 0.0% -0.7% Net Profit Margins 3.2% 6.2% 1.0% -13.4% 5.0% 10.1% 0.8% -1.1% Sales vs Plan 100.0% 97.2% 96.4% 93.5% 96.8% 97.3% Operating Profit vs Plan 95.4% 119.7% 54.8% -41.7% 116.9% 130.8% Recurring Profit vs Plan 90.6% 120.8% 46.9% -74.1% 124.7% 136.2% Net Profit vs Plan 91.0% 113.2% 30.6% % 127.4% Comp Sales +1.2% (+6m yen) New Store Sales -12.5%(-43m yen)


24 Outside Titicaca Stores Standalone Shop In-Shop Shopping centers, railway stations Apparel Focused Store


25 Inside Titicaca Stores Dozens of alpacas, Titicaca stores signature item
26 Unconsolidated Subsidiary Village Vanguard (Hong Kong) Limited
27 TOPICS Stores: #1 opened on Nov. 28, 2009 at JUSCO Kornhill(148.5sq m) #2 opened on Dec. 15, 2009 at Dragon Center(237.6sq m) Business Directly managed Village Vanguard stores(same concept as in Japan) Situation Changing the store according to the needs of H.K. customers Future Plans To open more stores while watching the performance of the first two.
Investors Guide. February Shimamura Co.,Ltd.
 Investors Guide February-2018 Shimamura Co.,Ltd. Ⅰ.Shimamura Co., Ltd. (Consolidated) 1.Consolidated Financial Summary and Forecast (1)Consolidated Profit and loss statement (2)Selling, General and Administrative
Investors Guide. August Shimamura Co.,Ltd.
 Investors Guide August-2018 Shimamura Co.,Ltd. Ⅰ.Shimamura Co., Ltd. (Consolidated) 1.Consolidated Financial Summary and Forecast (1)Consolidated Profit and loss statement (2)Selling, General and Administrative
Investors Guide. Februrary Shimamura Co.,Ltd.
 Investors Guide Februrary-2012 Shimamura Co.,Ltd. Ⅰ.Shimamura Co., Ltd. (Consolidated) 1.Consolidated Financial Summary and Forecast (1)Consolidated Profit and loss statement (2)Selling, Gneneral and Administrative
Representativeness Analysis: Participants vs. Non-Participants
 Representativeness Analysis: Participants vs. Non-Participants 1 All significance tests are two-sample t-tests unless otherwise noted. *p
Summary Report of Basic Survey on Wage Structure (starting salary)
") Summary Report of Basic Survey on Wage Structure (starting ) 2012 Contents Outline of Survey Page 1 Definitions Page 3 Summary of Results 1. Starting by school career Page 4 2. Starting by enterprise size
Summary Report of Basic Survey on Wage Structure (starting ) 2012 Contents Outline of Survey Page 1 Definitions Page 3 Summary of Results 1. Starting by school career Page 4 2. Starting by enterprise size
Newly Registered Number of Imported Vehicles as of February 2019 (Quick Report)
") Imported Automobile News March 6, 2019 Japan Automobile Importers Association Newly Registered Number of Imported Vehicles as of February 2019 (Quick Report) The number of vehicles produced by foreign
Imported Automobile News March 6, 2019 Japan Automobile Importers Association Newly Registered Number of Imported Vehicles as of February 2019 (Quick Report) The number of vehicles produced by foreign
Newly Registered Number of Imported Vehicles as of May 2018 (Quick Report)
") June 6, 2018 Japan Automobile Importers Association Newly Registered Number of Imported Vehicles as of May 2018 (Quick Report) 2018 was 120,015 units, increased by 1.0% compared with the same period of
June 6, 2018 Japan Automobile Importers Association Newly Registered Number of Imported Vehicles as of May 2018 (Quick Report) 2018 was 120,015 units, increased by 1.0% compared with the same period of
Brief Summary for the Second Quarter of FY2015
 Brief Summary for the Second Quarter of FY2015 October 2, 2014 Seven & i Holdings Co., Ltd. CONSOLIDATED RESULTS 1. Financial Results Fiscal Year Ending August 31, 2013 August 31, 2014 Feb. 28, 2014 Feb.
1. Trends in the current fiscal year and previous fiscal year 3. Business overview 2. Secular trends in first quarter financial results
 FY2/19 (March 2018~May 2018) Fact Book 1. Trends in the current fiscal year and previous fiscal year 3. Business overview (1) Performance overview P. 1 (1) No. of students at the end of month P. 6 (2)
Results for the Three Months ended June 30, 2018
 Reference Translation Results for the Three Months ended June 30, 2018 July 31, 2018 AUTOBACS SEVEN CO., LTD. FY March 2019 Consolidated P/L Profit Loss/Gain: Net sales and gross profit decreased, and
FY2/18 2Q(March 2017~August 2018)
") FY2/18 2Q(March 2017~August 2018) Fact Book 1. Trends in the current fiscal year and previous fiscal year 3. Business overview (1) Performance overview P.1 (1) No. of students at the end of month P.7 (2)
FY2/18 2Q(March 2017~August 2018) Fact Book 1. Trends in the current fiscal year and previous fiscal year 3. Business overview (1) Performance overview P.1 (1) No. of students at the end of month P.7 (2)
FY2/18 (March 2017~February 2018)
") FY2/18 (March 2017~February 2018) Fact Book 1. Trends in the current fiscal year and previous fiscal year 3. Business overview (1) Performance overview P. 1 (1) No. of students at the end of month P. 6
FY2/18 (March 2017~February 2018) Fact Book 1. Trends in the current fiscal year and previous fiscal year 3. Business overview (1) Performance overview P. 1 (1) No. of students at the end of month P. 6
FY2/17 3Q(March 2016~November2016)
") FY2/17 (March 2016~November2016) Fact Book 1. Trends in the current fiscal year and previous fiscal year 3. Business overview (1) Performance overview P. 1 (1) No. of students at the end of month P. 7
FY2/17 (March 2016~November2016) Fact Book 1. Trends in the current fiscal year and previous fiscal year 3. Business overview (1) Performance overview P. 1 (1) No. of students at the end of month P. 7
FY2/17 (March 2016~February 2017)
") FY2/17 (March 2016~February 2017) Fact Book 1. Trends in the current fiscal year and previous fiscal year 3. Business overview (1) Performance overview P. 1 (1) No. of students at the end of month P. 7
FY2/17 (March 2016~February 2017) Fact Book 1. Trends in the current fiscal year and previous fiscal year 3. Business overview (1) Performance overview P. 1 (1) No. of students at the end of month P. 7
pulmonary tuberculosis Year
 Summary Rate per 100,000 1000 * New criteria applied for notification in 1998 "Tuberculosis emergency " declared in 1999 100 All forms of * 13.3* in2017 10 Smear pulmonary 5.0 in2017 Sputum-smear pulmonary
FY2/16(March 2015~February 2016)
") FY2/16(March 2015~February 2016) 1. Trends in the current fiscal year and the previous fiscal year 3. Business overview (1) Peformance overview P.1 (1) No. of students at the end of month P.7 (2) Cost
FY2/16(March 2015~February 2016) 1. Trends in the current fiscal year and the previous fiscal year 3. Business overview (1) Peformance overview P.1 (1) No. of students at the end of month P.7 (2) Cost
A Vast Range of Related Industries
 Automotive Industry AutomobileRelated Industries and Employment A Vast Range of Related Industries Automobiles are the focus of an extremely wide range of industrial and related activity, from materials
Annual Report of. Electricity and Gas Market Surveillance Commission. (September 2016 August 2017)
") (Tentative translation) Annual Report of Electricity and Gas Market Surveillance Commission (September 2016 August 2017) November 2017 Electricity and Gas Market Surveillance Commission NOTE: This is an
(Tentative translation) Annual Report of Electricity and Gas Market Surveillance Commission (September 2016 August 2017) November 2017 Electricity and Gas Market Surveillance Commission NOTE: This is an
FY2/15(March 2014~February 2015)
") FY2/15(March 2014~February 2015) 1. Trends in the current fiscal year and the previous fiscal year 3. Business overview (1) Peformance overview P.1 (1) No. of students at the end of month P.7 (2) Cost
FY2/15(March 2014~February 2015) 1. Trends in the current fiscal year and the previous fiscal year 3. Business overview (1) Peformance overview P.1 (1) No. of students at the end of month P.7 (2) Cost
A Vast Range of Related Industries
 Automotive Industry AutomobileRelated Industries and Employment A Vast Range of Related Industries Automobiles are the focus of an extremely wide range of industrial and related activity, from materials
A Vast Range of Related Industries
 Automotive Industry AutomobileRelated Industries and Employment A Vast Range of Related Industries Automobiles are the focus of an extremely wide range of industrial and related activity, from materials
A Vast Range of Related Industries
 Automotive Industry AutomobileRelated Industries and Employment A Vast Range of Related Industries Automobiles are the focus of an extremely wide range of industrial and related activity, from materials
First half (2014/3/1~2014/8/31)
") FY2/15 (March 2014~November 201 4) 1.Trends in current fiscal year and previouse fiscal year 3.Business overview (1)Peformance overview P.1 (1)No. of students at the end of month P.7 (2)Cost of sales breakdown
FY2/15 (March 2014~November 201 4) 1.Trends in current fiscal year and previouse fiscal year 3.Business overview (1)Peformance overview P.1 (1)No. of students at the end of month P.7 (2)Cost of sales breakdown
Research Coverage Report by Shared Research Inc.
 esearch eport by Shared esearch Inc. https://sharedresearch.jp This PDF document is an updated note on the company. A comprehensive version of the report on the company, including this latest update, is
Financial Results for First Quarter of FY2015
 Financial Results for First Quarter of FY2015 (From April 1, 2014 to June 30, 2014) July 29, 2014 Hino Motors, Ltd. 1. Sales Turnover 2/15 Global Unit Sales (Retail Sales) 3/15 Sales Sales decreased decreased
Commercial-in-Confidence Ashton Old Baths Financial Model - Detailed Cashflow
 Year 0 1 2 3 4 5 6 7 8 9 10 11 12 13 Oct-16 Nov-16 Dec-16 Jan-17 Feb-17 Mar-17 Apr-17 May-17 Jun-17 Jul-17 Aug-17 Sep-17 Oct-17 2,038 2,922 4,089 4,349 6,256 7,124 8,885 8,885 8,885 8,885 8,885 8,885 9,107
ANALYST BRIEFING FOR THE FOURTH QUARTER ENDED FEBRUARY 2017
 ANALYST BRIEFING FOR THE FOURTH QUARTER ENDED 2016 22 FEBRUARY 2017 MSM Malaysia Holdings Berhad Analyst Briefing Q4 2016 22/2/2017 1 CONTENTS 01 02 03 04 05 Group Financial Highlights Performance Review
Rebels too old for a cause
 Rebels too old for a cause The dying motorcycle market in Japan :; Mike Newman President & CEO Analogica K.K. May 23 rd, 217 Page 1 INTELLIGENCE, INDEPENDENCE, INTEGRITY www.analogica.jp Yamagata Fukui
Results for the First Six Months Ended September 30, 2013
 Translation ANALYST MEETING Results for the First Six Months Ended September 30, 2013 November 1, 2013 Setsuo Wakuda Representative Director and CEO AUTOBACS SEVEN CO., LTD. Contents 1. Results for the
FY2016 Third Quarter consolidated financial highlights
 FY2016 Third Quarter consolidated financial highlights pages Ⅰ. Overview of Consolidated Results Ⅱ. Q3 and YTD FY2016 Consolidated Financial Results Summary Ⅲ. and Net by Product / Sanwa Shutter 1 2 4
Research Coverage Report by Shared Research Inc.
 esearch eport by Shared esearch Inc. https://sharedresearch.jp This PDF document is an updated note on the company. A comprehensive version of the report on the company, including this latest update, is
2Q06 Results. Investor Relations
 2Q06 Results Investor Relations Content 1. 2Q06 Key Results 2. Summarized Income Statement 3. Balance Sheet as of Jun. 2006 4. Outlook for 2006 5. Result & Outlook By Division Appendix : 2Q06 Results Breakdown
Research Coverage Report by Shared Research Inc.
 esearch eport by Shared esearch Inc. https://sharedresearch.jp This PDF document is an updated note on the company. A comprehensive version of the report on the company, including this latest update, is
Commonwealth of the Northern Mariana Islands
 Commonwealth of the Northern Mariana Islands ~ FISCAL YEAR ~ 2017 2018 % change ~ CALENDAR YEAR ~ 2017 2018 % change YTD OCT NOV DEC JAN FEB MAR APR MAY JUN JUL AUG SEP TOTAL 481,793 41,910 47,261 58,558
Third Quarter Results (ended December 31, 2013)
") Fiscal Year 213 (ending March 31, 214) Third Quarter Results (ended December 31, 213) Brother Industries, Ltd. February 4, 214 Information on this report, other than historical facts, refers to future
Fiscal Year 213 (ending March 31, 214) Third Quarter Results (ended December 31, 213) Brother Industries, Ltd. February 4, 214 Information on this report, other than historical facts, refers to future
Consolidated Financial Results for 1Q FY2016 July 29, 2016 Fuji Electric Co., Ltd.
 Consolidated Financial Results for 1Q FY2016 July 29, 2016 Fuji Electric Co., Ltd. 2016Fuji Electric Co., Ltd. All rights reserved. 1 Summary of Consolidated Financial Results for 1Q FY2016 (YoY Comparison)
Research Coverage Report by Shared Research Inc.
 esearch eport by Shared esearch Inc. https://sharedresearch.jp This PDF document is an updated note on the company. A comprehensive version of the report on the company, including this latest update, is
Domestic economy stopped worsening, negative shock moderated
 TDB Trends Research (Research & Summary for July 2016) Domestic economy stopped worsening, negative shock moderated - Nationwide improvement for the first time in a year and five months - e-mail:keiki@mail.tdb.co.jp
General Situation 1. The number of establishments
 General Situation This survey report provides a summary of 23 Census of Manufacture carried out on December 31, 23, and the following sections detail the number of establishments with 4 or more employees
282m 75% +575m. Net sales Operating income before non-recurring items. Operating margin before non-recurring items. Net Loss.
 First-Half 2009 Financial Highlights Net sales Operating income before non-recurring items Operating margin before non-recurring items Net Loss Net debt-to-equity ratio Free cash flow** 7,134m 282m 4.0%
FY2017 Third Quarter consolidated financial result highlights
 FY2017 Third Quarter consolidated financial result highlights pages Ⅰ. Ⅱ. Ⅲ. Overview of Consolidated Financial Results Summary of Consolidated Q3 FY2017 Financial Results Forecast of FY2017 Consolidated
FY H1 Financial Results
 FY2011 1 H1 Financial Results November 8, 2010 1 Copyright(C) 2010 Isuzu Motors Limited All rights reserved Contents Ⅰ. President and Representative Director : Susumu Hosoi :FY2011 H1 Financial Summary
NISSAN REVIVAL PLAN. TOKYO October 18, 1999
 NISSAN REVIVAL PLAN TOKYO October 18, 1999 REVIVAL PLAN OUTLINE I) Diagnosis II) III) Introduction Past Performance: Facts/Figures Past Performance: Analysis + Opportunities Revival Plan Elaboration Key
FISCAL YEAR MARCH 2018 FIRST QUARTER FINANCIAL RESULTS
 FISCAL YEAR MARCH 2018 FIRST QUARTER FINANCIAL RESULTS PRESENTATION OUTLINE Highlights Fiscal Year March 2018 First Quarter Results Fiscal Year March 2018 Full Year Forecast Structural Reform Stage 2 Progress
Third Quarter Results (ended December 31, 2014)
") Fiscal Year 214 (ending March 31, 215) Third Quarter Results (ended December 31, 214) Brother Industries, Ltd. February 4, 215 Information on this report, other than historical facts, refers to future
Fiscal Year 214 (ending March 31, 215) Third Quarter Results (ended December 31, 214) Brother Industries, Ltd. February 4, 215 Information on this report, other than historical facts, refers to future
1 st Half Joakim Olsson CEO and President July 17, Innovative Vehicle Technology
 1 st Half 2009 Joakim Olsson CEO and President July 17, 2009 Innovative Vehicle Technology 2009-07-17 Summary 1st half 2009 Sales of SEK 2,971m (4,473) Adjusted for currency exchange rates, sales declined
FISCAL YEAR MARCH 2018 FIRST HALF FINANCIAL RESULTS
 FISCAL YEAR MARCH 2018 FIRST HALF FINANCIAL RESULTS PRESENTATION OUTLINE Highlights Fiscal Year March 2018 First Half Results Fiscal Year March 2018 Full Year Forecast Progress of Key Initiatives/ Business
The outline of our management for environment. Takahito Sunohara East Japan Railway Company, Tokyo, Japan
 The outline of our management for environment Takahito Sunohara East Japan Railway Company, Tokyo, Japan Key Presentation Take-Aways Summary, process of the company For sustained management In the future
Dynasty Ceramic. We are making the impossible, POSSIBLE.
 Dynasty Ceramic We are making the impossible, POSSIBLE. Contents Road to Success Sales Reports Cost of Production Performance Competitor Analysis Going Forward Q & A 2 Dynasty Ceramic Road to Success DCC
伪伪 Concentrating on automotive businesses, the company is growing rapidly through acquisitions
 Company Research and Analysis Report FISCO Ltd. http://www.fisco.co.jp 伪伪 Concentrating on automotive businesses, the company is growing rapidly through acquisitions VT Holdings has 23 operational subsidiaries
Financial Highlights Q1 Results of FY 2013 (Fiscal year ending March 2014) August 8, : Avex Group Holdings Inc.
 August 8, : Avex Group Holdings Inc.") Financial Highlights Q1 Results of FY 2013 (Fiscal year ending March 2014) August 8, 2013 7860: Avex Group Holdings Inc. 1 1 Consolidated Results 2 2 Q1 FY 2013 Highlights Record high as a quarterly sales.
Financial Highlights Q1 Results of FY 2013 (Fiscal year ending March 2014) August 8, 2013 7860: Avex Group Holdings Inc. 1 1 Consolidated Results 2 2 Q1 FY 2013 Highlights Record high as a quarterly sales.
Q3 Results November 16, 2006 Analyst Presentation
 Q3 Results 2006 November 16, 2006 Analyst Presentation Group Sales (in million Euro) Total Sales 2,395 +3.3% (+2.4%)* 2,474 Split per Business Group (YTD) Specialty Products 7% Q3 797 +1.0% (+2.5%)* 805
Monthly Operating Report. December 2017
 Monthly Operating Report December 20 December overview» For the month of December 20 Contact recorded: Electricity and gas sales of 571 GWh (December 2016: 582 GWh) Netback of $79.23/MWh (December 2016:
CHANG WAH TECHNOLOGY CO., LTD (6548) March 16,2018
 March 16,2018") CHANG WAH TECHNOLOGY CO., LTD (6548) March 16,2018 1 Outline Company Introduction Automotive Electronics and QFN Wettable Flank Packages Financial Results Development and Vision 2 Company Introduction
CHANG WAH TECHNOLOGY CO., LTD (6548) March 16,2018 1 Outline Company Introduction Automotive Electronics and QFN Wettable Flank Packages Financial Results Development and Vision 2 Company Introduction
FISCAL YEAR ENDED MARCH 2011 FINANCIAL RESULTS
 FISCAL YEAR ENDED MARCH 211 FINANCIAL RESULTS Mazda Motor Corporation April 28, 211 Mazda MINAGI 1 PRESENTATION OUTLINE Highlights Fiscal Year Ended March 211 Results In Summary Question & Answer Session
FY2015 Third Quarter Financial Results
 FY2015 Third Quarter Financial Results Mitsubishi Motors Corporation February 3, 2016 FY2015 Third Quarter Financial Results All-new Pajero Sport 1 FY2015 1-3Q Results Summary (vs. FY2014 1-3Q) Increase
FY2018 Financial Results Digest
 This material includes the comments and the reference data based on FY2018 Financial Results. FY2018 Financial Results Digest February 2019 Financial Results Highlight for 2018 Alcohol Beverages Business
Financial Results for the 3rd Quarter Ended Dec. 31, 2005 < U.S. GAAP-based >
 Financial Results for the 3rd Quarter Ended Dec. 31, 25 < U.S. GAAP-based > February 1, 26 NIDEC CORPORATION www.nidec.co.jp/english/index.html Financial Results for the 3 rd Quarter Ended Dec. 31, 25
Cosmo Oil Co., Ltd. Presentation on Results for First Quarter of Fiscal 2012 August 2, 2012 Director: Satoshi Miyamoto
 Cosmo Oil Co., Ltd. Presentation on Results for First Quarter of Fiscal 2012 August 2, 2012 Director: Satoshi Miyamoto Copyright 2012 COSMO OIL CO.,LTD. All Rights Reserved. Key Points of Financial Results
伪伪 Concentrating on Automotive Businesses, the Company is Growing Rapidly Through Acquisitions
 Company Research and Analysis Report FISCO Ltd. http://www.fisco.co.jp 伪伪 Concentrating on Automotive Businesses, the Company is Growing Rapidly Through Acquisitions VT Holdings is a pure holding
FISCAL YEAR END MARCH 2013 FIRST HALF FINANCIAL RESULTS. New Mazda6 (Atenza)
") FISCAL YEAR END MARCH 2013 FIRST HALF FINANCIAL RESULTS New Mazda6 (Atenza) Mazda Motor Corporation October 31, 2012 1 PRESENTATION OUTLINE Highlights Fiscal Year March 2013 First Half Results Fiscal Year
FISCAL YEAR END MARCH 2013 FIRST HALF FINANCIAL RESULTS New Mazda6 (Atenza) Mazda Motor Corporation October 31, 2012 1 PRESENTATION OUTLINE Highlights Fiscal Year March 2013 First Half Results Fiscal Year
FISCAL YEAR ENDING MARCH 2012 FIRST HALF FINANCIAL RESULTS
 FISCAL YEAR ENDING MARCH 2012 FIRST HALF FINANCIAL RESULTS Mazda Motor Corporation November 2, 2011 New Mazda CX-5 (European specifications) 1 PRESENTATION OUTLINE Highlights Fiscal Year Ending March 2012
FISCAL YEAR MARCH 2015 FIRST HALF FINANCIAL RESULTS. New Mazda Demio
 FISCAL YEAR MARCH 2015 FIRST HALF FINANCIAL RESULTS New Mazda Demio Mazda Motor Corporation October 31, 2014 1 PRESENTATION OUTLINE Highlights Fiscal Year March 2015 First Half Results Fiscal Year March
Financial Result for 3 rd Quarter of Fiscal Year 2004
 Financial Result for 3 rd Quarter of Fiscal Year 2004 January 28, 2005 Yokogawa Electric Corporation 1 Revised Budget FY03 Result Budget 2004/5/11 Revised Budget 2004/11/9 (a) 2005/1/28 (b) (b)-(a) 390.5
FY2012. H1 Financial Results. November 8, Copyright(C) 2011 Isuzu Motors Limited All rights reserved
 2011 Isuzu Motors Limited All rights reserved") FY2012 H1 Financial Results November 8, 2011 1 Copyright(C) 2011 Isuzu Motors Limited All rights reserved Ⅰ. President and Representative Director : Susumu Hosoi :FY2012 H1 Financial Summary Outline Ⅱ.
FY2012 H1 Financial Results November 8, 2011 1 Copyright(C) 2011 Isuzu Motors Limited All rights reserved Ⅰ. President and Representative Director : Susumu Hosoi :FY2012 H1 Financial Summary Outline Ⅱ.
Full-year Report 2008
 Full-year Report 2008 Joakim Olsson CEO and President February 20, 2009 Innovative Vehicle Technology 2009-02-20 Summary 2008 Orders received of SEK 7,923m (8,098) Currency adjusted orders decreased with
FISCAL YEAR MARCH 2018 THIRD QUARTER FINANCIAL RESULTS
 FISCAL YEAR MARCH 2018 THIRD QUARTER FINANCIAL RESULTS PRESENTATION OUTLINE Highlights Fiscal Year March 2018 Nine Month Results Fiscal Year March 2018 Full Year Forecast Progress of Key Initiatives 1
The Electrical Industry in Japan April 24, 2013 Japanese Electrical Electronic and Information Union
 Ver.1.3 The Electrical Industry in Japan April 24, 213 State of the Electrical Industry (1) Position of the electrical industry in Japan (FY29) The machine industry s share of total domestic production
MARKET UPDATE & ECONOMIC OUTLOOK
 MARKET UPDATE & ECONOMIC OUTLOOK Economic Expansion Accelerates For the Moment Growth surged in Q2 from average 2.1% pace over prior 14 quarters; best quarter since 2014 10.0 Real Gross Domestic Product
By size : Large enterprises and SMEs took a downturn for two months in a row
 TDB Trends Research (Research & Summary for May 2018) Domestic economy worsened for two months in a row due to rising crude oil prices ~ Retail industry significantly worsened because of weak consumer
Valvoline Fourth-Quarter Fiscal 2016 Earnings Conference Call. November 9, 2016
 Valvoline Fourth-Quarter Fiscal 2016 Earnings Conference Call November 9, 2016 Forward-Looking Statements This presentation contains forward-looking statements within the meaning of Section 27A of the
An Overwhelmingly Solid and Advantageo
 JR East s Strengths 1 AN OVERWHELMINGLY SOLID AND ADVANTAGEOUS RAILWAY NETWORK JR EAST S SERVICE AREA TOKYO The railway business of the JR East Group covers the eastern half of Honshu island, which includes
Q Analyst Teleconference. 9 August 2018
 9 August 218 Disclaimer This presentation contains forward-looking statements that reflect the Company management s current views with respect to certain future events. Although it is believed that the
ANALYST BRIEFING FOR THE THIRD QUARTER ENDED NOV 2016
 ANALYST BRIEFING FOR THE THIRD QUARTER ENDED 2016 21 NOV 2016 MSM Malaysia Holdings Berhad Analyst Briefing Q3 2016 21/11/2016 1 CONTENTS 01 02 03 04 05 Group Financial Highlights Performance Review Sugar
Financial Results for First Half of FY2014 (April 1- September 30) Investor meeting. October 31, 2014
 Investor meeting. October 31, 2014") Financial Results for First Half of FY2014 (April 1- September 30) Investor meeting October 31, 2014 1 CONTENTS 1. Financial Results for First Half of FY2014 2. Forecast for FY2014 3. Cash Flow and Debt
Financial Results for First Half of FY2014 (April 1- September 30) Investor meeting October 31, 2014 1 CONTENTS 1. Financial Results for First Half of FY2014 2. Forecast for FY2014 3. Cash Flow and Debt
0/31. LASERTEC 30 SLM Additive manufacturing with powder bed. NVX nd Generation. DMU 503rd Generation IR Conference 2017/8/8
 LASERTEC 30 SLM Additive manufacturing with powder bed NVX 5080 2nd Generation Ultra-high spec machining center from Japan DMU 503rd Generation 0/31 The latest version of world best selling 5-axis machine
Second Quarter 2009 Results
 1 Second Quarter 2009 Results Second Quarter 2009 Results Donald W. Seale Executive Vice President and Chief Marketing Officer Railway Operating Revenue Second Quarter 2009 vs. 2008 Revenue Total $1.86
FISCAL YEAR MARCH 2014 FINANCIAL RESULTS
 FISCAL YEAR MARCH 214 FINANCIAL RESULTS Mazda CX-5 Mazda Atenza Mazda Motor Corporation April 25, 214 New Mazda Axela 1 PRESENTATION OUTLINE Highlights Fiscal Year March 214 Results Fiscal Year March 215
Contents. Corporate Data 30 1 Corporate Profile 30 2 Directors and Corporate Auditors 30 3 Network 30 4 Major Group Companies 31
 Contents Japanese Electric Power Industry and J-POWER 1 1 Electric Power Industry in Japan 1 2 J-POWER s Power Generation (Consolidated) 2 3 Comparison of Electric Power Companies 4 J-POWER Operational
Financial Results Digest for Q1 2017
 This material includes the comments and the reference data based on FY2017 Q1 Financial Results. Financial Results Digest for Q1 2017 May 2017 Financial Results Highlights for Q1 2017 All Businesses achieved
Third Quarter Financial Results for the Fiscal Ending March31,2018 Supplementary Materials. February 8, 2018 AOKI Holdings Inc.
 Third Quarter Financial for the Fiscal Ending March31,2018 Supplementary Materials February 8, 2018 AOKI Holdings Inc. FY3/18 Consolidated Financial Highlights Sales increased due to new store openings
9M 2003 Financial Results (US GAAP)
") 9M Financial Results (US GAAP) January 2004 LUKOIL Group Crude Oil Production* mln tonnes 82 80 78 76 74 72 70 68 66 64 Crude oil production 3.2 5.5 3.9 76.8 70.3 71.3 2001 Production by subsidiaries Share
9M Financial Results (US GAAP) January 2004 LUKOIL Group Crude Oil Production* mln tonnes 82 80 78 76 74 72 70 68 66 64 Crude oil production 3.2 5.5 3.9 76.8 70.3 71.3 2001 Production by subsidiaries Share
Financial Information Details
 FY2012, Year Ended March 31, 2013 Financial Information Details Financial Results (Consolidated) 1 Cash-Flows (Consolidated) 2 Subsidiaries 3 Financial Results of Major Subsidiaries,Other Financial Data
FISCAL YEAR END MARCH 2012 FINANCIAL RESULTS. Mazda TAKERI
 FISCAL YEAR END MARCH 212 FINANCIAL RESULTS Mazda TAKERI Mazda Motor Corporation April 27, 212 1 PRESENTATION OUTLINE Highlights FY End March 212 Results FY End March 213 Forecast Summary Progress Toward
FY2013 2Q Report (ended on 30 th September, 2013) Reported on 7 November, 2013
 Reported on 7 November, 2013") FY2013 2Q Report (ended on 30 th September, 2013) Reported on 7 November, 2013 Key Point of FY2013 2Q Upward revision of full-term earnings forecast Positive turnaround in market environment - Increase
FY2013 2Q Report (ended on 30 th September, 2013) Reported on 7 November, 2013 Key Point of FY2013 2Q Upward revision of full-term earnings forecast Positive turnaround in market environment - Increase
FY 2006 Third Quarter Review
 FY 26 Third Quarter Review February 2, 27 Nissan Motor Co., Ltd 1 Agenda Third quarter news update Sales performance Financial results FY6 Outlook Sustainable growth 2 Third quarter news update Oct 1)
Months Investor Presentation
 2018 9 Months Investor Presentation 25.10.2018 Disclaimer Ereğli Demir Çelik Fabrikaları T.A.Ş. (Erdemir) may, when necessary, make written or verbal announcements about forward-looking information, expectations,
Nissan Motor Co., Ltd. February 12 th, 2019
 Nissan Motor Co., Ltd. February 12 th, 2019 NET REVENUE 2,875.5 3,045.7 OPERATING PROFIT *1 NET INCOME 301.6 FREE CASH FLOW (AUTO) NET CASH (AUTO) 1,311.4 1,334.4 US TAX REFORM 207.7 82.4 103.3 93.9 *2
TOFAŞ RESULTS WEBCAST PRESENTATION
 TOFAŞ 31.12.2017 RESULTS WEBCAST PRESENTATION 02.02.2018 AGENDA Highlights Turkish Automotive Industry Production Domestic Market Developments Tofaş Domestic Market Performance Export Markets & Tofaş Performance
1 Copyright(C) 2012 Isuzu Motors Limited All rights reserved
 2012 Isuzu Motors Limited All rights reserved") FY2012 Financial Results May 10, 2012 1 Copyright(C) 2012 Isuzu Motors Limited All rights reserved Contents Ⅰ. President and Representative Director : Susumu Hosoi FY2012 Overview Ⅱ. Director Director
FY2012 Financial Results May 10, 2012 1 Copyright(C) 2012 Isuzu Motors Limited All rights reserved Contents Ⅰ. President and Representative Director : Susumu Hosoi FY2012 Overview Ⅱ. Director Director
Martin Laubscher Barloworld Automotive
 Barloworld Limited Investor Day Martin Laubscher Barloworld Automotive 2 February 2009 Business Overview Automotive Division Car Rental Fleet Services Motor Retail Joint Ventures Southern Africa Southern
Analyst Presentation Barloworld Automotive 29 February 2008
 Analyst Presentation Barloworld Automotive 29 February 2008 Automotive Division Automotive Division Overview Business Overview Motor Retail Car Rental Fleet Services Importation & Distribution Joint Ventures
FY2015 First Quarter Financial Results. SUZUKI MOTOR CORPORATION 3 August 2015
 First Quarter Financial Results SUZUKI MOTOR CORPORATION 3 August 2015 Consolidated: Financial Summary Page2 Increased net sales and operating income/ordinary income Decreased net income attributable to
BUSINESS OVERVIEW FEBRUARY
 BUSINESS OVERVIEW FEBRUARY 2018 Except for historical information, the statements made in this presentation constitute forward looking statements. These include statements regarding the intent, belief
3QFY2018 Financial Results. Quarter Ended 31 December 2017
 3QFY2018 Financial Results Quarter Ended 31 December 2017 Disclaimer This presentation is not and does not constitute an offer, invitation, solicitation or recommendation to subscribe for, or purchase,
COMPARISON OF FIXED & VARIABLE RATES (25 YEARS) CHARTERED BANK ADMINISTERED INTEREST RATES - PRIME BUSINESS*
 CHARTERED BANK ADMINISTERED INTEREST RATES - PRIME BUSINESS*") COMPARISON OF FIXED & VARIABLE RATES (25 YEARS) 2 Fixed Rates Variable Rates For Internal Use Only. FIXED RATES OF THE PAST 25 YEARS AVERAGE RESIDENTIAL MORTGAGE LENDING RATE - 5 YEAR* (Per cent) Year
COMPARISON OF FIXED & VARIABLE RATES (25 YEARS) 2 Fixed Rates Variable Rates For Internal Use Only. FIXED RATES OF THE PAST 25 YEARS AVERAGE RESIDENTIAL MORTGAGE LENDING RATE - 5 YEAR* (Per cent) Year
FY2016 Nine Months Financial Results (Ended December 20, 2016) FY2016 Full-year Financial Forecasts (Ending March 20, 2017) (TSE 6506)
 FY2016 Full-year Financial Forecasts (Ending March 20, 2017) (TSE 6506)") FY2016 Nine Months Financial Results (Ended December 20, 2016) FY2016 Full-year Financial Forecasts (Ending March 20, 2017) (TSE 6506) 2017 YASKAWA Electric Corporation Contents 1. FY2016 Nine Months Financial
FY2016 Nine Months Financial Results (Ended December 20, 2016) FY2016 Full-year Financial Forecasts (Ending March 20, 2017) (TSE 6506) 2017 YASKAWA Electric Corporation Contents 1. FY2016 Nine Months Financial
COMPARISON OF FIXED & VARIABLE RATES (25 YEARS) CHARTERED BANK ADMINISTERED INTEREST RATES - PRIME BUSINESS*
 CHARTERED BANK ADMINISTERED INTEREST RATES - PRIME BUSINESS*") COMPARISON OF FIXED & VARIABLE RATES (25 YEARS) 2 Fixed Rates Variable Rates FIXED RATES OF THE PAST 25 YEARS AVERAGE RESIDENTIAL MORTGAGE LENDING RATE - 5 YEAR* (Per cent) Year Jan Feb Mar Apr May Jun
COMPARISON OF FIXED & VARIABLE RATES (25 YEARS) 2 Fixed Rates Variable Rates FIXED RATES OF THE PAST 25 YEARS AVERAGE RESIDENTIAL MORTGAGE LENDING RATE - 5 YEAR* (Per cent) Year Jan Feb Mar Apr May Jun
BUSINESS YEAR 2007 RESULTS
 BUSINESS YEAR 2007 RESULTS EVOLUTION OF THE STAINLESS STEEL WORLD PRODUCTION Million Mt. YEAR 2003 YEAR 2004 YEAR 2005 YEAR 2006 YEAR 2007 (estimated) 9.5 10.6 2.7 9.8 11.9 2.9 9.1 12.5 2.7 10.3 15.1 3.0
Honda FY2011 Rating Review
 Honda Information Meeting 213 Spring Honda FY211 Rating Review 214 Acura MDX 1 1 Honda Information Meeting Honda FY211 Rating Review Current Honda Business Business Strategy Automobile Business Motorcycle