Bella Vista Bypass TABEL OF CONTENTS
|
|
|
- Polly Watts
- 5 years ago
- Views:
Transcription
1
2 TABEL OF CONTENTS DRAFT TRAFFIC AND REVENUE REPORT Introduction 1 Identification of Key Factors from HNTB/WSA Traffic and Revenue Report 3 Summary of 2007 Field Work Data Collection 8 Traffic and Revenue Model and Base Traffic and Revenue Estimates 14 APPENDIX Table 1: Transactions and Revenue WSA Forecast 2004 and 2006 Table 2: Estimated Transactions and Revenue Stantec Consulting Forecast Base Case Scenario Table 3: Transaction and Revenue Breakdown by Vehicle Class by Direction Mainline Toll Plaza Only Base Case Scenario Table 4: Assumed Diversion Rates and Trip Savings Table 5: Assumed ETC Capture Rates by Vehicle Class Mainline Toll Plaza Only Table 6 Estimated Transactions and Revenue - Stantec Consulting All ETC Scenario Table 7: Transaction and Revenue Breakdown by Vehicle Class by Direction Mainline Toll Plaza Only All ETC Scenario LIST OF TABLES Table 1: Factors That Influence Bella Vista Traffic and Revenue Estimates 4 Table 2: Trip Length by Vehicle Class 18 Table 3: Stantec Estimates 20 Table 4: Factors That Influence Bella Vista Traffic and Revenue Estimates 23 in association with Stantec
3 LIST OF FIGURES Figure 1: Location Map 2 Figure 2: Toll Rate Per Mile Passenger Vehicles 5 Figure 3: Toll Rate Per Mile Passenger Trucks 6 Figure 4: Traffic Count Locations 9 Figure 5: Rolling Hour Volume & Weighted Avg Speed Typ Weekday US71 SB 10 Figure 6: Rolling Hour Volume & Weighted Avg Speed Typ Weekday US71 NB 10 Figure 7: Rolling Hour Volume & Weighted Avg Speed Typ Weekend US71 NB 11 Figure 8: Rolling Hour Volume & Weighted Avg Speed Typ Weekend US71 SB 11 Figure 9: Box Type Breakdown Weekday 12 Figure 10: Gas Tank Type Breakdown Weekday 13 Figure 11: Sleeper Type Breakdown Weekday 13 Figure 12: Ownership Type Breakdown Weekday 14 Figure 13: Traffic Count Data 15 Figure 14: Standard Toll Diversion Curve 17 in association with Stantec
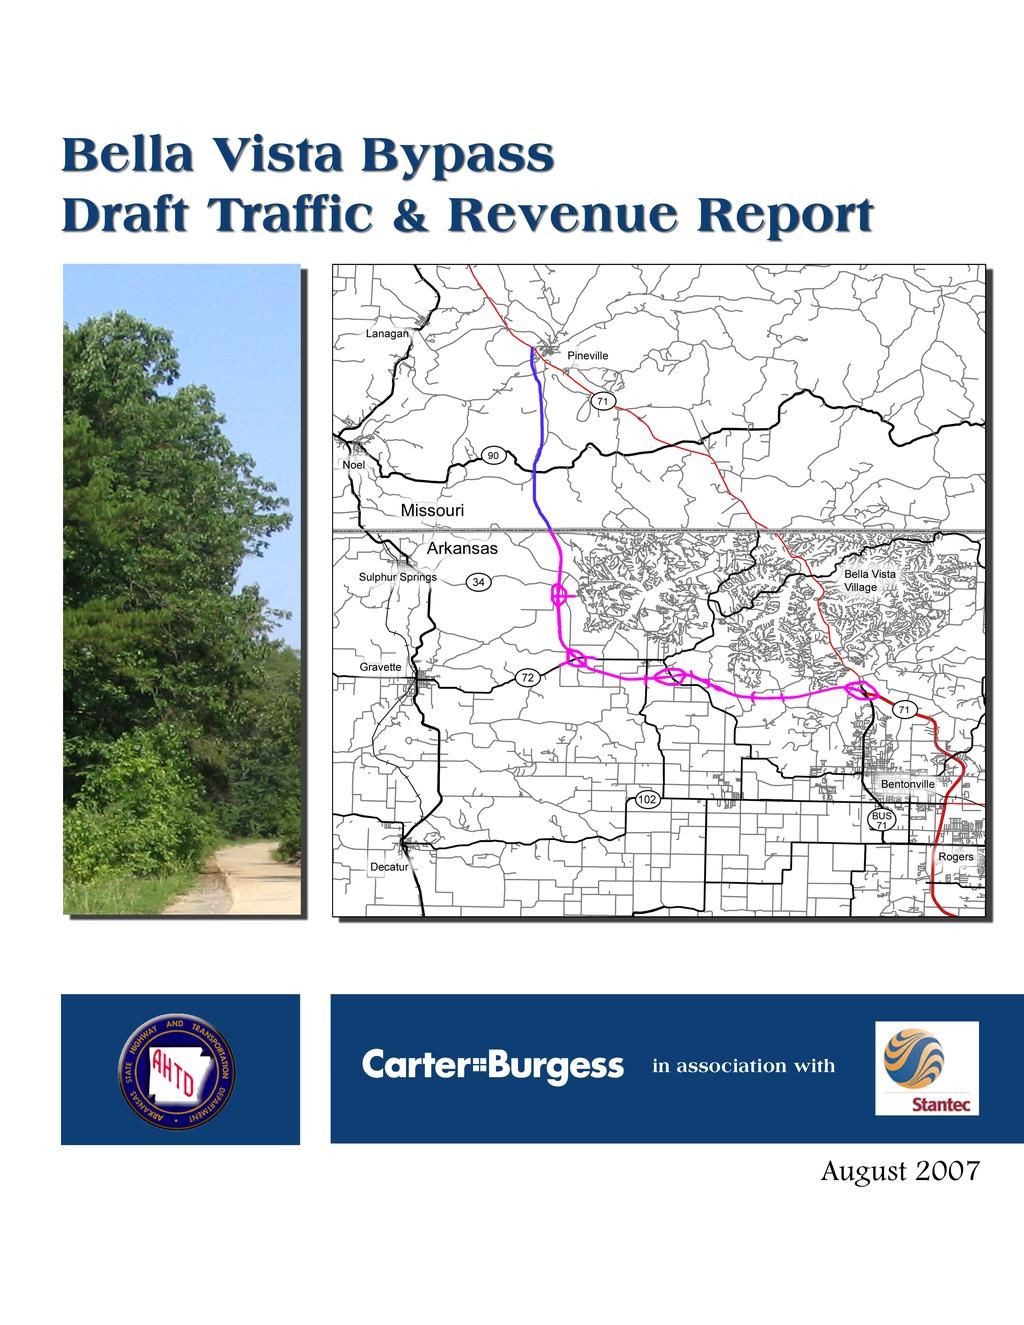
4 INTRODUCTION Carter & Burgess, Inc. and Stantec Consulting made independent traffic and revenue estimates for a proposed by-pass around the Bella Vista area in northwest Arkansas. The Missouri Department of Transportation (MoDOT) and the Arkansas State Highway and Transportation Department (AHTD) are considering the feasibility of constructing the US 71 (the Bypass ), a highway corridor relocation project of the US 71 corridor from just north of Bentonville, Arkansas to Pineville, Missouri, using toll financing for the Arkansas section. There were two previous studies and reports made by HNTB and Wilbur Smith Associates (WSA) for this Bypass; one in 2004 and one in The July 2004 Traffic, Revenue and Toll Feasibility Study Conducted for the US 71 Bella Vista Bypass Project by HNTB/WSA was conducted as an investment-grade toll study for the purpose of determining the potential toll financing feasibility for the entire US 71 Project. The 2006 HNTB/WSA Toll Study Update (subsequently referred to as the 2006 Update Report ) updated the 2004 study based on the assumption that the Missouri section of the Bypass would not be tolled. The two purposes of our study are 1) to evaluate the 2006 Update Report ; and 2) to make independent traffic and revenue estimates for the Bypass. Carter & Burgess responsibility consisted of project management, data collection, report assembly, critique of the 2006 Update Report) and other efforts associated with any proposed electronic tolling. Stantec developed a traffic and revenue model and estimated the probable usage for a 30-year time frame. This estimating effort relied on information in the 2006 Update Report as well as new data collected in June Stantec also prepared sensitivity model runs to test various inputs to the model. US 71, as shown in Figure 1, is the main north-south route providing access to and through the Northwest Arkansas and Southwest Missouri regions. Within these areas are several cities and economic activity centers, including Neosho, Joplin and Carthage in Missouri and Bentonville, Rogers, Springdale, and Fayetteville in Arkansas. Bella Vista, Arkansas, which began as a retirement and recreation community, is also served by US 71. The study area in Arkansas includes most of the unincorporated Bella Vista community. in association with Stantec 1

5 DRAFT TRAFFIC AND REVENUE REPORT Figure 1 The proposed length of the Bypass is 19.6 miles. Of that 14.6 miles are in Arkansas, measured from the Arkansas Missouri state line to the US 71/ US 71 Business interchange, and 5 miles are in Missouri. The Bypass project consists of constructing a new, four-lane, fully-access-controlled toll road with toll collection points between the Arkansas Missouri state line and the US 71 / US 71 Business interchange. The new facility is planned to be constructed to interstate standards, and would have two traffic lanes in each direction separated by a median. Paved shoulders would also be provided. in association with Stantec 2
6 The 2004 Study analyzed the financial feasibility of several different tolling scenarios for the Bypass. For the 2006 Update, the preferred scenario from the 2004 Study was assumed, but was modified to include tolling for the Arkansas portion of the Bypass only. The assumed tolling plan for the Bypass currently has one mainline toll collection point located in Arkansas between the Highway 72 and US 71 / US 71 Business interchanges, and ramp toll collection points to and from the north at the CR 24, Highway 72 South and Highway 72 north interchanges (see Figure 1). According to the 2006 Update Report, the site of the mainline toll collection point was located to capture the best possible number of toll facility users and toll revenue, discourage diversion and offer good horizontal and vertical sight distance. We made all of our analyses presented herein based on toll collection within these locations. The mainline toll collection point would be designed to have two express lanes and three cash lanes per direction. The ramp toll collection points would be designed to have one express lane and one cash lane per location. There are three main sections to this draft traffic and revenue report: the first section identifies key factors in the 2006 Update Report and assess the magnitude that each has on the estimated traffic and revenues; the second section summarizes the 2007 field work data collection made specifically for our estimates; and the third section discusses the traffic and revenue model and shows the base case traffic and revenue estimates along with sensitivity runs for key input parameters. IDENTIFICATION OF KEY FACTORS FROM HNTB/WSA TRAFFIC AND REVENUE REPORT, APRIL 2006 To expedite our work, C&B/Stantec utilized several existing data sources. Much of this information was contained in the 2006 Update Report. Historical traffic data and construction information was also collected for the area from independent research and other sources such as the Arkansas State Highway and Transportation Department (AHTD). We also conducted travel time runs and observations on US 71 and neighboring alternate routes for AM, midday, and PM peak hour periods during a weekday and a weekend day. The purpose for this survey was to identify potential alternate routes and assess the relative travel time differences between each alternate route and the Bypass. These travel time runs were used to supplement the travel time data collected by HNTB/WSA. We also made independent traffic counts for one week at six area locations (three on US 71, two on Highway 340 and one on Highway 279), including vehicle classification counts. In addition, we made truck video observations to determine the percentage of owner-operators (those drivers who own their rigs) versus fleet (rigs owned by companies). in association with Stantec 3
7 This review identified primary factors that would influence the Bypass traffic estimate. These factors plus the influence on the HNTB/WSA estimates and the magnitudes of their likely impacts on the traffic forecast are summarized in Table 1. Table 1 Factors That Influence Bella Vista Traffic and Revenue Estimates Factors Influencing Traffic Forecast Toll Plaza Configuration Effects of Congestion on Alternative Routes Toll Rates Bypass Capture Rate Truck Usage Projected Growth Rates Ramp-up Relationship The assumed mainline toll collection point location captures much of the local traffic at higher per-mile toll rates than the longdistance traffic The congestion on US 71 is for short intervals (over a 24-hour time period) and is directional. At or near to the top of the revenue curves. Captures almost 55% of total traffic near the Missouri State line and 27% near the southern end. Assumes a high usage of long-distance trucks for a 14-minute time savings on multiple-hour journeys. Moderate growth rates assumed throughout the time period Assumed ramp-up is short (18 months) and not steep (-25% loss the first year and -7% loss the second year) Magnitude of Impact on HNTB/WSA Estimates Moderate High (decreased revenues) Moderate (decreased revenues) Moderate (decreased revenues) High (decreased revenues) None Moderate (decreased revenues, opening years) Toll Collection Point Configuration Under the mainline tolling configuration, the passenger car tolls charged at the mainline result in the portion of traffic traveling between Bella Vista Village and Bentonville (or points south; which was estimated by WSA to be 25 percent of the mainline traffic) paying the mainline toll of $1.50 for a 6-mile trip on the Bypass, or $0.25 per mile. This per-mile rate is higher than many urban, congestion-relieving toll in association with Stantec 4
8 facilities. The assumed time savings for this trip according to HNTB/WSA would be 6 minutes, or a value of time (VoT) of $0.25 per minute, or $15.00 per hour, which is 50 percent higher than their own assumed VoT of $9.78 for their analyses of the Bypass Effects of Congestion on Alternative Routes Collected speed data suggests that little congestion exists along northbound US 71 today. Only for a few hours during the week s worth of data collected did speeds drop below a free-flow speed of about 55 mph. Using this data, it was estimated that speeds along US 71 northbound decreased when traffic volumes exceeded 1,300 vehicles per hour (an average of 650 vehicles per lane). At the northern terminus of the, little or no congestion exists. Therefore, even as traffic grows in the future, the level of congestion in the area will be minor for the majority of the day. Toll Rates The HNTB/WSA assumed optimal toll for two-axle (passenger) vehicles is $1.50 for the mainline, for a 14.6-mile tolled trip (which equates to 10 cents per mile). HNTB/WSA also estimated that some 5,000 of the 12,000 (or some 40 percent) would through trips or trips that would travel the full 14.6 miles. Consequently, the remaining 60 percent (local traffic) would pay considerably higher per-mile rates (up to 25 cents per mile). Figure 2 I-15 Express lanes (CA) SR 91 (CA) Miami Dade Expressway, Snapper Creek, S.R. 878 (FL) Chicago Skyway (IL) Miami Dade Expressway, Airport, S.R. 112 (FL) San Joaquin Hills Corridor (CA) Delaware Turnpike (I-95) (DE) Miami Dade Expressway, Gratigny, S.R. 924 (FL) Tampa Crosstown Expressway (FL) E-470 (CO) Dulles Greenway (VA) Massachusetts Tpke., Boston Extension (MA) Toronto 407 (Canada) Miami Dade Expressway, Don Shula, S.R. 874 (FL) Sam Houston Tollway (TX) North-South Tollway (IL) Southern Connector (SC) JFK Memorial Highway (MD) SR 241-Foothill/Eastern Toll Road (CA) OOCEA S.R. 408 (East-West Expressway) (FL) Hardy Toll Road (TX) Miami Dade Expressway, Dolphin, S.R. 836 (FL) (AR) Dallas North Tollway (TX) OOCEA S.R. 429 (Western Espressway) (FL) Beachline West, Florida's Turnpike (FL) OOCEA S.R. 417 (Central Florida GreeneWay) (FL) Dulles Toll Road (VA) Sawgrass Expressway (FL) Georgia 400 (GA) OOCEA S.R. 528 (Beachline Expressway) (FL) Florida's Turnpike (FL) Pennsylvania Turnpike (PA) New Jersey Turnpike (NJ) Ohio Turnpike (OH) West Virginia Turnpike (WV) Maine Turnpike (ME) Massachusetts Turnpike (MA) New York State Thruway (NY) Kansas Turnpike (KS) Spaulding Turnpike (NH) Indiana Toll Road (IN) Garden State Parkway (NJ) Toll Rate Per Mile (cents per mile, non-discounted) Passenger Vehicles in association with Stantec 5
9 Comparison of Passenger Car Tolls to Other Toll Facilities The attached Figure 2 shows passenger car toll rates on various US toll facilities (compiled from published information spring 2007). The Bypass is expected to charge $1.50 for facility usage, equating to $0.10 per mile for a full length trip and $0.25 per mile for the shorter, Bella Vista Village to Bentonville trip. Figure 3 Sam Houston Tollway (TX) San Joaquin Hills Corridor (CA) Delaware Turnpike (I-95) E-470 (CO) B Toronto 407 (Canada) JFK Memorial Highway (MD) North-South Tollway (IL) Hardy Toll Road (TX) Georgia 400 Massachusetts Tpke. Boston Extension SR 241-Foothill/Eastern Toll Road (CA) (AR) Dulles Greenway (VA) Bee Line west, Florida's Turnpike OOCEA S.R. 408 (East-West Expressway) (FL) Sawgrass Expressway (FL) OOCEA S.R. 417 (Central Florida GreeneWay) (FL) Dallas North Tollway (TX) OOCEA S.R. 528 (Bee Line Expressway) (FL) NY State Thruway New Jersey Turnpike Florida's Turnpike OOCEA S.R. 429 (Western Espressway) (FL) Pennsylvania Turnpike Maine Turnpike Spaulding Turnpike (NH) West Virginia Turnpike Massachusetts Turnpike Kansas Turnpike Dulles Toll Road (VA) Southern Connector (SC) Ohio Turnpike Indiana Toll Road Garden State Parkway (NJ) Toll Rate Per Mile (cents per mile, non-discounted) Heavy Trucks Comparison of 5-Axle Truck Tolls to Other Toll Facilities Figure 3 shows similar data for 5-axle vehicles. The Bypass is expected to charge $6.00 for facility usage by heavy trucks, equating to $0.40 per mile for a full length trip and $1.00 per mile for the shorter, Bella Vista Village to Bentonville trip. in association with Stantec 6
10 Bypass Capture Rate The capture rate represents the percent of toll customers compared to all travelers at a given screenline (a line drawn across an area at which all traffic passing through that line on each individual roadway is analyzed).. The HNTB/WSA capture rate for the toll facility was 55 percent in Missouri (where the facility is non-tolled) and 27 percent near the southern end. The bypass provides 50 percent of roadway capacity near the State line (with four expressway lanes Bypass + four lanes of express lanes US 71) and some 75 percent of roadway capacity south of Bella Vista Village (with four expressway lanes Bypass at 2,000 vehicles per lane per hour + four lanes of signalized US 71 at 650 vehicles per lane per hour). Capture rates in highly congested urban areas throughout the United States range on the order of percent, with lower capture rates in rural areas with competitive non-tolled facilities. Truck Usage HNTB/WSA assumed Bypass truck usage of 20 percent of total traffic at the mainline toll collection point. According to the origin destination surveys performed by HNTB/WSA, the long-distance trips (not clearly defined in the HNTB/WSA Report as to how long of a distance), account for 69 percent of all truck traffic at the mainline location. A travel time savings of 14 minutes (estimated by HNTB/WSA) on a longdistance trip, assuming a trip of 3 hours or more, would not likely be a benefit for the truck driver, as they would not be able to make an extra run in a given day. Thus they are less likely to pay a toll for no benefit other than ease of travel over the at-times congested US 71 south of Bella Vista Village. Projected Growth Rates We reviewed HNTB/WSA s projected growth rates for traffic on the Bypass and have investigated independently the socioeconomic characteristics of the area. The projected growth rates were compared to historic traffic growth rates in the area and other similar toll facilities, as well as forecasted population and employment growth in the region. In conjunction with the economic forecasts and historic patterns, the baseline growth rates are in our opinion, reasonable, and have been applied to all of our models. Ramp-up Opening year traffic levels, and levels in the first few years after opening, are influenced by many factors, including current trip making characteristics, as well as those changes that will occur because of the presence of the new toll facility. The process of traffic reaching its full potential over a given time, without considering nominal growth, is considered ramp-up. in association with Stantec 7
11 The 2006 Update Report shows a reduced revenue stream due to ramp-up for two years at -25 percent for the first year and -7 percent for year two. Based on C&B s and Stantec s experiences from other toll roads, the typical ramp-up period is two to five years and varies by facility type, projected growth, development, traffic characteristics and other local considerations. New toll facilities tend to reach equilibrium by year five (month 60), while other facilities, which are part of an existing roadway network, reached equilibrium much faster: some within two years. In consideration of these factors, it is our opinion that the ramp-up for the Bypass would be slower than the 2006Update Report suggests. We have used a 4-year ramp-up period, with -45 percent, -30 percent, -15 percent, -10 percent for each of the four years following the opening, respectively. SUMMARY OF 2007 FIELD WORK DATA COLLECTION C&B conducted travel time runs and observations on US 71 and neighboring alternate routes for AM, midday, and PM peak hour periods during a weekday and a weekend day. The purpose for this survey was to identify the relative travel time differences between each alternate route and the Bypass. These travel time runs were used to supplement the travel time data collected by HNTB/WSA. We also made independent traffic counts using automatic traffic recorders (ATR) for one week at six area locations (three on US 71, two on Highway 340 and one on Highway 279), and conducted vehicle classification counts. In addition, we made truck video observations to determine the percentage of owner-operators (those drivers who own their rigs) versus fleet (rigs owned by companies). Traffic Counts Traffic count locations are shown in Figure 4. The ATR traffic data for a week in June 2007 along US 71 in Arkansas and Missouri were collected and summarized. The data were summarized into 15-minute and rolling hour totals for passenger vehicles, light trucks, heavy trucks and total vehicles. In the northbound direction, volumes typically remain low throughout the day, peaking at almost 2,000 vehicles per hour during the PM peak. In the southbound direction, traffic volumes peak in the AM at just over 1,500 vehicles per hour. Other than these two peaks, traffic volumes remain in the range of 1,000 to 1,200 throughout the remainder of the day. Speed data were also summarized and the weighted average speed in each direction for both 15-minute intervals and rolling hours were calculated. In the southbound direction during the AM peak hour, traffic volumes peak, causing congestion. During this hour, average speeds decrease to almost 30 mph. This condition lasts for one hour, and then speeds return to free-flow conditions. A similar condition occurs in the northbound direction during the PM peak hour. Again, speeds decrease to almost 40 mph for one hour before returning to free-flow conditions. in association with Stantec 8


12 DRAFT TRAFFIC AND REVENUE REPORT Figure 4 Saturday and Sunday volumes were marginally lower than during the week, with traffic volumes never exceeding 1,500 vehicles per hour. However, free-flow conditions provided for consistently high speeds, with no peaks. As shown in accompanying graphs, when traffic levels exceed 1,500 vehicles per hour per direction, congestion ensues, causing a decrease in the average vehicle speed. However, this decrease in speed only lasts for approximately one hour during the weekday AM peak in the southbound direction and the PM peak in the in association with Stantec 9
13 northbound direction. Figures 5 and 6 show average weekday traffic and speeds; and Figures 7 and 8 show the similar data for an average weekend day. Figure 5 Rolling Hour Volume and Weighted Average Speed Typical Weekday Route 71 Southbound - South of Bella Vista Village Rolling Hour Volume Weighted Average Speed Rolling Hour Volume Weighed Average Speed Figure 6 Rolling Hour Volume and Weighted Average Speed Typical Weekday Route 71 Northbound - South of Bella Vista Village Rolling Hour Volume Weighted Average Speed Rolling Hour Volume Weighted Average Speed in association with Stantec 10
14 Figure Rolling Hour Volume and Weighted Average Speed Typical Weekend Route 71 Northbound - South of Bella Vista Village 70 Rolling Hour Volume Weighted Average Speed Rolling Hour Volume Weighted Average Speed Figure 8 Rolling Hour Volume and Weighted Average Speed Typical Weekend Route 71 Southbound - South of Bella Vista Village Rolling Hour Volume Weighted Average Speed Rolling Hour Volume Weighted Average Speed in association with Stantec 11
15 Video Survey of Trucks We also undertook a video survey for northbound traffic along US 71 near the State line (shown on Figure 4). The videos were filmed on Sunday June 10, 2007 and Tuesday June 12, During our review we identified each truck passing to determine vehicle size, ownership and range (sleepers and/or large fuel tanks). On Sunday, there were 384 trucks recorded from 5:55 AM to 6:15 PM; on Tuesday, there were 870 trucks recorded from 6:00 AM to 5:55 PM. There were four types of boxes recorded on the trucks: storage boxes, refrigerated boxes, tanker and no box. On Sunday, 71 percent of the total trucks had storage boxes; 14 percent had refrigerated boxes; 13 percent had tankers attached to them; and 2 percent had no box attached to them. On Tuesday, 66 percent of the total trucks had storage boxes; 15 percent had refrigerated boxes; 17 percent had tankers attached to them; and 2 percent has no boxes attached to them. Figure 9 summarizes the weekday findings. Figure 9 Box Type Breakdow n Weekday Flatbed 17% No Box 2% Reefer 15% Storage 66% There were three sizes of gas tanks recorded on the trucks: large, small and hidden. On Sunday, 60 percent had large gas tanks; 7 percent had small gas tanks; and 33 percent had hidden gas tanks. On Tuesday, 49 percent had large gas tanks; 20 percent had small gas tanks; and 31 percent had hidden gas tanks. Figure 10 graphically displays the weekday results. in association with Stantec 12
16 Figure 10 Gas Tank Type Breakdown Weekday Hidden 31% Large 49% Small 20% Trucks were also classified by whether or not they had a sleeper compartments. On Sunday, 94 percent had sleeper compartments and on Tuesday, 82 percent had sleeper attachments. Figure 11 summarizes the weekday data. Figure 11 Sleeper Type Breakdow n Weekday Sleeper Cab 82% No Sleeper Cab 18% Ownership was classified as either company operated or owner operated. Those that could not be determined were classified as unknown. On Sunday, 14 percent were owner operated trucks, 36 percent were company operated trucks, and 50 percent were unknown. On Tuesday, 7 percent were owner operated, 19 percent were company operated and 74 percent were unknown. Figure 12 summarizes the weekday data. in association with Stantec 13
17 Figure 12 Ow nership Type Breakdow n Weekday DRAFT TRAFFIC AND REVENUE REPORT Company 19% Unknow n 74% Ow ner Operated 7% The high percentage of trucks with sleeper compartments and large gas tanks suggests that more than 80 percent of the trucks in the corridor on a weekday are likely to be on long distance trips. Given that we calculated the maximum time savings for a through-trip using the is 12 minutes, there is a low incentive for a large proportion of these long-distance trucks to pay a toll to use the Bypass. Based on a day of driving, a time savings of 12 minutes is inconsequential. In addition, owner-operators usually receive a fixed fee per load, with fuel, lodging and tolls paid by the driver out of the fee. In this case, many of the drivers would likely avoid paying tolls wherever possible, unless time and distance savings fully offset the toll cost. TRAFFIC AND REVENUE MODEL and BASE TRAFFIC AND REVENUE ESTIMATES The following section summarizes the traffic and revenue model constructed to forecast traffic volumes and revenues for the. Data Collection Existing Traffic Conditions As mentioned previously, traffic counts were collected at three locations along the existing US 71 and at three locations along feeder roadways to US 71, two on Highway 340 and one on Highway 279. In addition to traffic volume counts, speed data and classification counts were also conducted. Counts conducted along US 71 near I-540 were used to determine the total traffic traveling northbound throughout the corridor. Traffic traveling southbound at the northern terminus of the was estimated based on screenline volumes given in the HNTB/ WSA Report. in association with Stantec 14


18 DRAFT TRAFFIC AND REVENUE REPORT Figure 13 Traffic counts were summarized for an average weekday and for Saturday and Sunday. Classification counts were used to determine the percentage of passenger vehicles, light trucks, and heavy trucks. Since the current proposed toll schedule calls for three separate toll rates, one for passenger vehicles, one for light trucks and one for heavy trucks, the model forecasts traffic and revenue for each of these categories. Actual traffic count data are shown in Figure 13. Where possible, data from the 2006 Update Report were utilized. According to the 2006 Update Report and data from AHTD, traffic volumes in June are 6 percent higher than the average month. We reduced our count data by 6 percent to represent an average month and to then develop our calculations. in association with Stantec 15
19 Growth Rates Corridor growth considerations provide the foundation for the estimates of the future year traffic volumes and toll revenue estimates developed. Historical population and employment data were obtained from the US Bureau of the Census for the year County-level population, employment and household income projections were obtained from existing local and national sources. We reviewed the projected growth rates for the given in the 2006 Update Report, as well as other economic and population data. The projected growth rates were compared to historic traffic growth rates in the area, as well as forecasted population and employment. Growth that would occur between today s existing conditions and the opening of the toll facility were not provided in the 2006 Update Report. We determined the potential growth for that period based on count data supplied in the 2004 and 2006 Reports. In consideration of the additional data that we reviewed, we had to gradually scale down our projected growth rates In order to meet HNTB/WSA s projected growth rates. Growth rates for light trucks were the same as passenger vehicles. Growth rates for heavy trucks were reduced slightly to better represent the historic growth rate patterns for trucks. Existing Traffic Data and Future Growth Since a portion of the incentive to use the is time savings due to the avoidance of congestion we constructed a model that divided the week into eight time periods. After examining count data along US 71, weekday traffic volumes were divided into four separate periods, AM peak (7-10 AM), midday (MD) peak (12-2 PM), PM peak (2-7 PM), and off-peak (12-7 AM, 10 AM 12 PM, 7 PM 12 AM). Likewise, Saturday and Sunday were divided into two periods, peak (10 AM 7 PM) and off-peak (12-10 AM, 7PM 12AM). Growth rates for each vehicle class were applied and traffic volumes for each of the eight periods were projected for every year until These volumes represent the total capturable traffic for the Bella Vista Bypass. Time Savings Calculations The 2006 Update Report contains time and distance savings estimates for four separate origin-destination movements. While these four movements cover the short, medium, and long trip categories that would utilize the bypass, each origin-destination pair contains a segment of US 71 south of the decision point where vehicles must decide whether to take the free US 71 or the tolled. To more fairly compare the two route choices, we developed an independent estimate of the time-distance savings for the three trip categories for both peak travel conditions where congestion may exist on US 71 and off-peak conditions where free flow speeds on US 71 are likely. After examining the US 71 Corridor Management Plan, delays due to traffic signals were estimated for short, medium and long trips through the corridor for both in association with Stantec 16
20 peak and off-peak hours. Free-flow speeds were assumed to be 65 mph on the Bella Vista Bypass and between 45 and 55 mph on US 71. Our estimates for the time saved by using the vary from the HNTB/WSA estimates. During peak hours, our estimated time saved for short trips was the same as HNTB/WSA - 6 minutes; time saved for medium trips we estimated at 10 minutes compared to HNTB/WSA s 7 minutes; and time saved for long trips we estimated would be 12 minutes compared to HNTB/WSA s 14 minutes. Diversion curves based on time savings were applied to our estimates for each trip length. Traffic Diversion Curves Toll diversion curves were developed based on previous efforts made by Stantec Consulting. The economic data supplied in the 2006 Update Report and other data on median income were used to adapt the curves for use in Benton County, Arkansas. A sample diversion curve is shown in Figure 14. As time savings for a toll facility increases, the percentage of vehicles willing to pay the toll increases. Figure 14 Standard Toll Diversion Curve HIGH Diversion LOW LOW Time Savings HIGH Trip purpose information from the 2006 Update Report was used to calculate a weighted average diversion curve. The desire of drivers of passenger vehicles to use a toll facility depends on time savings vs. toll rate, trip purpose and value of time. During the peak hours, work trips represent a significant portion of the volume on US 71 and the average value of time is generally the highest. For off-peak periods, this percentage was reduced by 2/3 and trip purposes were normalized and the weighted average was recalculated. This reflects the lower value of time of non-work trips. in association with Stantec 17
21 Likewise, trip pattern information for both passenger vehicles and trucks from the 2006 Update Report was utilized. Trip patterns were applied to the short, medium, and long trips to determine the total amount of potential traffic for the. Passenger vehicles destined for Bella Vista Village, a short trip, comprised 44 percent of the total passenger vehicle trips, with 7 percent representing medium trips, and 19 percent destined for points north of the. Passenger vehicles destined for points east of US 71 (30 percent of the total passenger vehicle trips) were consider non-potential trips or users of the Bell Vista Bypass. The majority of truck trips were long trips, almost 70 percent destined for points north of the. Seventeen percent of truck trips were considered non-potential users because their destinations were east of US 71. Table 2 Trip Length by Vehicle Class Potential Trips Short Trips Medium Trips Long Trips % % % Non-Potential Trips (%) Passenger Vehicles 44% 7% 19% 30% Off-peak PV 44% 7% 19% 30% Light Trucks 12% 2% 69% 17% Heavy Trucks 12% 2% 69% 17% The video survey of trucks traveling along US 71 shows that more than 80 percent of trucks traveling on a typical weekday are on long distance trips. Therefore, an estimated time savings of minutes over a maximum eleven hour trip does not carry the same importance to these truck drivers. Owner-operators also tend to be very toll averse, since their payment is usually a fixed fee per load with any costs, including tolls, being deducted from their profit. Given these data, diversion rates for medium and long trips for both light and heavy trucks were reduced from HNTB/WSA levels by 5 and 10 percent, respectively. Congestion along US 71 As mentioned previously, the collected speed data suggest that very little congestion exists along US 71 today, with the exception of a few hours of PM period northbound traffic during which speeds drop below the free-flow speed of about mph. Using our collected data, it was estimated that speeds along US 71 northbound decreased when traffic volumes exceeded an average of 750 vehicles per lane per hour. Therefore, whenever forecasted traffic volumes exceeded 750 vehicles per lane per hour, an additional percentage of traffic was shifted onto the tolled Bella Vista Bypass. Given the existing traffic statistics of the southbound traffic, no additional southbound traffic (other than those choosing to use the Bypass) was routed onto the Bella Vista Bypass due to congestion during peaking periods. While some congestion exists in the southbound direction near Bella Vista Village during the AM peak, further north in association with Stantec 18
22 on Route 71 at the point where the splits from Route 71, traffic volumes are very light and little or no congestion exists. Ramp Tolls We did not conduct an independent estimate of the traffic and revenue that would be generated by the ramp toll collection points along the, as the ramp tolls were expected to generate less than 10 percent of the total revenues. We applied the ratio of the HNTB/WSA estimated mainline traffic to the HNTB/WSA estimated ramp traffic and we applied those factors to our own estimated mainline toll collection point transactions to estimate transactions and revenues for the ramp toll collection points. Ramp-up Ramp-up is often defined as the time it takes for the drivers to become aware of a new (toll) facility and its potential benefits, change old habits and begin using the new (toll) facility. Based on our experience from other toll facilities, typical ramp-up period is two to five years; several new toll facilities have reached equilibrium by year five (month 60), while other facilities, however, which were already part of an existing roadway network, reached equilibrium much faster, some within two years. Often, signage and mapping indicating the presence of the new facility are delayed and do not occur at the time of a facility s opening. This is particularly important when a facility will serve travelers coming from areas outside the project corridor. For the, characteristics are such that we would expect the rampup period to be four years; therefore, our revenue estimates were reduced by 45 percent, 30 percent, 15 percent, and 10 percent for the first four years, respectively, to reflect ramp up. Traffic and Revenue Estimates Based on the aforementioned information, our traffic and revenue estimates in the opening year of 2011 are 1.3 million transactions yielding $2.9 million in revenue. In 2042 transactions are estimated to increase to 4.0 million yielding revenue up to $8.5 million. These are shown in Table 3; detailed information on the traffic and revenue estimates are shown in the Appendix tables and figures. All Electronic Toll Facility Traffic and revenue projections were also calculated for an alternative in which the operates as an all electronic toll collection (ETC) facility. Because there are no other toll facilities in the area, passenger vehicles were estimated to achieve a 35 percent ETC market share in opening year of 2011, increasing gradually to 70 percent by Assuming interoperability with existing ETC systems (such as E-ZPass), and since truck traffic is assumed to be comprised of longer distance trips, a higher ETC share was assumed: 50 percent for light trucks and 60 percent for heavy trucks in Truck ETC share reaches 80 percent for both light and heavy trucks by in association with Stantec 19
23 Opening year 2011 ETC transactions are estimated to be 300,000 with revenue of $730,000. In 2042 ETC transactions are estimated to increase to 2.88 million yielding revenue up to $6.35 million. These are also shown in Table 3; detailed information, including assumed ETC capture rates by vehicle class, are shown in tables and figures in the Appendix. Table 3 Stantec Estimates Full Service Toll Facility All ETC Toll Facility Transactions Revenue Transactions Revenue ,300,000 $2,900, ,000 $1,200, ,690,000 $3,770, ,000 $1,670, ,150,000 $4,720, ,000 $2,240, ,360,000 $5,170,000 1,080,000 $2,610, ,690,000 $5,860,000 1,320,000 $3,150, ,790,000 $6,030,000 1,470,000 $3,420, ,840,000 $6,150,000 1,590,000 $3,690, ,910,000 $6,270,000 1,710,000 $3,940, ,960,000 $6,380,000 1,830,000 $4,200, ,010,000 $6,480,000 1,950,000 $4,460, ,070,000 $6,580,000 2,080,000 $4,720, ,110,000 $6,700,000 2,190,000 $4,910, ,170,000 $6,800,000 2,290,000 $5,060, ,220,000 $6,890,000 2,320,000 $5,130, ,260,000 $6,990,000 2,350,000 $5,200, ,320,000 $7,090,000 2,400,000 $5,290, ,380,000 $7,200,000 2,430,000 $5,360, ,420,000 $7,300,000 2,470,000 $5,450, ,470,000 $7,420,000 2,500,000 $5,520, ,520,000 $7,520,000 2,540,000 $5,610, ,560,000 $7,600,000 2,560,000 $5,670, ,600,000 $7,680,000 2,600,000 $5,720, ,640,000 $7,760,000 2,620,000 $5,780, ,680,000 $7,840,000 2,650,000 $5,850, ,710,000 $7,930,000 2,680,000 $5,900, ,750,000 $8,000,000 2,710,000 $5,960, ,800,000 $8,090,000 2,730,000 $6,030, ,840,000 $8,180,000 2,760,000 $6,090, ,870,000 $8,250,000 2,800,000 $6,160, ,920,000 $8,340,000 2,820,000 $6,220, ,960,000 $8,430,000 2,850,000 $6,290, ,010,000 $8,520,000 2,880,000 $6,350,000 in association with Stantec 20
24 Sensitivity Analyses The 2006 Update Report assumed a certain toll rate and location of the Mainline Toll Collection Point, growth rates and value of time. Vital to such an assessment or recommendation is also assessing the users sensitivities. Sensitivity analyses were performed for eight separate scenarios: Passenger car toll rate lowered to $0.75 at Mainline Toll Collection Point Passenger car toll rate lowered to $1.00 at Mainline Toll Collection Point Passenger car toll rate lowered to $1.25 at Mainline Toll Collection Point Passenger car toll rate raised to $1.75 at Mainline Toll Collection Point Passenger car toll rate raised to $2.00 at Mainline Toll Collection Point Value of Time Increased Value of Time Decreased Aggressive Traffic Growth Rates Relocation of the Mainline Toll Collection Point The first sensitivity run decreased the toll rate at the Mainline Toll Collection Point to $0.75 for passenger vehicles, $2.50 for light trucks, and $5.00 for heavy trucks. With the lowering of the toll rates, more vehicles were likely to use the. In addition to reducing the mainline toll, ramp tolls were reduced proportionately. Since the proposed mainline toll rate is $0.75 for passenger vehicle, 50 percent lower than the base case scenario, the average toll rates given in the 2006 HNTB/WSA Report for the ramp toll collection points were reduced by 50 percent. Though transactions increased by nearly 31 percent per year from our base case scenario, due to the lower toll rate, the revenues generated decreased approximately 35 percent per year. A second sensitivity run decreased the toll rate at the Mainline Toll Collection Point to $1.00 for passenger vehicles, $2.00 for light trucks and $4.00 for heavy trucks. Average ramp toll rates were reduced proportionately, as discussed above. Similarly to the first sensitivity run, transactions increased by 20 percent per year, but revenue decreased by 20 percent per year compared to our base case scenario. A third sensitivity run decreased the toll rate at the Mainline Toll Collection Point to $1.25 for passenger vehicles, $2.50 for light trucks and $5.00 for heavy trucks. Average ramp toll rates were reduced proportionately, as discussed above. Transactions increased by 10 percent per year, but revenue decreased by 9 percent per year compared to our base case scenario. in association with Stantec 21
25 The toll rate at the Mainline Toll Collection Point was increased to $1.75 for passenger vehicles, $3.50 for light trucks and $7.00 for heavy trucks to determine whether raising the toll rate would have a positive impact on revenue. In this scenario, average ramp toll rates were increased by approximately 16 percent to remain consistent with the increase for the mainline toll. Even though transactions decreased by 10 percent per year, revenues increased by 5 percent over the base case scenario. The final toll rate sensitivity run analyzed was increasing the Mainline Toll Collection Point to $2.00 for passenger vehicles, $4.00 for light trucks, and $8.00 for heavy trucks. With the increase of the toll rates, the number of vehicles using the Bella Vista Bypass decreases. Average ramp toll rates were increased 33 percent to reflect the increase to the mainline toll. Transactions on the decreased 18 percent while revenues increased 5 percent compared to our base case scenario. The value of time was increased to reflect a higher income in the area, which would increase a user s likelihood to pay a toll to save time. The value of time, however, only has a major influence over work-based trips and has little impact on light and heavy trucks. Based on trip purpose information from the 2006 Update Report, approximately 75 percent of northbound passenger vehicle trips were work-related trips and 80 percent of southbound passenger-vehicle trips were work-related. The increased value of time was added to these users causing an increase in passenger vehicles trips on the proposed. The increase in trips, however, only has a minor impact on overall transactions and revenues. Transactions increased approximately 3 percent per year over the base case scenario and revenues increased by 2 percent per year over the base case scenario. Conversely, a sensitivity analysis was performed for a decrease in the value of time. Again, this decrease in value of time was only applied to work-related trips. With a decreased value of time, transactions were reduced by 3 percent per year and revenues decreased by approximately 3 percent per year over the base case scenario. Since the Bentonville area has shown tremendous growth over the last decade, a sensitivity analysis was performed for aggressive growth continuing into the near future. With the aggressive growth rates, transactions increased by nearly 6 percent per year with revenue increasing by over 5 percent per year over the base case scenario. The final sensitivity analysis involved the relocation of the Mainline Toll Collection Point closer to the Arkansas-Missouri border. This sensitivity analysis is ongoing and results will be available within the next week. in association with Stantec 22
26 The following table summarizes the sensitivity analyses and their impacts on transactions and revenue. Table 4 Factors That Influence Bella Vista Traffic and Revenue Estimates Sensitivity Analysis Impact on Transactions Impact on Revenue Toll rate lowered to $0.75 Increase 31 percent Decrease 35 percent Toll rate lowered to $1.00 Increase 20 percent Decrease 20 percent Toll rate lowered to $1.25 Increase 10 percent Decrease 9 percent Toll rate raised to $1.75 Decrease 10 percent Increase 5 percent Toll rate raised to $2.00 Decrease 18 percent Increase 8 percent Value of Time increased Increase 3 percent Increase 2 percent Value of Time decreased Decrease 3 percent Decrease 3 percent Aggressive growth rates Increase 6 percent Increase 5 percent Relocation of mainline toll collection point in association with Stantec 23
27 APPENDIX in association with Stantec
28 Table 1 Transactions and Revenue - WSA Forecast 2004 and REPORT 2004 REPORT % Change % Change WSA Transactions WSA Revenue $ / Transaction Transactions Revenue Transactions Revenue $ / Transaction Transactions Revenue ,641,000 $7,222,000 $ ,737,000 $7,672,000 $ ,741,000 $9,385,000 $ % 30.0% ,879,000 $7,892,000 $ % 2.9% ,327,000 $10,515,000 $ % 12.0% ,025,000 $8,118,000 $ % 2.9% ,530,000 $10,862,000 $ % 3.3% ,175,000 $8,351,000 $ % 2.9% ,712,000 $11,166,000 $ % 2.8% ,330,000 $8,591,000 $ % 2.9% ,872,000 $11,434,000 $ % 2.4% ,490,000 $8,838,000 $ % 2.9% ,007,000 $11,674,000 $ % 2.1% ,654,000 $9,092,000 $ % 2.9% ,133,000 $11,908,000 $ % 2.0% ,823,000 $9,353,000 $ % 2.9% ,256,000 $12,134,000 $ % 1.9% ,997,000 $9,621,000 $ % 2.9% ,378,000 $12,358,000 $ % 1.8% ,177,000 $9,897,000 $ % 2.9% ,499,000 $12,581,000 $ % 1.8% ,362,000 $10,181,000 $ % 2.9% ,616,000 $12,795,000 $ % 1.7% ,552,000 $10,473,000 $ % 2.9% ,732,000 $13,006,000 $ % 1.6% ,748,000 $10,774,000 $ % 2.9% ,846,000 $13,214,000 $ % 1.6% ,951,000 $11,083,000 $ % 2.9% ,958,000 $13,422,000 $ % 1.6% ,055,000 $11,249,000 $ % 1.5% ,062,000 $13,623,000 $ % 1.5% ,161,000 $11,418,000 $ % 1.5% ,168,000 $13,827,000 $ % 1.5% ,268,000 $11,589,000 $ % 1.5% ,276,000 $14,034,000 $ % 1.5% ,377,000 $11,763,000 $ % 1.5% ,385,000 $14,245,000 $ % 1.5% ,488,000 $11,939,000 $ % 1.5% ,496,000 $14,459,000 $ % 1.5% ,563,000 $12,058,000 $ % 1.0% ,571,000 $14,604,000 $ % 1.0% ,639,000 $12,179,000 $ % 1.0% ,647,000 $14,750,000 $ % 1.0% ,715,000 $12,301,000 $ % 1.0% ,723,000 $14,898,000 $ % 1.0% ,792,000 $12,424,000 $ % 1.0% ,800,000 $15,047,000 $ % 1.0% ,870,000 $12,548,000 $ % 1.0% ,878,000 $15,197,000 $ % 1.0% ,949,000 $12,673,000 $ % 1.0% ,957,000 $15,349,000 $ % 1.0% ,028,000 $12,800,000 $ % 1.0% ,037,000 $15,502,000 $ % 1.0% ,108,000 $12,928,000 $ % 1.0% ,117,000 $15,657,000 $ % 1.0% ,189,000 $13,057,000 $ % 1.0% ,198,000 $15,814,000 $ % 1.0% ,271,000 $13,188,000 $ % 1.0% ,280,000 $15,972,000 $ % 1.0% ,354,000 $13,320,000 $ % 1.0% ,363,000 $16,132,000 $ % 1.0% ,438,000 $13,453,000 $ % 1.0% ,447,000 $16,293,000 $ % 1.0% WITHOUT RAMP-UP Transactions Revenue ,854,667 $9,629, ,097,849 $10,091, % 4.8% ,327,000 $10,515, % 4.2% Stantec Consulting, Inc. 8/2/2007
29 Table 2 Estimated Transactions and Revenue - Stantec Consulting Forecast Base Case Scenario Year Transactions Northbound Transactions Southbound Ramp Transactions Total Transactions Total Transactions (with Ramp-up) Revenue Northbound Revenue Southbound Ramp Revenue Total Revenue Total Revenue (with Ramp-up) Average Toll Northbound Average Toll Southbound ,440, , ,000 2,370,000 1,300,000 $2,950,000 $1,880,000 $440,000 $5,270,000 $2,900,000 $2.05 $3.24 $ ,480, , ,000 2,430,000 1,700,000 $3,020,000 $1,920,000 $450,000 $5,390,000 $3,770,000 $2.04 $3.20 $ ,560, , ,000 2,530,000 2,150,000 $3,150,000 $1,960,000 $450,000 $5,560,000 $4,730,000 $2.02 $3.21 $ ,640, , ,000 2,620,000 2,360,000 $3,290,000 $1,990,000 $460,000 $5,740,000 $5,170,000 $2.01 $3.21 $ ,680, , ,000 2,690,000 2,690,000 $3,360,000 $2,030,000 $470,000 $5,860,000 $5,860,000 $2.00 $3.17 $ ,760, , ,000 2,790,000 2,790,000 $3,500,000 $2,070,000 $470,000 $6,040,000 $6,040,000 $1.99 $3.18 $ ,800, , ,000 2,840,000 2,840,000 $3,570,000 $2,100,000 $480,000 $6,150,000 $6,150,000 $1.98 $3.18 $ ,840, , ,000 2,910,000 2,910,000 $3,650,000 $2,140,000 $490,000 $6,280,000 $6,280,000 $1.98 $3.15 $ ,880, , ,000 2,960,000 2,960,000 $3,710,000 $2,170,000 $500,000 $6,380,000 $6,380,000 $1.97 $3.14 $ ,910, , ,000 3,010,000 3,010,000 $3,780,000 $2,210,000 $500,000 $6,490,000 $6,490,000 $1.98 $3.16 $ ,950, , ,000 3,070,000 3,070,000 $3,840,000 $2,240,000 $510,000 $6,590,000 $6,590,000 $1.97 $3.15 $ ,980, , ,000 3,110,000 3,110,000 $3,910,000 $2,270,000 $520,000 $6,700,000 $6,700,000 $1.97 $3.15 $ ,020, , ,000 3,170,000 3,170,000 $3,970,000 $2,300,000 $530,000 $6,800,000 $6,800,000 $1.97 $3.15 $ ,050, , ,000 3,230,000 3,230,000 $4,030,000 $2,330,000 $530,000 $6,890,000 $6,890,000 $1.97 $3.11 $ ,080, , ,000 3,270,000 3,270,000 $4,090,000 $2,360,000 $540,000 $6,990,000 $6,990,000 $1.97 $3.11 $ ,110, , ,000 3,320,000 3,320,000 $4,150,000 $2,400,000 $550,000 $7,100,000 $7,100,000 $1.97 $3.12 $ ,150, , ,000 3,380,000 3,380,000 $4,210,000 $2,430,000 $560,000 $7,200,000 $7,200,000 $1.96 $3.12 $ ,180, , ,000 3,420,000 3,420,000 $4,270,000 $2,470,000 $570,000 $7,310,000 $7,310,000 $1.96 $3.13 $ ,210, , ,000 3,470,000 3,470,000 $4,340,000 $2,500,000 $580,000 $7,420,000 $7,420,000 $1.96 $3.13 $ ,240, , ,000 3,520,000 3,520,000 $4,400,000 $2,540,000 $590,000 $7,530,000 $7,530,000 $1.96 $3.14 $ ,270, , ,000 3,560,000 3,560,000 $4,450,000 $2,570,000 $590,000 $7,610,000 $7,610,000 $1.96 $3.13 $ ,290, , ,000 3,600,000 3,600,000 $4,490,000 $2,590,000 $600,000 $7,680,000 $7,680,000 $1.96 $3.12 $ ,310, , ,000 3,640,000 3,640,000 $4,540,000 $2,620,000 $610,000 $7,770,000 $7,770,000 $1.97 $3.12 $ ,330, , ,000 3,680,000 3,680,000 $4,580,000 $2,650,000 $620,000 $7,850,000 $7,850,000 $1.97 $3.12 $ ,360, , ,000 3,720,000 3,720,000 $4,630,000 $2,670,000 $630,000 $7,930,000 $7,930,000 $1.96 $3.10 $ ,380, , ,000 3,750,000 3,750,000 $4,670,000 $2,700,000 $640,000 $8,010,000 $8,010,000 $1.96 $3.14 $ ,410, , ,000 3,800,000 3,800,000 $4,720,000 $2,730,000 $650,000 $8,100,000 $8,100,000 $1.96 $3.14 $ ,430, , ,000 3,840,000 3,840,000 $4,770,000 $2,750,000 $660,000 $8,180,000 $8,180,000 $1.96 $3.13 $ ,450, , ,000 3,880,000 3,880,000 $4,810,000 $2,780,000 $670,000 $8,260,000 $8,260,000 $1.96 $3.12 $ ,480, , ,000 3,920,000 3,920,000 $4,860,000 $2,810,000 $680,000 $8,350,000 $8,350,000 $1.96 $3.12 $ ,500, , ,000 3,960,000 3,960,000 $4,910,000 $2,840,000 $690,000 $8,440,000 $8,440,000 $1.96 $3.12 $ ,530, , ,000 4,010,000 4,010,000 $4,960,000 $2,870,000 $700,000 $8,530,000 $8,530,000 $1.96 $3.12 $2.13 Ramp-up % % % % Average Toll Total Stantec Consulting, Inc. 8/2/2007
Bella Vista Bypass Traffic and Revenue Report
 Bella Vista Bypass Traffic and Revenue Report August 27, 2009 Prepared for the: Prepared by: in association with Stantec TABLE OF CONTENTS 1.0 Introduction...2 2.0 Identification of Key Factors from HNTB/WSA
Pennsylvania Turnpike 2018 Traffic and Revenue Forecast Study
 Pennsylvania Turnpike 2018 Traffic and Revenue Forecast Study April 2018 Pennsylvania Turnpike Commission Table of Contents Chapter 1 Introduction... 1-1 1.1 Report Structure... 1-1 Chapter 2 Turnpike
Expansion Projects Description
 Expansion Projects Description The Turnpike expansion program was authorized by the Florida Legislature in 1990 to meet the State s backlog of needed highway facilities. The Legislature set environmental
Bella Vista Bypass Benefit Cost Analysis
 Bella Vista Benefit Cost Analysis The Benefit Cost Analysis (BCA) was performed in accordance with the ARRA guidance provided in the Federal Register. These benefits and costs were quantified in accordance
Benefit Cost Analysis
 Benefit Cost Analysis The Benefit Cost Analysis (BCA) was performed in accordance with the ARRA guidance provided in the Federal Register. These benefits and costs were quantified in accordance with the
Traffic and Toll Revenue Estimates
 The results of WSA s assessment of traffic and toll revenue characteristics of the proposed LBJ (MLs) are presented in this chapter. As discussed in Chapter 1, Alternatives 2 and 6 were selected as the
CHAPTER 5 ESTIMATED TRAFFIC AND TOLL REVENUE
 CHAPTER 5 ESTIMATED TRAFFIC AND TOLL REVENUE Estimated traffic and toll revenue for the proposed ICC is based on the volume of traffic that would be diverted from existing routes in the travel corridor,
US 81 Bypass of Chickasha Environmental Assessment Public Meeting
 US 81 Bypass of Chickasha Environmental Assessment Public Meeting March 14, 2013 Introductions ODOT FHWA SAIC Meeting Purpose Present need for bypass Provide responses to 10/04/11 public meeting comments
Task Force Meeting January 15, 2009
 Task Force Meeting January 15, 2009 Study Update August 14 th Task Force Meeting Update on Traffic Projections and Financial Feasibility Study presented by Kane County and WSA staff The presentation summarized
Evaluation of Renton Ramp Meters on I-405
 Evaluation of Renton Ramp Meters on I-405 From the SE 8 th St. Interchange in Bellevue to the SR 167 Interchange in Renton January 2000 By Hien Trinh Edited by Jason Gibbens Northwest Region Traffic Systems
Toll Impact Study Tier 1 Environmental Impact Statement
 PPMS: 67587 PROJECT NO: 0081-961-111 PPMS: 67588 PROJECT NO: 0081-962-116 PPMS: 67589 PROJECT NO: 0081-968-123 Tier 1 Environmental Impact Statement This technical report was prepared to support the Tier
APPENDIX C1 TRAFFIC ANALYSIS DESIGN YEAR TRAFFIC ANALYSIS
 APPENDIX C1 TRAFFIC ANALYSIS DESIGN YEAR TRAFFIC ANALYSIS DESIGN YEAR TRAFFIC ANALYSIS February 2018 Highway & Bridge Project PIN 6754.12 Route 13 Connector Road Chemung County February 2018 Appendix
House Committee on Transportation Policy Public Hearing HB April 5, 2017
 REPRESENTATIVE RICH VIAL OREGON HOUSE OF REPRESENTATIVES HOUSE DISTRICT 26 House Committee on Transportation Policy Public Hearing HB 3231 April 5, 2017 Background House District 26 Wilsonville Sherwood
STH 60 Northern Reliever Route Feasibility Study Report
 #233087 v3 STH 60 Northern Reliever Route Feasibility Study Report Washington County Public Works Committee Meeting September 28, 2016 1 STH 60 Northern Reliever Route Feasibility Study Hartford Area Development
New Jersey Turnpike Authority Interchange 6 to 9 Widening Program
 New Jersey Turnpike Authority Interchange 6 to 9 Widening Program Tuesday, September 18, 2007 Public Hearings: Time: 5:00 PM - 8:00 PM Wednesday, September 19, 2007 Senior Center 3 Municipal Drive Bordentown,
Introduction and Background Study Purpose
 Introduction and Background The Brent Spence Bridge on I-71/75 across the Ohio River is arguably the single most important piece of transportation infrastructure the Ohio-Kentucky-Indiana (OKI) region.
Clean Harbors Canada, Inc.
 Clean Harbors Canada, Inc. Proposed Lambton Landfill Expansion Environmental Assessment Terms of Reference Transportation Assessment St. Clair Township, Ontario September 2009 itrans Consulting Inc. 260
Town of Londonderry, New Hampshire NH Route 28 Western Segment Traffic Impact Fee Methodology
 Town of Londonderry, New Hampshire NH Route 28 Western Segment Traffic Impact Fee Methodology Prepared by the Londonderry Community Development Department Planning & Economic Development Division Based
Post Opening Project Evaluation. M6 Toll
 M6 Toll Five Post Years Opening After Study: Project Summary Evaluation Report Post Opening Project Evaluation M6 Toll Five Years After Study Summary Report October 2009 Document History JOB NUMBER: 5081587/905
The major roadways in the study area are State Route 166 and State Route 33, which are shown on Figure 1-1 and described below:
 3.5 TRAFFIC AND CIRCULATION 3.5.1 Existing Conditions 3.5.1.1 Street Network DRAFT ENVIRONMENTAL IMPACT REPORT The major roadways in the study area are State Route 166 and State Route 33, which are shown
RETURN ON INVESTMENT LIQUIFIED NATURAL GAS PIVOTAL LNG TRUCK MARKET LNG TO DIESEL COMPARISON
 RETURN ON INVESTMENT LIQUIFIED NATURAL GAS PIVOTAL LNG TRUCK MARKET LNG TO DIESEL COMPARISON Year 1 Year 2 Year 3 Year 4 Year 5 Year 6 Year 7 Year 8 Year 9 Year 10 RETAIL BREAK EVEN AND IRR EXAMPLE FOR
Honda Accord theft losses an update
 Highway Loss Data Institute Bulletin Vol. 34, No. 20 : September 2017 Honda Accord theft losses an update Executive Summary Thefts of tires and rims have become a significant problem for some vehicles.
Funding Scenario Descriptions & Performance
 Funding Scenario Descriptions & Performance These scenarios were developed based on direction set by the Task Force at previous meetings. They represent approaches for funding to further Task Force discussion
Parks and Transportation System Development Charge Methodology
 City of Sandy Parks and Transportation System Development Charge Methodology March, 2016 Background In order to implement a City Council goal the City of Sandy engaged FCS Group in January of 2015 to update
State Highway 32 East TIGER Discretionary Grant Application APPENDIX C - BENEFIT COST ANALYSIS REPORT
 State Highway 32 East TIGER Discretionary Grant Application APPENDIX C - BENEFIT COST ANALYSIS REPORT April 2016 I. COST-EFFECTIVENESS ANALYSIS A Benefit-Cost Analysis (BCA) was conducted in conformance
final report Northwest Toll Expressway Value Pricing Program Pilot Study Georgia State Road and Tollway Authority Cambridge Systematics, Inc.
 Northwest Toll Expressway Value Pricing Program Pilot Study final report prepared for Georgia State Road and Tollway Authority prepared by Cambridge Systematics, Inc. with Jordan Jones & Goulding GeoStats
Interstate Operations Study: Fargo-Moorhead Metropolitan Area Simulation Output
 NDSU Dept #2880 PO Box 6050 Fargo, ND 58108-6050 Tel 701-231-8058 Fax 701-231-6265 www.ugpti.org www.atacenter.org Interstate Operations Study: Fargo-Moorhead Metropolitan Area 2015 Simulation Output Technical
MILLERSVILLE PARK TRAFFIC IMPACT ANALYSIS ANNE ARUNDEL COUNTY, MARYLAND
 MILLERSVILLE PARK TRAFFIC IMPACT ANALYSIS ANNE ARUNDEL COUNTY, MARYLAND Prepared for: Department of Public Works Anne Arundel County Prepared by: URS Corporation 4 North Park Drive, Suite 3 Hunt Valley,
GEORGIA DEPARTMENT OF TRANSPORTATION
 GEORGIA DEPARTMENT OF TRANSPORTATION Statewide Truck Lanes Needs Identification Study SR 21 CORRIDOR NEEDS ANALYSIS PREPARED FOR Georgia Department of Transportation Office of Planning #2 Capitol Square
Executive Summary. Florida Department of Transportation ENTERPRISE TOLL OPERATIONS
 This Traffic Engineer s Annual Report provides a comprehensive look at the conditions of the five toll facilities throughout the state that are owned by the Florida Department of Transportation (the Department)
Missouri Seat Belt Usage Survey for 2017
 Missouri Seat Belt Usage Survey for 2017 Conducted for the Highway Safety & Traffic Division of the Missouri Department of Transportation by The Missouri Safety Center University of Central Missouri Final
National and Regional Electronic Toll Interoperability
 National and Regional Electronic Toll Interoperability Presented to The Oklahoma Traffic Engineering Association October 23,2014 By: David Machamer Toll Operations Director Oklahoma Turnpike Authority
RTID Travel Demand Modeling: Assumptions and Method of Analysis
 RTID Travel Demand Modeling: Assumptions and Method of Analysis Overall Model and Scenario Assumptions The Puget Sound Regional Council s (PSRC) regional travel demand model was used to forecast travel
Alpine Highway to North County Boulevard Connector Study
 Alpine Highway to North County Boulevard Connector Study prepared by Avenue Consultants March 16, 2017 North County Boulevard Connector Study March 16, 2017 Table of Contents 1 Summary of Findings... 1
Miami Dade's move to all-electronic cashless tolling Posted Wed, :27
 Miami Dade's move to all-electronic cashless tolling Posted Wed, 2008-07-23 19:27 Miami Dade Expressway Authority (MDX) is expected to begin formal procurement in early September of the toll systems needed
Metropolitan Freeway System 2007 Congestion Report
 Metropolitan Freeway System 2007 Congestion Report Minnesota Department of Transportation Office of Traffic, Safety and Operations Freeway Operations Section Regional Transportation Management Center March
Executive Summary. Draft Environmental Impact Statement/Environmental Impact Report ES-1
 Executive Summary Introduction The Eastside Transit Corridor Phase 2 Project is a vital public transit infrastructure investment that would provide a transit connection to the existing Metro Gold Line
2016 Congestion Report
 2016 Congestion Report Metropolitan Freeway System May 2017 2016 Congestion Report 1 Table of Contents Purpose and Need...3 Introduction...3 Methodology...4 2016 Results...5 Explanation of Percentage Miles
WIM #41 CSAH 14, MP 14.9 CROOKSTON, MINNESOTA APRIL 2014 MONTHLY REPORT
 WIM #41 CSAH 14, MP 14.9 CROOKSTON, MINNESOTA APRIL 2014 MONTHLY REPORT In order to understand the vehicle classes and groupings, the MnDOT Vehicle Classification Scheme and the Vehicle Classification
The Boston South Station HSIPR Expansion Project Cost-Benefit Analysis. High Speed Intercity Passenger Rail Technical Appendix
 The Boston South Station HSIPR Expansion Project Cost-Benefit Analysis High Speed Intercity Passenger Rail Technical Appendix Prepared by HDR August 5, 2010 The Boston South Station HSIPR Expansion Project
Traffic Feasibility Study
 Traffic Feasibility Study Town Center South Robbinsville Township, Mercer County, New Jersey December 19, 2017 Prepared For Robbinsville Township Department of Community Development 2298 Route 33 Robbinsville,
LAWRENCE TRANSIT CENTER LOCATION ANALYSIS 9 TH STREET & ROCKLEDGE ROAD / 21 ST STREET & IOWA STREET LAWRENCE, KANSAS
 LAWRENCE TRANSIT CENTER LOCATION ANALYSIS 9 TH STREET & ROCKLEDGE ROAD / 21 ST STREET & IOWA STREET LAWRENCE, KANSAS TRAFFIC IMPACT STUDY FEBRUARY 214 OA Project No. 213-542 TABLE OF CONTENTS 1. INTRODUCTION...
Subarea Study. Manning Avenue (CSAH 15) Corridor Management and Safety Improvement Project. Final Version 1. Washington County.
 Corridor Management and Safety Improvement Project. Final Version 1. Washington County.") Subarea Study Manning Avenue (CSAH 15) Corridor Management and Safety Improvement Project Final Version 1 Washington County June 12, 214 SRF No. 138141 Table of Contents Introduction... 1 Forecast Methodology
Subarea Study Manning Avenue (CSAH 15) Corridor Management and Safety Improvement Project Final Version 1 Washington County June 12, 214 SRF No. 138141 Table of Contents Introduction... 1 Forecast Methodology
2013 Operations Statistics Report Triangle Expressway Fourth Quarter
 2013 Operations Statistics Report Fourth Quarter 1 S. Wilmington Street Raleigh, C 27601 2012 Annual Operations Last Updated: Report 1 11, 2014 Table of Contents 2013 Fourth Quarter Operations Statistics
Interstate Operations Study: Fargo-Moorhead Metropolitan Area Simulation Results
 NDSU Dept #2880 PO Box 6050 Fargo, ND 58108-6050 Tel 701-231-8058 Fax 701-231-6265 www.ugpti.org www.atacenter.org Interstate Operations Study: Fargo-Moorhead Metropolitan Area 2025 Simulation Results
WASHINGTON STATE ROAD USAGE CHARGE ASSESSMENT
 1 WASHINGTON STATE ROAD USAGE CHARGE ASSESSMENT Anthony L. Buckley Director, Office of Innovative Partnerships Washington State Department of Transportation Overview: Washington State Infrastructure 2
Traffic Engineering Study
 Traffic Engineering Study Bellaire Boulevard Prepared For: International Management District Technical Services, Inc. Texas Registered Engineering Firm F-3580 November 2009 Executive Summary has been requested
Technical Memorandum Analysis Procedures and Mobility Performance Measures 100 Most Congested Texas Road Sections What s New for 2015
 Technical Memorandum Analysis Procedures and Mobility Performance Measures 100 Most Congested Texas Road Sections Prepared by Texas A&M Transportation Institute August 2015 This memo documents the analysis
Metropolitan Freeway System 2013 Congestion Report
 Metropolitan Freeway System 2013 Congestion Report Metro District Office of Operations and Maintenance Regional Transportation Management Center May 2014 Table of Contents PURPOSE AND NEED... 1 INTRODUCTION...
BACKGROUND. Dear Mr. Dietrich:
 Mr. Bren Dietrich, C.P.A. December 28, 2018 Chief Financial Officer, Florida s Turnpike Enterprise Florida Department of Transportation Florida s Turnpike, Milepost 263 Building 5315, Turkey Lake Service
Appendix J Traffic Impact Study
 MRI May 2012 Appendix J Traffic Impact Study Level 2 Traffic Assessment Limited Impact Review Appendix J [This page was left blank intentionally.] www.sgm-inc.com Figure 1. Site Driveway and Trail Crossing
Fueling Savings: Higher Fuel Economy Standards Result In Big Savings for Consumers
 Fueling Savings: Higher Fuel Economy Standards Result In Big Savings for Consumers Prepared for Consumers Union September 7, 2016 AUTHORS Tyler Comings Avi Allison Frank Ackerman, PhD 485 Massachusetts
To: File From: Adrian Soo, P. Eng. Markham, ON File: Date: August 18, 2015
 Memo To: From: Adrian Soo, P. Eng. Markham, ON : 165620021 Date: Reference: E.C. Row Expressway, Dominion Boulevard Interchange, Dougall Avenue Interchange, and Howard 1. Review of Interchange Geometry
Proposed location of Camp Parkway Commerce Center. Vicinity map of Camp Parkway Commerce Center Southampton County, VA
 Proposed location of Camp Parkway Commerce Center Vicinity map of Camp Parkway Commerce Center Southampton County, VA Camp Parkway Commerce Center is a proposed distribution and industrial center to be
Abstract. Executive Summary. Emily Rogers Jean Wang ORF 467 Final Report-Middlesex County
 Emily Rogers Jean Wang ORF 467 Final Report-Middlesex County Abstract The purpose of this investigation is to model the demand for an ataxi system in Middlesex County. Given transportation statistics for
Costco Gasoline Fuel Station Transportation Characteristics
 Exhibit A MEMORANDUM Date: May 23, 2013 Project #: I-10 To: Jennifer Murillo, Costco Wholesale Terry Odle, Mulvanny G2 Architecture From: Sonia Hennum, PTOE Project: Subject: Signal Hill Costco Gasoline
WIM #48 is located on CSAH 5 near Storden in Cottonwood county.
 WIM Site Location WIM #48 is located on CSAH 5 near Storden in Cottonwood county. System Operation WIM #48 was operational for the entire month of August 2017. Volume was computed using all monthly data.
Traffic, Transportation & Civil Engineering Ali R. Khorasani, P.E. P.O. Box 804, Spencer, MA 01562, Tel: (508)
") Associates Traffic, Transportation & Civil Engineering Ali R. Khorasani, P.E. P.O. Box 804, Spencer, MA 01562, Tel: (508) 885-5121 Ms. Teri Ford, Associate 800 Boylston Street, Suite 1570 Boston, MA July
Associates Traffic, Transportation & Civil Engineering Ali R. Khorasani, P.E. P.O. Box 804, Spencer, MA 01562, Tel: (508) 885-5121 Ms. Teri Ford, Associate 800 Boylston Street, Suite 1570 Boston, MA July
Disruptive Technology and Mobility Change
 Disruptive Technology and Mobility Change What it Might Mean for Urban Transportation Ed Regan Senior Vice President June 1, 2018 Presented at Transport Chicago Ed Regan, SVP, CDM Smith 43-year veteran
DEVELOPMENT OF RIDERSHIP FORECASTS FOR THE SAN BERNARDINO INFRASTRUCTURE IMPROVEMENT STUDY
 APPENDIX 1 DEVELOPMENT OF RIDERSHIP FORECASTS FOR THE SAN BERNARDINO INFRASTRUCTURE IMPROVEMENT STUDY INTRODUCTION: This Appendix presents a general description of the analysis method used in forecasting
2 EXISTING ROUTE STRUCTURE AND SERVICE LEVELS
 2 EXISTING ROUTE STRUCTURE AND SERVICE LEVELS In the Study Area, as in most of the Metro Transit network, there are two distinct route structures. The base service structure operates all day and the peak
What is ELToD and Why Use it? Toll Choice Key Concepts. ELToD Applications. SW 10 th Street. ELToD Future Enhancements
 June 16, 2017 What is ELToD and Why Use it? Toll Choice Key Concepts ELToD Applications SW 10 th Street ELToD Future Enhancements 2 ELToD (Express Lanes Time of Day) Model is a traffic assignment model
TRAVEL DEMAND FORECASTS
 Jiangxi Ji an Sustainable Urban Transport Project (RRP PRC 45022) TRAVEL DEMAND FORECASTS A. Introduction 1. The purpose of the travel demand forecasts is to assess the impact of the project components
New Buck O Neil (U. S. 169) Crossing Benefit-Cost Analysis. Kansas City, Missouri
 Crossing Benefit-Cost Analysis. Kansas City, Missouri") New Buck O Neil (U. S. 169) Crossing Benefit-Cost Analysis Kansas City, Missouri New Buck O Neil (U. S. 169) Crossing Benefit-Cost Analysis prepared for Kansas City, Missouri prepared by Burns & McDonnell
New Buck O Neil (U. S. 169) Crossing Benefit-Cost Analysis Kansas City, Missouri New Buck O Neil (U. S. 169) Crossing Benefit-Cost Analysis prepared for Kansas City, Missouri prepared by Burns & McDonnell
Transit City Etobicoke - Finch West LRT
 Delcan Corporation Transit City Etobicoke - Finch West LRT APPENDIX D Microsimulation Traffic Modeling Report March 2010 March 2010 Appendix D CONTENTS 1.0 STUDY CONTEXT... 2 Figure 1 Study Limits... 2
Southern Windsor County 2016 Traffic Count Program Summary April 2017
 Southern Windsor County 2016 Traffic Count Program Summary April 2017 The Southern Windsor County Regional Planning Commission (the RPC ) has been monitoring traffic at 19 locations throughout the southern
Appendix SAN San Diego, California 2003 Annual Report on Freeway Mobility and Reliability
 (http://mobility.tamu.edu/mmp) Office of Operations, Federal Highway Administration Appendix SAN San Diego, California 2003 Annual Report on Freeway Mobility and Reliability This report is a supplement
Request for Design Exception (#1) S.M. Wright Phase IIB
 S.M. Wright Phase IIB") Request for Design Exception (#1) S.M. Wright Phase IIB County: Dallas CSJ s: 0092-01-059, 0092-14-088 Project Limits: From Pennsylvania Avenue to North of Al Lipscomb Way Date: June 28, 2016 Proposed
Request for Design Exception (#1) S.M. Wright Phase IIB County: Dallas CSJ s: 0092-01-059, 0092-14-088 Project Limits: From Pennsylvania Avenue to North of Al Lipscomb Way Date: June 28, 2016 Proposed
The Eastern Connector Study November, 2007 planning for the future
 The Eastern Connector Study November, 2007 planning for the future In late 2006, Albemarle County and the City of Charlottesville jointly initiated the Eastern Connector Corridor Study. The Project Team
Travel Time Savings Memorandum
 04-05-2018 TABLE OF CONTENTS 1 Background 3 Methodology 3 Inputs and Calculation 3 Assumptions 4 Light Rail Transit (LRT) Travel Times 5 Auto Travel Times 5 Bus Travel Times 6 Findings 7 Generalized Cost
Appendix B CTA Transit Data Supporting Documentation
 RED ED-PURPLE BYPASS PROJECT ENVIRONMENTAL ASSESSMENT AND SECTION 4(F) EVALUATION Appendix B CTA Transit Data Supporting Documentation 4( Memorandum Date: May 14, 2015 Subject: Chicago Transit Authority
V. DEVELOPMENT OF CONCEPTS
 Martin Luther King, Jr. Drive Extension FINAL Feasibility Study Page 9 V. DEVELOPMENT OF CONCEPTS Throughout the study process several alternative alignments were developed and eliminated. Initial discussion
INDUSTRIAL DEVELOPMENT
 INDUSTRIAL DEVELOPMENT Traffic Impact Study Plainfield, Illinois August 2018 Prepared for: Seefried Industrial Properties, Inc. TABLE OF CONTENTS Executive Summary 2 Introduction 3 Existing Conditions
Appendix 3 Traffic Technical Memorandum
 Appendix 3 Traffic Technical Memorandum DRAFT TECHNICAL MEMORANDUM Southport Connector Project Traffic Development Comparison of Future Year Model Results Date: September 10, 2015 Project #:11730.030 To:
Appendix G Traffic Study Methodology
 REVISED DRAFT ENVIRONMENTAL IMPACT REPORT/ Appendix G Traffic Forecasting Model Methodology In addition to the existing/baseline condition (year 2005), a level of service (LOS) analysis was conducted for
The key roadways in the project vicinity are described below. Exhibit displays the existing number of lanes on the study roadways.
 4.2 TRAFFIC AND CIRCULATION This section presents the key assumptions, methods, and results of analysis for the transportation and circulation impacts of the proposed project. This section is based on
Click to edit Master title style
 Nelson/Nygaard Consulting Associates SERVICE IMPROVEMENT STRATEGIES September 22, 2015 1 PROJECT OVERVIEW & WORK TO DATE 1. Extensive stakeholder involvement Throughout 2. System and market assessment
Developing a Toll Demand Model for DelDOT s Statewide Travel Demand Model
 Developing a Toll Demand Model for DelDOT s Statewide Travel Demand Model TRB 87 th Annual Meeting Washington, D.C. Introduction DelDOT is facing the same deteriorating infrastructure, increasing congestion
Madison BRT Transit Corridor Study Proposed BRT Operations Plans
 Madison BRT Transit Corridor Study Proposed BRT Operations Plans This paper presents a description of the proposed BRT operations plan for use in the Madison BRT Transit Corridor Study. The objective is
WIM #40 is located on US 52 near South St. Paul in Dakota county.
 WIM Site Location WIM #40 is located on US 52 near South St. Paul in Dakota county. System Operation WIM #40 was operational for the entire month of November 2017. Volume was computed using all monthly
Letter of Transmittal
 Letter of Transmittal To: Chris Lovell City of Richmond Hill Date: 5/2/6 Job 2582 Re: Richmond Hill-South Bryan County Transportation STudy WE ARE SENDING YOU THE FOLLOWING ITEMS ( attached) ( under separate
WIM #37 was operational for the entire month of September Volume was computed using all monthly data.
 SEPTEMBER 2016 WIM Site Location WIM #37 is located on I-94 near Otsego in Wright county. The WIM is located only on the westbound (WB) side of I-94, meaning that all data mentioned in this report pertains
BROWARD BOULEVARD CORRIDOR TRANSIT STUDY
 BROWARD BOULEVARD CORRIDOR TRANSIT STUDY FM # 42802411201 EXECUTIVE SUMMARY July 2012 GOBROWARD Broward Boulevard Corridor Transit Study FM # 42802411201 Executive Summary Prepared For: Ms. Khalilah Ffrench,
King Soopers #116 Thornton, Colorado
 Traffic Impact Study King Soopers #116 Thornton, Colorado Prepared for: Galloway & Company, Inc. T R A F F I C I M P A C T S T U D Y King Soopers #116 Thornton, Colorado Prepared for Galloway & Company
TRAFFIC IMPACT STUDY. USD #497 Warehouse and Bus Site
 TRAFFIC IMPACT STUDY for USD #497 Warehouse and Bus Site Prepared by: Jason Hoskinson, PE, PTOE BG Project No. 16-12L July 8, 216 145 Wakarusa Drive Lawrence, Kansas 6649 T: 785.749.4474 F: 785.749.734
The USDOT Congestion Pricing Program: A New Era for Congestion Management
 The USDOT Congestion Pricing Program: A New Era for Congestion Management Patrick DeCorla-Souza, AICP Federal Highway Administration Presentation at Congestion Pricing Discovery Workshop Los Angeles, CA
Submission to Greater Cambridge City Deal
 What Transport for Cambridge? 2 1 Submission to Greater Cambridge City Deal By Professor Marcial Echenique OBE ScD RIBA RTPI and Jonathan Barker Introduction Cambridge Futures was founded in 1997 as a
Table of Contents INTRODUCTION... 3 PROJECT STUDY AREA Figure 1 Vicinity Map Study Area... 4 EXISTING CONDITIONS... 5 TRAFFIC OPERATIONS...
 Crosshaven Drive Corridor Study City of Vestavia Hills, Alabama Table of Contents INTRODUCTION... 3 PROJECT STUDY AREA... 3 Figure 1 Vicinity Map Study Area... 4 EXISTING CONDITIONS... 5 TRAFFIC OPERATIONS...
Troost Corridor Transit Study
 Troost Corridor Transit Study May 23, 2007 Kansas City Area Transportation Authority Agenda Welcome Troost Corridor Planning Study Public participation What is MAX? Survey of Troost Riders Proposed Transit
RhodeWorks Initiative
 RhodeWorks Initiative Accent image here Fixing Rhode Island s bridges and getting Rhode Islanders back to work Rhode Island Department of Transportation Primary Image here International Bridge, Tunnel
Traffic Impact Analysis. Alliance Cole Avenue Residential Site Dallas, Texas. Kimley-Horn and Associates, Inc. Dallas, Texas.
 Traffic Impact Analysis Alliance Cole Avenue Residential Site Dallas, Texas February 15, 2018 Kimley-Horn and Associates, Inc. Dallas, Texas Project #064524900 Registered Firm F-928 Traffic Impact Analysis
I-820 (East) Project Description. Fort Worth District. Reconstruct Southern I-820/SH 121 Interchange
 Project Description. Fort Worth District. Reconstruct Southern I-820/SH 121 Interchange") I-820 (East) Project Description Fort Worth District Reconstruct Southern I-820/SH 121 Interchange I-820 from approximately 2,000 feet north of Pipeline Road/Glenview Drive to approximately 3,200 feet
I-820 (East) Project Description Fort Worth District Reconstruct Southern I-820/SH 121 Interchange I-820 from approximately 2,000 feet north of Pipeline Road/Glenview Drive to approximately 3,200 feet
HRTPO Strategic Campaign. Passenger Rail. Agenda Item #11. Presentation To. May 19, Presentation By
 Presentation To HRTPO Board Meeting Agenda Item #11 HRTPO Strategic Campaign and Vision Plan for Passenger Rail Presentation By May 19, 2010 Transportation Economics & Management Systems, Inc. Study Timeline
Electric Vehicle Cost-Benefit Analyses
 Electric Vehicle Cost-Benefit Analyses Results of plug-in electric vehicle modeling in five Northeast & Mid-Atlantic states Quick Take With growing interest in the electrification of transportation in
Table 8-1: Service Frequencies for All Short-List Alternatives by Day of Week and Time of Day Frequency Day of Week Time of Day Time Period
 8. Operating Plans The following Section presents the operating plans for the Short-List Alternatives. The modern streetcar operating plans are presented for Alternatives 2 and 3, followed by bus rapid
Southeastern Wisconsin Regional Freeway System Reconstruction Study
 Southeastern Wisconsin Regional Freeway System Reconstruction Study July 26, 2001 1 Agenda Item 3 Presentation of Projected Traffic Impacts of the Possible New Freeway Segment Connecting IH 43 and USH
EXECUTIVE SUMMARY. The following is an outline of the traffic analysis performed by Hales Engineering for the traffic conditions of this project.
 EXECUTIVE SUMMARY This study addresses the traffic impacts associated with the proposed Shopko redevelopment located in Sugarhouse, Utah. The Shopko redevelopment project is located between 1300 East and
Craig Scheffler, P.E., PTOE HNTB North Carolina, P.C. HNTB Project File: Subject
 TECHNICAL MEMORANDUM To Kumar Neppalli Traffic Engineering Manager Town of Chapel Hill From Craig Scheffler, P.E., PTOE HNTB North Carolina, P.C. Cc HNTB Project File: 38435 Subject Obey Creek TIS 2022
TABLE OF CONTENTS EXECUTIVE SUMMARY...1 INTRODUCTION...3 PROJECTED FUTURE GROWTH...3 ROADWAY IMPROVEMENT PROJECTS...4 POTENTIAL FUNDING SOURCES...
 Transportation Impact Fee Study September 2014 TABLE OF CONTENTS EXECUTIVE SUMMARY...1 INTRODUCTION...3 PROJECTED FUTURE GROWTH...3 ROADWAY IMPROVEMENT PROJECTS......4 POTENTIAL FUNDING SOURCES...7 PROPOSED
Act 229 Evaluation Report
 R22-1 W21-19 W21-20 Act 229 Evaluation Report Prepared for Prepared by Table of Contents 1. Documentation Page 3 2. Executive Summary 4 2.1. Purpose 4 2.2. Evaluation Results 4 3. Background 4 4. Approach