THE TRAFFIC INJURY RESEARCH FOUNDATION
|
|
|
- Osborne Kelly
- 6 years ago
- Views:
Transcription

1
2 THE TRAFFIC INJURY RESEARCH FOUNDATION The mission of the Traffic Injury Research Foundation (TIRF) is to reduce traffic-related deaths and injuries. TIRF is a national, independent, charitable road safety research institute. Since its inception in 1964, TIRF has become internationally recognized for its accomplishments in a wide range of subject areas related to identifying the causes of road crashes and developing programs and policies to address them effectively. Disclaimer The Ontario Ministry of Transportation (MTO) has provided funding for the report: Understanding Young Drivers in Ontario: Final Report. MTO does NOT warrant the accuracy, validity, completeness or currency of the report. Funding of the report is NOT to be construed as an endorsement of the contents of the report, the Traffic Injury Research Foundation or any other person or entity. Use of this report is completely at one s own discretion and risk. Traffic Injury Research Foundation 171 Nepean Street, Suite 200 Ottawa, Ontario K2P 0B4 Ph: (613) Fax: (613) tirf@tirf.ca Website: Traffic Injury Research Foundation Copyright 2014 ISBN:
3 Understanding Young Drivers in Ontario: Final Report Prepared by: Ward Vanlaar, Charlotte Pashley, Dan Mayhew, Robyn Robertson, and Marisela Mainegra Hing Traffic Injury Research Foundation 171 Nepean St. Suite 200 Ottawa, ON K2P 0B4 SEPTEMBER 2014
4
5 TABLE OF CONTENTS EXECUTIVE SUMMARY... iii Introduction... iii Methodology... iii Research Questions... iv Results... iv Conclusion... vi ACKNOWLEDGMENTS... vii 1.0 INTRODUCTION BACKGROUND: THE ISSUE AND SOLUTIONS The Issue The Solutions Graduated Driver Licensing Driver Education and Time Discounts Teen Driving Characteristics and Exposure Conclusion PROJECT OBJECTIVES Objectives Research Questions METHODOLOGY Data Sample Composition Sample Selection Research Design Survey response options Incentives Item Development Data Collection Data Analysis Weights Univariate and Bivariate Distribution Analyses Logistic regression analysis RESULTS Research Questions: Results What are the key driving characteristics of the young driver population in Ontario? What is the amount of driving among young drivers? i
6 5.1.3 How often does the driver have access to a vehicle? How much responsibility do young drivers have for the vehicles they drive? What type of vehicles do younger drivers operate most often? During the G1 licence period, who served most often as the experienced driver accompanying the young driver? How many combined hours did the driver spend under supervision (i.e., parents/guardians, other adults, driving instructor, etc.)? Did the driver s parents/guardians establish any rules for driving a vehicle? How often do young drivers parents/guardians or other family members talk to them about traffic safety/rules? How often do young drivers drive on 400-series highways? How much experience does the driver have in higher-risk traffic situations (i.e., night driving, hazardous weather, heavy traffic)? How do young drivers perceive their driving ability (i.e., before/after or without BDE program)? How often do young drivers engage in risky driving behaviours, and how do they perceive them? What was the primary reason for taking a BDE course or not taking a BDE course? How do young drivers perceive the usefulness of the Beginner Driver Education (BDE) program? How often do young drivers take driving lessons outside of Beginner Driver Education (BDE)? How often do young drivers utilize public transportation? Are young drivers aware of the Ministry s various public education tools targeted at young drivers (i.e., GLS videos)? Summary and Discussion CONCLUSIONS AND CONSIDERATIONS REFERENCES APPENDIX A APPENDIX B: G1 QUESTIONNAIRE APPENDIX C: G2 QUESTIONNAIRE ii
7 EXECUTIVE SUMMARY Introduction Beginner Driver Education (BDE) was implemented in Ontario to ensure the safety and driving competency of young and novice drivers, as well as to improve road safety for all drivers. Its main goal was to deliver a program that would help beginner drivers to develop a positive and responsible attitude towards driving. The program involves several mandatory modes of instruction including a minimum of 20 hours of classroom driving instruction, 10 hours of in-vehicle driving instruction, and 10 additional hours of flexible instruction (i.e., classroom, computer-based, in-vehicle, or driving simulator). To help encourage participation in the BDE program, drivers who completed a Ministry of Transportation, Ontario-approved program were eligible to reduce the amount of time spent in the 12-month minimum G1-licensing period by up to four months, as well as to receive reductions in insurance premiums. In an average year, more than half of G1 drivers participated in a BDE program and the Ministry estimates that between 55% and 67% of BDE participants obtain a time discount. Significant decreases in the average fatality rate of young drivers demonstrate that Ontario has been successful in improving young and novice driver safety within the past few decades. However, there is still room for improvement. Young drivers continue to be responsible for a disproportionate percentage of drivers killed on roads in Ontario. Even though programs and policies are implemented with the goal of decreasing these risks to the young driver population, very little is still known about their driving characteristics and behaviours. With this in mind, the objective of the current study was to help MTO determine the effectiveness of its BDE program by gaining a better understanding of young and new drivers. The three primary groups included in the study were: drivers who completed BDE and took a time discount; drivers who completed BDE without taking a time discount; and, drivers who did not complete BDE. Methodology To accomplish the objectives of this project, the Traffic Injury Research Foundation was contracted to survey young drivers in Ontario aged The Young Driver Survey was designed to identify similarities and differences in the characteristics and behaviours of young and novice drivers categorized in terms of the three primary BDE subgroups. An online survey of G1 and G2 licensed drivers in Ontario was conducted to gather information about their driving skills, perceptions, behaviours and influences. iii
8 The survey questionnaire was carefully developed and tested to ensure the reliability and validity of the measures. The Young Driver Survey consisted of approximately questions per participant, depending on their licence class and BDE status. As well, the online questionnaire took approximately minutes to complete. Univariate, bivariate and logistic regression analyses were conducted using Stata statistical software to objectively evaluate specific driving characteristics, behaviours, and perceptions reported by young drivers, and to identify any differences among them. Research Questions The questionnaire was designed to assess specific areas of interest within the young driver population. These areas included: driving and travel characteristics; licence class; amount of driving (with and without supervision); access to vehicle and public transportation options; parental or familial influences; motivations for participation in the BDE program; perceptions of risks for various driving abilities and behaviours; and, awareness of the Ministry s public education tools targeted at young drivers. Differences across subgroups of the young driving population were also analyzed to determine the impact that factors, such as completing BDE or obtaining a time discount, had on the many driving behaviours and attitudes studied. Results The results of the Young Driver Survey revealed many distinct characteristics, attitudes and behaviours among the young driver population in Ontario. Key findings emerging from the study include: > The majority of young drivers believed that BDE improved their driving skills and made them a safer, more knowledgeable driver. > After completing BDE, young drivers rated their driving abilities and knowledge significantly higher than those who did not complete BDE. > The majority of young drivers reported accumulating between 0-20 hours of supervised driving practice in an average month during their G1 licence period. iv
9 > Drivers who completed BDE and took a time discount were significantly more likely to accumulate more than 10 hours of supervised driving practice in an average month during the G1 licence period compared to drivers who did not complete BDE. > Drivers who completed BDE and took a time discount were found to be significantly more likely to engage in risky driving behaviours including: speeding; sending hand-held text messages; making hand-held phone calls; driving while tired; driving with teenage passengers; passing other cars because it was exciting; driving during rush hour; driving at night; driving in adverse weather conditions; and, driving on 400-series highways compared to other young drivers. > Drivers who completed BDE and took a time discount were found to be significantly more likely to drive: to school; to work; and, to practice driving compared to drivers who did not complete BDE. > Drivers who did not complete BDE were found to be significantly more likely to drive just to go for a drive (i.e., drive for fun) compared to drivers who completed BDE and took a time discount. > Drivers who completed BDE and took a time discount were significantly more likely to have unlimited use of a motor vehicle than drivers who completed BDE without taking a time discount and drivers who did not complete BDE. > Young drivers were more frequently exposed to high-risk traffic situations (e.g., rush hour driving, night-time driving, adverse weather conditions) during the G2 licence period as compared to the G1 licence period. > Almost half (45%) of G2 drivers reported accumulating additional supervised driving practice after obtaining their G2 licence. > Almost one-quarter (23%) of young drivers reported driving on 400-series highways during their G1 licence period, a behaviour that is prohibited during the G1 stage. > Almost one-quarter (23%) of young drivers reported driving unsupervised at some point during the G1 licence period, even though Ontario s Graduated Licensing System (GLS) requires G1 drivers to have an experienced driver accompany them in the vehicle at all times while they are driving. > About half (52%) of G1 drivers indicated that their parents/guardians restricted the number of hours they had access to a vehicle, compared to 38% of G2 drivers. > Over 80% of young drivers parents have talked to them about issues relating to traffic safety including: drinking and driving; texting and driving; and, distracted driving. v
10 Conclusion The results of the Young Driver Survey revealed several positive aspects of BDE. Overall, young drivers believed that they had greatly benefitted from the program, and showed increased confidence in their driving skills and abilities as a result. As well, young drivers who completed BDE and took a time discount were more likely to accumulate at least 10 hours of supervised driving practice, a proven safety measure, in the average month, compared to young drivers who did not complete BDE. This suggests that drivers who take a time discount may have had more motivation to practice driving, in order to receive their G2 licence earlier. However, results also revealed several areas within the program which may require further attention. As a whole, drivers who completed BDE and took a time discount showed much greater tendencies towards risk taking behaviours while driving during both the G1 and G2 licence periods. With this in mind, consideration should be given to young drivers who obtain their G2 licence earlier and reducing the amount of time spent under supervision. The issue of a time discount component as part of the GLS system should be reviewed given that those who choose to take a time discount were shown to be more likely than others to engage in risky behaviours. In other words, while the BDE program was associated with some positive outcomes for drivers who completed the course, they did not necessarily counterbalance the risks associated with reduced time spent in the protective G1 licence stage. Further consideration to enhance the BDE program, such as increasing the number of mandatory supervised driving hours, or promoting parental involvement and awareness of the risks associated with teen drivers, may also serve to benefit the program. Additionally, it was found that many young drivers do not adhere to the mandatory restrictions of the GLS program, such as the requirement to have a qualified supervising driver accompany them, or not driving on 400-series highways (i.e., a network of controlled access highways spanning southern Ontario), during their G1 licence period, suggesting the need for increased awareness and enforcement of these restrictions. Without compliance to the restrictions and rules of GLS, the safety benefits associated with driving under low-risk conditions during the G1 licence period may be compromised. vi
11 ACKNOWLEDGMENTS TIRF would like to acknowledge the assistance of the following individuals who shared their expertise in the development of this report and who reviewed and commented on earlier drafts of this report. Their insights helped us to develop a well-rounded document. Professor Barry Watson, Ph.D. Director Centre for Accident Research and Road Safety-Queensland (CARRS-Q) Queensland, Australia Ruth Shults, Ph.D., MPH Senior Epidemiologist Injury Center, Centers for Disease Control and Prevention TIRF also acknowledges the assistance of the following individuals who completed various tasks associated with conducting the Young Driver Survey. Their contributions to this project were greatly appreciated. Stephen Brown, Research Associate Jennifer Hall, Administrative Assistant Erin Holmes, Research Scientist Anna McKiernan, Research Associate Shawna Meister, Research Coordinator Luciana Nechita, Administrator, Marketing and Communications Bruce Scott, Vice President, Finance and Administration The opinions, findings, and conclusions expressed in this report are those of the authors. vii
12
13 1.0 INTRODUCTION In April 1994, Ontario introduced North America s first Graduated Licensing System (GLS). The aim of this program was to reduce the risk of collisions and injuries among newly licensed drivers. Previous evaluations have shown GLS to be effective in this regard (Boase and Tasca 1998; Vanlaar et al. 2009; Mayhew 2005; Mayhew 2008; Williams et al. 2013). The Ontario GLS involves the progression of learning to drive through several stages of driver licensing termed G1, G2, and G sequentially. The G1 licence stage requires that young drivers only operate vehicles under the supervision of a qualified supervising driver for a minimum of 12 months. Various other restrictions are in place for new drivers in the G1 stage and in the G2 stage and these are lifted as they progress to obtaining their full G licence. An integral part of this graduated system encourages G1 drivers to participate in a Ministry-approved Beginner Driver Education (BDE) program to further develop their driving skills and abilities. In April of 2009, the Ministry of Transportation, Ontario (MTO) introduced new enhancements to its Beginner Driver Education (BDE) program to ensure that the highest standards of quality in the content and delivery of driver education in Ontario were being met. The BDE program aims to help young drivers to develop positive attitudes towards driving, as well as to foster safe and responsible driving behaviours in new drivers. Driver education programs in Ontario must meet rigorous ministry standards for training, administration, and advertising before they are considered to be Ministry of Transportation-approved. Ministry-approved BDE program components consist of two main parts including classroom and in-vehicle instruction. Courses are comprised of a minimum of 20 hours of classroom instruction, 10 hours of in-vehicle instruction, as well as 10 hours of flexible instruction, delivered by a qualified instructor. BDE course content includes: the rules of the road; vehicle components; vehicle handling; driver behaviour; respect and responsibility; sharing the road; attention; and, perception and risk management. For more information about GLS or BDE programs in Ontario, refer to the Ministry of Transportation, Ontario s website ( Upon completion of a BDE program, G1 drivers can choose to take the on-road test after eight months rather than after the full 12 months, and if successful on this test, exit the G1 stage to the G2 stage. This four month reduction in the time spent in the G1 licence stage, called a time discount, was introduced to encourage drivers to learn safe driving practices and the rules of the road through an approved driving course. Ontario has seen significant improvement in the safety of its drivers over the past years, and GLS has likely contributed to this positive trend. In 2010, the fatality rate in Ontario was 0.63 per 10,000 licensed drivers, the second lowest ever recorded in Ontario. However, 1
14 the fatality rate for persons aged was higher, with 0.93 fatalities per 10,000 licensed drivers (ORSAR 2010), suggesting that teens and young adults continue to represent a disproportionately high number of deaths on Ontario roadways. Further progress in reducing young driver crashes requires a better understanding of young drivers and the risks they pose in traffic. There is a significant need for an enhanced understanding of the characteristics and behaviours of young drivers to be able to improve the safety of all drivers on the road, and this is the focus of this report. 2
15 2.0 BACKGROUND: THE ISSUE AND SOLUTIONS 2.1 The Issue Research has demonstrated that teenage drivers, particularly 16- and 17-year-olds, pose significant road safety and health concerns in Canada and elsewhere. The crash rates of young drivers have been repeatedly shown to exceed those of older, more experienced drivers (e.g., Mayhew and Simpson 1990; Mayhew and Simpson 1995; Mayhew et al. 2004; Mayhew and Simpson 1999; Mayhew et al. 2006; Williams 2003; Lee et. al. 2011; Tefft 2012). Williams (2003), for example, reported that in the United States (U.S.) teenage drivers had crash rates (measured in number of crashes per million miles of travel) much higher than older drivers; 16- and 17-year-old drivers were involved in 35 and 20 crashes per million miles of travel, respectively, whereas drivers in their early 20s and those years of age were involved in 9 and 4 crashes per million miles, respectively. Teenage drivers do not simply have a higher incidence of property damage collisions; a similar pattern emerges for fatal crash rates. In the United States, the per-mile fatal crash involvement rates for drivers aged 16 and 17 were respectively 3 times and 2 times that of drivers aged 20 24, and 13 times and 8 times that of drivers aged (Williams 2003). Additionally, data compiled by MTO in the Ontario Road Safety Annual Report (ORSAR) for 2010 showed that 26 teens aged and 31 teens aged were killed in road crashes in Ontario; a further 2,025 teens aged and 3,204 teens aged were injured in road crashes. ORSAR also reported that 6,614 drivers aged and 15,132 drivers aged were involved in crashes. When taking into account the total number of licensed drivers, teen drivers accounted for a disproportional number of drivers involved in collisions. While it is clear that teenage drivers constitute a significant traffic safety problem, the consequences of their crashes extend beyond just young drivers. Teen drivers put other road users, as well as teenage passengers at considerable risk. Research has shown that many teens die as passengers in motor vehicles, frequently in vehicles driven by a teen driver (Williams 2003; Williams et al. 2005; Williams and Wells 1995). A recent American Automobile Association (AAA) study (2006) found that the majority of fatalities in crashes involving 15-to-17-year-old drivers were people other than the teen driver: 36.2% of those killed were the teen drivers themselves, but 63.8% were others, including passengers riding in the teen driver s vehicle (31.8%), occupants of vehicles operated by drivers at least 18 years old (24.2%), and non-motorists such as pedestrians and bicyclists (7.5%). Teen crashes clearly place other road users at risk. 3
16 On a more positive note, improvements in the safety and crash risk of teen drivers have been made in recent decades and Ontario has been successful in enhancing young and novice driver safety. For example, from , Ontario experienced a decrease of 74% in the average fatality rate per licensed drivers aged 16-19, as well as a 61% decrease in the number of young drivers killed or injured on roads (ORSAR 2010). 2.2 The Solutions Primary safety measures MTO has implemented to address the elevated crash risk of young drivers include the Graduated Licensing System (GLS) and the Beginner Driver Education (BDE) program. As part of the GLS, novice drivers have the option to exit the G1 stage after eight months (as opposed to after the full 12 months) once they have successfully completed a Ministry-approved BDE program and have passed the G1 on-road test. This four-month time discount was created to encourage drivers to learn the rules of the road and obtain technical driving skills through the formal instruction of a BDE program. The effectiveness of these, and similar programs, is described below Graduated Driver Licensing There is a growing body of research demonstrating that Graduated Driver Licensing (GDL, or GLS) is an effective safety measure. Almost all the scientific evaluations conducted to date have reported positive safety benefits, typically measured in terms of crash reductions. Studies into the safety effectiveness of graduated driver licensing in Canada, the United States, and New Zealand have shown overall reductions in crashes ranging from 4% to 75%. Most of these studies have found that the crash risk of teen and new drivers has been reduced by about 20% to 40% (Vanlaar et al. 2009; Mayhew 2005; Mayhew 2008; Williams et al. 2013). Given the diversity of GDL programs, it is not surprising that the magnitude of the crash reductions reported to date have varied so much. However, this variability may also be a result of the different evaluation designs and statistical analyses used in the studies, ranging from simple pre-post comparisons with no control group(s), which are needed to account for the effects of other factors and events influencing collisions, to the use of powerful interrupted time series analysis. As well, the basic groups studied have differed (e.g., the New Zealand program originally applied to drivers under the age of 25; Canadian programs apply to all novices not just young ones; and, U.S. programs apply primarily to drivers under the age of 18). In Canada, the first GDL program was implemented in Ontario in April Similar to GDL programs elsewhere, evaluations of the Ontario GLS program have shown significant safety benefits. Boase and Tasca (1998) conducted an interim evaluation of the Ontario program using a simple pre-post comparison group design. They found that the overall collision rate per 10,000 novice drivers licenced in 1995 (program group) was 31% lower 4
17 than the rate observed for 1993 novice drivers (comparison group). The overall collision rate declined with the introduction of GDL for all age groups of novice drivers: a 31% reduction among those aged 16-19; a 42% reduction among year olds; a 38% reduction among year olds; a 37% reduction among 35 to 44 year olds; a 24% reduction among year olds; and a 19% reduction among novice drivers aged 55 and older. Mayhew et al. (2002) evaluated the safety effects of the Ontario GLS program in terms of crash reductions among drivers aged of passenger vehicles and motorcycles. Percapita collision rate comparisons and time series analyses of monthly collision data were used to examine changes and trends in the collisions of the target group (Ontario drivers aged 16-19) compared to changes and trends in the collisions of the internal control group (Ontario drivers aged 25-54). The analyses revealed that the most dramatic reductions occurred among 16-year-old drivers of passenger vehicles. In terms of the number of year-old drivers of passenger vehicles involved in total collisions and casualty collisions, intervention analysis ARIMA modeling showed significant reductions attributable to the program, that are summarized below. Total collisions Casualty collisions 16-year old drivers -73% -72% 17-year old drivers -26% -28% 18-year old drivers -29% -38% 19-year old drivers -10% ---- Both per-capita and per-driver collision rate comparisons showed that the positive impact of the Ontario GLS program was evident among young drivers who more recently entered the program several years after implementation, demonstrating the permanence and persistence of its safety effect. The Mayhew et al. study of GLS in Ontario and numerous other studies of programs elsewhere have shown that GDL has had a positive effect on the collision involvement of 16- and 17-year-old drivers. GDL effects on 18- and 19-year-olds, however, have been less clear and there has been growing concern for the need to address this issue, for example, by raising the licensing age (Tefft et al. 2013; Williams et al. 2013) Driver Education and Time Discounts Reviews of the evaluation literature consistently report that driver education fails to reduce collisions and convictions (Christie 2011; Engstrom et al. 2003; Lonero and Mayhew 2010; Mayhew 2007; Mayhew and Simpson 1996; Mayhew and Simpson 2002; Nichols 2003; Roberts et al. 2002; Thomas et al. 2012; Vernick et al. 1999; Williams et al. 2009; Woolley et al. 2000). This is not a result specific to driver education programs that have been 5
18 evaluated in the United States but is a conclusion of evaluation studies conducted in other countries over the past several decades as well as a finding of evaluations that have used experimental designs with random assignment of teens who take or do not take driver education. Previous research has also shown that a time discount that allows teen and new drivers to spend less time in the learner phase of the graduated system may actually negatively impact the safety of young drivers. Several evaluation studies in Ontario, Nova Scotia, and British Columbia have reported that the time discount for driver education increases, rather than decreases, the risk for novice drivers. Drivers who received the time discount had higher crash rates than those who did not: 45% more crashes in Ontario, 27% more in Nova Scotia, and 45% more in British Columbia (Boase and Tasca 1998; Mayhew et al. 2003; Wiggins 2004). Mayhew and colleagues (2002) also reported that the time discount for driver education had a dramatic negative impact on the crash rates of Ontario novice drivers, a finding consistent with interim results reported earlier by Boase and Tasca (1998). More recently, in 2007, the Auditor General of Ontario found that collision involvement rates for drivers who have taken the Ministry-approved course were higher than for those who had not taken the course (Auditor General of Ontario 2007). However, it has since been suggested that these differences in collision rates were largely the result of the time discount, age differences of G2 drivers who had and had not taken BDE, and other factors, and not necessarily the BDE program (Auditor General of Ontario 2009; MTO 2013). As well, a recent study in Quebec also found that adolescents who received a time discount for driver education had higher crash rates than other adolescent drivers (Hirsch et al. 2006). Evaluations of international licensing programs have also demonstrated the risks associated with allowing for a time discount to be taken in lieu of completing a driver education course. For example, a review of crash data in New Zealand found that the crash risk of those drivers who received a time discount (up to 6 months) before the mandatory 18-month time period of driving on a restricted licence was 2.9 times higher than those who did not receive the time discount (Lewis-Evans 2010). Despite a longer restricted phase of licensure compared to North American jurisdictions, the negative impact of a time discount was still present. 2.3 Teen Driving Characteristics and Exposure Understanding teen driving characteristics and exposure is critical, especially when they are initially licenced, because teens have the highest crash risk during the first few months and miles of independent driving (Mayhew et al. 2003; McCartt et al. 2003; McCartt et al. 2009; Sagberg 1998; Lee et al. 2011). For example, McCartt et al. (2003), using self-reported exposure data, found that crash risk was highest during the first 500 miles driven after licensure. This study also showed that the average miles driven each month by teens increased during the first 10 months of licensure, but at a steadily declining rate and was 6
19 flat over the next eight months of driving. They also reported, however, that teenagers accumulated driving exposure after licensure at widely varying rates. Teenage driving exposure issues have recently been identified as one of the five priority critical research need areas in the Transportation Research Board Circular Future Directions for Research on Motor Vehicle Crashes and Injuries Involving Teenage Drivers (Foss 2009). To address this need, the Transportation Research Board s Sub-Committee on Young Drivers convened a mid-year workshop on measuring young driver exposure (July 2010). Workshop participants underscored the need for research that rigorously and accurately collects teen driving exposure data to improve our understanding of how much teens actually drive and under what circumstances, and how their driving and risk change over time. Copies of workshop presentations and summaries are available on the subcommittee s website: ( In the past, teen driving exposure data have commonly been obtained through self-report surveys/interviews and teens completion of trip diaries (e.g., Mayhew et al. 2006; Bureau of Transportation Statistics 2006). Researchers commonly ask teens to report their driving in terms of miles, trips, or time over a period of a day, week, month or year. The primary focus has often been on the quantity of exposure (e.g., miles driven) rather than the quality of exposure (i.e., the context in which driving takes place). Although self-reported exposure measures have been useful, the accuracy of driving miles estimates by teen drivers has been questioned. Leaf et al. (2008) tested three different measures of teenage driving exposure: telephone survey about their preceding week of driving; a daily trip log for the next week, and a second survey about the details of the logged week s trips and miles; and having teens provide odometer readings. Results showed that single self-report estimates frequently understated total miles driven but prompted reviews provided more accurate information. They also observed that odometer readings provided useful information for teens who own their vehicle but not for teens who share vehicles or drive multiple vehicles. Eshani et al. (2010) used trip diaries and geo-spatial mapping to examine the driving exposure of year olds in Michigan within a 48-hour survey period. Minutes driven and number of trips taken were recorded by participants in their travel diaries. In terms of mapping the trips of teen subjects, origin and destination points for reported trips were geo-coded by the Michigan Department of Transportation. The authors calculated miles driven using origin and destination coordinate data points projected onto a road network of Michigan. They reported that young drivers with the following characteristics drove more than their peers: employed; greater access to a vehicle; and from urban residences. The authors also found that all teen year old drivers in their study drove substantially more during the day than at night, and they drove more often on their own than with passengers. They also found that male and female teenagers did not differ much in overall driving exposure and driving behaviour. Finally, the authors highlighted several 7
20 sampling and methodological limitations of their study and underscored the need for teen driver exposure data using in-vehicle devices. And, in this regard, recent studies have emerged that use in-vehicle recording devices to examine the amount and conditions of teen driver exposure (e.g., Lee et al. 2011; Klauer et al. 2011) or to modify teen driving behaviour through feedback (e.g., McGehee et al. 2007; Farmer et. al. 2009; Toledo et al. 2008; Prato et al. 2010). Lee et al. (2011) conducted a Naturalistic Teenage Driving (NTD) study which involved installing a data acquisition system in the vehicles of 42 newly licenced teenage drivers 16 years of age during their first 18 months of independent driving. They found that subjects drove an average of 315 miles in the first month to 441 miles in the last month, although this difference was not statistically significant. Similar to other studies based on self-report and trip diaries, they reported a wide range of exposure to driving between participants. Klauer et al. (2011), as part of the NTD study, examined the nature of teenage driving during the first 18 months of licensure in terms of known risk factors. The authors reported that average miles driven or average night-time miles driven did not increase over the 18 month study period. The total miles driven per teenage driver was highly variable, consistent with the findings of previously mentioned studies. The majority of the teen driving involved no passengers (62%), and driving with no passengers increased over time. Teens who owned their own vehicle were also more likely than others to speed more frequently overall, and speed more frequently at night and with multiple teen passengers. This finding is consistent with another study conducted in Queensland, Australia which found that young drivers who owned their own vehicle reported driving for greater distances and engaging in risky behaviour (Parker et al. 2011). These recent naturalistic studies using instrumented vehicles are promising in that they generate much needed data that improves our understanding of teen driving characteristics and exposure. However, they have suffered from methodological and other limitations, including: small sample sizes that detract from the generalizability of the findings; limited contextual data (e.g., no data on road surface conditions, weather conditions, traffic density, geography); difficulties with driver identification; challenges with subject recruitment and retention/attrition; and issues related to the use of multiple in-vehicle devices and the management of a myriad of data from multiple systems in a relational database/analyses. Naturalistic studies are also a very expensive method to obtain information on the driving characteristics and behaviours of young drivers. Selfreport surveys/interviews are a much less expensive method of gathering such information and have generated useful data in the past that has increased understanding of the driving characteristics and exposure of young drivers. 2.4 Conclusion In summary, there is an abundance of research related to the factors contributing to teen driver risks and fatalities. However, there continues to be knowledge gaps regarding 8
21 specific behaviours and characteristics of teenage drivers that may contribute to increasing these risks. As well, more information about the effectiveness of driver education is needed. This study aims to contribute to this knowledge generation by exploring the attributes and behaviours of young drivers in Ontario s GLS program with regards to their participation (or non-participation) in the Ministry s BDE program. 9
22
23 3.0 PROJECT OBJECTIVES 3.1 Objectives The primary objective of this assignment was to determine the effectiveness of the MTO BDE program by generating a greater understanding of the driving characteristics and behaviours of young drivers and collecting key exposure variables among the following three groups of young drivers: year olds who participated in a BDE program and did take a time discount; year olds who participated in a BDE program but did not take a time discount; and, year olds who did not participate in a BDE program. To achieve this objective, a survey of young and novice drivers (ages 16-19) was conducted to identify characteristics and behaviours unique to them. A random, representative sample of young drivers was used to collect the following information: driving and travel characteristics; licence class; amount of driving (with and without supervision); access to vehicle and public transportation options; parental or familial influences; motivations for taking or not taking BDE; perceptions of risks for various driving behaviours; self-reported driving ability and risky driving behaviours; and, awareness of the Ministry s public education tools targeted at young drivers. The outcomes of this investigation may contribute to the development of educational materials or marketing tools that can be targeted towards specific groups within the young driver population in Ontario. As well, it may also contribute to the development of policy and legislative measures to enhance GLS and BDE. As such, this survey was designed to also be able to analyze questionnaire responses according to various demographic information variables (e.g., urban/rural populations). 11
24 3.2 Research Questions Given the objectives and goals of MTO s BDE program, the following research questions were addressed in the survey: What are the key driving characteristics of the young driver population in Ontario? Are these characteristics significantly different among drivers who completed a BDE program (with or without time discount) and drivers who did not complete a BDE program? If so, are these differences statistically significant? What is the amount of driving among young drivers? How often does the driver have access to a vehicle? How much responsibility do young drivers have for the vehicles they drive? What type of vehicles do younger drivers operate most often? During the G1 licence period, who served most often as the experienced driver accompanying the young driver? How many combined hours did the driver spend under supervision (e.g., parents/guardians, other adults, driving instructor, etc.)? Did the driver s parents/guardians establish any rules for driving a vehicle? How often do young drivers parents/guardians or other family members talk to them about traffic safety/rules? How often do young drivers drive on 400-series highways? How much experience does the driver have in higher-risk traffic situations (e.g., night driving, hazardous weather, heavy traffic)? How do young drivers perceive their driving ability (i.e., before/after or without BDE program)? How often do young drivers engage in risky driving behaviours, and how do they perceive them? What was the primary reason for taking a BDE course or not taking a BDE course? How do young drivers perceive the BDE course? How often do young drivers take additional driving lessons outside of BDE? How often do young drivers utilize public transportation? How much access? Feasibility of using public transportation? Are young drivers aware of the Ministry s various public education tools targeted at young drivers (e.g., GLS videos)? 12
25 4.0 METHODOLOGY 4.1 Data A contact list containing all G1 and G2 licensed drivers in Ontario was generated from MTO s driver database. The names of drivers were excluded from this list to ensure confidentiality and privacy. The database included several categorical variables for each driver including: age at the time of data extraction; postal code; licence type; whether or not they had completed BDE; and, whether or not they had taken a time discount. These variables were used to ensure that a random, representative sample of teen drivers was surveyed across the three BDE-status groups (i.e., completed BDE with time discount; completed BDE without time discount; and, did not complete BDE). This contact list was also used to mail out survey invitation letters to the household of selected participants. 4.2 Sample Composition The target population for the survey consisted of young drivers residing in Ontario between the ages of years old. All participants were G2 licensed drivers, with the exception of 16-year old G1 licensed drivers who either: had completed BDE without taking a time discount or, did not complete BDE. As well, only those aged 16 years and 8 months or older were invited to participate, because this is the point at which they could become eligible to benefit from the completion of BDE. In other words, the minimum age at which an individual could have (or have not) completed BDE and taken a time discount to obtain their G2 licence is 16 years and 8 months old. Since this research is specific to being able to make these distinctions among drivers based on their BDE-status, only those individuals who could have possibly completed BDE and taken a time discount at the time of the survey were included. Therefore anyone younger than 16 years and 8 months was not included in the study, as it would be impossible to predict whether or not they would complete BDE or take a time discount. 4.3 Sample Selection A total of 9,008 addresses were sampled from the database of eligible drivers as part of the study. Three separate samples were drawn throughout the study to ensure target response numbers (1,200 responses) were obtained. The first sample contained 6,000 addresses, the second contained 1,008 addresses, and the third was comprised of 2,000 addresses. The objective behind the following sampling strategy was to obtain a balanced and representative number of participants in each of the three targeted categories of BDE drivers, across age and demographic variables. 13
26 Three key variables were used to stratify the sample: age when the sample was drawn (four categories: 16, 17, 18 and 19), BDE status (three categories: teen completed BDE and took the time discount, teen completed BDE but did not take the time discount, teen did not complete BDE) and the distinction between rural versus urban as determined by the postal code. As can be seen in the first two tables (see Table 1 & Table 2 on next page), the distributions are balanced according to the variables age and BDE status (i.e., an equal number was to be sampled for each category of these two variables). However, with respect to urban and rural, the design is unbalanced in that approximately 70% of sampled records were in the urban category and 30% in the rural category. This was done to ensure an adequate number of responses were obtained in each stratum so that statistical significance, with respect to a larger population, could be established in the analyses. The stratification of the third sample of addresses (see Table 3) was drawn and distributed across the matrix according to the response rates from the two previous samples. It was determined that certain groups (e.g., 16-year olds who completed BDE and took a time discount) had higher response rates to this survey than other groups of drivers in the study. Those cells which were found to have lower overall response rates from participants were identified and oversampled in this selection to ensure even distributions of responses across the stratification matrix in the final results. The following tables depict the stratification matrices used to classify individuals within the target groups of the study for each new sample of participants. Table 1. Sample #1 (Total: 6000) Age (at time of BDE with time data extraction) discount 16 years old 17 years old 18 years old BDE without time discount Non-BDE Urban: 353 Urban: 353 Urban: 353 Rural: 147 Rural: 147 Rural: 147 Urban: 353 Urban: 353 Urban: 353 Rural: 147 Rural: 147 Rural: 147 Urban: 353 Urban: 353 Urban: 353 Rural: 147 Rural: 147 Rural: 147 Urban: 353 Urban: 353 Urban: years old Rural: 147 Rural: 147 Rural: 147 Includes valid G2s only (except for 16 year olds in shaded cells, which consist of G1s only) 14
27 Table 2. Sample #2 (Total: 1008) Age (at time of data extraction) 16 years old 17 years old 18 years old 19 years old BDE with time discount BDE without time discount Non-BDE Urban: 59 Urban: 59 Urban: 59 Rural: 25 Rural: 25 Rural: 25 Urban: 59 Urban: 59 Urban: 59 Rural: 25 Rural: 25 Rural: 25 Urban: 59 Urban: 59 Urban: 59 Rural: 25 Rural: 25 Rural: 25 Urban: 59 Urban: 59 Urban: 59 Rural: 25 Rural: 25 Rural: 25 Includes valid G2s only (except for 16 year olds in shaded cells, which consist of G1s only) Table 3. Sample #3 (Total: 2000) Age (at time of data extraction) 16 years old 17 years old 18 years old 19 years old BDE with time discount BDE without time discount Non-BDE Urban: 0 Urban: 258 Urban: 127 Rural: 0 Rural: 0 Rural: 62 Urban: 0 Urban: 120 Urban: 71 Rural: 0 Rural: 16 Rural: 71 Urban: 38 Urban: 201 Urban: 134 Rural: 0 Rural: 54 Rural: 36 Urban: 24 Urban: 189 Urban: 386 Rural: 16 Rural: 126 Rural: 71 Includes valid G2s only (except for 16 year olds in shaded cells, which consist of G1s only) 4.4 Research Design Survey response options Participants were asked to complete the Young Driver Survey questionnaire through the online platform Survey Monkey. Participants gained access to the survey via a web-link provided in the invitation letter. This web-link was not publicly available, and was disclosed to participants in the survey invitation letters only. The invitation letters sent to participants were prepared in both French and English, as required by the Ministry. Participants were given the option of responding to the survey in their choice of either French or English. As well, participants were given the option of completing the 15
28 questionnaire over the phone with a survey consultant or through a mailed-paper version. Overall, 1,093 individuals who participated chose to complete the survey online; three individuals completed the survey over the phone; and six chose to use the paper version Incentives In order to maximize response rates from the survey, a monetary incentive was used for recruitment. Upon completion of the questionnaire, participants were redirected to TIRF s website where they were given the opportunity to receive $10 as thanks for their participation. Redirecting participants to TIRF s website after completion of the questionnaire ensured that personal information from participants and their responses could not be linked in any way, allowing for anonymity and confidentiality to be preserved. Participants who completed the questionnaire and submitted their contact information were subsequently sent a $10 bill by mail Item Development The Young Driver Survey questionnaire was developed and used to measure the characteristics and behaviours of young and novice drivers in Ontario. The development of the Young Driver Survey was guided by the research questions MTO established for this project. It involved several iterative stages, including extensive consultation and revision between TIRF s research team and MTO. Details of the development of the Young Driver Survey questionnaire are described below. Questionnaire development began with the identification of primary domains (e.g., behaviours, skills, and risks) that accompany learning to drive, as well as key components of the GLS and BDE program (e.g., supervised driving, driving restrictions). These areas became the focus of item construction and development. Item development explored a number of existing scales and questionnaires used to measure skills and behaviours of teen drivers. These existing scales included TIRF s own measures developed as part of previous young driver research projects (e.g., The New Driver questionnaire) as well as other relevant tools used in traffic safety research. Relevant existing items were adapted to fit the identified areas specific to this survey and research goals. Where gaps in items existed, TIRF s research team evaluated existing literature, as well as the BDE curriculum, to identify content appropriate to the Young Driver Survey. An extensive pool of items was constructed and reviewed by TIRF s research team to evaluate which items held the highest estimated reliability and validity, and to eliminate those which were redundant or inappropriate. Careful consideration was given to select items that were assessed as being very specific, but which did not require increased response time to complete. This allowed for a relatively compact questionnaire to be constructed (15-20 minutes to complete online) without compromising content-rich results. 16
29 Items that were agreed upon were organized according to corresponding domains. These domain areas included: background information; learning to drive; G1 licence stage; vehicles; driving behaviours; parental influences; alternatives to driving; and, driving programs and resources. At this point, pilot testing was completed to further refine the existing items. User acceptance testing and refinement. Pilot testing was conducted in several stages. Those testing the questionnaire were asked to review the items for response time, clarity of the content and wording of items, as well as to evaluate the overall feel and flow of the questionnaire. Items were added, removed, or revised based on this feedback. Item types. Once finalized, the Young Driver Survey questionnaire consisted of three different item types: multiple choice (only one answer allowed or multiple answers allowed); open ended; and, rating scale items. Questionnaire composition. The online format of the Young Driver Survey questionnaire allowed for automatic branching of items, reducing unnecessary or irrelevant questions to be given to participants when they were not applicable. In other words, the number of overall questions for each participant varied depending on how they responded to certain questionnaire items. Hard-copy versions (for both G1 and G2 drivers) of the Young Driver Survey were also developed (see Appendices B & C). Branching of items occurred at several critical areas within the questionnaire so that participants answered question items that pertained to their group membership. These areas included, among others: licence type (G1 or G2); BDE status (whether or not the participant completed a Ministry-approved BDE course); and, time discount status (whether or not the participant had reduced the amount of time in the G1 licence stage). As well, the online survey format required that participants choose an answer option before progressing to the next item, reducing the likelihood of missing data points that would be expected otherwise. Participants responded to a total of approximately questions, depending on the branching of items within the questionnaire. The average response time to complete the survey online was between 15 and 20 minutes. The questionnaire was comprised of several sections related to key characteristics of the young driver population (refer to Appendices B & C for specific item content). 4.5 Data Collection Over the time period from December 11, 2013 to March 9, 2014, three samples of Ontario households were contacted to invite teens to participate in the Young Driver Survey. An initial 6,000 letters were sent to participants in December Due to time and budgetary constraints of the project, only the first sample of invitation letters was followed up with reminder letters, approximately four weeks after distribution of the initial invitations. 17
30 Additional mail-outs of 1,008 and 2,000 invitation letters were sent in January and February of 2014, respectively. Throughout the course of the study, response rates were monitored to determine the need for additional mail-outs. As well, the distribution of responses across the sampling design of the survey was monitored to ensure a balanced number of responses was received in each target group. At the conclusion of the survey period, a total of 1,102 young drivers chose to participate in the survey, with an overall response rate of approximately 12%. 4.6 Data Analysis Of the 1,102 individuals who responded to the Young Driver Survey, a total of 995 were ultimately included in the analysis of the survey data. Reasons for exclusion from the final dataset were survey attrition (i.e., withdrawing from the survey early), invalid respondent categorization (e.g., respondents who were not included in the sampling design such as year old G1 drivers), and any respondents who entered an unidentifiable or invalid postal code. Data analysis was conducted using Stata, version 13. Univariate frequency distributions, bivariate cross-tabulations, and logistic regression analyses were used to analyze the results of the Young Driver Survey. These approaches were appropriate given the project objectives and structure of the research questions that were addressed as part of this study. Statistical significance was evaluated using calculations of 95% confidence intervals (CIs), as well as logistic regression modelling. Summary statistics across the entire response set were analyzed. Careful analysis was undertaken to control for impossible values or response patterns which were contrary to the targeted design of this survey (e.g year old G1 licensed drivers). Data checks were initially completed by the TIRF research team and continued throughout the analysis process to ensure accuracy of results. 4.7 Weights Design and post-stratification weights were used to most accurately analyze the survey data. Determination of the weights used during analysis involved several procedures (see Table 4-1 for specific values). First, the total population of G1 and G2 drivers in Ontario, obtained from the original sample from MTO, was distributed according to the stratification matrix of the sampling design for each of the 24 strata (see section 4.3 Sample Selection). Then, the probability of unit selection within each stratification cell in the survey design was calculated (Total sampled/population total). The inverse of this probability was calculated. The result of these calculations represented the design weight of the survey. 18
31 Next, the post-stratification weight was calculated. Response totals of the survey were calculated for each of the 24 strata. Then, response rates were calculated for each strata (Total response/total sampled). The inverse of the response rate for each cell of the stratification matrix was then calculated to obtain the resulting weight. The design and post-stratification weights were multiplied to determine the overall weighting to be used in the survey analysis. Univariate, bivariate and logistic regression analyses were conducted using these weights, utilizing Stata s svy procedures for survey analysis. Table 4-1: Calculation of Survey Weights Stratum Pop. totals Sample 1 Sample 2 Sample 3 Total sam. Prob. of selection Design weight Total Resp. Resp. rate Post-Str weight Final weight Univariate and Bivariate Distribution Analyses Univariate and bivariate analyses were used to explore each variable in the data set separately, and across each of the target groups within the sampling design (i.e., BDE with time discount; BDE without time discount; and, non-bde). Frequency and percentages of 19
32 responses for each evaluated variable were calculated where appropriate. Patterns of responses were individually analyzed to determine their significance levels. Where bivariate distribution analyses were performed across subgroups of the young driver population the variable classification was used. The classification variable allowed for responses to be grouped according to where participants fell within the three targeted groups of young drivers (i.e., completed BDE with a time discount; completed BDE without a time discount; and drivers who did not complete BDE). Using these subgroups, researchers were able to determine if significant differences or similarities in skills, abilities, or perceptions were present between groups of young and novice drivers. As mentioned above, certain variables were analyzed across groups determined by the BDE status of participants. In these cases, any significant variances in the distributions of variables across these groups were identified and subsequently confirmed using more advanced logistical models (see section for further description). In all cases, significance was initially evaluated by 95% confidence intervals (CIs) Logistic regression analysis Logistic regression analysis was used to formally test the variance within the data between various driving skills, abilities, and behaviours among subgroups of young drivers. Depending on the specific research question, as well as results of the univariate and bivariate analyses, more sophisticated logistic regression analyses were conducted to evaluate statistical significance of results where appropriate. In these instances, a model was devised to examine the statistical estimates, as odds ratios, between a binary dependent variable (e.g., the frequency of a driving behaviour, or the rating of a specific skill) and an independent variable (e.g., BDE and time discount status, or demographic information). In this way, outcomes between the dependent variables could be interpreted as odds ratios. The outcomes of each logistic regression model were evaluated for significance at the 5% level (p-value < 0.05). Additionally, the logistic regression analyses were conducted while controlling for specific external factors (e.g., gender and age) to further refine the risk estimates, in order to better detect the true effects of the key independent variables discussed. Demographic location (i.e., urban versus rural) was also considered as a control variable, but was found to be an insignificant factor for the vast majority of models. Thus, this variable was only used in logistic regression models where significant differences were identified in the resulting odds ratios when controlling for urban versus rural location. A summary of the significant findings can be found in the discussion section, 5.2 Summary and Discussion. 20
33 5.0 RESULTS 5.1 Research Questions: Results In this section, the results of the study are described with respect to each research question listed in the project objectives. Any figures not displayed within the results section can be found in Appendix A What are the key driving characteristics of the young driver population in Ontario? Are these characteristics significantly different among drivers who completed a BDE program (with or without time discount) and drivers who did not complete a BDE program? If so, are these differences statistically significant? Figure 5-1 shows the breakdown of individuals who participated in the Young Driver Survey, with respect to their categorization within the sampling design prior to applying design and stratification weights. Figure 5-1: Distribution of responses by sampling design BDE_TD BDE_noTD non_bde Totals 16-Urban Rural Urban Rural Urban Rural Urban Rural Totals Descriptive statistics of the weighted sample were evaluated to determine the overall percentages of young drivers in the population studied with respect to age, gender, demographic information (i.e., urban vs. rural), and school status (see Figures 5-2 to 5-5). With respect to age, 16-year olds made up 12.76% [10.78,15.03] of the population, 17-year olds made up 25.13% [22.38,28.10] of the population, 18-year olds made up 32.28% [28.61,36.91] of the population, and 19-year olds comprised 29.83% [26.39,33.51] of the population. As well, male respondents comprised 46.24% [42.43,50.08] of total population compared to female respondents (53.76% [49.92,57.57]). No statistically significant differences were found between males and females with respect to whether or not they completed BDE or took a time discount. With respect to the sampling design and overall population, there were more responses from urban participants (81.75% [79.39,83.90]) than rural participants (18.25% [16.10,20.61]). Interestingly, demographic differences were found within the young driver population with respect to the three target subgroups of young drivers (see Figure 5-7 in Appendix A). A greater percentage of rural drivers (51.92% [45.88,57.89]), compared to 21
34 urban drivers (45.25% [40.97,49.61]), completed BDE and took a time discount. Conversely, a greater percentage of urban drivers (33.81% [29.4,38.52]) completed BDE and did not take a time discount, compared to rural drivers (26.17% [20.85,32.29]). No significant differences were found among drivers who did not complete BDE with respect to demographic location. Almost half of participants indicated that they were in high school (44.61% [42.47,46.78]), with an additional 49.84% [47.22,52.46] indicating that they were at the university or college level. Only 5.54% [4.07,7.51] of respondents indicated that they were not in school. Again, results showed significant variance within the three targeted subgroups of drivers in relation to their school status (see Figure 5-8 in Appendix A). Bivariate frequency analysis showed that a greater percentage of high school students (26.46% [24.82,28.16]), compared to university and college students (15.76% [14.17,17.48]) had not completed BDE. Figure 5-2: Distribution of responses by age Number of strata = 6 Number of obs = 995 Number of PSUs = 995 Population size = Design df = 989 age - years percentages lb ub Total 100 Key: percentages = cell percentages lb = lower 95% confidence bounds for cell percentages ub = upper 95% confidence bounds for cell percentages Figure 5-3: Distribution of responses by gender Number of strata = 24 Number of obs = 995 Number of PSUs = 995 Population size = Design df = 971 are you: percentages lb ub male female Total 100 Key: percentages = cell percentages lb = lower 95% confidence bounds for cell percentages ub = upper 95% confidence bounds for cell percentages 22
35 Figure 5-4: Distribution of responses by demographics Number of strata = 12 Number of obs = 995 Number of PSUs = 995 Population size = Design df = 983 postalcode percentages lb ub rural urban Total 100 Key: percentages = cell percentages lb = lower 95% confidence bounds for cell percentages ub = upper 95% confidence bounds for cell percentages Figure 5-5: Distribution of responses by school year Number of strata = 24 Number of obs = 995 Number of PSUs = 995 Population size = Design df = 971 Current Education Level percentages lb ub High School University Not In School Total 100 Key: percentages = cell percentages lb = lower 95% confidence bounds for cell percentages ub = upper 95% confidence bounds for cell percentages Univariate analysis techniques were used to determine the distribution of young drivers who fell within each of the three targeted subgroups of the study, (i.e., drivers who completed BDE and took a time discount, drivers who completed BDE and did not take a time discount, and drivers who had not completed BDE). Drivers who completed BDE and took a time discount comprised 46.47% [42.81,50.17] of the weighted sample (i.e., representative with respect to the larger population). Those who completed BDE without taking a time discount made up 32.41% [28.66,36.41] of the population. Participants who did not complete BDE made up the final 21.11% [18.56,23.92] of drivers (see Figure 5-6). 23
36 Figure 5-6: Distribution of responses by targeted subgroups Number of strata = 8 Number of obs = 995 Number of PSUs = 995 Population size = Design df = 987 classification percentages lb ub BDE w/ TD BDE w/o TD non-bde Total 100 Key: percentages = cell percentages lb = lower 95% confidence bounds for cell percentages ub = upper 95% confidence bounds for cell percentages What is the amount of driving among young drivers? The following subsection analyzes the amount of driving, including driving for specific purposes, that young drivers experience during different stages of the graduated licensing process. It also examines the amount of driving among subgroups of young drivers defined in terms whether they completed BDE or not, as well as whether or not they decided to take a time discount. Within the questionnaire, participants were asked several questions related to the frequency and amount of driving they accumulated during G1 and G2 licence stages. Such questions asked whether or not they had driven prior to enrolling in BDE; how many days per month they drove; how many kilometers (km) they drove each month; and, how often they drove for specific purposes (e.g., to get to and from school). Univariate and bivariate analyses were performed to gauge the frequency and amount of driving, as well as the percentage of drivers who rated the frequency which they drove for each separate driving purpose in the average month as Never, Once, Sometimes, Often, or Very often. Additionally, logistic regression analyses were conducted to discern whether any differences among the three subgroups of drivers were present. The logistic regression measured any significant differences between those drivers who drove for each specific purpose often (i.e., categories of Often or Very often) versus those who drove for each specific purpose not often (i.e., categories of Never, Once, or Sometimes). Driving prior to BDE enrollment. Results of a univariate analysis revealed that the majority of young drivers, approximately 77.47% [73.49, 81], who had completed BDE, reported that they drove prior to enrolling in the BDE program (see Figure 5-9 in Appendix A). Days driven. Participants were asked to indicate the amount of driving they experienced in an average month. A univariate analysis was conducted to measure the amount of driving that G1 drivers accumulated in an average month, as well as the distribution of 24
37 driving frequency across subgroups (see Figure 5-10 in Appendix A). It should be noted that, as per the sampling design of this study, G1 drivers in this analysis consist of 16-year olds only. The majority of G1 drivers (74.59% [63.11,83.43]) drove less than eight days per month. Approximately 7% [3.01,16.92] of G1 drivers reported driving between 24 and 31 days per month on average. Figure 5-11 shows the amount of driving that G2 drivers accumulated in an average month, as well as the distribution of driving frequency across subgroups. As opposed to G1 drivers, the number of days driven per month is more equally distributed among G2 drivers, with 33.42% [29.64,37.42] of G2s driving 0-7 days per month; 20.88% [17.72,42.42] driving 8-15 days per month; 20.33% [17.25,23.79] driving days per month; and, 25.38% [22.07,28.99] driving days per month. Figure 5-11: How many days do G2 drivers drive in an average month? Number of strata = 20 Number of obs = 853 Number of PSUs = 853 Population size = Design df = 833 On how many days do you drive in the average month? classification 0-7 days 8-15 days days days Total BDE w/ TD [23.52,32.87] [17.88,26.4] [17.27,25.67] [24.59,33.93] BDE w/o TD [31.93,48.39] [15.14,28.98] [12.8,26.17] [14.46,27.75] non-bde [30.26,45.97] [11.26,23.35] [15.99,28.35] [17.97,31.86] Total [29.64,37.42] [17.73,24.42] [17.25,23.79] [22.07,28.99] Key: row percentages [95% confidence intervals for row percentages] Pearson: Uncorrected chi2(6) = Design-based F(5.32, )= P = Preliminary bivariate analysis indicated that there may be some differences among subgroups of G2 drivers with respect to the number of days driven in an average month. However, after further controlling for gender and age differences using logistic regression analysis, it was determined that these differences were not statistically significant (see Figure 5-12 in Appendix A). Kilometers driven. Figures 5-13 and 5-15 (see Appendix A) show the number of kilometers reported by G1 and G2 drivers in an average month. A bivariate analysis determined the number of kilometers driven by G1 drivers in an average month, as well as the distribution across subgroups. The majority of G1 drivers (75.31% [65.16,83.25]) drove 25
38 less than 101 kilometers per month. Additionally, about 22.60% [15.18,32.25] of G1 drivers drove between kilometers per month. Within subgroups of drivers, the majority of G1 drivers who did not complete BDE (80.23% [67.92,88.61]) drove less than 101 km per month. This is noticeably higher than the 48.36% [32.68,64.38] of drivers who completed BDE without taking a time discount. Logistic regression analysis was used to confirm the significance of this finding (see Figure 5-14 in Appendix A). The analysis evaluated the significance between drivers who indicated that they drove for more than 100 kilometers per month, compared to those who drove for less than 101 kilometers per month, while controlling for gender. It should be noted that age was not used as a control variable in this model due to the fact that only 16 year old G1 licensed drivers were included in this study. An odds ratio of 0.21 (p<0.01) was found between G1 drivers who did not complete BDE and those G1 drivers who completed BDE but did not take a time discount. In other words, non-bde drivers have an approximate 79% ((1-0.21)*100) decrease in the odds that they will drive for more than 100 kilometers per month, compared to G1 drivers who completed BDE without taking a time discount. Approximately 41.60% [37.61,45.71] of G2 drivers reported that they drove for less than 101 kilometers in an average month. A higher percentage of G2 drivers (58.39%) than G1 drivers (24.70%) indicated that they drove more than 100 kilometers per month. The results of a logistic regression analysis (see Figure 5-16) confirmed the significance of this finding with an odds ratio of 4.28 (p<0.01) between G1 and G2 drivers when controlling for gender. This means that G2 drivers had a 328% increase in the odds of driving for more than 100 kilometers in the average month compared to G1 drivers. Furthermore, as opposed to differences found among G1 drivers, no statistically significant differences were found between subgroups of G2 drivers with respect to whether or not they drove for more than 100 kilometers per month. 26
39 Figure 5-16: Logistic regression Number of strata = 24 Number of obs = 966 Number of PSUs = 966 Population size = Design df = 942 F( 2, 941) = Prob > F = Linearized km_drive Odds Ratio Std. Err. t P> t [95% Conf. Interval] licencetype g1 licence g2 licence gender male female _cons Driving to school. Participants were also asked to estimate the frequency that they drove for specific purposes (e.g., to school, work, social activities) each month. They were asked to give the frequency on a scale from Never to Very often. Overall, 41.05% [37.1,45.11] of young drivers said that they never drove to get to and from school on a monthly basis; 7.7% [5.84,10.10] said they drove once per month; 11.54% [9.227,14.35] said they sometimes drove to school; 12.11% [9.65,15.11] said they often drove to school; and, 27.60% [24.16,31.32] said they drive to school very often in the average month (see Figure 5-17). The percentage of drivers, who completed BDE and took a time discount, and that never drove to or from school is much smaller than those who did not complete BDE (33.08% [28.21,38.34] vs 53.38% [45.58,61.02]). A logistic regression analysis (see Figure 5-18 in Appendix A) was conducted to determine subgroup differences between drivers who reported never driving to or from school, compared to those who drove to or from school at least once per month. Results showed an odds ratio of 0.60 (p=0.01) between drivers who completed BDE and took a time discount and those who did not complete BDE. This means that drivers who did not complete BDE are 40% ((1-0.60)*100) less likely to drive to or from school at least once per month, compared to BDE drivers who take a time discount. In this instance, it was observed that drivers who completed BDE and took a time discount drove significantly more often to school compared to drivers who did not complete BDE. 27
40 Figure 5-17: How often do young drivers drive to/from school, monthly? Number of strata = 24 Number of obs = 861 Number of PSUs = 861 Population size = Design df = 837 How often have you driven to get to/from school, classification monthly? BDE w/ TD BDE w/o TD non-bde Total Never [28.21,38.34] [37.17,54.51] [45.58,61.02] [37.1,45.11] Once [6.05,12.09] [3.76,12.4] [3.621,12.08] [5.836,10.1] Sometimes [10.34,17.86] [5.386,15.22] [6.149,15.97] [9.227,14.35] Often [9.374,16.65] [8.537,20.69] [5.334,14.14] [9.647,15.11] Very Often [27.27,37.31] [18.04,32.82] [15.81,27.57] [24.16,31.32] Total Key: column percentages [95% confidence intervals for column percentages] Pearson: Uncorrected chi2(8) = Design-based F(7.56, )= P = Driving to work. Overall, 43.97% [39.98,48.04] of young drivers said that they never drove to get to and from work on a monthly basis; 4.25% [2.84,6.32] said they drove once per month; 11.14% [8.81, 14.00] said they sometimes drove to or from work; 15.87% [12.97,19.28] said they often drove to work; and, 24.77% [21.5,28.35] said they drove to or from work very often in the average month (see Figure 5-19 in Appendix A). A bivariate distribution analysis shows that drivers who have completed BDE and took a time discount never drove to or from work significantly less than those who did not complete BDE (40.22% [34.99,45.68] vs 56.36% [48.90,63.55]). Results of a logistic regression analysis (see Figure 5-20 in Appendix A), evaluated the odds ratio of driving to work at least once a month compared to those who never drove to work, confirmed these findings, with an odds ratio of 0.66 (p=0.04) between drivers who completed BDE and took a time discount and non-bde drivers. In other words, drivers who did not complete BDE had 34% ((1-0.66)*100) decreased odds that they will drive to work at least once in the average month compared to drivers who completed BDE and took a time discount. No significance was found when comparing other subgroups of drivers with respect to the frequency that they drove to or from work in the average month. However, results did reveal that females were significantly more likely to report driving to work at least one time per month compared to males, with an odds ratio of 1.62 (p=0.01) for female drivers. 28
41 Driving as part of a job. Results show that 82.91% [79.67,85.72] of young drivers never drove as part of their job (see Figure 5-21 in Appendix A). Around 3.18% [2.04,4.94] said they drove as part of their job once per month; 3.44% [2.24,5.24] drove as part of their job sometimes; 5.16% [3.64,7.27] drove often; and, 5.31% [3.78,7.40] drove as part of their job very often. Bivariate analysis showed that 79.65% [74.88,83.71] of drivers who completed BDE and took a time discount never drove as part of their job in an average month. A higher percentage of drivers, 87.14% [80.13,91.92] of those who completed BDE and did not take a time discount and 84.24% [78.04,88.94] of those who did not complete BDE, indicated that they never drove as part of their job in the average month. However, a logistic regression analysis, controlling for gender, age, and demographic location (i.e., urban versus rural) variables, suggested that these differences were not statistically significant when taking other factors into account, with respect to whether or not they drove as part of their job at least once per month (see Figure 5-22 in Appendix A). Demographic location was used as a control variable in this particular model due to the fact that it significantly influenced the odds ratio, in this case suggesting that the differences among subgroups were not statistically significant. Driving to recreational or social activities. Overall, 20.84% [17.88,24.14] of young drivers said that they never drove to get to and from recreational or social activities on a monthly basis; 16.75% [13.79,20.21] said they drove once per month; 26.63% [23.25,30.31] said that they sometimes drove to or from recreational or social activities; 23.88% [20.47,27.66] said they often drove to recreational or social activities; and, 11.90% [9.42,14.92] said they drove to or from recreational or social activities very often in the average month (see Figure 5-23). Similar differences were found between subgroups of drivers, as in previous categories of driving purposes. A smaller percentage of drivers who completed BDE and took a time discount (17.01% [13.31,21.49]) and drivers who completed BDE but did not take a time discount (19.43 [13.93,26.42]) never drove to or from recreational or social activities compared to those who did not complete BDE (32.56% [25.91,40.00]). However, a logistic regression analysis, which controlled for differences in age and gender variables, suggested that these differences among subgroups of drivers were not statistically significant (see Figure 5-24 in Appendix A). 29
42 Figure 5-23: How often do young drivers drive to/from recreational or social activities, monthly? Number of strata = 24 Number of obs = 861 Number of PSUs = 861 Population size = Design df = 837 How often have you driven to get to/from recreational or social activities, classification mont BDE w/ TD BDE w/o TD non-bde Total Never [13.31,21.49] [13.93,26.42] [25.91,40] [17.88,24.14] Once [11.32,19.21] [15.08,30.19] [9.348,19.45] [13.79,20.21] Sometimes [26.48,36.42] [15.38,29.6] [17.44,30] [23.25,30.31] Often [22.28,32.14] [15.47,30.53] [13.68,26.2] [20.47,27.66] Very Often [7.219,13.67] [9.621,22.97] [7.773,16.69] [9.421,14.92] Total Key: column percentages [95% confidence intervals for column percentages] Pearson: Uncorrected chi2(8) = Design-based F(7.38, )= P = Driving to practice driving. Results of the univariate analysis showed that young drivers do practice driving fairly often overall. Approximately one-quarter, or 24.33% [20.95,28.07] of drivers said they drive to practice driving very often in the average month; 29.19% [25.67,32.99] said they drove to practice often; 27.79% [24.25,31.64] said they practiced driving sometimes; 8.99% [6.75,11.88] said they practiced driving once per month; and, 9.70% [7.61,12.28] said that they never drove to practice their driving in the average month (see Figure 5-25 in Appendix A). Significant differences were found among subgroups of young drivers. Significantly fewer drivers who completed BDE and took a time discount (5.9% [3.71,9.25]) said that they never drove to practice driving, compared to 21.25% [15.55,28.34] of drivers who did not complete BDE. Results of a logistic regression analysis (see Figure 5-26 in Appendix A), controlling for gender differences, showed a significant odds ratio of 0.42 (p=0.01) between BDE drivers who took a time discount and drivers who did not complete BDE. This means that, compared to BDE drivers who took a time discount, non-bde drivers had a 58% ((1-0.42)*100) decrease in the odds of driving to practice at least once per month. 30
43 Although a smaller percentage of drivers who completed BDE without taking a time discount (8.35% [4.78,14.20]) reported never driving to practice in the average month compared to drivers who did not complete BDE, the logistic regression analysis determined that these differences were not statistically significant. These findings suggest that drivers who did not complete BDE do not practice driving as often as drivers who completed BDE and took a time discount. Driving just to go for a drive. Results of the univariate analysis indicated that, for the most part, young drivers did not often drive just to go for a drive (see Figure 5-27 in Appendix A). Just 3.40% [2.18,5.25] of drivers said they drove just to go for a drive very often in the average month; 5.60% [4.04,7.73] said they went for a drive often; 12.37% [9.93,15.31] said they drove just to go for a drive sometimes; 13.52% [11.03,16.47] said they did this once per month; and, 65.11% [61.45,68.60] said they never drove just to go for a drive in the average month. The bivariate analysis revealed differences among subgroups of young drivers. A much smaller percentage of drivers who did not complete BDE (43.40% [37.69,49.29]) said that they never drove just to go for a drive in the average month, compared to drivers who completed BDE and took a time discount (72.85% [67.93,77.27]). Similarly, 66.69% [58.30,74.13] of drivers who completed BDE without taking a time discount said that they never drove simply to go for a drive, more than those who did not complete BDE. Logistic regression analysis, controlling for gender and age factors, was used to confirm the significance of these results (see Figure 5-28 in Appendix A). A significant odds ratio of 2.38 (p<0.01) was found between drivers who did not complete BDE and those who completed BDE and took a time discount. This means that drivers who did not complete BDE had a 138% ((2.38-1)*100) increase in the odds of driving just to go for a drive at least once per month compared to BDE drivers who took a time discount. Results also revealed that, when controlling for age and gender, the differences between drivers who completed BDE without taking a time discount and those who did not complete BDE were not statistically significant How often does the driver have access to a vehicle? This subsection describes how often young drivers had access to a vehicle. As well, it analyzes distributions of these percentages across the three targeted subgroups of drivers. Figure 5-29 contains the distribution of young drivers who had unlimited access to a vehicle across subgroups. Results indicated that about an equal number of young drivers said they had unlimited use of a motor vehicle (47.00% [43.21,50.83]) compared to those that said that they did not have unlimited use (53.00% [49.17,56.79]). 31
44 Figure 5-29: Do young drivers have unlimited access to a vehicle? Number of strata = 24 Number of obs = 980 Number of PSUs = 980 Population size = Design df = 956 Do you have unlimited use of vehicle? classification No Yes Total BDE w/ TD [41.89,52.16] [47.84,58.11] BDE w/o TD [50.16,65.95] [34.05,49.84] non-bde [50.93,65.12] [34.88,49.07] Total [49.17,56.79] [43.21,50.83] Key: row percentages [95% confidence intervals for row percentages] Pearson: Uncorrected chi2(2) = Design-based F(1.91, )= P = More drivers who completed BDE and took a time discount were found to have unlimited access to a vehicle (53% [47.84,58.11]), compared to those drivers who completed BDE without taking a time discount (41.73% [34.05,49.84]) and those who did not complete BDE (41.81% [34.88,49.07]). Logistic regression analysis was undertaken to further confirm the significance of this finding, while controlling for gender and age differences (see Figure 5-30 in Appendix A). Speaking in terms of percentages, for a driver who had completed BDE but did not take a time discount, the odds of having unlimited access to a vehicle is 40% ((1-0.60)*100) less than a driver who had taken a time discount. Similarly, the likelihood of drivers who did not complete BDE to have unlimited access to a vehicle is 32% ((1-0.68)*100) less than drivers who completed BDE and took a time discount How much responsibility do young drivers have for the vehicles they drive? Participants were asked questions about the amount of responsibility they had for the vehicles they drive. Participants were asked to identify the individual who owned the vehicle that they operated most often. The response options included: you; your parents/guardians; other family members; a friend; or, other. Univariate analysis results showed the distribution of ownership of the vehicles that young drivers operated (see Figure 5-31). In the majority of cases (86.41% [83.69,88.73), the parents/guardians of young drivers own the vehicle that they operated. Approximately 9.31% [7.52,11.48] of young drivers said they owned their own vehicles. 32
45 Figure 5-31: Who owns the vehicles that young drivers operate? Number of strata = 24 Number of obs = 978 Number of PSUs = 978 Population size = Design df = 954 Who owns the vehicle classification you drive? BDE w/ TD BDE w/o TD non-bde Total you [9.018,15.44] [3.889,11.1] [5.289,11.28] [7.524,11.48] your parents/guardian [82.46,89.34] [81.91,92.24] [78.78,88.62] [83.69,88.73] other family member [.5081,2.844] [1.458,9.079] [2.597,8.609] [1.698,4.476] friend [.2965,5.9] [.9568,7.62] [.4216,2.429] other [.1659,2.719] [.07959,1.201 [.09144,1.657 [.1907,1.297] Total Key: column percentages [95% confidence intervals for column percentages] Pearson: Uncorrected chi2(8) = Design-based F(6.52, )= P = Interestingly, a greater percentage of young drivers who completed BDE and took a time discount (11.86% [9.02,15.44]) said they owned their own vehicles, compared to those drivers who completed BDE and did not take a time discount (6.64% [3.89,11.10]) and those who did not complete BDE (7.77% [5.29,11.28]). A logistic regression analysis was conducted to further analyze these results (see Figure 5-32 in Appendix A). The analysis, which also controlled for gender, age, and demographic location (i.e., urban versus rural) factors, examined the difference among the three targeted subgroups of young drivers with respect to whether they owned the vehicle they drove or someone else did. Demographic location was used as a control variable in this particular model due to the fact that it significantly influenced the resulting odds ratios, in this case suggesting that the differences among subgroups were actually not statistically significant. Results indicated that the differences with respect to vehicle ownership seen in the bivariate analysis were not statistically significant, suggesting other factors were likely more influential. A bivariate analysis was also conducted to determine whether or not young drivers who owned their own vehicles also reported having unlimited use of a motor vehicle compared to drivers who did not own their own vehicle. A much larger percentage of drivers who owned their own vehicles (93.19% [84.89,97.09]) reported having unlimited access to a vehicle compared to the 42.27% [38.29,46.36] of drivers who did not own their own vehicle (see Figure 5-33 in Appendix A). This suggests that those drivers who owned their 33
46 own vehicle did not have restrictions on the amount of access to a vehicle they were allowed, unlike the majority of those individuals who drove cars owned by other people, such as their parents or family members. Ultimately, this implies that vehicle ownership was associated with decreased restriction and monitoring of young drivers while they were learning to drive What type of vehicles do younger drivers operate most often? This subsection describes the most common types and number of vehicles that young drivers operate. Participants were asked to select the single type of vehicle which they drove most often, as well as how many vehicles they had access to drive. The choices were as follows: Car; Minivan/Family van; Sports utility vehicle (SUV); Pick-up truck; Motorcycle; or, Other. The univariate analysis showed that cars were the most common type of vehicle used, driven by approximately 56.64% [52.78,60.42] of young drivers. Sport utility vehicles (SUVs) and vans were also vehicle types most often driven (19.61% [16.72,22.86] and 15.38% [12.77,18.41] respectively) by some young drivers (see Figure 5-34 in Appendix A). Almost half of young drivers (46.87% [43.05,50.73]) said that they had access to two vehicles (see Figure 5-35 in Appendix A). Very few drivers, approximately 2.48% [1.42,4.32], did not have access to a vehicle; 28.11% [24.78,31.7] had access to one vehicle; 17.94% [15.21,21.05] had access to three vehicles; and, 4.59% [3.34,6.27] had access to four or more vehicles to drive. No significant differences were found among subgroups of young drivers with respect to the type of vehicle that they drove. However, results of a logistic regression analysis revealed differences among subgroups of young drivers with respect to the number of cars they had access to (see Figure 5-36 in Appendix A). An odds ratio of 0.59 (p=0.01) was found for drivers who did not complete BDE compared to those who completed BDE and took a time discount with respect to whether or not they had access to at least three vehicles. This means that drivers who did not complete BDE had a 41% ((1-0.59)*100) decrease in the odds that they would have access to at least 3 cars, compared to those who completed BDE and took a time discount. These results imply, that in general, drivers who completed BDE and took a time discount had access to a greater number of vehicles During the G1 licence period, who served most often as the experienced driver accompanying the young driver? In this subsection, we identify the individual(s) who most often served as supervising drivers to young drivers during the G1 licence period. Participants were asked to indicate, from a specified list, the individual who served as the supervising driver most often during their G1 licence stage. Figure 5-37 shows the results of the univariate analysis. Parents (i.e., mothers or fathers) were found to be the primary supervising driver to young drivers most often during the G1 34
47 stage (mothers and fathers serving as the primary supervising driver for 38.85% [35.22,42.6] and 44.76% [40.96,48.62] of individuals, respectively). Additionally, driving instructors were cited as the primary supervising driver to 9.57% [7.46,12.19] of young drivers during the G1 licence stage. Figure 5-37: Who served most often as the supervising driver during G1 stage? Number of strata = 24 Number of obs = 983 Number of PSUs = 983 Population size = Design df = 959 Who is/was the supervising driver most often during G1? percentages lb ub other (please specify) mother father older sibling other relative friend driving instructor drove alone did not drive during this period Total 100 Key: percentages = cell percentages lb = lower 95% confidence bounds for cell percentages ub = upper 95% confidence bounds for cell percentages How many combined hours did the driver spend under supervision (i.e., parents/guardians, other adults, driving instructor, etc.)? This subsection examines the amount of time that young drivers spent under supervision while learning to drive. The number of hours of supervision per month, the amount of additional G2 supervision, as well as the amount of unsupervised driving during the G1 licence stage is examined. Monthly supervised driving practice. Results of the univariate analysis showed that the majority of young drivers received between 0 and 20 hours of supervised driving practice per month during the G1 licence stage (see Figure 5-38 in Appendix A). Approximately 41.01% [37.3,44.83] of young drivers received between 0-10 hours of supervision per month; 32.59% [29.07,36.32] received hours; 12.98% [10.60,15.82] received hours; 6.65% [5.00,8.80] received hours; 3.83% [2.68,5.46] received hours; and, 2.93% [1.93,4.43] received over 51 hours of monthly supervised driving during their G1 licence stage. A logistic regression analysis was conducted to evaluate the differences among subgroups of young drivers between those drivers who indicate that they received either 0-10 hours, or more than 10 hours of supervision per month during their G1 licence stage (see Figure 5-39 in Appendix A). Results of this analysis revealed an odds ratio of 0.65 (p=0.02) 35
48 between drivers who completed BDE and took a time discount and those who did not complete BDE. In other words, young drivers who did not complete BDE had a 35% ((1-0.65)*100) decrease in the likelihood of getting more than 10 hours of supervised driving practice per month compared to drivers who completed BDE with a time discount. No significant differences were found, in this case, between these two subgroups and drivers who completed BDE without taking a time discount. As indicated in the background section of this report, supervised driving practice is an essential component of GDL, and these results indicate that drivers who completed BDE and took a time discount were more likely to engage in supervised driving practice compared to the other two targeted subgroups. Additional supervised driving practice. Results showed that almost half of young drivers received additional supervised driving practice once they obtained their G2 licence (see Figure 5-40 in Appendix A). About 45.31% [41.36,49.31] of G2 drivers indicated that they received this additional practice. Unsupervised driving. The majority of drivers (77.16% [73.73,80.27]) said that they never drove without a supervising driver during the G1 licence stage. This is consistent with Ontario s graduated licensing law which requires all G1 drivers to be accompanied by a qualified supervising driver (Ministry of Transportation, Ontario 2014). However, almost one in four drivers (around 23%) admitted to driving without a supervising driver during the G1 licence stage. In this regard, univariate analysis results (see Figure 5-41 in Appendix A) revealed that 4.41% [2.99,6.47] of young drivers said that they drove unsupervised once per month during their G1 licence stage; 7.48% [5.68,9.80] did this once per week; 7.83% [6.01,10.15] said drove unsupervised several times per week; and, 3.11% [2.04,4.71] drove unsupervised during the G1 licence stage almost every day during the average month. No significant differences were found between subgroups of young drivers in this instance. Results from drivers who indicated that they drove on 400-series highways during their G1 licence period and from those who indicated that they drove unsupervised during their G1 licence period were compared to determine whether or not the same drivers were likely to engage in these two risky behaviours. Using logistic regression analysis (see Figure 5-42 in Appendix A), a significant odds ratio of 2.23 (p<0.01) was found, indicating that drivers who drove on 400-series highways during their G1 licence period were 123% ((2.23-1)*100) more likely to also drive without a supervising driver at least once per month during their G1 licence period compared to those who did not engage in these behaviours. This suggests that drivers who ignored the restrictions of the G1 driver licence period and drove on 400-series highways also ignored the restrictions requiring all G1 drivers to have a qualified supervisor in the vehicle when driving Did the driver s parents/guardians establish any rules for driving a vehicle? This subsection analyzes the influence of parents/guardians in establishing rules for younger drivers while they are driving. The analysis differentiates between the rules applying to G1 and G2 drivers, as well as across subgroups of drivers. 36
49 The questionnaire asked participants to indicate whether or not their parents restricted the hours that they had access to a vehicle; whether or not their parents enforced a curfew when they were driving; and, how many teenagers their parents allowed them to have in the vehicle while they were driving during the G1 and G2 licence periods. Approximately 51.61% [39.72,63.33] of G1 drivers indicated that their parents/guardians restricted the number of hours they had access to a vehicle, compared to 38.36% [34.47,42.4] of G2 drivers (see Figures 5-43 & 5-44 in Appendix A). Results did not show significant differences within subgroups of drivers. Slightly more than half of G1 and G2 drivers said they had a curfew (i.e., a set time by which they must be home), enforced by their parents, when they were driving (see Figures 5-45 & 5-46 in Appendix A). A slightly larger percentage of G1 drivers (51.04% [39.08,62.89]) said they had a curfew when driving compared to G2 drivers (44.99% [40.95,49.11]). Results of a logistic regression analysis did not show significant differences within subgroups of drivers. The number of teen passengers allowed in the vehicle of young G1 and G2 drivers by parents/guardians was evaluated using a univariate analysis (see Figures 5-47 & 5-48 in Appendix A). More than one-quarter (27.87% [24.46,31.55]) of G1 drivers were not allowed to have any teenage passengers in the vehicle when they were driving, compared to 2.58% [1.59,4.17] of G2 drivers whose parents/guardians enforced this same restriction. Conversely, only 1.58% [0.93,2.67] of G1 drivers were allowed four or more teenage passengers in the vehicle while driving, compared to 26.38% [22.95,30.11] of G2 drivers. It should also be noted that 40.44% [36.43,44.59] of G2 drivers indicated that they did not know or never asked their parents about the number of teen passengers they were allowed to have in the vehicle when driving. This suggests that many parents did not speak to G2 licenced drivers about the number of teenage passengers they were allowed to have in the vehicle. Results of a logistic regression analysis between drivers who were or were not allowed to have any teens in the vehicle during G1 and G2 licence periods did not reveal any differences among the three targeted subgroups of young drivers. This result suggests that the BDE program may have been a missed opportunity to promote parental involvement and awareness of the risks associated with teenage passengers during the time period of learning how to drive. In other words, the BDE program could be enhanced to better serve as a means to provide parents and new drivers with important information about the risks associated with teenage passengers How often do young drivers parents/guardians or other family members talk to them about traffic safety/rules? Participants were asked several questions related to conversations that they had with their parents/guardians about driving. Specifically, participants were asked how often they talked about traffic safety and rules; and whether or not they had talked about drinking and driving, texting and driving, and distracted driving. 37
50 The univariate analysis results indicated that parents do talk to young drivers about traffic safety and rules of the road often (see Figure 5-49 in Appendix A). Overall, approximately 70.46% [66.79,73.89] of young drivers said that their parents/guardians have talked to them several times about traffic safety and rules of the road. Additionally, 24.92% [21.7,28.44] of young drivers said that their parents have talked to them about traffic safety and the rules of the road once or twice, and 4.62% [3.17,6.69] of drivers said their parents had never talked to them about these topics. Within subgroups, differences were found. Bivariate analysis results showed that a majority (83.76% [77.8,88.36]) of non-bde drivers said their parents had talked to them several times about these issues, compared to 66.87% [61.84,71.54] and 66.99% [58.82,74.24] of drivers who had completed BDE with and without taking a time discount, respectively. A logistic regression analysis was performed to evaluate the differences between drivers who indicated that their parents/guardians had talked to them about traffic safety and rules of the road Several times and Once or twice, or Never (see Figure 5-50 in Appendix A). The logistic regression model produced odds ratios of 0.39 (p<0.01) for BDE drivers who took a time discount and 0.42 (p<0.01) for BDE drivers who did not take a time discount compared to non-bde drivers. In other words, young drivers who completed BDE and took a time discount have an approximate 61% ((1-0.39)*100) decrease in the odds of talking with their parents about traffic safety and rules of the road several times, compared to drivers who did not complete BDE. Similarly, drivers who completed BDE without taking a time discount had a 58% ((1-0.42)*100) decrease in the likelihood of talking about these topics with their parents compared to non-bde drivers. This suggests that drivers who did not complete BDE are more likely to talk to their parents frequently about traffic safety and the rules of the road compared to drivers who completed BDE with and without a time discount. Figures 5-51 to 5-53 show that the vast majority of young drivers have had conversations with their parents/guardians about various driving related issues. Approximately 81.33% [78.02,84.24] of young drivers reported that their parents/guardians had talked to them about drinking and driving; 82.62% [79.39,85.43] about texting and driving; and, 83.57% [80.46,86.27] about distracted driving. 38
51 Figure 5-51: Do parents/guardians talk to young drivers about drinking and driving? Number of strata = 24 Number of obs = 959 Number of PSUs = 959 Population size = Design df = 935 Have your parents ever talked to you about drinking and driving? classification yes no Total BDE w/ TD [81.31,88.87] [11.13,18.69] BDE w/o TD [68.01,81.88] [18.12,31.99] non-bde [74.32,86.12] [13.88,25.68] Total [78.02,84.24] [15.76,21.98] Key: row percentages [95% confidence intervals for row percentages] Pearson: Uncorrected chi2(2) = Design-based F(1.93, )= P = Figure 5-52: Do parents/guardians talk to young drivers about texting and driving? Number of strata = 24 Number of obs = 959 Number of PSUs = 959 Population size = Design df = 935 Have your parents ever talked to you about texting and driving? classification yes no Total BDE w/ TD [82.99,90.15] [9.855,17.01] BDE w/o TD [69.17,82.69] [17.31,30.83] non-bde [75.56,87.37] [12.63,24.44] Total [79.39,85.43] [14.57,20.61] Key: row percentages [95% confidence intervals for row percentages] Pearson: Uncorrected chi2(2) = Design-based F(1.95, )= P =
52 Figure 5-53: Do parents/guardians talk to young drivers about distracted driving other than texting and driving? Number of strata = 24 Number of obs = 959 Number of PSUs = 959 Population size = Design df = 935 Have your parents ever talked to you about distracted driving? classification yes no Total BDE w/ TD [80.96,88.53] [11.47,19.04] BDE w/o TD [73.25,85.74] [14.26,26.75] non-bde [79.12,89.79] [10.21,20.88] Total [80.46,86.27] [13.73,19.54] Key: row percentages [95% confidence intervals for row percentages] Pearson: Uncorrected chi2(2) = Design-based F(1.94, )= P = Results of three logistic regression analyses (see Figures 5-54 to 5-56 in Appendix A), controlling for gender and age differences, investigated the variance among subgroups of drivers who indicated that their parents/guardians had discussed various driving issues with them (i.e., drinking and driving, texting and driving, and distracted driving). The first analysis looked at the differences among the three subgroups who said that their parents had talked to them about drinking and driving. An odds ratio of 0.55 (p=0.01) was found between drivers who completed BDE without taking a time discount and those who took a time discount. This means that BDE drivers who did not take a time discount had 45% ((1-0.55)*100) decreased odds of having a conversation with their parents about drinking and driving compared to drivers who completed BDE and took a time discount. No significant difference was found between either of these two subgroups and drivers who did not complete BDE. The second logistic regression analysis evaluated the significance between subgroups of young drivers who said that their parents had talked to them about texting and driving. As with the drinking and driving issue, significant differences were found between drivers who completed BDE and took a time discount and those who completed BDE and did not take a time discount, but not compared to non-bde drivers. An odds ratio of 0.52 (p=0.01) indicates that drivers who completed BDE and did not take a time discount were 48% ((1-0.52)*100) less likely than drivers who completed BDE and took a time discount to talk to their parents/guardians about texting and driving. The third regression analysis revealed no significant differences among the three subgroups of drivers for those drivers who said 40
53 that their parents/guardians had talked to them about distracted driving. These results suggest that young drivers who completed BDE and took a time discount had more frequent discussions with their parents about engaging in risky behaviours while driving compared to those who completed BDE and did not take a time discount. This may be explained by an increased feeling of responsibility among parents to remind their teens not to engage in risky behaviours because they are driving independently sooner than they otherwise would How often do young drivers drive on 400-series highways? This subsection explores how often young drivers operated vehicles on 400-series highways, a network of controlled access highways spanning southern Ontario. The analysis differentiates between the time period when driving with a G1 and G2 licence, as well as differences across the three targeted subgroups (i.e., BDE with time discount, BDE without time discount, and non-bde drivers). Participants were asked to rate the frequency that they drove on 400-series highways on a scale of: Never, Once, Sometimes, Often, or Very often. Results of a univariate analysis (see Figure 5-57 in Appendix A) showed that the majority of drivers (77.31% [73.92,80.37]) indicated that they never drove on 400-series highways during their G1 licence period. This finding is consistent with Ontario s graduated licensing law restricting G1 drivers from operating vehicles on 400-series highways during this period (Ministry of Transportation, Ontario 2014). However, there was still a large percentage of young drivers (22.69%) who admitted to driving on these highways as G1 licensed drivers at least once per month. Results of the univariate analysis also indicated that G2 drivers operated vehicles on 400- series highways more often than G1 licence holders (see Figure 5-58 in Appendix A). Approximately 32.75% of G2 drivers indicated that they drove on 400-series highways often or very often. Still, approximately one-quarter (26.81% [23.30,30.63]) of G2 drivers said that they never drove on 400-series highways. A logistic regression analysis was performed to evaluate the differences among subgroups of drivers who drove Often or Very often compared to those who indicated that they drove Sometimes, Once or Never on 400-series highways in an average month (see Figure 5-59 in Appendix A). A significant difference in frequency of highway driving was found among G2 drivers who completed BDE and took a time discount and those who did not complete BDE, reporting an odds ratio of 0.48 (p<0.01). Strictly speaking, this means that G2 drivers who did not complete BDE are 52% ((1-0.48)*100) less likely to report driving on 400-series highways often or very often in the average month, than G2 drivers who completed BDE and took a time discount. Significant difference, with an odds ratio of 0.53 (p=0.01), was also found between G2 drivers who completed BDE and took a time discount and those who completed BDE without taking a time discount. This suggests that G2 drivers who completed BDE without taking a time discount are 47% ((1-0.53)*100) less 41
54 likely to drive on 400-series highways often or very often in the average month compared to those who did not take a time discount. Overall, this implies that G2 drivers who took a time discount were significantly more likely to report driving on 400-series highways compared to young drivers who did not take a time discount. No significant differences were found among the three targeted subgroups of young drivers with respect to how often they drive on 400-series highways during the G1 licence stage. The results of the same logistic regression model (see Figure 5-59 in Appendix A) also revealed significant differences between genders with respect to the frequency of driving on 400-series highways during the G2 licence stage. An odds ratio of 0.60 (p=0.01) was identified between female and male drivers. This suggests that males are significantly more likely to drive on 400-series highways during their G2 licence period compared to female drivers How much experience does the driver have in higher-risk traffic situations (i.e., night driving, hazardous weather, heavy traffic)? This subsection describes the amount of experience that young drivers had in specific traffic situations. The frequency of driving in rush hour; at night; and, in adverse weather conditions in the average month are described for G1 and G2 drivers. Participants were asked to rate the frequency of driving in these situations on a scale from Never, Once, Sometimes, Often, to Very often. Univariate analyses were performed to identify the percentage of drivers who rated the frequency that they drove in each separate higher-risk situation in the average month as Never, Once, Sometimes, Often, or Very often. Additionally, logistic regression analyses were conducted to discern whether any differences among subgroups of drivers were present. The logistic regression models identified any significant differences between those drivers who experienced these situations often (i.e., categories of Often or Very often) versus those who experienced these situations not often (i.e., categories of Never, Once, or Sometimes). Rush hour. In an average month, 27.67% [24.38,31.22] of young drivers said they never drove during rush hour during their G1 licence period; 25.52% [22.29,29.04] said they drove once per month in rush hour; 30.39% [26.92,34.09] said they drove sometimes during rush hour; 12.26% [10.09,14.83] said they drove during rush hour often; and, 4.16% [2.91,5.92] indicated that they drove very often during rush hour (see Figure 5-60). In an average month, 8.33% [6.40,10.77] of G2 drivers said they never drove during rush hour; 14.39% [11.70,17.56] indicated that they drove once per month in rush hour; 27.2% [23.65,31.07] said they drove sometimes during rush hour; 29.25% [25.65,33.12] said they drove during rush hour often; and, 20.84% [17.75,24.30] said that they drove very often during rush hour (see Figure 5-61). Comparing the frequencies of rush hour driving between the G1 and G2 licence periods indicated that G2 drivers were significantly more frequently exposed to rush hour situations than G1 licenced drivers. 42
55 Results of a logistic regression analysis showed differences among the three targeted subgroups of drivers between those who said that they drove during rush hour in the G1 licence period often or very often and drivers who indicated that they did not often do so (see Figures 5-62 & 5-63 in Appendix A). An odds ratio of 0.53 (p=0.03) was found between BDE drivers who took a time discount and BDE drivers who did not take a time discount, meaning that G1 drivers who completed BDE and did not take a time discount were 47% less likely to drive often or very often during rush hour compared to G1 drivers who completed BDE and took a time discount. No significance was found between subgroups of drivers who completed BDE compared to those who did not complete BDE. Results of a logistic regression analysis, controlling for gender and age, revealed similar variances among subgroups of G2 drivers, with an odds ratio of 0.65 (p=0.04) between drivers who completed BDE without taking a time discount and drivers who completed BDE and took a time discount. This indicates that, among drivers who completed BDE, those who took a time discount were significantly more likely to be exposed to rush hour driving compared to those who did not take a time discount during both the G1 and G2 licence stage. Figure 5-60: How often do young drivers operate vehicles during rush hour during G1? Number of strata = 24 Number of obs = 974 Number of PSUs = 974 Population size = Design df = 950 How often do/did you drive during rush hour classification during G1? BDE w/ TD BDE w/o TD non-bde Total Never [17.12,25.48] [24.77,39.56] [29.51,43.3] [24.38,31.22] Once [21.61,30.65] [18.52,32.67] [19.86,32.39] [22.29,29.04] Sometimes [28.2,37.96] [25.19,40.48] [16.61,28.41] [26.92,34.09] Often [12.02,19.58] [4.886,13.18] [7.992,16.65] [10.09,14.83] Very Often [2.998,7.624] [1.114,7.259] [2.578,8.307] [2.905,5.921] Total Key: column percentages [95% confidence intervals for column percentages] Pearson: Uncorrected chi2(8) = Design-based F(7.51, )= P =
56 Figure 5-61: How often do young drivers operate vehicles during rush hour during G2? Number of strata = 20 Number of obs = 853 Number of PSUs = 853 Population size = Design df = 833 How often do/did you drive during rush hour classification during G2? BDE w/ TD BDE w/o TD non-bde Total Never [4.724,9.693] [5.003,14.61] [8.678,19.44] [6.401,10.77] Once [9.966,16.83] [11.21,24.11] [9.172,20.31] [11.7,17.56] Sometimes [22.34,31.42] [22.65,38.41] [16.57,30.03] [23.65,31.07] Often [28.39,38.21] [18.4,33.22] [18.67,32.93] [25.65,33.12] Very Often [16.54,24.98] [13.89,26.98] [18.92,32.94] [17.75,24.3] Total Key: column percentages [95% confidence intervals for column percentages] Pearson: Uncorrected chi2(8) = Design-based F(7.15, )= P = Night-time driving. As part of the GLS program in Ontario, G1 drivers are allowed to drive at night, but not between the hours of midnight and 5 a.m. In an average month, 23.54% [20.38,27.03] of young drivers said they never drove at night during their G1 licence period; 17.92% [15.13,21.10] said they drove once per month at night; 31.16% [27.69,34.84] said they drove sometimes at night; 19.21% [16.54,22.18] said they often drove at night; and, 8.17% [6.43,10.33] said that they drive very often at night (see Figure 5-64). During the G2 licence period, Ontario drivers aged 19 and under are allowed to drive between midnight and 5 a.m., but only with a restricted number of teenage passengers in the vehicle. In an average month, 4.35% [2.95,6.38] of G2 drivers indicated that they never drove at night; 5.89% [4.03,8.53] said they drove once per month at night; 15.10% [12.37,18.30] said they drove sometimes at night; 30.51% [26.9,34.38] said they drove at night often; and, 44.15% [40.15,48.22] said they drove very often at night (see Figure 5-65). These results indicate that young drivers gained significantly more exposure to nighttime driving during their G2 licence period, compared to when they were driving with their G1 licence. To some extent, the lower frequency of driving at night in the G1 licence period may result from the restriction that G1 drivers not drive between midnight and five a.m. 44
57 A logistic regression analysis was conducted to examine the differences among the three subgroups of drivers with regards to the frequency that they exhibited driving at night during their G1 licence period (see Figure 5-66 in Appendix A). The analysis examined the difference between drivers who indicated that they often drove at night, compared to those who did not often drive at night. Significant variance was found in the G1 licence stage between drivers who completed BDE and took a time discount and those who completed BDE and did not take a time discount, with an odds ratio of 2.50 (p<0.01). This means that drivers who completed BDE and took a time discount had a 150% ((2.50-1)*100) increase in the odds that they will drive at night often or very often during their G1 licence period compared to drivers who completed BDE and did not take a time discount. Similarly, an odds ratio of 2.32 (p<0.01) was found between non-bde drivers and those who completed BDE without taking a time discount. In other words, non-bde drivers had a 132% ((2.32-1)*100) increase in the likelihood that they will drive at night often or very often during their G1 licence period compared to drivers who completed BDE without taking a time discount. This is an interesting finding due to the fact that the results indicate that drivers who completed BDE and took a time discount were more similar to drivers who did not complete BDE, than drivers who completed BDE without taking a time discount. One possible explanation for this occurrence could be that those drivers who completed BDE and took a time discount were more confident in their skills during their G1 licence period compared to those who did not take a time discount by virtue of the fact that they expected to obtain their G2 licence early. Similarly, drivers who did not complete BDE may have had misplaced confidence in their abilities to begin with, leading to overconfidence compared to drivers who completed BDE without taking a time discount. On the other hand, it is also possible that this over-confidence could actually be attributed to other factors, such as parental beliefs that their teen was prepared to drive at night, and not necessarily the perceptions of the teens themselves. Results of this logistic regression model also demonstrated that there were significant differences between genders with respect to the frequency of driving at night during the G1 licence period. An odds ratio of 0.68 (p<0.01) was found for females, compared to male drivers. This suggests that young female drivers were 32% ((1-0.68)*100) less likely than males to drive at night often or very often during the G1 licence stage. A second logistic regression analysis was conducted to evaluate the frequency of nighttime driving (i.e., often vs. not often) during the G2 licence stage (see Figure 5-67 in Appendix A). Results indicated that those drivers who completed BDE and took a time discount had increased odds of reporting driving at night during the G2 licence stage compared to drivers who completed BDE without taking a time discount and those who did not complete BDE. An odds ratio of 0.56 (p=0.01) was found between drivers who completed BDE without taking a time discount and those who completed BDE and took a time discount, indicating that drivers who completed BDE without taking a time discount had a 44% ((1-0.56)*100) decrease in the odds of driving at night often or very often compared to BDE drivers who took a time discount. Additionally, an odds ratio of
58 (p=0.02) showed the significance between drivers who completed BDE with a time discount and those who did not complete BDE, implying that those drivers who did not complete BDE had a 42% ((1-0.58)*100) decrease in the likelihood that they would drive at night often or very often compared to drivers who completed BDE and took a time discount. The difference in variance among subgroups of drivers between the G1 and G2 licence periods may be explained by the hypothesis that once drivers enter the G2 licence stage, those who took a time discount may feel an increased sense of confidence, by virtue of having obtained their G2 licence sooner, and therefore feel that they are more prepared to drive at night compared to other young drivers. Conversely, young drivers may have obtained a time discount because they perceived a stronger need to drive unsupervised at night. Contrary to the variance found between genders during the G1 licence period, no significant differences were found among males and females with respect to the frequency of night-time driving during the G2 licence period. Figure 5-64: How often do young drivers operate vehicles at night during G1? Number of strata = 24 Number of obs = 974 Number of PSUs = 974 Population size = Design df = 950 How often do/did you drive at night classification during G1? BDE w/ TD BDE w/o TD non-bde Total Never [11.87,19.49] [24.52,39.44] [23.14,36.77] [20.38,27.03] Once [17.52,26.27] [11.17,23.06] [8.32,18.35] [15.13,21.1] Sometimes [24.64,34.03] [28.52,43.91] [22.69,35.19] [27.69,34.84] Often [17.99,26.29] [9.736,20.01] [15.88,27.51] [16.54,22.18] Very Often [9.164,15.97] [.7324,6.879] [5.366,12.81] [6.431,10.33] Total Key: column percentages [95% confidence intervals for column percentages] Pearson: Uncorrected chi2(8) = Design-based F(7.44, )= P =
59 Figure 5-65: How often do young drivers operate vehicles at night during G2? Number of strata = 20 Number of obs = 853 Number of PSUs = 853 Population size = Design df = 833 How often do you drive at night during classification G2? BDE w/ TD BDE w/o TD non-bde Total Never [1.744,5.588] [2.366,10.09] [3.948,13.33] [2.951,6.38] Once [.8624,3.48] [7.71,19.89] [2.19,10.34] [4.031,8.531] Sometimes [12.04,19.64] [8.47,20.47] [12.49,25.18] [12.37,18.3] Often [30.22,40.12] [21.78,36.86] [13.11,24.91] [26.9,34.38] Very Often [39.59,49.83] [32.44,48.8] [43.5,59.51] [40.15,48.22] Total Key: column percentages [95% confidence intervals for column percentages] Pearson: Uncorrected chi2(8) = Design-based F(7.25, )= P = Adverse weather. Results of a univariate analysis revealed that, in an average month, 29.23% [25.82,32.89] of young drivers said they never drove in adverse weather conditions during their G1 licence period; 33.56% [30,37.33] said they drove once per month in adverse weather; 25.88% [22.71,29.32] said they drove sometimes in adverse weather; 8.75% [6.90,11.02] said they often drove in adverse weather; and, 2.59% [1.68,3.97] said they drove very often in adverse weather conditions (see Figure 5-68). In an average month, 10.01% [7.67,12.96] of G2 drivers indicated that they never drove in adverse weather; 13.86% [11.24,16.99] said they drove once per month in adverse weather; 33.43% [29.67,37.40] said they sometimes drove in adverse weather; 28.19% [24.63,32.05] said they drove in adverse weather often; and, 14.50% [11.97,17.47] said that they drove very often in adverse weather (see Figure 5-69). Comparing the frequencies of results between G2 and G1 exposure suggests that young drivers were significantly more exposed to adverse weather conditions during their G2 licence period, compared to when they were driving during their G1 licence period. A logistic regression analysis found significance in the frequency of driving in adverse weather conditions (often vs. not often) between subgroups of drivers during the G1 licence period (see Figure 5-70 in Appendix A). An odds ratio of 0.40 (p=0.01) was found between drivers who completed BDE and took a time discount and those who completed BDE and did not take a time discount. This means that among drivers who completed BDE, 47
60 those who did not take a time discount experienced a 60% ((1-0.40)*100) decrease in the odds of driving in adverse weather conditions often or very often during their G1 licence period, compared to those who decided to take a time discount and obtain their G2 licence early. A significant odds ratio of 2.36 (p=0.03) was also found between drivers who did not complete BDE and those who completed BDE without taking a time discount. This suggests, again, that drivers who did not complete BDE had a 136% ((2.36-1)*100) increase in the likelihood of driving in adverse weather compared to drivers who completed BDE without taking a time discount. Additionally, females were found to be significantly less likely to drive in adverse weather conditions during their G1 licence stage compared to male drivers, with an odds ratio of 0.56 (p=0.02). The logistic regression analysis revealed no significant differences among subgroups of drivers with respect to the frequency of driving in adverse weather conditions (often vs. not often) during their G2 licence period (see Figure 5-71 in Appendix A). As well, no significant differences between genders were identified in this model, as opposed to driving during the G1 licence period. Across all of these higher-risk driving situations, the results revealed clear indications that drivers who completed BDE and took a time discount were more frequently exposed to higher-risk traffic situations compared to those drivers who completed BDE without taking a time discount. This increased exposure to risky situations during the G1 and G2 licence periods suggests that teens taking a time discount are more likely to put themselves and others at risk. 48
61 Figure 5-68: How often do young drivers operate vehicles in adverse weather conditions during G1? Number of strata = 24 Number of obs = 974 Number of PSUs = 974 Population size = Design df = 950 How often do/did you drive in adverse weather classification during G1? BDE w/ TD BDE w/o TD non-bde Total Never [18.24,26.9] [26.68,42.01] [30.52,44.59] [25.82,32.89] Once [30.78,40.73] [29.15,44.81] [19.04,30.97] [30,37.33] Sometimes [23.25,32.45] [17.29,30.42] [20.24,32.96] [22.71,29.32] Often [9.156,15.93] [2.31,9.473] [4.511,11.86] [6.9,11.02] Very Often [1.221,4.557] [.4449,4.872] [2.511,8.65] [1.676,3.973] Total Key: column percentages [95% confidence intervals for column percentages] Pearson: Uncorrected chi2(8) = Design-based F(7.59, )= P = Figure 5-69: How often do young drivers operate vehicles in adverse weather conditions during G2? Number of strata = 20 Number of obs = 853 Number of PSUs = 853 Population size = Design df = 833 How often do/did you drive in adverse weather classification during G2? BDE w/ TD BDE w/o TD non-bde Total Never [3.915,8.943] [10.09,22.86] [7.358,18.36] [7.674,12.96] Once [9.278,16.2] [9.645,21.8] [11.99,24.74] [11.24,16.99] Sometimes [31.6,41.54] [23.82,39.5] [21.35,35.79] [29.67,37.4] Often [23.92,33.28] [22.55,37.98] [17.94,31.06] [24.63,32.05] Very Often [13.34,21.24] [5.345,14.95] [13.33,26] [11.97,17.47] Total Key: column percentages [95% confidence intervals for column percentages] Pearson: Uncorrected chi2(8) = Design-based F(7.20, )= P =
62 How do young drivers perceive their driving ability (i.e., before/after or without BDE program)? The following subsection explores how young drivers perceive their own driving abilities, as well as the impact of BDE on specific driving skills. Participants were asked to rate their driving abilities, prior to completing BDE, with respect to specific driving behaviours (e.g., merging, making left turns at intersections), on a scale from very poor to very good. They were subsequently asked to rate their abilities with respect to those behaviours on the same scale, after having completed BDE. Participants who did not complete BDE were also asked to rate their own driving abilities with respect to these behaviours. Univariate analyses were performed to identify the percentage of drivers who rated each separate behaviour as Very poor, Poor, Fair, Good, or Very good. Additionally, logistic regression analyses were conducted to discern whether any differences among subgroups of drivers were present. The logistic regression revealed any significant differences between those drivers who perceived their abilities as good (i.e., categories of Good or Very good) versus those who perceived their abilities as not good (i.e., categories of Very poor, Poor, or Fair). Subsequent logistic regression analyses were performed for each skill to identify the variance between the drivers ratings of their ability before versus after completing the BDE program, as well as the differences in ratings between drivers who did not complete BDE versus the ratings of drivers who did complete BDE. This allowed for a comparison of how young drivers perceived the impact of completing BDE on their driving skills and knowledge. Merging. Results of a univariate analysis found that among young drivers who have completed BDE, 6.29% [4.20,9.31] rated their ability to merge into traffic before having enrolled in BDE as very poor; 21.17% [17.26,25.69] as poor; 38.76% [33.97,43.77] as fair; 27.11% [22.93,31.74] as good; and, 6.68% [4.51,9.79] as very good (see Figure 5-72 in Appendix A). Among all drivers who completed BDE, less than 1% [0.01,0.44] rated their ability to merge into traffic after having completed BDE as very poor; 1.65% [0.77,3.49] rated this ability as poor; 7.71% [5.52,10.65] as fair; 45.33% [40.91,49.83] as good; and, 45.25% [40.91,49.66] as very good (see Figure 5-73 in Appendix A). Results of a logistic regression analysis did not reveal any significant differences in the perceived merging abilities between drivers who completed BDE with and without taking a time discount. However, it did show a significant odds ratio of 0.48 (p<0.01) for females, compared to males, with respect to how they rated their merging abilities before enrolling in BDE (see Figure 5-74 in Appendix A). This indicates that female drivers rated their merging abilities before BDE significantly lower than young male drivers. This difference was not found to be significant in the ratings of merging abilities after BDE. A logistic regression analysis, controlling for gender, age and BDE status with or without a time discount, was conducted to examine differences in how young drivers rated their 50
63 ability to merge into traffic before and after completing BDE (see Figure 5-75 in Appendix A). The results showed an odds ratio of 1.60 (p<0.01) between the ratings of merging skills before and after BDE. In other words, young drivers who have completed BDE had 60% ((1.60-1)*100) increased odds that they will rate their merging skills as good or very good after completing BDE, compared to before they completed BDE. Overall, this implies that young drivers believed that their merging skills improved after having completed the BDE course. Another logistic regression analysis was conducted to examine an interaction effect with respect to how drivers who completed BDE and took a time discount and drivers who completed BDE without taking a time discount rated their abilities to merge into traffic safely before and after completing BDE (see Figure 5-76 in Appendix A). No significant variances between these two subgroups were found, indicating that drivers who completed BDE and took a time discount did not rate their abilities to merge into traffic safely after BDE compared to before BDE significantly different than drivers who completed BDE without taking a time discount. In other words, the difference between the ratings of merging skill before and after completing BDE were not significantly different among those who took a time discount compared to those who did not take a time discount. Drivers who did not complete BDE were also asked to rate their ability to merge into traffic safely. There were no participants in the non-bde group who rated their ability to merge into traffic as very poor; 4.39% [1.97,9.47] rated their merging abilities as poor; 19.51% [14.18,26.24] as fair; 38.1% [31.30,45.40] as good; and, 38.00% [31.91,44.49] of the participants rated their merging ability as very good (see Figure 5-77 in Appendix A). When comparing these percentages to the ratings of young drivers who have completed BDE, it is clear that a larger percentage of BDE drivers rated their ability to merge into traffic safely as good or very good, compared to drivers who did not complete BDE. Results of an additional logistic regression analysis, controlling for gender and age differences, revealed an odds ratio of 1.84 (p=0.01) for the merging skill rating of young drivers after completing BDE compared to those who did not complete BDE (See Figure 5-78 in Appendix A). This means that young drivers who completed BDE with and without taking a time discount were 84% ((1.84-1)*100) more likely to rate their merging abilities as good or very good after completing BDE compared to those drivers who did not complete BDE. Making left turns at intersections. Among drivers who completed BDE, 4.20% [2.59,6.76] rated their ability to make left turns at intersections before having enrolled in BDE as very poor; 17.00% [13.51,21.17] as poor; 35.64% [30.97,40.61] as fair; 31.79% [27.29, 36.65] as good; and, 11.37% [8.49,15.07] as very good (see Figure 5-79 in Appendix A). Of all drivers who completed BDE, less than 1% [0.04,1.08] rated their ability to make left turns at intersections after having completed BDE as very poor; 0.99% [0.35,7.92] as poor; 51
64 5.31% [3.53,7.92] as fair; 37.03% [32.82,41.46] as good; and, 56.47% [52.02,60.82] rated their abilities as very good (see Figure 5-80 in Appendix A). Results of a logistic regression analysis did not reveal any significant differences in the perceived left turning abilities (either before or after completing BDE) between drivers who completed BDE with and without taking a time discount. However, it did reveal a significant odds ratio of 0.58 (p=0.01) for females, compared to males, with respect to how they rated their turning abilities before enrolling in BDE (see Figure 5-81 in Appendix A). Similar to the gender differences in merging ability ratings before enrolling in BDE, this suggests that female drivers also rated their left turning abilities before BDE significantly lower than young male drivers. This difference was not statistically significant in the ratings of left turning abilities at intersections after completing BDE. A logistic regression analysis, controlling for gender, age and BDE status with or without a time discount, was conducted to examine differences in how young drivers rated their ability to make left turns at intersections before versus after completing BDE (see Figure 5-82 in Appendix A). The results showed an odds ratio of 1.51 (p<0.01) between the ratings of turning skills before and after completing BDE. In other words, young drivers who completed BDE had 51% ((1.51-1)*100) increased odds that they would rate their ability to make left turns as good or very good after completing BDE, compared to the ratings of their skills before they completed BDE. Another logistic regression analysis was conducted to examine an interaction effect with respect to how drivers who completed BDE and took a time discount and drivers who completed BDE without taking a time discount rated their abilities to make left turns at intersections before and after completing BDE (see Figure 5-83 in Appendix A). No significant variance between these two subgroups was found, indicating that drivers who completed BDE and took a time discount did not rate their abilities to make left turns at intersections after as compared to before BDE significantly differently than drivers who completed BDE without taking a time discount. There were no participants in the non-bde group who rated their ability to make left turns at intersections as very poor; 1.26% [0.29,5.40] rated their left turn ability as poor; 21.17% [15.88,27.63] as fair; 33.15% [26.67,40.34] as good; and, 44.42% [38.09,50.95] as very good (see Figure 5-84 in Appendix A). Again, results of the univariate analysis revealed that a smaller percentage of drivers who did not complete BDE rated their left turn abilities as good or very good compared to drivers who completed BDE with and without taking a time discount. To confirm the significance of this observation, a logistic regression analysis was conducted to evaluate the variance between the left turning skill ratings of drivers who did not complete BDE versus the ratings of drivers after having completed BDE (see Figure 5-85 in Appendix A). An odds ratio of 2.03 (p<0.01) was found for the ratings of drivers who had completed BDE, compared to those drivers who had not completed BDE. These findings suggest that young drivers who completed BDE were 103% ((2.03-1)*100) more likely to 52
65 rate their left turning skills at intersections as good or very good, compared to those who did not complete BDE. Passing other cars. Among drivers who completed BDE, 6.24% [4.20,9.17] rated their ability to pass other cars safely before having enrolled in BDE as very poor; 17.31% [13.82,21.47] as poor; 33.48% [28.91,38.38] as fair; 31.40% [26.89,36.28] as good; and, 11.57% [8.63,15.36] rated their passing ability as very good (see Figure 5-86 in Appendix A). After completing BDE, less than 1% [0.16,2.35] of drivers rated their ability to pass other cars safely as very poor; 1.63% [0.69,3.83] as poor; 7.80% [5.64,10.69] as fair; 38.81% [34.58,43.21] as good; and, 51.14% [46.71,55.55] as very good (see Figure 5-87 in Appendix A). While results of a logistic regression analysis, controlling for gender and age differences, did not show any significant variance among drivers who had completed BDE with or without a time discount with respect to the ratings of their passing abilities before enrolling in BDE, they did reveal a significant difference in the ratings between genders (see Figure 5-88 in Appendix A). An odds ratio of 0.46 (p<0.01) was reported for females, compared to male drivers, meaning that females had a 54% ((1-0.46)*100) decrease in the likelihood that they will rate their passing abilities as good or very good before enrolling in BDE. A greater percentage of BDE drivers who took a time discount (56.4% [51.25,61.42]) rated their passing abilities as very good after completing BDE, compared to drivers who completed BDE but did not take a time discount (43.55% [35.85,51.58]). Results of a logistic regression analysis also showed a significant difference, with an odds ratio of 0.51 (p=0.03) between BDE drivers who took a time discount and BDE drivers who did not take a time discount in terms of whether or not they rated their ability to pass other cars as good (i.e., ratings of Good or Very good) versus not good (i.e., ratings of Very poor, Poor, or Fair) after completing BDE (see Figure 5-89 in Appendix A). These results indicate that drivers who completed BDE and did not take a time discount had approximately a 49% ((1-0.51)*100) decrease in the odds that they will perceive their ability to pass other cars as Good or Very good, compared to drivers who completed BDE and took a time discount. A logistic regression analysis, controlling for gender, age and BDE status with or without a time discount, was conducted to examine the differences in how young drivers rated their ability to pass other cars before versus after completing BDE (see Figure 5-90 in Appendix A). The results show an odds ratio of 1.45 (p=0.01) between the ratings of turning skills before and after BDE. In other words, young drivers who have completed BDE had 45% ((1.45-1)*100) increased odds that they will rate their ability to pass other cars as good or very good after completing BDE, compared to before they completed BDE. A secondary logistic regression analysis was conducted to examine an interaction effect with respect to how drivers who completed BDE and took a time discount and drivers who completed BDE without taking a time discount rated their abilities to pass other cars safely before and 53
66 after completing BDE (see Figure 5-91 in Appendix A). No significant variances between these two subgroups were found, indicating that drivers who completed BDE and took a time discount did not rate their abilities to pass other cars safely before versus after BDE significantly differently than drivers who completed BDE without taking a time discount. Of the young drivers who did not complete BDE, 0.85% [0.12,5.90] rated their ability to pass other cars as very poor; 4.89% [2.29,10.11] rated their passing abilities as poor; 20.08% [14.70,26.80] as fair; 28.03% [22.01,34.96] as good; and, 46.16% [39.60,52.85] rated this ability as very good (see Figure 5-92 in Appendix A). Once again, a larger percentage of young drivers who completed BDE rated their ability to pass other cars as good or very good, compared to the percentage of drivers who did not complete BDE. To confirm the significance of this observation, a logistic regression analysis was conducted to evaluate the variance between the passing skill ratings of drivers who did not complete BDE versus the ratings of those drivers who completed BDE (see Figure 5-93 in Appendix A). An odds ratio of 1.90 (p<0.01) was found for the ratings of drivers who completed BDE, compared to those drivers who did not complete BDE. These findings suggest that young drivers who completed BDE were 90% ((1.90-1)*100) more likely to rate their passing abilities as good or very good, compared to those who did not complete BDE. Knowledge of right of way rules. Among drivers who completed BDE, 5.31% [3.55,7.87] rated their knowledge of who has right of way on the road before having enrolled in BDE as very poor; 12.92% [9.94,16.63] as poor; 30.30% [25.96,35.03] as fair; 34.21% [29.6,39.15] as good; and, 17.25% [13.63,21.6] rated their knowledge as very good (see Figure 5-94 in Appendix A). Among all drivers who completed BDE, less than 1% [0.07,2.00] rated their knowledge of who has right of way on the road after completing BDE as very poor; 0.62% [0.23,1.62] as poor; 5.35% [3.59,7.91] as fair; 31.09% [27.11,35.37] as good; and, 62.56% [58.11,66.81] as very good (see Figure 5-95 in Appendix A). Results of a logistic regression analysis revealed no significant differences between the ratings (i.e., before or after completing BDE) of drivers who completed BDE and took a time discount compared to drivers who completed BDE and did not take a time discount. As opposed to the differences found between genders for previous skills, no difference between genders was found as a result of the logistic regression analysis, in this instance, of young drivers ratings of their right of way knowledge before or after completing BDE. A logistic regression analysis, controlling for gender, age and BDE status with or without a time discount, was conducted to examine differences in how young drivers rated their knowledge of right of way rules before versus after completing BDE (see Figure 5-96 in Appendix A). The results showed an odds ratio of 1.39 (p=0.02) between the perception of right of way knowledge before and after BDE. In other words, young drivers who had completed BDE had 39% ((1.39-1)*100) increased odds that they would rate their knowledge of right of way rules as good or very good after completing BDE, compared to 54
67 before they completed BDE. Another logistic regression analysis was conducted to examine an interaction effect with respect to how drivers who completed BDE and took a time discount and drivers who completed BDE without taking a time discount rated their knowledge of right of way rules before and after completing BDE (see Figure 5-97 in Appendix A). No significant variances between these two subgroups were found, indicating that drivers who completed BDE and took a time discount did not rate their knowledge of right of way rules before and after BDE significantly differently than drivers who complete BDE without taking a time discount. Within the young driver population who did not complete BDE, approximately 1% [0.08,3.87] rated their knowledge of who has right of way on the road as poor; 22.75% [16.97,29.8] rated their right of way knowledge as fair; 29.87% [23.87,36.66] as good; and, 46.82% [39.81,53.96] perceived their knowledge of who has right of way on the road as very good (see Figure 5-98 in Appendix A). As well, no participants in the non-bde group rated their knowledge of right of way rules as very poor. From the results of the bivariate analyses it was found that, once again, a greater percentage of young drivers who completed BDE rated their right of way knowledge as good or very good compared to the percentage of young drivers who did not complete BDE. To further test the significance of this observation, a logistic regression analysis was conducted (see Figure 5-99 in Appendix A). An odds ratio of 3.01 (p<0.01) was found for the after ratings of drivers who completed BDE, compared to the ratings of those drivers who did not complete BDE. These findings suggest that young drivers who completed BDE are 201% ((3.01-1)*100) more likely to rate their knowledge of right of way rules as good or very good, compared to those who did not complete BDE. Vehicle handling. Among drivers who completed BDE, 2.15% [1.12,4.07] rated their vehicle handling abilities before having enrolled in BDE as very poor; 11.42% [8.55,15.10] as poor; 33.06% [28.54,37.91] as fair; 36.67% [31.96,41.64] as good; and, 16.70% [13.34,20.71] as very good (see Figure in Appendix A). Among all drivers who completed BDE, less than 1% [0.02,1.19] rated their vehicle handling abilities after having completed BDE as very poor; less than 1% [0.07,2.00] as poor; 3.23% [1.86,5.54] as fair; 32.11% [28.06,36.44] as good; and, 64.12% [59.76,68.25] perceived their vehicle handling skills to be very good (see Figure in Appendix A). Results of logistic regression analyses, controlling for gender and age differences, revealed no significant differences among drivers who completed BDE and took a time discount compared to drivers who completed BDE and did not take a time discount. A logistic regression analysis, controlling for gender, age and BDE status with or without a time discount, was conducted to examine the differences in how young drivers rated their vehicle handling skills before versus after completing BDE (see Figure in Appendix A). The results show an odds ratio of 1.45 (p=0.01) between the ratings of vehicle handling skills before and after BDE. In other words, young drivers who have completed BDE had 55
68 45% ((1.45-1)*100) increase in the odds that they will rate their vehicle handling abilities as good or very good after completing BDE, compared to before they completed BDE. A secondary logistic regression analysis was conducted to investigate an interaction effect with respect to how drivers who completed BDE and took a time discount and drivers who completed BDE without taking a time discount rated their vehicle handling abilities before and after completing BDE (see Figure in Appendix A). No significant variances between these two subgroups were found, meaning that drivers who completed BDE and took a time discount did not rate their vehicle handling abilities before as compared to after BDE significantly differently than drivers who completed BDE without taking a time discount. Among all young drivers who did not complete BDE, less than 1% [0.12,5.90] rated their vehicle handling abilities as poor; 11.27% [7.08,17.46] rated their vehicle handling as fair; 31.43% [25.13,38.50] as good; and, 56.45% [49.64,63.02] as very good. There were no participants in the non-bde group who rated their vehicle handling abilities as very poor (see Figure in Appendix A). A larger percentage of young drivers who completed BDE, approximately 96%, rated their vehicle handling abilities as good or very good after completing BDE, compared to about 88% of drivers who did not complete BDE. To confirm the statistical significance of this observation, a logistic regression analysis, controlling for age and gender, was conducted to evaluate the variance between the vehicle handling skill ratings of drivers who did not complete BDE versus the ratings of those drivers who completed BDE (see Figure in Appendix A). An odds ratio of 1.96 (p=0.03) was found for the ratings of drivers who completed BDE, compared to those drivers who did not complete BDE. These findings suggest that young drivers who completed BDE were 96% ((1.96-1)*100) more likely to rate their vehicle handling abilities as good or very good, compared to those who did not complete BDE How often do young drivers engage in risky driving behaviours, and how do they perceive them? The perception and frequency of risk taking behaviours among young drivers are analyzed in this subsection. Participants were asked to report the frequency with which they engaged in specific risky driving behaviours (e.g., speeding, texting while driving) during their G1 and G2 licence stages. Participants were asked to rate the frequency of these risky behaviours according to a scale ranging from never to very often. Since G1 drivers were assumed to be unlikely to exhibit certain behaviours while driving under supervision, only G2 drivers were asked about the frequency of engaging in the following behaviours: taking chances when driving for the fun of it; driving with one or more teenage passengers; running red lights; passing other cars because it is exciting; driving within two hours of consuming any type of drug (excluding alcohol); driving within two hours of consuming any amount of alcohol; and, driving especially close to the car in front to let its driver know that they should go faster or get out of the way. 56
69 Univariate analyses were performed to determine the percentage of drivers who engaged in these behaviours Never, Once, Sometimes, Often, or Very often. Additionally, logistic regression analyses, controlling for age and gender differences, were conducted to examine whether any variance among the three targeted subgroups of drivers was present. The logistic regression was used to identify any significant differences between those drivers who engaged in these behaviours often (i.e., categories of Often or Very often) versus those who experienced these behaviours not often (i.e., categories of Never, Once, or Sometimes). For certain behaviours (e.g., making phone calls while driving, running red lights), due to the very small number of people who responded as having engaged in these behaviours often or in instances where bivariate analysis revealed a clear relationship among subgroups, logistic regression analyses were conducted with respect to the frequency of having engaged in these behaviours never (i.e., the response option Never) versus those who engaged in these behaviours at least once (i.e., categories of Once, Sometimes, Often, or Very Often) in the average month. This allowed for a more representative sample of young drivers to be analyzed. Speeding. In an average month, during the G1 licence stage, 36.32% [32.70,40.1] of young drivers said they never speed; 20.95% [17.92,24.34] said they speed once per month; 23.38% [20.29,26.79] said they speed sometimes; 13.41% [11.04,16.21] said they speed often; and, 5.93% [4.47,7.83] said they speed very often. With respect to subgroups of drivers, 44.34% [37.20,51.72] of non-bde drivers said they never speed during their G1 licence stage, compared to 30.13% [25.61,35.07] of drivers who completed BDE and took a time discount (see Figure 5-106), indicating that a much higher percentage of drivers who completed BDE and took a time discount speed at least once per month during the G1 licence period, compared to drivers who did not complete BDE. In the average month, during the G2 licence stage, 16.17% [13.40,19.39] of young drivers said they never speed; 15.11% [12.34,18.37] speed once per month; 25.82% [22.36,29.61] speed sometimes; 20.92% [17.85,24.36] speed often; and, 21.98% [18.78,25.55] said they speed very often. Similar to the G1 licence stage, 24.33% [17.94,32.1] of non-bde drivers said they never speed during their G2 licence stage, compared to 13.82% [10.70,17.68] of drivers who completed BDE and took a time discount (see Figure 5-107). Comparing these results with those from the G1 licence period also suggest that there is an increase in the frequency that young drivers speed during their G2 licence period compared to when they were driving during their G1 licence stage. Since differences among subgroups of drivers were identified in the bivariate analyses with respect to the percentage of drivers who reported that they never speed, logistic regression analyses were conducted to confirm the differences in frequency (i.e., Never vs. At least once per month), while controlling for gender and age differences that young drivers reported speeding during the G1 and G2 licence periods. Results revealed an odds ratio of 0.65 (p=0.03) for drivers who completed BDE and did not take a time discount compared to those who completed BDE and took a time discount (see Figure in 57
70 Appendix A). This means that drivers who completed BDE but did not take a time discount had a 35% ((1-0.65)*100) decrease in the likelihood that they would speed at least one time in the average month while driving during the G1 licence period compared to those drivers who took a time discount. Similarly, an odds ratio of 0.60 (p=0.01) was found for drivers who did not complete BDE compared to those who completed BDE and took a time discount. Again, this suggests that drivers who did not complete BDE had 40% ((1-0.60))*100) decreased odds of speeding at least one time in the average month while driving during the G1 licence period. Differences were also identified among subgroups of drivers during their G2 licence period with respect to how often they engaged in speeding. An odds ratio of 0.47 (p<0.01) was found between G2 drivers who completed BDE and took a time discount and those who did not complete BDE (see Figure in Appendix A), indicating that young drivers who did not complete BDE had a 53% ((1-0.47)*100) decrease in the odds that they will speed at least one time in the average month, compared to drivers who completed BDE and took a time discount. No significant variance was found in the logistic regression analysis between drivers who completed BDE without taking a time discount compared to the other two subgroups with respect to whether or not they sped at least once in the average month during the G2 licence period. Ultimately, this suggests that drivers who completed BDE and took a time discount speed more frequently compared to drivers who did not complete BDE and, during the G1 licence period, those who completed BDE without taking a time discount. Previous research has reported that males, especially young males, are more likely to engage in speeding compared to females (GHSA 2012; Vanlaar et al. 2008). However, results of the logistic regression model described above did not show any statistically significant differences between genders with respect to whether or not they reported speeding at least once in the average month while driving during the G1 and G2 licence periods. It should be noted that this does not necessarily imply that this trend no longer exists, only that statistically significant differences were not identified in this instance, for this particular frequency of speeding. 58
71 Figure 5-106: How often do young drivers speed while driving during G1? Number of strata = 24 Number of obs = 974 Number of PSUs = 974 Population size = Design df = 950 How often do/did you speed classification during G1? BDE w/ TD BDE w/o TD non-bde Total Never [25.61,35.07] [32.37,48.04] [37.2,51.72] [32.7,40.1] Once [14.87,22.64] [17.08,31.22] [16.95,29.68] [17.92,24.34] Sometimes [24.68,34.16] [14.52,27.76] [10.87,21.11] [20.29,26.79] Often [12.18,19.84] [7.568,18.13] [7.576,15.47] [11.04,16.21] Very Often [4.478,9.642] [2.219,8.597] [4.24,10.6] [4.474,7.83] Total Key: column percentages [95% confidence intervals for column percentages] Pearson: Uncorrected chi2(8) = Design-based F(7.45, )= P = Figure 5-107: How often do young drivers speed while driving during G2? Number of strata = 20 Number of obs = 853 Number of PSUs = 853 Population size = Design df = 833 How often do/did you speed classification during G2? BDE w/ TD BDE w/o TD non-bde Total Never [10.7,17.68] [11,23.72] [17.94,32.1] [13.4,19.39] Once [8.309,14.86] [14.67,28.39] [10.84,22.89] [12.34,18.37] Sometimes [21.44,30.38] [21,36.37] [15.23,28.16] [22.36,29.61] Often [21.45,30.61] [10.64,22.81] [10.58,22.27] [17.85,24.36] Very Often [19.47,28.26] [13.18,26.78] [17.17,30.54] [18.78,25.55] Total Key: column percentages [95% confidence intervals for column percentages] Pearson: Uncorrected chi2(8) = Design-based F(7.13, )= P =
72 Texting while driving. In an average month, during the G1 licence stage, 88.75% [86.21,90.87] of young drivers said they never sent hand-held messages; 4.43% [3.23,6.05] sent hand-held messages once per month; 5.29% [3.75,7.40] sent hand-held messages sometimes; 1.16% [0.59,2.25] sent hand-held messages often; and, less than 1% [0.13,1.09] said they sent hand-held messages very often (see Figure 5-110). In an average month, during the G1 licence stage, 92.78% [90.43,94.58] of young drivers said they never sent hands-free messages; 2.84% [1.77,4.52] sent hands-free messages once per month; 2.99% [1.83,4.83] sent hands-free messages sometimes; 1.04% [0.53,2.01] sent hands-free messages often while driving; and, 0.36% [0.12,1.08] said they sent hands-free messages very often (see Figure in Appendix A). As can be seen from the univariate analysis results, only a very small proportion of the young driver population admitted to sending hand-held and hands-free messages while driving during the G1 licence period. A logistic regression analysis was conducted to evaluate the variation between subgroups of G1 drivers with respect those who never sent hand-held messages while driving compared to those who sent them at least once per month while driving (see Figure in Appendix A). Results revealed an odds ratio of 0.35 (p<0.01) between drivers who completed BDE and did not take a time discount and those who completed BDE and took a time discount. This implies that drivers who completed BDE but did not take a time discount had approximately 65% ((1-0.35)*100) decreased odds that they would send hand held messages at least once per month during their G1 licence stage compared to those drivers who completed BDE and took a time discount. Results of a separate logistic regression analysis did not reveal any significant differences among the targeted subgroups of young drivers with respect to the frequency of sending hands-free messages while driving (i.e. never versus at least once) during the G1 licence In an average month, during the G2 licence stage, 65.26% [61.37,68.95] of young drivers said they never sent hand-held messages; 11.46% [9.08,14.36] sent hand-held messages once per month; 12.59% [10.20,15.44] sent hand-held messages sometimes; 6.38% [4.58,8.82] sent hand-held messages often; and, 4.32% [2.90,6.41] said they sent hand-held messages very often while driving during their G2 licence stage (see Figure 5-113). In an average month, during the G2 licence stage, 85.52% [82.30,88.24] of young drivers said they never sent hands-free messages; 5.45% [3.82,7.73] sent hands-free messages once per month; 5.33% [3.74,7.53] sent hands-free messages sometimes; 2.25% [1.27,3.93] sent hands-free messages often; and, 1.46% [0.71,2.98] said they sent hands-free messages very often while driving (see Figure in Appendix A). Comparing the frequency of texting while driving (hand-held and hands-free) during the G1 and G2 licence periods reveals that there is an increase in the frequency of this behaviour in young drivers once they have reached their G2 licence stage. 60
73 As with the G1 licence period, results of logistic regression analyses, controlling for differences in gender and age, revealed an odds ratio of 0.56 (p=0.01) for drivers who completed BDE and did not take a time discount compared to those who completed BDE and took a time discount when comparing the frequency (i.e., never versus at least once per month) of hand-held text messaging during the G2 licence period (see Figure in Appendix A). These findings suggest that drivers who completed BDE and took a time discount were significantly more likely to engage in hand-held text messaging compared to drivers who completed BDE without taking a time discount. Conversely, no significant variance was revealed among the three targeted subgroups of drivers with respect to the frequency of hands-free text messaging during the G2 licence period. Figure 5-110: How often do G1 drivers send hand-held messages while driving? Number of strata = 24 Number of obs = 974 Number of PSUs = 974 Population size = Design df = 950 How often do/did you send hand-held messages classification during G1? BDE w/ TD BDE w/o TD non-bde Total Never [80.55,88.24] [88.13,96.47] [86.21,93.27] [86.21,90.87] Once [4.861,10.49] [.2563,2.203] [2.279,6.866] [3.228,6.054] Sometimes [3.612,8.795] [2.586,10.83] [2.376,7.707] [3.752,7.395] Often [.6514,3.944] [.05503,1.935] [.484,4.029] [.5922,2.247] Very Often [.2357,2.309] [.01489,.7517] [.1317,1.085] Total Key: column percentages [95% confidence intervals for column percentages] Pearson: Uncorrected chi2(8) = Design-based F(6.62, )= P =
74 Figure 5-113: How often do G2 drivers send hand-held messages while driving? Number of strata = 20 Number of obs = 853 Number of PSUs = 853 Population size = Design df = 833 How often do/did you send hand-held messages classification during G2? BDE w/ TD BDE w/o TD non-bde Total Never [56.54,66.29] [62.49,77.69] [57.69,73.04] [61.37,68.95] Once [7.716,14.28] [8.277,19.51] [7.221,17.23] [9.078,14.36] Sometimes [12.41,20.19] [4.131,13.12] [8.254,19.38] [10.2,15.44] Often [5.484,11.47] [1.963,10.53] [2.21,9.838] [4.579,8.816] Very Often [2.335,6.809] [1.934,9.521] [2.618,10.73] [2.895,6.405] Total Key: column percentages [95% confidence intervals for column percentages] Pearson: Uncorrected chi2(8) = Design-based F(7.02, )= P = Making phone calls while driving. In an average month during the G1 licence stage, 90.43% [88.00,92.41] of young drivers said they never made hand-held calls; 5.98% [4.45,7.98] made hand-held calls once per month; 2.76% [1.72,4.41] made hand-held calls sometimes; 0.61% [0.27,1.35] made hand-held calls often; and, less than 1% [0.05,0.92] said they made hand-held calls very often while driving (see Figure 5-116). In an average month during the G1 licence stage, 88.07% [85.29,90.39] of young drivers said they never made hands-free calls while driving; 6.13% [4.49,8.31] made hands-free calls once per month; 3.30% [2.14,5.06] made hands-free calls sometimes; 1.97% [1.11,3.48] made hands-free calls often; and, 0.53% [0.23,1.21] said they made hands-free calls very often (see Figure in Appendix A). Similar to the frequency of text messaging while driving, only a very small percentage of young drivers admitted to making phone calls while driving often or very often during their G1 licence period. Results of a logistic regression analysis, controlling for age and gender differences, revealed an odds ratio of 0.41 (p=0.03) for drivers who completed BDE and did not take a time discount and those who completed BDE and took a time discount with respect to the frequency (i.e., never versus at least once per month) of making handheld phone calls in the average month during the G1 licence period (see Figure in Appendix A). This suggests that drivers who completed BDE without taking a time discount were 59% ((1-0.41)*100) less likely to engage in making hand-held phone calls while driving compared to those who took a time discount. 62
75 As with sending hands-free text messaging, a logistic regression analysis found no significant differences among subgroups of young drivers with respect to the frequency of making hands-free calls during the G1 licence period. In an average month, during the G2 licence stage, 74.98% [71.27,78.36] of young drivers said they never made hand-held calls; 9.67% [7.52,12.34] made hand-held calls once per month; 10.41% [8.13,13.24] made hand-held calls sometimes; 3.01% [1.83,4.92] made hand-held calls often; and, 1.92% [1.05,3.48] said they made hand-held calls very often while driving (see Figure 5-119). In an average month during the G2 licence stage, 75.12% [71.34,78.55] of young drivers said they never made hands-free calls while driving; 8.34% [6.26,11.03] made hands-free calls once per month; 8.82% [6.78,11.40] made hands-free calls sometimes; 5.16% [3.57,7.41] made hands-free calls often; and, 2.55% [1.50,4.32] said they made hands-free calls very often (see Figure in Appendix A). Comparing the frequency of making phone calls while driving, for both hands-free and hand-held devices, during the G1 and G2 licence period indicates that a larger percentage of young drivers made phone calls while driving during the G2 licence period, compared to when they were driving during their G1 licence stage. Results of a logistic regression analysis, comparing the frequency of making hand-held phone calls while driving during the G2 licence period (i.e. never versus at least once per month) revealed a significant difference between drivers who completed BDE and took a time discount and those who completed BDE and did not take a time discount (see Figure in Appendix A). An odds ratio of 0.57 (p=0.03) suggests that drivers who completed BDE and do not take a time discount were 43% ((1-0.57)*100) less likely to engage in making hands-free calls while driving at least once per month during the G2 licence period, compared to those drivers who completed BDE and took a time discount. Results of a second logistic regression analysis, evaluating the variance among young drivers with respect to the frequency of making hands-free calls while driving during the G2 licence period, did not reveal any significant differences. 63
76 Figure 5-116: How often do drivers make hand-held calls while driving during their G1 period? Number of strata = 24 Number of obs = 974 Number of PSUs = 974 Population size = Design df = 950 How often do/did you make hand-held calls classification during G1? BDE w/ TD BDE w/o TD non-bde Total Never [83.95,91] [88.57,96.89] [86.56,93.52] [88,92.41] Once [6.235,12.45] [.7539,6.872] [3.11,8.639] [4.454,7.98] Sometimes [1.279,4.92] [1.183,7.882] [1.378,5.497] [1.719,4.412] Often [.09118,1.842] [.1574,2.523] [.2801,3.483] [.2735,1.349] Very Often [.04101,2.059] [.05763,2.883] [.05412,.9228] Total Key: column percentages [95% confidence intervals for column percentages] Pearson: Uncorrected chi2(8) = Design-based F(6.93, )= P = Figure 5-119: How often do G2 drivers make hand-held calls while driving? Number of strata = 20 Number of obs = 853 Number of PSUs = 853 Population size = Design df = 833 How often do/did you make hand-held calls classification during G2? BDE w/ TD BDE w/o TD non-bde Total Never [67.86,77.1] [71.57,85.65] [64.47,78.98] [71.27,78.36] Once [8.482,15.27] [3.187,12.28] [6.983,17.54] [7.524,12.34] Sometimes [7.921,14.64] [5.12,15.39] [7.876,18.66] [8.134,13.24] Often [1.565,5.541] [1.835,9.008] [.06492,3.245] [1.827,4.924] Very Often [.9307,4.414] [.14,6.886] [1.611,8.375] [1.054,3.483] Total Key: column percentages [95% confidence intervals for column percentages] Pearson: Uncorrected chi2(8) = Design-based F(6.60, )= P =
77 Listening to music. In an average month during the G1 licence stage, 10.59% [8.34,13.36] of young drivers said they never listened to music while driving; 9.04% [6.96,11.65] listened to music once per month; 17.26% [14.45,20.48] listened to music sometimes; 17.40% [14.71,20.47] listened to music often; and, 45.71% [42.03,49.45] said they listened to music very often (see Figure in Appendix A). With respect to subgroups of drivers, 52.32% [47.14,57.46] of drivers who completed BDE and took a time discount said that they listened to music very often and 20.31% [16.51,24.73] listened to music often while driving during their G1 licence stage. These percentages are larger than drivers who did not complete BDE, of whom 38.99% [32.62,45.77] said they listened to music very often and 15.63% [10.94,21.82] who said they listened to music often while driving during their G1 licence period. Similar differences were found between drivers who completed BDE and took a time discount and those who completed BDE and did not take a time discount. Results of a logistic regression analysis of this variable (see Figure in Appendix A), controlling for gender and age differences, found an odds ratio of 0.48 (p<0.01) between drivers who completed BDE and took a time discount and drivers who completed BDE and did not take a time discount, meaning that drivers who completed BDE without taking a time discount had a 52% ((1-0.48)*100) decrease in the likelihood that they listened to music while driving often or very often during their G1 licence stage compared to drivers who completed BDE and took a time discount. A significant odds ratio of 0.59 (p<0.01) was also found between drivers who completed BDE and took a time discount and those who did not complete BDE. This implies that drivers who did not complete BDE had a 51% ((1-0.59)*100) decrease in the odds of listening to music often or very often during their G1 licence stage compared to drivers who completed BDE and took a time discount. In an average month during the G2 licence stage, 6.41% [4.69,8.69] of young drivers said they never listened to music while driving; 3.01% [1.85,4.88] listened to music once per month; 7.35% [5.34,10.04] listened to music sometimes; 12.16% [9.67,15.19] listened to music often; and, 71.07% [67.12,74.71] said they listened to music very often while driving (see Figure in Appendix A). A logistic regression analysis revealed an odds ratio of 0.49 (p=0.01) between G2 drivers who completed BDE and took a time discount and those who completed BDE but did not take a time discount (see Figure in Appendix A). Put differently, drivers who completed BDE without taking a time discount were found to have decreased odds that they listened to music while driving often or very often compared to drivers who completed BDE and took a time discount of approximately 51% ((1-0.49)*100). The regression analysis did not reveal any further significant differences among the subgroups of young drivers with respect to the frequency that they listened to music often while driving during their G2 licence period. Results also indicated, with an odds ratio of 1.67 (p=0.03) between female and male drivers, that females are 67% ((1.67-1)*100) more likely to listen to music often while driving compared to males during the G2 licence period. 65
78 Driving while tired. In an average month during the G1 licence stage, 48.16% [44.38,51.96] of young drivers said that they never operated vehicles while tired; 29.94% [26.53,33.58] drove while tired once per month; 18.19% [15.5,21.23] drove while tired sometimes; 2.89% [1.91,4.35] drove often while tired; and, 0.82% [0.38,1.78] said they drove while tired very often (see Figure 5-126). With respect to subgroups of drivers, an association was found using bivariate analysis between subgroups of drivers relating to how often they reported driving while tired. Approximately 40.84% [35.84,46.02] of drivers who completed BDE and took a time discount said that they never drove tired during their G1 licence stage, compared to 57.96% [51.02,64.60] of drivers who did not complete BDE. A logistic regression analysis confirmed the significance of this observation, revealing an odds ratio of 0.63 (p=0.01) for drivers who did not complete BDE compared to those who completed BDE and took a time discount (see Figure in Appendix A). Additionally, an odds ratio of 0.64 (p=0.02) was found for drivers who completed BDE and did not take a time discount compared to those who completed BDE and took a time discount. This suggests that drivers who did not complete BDE and those who completed BDE but do not take a time discount were significantly less likely to drive while tired at least once per month during the G1 licence period, compared to those drivers who completed BDE and took a time discount. In an average month during the G2 licence stage, 29.13% [25.50,33.05] of young drivers reported that they never operated vehicles while tired; 20.57% [17.51,24.00] drove while tired once per month; 31.74% [28.04,35.68] drove while tired sometimes; 13.35% [10.81,16.38] drove while tired often; and, 5.22% [3.71,7.29] said they drove while tired very often (see Figure 5-128). This suggests that young drivers drove while tired more frequently during their G2 licence period, compared to their G1 licence period. Similar to the variance in fatigued driving behaviours found among subgroups during the G1 licence stage, a logistic regression analysis found a significant difference between the frequency of driving while tired (i.e. never versus at least once) between G2 drivers who did not complete BDE and those who completed BDE and took a time discount (see Figure in Appendix A). An odds ratio of 0.59 (p=0.02) was found between drivers who did not complete BDE and those who completed BDE and took a time discount. This suggests that drivers who did not complete BDE were approximately 41% less likely to drive while tired at least once per month during the G2 licence period, compared to those drivers who completed BDE and took a time discount. 66
79 Figure 5-126: How often do young drivers operate vehicles while tired during G1? Number of strata = 24 Number of obs = 974 Number of PSUs = 974 Population size = Design df = 950 How often do/did you drive tired classification during G1? BDE w/ TD BDE w/o TD non-bde Total Never [35.85,46.02] [44.21,60.15] [51.02,64.6] [44.38,51.96] Once [27.49,37.15] [23.81,38.57] [18.51,30.56] [26.53,33.58] Sometimes [18.53,27.17] [10.38,21.56] [9.32,18.58] [15.5,21.23] Often [1.861,5.761] [.4206,5.528] [2.257,7.146] [1.913,4.351] Very Often [.4185,3.339] [.06069,2.213] [.2185,2.191] [.3765,1.78] Total Key: column percentages [95% confidence intervals for column percentages] Pearson: Uncorrected chi2(8) = Design-based F(7.15, )= P = Figure 5-128: How often do young drivers operate vehicles while tired during G2? Number of strata = 20 Number of obs = 853 Number of PSUs = 853 Population size = Design df = 833 How often do/did you drive tired classification during G2? BDE w/ TD BDE w/o TD non-bde Total Never [21.02,29.99] [24.99,41.06] [27.9,43.33] [25.5,33.05] Once [18.82,27.43] [11.58,24.32] [15.02,28.12] [17.51,24] Sometimes [26.68,36.35] [28.05,43.82] [17.85,31.49] [28.04,35.68] Often [11.48,19.03] [7.394,18.36] [7.263,17.79] [10.81,16.38] Very Often [3.715,8.778] [1.182,7.922] [4.759,14.45] [3.709,7.286] Total Key: column percentages [95% confidence intervals for column percentages] Pearson: Uncorrected chi2(8) = Design-based F(7.12, )= P =
80 Taking chances while driving. In an average month, during the G2 licence stage, 73.21% [69.40,76.69] of young drivers said they never took chances while driving just for the fun of it; 16.17% [13.34,19.47] took chances once per month; 7.52% [5.53,10.14] took chances sometimes; 2.19% [1.37,3.48] took chances often; and, 0.92% [0.45,1.90] said they took chances very often while driving, just for the fun of it (see Figure in Appendix A). Logistic regression analyses were conducted to determine if there was any significant variance among the three subgroups of young drivers with respect to the frequency (i.e., never versus at least once per month) that they took chances while driving during their G2 licence period. Results did not show any significant variance among these groups. Teenage passengers. Results of the univariate analysis show the distribution of the frequencies that G2 drivers reported driving with one or more teenage passenger. Only 9.22% [7.13,11.86] of G2 drivers said they never drove with teenage passengers in the average month; 13.67% [11.02,16.83] drove with teenage passengers once per month; 29.83% [26.18,33.77] drove with teens sometimes; 25.10% [21.83,28.69] drove with teens often; and, 22.17% [19.00,25.71] said they drove with teenage passengers very often (see Figure in Appendix A). A logistic regression analysis was conducted to examine any differences among subgroups of young drivers to determine if certain groups were more or less likely to drive with one or more teenage passengers often or very often (see Figure in Appendix A). An odds ratio of 0.52 (p<0.01) was found between drivers who completed BDE and took a time discount and drivers who completed BDE and did not take a time discount. Additionally, an odds ratio of 0.54 (p<0.01) was found between drivers who completed BDE and took a time discount and drivers who did not complete BDE. These results suggest that drivers who completed BDE without taking a time discount had a 48% ((1-0.52)*100) decrease in the likelihood that they would drive with at least one passenger in the vehicle often or very often during their G2 licence period, compared to drivers who complete BDE and take a time discount. Similarly, drivers who did not complete BDE had a 46% ((1-0.54)*100) decrease in the likelihood that they will drive with at least one passenger in the vehicle often or very often during their G2 licence period, compared to drivers who completed BDE and took a time discount. Ultimately, the implication here is that drivers who completed BDE and took a time discount drove with teenage passengers, increasing the risk of crashing, more frequently during their G2 licence period compared to drivers who completed BDE without taking a time discount and drivers who did not complete BDE. Running red lights. Almost all G2 drivers (92.39% [89.74,94.4]) indicated that they never ran red lights in the average month. Among G2 drivers, 5.69% [4.00,8.04] said they ran red lights once per month; 1.56% [0.74,3.28] said they ran red lights sometimes; and, less than 1% said that they ran red lights often [0.02,1.08] or very often [0.03,1.43] (see Figure in Appendix A). 68
81 Logistic regression analyses were conducted to determine if there were any significant variance among the three subgroups of young drivers with respect to the frequency (i.e., never versus at least once per month) that they admitted to running red lights during their G2 licence period. Results did not show any significant variance among these groups. Passing other cars because it is exciting. In the average month, the majority of G2 drivers (86.50% [83.52,89.01]) said they never pass other cars because it is exciting. About 6.82% [5.06,9.14] of G2 drivers said they pass other cars once per month; 5.10% [3.54,7.30] said pass other cars sometimes; 0.89% [0.42,1.84] said they pass other cars often; and, 0.69% [0.30,1.62] admitted to passing other cars very often in the average month (see Figure in Appendix A). Logistic regression analyses, controlling for differences in gender, age, and demographic location (i.e., urban versus rural) were conducted to discern any variance among the three targeted subgroups of drivers with respect to whether or not they passed other cars because it was exciting never versus at least once per month during their G2 licence period (see Figure in Appendix A). Demographic location was included as a control variable in this model due to the fact that its inclusion was found to affect the significance of the resulting odds ratios. Results showed an odds ratio of 2.19 (p=0.04) for drivers who did not complete BDE compared to those who completed BDE and did not take a time discount. This means that young G2 drivers who did not complete BDE had approximately 119% ((2.19-1)*100) increased odds that they would pass other cars because it was exciting at least once per month compared to drivers who completed BDE and did not take a time discount. As well, an odds ratio of 2.02 (p=0.04) was identified between drivers who had completed BDE and taken a time discount compared to those who had completed BDE but did not take a time discount. In other words, drivers who completed BDE and took a time discount had a 102% ((2.02-1)*100) increase in the odds that they would pass other cars because it was exciting at least once per month compared to drivers who completed BDE without taking a time discount. Additionally, an odds ratio of 0.35 (p<0.01) was identified for females compared to male drivers, suggesting that females were significantly less likely to pass other cars because it was exciting at least once in the average month compared to young male drivers. Drug-impaired driving. The majority of G2 drivers (93.76% [91.29,95.56]) said they never drove within two hours of consuming drugs, other than alcohol during the G2 licence stage. However, a small percentage of G2 drivers did admit to this behaviour. About 3.42% [2.14,5.43] of G2 drivers said they operated a vehicle after consuming drugs once per month; 2.09% [1.12,3.88] of drivers admitted to doing this sometimes; and, less than 1% exhibited this behaviour often or very often in the average month (see Figure 5-136). 69
82 Figure 5-136: How often do young drivers operate vehicles within 2 hours after consuming drugs other than alcohol? Number of strata = 20 Number of obs = 853 Number of PSUs = 853 Population size = Design df = 833 How often do drive within 2 hours of consuming any drug classification during G2? BDE w/ TD BDE w/o TD non-bde Total Never [90.81,96.11] [87.26,96.67] [88.57,96.77] [91.29,95.56] Once [2.245,6.617] [.9887,8.534] [1.049,7.55] [2.138,5.431] Sometimes [.4216,3.365] [1.283,8.434] [.8452,6.149] [1.117,3.878] Often [.04262,.4114] [.04375,2.197] [.09811,4.869] [.09307,.8057] Very Often [.2353,2.731] [.04027,2.023] [.147,1.416] Total Key: column percentages [95% confidence intervals for column percentages] Pearson: Uncorrected chi2(8) = Design-based F(6.04, )= P = Logistic regression analyses were conducted to determine if there was any significant variance among the three targeted subgroups of young drivers with respect to the frequency (i.e., never versus at least once per month) that they admitted to taking drugs, other than alcohol, within two hours of driving during their G2 licence period. Results did not show any significant variance among these groups. Alcohol-impaired driving. The majority of G2 drivers (95.22% [93.06,96.73]) said they never drove within two hours of consuming any amount of alcohol. However, like with drug-impaired driving behaviours, a small percentage of G2 drivers did admit to driving after consuming alcohol. About 2.59% [1.56,4.27] of G2 drivers said they drove after consuming alcohol once per month; 1.49% [0.71,3.12] of G2s said they drove after consuming alcohol sometimes; 0.50% [0.17,1.48] said they drove after consuming alcohol often; and, less than 1% [0.03,1.43] reported engaging in this behaviour very often (see Figure 5-137). 70
83 Figure 5-137: How often do G2 drivers operate vehicles within 2 hours after consuming any amount of alcohol? Number of strata = 20 Number of obs = 853 Number of PSUs = 853 Population size = Design df = 833 How often do you drive within 2 hours of consuming any amount of alcohol classification during BDE w/ TD BDE w/o TD non-bde Total Never [92.39,97.28] [90.92,98.44] [86.19,95.69] [93.06,96.73] Once [1.45,5.4] [.2897,6.172] [2.187,10.07] [1.563,4.27] Sometimes [.1683,2.759] [.6255,7.154] [1.009,7.684] [.7057,3.12] Often [.1685,2.762] [.04375,2.197] [.03254,1.638] [.1645,1.481] Very Often [.0549,2.75] [.02846,1.433] Total Key: column percentages [95% confidence intervals for column percentages] Pearson: Uncorrected chi2(8) = Design-based F(5.88, )= P = Logistic regression analyses were conducted to determine if there was any significant variance among the three targeted subgroups of young drivers with respect to the frequency (i.e., never versus at least once per month) that they admitted to consuming alcohol within two hours of driving during their G2 licence period. Results did not show any significant variance among these groups. Tailgating. The majority of G2 drivers (80.77% [77.37,83.76]) reported that they never drove especially close to other cars to let its driver know to get out of the way. Among G2 drivers, 10.88% [8.57,13.73] of G2 drivers tailgated once per month; 5.94% [4.25,8.25] of drivers tailgated sometimes; 1.45% [0.76,2.76] of drivers tailgated often; and, 0.96% [0.49,1.86] tailgated very often (see Figure in Appendix A). Logistic regression analyses were conducted to determine if there was any significant variance among the three targeted subgroups of young drivers with respect to the frequency (i.e., never versus at least once per month) that they admitted to driving especially close to the car in front to let its driver know to go faster or get out of the way during their G2 licence period (see Figure in Appendix A). Results show an odds ratio of 0.50 (p=0.02) for drivers who completed BDE and did not take a time discount, compared to those who completed BDE and took a time discount. This means that drivers 71
84 who completed BDE without taking a time discount were 50% ((1-0.50)*100) less likely to tailgate at least once per month compared to drivers who completed BDE and took a time discount during the G2 licence period. This finding suggests that young drivers who decided to take a time discount were more likely to engage in potentially risky or aggressive behaviours, such as tailgating, compared to those drivers who completed BDE without taking a time discount What was the primary reason for taking a BDE course or not taking a BDE course? Various reasons for deciding to complete or not complete a BDE course are explored in this subsection. Participants were asked to choose, from a specified list, a reason for deciding to complete BDE. This list of response options included the following as reasons for deciding to complete BDE: to qualify for an insurance discount; to help pass the G1 road test; to make you a safer or more skilled driver; to get your G2 licence sooner; your parents wanted you to; to be able to get to activities such as work, school, or sports on your own; and, other. Participants who did not complete BDE were asked why they choose not to complete the BDE course. The response options for this item included: too expensive; not available where you live; not necessary-others could teach you just as well; did not have time to take the course; did not have access to a vehicle; enrolled in the course but never completed it; parents/guardians did not allow you to take it; not interested in getting a time discount (i.e., reducing the amount of time with a G1 licence); planning on taking the course in the future; currently taking the course; and, other. Results of a bivariate analysis indicated that the primary reason for completing BDE, identified by 34.11% [30.04,38.42] of young drivers who completed BDE, was to make themselves a safer or more skilled driver (see Figure 5-140). As well, 30.64% [26.62,34.98] of drivers who completed BDE said that the most important reason for deciding to take a BDE course was to qualify for an insurance discount. Approximately 18.18% [15.29,21.48] of drivers who completed BDE said that they decided to do so to get their G2 licence sooner, 4.39% [2.87,6.66] said it was to help pass the G1 road test, 4.22% [2.65,6.66] said they decided to take BDE because their parents wanted them to; and 8.31% [6.22,11.03] indicated that they completed BDE to be able to get to activities such as work, school, or sports on their own. These results provide evidence to support the hypothesis that if a large proportion of BDE drivers completed the course because they believed it would make them a safer driver, especially if course completion allowed them to obtain a G2 licence early, they may have ended up believing that they were a better driver, even if they were not safer or more skilled in reality compared to other young drivers. 72
85 Figure 5-140: What was the most important reason for deciding to take a BDE course? Number of strata = 16 Number of obs = 746 Number of PSUs = 746 Population size = Design df = 730 What was the single most important reason for taking BDE? percentages lb ub to qualify for insurance disc, to help pass the g1 road test to be a safer/skilled driver to get your g2 licence sooner your parents wanted you to to be able to get to activities other Total 100 Key: percentages = cell percentages lb = lower 95% confidence bounds for cell percentages ub = upper 95% confidence bounds for cell percentages The primary reason, identified by young drivers who did not complete BDE, for deciding not to complete the course was that they believed it was too expensive (see Figure 5-141). Approximately 34.22% [27.98,41.07] of young drivers who did not complete BDE, did so because it was too expensive; 18.22% [13.95,23.46] did not complete BDE because they believed it was not necessary, and that others could teach them to drive just as well; 16.65% [11.71,23.11] did not complete the course because they were planning on taking it in the future (88.30% [73.87,95.27] of these respondents were G1 drivers); 13.03% [8.70,19.07] indicated that they did not have time to take the course; and, 6.28% [3.48,11.08] indicated that they were not interested in taking a time discount. Figure 5-141: What was the most important reason for deciding not to take a BDE course? Number of strata = 8 Number of obs = 246 Number of PSUs = 246 Population size = Design df = 238 What was the main reason that you did not complete BDE? percentages lb ub too expensive not available where you live not necessary did not have time no access to a vehicle enrolled in BDE, never completed parents did not allow it not interested in time discount plan to take BDE later currently taking the course other Total 100 Key: percentages = cell percentages lb = lower 95% confidence bounds for cell percentages ub = upper 95% confidence bounds for cell percentages 73
86 How do young drivers perceive the usefulness of the Beginner Driver Education (BDE) program? The Young Driver Survey questionnaire asked participants, who had completed BDE, to indicate whether or not they felt that BDE improved their driving skills and knowledge of road rules and safety. They were also asked which component of the BDE program they found most useful. Results of the univariate analysis showed that young drivers perceived the BDE program as having a positive impact on their driving abilities (see Figure & in Appendix A). The vast majority of young drivers who completed BDE (90.47% [87.33,92.9]) believed that BDE improved their driving skills. Similarly, 95.52% [93.04,97.15] of young drivers who completed BDE believed that it enhanced their knowledge of road rules and safety. Once again, these results add to the hypothesis that completing BDE increases the selfconfidence of young drivers with respect to their skills and knowledge of driving. Among drivers who completed BDE, 89.94% [86.95,92.31] believed that in-vehicle instruction was the most useful component of the BDE program; 9.62% [7.33,12.54] thought that classroom instruction was the most useful; and, less than 1% [0.09,1.98] believed that additional instruction methods (e.g., online learning) were the most useful (see Figure 5-144). Figure 5-144: What part of BDE do young drivers find most useful? Number of strata = 16 Number of obs = 745 Number of PSUs = 745 Population size = Design df = 729 What part of the BDE course was most useful during G1 stage? percentages lb ub classroom instruction in-vehicle instruction additional instruction Total 100 Key: percentages = cell percentages lb = lower 95% confidence bounds for cell percentages ub = upper 95% confidence bounds for cell percentages How often do young drivers take driving lessons outside of Beginner Driver Education (BDE)? Since BDE is not the only available driver education program in Ontario, researchers were also interested in investigating the percentage of young drivers who took driving lessons from a professional instructor outside of BDE. 74
87 Results indicate that about 89.41% [87.04,91.38] of young drivers did not take driving lessons outside of BDE (see Figure in Appendix A). However, within subgroups of young drivers, a much larger percentage drivers who did not complete BDE (21.88% [17.02,27.68]) took driving lessons outside of BDE compared to those who completed BDE with and without a time discount (7.70% [5.39,10.89] and 7.36% [4.13,12.77], respectively). A logistic regression analysis confirmed the significance of this finding (see Figure in Appendix A). The analysis determined the difference between the three targeted subgroups of young drivers with respect to whether or not they had taken driving lessons outside of Beginner Driver Education. An odds ratio of 0.19 (p<0.01) was found between drivers who did not complete BDE and those who completed BDE and did not take a time discount. Similarly, an odds ratio of 0.21 (p<0.01) was found between drivers who did not complete BDE and those who completed BDE and took a time discount. Simply put, drivers who completed BDE without taking a time discount had 81% ((1-0.19)*100) decreased odds that they will take driving lessons outside of BDE compared to drivers who did not complete BDE. Similarly, drivers who completed BDE and took a time discount have 79% ((1-0.21)*100) decreased odds compared to drivers who did not complete BDE How often do young drivers utilize public transportation? How much access? Feasibility of using public transportation? The following subsection explores the convenience and level of public transportation that young drivers use. It also explores the frequency of public transportation use among young drivers. In this analysis, distinction is made between urban and rural categories of participants within the young driver population. Participants were asked to rate the convenience of the public transportation systems in their area, as well as the frequency of use of various public transportation options. Convenience of public transportation. Overall, among those participants who indicated that public transportation options were available in the area that they lived, 20.81% [17.36,24.74] indicated that the public transportation system was very convenient; 27.54% [23.61,31.86] said it was convenient; 33.44% [29.31,37.84] said it was somewhat convenient; 14.14% [11.33,17.51] said it was not convenient; and, 4.07% [2.69,6.10] said they did not know how convenient the public transportation systems in their area are to use (see Figure 5-147). Differences between groups of urban and rural populations were identified in the subsequent analyses. Within the urban driver population, where transportation is available, 12.16% [9.30,15.76] said that it was not convenient, compared to 37.64% [27.64,48.83] of rural drivers. A logistic regression analysis was conducted to confirm the significance of this finding, while controlling for differences in gender and age (see Figure in Appendix A). An odds ratio of 4.90 (p<0.01) was found between rural and urban drivers with respect to the convenience (i.e., Not convenient versus Convenient) of the 75
88 public transportation system in their area. In other words, not surprisingly, young drivers who live in urban regions had a 390% ((4.90-1)*100) increase in the odds that they would report that the public transportation systems are at least somewhat convenient, compared to rural drivers. Figure 5-147: How convenient are the public transportation systems in young driver s area? Number of strata = 24 Number of obs = 660 Number of PSUs = 660 Population size = Design df = 636 How convenient are the public transportation systems in your area postalcode to use? rural urban Total very convenient [5.777,18.74] [17.97,25.9] [17.36,24.74] convenient [6.055,21.73] [24.64,33.49] [23.61,31.86] somewhat convenient [22.75,42.88] [29.17,38.26] [29.31,37.84] not convenient at al [27.64,48.83] [9.295,15.76] [11.33,17.51] don't know / n/a [3.782,15.94] [2.34,5.922] [2.691,6.098] Total Key: column percentages [95% confidence intervals for column percentages] Pearson: Uncorrected chi2(4) = Design-based F(3.92, )= P = Frequency of public transportation use. A univariate analysis was conducted to evaluate the frequency that young drivers, who said they had available public transportation options in their area, made use of it in the average month (see Figure in Appendix A). Overall, 17.17% [13.89,21.05] of drivers took public transportation daily; 16.98% [13.81,20.7] took public transportation several times per week; 12.37% [9.63,15.75] took it once per week; 18.67% [15.34,22.53] took it once per month; and, 34.80% [30.75,39.09] never took public transportation in the average month. With regards to demographic information, a far greater percentage of rural drivers (66.81% [55.71,76.30]) said they never took public transportation, compared to 32.09% [27.82,36.69] of urban drivers. Similarly, 18.04% [14.5,22.22] of young urban drivers said they took public transportation daily, compared to 6.91% [3.33,13.8] of rural drivers. Results of a logistic regression analysis, controlling for gender and age factors, confirmed the significance of this finding, with an odds ratio of 3.06 (p<0.01) for urban drivers 76
89 compared to rural drivers (see Figure in Appendix A). Additionally, an odds ratio of 0.65 (p=0.03) was revealed between young female drivers and young male drivers, indicating that females were 35% ((1-0.65)*100) less likely to use public transportation at least once per week compared to male drivers. Carpooling. When asked how often young drivers received rides from other drivers in an average month, 11.37% [9.18,13.99] of young drivers said they got rides daily; 30.59% [27.12,34.29] said they carpool several times per week; 30.97% [27.46,34.72] said they carpool once per week; 20.16% [17.27,23.39] once per month; and, 6.91% [5.16, 9.19] said they never got rides from others in an average month (see Figure 5-151). Results of the bivariate frequency analysis found that a greater percentage of urban drivers, compared to young rural drivers got rides from other drivers at least once per week. A logistic regression analysis, controlling for gender and age factors, confirmed the significance of this finding, with an odds ratio of 1.56 (p=0.01) for urban drivers compared to rural drivers (see Figure in Appendix A). In other words, young drivers who live in urban areas carpooled with other drivers more often compared to those who reside in rural areas. Figure 5-151: How often do young drivers get rides from other drivers monthly? Number of strata = 24 Number of obs = 959 Number of PSUs = 959 Population size = Design df = 935 How often do you get a ride from someone else, postalcode monthly? rural urban Total daily [5.797,12.2] [9.449,15.16] [9.183,13.99] several times per week [23.17,34.38] [27.03,35.42] [27.12,34.29] once per week [23.92,35.09] [27.27,35.79] [27.46,34.72] once per month [19.2,29.89] [15.97,23.06] [17.27,23.39] never [6.669,14.05] [4.334,9.004] [5.163,9.188] Total Key: column percentages [95% confidence intervals for column percentages] Pearson: Uncorrected chi2(4) = Design-based F(3.95, )= P = Walking. Almost one-third 30.62% [27.19,34.28] of young drivers said they walked as a mode of transportation daily; 24.52% [21.25,28.10] walked several times per week; 11.39% 77
90 [9.14,14.11] walked once per week; 10.02% [7.93,12.58] walked once per month; and, 23.46% [20.50,26.70] said they never walked as a mode of transportation in an average month (see Figure in Appendix A). A logistic regression analysis was performed to evaluate the differences between rural and urban drivers with respect to the frequency that they walked as a mode of transportation (i.e., At least once per week versus Less than once per week) (see Figure in Appendix A). An odds ratio of 2.74 (p<0.01) was found, indicating that urban drivers had a 174% ((2.74-1)*100) increase in the likelihood that they will walk as a mode of transportation at least once per week in the average month, compared to rural drivers. Cycling. When asked how often young drivers cycled as a mode of transportation in an average month, 1.79% [0.94,3.37] of young drivers said they cycled daily; 7.41% [5.51,9.90] said they cycled several times per week; 6.56% [4.89,8.77] said they cycled once per week; 12.42% [9.98,15.35] said they cycled once per month; and, 71.82% [68.1,75.26] reported that they never cycled as a mode of transportation in an average month (see Figure in Appendix A). The results of a logistic regression analysis did not show any significant differences in the frequency of cycling as a mode of transportation (i.e., At least once per week versus Less than once per week) between urban and rural drivers Are young drivers aware of the Ministry s various public education tools targeted at young drivers (i.e., GLS videos)? Participants were also asked about the exposure they had to various public education tools developed by the Ministry of Transportation, Ontario. Respondents were asked whether they used these tools during various stages of the licensing process, as well as whether or not they had seen the educational videos developed for young and novice drivers. The majority of young drivers (62.71% [58.87,66.39]) visited the Ministry of Transportation, Ontario s website for licensing information before obtaining their G1 licence (see Figure in Appendix A). An examination of the percentage of young drivers that visited MTO s website for information on required documentation showed that the majority of young drivers (64.00% [60.26,67.58]) did visit the website before obtaining their G1 licence (see Figure in Appendix A). Approximately half of young drivers (50.75% [46.88,54.61]) said that they had not seen any of the available videos for young drivers listed on MTO s website entitled, Getting your driver s licence (see Figure 5-158). Almost one-quarter (23.64% [20.47,27.14]) of drivers said they had seen them, and 25.61% [22.31,29.21] said they did not know whether or not they had seen them (see Figure in Appendix A). After passing the G1 road test, and obtaining their G2 licence, the majority of young drivers (77.31% [73.66,80.59]) did not visit MTO s website. Additionally, about 14.37% 78
91 [11.70,17.53] of drivers did visit the website after obtaining their G2 licence and 8.32% [6.32,10.87] indicated that they did not know (see Figure in Appendix A). 5.2 Summary and Discussion The results of this study, relying on univariate, bivariate and logistic regression analyses of data obtained from the Young Driver Survey questionnaire, shed light on the characteristics and behaviours of young drivers in Ontario, as a whole. As well, behavioral and characteristic differences were found among young drivers in three targeted subgroups: those who completed BDE and took a time discount (BDE w/ TD); those who completed BDE and did not take a time discount (BDE w/o TD); and those who did not complete BDE (Non-BDE). Important differences were also seen with respect to other factors such as, demographic location (i.e., urban or rural residence), gender, and licence class (i.e., G1 or G2 licensed drivers). Table summarizes the significant findings from the logistic regression analyses explored in previous sections with respect to variance between the three targeted subgroups of young drivers. Table Summary of significant differences between targeted subgroups of young drivers Behaviour BDE w/ TD significantly more likely than BDE w/o TD BDE w/ TD significantly more likely than non-bde BDE w/o TD significantly more likely than non-bde Non-BDE significantly more likely than BDE w/ TD Non-BDE significantly more likely than BDE w/o TD Driving >100 km/month (G1 drivers only) X Driving to school X Driving to work X Driving to practice driving Driving just to go for a drive Have unlimited use of a motor vehicle Driving on 400-series highways (G2 licence period) Receive more than 10 hours of supervised driving practice (G1 licence period) X X X X X X X 79
92 Table Summary of significant differences between targeted subgroups of young drivers Behaviour BDE w/ TD significantly more likely than BDE w/o TD BDE w/ TD significantly more likely than non-bde BDE w/o TD significantly more likely than non-bde Non-BDE significantly more likely than BDE w/ TD Non-BDE significantly more likely than BDE w/o TD Talking with parents about traffic safety and the rules of the X X road Talking with parents about drinking and X driving Talking with parents about texting and X driving Driving during rush hour X (G1 licence period) Driving during rush hour X (G2 licence period) Driving at night (G1 licence period) X X Driving at night (G2 licence period) X X Driving in adverse weather X X (G1 licence period) Rating their ability to pass other cars after completing BDE as X good or very good Speeding (G1 licence period) X X Speeding (G2 licence period) X Sending hand-held text messages X (G1 licence period) Sending hand-held text messages X (G2 licence period) Making hand-held calls X (G1 licence period) Making hand-held calls (G2 licence period) X 80
93 Table Summary of significant differences between targeted subgroups of young drivers Behaviour BDE w/ TD significantly more likely than BDE w/o TD BDE w/ TD significantly more likely than non-bde BDE w/o TD significantly more likely than non-bde Non-BDE significantly more likely than BDE w/ TD Non-BDE significantly more likely than BDE w/o TD Listening to music (G1 licence period) X X Listening to music (G2 licence period) X Driving tired (G1 licence period) X X Driving tired (G2 licence period) X Driving with teenage passengers X X (G2 licence period) Passing other cars because it is exciting X X (G2 licence period) Tailgating (G2 licence period) X Note: No reported instances of BDE w/o TD significantly more likely than BDE w/ TD were found. Drivers who completed BDE and took a time discount, were found to be significantly more likely to: have unlimited use of a motor vehicle; drive on 400-series highways during the G2 licence period; drive at night during the G2 licence period; speed during the G1 licence period; listen to music while driving during the G1 licence period; drive while tired during the G1 licence period; and, drive with at least one teenage passenger during the G2 licence period compared to young drivers who completed BDE without taking a time discount and drivers who did not complete BDE. The greater frequency of certain driving behaviours indicate that there is something characteristic among drivers who completed BDE and took a time discount that set them apart behaviorally from drivers who completed BDE without taking a time discount and those who did not complete BDE. Furthermore, young drivers who completed BDE and took a time discount were shown to be significantly more likely than drivers who also completed BDE but did not take a time discount to: drive during rush hour during the G1 and G2 licence period; drive at night during the G1 licence period; drive in adverse weather conditions during the G1 licence period; rate their ability to pass other cars after completing BDE as good or very good; send hand-held text messages while driving during the G1 and G2 licence periods; make hand-held phone calls while driving during the G1 and G2 licence period; listen to music while driving during the G2 licence period; pass other cars because it was exciting during the G2 licence period; and, tailgate other drivers during the G2 licence period. Again, this suggests that there is something characteristically different about drivers who complete BDE and take a time discount compared to those who complete BDE and do not take a 81
94 time discount that causes them to take more risks while driving. As well, the fact that there were very few statistically significant differences found between drivers who completed BDE without taking a time discount and those who did not complete BDE, implies that the BDE program itself is not greatly influencing the likelihood that young drivers will engage in these types of risky behaviours. Rather, it supports the hypothesis that taking a time discount is positively associated with increased risk taking behaviours while driving. However, it is unknown whether the act of taking a time discount leads to increased confidence among young drivers and ultimately to risk taking behaviours, or if drivers with pre-disposed risk taking behaviours are more likely to take a time discount. Similarly, drivers who completed BDE and took a time discount were also significantly more likely than drivers who did not complete BDE to: drive to school; drive to work; drive to practice their driving; receive more than 10 hours of supervised driving practice during the G1 licence period; speed during the G2 licence period; and, drive tired during the G2 licence period. It makes sense that young drivers, who completed BDE and took a time discount, might have done so to be able drive to and from certain activities independently sooner than if they had not completed BDE. In other words, it is possible that the need to be able to drive independently, to get themselves to school or work, prompted some young drivers to complete BDE and take a time discount in the first place. The finding that drivers who completed BDE and took a time discount were more likely to speed and drive fatigued than those who did not complete BDE also provides further evidence that they are more likely to take risks. Results of a univariate analysis examined the reasons that young drivers chose to complete or not to complete BDE. The top two reasons that young drivers decided to complete BDE were to make them a safer or more skilled driver and to qualify for an insurance discount. The third most important reason that young drivers decided to complete BDE was to get their G2 licence sooner (i.e., take a time discount). Counter to that notion, the main reason that young drivers decided not to complete BDE was that they believed it was too expensive. As well, the vast majority of drivers who did complete BDE (over 90%) believed that BDE improved their driving skills and enhanced their knowledge of road rules and safety. This adds evidence to the hypothesis that young drivers who complete BDE believe that their driving skills and knowledge have been significantly improved as a result of having completed the course. Logistic regression analyses were also conducted to discern variances in how groups of young drivers rated their driving abilities and knowledge, while controlling for differences in gender and age factors within the population that might contribute to the outcomes. Results provide evidence to support the hypothesis that drivers who complete BDE have increased confidence in their skills compared to other drivers. Across all of the following driving abilities: merging into traffic safely; making left turns at intersections; passing other cars safely; knowing who has the right of way on the road; and, vehicle handling, drivers who completed BDE (i.e., with and without taking a time discount) consistently 82
95 rated their driving skills and knowledge significantly higher than those who did not complete BDE. Although the results of self-report measures, like those in this study, cannot tell us how skilled drivers are in reality, these results do tell us that drivers who complete BDE are significantly more confident in their abilities compared to drivers who do not complete BDE. Further studies, comparing these results to those using objective measures of driving skills derived from on-road tests or naturalistic driving studies and the crash rates of young drivers in each of the targeted subgroups would likely help create a more cohesive understanding of how BDE impacts the perceptions and abilities of young drivers. This would help to identify whether young drivers have a realistic self-understanding of their skill level in relation to their actual driving abilities, in order to ensure that the BDE program is in fact improving the perceptions and abilities of young drivers, or whether it may actually be producing over-confidence in novice drivers. Very few results showed statistically significant differences between drivers who completed BDE without taking a time discount and those drivers who did not complete BDE, indicating that the behaviours and characteristics of these two subgroups of drivers are not significantly different overall. In fact, the vast majority of results revealed that young drivers who completed BDE and took a time discount were significantly more likely to engage in various risky driving behaviours (e.g., speeding, using their phones while driving, driving with teen passengers) compared to other young drivers. Young drivers who completed BDE and took a time discount were also found to be significantly more likely to have unlimited use of a motor vehicle compared to other young drivers. These two factors combined create a dangerous situation for young teens that are driving independently for the first time, sooner than they would have otherwise been doing due to the time discount. On a more positive note, results showed that young drivers who completed BDE and took a time discount were also significantly more likely to talk to their parents about risky driving behaviours like drinking and driving and texting and driving compared to drivers who completed BDE without taking a time discount. This suggests that the parents of young drivers, who complete BDE and take a time discount, may be aware or more wary of the risks associated with newly licensed drivers, and feel the need to speak with their child about such risks. It may also suggest that parents recognize that their teens are more likely to engage in these types of behaviours. As indicated previously, drivers who completed BDE and took a time discount were more likely than drivers who did not complete BDE to receive more than 10 hours of supervised driving practice during the G1 licence period. A greater percentage of drivers who completed BDE without taking a time discount also received more than 10 hours of supervised driving practice compared to drivers who did not complete BDE. However, in this case, the difference was not found to be statistically significant. This is an encouraging finding because it suggests that drivers who completed BDE and took a time discount were practicing their driving skills before driving by themselves for the first time. It may also 83
96 imply that the parents of young drivers who took a time discount were more likely to encourage their teens to practice their driving, compared to the parents of teens who do not complete BDE. Conversely, it could also suggest that drivers who are interested in taking a time discount may practice more frequently solely so that they can pass the road test to get their G2 licence sooner. Moreover, drivers who did not complete BDE were found to be significantly more likely than drivers who completed BDE and took a time discount to drive just to go for a drive. Contrary to driving for other purposes (e.g., to get to and from school), driving just to go for a drive, or just for fun, was the only driving purpose which non-bde drivers reported engaging in significantly more frequently than other drivers. This suggests that drivers who completed BDE and took a time discount, often did so in order to accomplish specific driving goals, like being able to get to school or work, as opposed to drivers who did not complete BDE. Outcomes of a univariate analysis also showed that the most common type of vehicle driven by young drivers, reported by just over half of young drivers, was a car. Sport utility vehicles (SUVs) and vans/minivans were also commonly operated by young drivers. Results also showed that many young drivers, about 47%, had access to two vehicles to drive, and about 23% had access to three or more vehicles. Only approximately three percent of licensed G1 and G2 drivers did not have access to a vehicle. As well, approximately 10% of young drivers owned their own vehicles, with about 87% of the vehicles driven by young drivers being owned by the parents or guardian of the young driver. Fathers and mothers were found to be the primary supervising drivers to the majority of drivers during their G1 licence stage, with fathers supervising a slightly larger percentage than mothers. Following parental supervisors, driving instructors were cited as the primary supervising drivers to approximately 10% of the young driver population. Additionally, results found that almost half (45%) of all G2 drivers received additional supervised driving practice after they obtained their G2 licence. This is an extremely encouraging finding because it suggests that parents were highly involved in the process of helping their teens learn how to drive. It also reveals that many parents and their teens understood the importance of continuing to receive supervised driving practice during the G2 licence period. For the most part, as is to be expected when moving through the graduated licensing process, a larger percentage of G2 drivers experienced higher-risk traffic situations (i.e., night-time driving, hazardous weather conditions, and heavy traffic) compared to driving during the G1 licence period. Approximately half of G2 drivers drove during rush hour often or very often in the average month. The majority (75%) of G2 drivers drove at night often or very often in the average month, and approximately 43% drove in adverse weather conditions often or very often. These results suggest that young G2 drivers had increased exposure to these higher-risk traffic situations, compared to when they were driving solely under supervision during the G1 licence period. While this is to be expected, such increases in driving frequency during the G2 licence period suggests that many young 84
97 drivers were only exposed to higher-risk traffic situations once they began to be able to drive independently with their G2 licence, as opposed to under supervision with a G1 licence. Results of several univariate analyses revealed differences in the percentage of drivers who engaged in certain risky driving behaviours with respect to their stage of licensing. Furthermore, outcomes of the survey showed that a larger percentage of young drivers, during their G2 licence period, engaged in speeding; texting while driving (hand-held and hands-free); making phone calls while driving (hand-held and hands-free); listening to music; and, driving while tired, compared to when they were driving with a G1 licence. This increase in risky behaviour after entering the G2 licence period may be attributed to the lessened amount of supervision while driving in the G2 licence stage. If young drivers were not being monitored by a parent in the vehicle, and especially if they had teen passengers in the car, they may have consequently been more willing to take risks while driving during the G2 period. Results showed that, as a whole, the majority of G2 licensed drivers did not often engage in certain risky behaviours during the G2 licence stage. Only a small percentage of G2 drivers, less than 5%, said that they took chances while driving for the fun of it, ran red lights, passed other cars because it was exciting, drove within two hours of consuming any type of drug or alcohol, or drove especially close to other cars to let its driver know to get out of the way often or very often. This indicates that young drivers perceived these behaviours to be quite risky while driving. On the other hand, almost half (47%) of G2 drivers said that they drove with teenage passengers often or very often, implying that young drivers perceived this behaviour to be less of a risk to their safety even though previous studies have established that teenage passengers are associated with elevated crash risks for teen drivers. Another surprising, as well as concerning finding from the analyses was the high percentage of young drivers, about 23%, who reported driving on 400-series highways during their G1 licence period. As well, about the same percentage of young drivers, just under 23%, admitted to driving unsupervised during the G1 licence period. Results of a logistic regression analysis revealed these percentages were not a coincidence, and that the same drivers who reported driving on 400-series highways during the G1 licence period, were also likely to report driving unsupervised during this period. This ultimately means that almost one-quarter of young drivers in Ontario disregarded the restrictions of the G1 licence stage at some point, suggesting the need to encourage better parental monitoring and enforcement of GDL rules to prevent these behaviours. Gender differences were also noted for certain behaviours among young drivers. Males were found to be more likely than females to: drive on 400-series highways during the G2 licence period; drive at night during the G1 licence period; drive in adverse weather conditions during the G1 licence period; use public transit; and, rate their merging, passing, and left turning abilities as good or very good before enrolling in BDE. 85
98 Conversely, females were found to be more likely than males to drive to work and to listen to music during the G2 licence period. The use of public transportation within the young driver population varied according to several variables. Overall, approximately 21% of young drivers with available public transportation indicated that the public transportation systems were very convenient in their area. Urban drivers showed increased odds that they would perceive the transportation systems in their area to be at least somewhat convenient compared to rural drivers. Along the same lines, a larger percentage of urban drivers (about 18%) took public transportation daily compared to rural drivers (about 7%). Additionally, just over 70% of young drivers indicated that they got rides from other drivers at least once per week; over 50% reported walking as a mode of transportation at least several times per week; and, approximately 9% cycled at least several times per week as a mode of transportation. 86
99 6.0 CONCLUSIONS AND CONSIDERATIONS As is evident from the richness of the survey data examined in this study, there is still much to learn about young drivers as they experience learning how to drive and in their initial years of independent driving. Understanding the characteristics of teen drivers and their driving exposure is crucial to developing effective and improved strategies for keeping drivers safe on roadways. Little is known about the many factors that surround the complex procedure of learning to drive, but it is clear from the disproportionate amount of teen crashes that it is an issue that cannot be ignored. Several characteristics, behaviours and attributes relating to young G1 and G2 drivers, ages 16 through 19, were observed in this study, confirming the need to further explore how we think about young driver education, licensing and safety. Learning how to drive safely and responsibly is a complex and difficult process to understand and implement. Graduated driver licensing programs across North America and elsewhere aim to reduce these uncertainties by targeting the risks associated with young drivers. One feature of GLS in Ontario that was intended as an incentive to encourage young drivers to complete driver education and to learn to drive safely is the time discount, which allows young drivers to obtain their G2 licence up to four months earlier than the mandatory 12-month G1 licence period. However, results of this study suggest that this particular measure to enhance the safety of young drivers in Ontario may actually be associated with increased risk. Results from the Young Driver Survey repeatedly showed that young drivers who completed BDE and took a time discount were more likely than other groups of young drivers (i.e., those who completed BDE without taking a time discount and those who did not complete BDE) to report engaging in risky and potentially dangerous behaviours, such as texting while driving, speeding, and driving in high-risk traffic situations. These young drivers, as well as other drivers who completed BDE but did not take a time discount, were also found to have a heightened sense of confidence in their driving abilities compared to drivers who did not complete BDE. Collectively, this evidence suggests that taking a time discount is significantly associated with having unrestricted use of a vehicle, an increase in risk-taking behaviours, as well as greater frequency of driving for certain purposes, likely in more dangerous circumstances. Combined with the fact that previous studies have already shown the crash risks resulting from allowing time discounts for young drivers, these results reinforce the notion that time discounts do not improve the safety of young drivers, and may actually be associated with risky behaviours among young and newly licensed drivers. Ultimately, this leads to the conclusion that young drivers who obtain their G2 licence early and experience reduced time spent under supervision have an increased risk of being involved in a crash. 87
100 Results also showed that a large percentage of young drivers do not adhere to the restrictions of the GLS program, and choose to engage in unsupervised driving and driving on 400-series highways while on a G1 licence. This is particularly concerning as it means that many young drivers are not receiving the safety benefits of always having a supervising driver accompany them while they are learning how to drive. As well, it indicates that young drivers are willing to take risks, such as driving on 400-series highways, before they are licensed to do so. The conclusion here is that increased awareness and attention needs to be given to this issue, both at a public and policy level. Both parents and young drivers need to be made aware of the risks and penalties associated with disregarding the restrictions of GLS and the enforcement community needs to emphasize the importance of ensuring these restrictions are adhered to for the safety of teen drivers and other road users on the roads with them. On a more positive note, results of this study showed that the vast majority of young drivers do not engage in certain risky driving behaviours in the average month. When asked about the frequency of engaging in certain driving behaviours while driving with a G2 licence, the majority of drivers indicated that they never took chances while driving for the fun of it; ran red lights; passed other cars because it was exciting; consumed drugs or alcohol within two hours of operating a vehicle; or, drove especially close to other vehicles to let its driver know to get out of the way. These findings suggest that most young drivers understand the risks and consequences of engaging in risky driving behaviours and do not, for the most part, participate in these behaviours. As indicated in the literature review, supervised driving practice is an essential component to GDL. Not surprisingly, parents were found to serve most often as the supervising driver to young drivers. The majority of young drivers indicate that they accumulated between 0 and 20 hours of supervised driving practice in the average month during their G1 licence period. Additionally, it was found that approximately 45% of G2 licensed drivers continued to engage in supervised driving practice during their G2 licence stage. This is an encouraging finding, as it means that young drivers and their supervisors understand the importance of practicing safe driving behaviours under supervision, even after they are no longer required to do so. Encouraging young drivers and their parents to engage in more frequent supervised driving practice during the G1 and G2 licensing periods would increase the safety benefits of this GDL component, and should ultimately reduce the risk to young drivers. And, as discussed later in this section, it may even be advisable to require a certain mandatory number of hours of supervised driving practice in the G1 period. As well, findings indicate that parents and teen drivers often talk about the risks and responsibility of driving. Over 80% of the drivers surveyed reported that they had talked to their parents about drinking and driving, texting and driving, and other distracted driving behaviours. Furthermore, about 95% of young drivers said that their parents had talked to them about traffic safety and the rules of the road at least once or twice. These findings suggest that parental communication may be a good means of disseminating 88
101 information to teen drivers about the risks of driving. Increasing the awareness, information and resources available for parents of teen drivers relating to specific risks and behaviours associated with newly licensed drivers may serve as a way to increase the safety of these young drivers. One example of such a program is TIRF s educational tool for young and novice drivers, the Young and New Driver Resource Centre, which includes factsheets, videos, and other information about various issues related to young driver safety. More information about this program can be found at: The implications of the results of this study provide the basis for several positive and effective changes to be made to the GLS and BDE programs in Ontario. On one hand, these results show that BDE gives young drivers greater confidence in their skills, as well as increases their perception of themselves as a safe and responsible driver. To the extent that these are the goals of the BDE program, it has been successful in achieving its goals. Indeed, the fact that young drivers who have taken BDE report that it had improved their driving skills and knowledge speaks to a high level of consumer satisfaction with BDE. However, it is also important that BDE completion does not result in unrealistic assessments of their driving skills and abilities given that the research has shown that overconfidence contributes to crash risk. Young drivers who complete BDE and take a time discount are different from other young drivers and have been shown to be more likely to expose themselves to adverse driving conditions (i.e., driving at night and in bad weather) and engage in risky driving behaviours (e.g., speeding) during both the G1 and G2 licensing stages. This suggests that these young drivers place themselves and others at risk, and might benefit from remaining in the protective G1-stage for the full term of 12-months rather than exit four-months earlier. In light of these facts, the Ministry of Transportation should consider reviewing the issue of a time discount as part of the GLS system. Jurisdictions that have researched the merits of the time discount have chosen to reconsider their program or modify their GDL program to allow the time discount in the intermediate stage rather than the protective learner stage (e.g., British Columbia). Alternative incentives for completing BDE, such as insurance discounts or school credits, could also be considered. On a similar note, the availability and convenience of public transportation options plays an important role in understanding the characteristics of the young driver population and the implications it has on public and program policy. This study revealed that young urban drivers are much more likely to indicate that the public transportation systems in their area were at least somewhat convenient to use compared to rural drivers. Similarly, a higher percentage of young urban drivers indicated that they take public transportation daily and walk as a mode of transportation at least once per week, as opposed to young rural drivers. In light of these results an increased focus should be given to rural drivers in the development and implementation of driver education tools, due to the fact that they 89
102 report less use and convenience of public transportation in the area they live, and consequently may have a greater likelihood to need to learn how to drive. Finally, the Ministry should consider increasing the mandatory number of in-vehicle driving hours required as part of the BDE program in order to enhance the exposure that young drivers have to on-road driving with an instructor before they begin to drive independently. In support of this consideration, a recent review of the literature from Australian, European and North American evaluations suggested that requiring hours of supervised driving practice may have optimal safety benefits to novice drivers (Senserrick and Williams 2014). The majority (90%) of young drivers said that they believed the in-vehicle portion of the BDE course was the most useful to them when learning how to drive. As well, increasing their exposure to higher-risk traffic situations as part of the BDE program (e.g., on-road lessons with a driving instructor at night) may prove beneficial to young drivers, many of whom are only exposed to these risks once they begin to drive in the G2 licence period. Increasing the cumulative practice hours among young drivers could also be achieved by requiring mandatory minimum supervised practice hours, which is a common policy in the United States. The use of driving logs that structure the types of practice (e.g., from easy to more difficult driving conditions/situations) could be promoted as a useful tool for parents and teens to incorporate into their driving practice. Furthermore, it is important to acknowledge some of the strengths and limitations of the research conducted. For example, it should be noted that this research and the outcomes discussed in this report relied on self-report data, which is known to be associated with a range of potential biases. For example, although anonymity of responses was strongly emphasized throughout the survey process, it is possible that some of the items could have been influenced by a desire to induce socially desirable responses. Conducting research where individual participants cannot be linked to their unique responses also creates difficulty in being able to verify the accuracy of the data collected. As well, due to time and budgetary restraints, a response rate of only 12% was achieved. Additional mail-outs or reminders may have served to increase overall response rates. However, the sound sampling design, overall sample size, as well as numerous quality control procedures used throughout this research study, helped to minimize these biases. As well, the results of this study largely confirm the general findings from crash studies evaluating the impact of time discounts for driver education, supporting the robustness of the results of this evaluation. Lastly, due to the structure of the GLS process in Ontario, it became difficult to make generalizations with respect to certain populations (i.e., licence class) based on the sampling design of this study. For example, due to the nature of GLS, it was impossible to obtain a perfectly balanced sample of G1 and G2 drivers across the three targeted subgroups of drivers in this study. In other words, drivers who had completed BDE and taken a time discount could only, by virtue of the licensing system in Ontario, hold a G2 licence. Thus, decisions regarding the populations to be sampled from had to be made in order to obtain the most representative population for each of the three subgroups of interest. 90
103 Overall, the outcomes of this survey show the need for further examination and consideration of the effectiveness of Ontario s Beginner Driver Education (BDE) program. While the survey does demonstrate the positive impact that driver education had on young drivers, there were also areas identified within the program that require additional attention. Notably, several risk factors were observed among G1 and G2 drivers independently, as well as drivers who completed BDE and took a time discount. The implications of these characteristics and risk factors warrant further attention and scrutiny in order to continue to improve driver education and training, as well as to decrease the still elevated crash risk among young and novice drivers. 91
104
105 REFERENCES AAA. (2006). Teen Crashes: Everyone is at Risk. Washington, DC: American Automobile Association. Auditor General of Ontario. (2007). Driver Licensing and Driver Education Examination. Toronto, Ontario: Office of the Auditor General of Ontario. Auditor General of Ontario. (2009). Driver Licensing and Driver Education Examination: Follow-up report. Toronto, Ontario: Office of the Auditor General of Ontario. Boase, P., and Tasca, L. (1998). Graduated Licensing System Evaluation: Interim Report. Toronto, Ontario: Safety Policy Branch, Ontario Ministry of Transportation. Bureau of Transportation Statistics. (2006). National Household Travel Survey. Washington, D.C. Christie, R. (2011). The Effectiveness of Driver Training as a Road Safety Measure: A Review of the Literature (2011 Edition/Update). Report prepared for the Royal Automobile Club of Victoria (RACV) Ltd., Noble Park, Victoria. Engstrom, I., Gregersen, N. P., Hernetkoski, K., Keskinen, E., and Nyberg, A. (2003). Young novice drivers, driver education and training. (Literature review, VTI-rapport 491A). Linköping, Sweden: Swedish National Road and Transport Research Institute. Ehsani, J. P., Bingham, C. R., Shope, J. T., Sunbury, T. M., and Kweon, B. (2010). Teen driving exposure in Michigan: Demographic and behavioural characteristics. Accident Analysis and Prevention, 42: Farmer, C. M., Kirley, B. B., and McCartt, A. T. (2009). In-vehicle monitoring and the driving behaviour of teenagers. Arlington, D.C.: Insurance Institute for Highway Safety. Foss, R. (2009). Future Directions for Research Motor Vehicle Crashes and Injuries Involving Teenage Drivers. Washington D.C.: Transportation Research Board, TRB Circular. Governors Highways Safety Assocation (GHSA). (2012). Survey of the States: Speeding and Aggressive Driving. Hirsch, P., Maag, U., Laberge-Nadeau, C. (2006). The role of driver education in the licensing process in Quebec. Traffic Injury Prevention,7: Klauer, S. G., Simons-Morton, B., Lee, S. E., Ouimet, M. C., Howard, E. H., and Dingus, T. A. (2011). Traffic Injury Prevention Apr;12(2): Leaf, W., Simons-Morton, B., Hartos, J., and Northrup, V. (2008). Driving miles estimates by teen drivers: How accurate are they? Injury Prevention,
106 Lee, S. E., Simons-Morton, B. G., Klauer, S. E., Ouimet, M. C., and Dingus, T.A. (2011). Naturalistic assessment of novice crash experience. Accident Analysis and Prevention, 43: Lewis-Evans, B. (2010). Crash involvement during the different phases of the New Zealand Graduated Driver Licensing System (GLDS). Journal of Safety Research, 41: Lonero, L. and Mayhew, D. (2010). Large-Scale Evaluation of Driver Education Review of the Literature on Driver Education Evaluation: 2010 Update. Washington, D.C.: AAA Foundation for Traffic Safety. Mayhew, D. R., and Simpson, H. M. (1990). New to the Road. Young drivers and novice drivers: similar problems and solutions? Ottawa. Ontario: Traffic Injury Research Foundation. Mayhew, D. R., and Simpson, H. M. (1995). The Role of Driving Experience: Implications for the Training and Licensing of New Drivers. Toronto, Ontario: Insurance Bureau of Canada. Mayhew, D. R., and Simpson, H. M. (1996) Effectiveness and Role of Driver Education in a Graduated Licensing System. Ottawa, Ontario: Traffic Injury Research Foundation. Mayhew, D. R., and Simpson, H. M. (1999). Youth and Road Crashes: Reducing the Risks from Inexperience, Immaturity and Alcohol. Ottawa, Ontario: Traffic Injury Research Foundation. Mayhew D. R., Simpson, H. M, and Pak A. (2002, unpublished). Ontario Graduated Licensing System Evaluation. Toronto Ontario: Ontario Ministry of Transportation. Mayhew, D. R., and Simpson, H. M. (2002). The safety value of driver education and training. Injury Prevention, 8(Suppl. II): ii3-ii8. Mayhew, D.R., Simpson, H.M., & Pak, A. (2003). Changes in collision rates among novice drivers during the first months of driving. Accident Analysis and Prevention, 35(5): Mayhew, D. R., and Simpson, H. M. (2003, unpublished). Formal Novice Driver Education and Exposure to the Risk of Collision in Ontario. Downsview, Ontario: Ontario Ministry of Transportation Mayhew, D. R., Simpson, H. M., Desmond, K., and Williams, A. F. (2003). Specific and longterm effects of Nova Scotia s graduated licensing program. Traffic Injury Prevention, 4:91 7. Mayhew, D. R., Singhal, D., Simpson, H. M., and Beirness, D. J. (2004). Deaths and Injuries to Young Canadians from Road Crashes. Ottawa, Ontario: Traffic Injury Research Foundation. Mayhew, D. R., Simpson, H. M, and Singhal D. (2005). Best Practices for Graduated Driver Licensing in Canada: Ottawa, Ontario: Traffic Injury Research Foundation. 94
107 Mayhew, D. R., Simpson, H. M., Singhal, D., and Desmond, K. (2006). Reducing the crash risk for young drivers. Washington, DC: American Automobile Association. Mayhew, D. R. (2007). Driver education and graduated licensing in North America: Past, present, and future. Journal of Safety Research, 38(2): Mayhew, D. R., and Vanlaar, W. (2008, unpublished). The Safety Impact of Graduated Driver Licensing. Internal report prepared for the Manitoba Public Insurance Corporation, Winnipeg, Manitoba. Mayhew, D. R., et al. (2013, under review). Evaluation of Driver Education in Manitoba and Oregon. Washington, D.C.: AAA Foundation for Traffic Safety. Mayhew, D. R., et al. (2010, unpublished). Evaluation of Manitoba s Graduated Driver Licensing Program. Ottawa, Ontario: Traffic Injury Research Foundation. McCartt, A. T., Shabanova, V. I., and Leaf, W. A. (2003). Driving experience, crashes and traffic citations of teenage beginning drivers. Accident Analysis and Prevention, 35: McCartt A. T., Mayhew, D. R., and Simpson, H. M. (2009). The effects of age and experience on young driver crashes: Review of recent literature. Traffic Injury Prevention, 10: McGehee, D. V., Raby, M., Carney, C., Lee, J. D., and Reyes, M. L. (2007). Extending parental mentoring using an event-triggered video intervention in rural teen drivers. Journal of Safety Research, 38: MTO. (2014). Get a G driver s licence: new drivers. Retrieved from: MTO. (2013). An evaluation of the Beginner Driver Education (BDE) Program in Ontario. Presentation at the annual conference of the Canadian Council for Motor Transport Administrators (CCMTA). MTO. (unknown publication date). Ontario Road Safety Annual Report (ORSAR): Retrieved from: Nichols, J. L. (2003). A review of the history and effectiveness of driver education and training as a traffic safety program. Washington, DC: National Transportation Safety Board. Parker, B., Watson, B., King, M. and Hyde, M. (2011). Mileage, car ownership, experience of punishment avoidance and the risky driving of young drivers. Traffic Injury Prevention, 12(6): Prato, C., Toledo, T., Lotan, T., Taubman, O., and Ari, B. (2010). Modeling the behaviour of novice young drivers during the first year after licensure. Accident Analysis and Prevention, 42:
108 Roberts, I., Kwan, I., and Reviewers, C. I. G. D. E. (2002). School-based driver education for the prevention of traffic crashes. The Cochrane Library, Issue 1, Oxford, England. Sagberg, F. (1998). Month-by-month changes in accident risk among novice drivers. Presented at the 24th International Congress of Applied Psychology, San Francisco, August, Senserrick, T. M., and Williams, A. F. (2014). Summary of literature on the effective components of graduated licensing schemes for car drivers. Austroads Project SS1707. Draft final report to Austroads, under review, Sydney, NSW. The University of New South Wales. Tefft, B. (2012). Motor Vehicle Crashes, Injuries, and Deaths in Relation to Driver Age: United States, Washington, D.C.: AAA Foundation for Traffic Safety. Tefft, B. C., Williams, A. F., and Grabowski J. G. (2012). Teen Driver Risk in Relation to Age and Number of Passengers. Washington, D.C.: AAA Foundation for Traffic Safety. Tefft, B. C., Williams, A. F., Grabowski, J. (2013). Timing of Driver s License Acquisition and Reasons for Delay among Young People in the United States. Washington, D.C.: AAA Foundation for Traffic Safety. Toledo, T., Musicant, O., and Lotan, T. (2008). In-vehicle data recorders for monitoring and feedback on driver s behaviour. Transportation Research Part C, 16: Thomas, F. D., III, Blomberg, R. D., Donald L., and Fisher, D. L. (2012, April). A Fresh Look at Driver Education in America. (Report No. DOT HS ). Washington, DC: National Highway Traffic Safety Administration. Vanlaar, W., Mayhew, D., Marcoux, K., Wets, G., Brijs, T., and Shope, J. (2009). An evaluation of graduated driver licensing programs in North America using a metaanalytical approach. Accident Analysis and Prevention, 41, pp Vanlaar, W., Robertson, R., Marcoux, K. (2008). The Road Safety Monitor 2007: Excessive Speeding. Ottawa: Traffic Injury Research Foundation. Vernick, J. D., Li, G., Ogaitis, S., MacKenzie, E. J., Baker, S. P., and Gielen, A. C. (1999). Effects of high school driver education on motor vehicle crashes, violations, and licensure. American Journal of Preventive Medicine, 1S, 16. Wiggins S. (2004). Graduated licensing program: interim evaluation report year 3. Victoria, Canada: Insurance Corporation of British Columbia. Williams, A. F., and Wells, J. K. (1995). Deaths of teenagers as motor vehicle passengers. Journal of Safety Research, 26(3): Williams, A. F. (2003). Teenage drivers: Patterns of risk. Journal of Safety Research, 34(1):
109 Williams, A. F., Ferguson, S. A., and Wells, J. K. (2005). Sixteen-year-old drivers in fatal crashes, United States, Traffic Injury Prevention, 6: Williams, A. F., Preusser, D. F., and Ledingham, K. A. (2009). Feasibility Study on Evaluating Driver Education Curriculum. Washington, D.C. National Highway Traffic Safety Administration. Williams, A. F., McCartt, A. T., Mayhew, D. R., and Watson, B. (2013). Licensing Age Issues: Deliberations from a Workshop. Traffic Injury Prevention, 14, Woolley, J. (2000). In car driver training at high schools: a literature review. Walkerville, South Australia: Safety Strategy, Transportation. 97
110
111 APPENDIX A Figure 5-1: Distribution of responses by sampling design BDE_TD BDE_noTD non_bde Totals 16-Urban Rural Urban Rural Urban Rural Urban Rural Totals Figure 5-2: Distribution of responses by age Number of strata = 6 Number of obs = 995 Number of PSUs = 995 Population size = Design df = 989 age - years percentages lb ub Total 100 Key: percentages = cell percentages lb = lower 95% confidence bounds for cell percentages ub = upper 95% confidence bounds for cell percentages Figure 5-3: Distribution of responses by gender Number of strata = 24 Number of obs = 995 Number of PSUs = 995 Population size = Design df = 971 are you: percentages lb ub male female Total 100 Key: percentages = cell percentages lb = lower 95% confidence bounds for cell percentages ub = upper 95% confidence bounds for cell percentages 99
112 Figure 5-4: Distribution of responses by demographics Number of strata = 24 Number of obs = 995 Number of PSUs = 995 Population size = Design df = 971 classification postalcode BDE w/ TD BDE w/o TD non-bde Total rural urban Total Key: row percentages Pearson: Uncorrected chi2(2) = Design-based F(1.59, )= 1.04e+31 P = Figure 5-5: Distribution of responses by school year Number of strata = 24 Number of obs = 995 Number of PSUs = 995 Population size = Design df = 971 Current Education Level percentages lb ub High School University Not In School Total 100 Key: percentages = cell percentages lb = lower 95% confidence bounds for cell percentages ub = upper 95% confidence bounds for cell percentages Figure 5-6: Distribution of responses by targeted subgroups Number of strata = 8 Number of obs = 995 Number of PSUs = 995 Population size = Design df = 987 classification percentages lb ub BDE w/ TD BDE w/o TD non-bde Total 100 Key: percentages = cell percentages lb = lower 95% confidence bounds for cell percentages ub = upper 95% confidence bounds for cell percentages 100
113 Figure 5-7: Distribution of subgroups by demographic information Number of strata = 4 Number of obs = 995 Number of PSUs = 995 Population size = Design df = 991 classification postalcode BDE w/ T BDE w/o non-bde Total rural [45.88,57.89] [20.85,32.29] [17.63,26.91] urban [40.97,49.61] [29.4,38.52] [17.93,24.3] Total [42.8,50.17] [28.65,36.42] [18.53,23.95] Key: row percentages [95% confidence intervals for row percentages] Pearson: Uncorrected chi2(2) = Design-based F(1.95, )= P = Figure 5-8: Distribution of subgroups by school status Number of strata = 24 Number of obs = 995 Number of PSUs = 995 Population size = Design df = 971 Current classification Education Level BDE w/ T BDE w/o non-bde Total High School [46.95,51.75] [21.33,27.31] [24.82,28.16] University [41.96,47.01] [37.03,42.58] [14.17,17.48] Not In School [27.5,56.59] [18.68,50.06] [16.92,38.45] Total [32.41,32.41] Key: row percentages [95% confidence intervals for row percentages] Pearson: Uncorrected chi2(4) = Design-based F(2.93, )= P =
114 Figure 5-9: Do drivers, who complete BDE, drive prior to enrolling in BDE? Number of strata = 16 Number of obs = 741 Number of PSUs = 741 Population size = Design df = 725 Did you drive before enrolling in BDE? percentages lb ub No Yes Total 100 Key: percentages = cell percentages lb = lower 95% confidence bounds for cell percentages ub = upper 95% confidence bounds for cell percentages Figure 5-10: How many days do G1 drivers drive in an average month? Number of strata = 4 Number of obs = 114 Number of PSUs = 114 Population size = Design df = 110 On how many days do you drive in the average month? classification 0-7 days 8-15 days days days Total BDE w/o TD [47.91,77. [17.41,46. [.9972,6.5 [.4217,20. non-bde [62.82,86. [3.748,20. [2.032,18. [3.143,19. Total [63.11,83. [6.865,20. [2,15.65] [3.013,16. Key: row percentages [95% confidence intervals for row percentages] Pearson: Uncorrected chi2(3) = Design-based F(2.51, ) = P =
115 Figure 5-11: How many days do G2 drivers drive in an average month? Number of strata = 20 Number of obs = 853 Number of PSUs = 853 Population size = Design df = 833 On how many days do you drive in the average month? classification 0-7 days 8-15 days days days Total BDE w/ TD [23.52,32.87] [17.88,26.4] [17.27,25.67] [24.59,33.93] BDE w/o TD [31.93,48.39] [15.14,28.98] [12.8,26.17] [14.46,27.75] non-bde [30.26,45.97] [11.26,23.35] [15.99,28.35] [17.97,31.86] Total [29.64,37.42] [17.73,24.42] [17.25,23.79] [22.07,28.99] Key: row percentages [95% confidence intervals for row percentages] Pearson: Uncorrected chi2(6) = Design-based F(5.32, )= P = Figure 5-12: Logistic regression Number of strata = 20 Number of obs = 853 Number of PSUs = 853 Population size = Design df = 833 F( 6, 828) = 5.04 Prob > F = Linearized days_drive Odds Ratio Std. Err. t P> t [95% Conf. Interval] classifica~n BDE w/ TD BDE w/o TD non-bde gender male female ageyears _cons
116 Figure 5-13: How many kilometers do G1 drivers drive each month? Number of strata = 4 Number of obs = 114 Number of PSUs = 114 Population size = Design df = 110 classifica How many km do you drive each month? tion < >1000 Total BDE w/o TD [32.68,64.38] [33.85,65.61] [.3223,5.016] [.0882,4.554] non-bde [67.92,88.61] [9.92,29.4] [.2863,14.14] Total [65.16,83.25] [15.18,32.25] [.3275,11.24] [.0137,.7204] Key: row percentages [95% confidence intervals for row percentages] Pearson: Uncorrected chi2(3) = Design-based F(2.06, ) = P = Figure 5-14: Logistic regression Number of strata = 4 Number of obs = 114 Number of PSUs = 114 Population size = Design df = 110 F( 2, 109) = 6.58 Prob > F = Linearized km_drive Odds Ratio Std. Err. t P> t [95% Conf. Interval] classifica~n BDE w/o TD non-bde gender male female _cons
117 Figure 5-15: How many kilometers do G2 drivers drive each month? Number of strata = 20 Number of obs = 852 Number of PSUs = 852 Population size = Design df = 832 classifica How many km do you drive each month? tion < >1000 Total BDE w/ TD [34.47,44.62] [33.09,43.12] [13.99,21.81] [3.307,7.586] BDE w/o TD [37.74,54.52] [29.39,45.7] [7.873,18.56] [2.286,8.863] non-bde [31.48,46.71] [31.79,47.4] [9.647,20.88] [4.198,12.99] Total [37.61,45.71] [33.99,41.96] [12.68,18.33] [3.804,7.101] Key: row percentages [95% confidence intervals for row percentages] Pearson: Uncorrected chi2(6) = Design-based F(5.39, )= P = Figure 5-16: Logistic regression Number of strata = 24 Number of obs = 966 Number of PSUs = 966 Population size = Design df = 942 F( 2, 941) = Prob > F = Linearized km_drive Odds Ratio Std. Err. t P> t [95% Conf. Interval] licencetype g1 licence g2 licence gender male female _cons
118 Figure 5-17: How often do young drivers drive to/from school, monthly? Number of strata = 24 Number of obs = 861 Number of PSUs = 861 Population size = Design df = 837 How often have you driven to get to/from school, classification monthly? BDE w/ TD BDE w/o TD non-bde Total Never [28.21,38.34] [37.17,54.51] [45.58,61.02] [37.1,45.11] Once [6.05,12.09] [3.76,12.4] [3.621,12.08] [5.836,10.1] Sometimes [10.34,17.86] [5.386,15.22] [6.149,15.97] [9.227,14.35] Often [9.374,16.65] [8.537,20.69] [5.334,14.14] [9.647,15.11] Very Often [27.27,37.31] [18.04,32.82] [15.81,27.57] [24.16,31.32] Total Key: column percentages [95% confidence intervals for column percentages] Pearson: Uncorrected chi2(8) = Design-based F(7.56, )= P = Figure 5-18: Logistic regression Number of strata = 24 Number of obs = 861 Number of PSUs = 861 Population size = Design df = 837 F( 6, 832) = 8.11 Prob > F = Linearized never_to_~ol Odds Ratio Std. Err. t P> t [95% Conf. Interval] classifica~n BDE w/ TD BDE w/o TD non-bde gender male female ageyears _cons
119 Figure 5-19: How often do young drivers drive to/from work, monthly? Number of strata = 24 Number of obs = 861 Number of PSUs = 861 Population size = Design df = 837 How often have you driven to get to/from work, classification monthly? BDE w/ T BDE w/o non-bde Total Never [34.99,45.68] [33.73,50.81] [48.9,63.55] [39.98,48.04] Once [1.778,5.869] [2.854,11.53] [2.042,8.436] [2.835,6.315] Sometimes [8.471,15.57] [6.185,16.74] [7.137,17.8] [8.812,14] Often [12.55,20.86] [12.93,27.34] [6.103,15] [12.97,19.28] Very Often [24.14,33.72] [16.28,30.71] [13.65,24.2] [21.5,28.35] Total Key: column percentages [95% confidence intervals for column percentages] Pearson: Uncorrected chi2(8) = Design-based F(7.43, )= P =
120 Figure 5-20: Logistic regression Number of strata = 24 Number of obs = 861 Number of PSUs = 861 Population size = Design df = 837 F( 6, 832) = 5.16 Prob > F = Linearized never_to_w~k Odds Ratio Std. Err. t P> t [95% Conf. Interval] classifica~n BDE w/ TD BDE w/o TD non-bde gender male female ageyears _cons (running logit on estimation sample) Survey: Logistic regression Number of strata = 24 Number of obs = 861 Number of PSUs = 861 Population size = Design df = 837 F( 6, 832) = 5.16 Prob > F = Linearized never_to_w~k Odds Ratio Std. Err. t P> t [95% Conf. Interval] classifica~n BDE w/ TD BDE w/o TD non-bde gender male female ageyears _cons
121 Figure 5-21: How often do young drivers drive as part of a job, monthly? Number of strata = 24 Number of obs = 861 Number of PSUs = 861 Population size = Design df = 837 How often have you driven as part of your job, classification monthly? BDE w/ T BDE w/o non-bde Total Never [74.88,83.71] [80.13,91.92] [78.04,88.94] [79.67,85.72] Once [2.158,6.76] [.9352,7.009] [1.084,5.517] [2.036,4.941] Sometimes [2.224,6.472] [1.194,7.774] [1.218,7.497] [2.243,5.242] Often [3.988,9.631] [1.184,7.818] [3.045,10.77] [3.643,7.269] Very Often [4.344,9.474] [1.635,9.83] [2.258,8.497] [3.78,7.404] Total Key: column percentages [95% confidence intervals for column percentages] Pearson: Uncorrected chi2(8) = Design-based F(7.32, )= P =
122 Figure 5-22: Logistic regression Number of strata = 24 Number of obs = 861 Number of PSUs = 861 Population size = Design df = 837 F( 7, 831) = 2.65 Prob > F = Linearized never_to_job Odds Ratio Std. Err. t P> t [95% Conf. Interval] classifica~n BDE w/ TD BDE w/o TD non-bde gender male female ageyears num_postal~e Rural Urban _cons (running logit on estimation sample) Survey: Logistic regression Number of strata = 24 Number of obs = 861 Number of PSUs = 861 Population size = Design df = 837 F( 7, 831) = 2.65 Prob > F = Linearized never_to_job Odds Ratio Std. Err. t P> t [95% Conf. Interval] classifica~n BDE w/ TD BDE w/o TD non-bde gender male female ageyears num_postal~e Rural Urban _cons
123 Figure 5-23: How often do young drivers drive to/from recreational or social activities, monthly? Number of strata = 24 Number of obs = 861 Number of PSUs = 861 Population size = Design df = 837 How often have you driven to get to/from recreational or social activities, classification mont BDE w/ TD BDE w/o TD non-bde Total Never [13.31,21.49] [13.93,26.42] [25.91,40] [17.88,24.14] Once [11.32,19.21] [15.08,30.19] [9.348,19.45] [13.79,20.21] Sometimes [26.48,36.42] [15.38,29.6] [17.44,30] [23.25,30.31] Often [22.28,32.14] [15.47,30.53] [13.68,26.2] [20.47,27.66] Very Often [7.219,13.67] [9.621,22.97] [7.773,16.69] [9.421,14.92] Total Key: column percentages [95% confidence intervals for column percentages] Pearson: Uncorrected chi2(8) = Design-based F(7.38, )= P =
124 Figure 5-24: Logistic regression Number of strata = 24 Number of obs = 861 Number of PSUs = 861 Population size = Design df = 837 F( 6, 832) = 9.73 Prob > F = Linearized never_to_~al Odds Ratio Std. Err. t P> t [95% Conf. Interval] classifica~n BDE w/ TD BDE w/o TD non-bde gender male female ageyears _cons (running logit on estimation sample) Survey: Logistic regression Number of strata = 24 Number of obs = 861 Number of PSUs = 861 Population size = Design df = 837 F( 6, 832) = 9.73 Prob > F = Linearized never_to_~al Odds Ratio Std. Err. t P> t [95% Conf. Interval] classifica~n BDE w/ TD BDE w/o TD non-bde gender male female ageyears _cons
125 Figure 5-25: How often do young drivers drive to practice driving, monthly? Number of strata = 24 Number of obs = 861 Number of PSUs = 861 Population size = Design df = 837 How often have you driven to practice driving, classification monthly? BDE w/ T BDE w/o non-bde Total Never [3.713,9.253] [4.777,14.2] [15.55,28.34] [7.61,12.28] Once [3.857,9.164] [7.959,20.53] [5.884,16.66] [6.751,11.88] Sometimes [21.41,30.72] [24.08,40.45] [20.29,33.84] [24.25,31.64] Often [30.43,40.88] [16.23,30.69] [18.03,31.22] [25.67,32.99] Very Often [22.26,31.98] [17.34,32.9] [13.6,23.84] [20.95,28.07] Total Key: column percentages [95% confidence intervals for column percentages] Pearson: Uncorrected chi2(8) = Design-based F(7.49, )= P =
126 Figure 5-26: Logistic regression Number of strata = 24 Number of obs = 861 Number of PSUs = 861 Population size = Design df = 837 F( 6, 832) = 9.08 Prob > F = Linearized never_to_p~e Odds Ratio Std. Err. t P> t [95% Conf. Interval] classifica~n BDE w/ TD BDE w/o TD non-bde gender male female ageyears _cons (running logit on estimation sample) Survey: Logistic regression Number of strata = 24 Number of obs = 861 Number of PSUs = 861 Population size = Design df = 837 F( 6, 832) = 9.08 Prob > F = Linearized never_to_p~e Odds Ratio Std. Err. t P> t [95% Conf. Interval] classifica~n BDE w/ TD BDE w/o TD non-bde gender male female ageyears _cons
127 Figure 5-27: How often do young drivers drive just to go for a drive, monthly? Number of strata = 24 Number of obs = 861 Number of PSUs = 861 Population size = Design df = 837 How often have you driven just to go for a drive, classification monthly? BDE w/ T BDE w/o non-bde Total Never [67.93,77.27] [58.3,74.13] [37.69,49.29] [61.45,68.6] Once [8.327,15] [8.654,19.79] [13.74,27.17] [11.03,16.47] Sometimes [7.627,14.19] [6.821,17.99] [13.11,26.39] [9.925,15.31] Often [2.48,6.283] [2.177,9.877] [6.595,18.11] [4.041,7.728] Very Often [.606,3.585] [1.838,8.889] [3.669,13.03] [2.182,5.252] Total Key: column percentages [95% confidence intervals for column percentages] Pearson: Uncorrected chi2(8) = Design-based F(7.58, )= P =
128 Figure 5-28: Logistic regression Number of strata = 24 Number of obs = 861 Number of PSUs = 861 Population size = Design df = 837 F( 6, 832) = Prob > F = Linearized never_to_g~e Odds Ratio Std. Err. t P> t [95% Conf. Interval] classifica~n BDE w/ TD BDE w/o TD non-bde gender male female ageyears _cons (running logit on estimation sample) Survey: Logistic regression Number of strata = 24 Number of obs = 861 Number of PSUs = 861 Population size = Design df = 837 F( 6, 832) = Prob > F = Linearized never_to_g~e Odds Ratio Std. Err. t P> t [95% Conf. Interval] classifica~n BDE w/ TD BDE w/o TD non-bde gender male female ageyears _cons
129 Figure 5-29: Do young drivers have unlimited access to a vehicle? Number of strata = 24 Number of obs = 980 Number of PSUs = 980 Population size = Design df = 956 Do you have unlimited use of vehicle? classification No Yes Total BDE w/ TD [41.89,52.16] [47.84,58.11] BDE w/o TD [50.16,65.95] [34.05,49.84] non-bde [50.93,65.12] [34.88,49.07] Total [49.17,56.79] [43.21,50.83] Key: row percentages [95% confidence intervals for row percentages] Pearson: Uncorrected chi2(2) = Design-based F(1.91, )= P = Figure 5-30: Logistic regression Number of strata = 24 Number of obs = 980 Number of PSUs = 980 Population size = Design df = 956 F( 6, 951) = 2.44 Prob > F = Linearized unlimited_~e Odds Ratio Std. Err. t P> t [95% Conf. Interval] classifica~n BDE w/ TD BDE w/o TD non-bde gender male female ageyears _cons
130 Figure 5-31: Who owns the vehicles that young drivers operate? Number of strata = 24 Number of obs = 978 Number of PSUs = 978 Population size = Design df = 954 Who owns the vehicle classification you drive? BDE w/ TD BDE w/o TD non-bde Total you [9.018,15.44] [3.889,11.1] [5.289,11.28] [7.524,11.48] your parents/guardian [82.46,89.34] [81.91,92.24] [78.78,88.62] [83.69,88.73] other family member [.5081,2.844] [1.458,9.079] [2.597,8.609] [1.698,4.476] friend [.2965,5.9] [.9568,7.62] [.4216,2.429] other [.1659,2.719] [.07959,1.201 [.09144,1.657 [.1907,1.297] Total Key: column percentages [95% confidence intervals for column percentages] Pearson: Uncorrected chi2(8) = Design-based F(6.52, )= P = Figure 5-32: Logistic regression Number of strata = 24 Number of obs = 978 Number of PSUs = 978 Population size = Design df = 954 F( 7, 948) = Prob > F = Linearized driver_owns Odds Ratio Std. Err. t P> t [95% Conf. Interval] classifica~n BDE w/ TD BDE w/o TD non-bde gender male female ageyears num_postal~e Rural Urban _cons
131 Figure 5-33: Who has unlimited use of a motor vehicle? Number of strata = 24 Number of obs = 978 Number of PSUs = 978 Population size = Design df = 954 Do you have unlimited use of vehicle? Vehicle Ownership No Yes Total Someone Else Owns Vehicle [53.64,61.71] [38.29,46.36] Owns Vehicle [2.912,15.11] [84.89,97.09] Total [49.15,56.79] [43.21,50.85] Key: row percentages [95% confidence intervals for row percentages] Pearson: Uncorrected chi2(1) = Design-based F(1, 954) = P = Figure 5-34: What type of vehicles do young drivers operate? Number of strata = 24 Number of obs = 978 Number of PSUs = 978 Population size = Design df = 954 What type of vehicle do you drive most often? percentages lb ub other (please s car minivan/family sport utility v pick-up truck motorcycle Total 100 Key: percentages = cell percentages lb = lower 95% confidence bounds for cell percentages ub = upper 95% confidence bounds for cell percentages 119
132 Figure 5-35: How many vehicles do young drivers have access to drive? Number of strata = 24 Number of obs = 978 Number of PSUs = 978 Population size = Design df = 954 How many vehicles do you have access classification to drive? BDE w/ T BDE w/o non-bde Total do not have access [.4997,3.355] [1.566,9.302] [1.165,7.291] [1.416,4.316] [21.26,30.4] [20.48,34.68] [28.79,42.59] [24.78,31.7] [42.26,52.53] [39.5,55.44] [37.91,52.28] [43.05,50.73] [16.9,25.02] [12.67,24.95] [7.795,17.65] [15.21,21.05] [3.336,7.732] [1.873,7.211] [2.487,9.073] [3.344,6.274] Total Key: column percentages [95% confidence intervals for column percentages] Pearson: Uncorrected chi2(8) = Design-based F(7.65, )= P = Figure 5-36: Logistic regression Number of strata = 24 Number of obs = 978 Number of PSUs = 978 Population size = Design df = 954 F( 6, 949) = 1.87 Prob > F = Linearized number_veh~1 Odds Ratio Std. Err. t P> t [95% Conf. Interval] classifica~n BDE w/ TD BDE w/o TD non-bde gender male female ageyears _cons
133 Figure 5-37: Who served most often as the supervising driver during G1 stage? Number of strata = 24 Number of obs = 983 Number of PSUs = 983 Population size = Design df = 959 Who is/was the supervising driver most often during G1? percentages lb ub other (please specify) mother father older sibling other relative friend driving instructor drove alone did not drive during this period Total 100 Key: percentages = cell percentages lb = lower 95% confidence bounds for cell percentages ub = upper 95% confidence bounds for cell percentages Figure 5-38: On average, how many hours of supervision do young drivers get per month during the G1 licence stage? Number of strata = 24 Number of obs = 970 Number of PSUs = 970 Population size = Design df = 946 # supervised hours monthly, classification G1 BDE w/ T BDE w/o non-bde Total 0-10 hours [30.34,40.28] [34.81,50.73] [45.08,58.77] [37.3,44.83] hours [29.9,39.77] [27.58,42.96] [18.76,30.84] [29.07,36.32] hours [12.58,20.22] [7.036,17.77] [5.35,13.44] [10.6,15.82] hours [5.392,10.76] [2.858,11.5] [3.611,8.706] [4.999,8.795] hours [2.883,7.164] [.7131,5.797] [2.591,9.11] [2.68,5.456] 51+ hours [1.033,3.532] [1.398,7.683] [2.491,8.429] [1.927,4.425] Total Key: column percentages [95% confidence intervals for column percentages] Pearson: Uncorrected chi2(10) = Design-based F(9.08, )= P =
134 Figure 5-39: Logistic regression Number of strata = 24 Number of obs = 970 Number of PSUs = 970 Population size = Design df = 946 F( 6, 941) = 5.18 Prob > F = Linearized supervisio~1 Odds Ratio Std. Err. t P> t [95% Conf. Interval] classifica~n BDE w/ TD BDE w/o TD non-bde gender male female ageyears _cons Figure 5-40: Do young drivers get additional supervised driving practice once they obtain a G2 licence? Number of strata = 20 Number of obs = 868 Number of PSUs = 868 Population size = Design df = 848 Did the driver get supervision during G2? percentages lb ub yes no Total 100 Key: percentages = cell percentages lb = lower 95% confidence bounds for cell percentages ub = upper 95% confidence bounds for cell percentages 122
135 Figure 5-41: In the average month, how often do young G1 drivers operate a vehicle unsupervised? Number of strata = 24 Number of obs = 970 Number of PSUs = 970 Population size = Design df = 946 How often do/did you drive without classification supervisor? BDE w/ T BDE w/o non-bde Total never/rarely [69.61,78.69] [72.13,85.48] [73.04,84.99] [73.73,80.27] once per month [2.938,7.739] [2.227,10.08] [1.098,7.519] [2.987,6.474] once per week [5.449,10.96] [3.885,12.77] [4.281,12.33] [5.677,9.799] several times p [6.73,13.08] [3.979,12.34] [3.046,9.106] [6.006,10.15] almost every da [2.083,6.105] [.2963,5.881] [2.399,9.229] [2.041,4.711] Total Key: column percentages [95% confidence intervals for column percentages] Pearson: Uncorrected chi2(8) = Design-based F(7.44, )= P = Figure 5-42: Logistic regression Number of strata = 24 Number of obs = 962 Number of PSUs = 962 Population size = Design df = 938 F( 5, 934) = 3.98 Prob > F = Linearized unsupervis~y Odds Ratio Std. Err. t P> t [95% Conf. Interval] never_high~ gender male female ageyears _cons
136 Figure 5-43: Do parents/guardians restrict the hours that G1 drivers have access to a vehicle? Number of strata = 4 Number of obs = 114 Number of PSUs = 114 Population size = Design df = 110 Do your parents/guardians restrict the hours access to a vehicle? classification No Yes Total BDE w/o TD [44.08,74.79] [25.21,55.92] non-bde [32.88,60.05] [39.95,67.12] Total [36.67,60.28] [39.72,63.33] Key: row percentages [95% confidence intervals for row percentages] Pearson: Uncorrected chi2(1) = Design-based F(1, 110) = P = Figure 5-44: Do parents/guardians restrict the hours that G2 drivers have access to a vehicle? Number of strata = 20 Number of obs = 850 Number of PSUs = 850 Population size = Design df = 830 Do your parents/guardians restrict the hours access to a vehicle? classification No Yes Total BDE w/ TD [56.34,66.28] [33.72,43.66] BDE w/o TD [53.88,70.18] [29.82,46.12] non-bde [52.56,68.12] [31.88,47.44] Total [57.6,65.53] [34.47,42.4] Key: row percentages [95% confidence intervals for row percentages] Pearson: Uncorrected chi2(2) = Design-based F(1.77, )= P =
137 Figure 5-45: Do G1 drivers have a curfew set by their parents/guardians when they are driving? Number of strata = 4 Number of obs = 113 Number of PSUs = 113 Population size = Design df = 109 Do your parents/guardians set a curfew? classification No Yes Total BDE w/o TD [36.29,68.39] [31.61,63.71] non-bde [34.8,62.07] [37.93,65.2] Total [37.11,60.92] [39.08,62.89] Key: row percentages [95% confidence intervals for row percentages] Pearson: Uncorrected chi2(1) = Design-based F(1, 109) = P = Figure 5-46: Do G2 drivers have a curfew set by their parents/guardians when they are driving? Number of strata = 20 Number of obs = 848 Number of PSUs = 848 Population size = Design df = 828 Do your parents/guardians set a curfew? classification No Yes Total BDE w/ TD [48.62,58.82] [41.18,51.38] BDE w/o TD [47.29,64.09] [35.91,52.71] non-bde [49.45,65.26] [34.74,50.55] Total [50.89,59.05] [40.95,49.11] Key: row percentages [95% confidence intervals for row percentages] Pearson: Uncorrected chi2(2) = Design-based F(1.77, )= P =
138 Figure 5-47: How many teen drivers do parents/guardians allow in the vehicle with young drivers during G1 licence stage? Number of strata = 24 Number of obs = 959 Number of PSUs = 959 Population size = Design df = 935 How many teens do your parents allow you to classification have during G1? BDE w/ T BDE w/o non-bde Total [22.23,31.49] [24.03,39.33] [19.88,32.28] [24.46,31.55] [12.83,20.29] [14.38,27.37] [10.78,20.95] [14.52,20.38] [6.046,11.49] [3.274,11.21] [3.253,8.944] [5.393,9.118] [2.76,7.422] [1.747,9.138] [1.734,8.455] [2.875,6.241] [.7529,3.609] [.3641,3.028] [.8288,5.673] [.9257,2.67] don't know / ne [35.16,45.41] [24.7,39.34] [29.21,43.4] [32.9,40.28] have not driven [1.214,4.753] [3.092,11.03] [7.386,18.1] [3.946,7.644] Total Key: column percentages [95% confidence intervals for column percentages] Pearson: Uncorrected chi2(12) = Design-based F(11.19, )= P =
139 Figure 5-48: How many teen drivers do parents/guardians allow in the vehicle with young drivers during G2 licence stage? Number of strata = 20 Number of obs = 846 Number of PSUs = 846 Population size = Design df = 826 How many teens do your parents allow you to classification have during G2? BDE w/ T BDE w/o non-bde Total [1.056,4.509] [.6344,6.099] [2.774,10.67] [1.589,4.172] [4.88,10.22] [7.297,18.7] [5.546,15.54] [6.882,11.82] [7.289,13.28] [5.863,15.84] [8.245,18.95] [8.073,12.88] [9.013,15.56] [6.889,17.54] [4.403,11.72] [8.73,13.78] [26.56,36.24] [14.46,28.28] [16.77,30.25] [22.95,30.11] don't know / ne [32.49,42.53] [36.39,53.33] [33.58,49.61] [36.43,44.59] have not driven [.0617,1.886] [.1357,6.679] [.0858,1.131] Total Key: column percentages [95% confidence intervals for column percentages] Pearson: Uncorrected chi2(12) = Design-based F(10.75, )= P =
140 Figure 5-49: How often do parents/guardians talk to young drivers about traffic safety and rules of the road? Number of strata = 24 Number of obs = 959 Number of PSUs = 959 Population size = Design df = 935 How many times have your parents talked to you about traffic safety and rules? classification never once or several Total BDE w/ TD [2.271,6.797] [24.69,34.12] [61.84,71.54] BDE w/o TD [3.161,11.31] [20.28,34.86] [58.82,74.24] non-bde [1.776,8.224] [8.498,17.66] [77.8,88.36] Total [3.166,6.691] [21.7,28.44] [66.79,73.89] Key: row percentages [95% confidence intervals for row percentages] Pearson: Uncorrected chi2(4) = Design-based F(3.80, )= P = Figure 5-50: Logistic regression Number of strata = 24 Number of obs = 959 Number of PSUs = 959 Population size = Design df = 935 F( 6, 930) = 4.10 Prob > F = Linearized rules_conv~1 Odds Ratio Std. Err. t P> t [95% Conf. Interval] classifica~n BDE w/ TD BDE w/o TD non-bde gender male female ageyears _cons
141 Figure 5-51: Do parents/guardians talk to young drivers about drinking and driving? Number of strata = 24 Number of obs = 959 Number of PSUs = 959 Population size = Design df = 935 Have your parents ever talked to you about drinking and driving? classification yes no Total BDE w/ TD [81.31,88.87] [11.13,18.69] BDE w/o TD [68.01,81.88] [18.12,31.99] non-bde [74.32,86.12] [13.88,25.68] Total [78.02,84.24] [15.76,21.98] Key: row percentages [95% confidence intervals for row percentages] Pearson: Uncorrected chi2(2) = Design-based F(1.93, )= P = Figure 5-52: Do parents/guardians talk to young drivers about texting and driving? Number of strata = 24 Number of obs = 959 Number of PSUs = 959 Population size = Design df = 935 Have your parents ever talked to you about texting and driving? classification yes no Total BDE w/ TD [82.99,90.15] [9.855,17.01] BDE w/o TD [69.17,82.69] [17.31,30.83] non-bde [75.56,87.37] [12.63,24.44] Total [79.39,85.43] [14.57,20.61] Key: row percentages [95% confidence intervals for row percentages] Pearson: Uncorrected chi2(2) = Design-based F(1.95, )= P =
142 Figure 5-53: Do parents/guardians talk to young drivers about distracted driving other than texting and driving? Number of strata = 24 Number of obs = 959 Number of PSUs = 959 Population size = Design df = 935 Have your parents ever talked to you about distracted driving? classification yes no Total BDE w/ TD [80.96,88.53] [11.47,19.04] BDE w/o TD [73.25,85.74] [14.26,26.75] non-bde [79.12,89.79] [10.21,20.88] Total [80.46,86.27] [13.73,19.54] Key: row percentages [95% confidence intervals for row percentages] Pearson: Uncorrected chi2(2) = Design-based F(1.94, )= P =
143 Figure 5-54: Logistic regression drunkdrive_conversation : 0=No 1=Yes (running logit on estimation sample) Survey: Logistic regression Number of strata = 24 Number of obs = 959 Number of PSUs = 959 Population size = Design df = 935 F( 6, 930) = 1.91 Prob > F = Linearized drunkdrive~n Odds Ratio Std. Err. t P> t [95% Conf. Interval] classifica~n BDE w/ TD BDE w/o TD non-bde gender male female ageyears _cons (running logit on estimation sample) Survey: Logistic regression Number of strata = 24 Number of obs = 959 Number of PSUs = 959 Population size = Design df = 935 F( 6, 930) = 1.91 Prob > F = Linearized drunkdrive~n Odds Ratio Std. Err. t P> t [95% Conf. Interval] classifica~n BDE w/ TD BDE w/o TD non-bde gender male female ageyears _cons
144 Figure 5-55: Logistic regression text_conversation : 0=No 1=Yes (running logit on estimation sample) Survey: Logistic regression Number of strata = 24 Number of obs = 959 Number of PSUs = 959 Population size = Design df = 935 F( 6, 930) = 2.14 Prob > F = Linearized text_conve~n Odds Ratio Std. Err. t P> t [95% Conf. Interval] classifica~n BDE w/ TD BDE w/o TD non-bde gender male female ageyears _cons (running logit on estimation sample) Survey: Logistic regression Number of strata = 24 Number of obs = 959 Number of PSUs = 959 Population size = Design df = 935 F( 6, 930) = 2.14 Prob > F = Linearized text_conve~n Odds Ratio Std. Err. t P> t [95% Conf. Interval] classifica~n BDE w/ TD BDE w/o TD non-bde gender male female ageyears _cons
145 Figure 5-56: Logistic regression distraction_conversation : 0=No 1=Yes (running logit on estimation sample) Survey: Logistic regression Number of strata = 24 Number of obs = 959 Number of PSUs = 959 Population size = Design df = 935 F( 6, 930) = 1.49 Prob > F = Linearized distractio~n Odds Ratio Std. Err. t P> t [95% Conf. Interval] classifica~n BDE w/ TD BDE w/o TD non-bde gender male female ageyears _cons (running logit on estimation sample) Survey: Logistic regression Number of strata = 24 Number of obs = 959 Number of PSUs = 959 Population size = Design df = 935 F( 6, 930) = 1.49 Prob > F = Linearized distractio~n Odds Ratio Std. Err. t P> t [95% Conf. Interval] classifica~n BDE w/ TD BDE w/o TD non-bde gender male female ageyears _cons
146 Figure 5-57: How often do young drivers drive on 400-series highways during G1 licence period? Number of strata = 24 Number of obs = 974 Number of PSUs = 974 Population size = Design df = 950 How often do/did you drive on 400-series highways during classification G1? BDE w/ T BDE w/o non-bde Total Never [69.03,78.16] [73.16,86.42] [73.8,84.72] [73.92,80.37] Once [11.13,18.27] [9.648,21.47] [8.54,17.91] [11.54,16.94] Sometimes [4.626,10.05] [1.265,8.399] [2.597,8.833] [3.806,7.298] Often [2.182,6.331] [.1004,2.448] [.9053,4.434] [1.499,3.601] Very Often [.4125,3.528] [.1331,6.553] [.2553,2.805] [.4548,2.428] Total Key: column percentages [95% confidence intervals for column percentages] Pearson: Uncorrected chi2(8) = Design-based F(6.72, )= P =
147 Figure 5-58: How often do young drivers drive on 400-series highways during G2 licence period? Number of strata = 20 Number of obs = 853 Number of PSUs = 853 Population size = Design df = 833 How often do/did you drive on 400-series highways during classification G2? BDE w/ T BDE w/o non-bde Total Never [18.81,27.41] [24.39,40.28] [22.66,36.9] [23.3,30.63] Once [15.9,24.07] [18.68,33.23] [20.77,35.36] [19.43,26.29] Sometimes [16.28,24.51] [9.763,21.97] [11.3,23.03] [14.89,21.06] Often [13.6,21.59] [10.72,23.63] [8.774,19.55] [13.44,19.66] Very Often [16.26,24.79] [7.446,18.5] [9.002,20.2] [13.66,19.65] Total Key: column percentages [95% confidence intervals for column percentages] Pearson: Uncorrected chi2(8) = Design-based F(7.05, )= P =
148 Figure 5-59: Logistic regression Number of strata = 20 Number of obs = 853 Number of PSUs = 853 Population size = Design df = 833 F( 6, 828) = 6.38 Prob > F = Linearized highwa~2_reg Odds Ratio Std. Err. t P> t [95% Conf. Interval] classifica~n BDE w/ TD BDE w/o TD non-bde gender male female ageyears _cons (running logit on estimation sample) Survey: Logistic regression Number of strata = 20 Number of obs = 853 Number of PSUs = 853 Population size = Design df = 833 F( 6, 828) = 6.38 Prob > F = Linearized highwa~2_reg Odds Ratio Std. Err. t P> t [95% Conf. Interval] classifica~n BDE w/ TD BDE w/o TD non-bde gender male female ageyears _cons
149 Figure 5-60: How often do young drivers operate vehicles during rush hour during G1? Number of strata = 24 Number of obs = 974 Number of PSUs = 974 Population size = Design df = 950 How often do/did you drive during rush hour classification during G1? BDE w/ TD BDE w/o TD non-bde Total Never [17.12,25.48] [24.77,39.56] [29.51,43.3] [24.38,31.22] Once [21.61,30.65] [18.52,32.67] [19.86,32.39] [22.29,29.04] Sometimes [28.2,37.96] [25.19,40.48] [16.61,28.41] [26.92,34.09] Often [12.02,19.58] [4.886,13.18] [7.992,16.65] [10.09,14.83] Very Often [2.998,7.624] [1.114,7.259] [2.578,8.307] [2.905,5.921] Total Key: column percentages [95% confidence intervals for column percentages] Pearson: Uncorrected chi2(8) = Design-based F(7.51, )= P = Figure 5-61: How often do young drivers operate vehicles during rush hour during G2? Number of strata = 20 Number of obs = 853 Number of PSUs = 853 Population size = Design df = 833 How often do/did you drive during rush hour classification during G2? BDE w/ TD BDE w/o TD non-bde Total Never [4.724,9.693] [5.003,14.61] [8.678,19.44] [6.401,10.77] Once [9.966,16.83] [11.21,24.11] [9.172,20.31] [11.7,17.56] Sometimes [22.34,31.42] [22.65,38.41] [16.57,30.03] [23.65,31.07] Often [28.39,38.21] [18.4,33.22] [18.67,32.93] [25.65,33.12] Very Often [16.54,24.98] [13.89,26.98] [18.92,32.94] [17.75,24.3] Total Key: column percentages [95% confidence intervals for column percentages] Pearson: Uncorrected chi2(8) = Design-based F(7.15, )= P =
150 Figure 5-62: Logistic regression rushhour_g1_reg : 0=Not Often 1=Often or Very Often (running logit on estimation sample) Survey: Logistic regression Number of strata = 24 Number of obs = 974 Number of PSUs = 974 Population size = Design df = 950 F( 6, 945) = 2.91 Prob > F = Linearized rushho~1_reg Odds Ratio Std. Err. t P> t [95% Conf. Interval] classifica~n BDE w/ TD BDE w/o TD non-bde gender male female ageyears _cons (running logit on estimation sample) Survey: Logistic regression Number of strata = 24 Number of obs = 974 Number of PSUs = 974 Population size = Design df = 950 F( 6, 945) = 2.91 Prob > F = Linearized rushho~1_reg Odds Ratio Std. Err. t P> t [95% Conf. Interval] classifica~n BDE w/ TD BDE w/o TD non-bde gender male female ageyears _cons
151 Figure 5-63: Logistic regression rushhour_g2_reg : 0=Not Often 1=Often or Very Often (running logit on estimation sample) Survey: Logistic regression Number of strata = 20 Number of obs = 853 Number of PSUs = 853 Population size = Design df = 833 F( 6, 828) = 1.36 Prob > F = Linearized rushho~2_reg Odds Ratio Std. Err. t P> t [95% Conf. Interval] classifica~n BDE w/ TD BDE w/o TD non-bde gender male female ageyears _cons (running logit on estimation sample) Survey: Logistic regression Number of strata = 20 Number of obs = 853 Number of PSUs = 853 Population size = Design df = 833 F( 6, 828) = 1.36 Prob > F = Linearized rushho~2_reg Odds Ratio Std. Err. t P> t [95% Conf. Interval] classifica~n BDE w/ TD BDE w/o TD non-bde gender male female ageyears _cons
152 Figure 5-64: How often do young drivers operate vehicles at night during G1? Number of strata = 24 Number of obs = 974 Number of PSUs = 974 Population size = Design df = 950 How often do/did you drive at night classification during G1? BDE w/ TD BDE w/o TD non-bde Total Never [11.87,19.49] [24.52,39.44] [23.14,36.77] [20.38,27.03] Once [17.52,26.27] [11.17,23.06] [8.32,18.35] [15.13,21.1] Sometimes [24.64,34.03] [28.52,43.91] [22.69,35.19] [27.69,34.84] Often [17.99,26.29] [9.736,20.01] [15.88,27.51] [16.54,22.18] Very Often [9.164,15.97] [.7324,6.879] [5.366,12.81] [6.431,10.33] Total Key: column percentages [95% confidence intervals for column percentages] Pearson: Uncorrected chi2(8) = Design-based F(7.44, )= P = Figure 5-65: How often do young drivers operate vehicles at night during G2? Number of strata = 20 Number of obs = 853 Number of PSUs = 853 Population size = Design df = 833 How often do you drive at night during classification G2? BDE w/ TD BDE w/o TD non-bde Total Never [1.744,5.588] [2.366,10.09] [3.948,13.33] [2.951,6.38] Once [.8624,3.48] [7.71,19.89] [2.19,10.34] [4.031,8.531] Sometimes [12.04,19.64] [8.47,20.47] [12.49,25.18] [12.37,18.3] Often [30.22,40.12] [21.78,36.86] [13.11,24.91] [26.9,34.38] Very Often [39.59,49.83] [32.44,48.8] [43.5,59.51] [40.15,48.22] Total Key: column percentages [95% confidence intervals for column percentages] Pearson: Uncorrected chi2(8) = Design-based F(7.25, )= P =
153 Figure 5-66: Logistic regression nightdriving_g1_reg : 0=Not Often 1=Often or Very Often (running logit on estimation sample) Survey: Logistic regression Number of strata = 24 Number of obs = 974 Number of PSUs = 974 Population size = Design df = 950 F( 6, 945) = 4.78 Prob > F = Linearized nightd~1_reg Odds Ratio Std. Err. t P> t [95% Conf. Interval] classifica~n BDE w/ TD BDE w/o TD non-bde gender male female ageyears _cons (running logit on estimation sample) Survey: Logistic regression Number of strata = 24 Number of obs = 974 Number of PSUs = 974 Population size = Design df = 950 F( 6, 945) = 4.78 Prob > F = Linearized nightd~1_reg Odds Ratio Std. Err. t P> t [95% Conf. Interval] classifica~n BDE w/ TD BDE w/o TD non-bde gender male female ageyears _cons
154 Figure 5-67: Logistic regression nightdriving_g2_reg : 0=Not Often 1=Often or Very Often (running logit on estimation sample) Survey: Logistic regression Number of strata = 20 Number of obs = 853 Number of PSUs = 853 Population size = Design df = 833 F( 6, 828) = 1.66 Prob > F = Linearized nightd~2_reg Odds Ratio Std. Err. t P> t [95% Conf. Interval] classifica~n BDE w/ TD BDE w/o TD non-bde gender male female ageyears _cons (running logit on estimation sample) Survey: Logistic regression Number of strata = 20 Number of obs = 853 Number of PSUs = 853 Population size = Design df = 833 F( 6, 828) = 1.66 Prob > F = Linearized nightd~2_reg Odds Ratio Std. Err. t P> t [95% Conf. Interval] classifica~n BDE w/ TD BDE w/o TD non-bde gender male female ageyears _cons
155 Figure 5-68: How often do young drivers operate vehicles in adverse weather conditions during G1? Number of strata = 24 Number of obs = 974 Number of PSUs = 974 Population size = Design df = 950 How often do/did you drive in adverse weather classification during G1? BDE w/ TD BDE w/o TD non-bde Total Never [18.24,26.9] [26.68,42.01] [30.52,44.59] [25.82,32.89] Once [30.78,40.73] [29.15,44.81] [19.04,30.97] [30,37.33] Sometimes [23.25,32.45] [17.29,30.42] [20.24,32.96] [22.71,29.32] Often [9.156,15.93] [2.31,9.473] [4.511,11.86] [6.9,11.02] Very Often [1.221,4.557] [.4449,4.872] [2.511,8.65] [1.676,3.973] Total Key: column percentages [95% confidence intervals for column percentages] Pearson: Uncorrected chi2(8) = Design-based F(7.59, )= P = Figure 5-69: How often do young drivers operate vehicles in adverse weather conditions during G2? Number of strata = 20 Number of obs = 853 Number of PSUs = 853 Population size = Design df = 833 How often do/did you drive in adverse weather classification during G2? BDE w/ TD BDE w/o TD non-bde Total Never [3.915,8.943] [10.09,22.86] [7.358,18.36] [7.674,12.96] Once [9.278,16.2] [9.645,21.8] [11.99,24.74] [11.24,16.99] Sometimes [31.6,41.54] [23.82,39.5] [21.35,35.79] [29.67,37.4] Often [23.92,33.28] [22.55,37.98] [17.94,31.06] [24.63,32.05] Very Often [13.34,21.24] [5.345,14.95] [13.33,26] [11.97,17.47] Total Key: column percentages [95% confidence intervals for column percentages] Pearson: Uncorrected chi2(8) = Design-based F(7.20, )= P =
156 Figure 5-70: Logistic regression weather_g1_reg : 0=Not Often 1=Often or Very Often (running logit on estimation sample) Survey: Logistic regression Number of strata = 24 Number of obs = 974 Number of PSUs = 974 Population size = Design df = 950 F( 6, 945) = 2.52 Prob > F = Linearized weather_g1~g Odds Ratio Std. Err. t P> t [95% Conf. Interval] classifica~n BDE w/ TD BDE w/o TD non-bde gender male female ageyears _cons (running logit on estimation sample) Survey: Logistic regression Number of strata = 24 Number of obs = 974 Number of PSUs = 974 Population size = Design df = 950 F( 6, 945) = 2.52 Prob > F = Linearized weather_g1~g Odds Ratio Std. Err. t P> t [95% Conf. Interval] classifica~n BDE w/ TD BDE w/o TD non-bde gender male female ageyears _cons
157 Figure 5-71: Logistic regression weather_g2_reg : 0=Not Often 1=Often or Very Often (running logit on estimation sample) Survey: Logistic regression Number of strata = 20 Number of obs = 853 Number of PSUs = 853 Population size = Design df = 833 F( 6, 828) = 1.09 Prob > F = Linearized weather_g2~g Odds Ratio Std. Err. t P> t [95% Conf. Interval] classifica~n BDE w/ TD BDE w/o TD non-bde gender male female ageyears _cons (running logit on estimation sample) Survey: Logistic regression Number of strata = 20 Number of obs = 853 Number of PSUs = 853 Population size = Design df = 833 F( 6, 828) = 1.09 Prob > F = Linearized weather_g2~g Odds Ratio Std. Err. t P> t [95% Conf. Interval] classifica~n BDE w/ TD BDE w/o TD non-bde gender male female ageyears _cons
158 Figure 5-72: How do young drivers rate their ability to merge into traffic before BDE? Number of strata = 16 Number of obs = 591 Number of PSUs = 591 Population size = Design df = 575 Merging into traffic ability classification before BDE BDE w/ T BDE w/o Total very poor [3.349,8.922] [3.864,13.74] [4.197,9.31] poor [15.96,25.62] [15.66,30.8] [17.26,25.69] fair [32.3,43.41] [31.79,49.43] [33.97,43.77] good [24.67,35.21] [16.66,31.84] [22.93,31.74] very good [4.408,10.24] [3.1,13.34] [4.507,9.787] Total Key: column percentages [95% confidence intervals for column percentages] Pearson: Uncorrected chi2(4) = Design-based F(3.99, )= P = Figure 5-73: How do young drivers rate their ability to merge into traffic after BDE? Number of strata = 16 Number of obs = 744 Number of PSUs = 744 Population size = Design df = 728 Merging into traffic ability classification after BDE BDE w/ T BDE w/o Total very poor [.02129,1.075] [ ,.442] poor [.4545,3.057] [.7589,6.875] [.7726,3.492] fair [4.198,9.223] [5.767,16.15] [5.523,10.65] good [37.31,47.45] [41.7,57.73] [40.91,49.83] very good [45.14,55.38] [30.65,45.99] [40.91,49.66] Total Key: column percentages [95% confidence intervals for column percentages] Pearson: Uncorrected chi2(4) = Design-based F(3.48, )= P =
159 Figure 5-74: Logistic regression Number of strata = 16 Number of obs = 591 Number of PSUs = 591 Population size = Design df = 575 F( 5, 571) = 2.65 Prob > F = Linearized skill_merg~e Odds Ratio Std. Err. t P> t [95% Conf. Interval] classifica~n BDE w/ TD BDE w/o TD gender male female ageyears _cons Figure 5-75: Logistic regression Logistic Regression of rating_merging, controlling for BDE status 1=Good/Very Goo > d 0 = Not Good (running logit on estimation sample) Survey: Logistic regression Number of strata = 16 Number of obs = 1335 Number of PSUs = 1335 Population size = Design df = 1319 F( 6, 1314) = 5.11 Prob > F = Linearized rating_mer~g Odds Ratio Std. Err. t P> t [95% Conf. Interval] after classifica~2 BDE w/o TD BDE w/ TD gender male female ageyears _cons
160 Figure 5-76: Logistic regression Logistic Regression of rating_merging w/ interaction variable BDE status (running logit on estimation sample) Survey: Logistic regression Number of strata = 16 Number of obs = 1335 Number of PSUs = 1335 Population size = Design df = 1319 F( 7, 1313) = 4.41 Prob > F = Linearized rating_mer~g Odds Ratio Std. Err. t P> t [95% Conf. Interval] after classifica~2 BDE w/o TD BDE w/ TD gender male female ageyears interaction _cons Figure 5-77: How do non-bde drivers rate their ability to merge into traffic? Number of strata = 8 Number of obs = 246 Number of PSUs = 246 Population size = Design df = 238 Merging into traffic ability without taking BDE column lb ub poor fair good very good Total 100 Key: column lb ub = column percentages = lower 95% confidence bounds for column percentages = upper 95% confidence bounds for column percentages 148
161 Figure 5-78: Logistic regression logistic regression After BDE rating vs NonBDE rating 1=Good/Very Good 0 = Not Go > od (running logit on estimation sample) Survey: Logistic regression Number of strata = 24 Number of obs = 990 Number of PSUs = 990 Population size = Design df = 966 F( 5, 962) = 9.18 Prob > F = Linearized rating_mer~g Odds Ratio Std. Err. t P> t [95% Conf. Interval] after ageyears gender male female _cons Figure 5-79: How do drivers rate their ability to make left turns at intersections before BDE? Number of strata = 16 Number of obs = 591 Number of PSUs = 591 Population size = Design df = 575 Making left turns at intersection ability before classification BDE BDE w/ T BDE w/o Total very poor [2.66,7.864] [1.408,8.975] [2.586,6.757] poor [13.12,21.82] [11.1,25.04] [13.51,21.17] fair [28.39,39.39] [30.21,47.48] [30.97,40.61] good [28.72,39.75] [21.08,37.44] [27.29,36.65] very good [7.584,14.81] [7.456,19.87] [8.488,15.07] Total Key: column percentages [95% confidence intervals for column percentages] Pearson: Uncorrected chi2(4) = Design-based F(4.00, )= P =
162 Figure 5-80: How do drivers rate their ability to make left turns at intersections after BDE? Number of strata = 16 Number of obs = 744 Number of PSUs = 744 Population size = Design df = 728 Making left turns at intersection ability after classification BDE BDE w/ T BDE w/o Total very poor [.05967,1.824] [.03526,1.081] poor [.1227,1.19] [.5063,6.595] [.352,2.744] fair [2.258,6.259] [4.114,13.35] [3.53,7.917] good [32.4,42.33] [29.38,44.79] [32.82,41.46] very good [53.13,63.25] [45.93,61.63] [52.02,60.82] Total Key: column percentages [95% confidence intervals for column percentages] Pearson: Uncorrected chi2(4) = Design-based F(3.81, )= P = Figure 5-81: Logistic regression skill_turns_before : 0=Not Good 1=Good or Very Good (running logit on estimation sample) Survey: Logistic regression Number of strata = 16 Number of obs = 591 Number of PSUs = 591 Population size = Design df = 575 F( 5, 571) = 1.52 Prob > F = Linearized skill_turn~e Odds Ratio Std. Err. t P> t [95% Conf. Interval] classifica~n BDE w/ TD BDE w/o TD gender male female ageyears _cons
163 Figure 5-82: Logistic regression Logistic Regression of rating_turns, controlling for BDE status 1=Good/Very Good > 0 = Not Good (running logit on estimation sample) Survey: Logistic regression Number of strata = 16 Number of obs = 1335 Number of PSUs = 1335 Population size = Design df = 1319 F( 6, 1314) = 3.41 Prob > F = Linearized rating_turns Odds Ratio Std. Err. t P> t [95% Conf. Interval] after classifica~2 BDE w/o TD BDE w/ TD gender male female ageyears _cons Figure 5-83 : Logistic regression Logistic Regression of rating_turns w/ interaction variable BDE status (running logit on estimation sample) Survey: Logistic regression Number of strata = 16 Number of obs = 1335 Number of PSUs = 1335 Population size = Design df = 1319 F( 7, 1313) = 3.00 Prob > F = Linearized rating_turns Odds Ratio Std. Err. t P> t [95% Conf. Interval] after classifica~2 BDE w/o TD BDE w/ TD gender male female ageyears interaction _cons
164 Figure 5-84: How do non-bde drivers rate their ability to make left turns at intersections? Number of strata = 8 Number of obs = 246 Number of PSUs = 246 Population size = Design df = 238 Making left turns at intersection ability without taking BDE column lb ub poor fair good very good Total 100 Key: column lb ub = column percentages = lower 95% confidence bounds for column percentages = upper 95% confidence bounds for column percentages Figure 5-85: Logistic regression logistic regression After BDE rating vs NonBDE rating 1=Good/Very Good 0 = Not Go > od (running logit on estimation sample) Survey: Logistic regression Number of strata = 24 Number of obs = 990 Number of PSUs = 990 Population size = Design df = 966 F( 5, 962) = Prob > F = Linearized rating_turns Odds Ratio Std. Err. t P> t [95% Conf. Interval] after ageyears gender male female _cons
165 Figure 5-86: How do young drivers rate their ability to pass other cars safely before BDE? Number of strata = 16 Number of obs = 591 Number of PSUs = 591 Population size = Design df = 575 Passing other cars safely ability before classification BDE BDE w/ T BDE w/o Total very poor [2.885,7.807] [4.6,14.68] [4.201,9.169] poor [12.84,21.64] [12.18,25.94] [13.82,21.47] fair [28.59,39.53] [25.09,41.89] [28.91,38.38] good [27.6,38.56] [21.71,38.26] [26.89,36.28] very good [8.465,16.07] [6.509,19] [8.625,15.36] Total Key: column percentages [95% confidence intervals for column percentages] Pearson: Uncorrected chi2(4) = Design-based F(3.97, )= P = Figure 5-87: How do young drivers rate their ability to pass other cars safely after BDE? Number of strata = 16 Number of obs = 744 Number of PSUs = 744 Population size = Design df = 728 Passing other cars safely ability after classification BDE BDE w/ T BDE w/o Total very poor [.08912,1.801] [.1299,6.407] [.1617,2.353] poor [.04002,2.013] [1.384,8.889] [.6853,3.831] fair [4.325,9.502] [5.855,15.83] [5.644,10.69] good [31.65,41.56] [34.68,50.07] [34.58,43.21] very good [51.25,61.42] [35.85,51.58] [46.71,55.55] Total Key: column percentages [95% confidence intervals for column percentages] Pearson: Uncorrected chi2(4) = Design-based F(3.97, )= P =
166 Figure 5-88: Logistic regression skill_passing_before : 0=Not Good 1=Good or Very Good (running logit on estimation sample) Survey: Logistic regression Number of strata = 16 Number of obs = 591 Number of PSUs = 591 Population size = Design df = 575 F( 5, 571) = 3.07 Prob > F = Linearized skill_pass~e Odds Ratio Std. Err. t P> t [95% Conf. Interval] classifica~n BDE w/ TD BDE w/o TD gender male female ageyears _cons Figure 5-89: Logistic regression skill_passing_after : 0=Not Good 1=Good or Very Good (running logit on estimation sample) Survey: Logistic regression Number of strata = 16 Number of obs = 744 Number of PSUs = 744 Population size = Design df = 728 F( 5, 724) = 1.39 Prob > F = Linearized skill_pass~r Odds Ratio Std. Err. t P> t [95% Conf. Interval] classifica~n BDE w/ TD BDE w/o TD gender male female ageyears _cons
167 Figure 5-90: Logistic regression Logistic Regression of rating_passing, controlling for BDE status 1=Good/Very Goo > d 0 = Not Good (running logit on estimation sample) Survey: Logistic regression Number of strata = 16 Number of obs = 1335 Number of PSUs = 1335 Population size = Design df = 1319 F( 6, 1314) = 5.40 Prob > F = Linearized rating_pas~g Odds Ratio Std. Err. t P> t [95% Conf. Interval] after classifica~2 BDE w/o TD BDE w/ TD gender male female ageyears _cons
168 Figure 5-91: Logistic regression Logistic Regression of rating_passing w/ interaction variable BDE status (running logit on estimation sample) Survey: Logistic regression Number of strata = 16 Number of obs = 1335 Number of PSUs = 1335 Population size = Design df = 1319 F( 7, 1313) = 4.74 Prob > F = Linearized rating_pas~g Odds Ratio Std. Err. t P> t [95% Conf. Interval] after classifica~2 BDE w/o TD BDE w/ TD gender male female ageyears interaction _cons Figure 5-92: How do non-bde drivers rate their ability to pass other cars safely? Number of strata = 8 Number of obs = 246 Number of PSUs = 246 Population size = Design df = 238 Passing other cars safely ability without taking BDE column lb ub very poor poor fair good very good Total 100 Key: column lb ub = column percentages = lower 95% confidence bounds for column percentages = upper 95% confidence bounds for column percentages 156
169 Figure 5-93: Logistic regression logistic regression After BDE rating vs NonBDE rating 1=Good/Very Good 0 = Not Go > od (running logit on estimation sample) Survey: Logistic regression Number of strata = 24 Number of obs = 990 Number of PSUs = 990 Population size = Design df = 966 F( 5, 962) = 8.39 Prob > F = Linearized rating_pas~g Odds Ratio Std. Err. t P> t [95% Conf. Interval] after ageyears gender male female _cons Figure 5-94: How do young drivers rate their knowledge of who has right of way before BDE? Number of strata = 16 Number of obs = 591 Number of PSUs = 591 Population size = Design df = 575 Right of way ability before classification BDE BDE w/ T BDE w/o Total very poor [3.447,9.006] [2.4,9.624] [3.548,7.866] poor [9.91,17.59] [7.545,19.72] [9.944,16.63] fair [25.51,36.05] [22.57,38.6] [25.96,35.03] good [29.88,40.99] [24.86,41.72] [29.6,39.15] very good [11.6,20.02] [13.46,28.71] [13.63,21.6] Total Key: column percentages [95% confidence intervals for column percentages] Pearson: Uncorrected chi2(4) = Design-based F(3.97, )= P =
170 Figure 5-95: How do young drivers rate their knowledge of who has right of way after BDE? Number of strata = 16 Number of obs = 744 Number of PSUs = 744 Population size = Design df = 728 Right of way ability after classification BDE BDE w/ T BDE w/o Total very poor [.1724,4.81] [.07098,1.999] poor [.3943,2.74] [.2331,1.622] fair [2.316,6.138] [4.198,13.4] [3.589,7.914] good [27.15,36.74] [23.32,37.94] [27.11,35.37] very good [58.32,68.22] [53.22,68.87] [58.11,66.81] Total Key: column percentages [95% confidence intervals for column percentages] Pearson: Uncorrected chi2(4) = Design-based F(3.83, )= P = Figure 5-96: Logistic regression Logistic Regression of rating_row, controlling for BDE status 1=Good/Very Good 0 > = Not Good (running logit on estimation sample) Survey: Logistic regression Number of strata = 16 Number of obs = 1335 Number of PSUs = 1335 Population size = Design df = 1319 F( 6, 1314) = 2.61 Prob > F = Linearized rating_row Odds Ratio Std. Err. t P> t [95% Conf. Interval] after classifica~2 BDE w/o TD BDE w/ TD gender male female ageyears _cons
171 Figure 5-97: Logistic regression Logistic Regression of rating_row w/ interaction variable BDE status (running logit on estimation sample) Survey: Logistic regression Number of strata = 16 Number of obs = 1335 Number of PSUs = 1335 Population size = Design df = 1319 F( 7, 1313) = 2.32 Prob > F = Linearized rating_row Odds Ratio Std. Err. t P> t [95% Conf. Interval] after classifica~2 BDE w/o TD BDE w/ TD gender male female ageyears interaction _cons Figure 5-98: How do non-bde drivers rate their knowledge of who has right of way? Number of strata = 8 Number of obs = 246 Number of PSUs = 246 Population size = Design df = 238 Right of way ability without taking BDE column lb ub poor fair good very good Total 100 Key: column lb ub = column percentages = lower 95% confidence bounds for column percentages = upper 95% confidence bounds for column percentages 159
172 Figure 5-99: Logistic regression logistic regression After BDE rating vs NonBDE rating 1=Good/Very Good 0 = Not Go > od (running logit on estimation sample) Survey: Logistic regression Number of strata = 24 Number of obs = 990 Number of PSUs = 990 Population size = Design df = 966 F( 5, 962) = 8.55 Prob > F = Linearized rating_row Odds Ratio Std. Err. t P> t [95% Conf. Interval] after ageyears gender male female _cons Figure 5-100: How do young drivers rate their vehicle handling abilities before BDE? Number of strata = 16 Number of obs = 591 Number of PSUs = 591 Population size = Design df = 575 Vehilce handling ability before classification BDE BDE w/ T BDE w/o Total very poor [1.348,5.387] [.2885,5.901] [1.122,4.07] poor [6.564,13.44] [9.073,21.72] [8.554,15.1] fair [29.65,40.81] [22.74,38.93] [28.54,37.91] good [29.69,40.72] [30.73,48.11] [31.96,41.64] very good [13.88,22.54] [9.711,22.76] [13.34,20.71] Total Key: column percentages [95% confidence intervals for column percentages] Pearson: Uncorrected chi2(4) = Design-based F(3.99, )= P =
173 Figure 5-101: How do young drivers rate their vehicle handling abilities after BDE? Number of strata = 16 Number of obs = 744 Number of PSUs = 744 Population size = Design df = 728 Vehilce handling ability after classification BDE BDE w/ T BDE w/o Total very poor [.04002,2.013] [.02365,1.194] poor [.1724,4.81] [.07098,1.999] fair [.736,3.788] [2.675,10.8] [1.859,5.541] good [26.64,36.26] [26.29,41.26] [28.06,36.44] very good [61.74,71.48] [52.44,67.6] [59.76,68.25] Total Key: column percentages [95% confidence intervals for column percentages] Pearson: Uncorrected chi2(4) = Design-based F(3.88, )= P =
174 Figure 5-102: Logistic regression Logistic Regression of rating_handling, controlling for BDE status 1=Good/Very Go > od 0 = Not Good (running logit on estimation sample) Survey: Logistic regression Number of strata = 16 Number of obs = 1335 Number of PSUs = 1335 Population size = Design df = 1319 F( 6, 1314) = 3.90 Prob > F = Linearized rating_han~g Odds Ratio Std. Err. t P> t [95% Conf. Interval] after classifica~2 BDE w/o TD BDE w/ TD gender male female ageyears _cons
175 Figure 5-103: Logistic regression Logistic Regression of rating_handling w/ interaction variable BDE status (running logit on estimation sample) Survey: Logistic regression Number of strata = 16 Number of obs = 1335 Number of PSUs = 1335 Population size = Design df = 1319 F( 7, 1313) = 3.46 Prob > F = Linearized rating_han~g Odds Ratio Std. Err. t P> t [95% Conf. Interval] after classifica~2 BDE w/o TD BDE w/ TD gender male female ageyears interaction _cons Figure 5-104: How do non-bde drivers rate their vehicle handling abilities? Number of strata = 8 Number of obs = 246 Number of PSUs = 246 Population size = Design df = 238 Vehilce handling ability without taking BDE column lb ub poor fair good very good Total 100 Key: column lb ub = column percentages = lower 95% confidence bounds for column percentages = upper 95% confidence bounds for column percentages 163
176 Figure 5-105: Logistic regression logistic regression After BDE rating vs NonBDE rating 1=Good/Very Good 0 = Not Go > od (running logit on estimation sample) Survey: Logistic regression Number of strata = 24 Number of obs = 990 Number of PSUs = 990 Population size = Design df = 966 F( 5, 962) = 5.42 Prob > F = Linearized rating_han~g Odds Ratio Std. Err. t P> t [95% Conf. Interval] after ageyears gender male female _cons Figure 5-106: How often do young drivers speed while driving during G1? Number of strata = 24 Number of obs = 974 Number of PSUs = 974 Population size = Design df = 950 How often do/did you speed classification during G1? BDE w/ TD BDE w/o TD non-bde Total Never [25.61,35.07] [32.37,48.04] [37.2,51.72] [32.7,40.1] Once [14.87,22.64] [17.08,31.22] [16.95,29.68] [17.92,24.34] Sometimes [24.68,34.16] [14.52,27.76] [10.87,21.11] [20.29,26.79] Often [12.18,19.84] [7.568,18.13] [7.576,15.47] [11.04,16.21] Very Often [4.478,9.642] [2.219,8.597] [4.24,10.6] [4.474,7.83] Total Key: column percentages [95% confidence intervals for column percentages] Pearson: Uncorrected chi2(8) = Design-based F(7.45, )= P =
177 Figure 5-107: How often do young drivers speed while driving during G2? Number of strata = 20 Number of obs = 853 Number of PSUs = 853 Population size = Design df = 833 How often do/did you speed classification during G2? BDE w/ TD BDE w/o TD non-bde Total Never [10.7,17.68] [11,23.72] [17.94,32.1] [13.4,19.39] Once [8.309,14.86] [14.67,28.39] [10.84,22.89] [12.34,18.37] Sometimes [21.44,30.38] [21,36.37] [15.23,28.16] [22.36,29.61] Often [21.45,30.61] [10.64,22.81] [10.58,22.27] [17.85,24.36] Very Often [19.47,28.26] [13.18,26.78] [17.17,30.54] [18.78,25.55] Total Key: column percentages [95% confidence intervals for column percentages] Pearson: Uncorrected chi2(8) = Design-based F(7.13, )= P =
178 Figure 5-108: Logistic regression speeding_g1_x : 0=Never 1=At least once (running logit on estimation sample) Survey: Logistic regression Number of strata = 24 Number of obs = 974 Number of PSUs = 974 Population size = Design df = 950 F( 6, 945) = 2.57 Prob > F = Linearized speeding~1_x Odds Ratio Std. Err. t P> t [95% Conf. Interval] classifica~n BDE w/ TD BDE w/o TD non-bde gender male female ageyears _cons (running logit on estimation sample) Survey: Logistic regression Number of strata = 24 Number of obs = 974 Number of PSUs = 974 Population size = Design df = 950 F( 6, 945) = 2.57 Prob > F = Linearized speeding~1_x Odds Ratio Std. Err. t P> t [95% Conf. Interval] classifica~n BDE w/ TD BDE w/o TD non-bde gender male female ageyears _cons
179 Figure 5-109: Logistic regression speeding_g2_x : 0=Never 1=At least once (running logit on estimation sample) Survey: Logistic regression Number of strata = 20 Number of obs = 853 Number of PSUs = 853 Population size = Design df = 833 F( 6, 828) = 1.82 Prob > F = Linearized speeding~2_x Odds Ratio Std. Err. t P> t [95% Conf. Interval] classifica~n BDE w/ TD BDE w/o TD non-bde gender male female ageyears _cons (running logit on estimation sample) Survey: Logistic regression Number of strata = 20 Number of obs = 853 Number of PSUs = 853 Population size = Design df = 833 F( 6, 828) = 1.82 Prob > F = Linearized speeding~2_x Odds Ratio Std. Err. t P> t [95% Conf. Interval] classifica~n BDE w/ TD BDE w/o TD non-bde gender male female ageyears _cons
180 Figure 5-110: How often do G1 drivers send hand-held messages while driving? Number of strata = 24 Number of obs = 974 Number of PSUs = 974 Population size = Design df = 950 How often do/did you send hand-held messages classification during G1? BDE w/ TD BDE w/o TD non-bde Total Never [80.55,88.24] [88.13,96.47] [86.21,93.27] [86.21,90.87] Once [4.861,10.49] [.2563,2.203] [2.279,6.866] [3.228,6.054] Sometimes [3.612,8.795] [2.586,10.83] [2.376,7.707] [3.752,7.395] Often [.6514,3.944] [.05503,1.935] [.484,4.029] [.5922,2.247] Very Often [.2357,2.309] [.01489,.7517] [.1317,1.085] Total Key: column percentages [95% confidence intervals for column percentages] Pearson: Uncorrected chi2(8) = Design-based F(6.62, )= P = Figure 5-111: How often do G1 drivers send hands-free messages while driving? Number of strata = 24 Number of obs = 974 Number of PSUs = 974 Population size = Design df = 950 How often do/did you send hands-free messages during classification G1? BDE w/ T BDE w/o non-bde Total Never [87.66,93.87] [89.12,97.66] [88.43,95.79] [90.43,94.58] Once [1.842,5.791] [.7618,7.247] [1.004,6.294] [1.77,4.523] Sometimes [1.737,5.999] [.869,8.118] [1.202,6.524] [1.832,4.831] Often [.6817,3.64] [.5136,3.781] [.5331,2.005] Very Often [.1728,2.282] [.00444,.2247] [.03809,1.913] [.1207,1.08] Total Key: column percentages [95% confidence intervals for column percentages] Pearson: Uncorrected chi2(8) = Design-based F(5.99, )= P =
181 Figure 5-112: Logistic regression hand_held_texts_g1_x : 0=Never 1=At least once (running logit on estimation sample) Survey: Logistic regression Number of strata = 24 Number of obs = 974 Number of PSUs = 974 Population size = Design df = 950 F( 6, 945) = 6.08 Prob > F = Linearized hand_held_.. Odds Ratio Std. Err. t P> t [95% Conf. Interval] classifica~n BDE w/ TD BDE w/o TD non-bde gender male female ageyears _cons (running logit on estimation sample) Survey: Logistic regression Number of strata = 24 Number of obs = 974 Number of PSUs = 974 Population size = Design df = 950 F( 6, 945) = 6.08 Prob > F = Linearized hand_held_.. Odds Ratio Std. Err. t P> t [95% Conf. Interval] classifica~n BDE w/ TD BDE w/o TD non-bde gender male female ageyears _cons
182 Figure 5-113: How often do G2 drivers send hand-held messages while driving? Number of strata = 20 Number of obs = 853 Number of PSUs = 853 Population size = Design df = 833 How often do/did you send hand-held messages classification during G2? BDE w/ TD BDE w/o TD non-bde Total Never [56.54,66.29] [62.49,77.69] [57.69,73.04] [61.37,68.95] Once [7.716,14.28] [8.277,19.51] [7.221,17.23] [9.078,14.36] Sometimes [12.41,20.19] [4.131,13.12] [8.254,19.38] [10.2,15.44] Often [5.484,11.47] [1.963,10.53] [2.21,9.838] [4.579,8.816] Very Often [2.335,6.809] [1.934,9.521] [2.618,10.73] [2.895,6.405] Total Key: column percentages [95% confidence intervals for column percentages] Pearson: Uncorrected chi2(8) = Design-based F(7.02, )= P = Figure 5-114: How often do G2 drivers send hands-free messages while driving? Number of strata = 20 Number of obs = 853 Number of PSUs = 853 Population size = Design df = 833 How often do/did you send hands-free messages during classification G2? BDE w/ T BDE w/o non-bde Total Never [80.36,88.08] [80.07,92.07] [77.61,89.85] [82.3,88.24] Once [3.2,7.773] [3.231,12.27] [2.322,9.442] [3.815,7.728] Sometimes [3.96,9.438] [1.13,8.226] [4.168,13.89] [3.744,7.529] Often [1.284,4.679] [.6255,7.154] [.4023,6.551] [1.273,3.931] Very Often [.7525,4.037] [.1872,6.399] [.2812,4.724] [.7048,2.979] Total Key: column percentages [95% confidence intervals for column percentages] Pearson: Uncorrected chi2(8) = Design-based F(6.92, )= P =
183 Figure 5-115: Logistic regression hand_held_texts_g2_x : 0=Never 1=At least once (running logit on estimation sample) Survey: Logistic regression Number of strata = 20 Number of obs = 853 Number of PSUs = 853 Population size = Design df = 833 F( 6, 828) = 4.91 Prob > F = Linearized hand_held_.. Odds Ratio Std. Err. t P> t [95% Conf. Interval] classifica~n BDE w/ TD BDE w/o TD non-bde gender male female ageyears _cons (running logit on estimation sample) Survey: Logistic regression Number of strata = 20 Number of obs = 853 Number of PSUs = 853 Population size = Design df = 833 F( 6, 828) = 4.91 Prob > F = Linearized hand_held_.. Odds Ratio Std. Err. t P> t [95% Conf. Interval] classifica~n BDE w/ TD BDE w/o TD non-bde gender male female ageyears _cons
184 Figure 5-116: How often do drivers make hand-held calls while driving during their G1 period? Number of strata = 24 Number of obs = 974 Number of PSUs = 974 Population size = Design df = 950 How often do/did you make hand-held calls classification during G1? BDE w/ TD BDE w/o TD non-bde Total Never [83.95,91] [88.57,96.89] [86.56,93.52] [88,92.41] Once [6.235,12.45] [.7539,6.872] [3.11,8.639] [4.454,7.98] Sometimes [1.279,4.92] [1.183,7.882] [1.378,5.497] [1.719,4.412] Often [.09118,1.842] [.1574,2.523] [.2801,3.483] [.2735,1.349] Very Often [.04101,2.059] [.05763,2.883] [.05412,.9228] Total Key: column percentages [95% confidence intervals for column percentages] Pearson: Uncorrected chi2(8) = Design-based F(6.93, )= P = Figure 5-117: How often do drivers make hands-free calls while driving during their G1 period? Number of strata = 24 Number of obs = 974 Number of PSUs = 974 Population size = Design df = 950 How often do/did you make hands-free calls during classification G1? BDE w/ T BDE w/o non-bde Total Never [82.26,89.51] [84.56,94.81] [81.92,91.79] [85.29,90.39] Once [5.261,10.94] [2.758,10.89] [1.775,7.603] [4.493,8.305] Sometimes [1.858,5.716] [.8115,7.68] [2.268,8.763] [2.143,5.059] Often [1.109,4.589] [.1331,6.553] [1.083,7.309] [1.111,3.479] Very Often [.158,1.825] [.00444,.2247] [.38,3.972] [.2282,1.207] Total Key: column percentages [95% confidence intervals for column percentages] Pearson: Uncorrected chi2(8) = Design-based F(6.25, )= P =
185 Figure 5-118: Logistic regression hand_held_calls_g1_x : 0=Never 1=At least once (running logit on estimation sample) Survey: Logistic regression Number of strata = 24 Number of obs = 974 Number of PSUs = 974 Population size = Design df = 950 F( 6, 945) = 5.61 Prob > F = Linearized hand_held_.. Odds Ratio Std. Err. t P> t [95% Conf. Interval] classifica~n BDE w/ TD BDE w/o TD non-bde gender male female ageyears _cons (running logit on estimation sample) Survey: Logistic regression Number of strata = 24 Number of obs = 974 Number of PSUs = 974 Population size = Design df = 950 F( 6, 945) = 5.61 Prob > F = Linearized hand_held_.. Odds Ratio Std. Err. t P> t [95% Conf. Interval] classifica~n BDE w/ TD BDE w/o TD non-bde gender male female ageyears _cons
186 Figure 5-119: How often do G2 drivers make hand-held calls while driving? Number of strata = 20 Number of obs = 853 Number of PSUs = 853 Population size = Design df = 833 How often do/did you make hand-held calls classification during G2? BDE w/ TD BDE w/o TD non-bde Total Never [67.86,77.1] [71.57,85.65] [64.47,78.98] [71.27,78.36] Once [8.482,15.27] [3.187,12.28] [6.983,17.54] [7.524,12.34] Sometimes [7.921,14.64] [5.12,15.39] [7.876,18.66] [8.134,13.24] Often [1.565,5.541] [1.835,9.008] [.06492,3.245] [1.827,4.924] Very Often [.9307,4.414] [.14,6.886] [1.611,8.375] [1.054,3.483] Total Key: column percentages [95% confidence intervals for column percentages] Pearson: Uncorrected chi2(8) = Design-based F(6.60, )= P = Figure 5-120: How often do G2 drivers make hands-free calls while driving? Number of strata = 20 Number of obs = 853 Number of PSUs = 853 Population size = Design df = 833 How often do/did you make hands-free calls during classification G2? BDE w/ T BDE w/o non-bde Total Never [69.7,78.76] [68.19,83] [66.44,80.91] [71.34,78.55] Once [5.574,11.26] [4.896,15.48] [4.918,14.21] [6.262,11.03] Sometimes [7.263,13.55] [4.2,13.25] [4.121,13.7] [6.782,11.4] Often [3.064,7.898] [2.353,10.56] [3.059,12.17] [3.574,7.408] Very Often [1.378,4.911] [.5736,7.572] [1.305,8.368] [1.498,4.318] Total Key: column percentages [95% confidence intervals for column percentages] Pearson: Uncorrected chi2(8) = Design-based F(7.10, )= P =
187 Figure 5-121: Logistic regression hand_held_calls_g2_x : 0=Never 1=At least once (running logit on estimation sample) Survey: Logistic regression Number of strata = 20 Number of obs = 853 Number of PSUs = 853 Population size = Design df = 833 F( 6, 828) = 4.70 Prob > F = Linearized hand_held_.. Odds Ratio Std. Err. t P> t [95% Conf. Interval] classifica~n BDE w/ TD BDE w/o TD non-bde gender male female ageyears _cons (running logit on estimation sample) Survey: Logistic regression Number of strata = 20 Number of obs = 853 Number of PSUs = 853 Population size = Design df = 833 F( 6, 828) = 4.70 Prob > F = Linearized hand_held_.. Odds Ratio Std. Err. t P> t [95% Conf. Interval] classifica~n BDE w/ TD BDE w/o TD non-bde gender male female ageyears _cons
188 Figure 5-122: How often do young drivers listen to music while driving during G1? Number of strata = 24 Number of obs = 974 Number of PSUs = 974 Population size = Design df = 950 How often do/did you listen to music while driving classification during G1? BDE w/ T BDE w/o non-bde Total Never [4.213,9.161] [10.13,22.18] [8.701,19.31] [8.344,13.36] Once [4.2,9.592] [5.852,16.02] [9.028,20.05] [6.963,11.65] Sometimes [11.38,18.86] [14.12,27.51] [13.67,24.89] [14.45,20.48] Often [16.51,24.73] [9.587,20.97] [10.94,21.82] [14.71,20.47] Very Often [47.14,57.46] [33.26,48.44] [32.62,45.77] [42.03,49.45] Total Key: column percentages [95% confidence intervals for column percentages] Pearson: Uncorrected chi2(8) = Design-based F(7.64, )= P =
189 Figure 5-123: Logistic regression music_g1_reg : 0=Not Often 1=Often or Very Often (running logit on estimation sample) Survey: Logistic regression Number of strata = 24 Number of obs = 974 Number of PSUs = 974 Population size = Design df = 950 F( 6, 945) = 4.90 Prob > F = Linearized music_g1_reg Odds Ratio Std. Err. t P> t [95% Conf. Interval] classifica~n BDE w/ TD BDE w/o TD non-bde gender male female ageyears _cons (running logit on estimation sample) Survey: Logistic regression Number of strata = 24 Number of obs = 974 Number of PSUs = 974 Population size = Design df = 950 F( 6, 945) = 4.90 Prob > F = Linearized music_g1_reg Odds Ratio Std. Err. t P> t [95% Conf. Interval] classifica~n BDE w/ TD BDE w/o TD non-bde gender male female ageyears _cons
190 Figure 5-124: How often do young drivers listen to music while driving during G2? Number of strata = 20 Number of obs = 853 Number of PSUs = 853 Population size = Design df = 833 How often do/did you listen to music while driving classification during G2? BDE w/ T BDE w/o non-bde Total Never [4.531,9.402] [2.772,11.68] [4.227,12.56] [4.692,8.693] Once [1.296,4.84] [1.807,9.029] [.7034,6.522] [1.847,4.876] Sometimes [2.515,7.011] [7.369,18.79] [4.125,13.84] [5.344,10.04] Often [8.5,15.35] [7.522,19.12] [9.706,21.4] [9.666,15.19] Very Often [70.42,79.45] [57.41,73.64] [60.14,75.25] [67.12,74.71] Total Key: column percentages [95% confidence intervals for column percentages] Pearson: Uncorrected chi2(8) = Design-based F(7.18, )= P =
191 Figure 5-125: Logistic regression music_g2_reg : 0=Not Often 1=Often or Very Often (running logit on estimation sample) Survey: Logistic regression Number of strata = 20 Number of obs = 853 Number of PSUs = 853 Population size = Design df = 833 F( 6, 828) = 2.46 Prob > F = Linearized music_g2_reg Odds Ratio Std. Err. t P> t [95% Conf. Interval] classifica~n BDE w/ TD BDE w/o TD non-bde gender male female ageyears _cons (running logit on estimation sample) Survey: Logistic regression Number of strata = 20 Number of obs = 853 Number of PSUs = 853 Population size = Design df = 833 F( 6, 828) = 2.46 Prob > F = Linearized music_g2_reg Odds Ratio Std. Err. t P> t [95% Conf. Interval] classifica~n BDE w/ TD BDE w/o TD non-bde gender male female ageyears _cons
192 Figure 5-126: How often do young drivers operate vehicles while tired during G1? Number of strata = 24 Number of obs = 974 Number of PSUs = 974 Population size = Design df = 950 How often do/did you drive tired classification during G1? BDE w/ TD BDE w/o TD non-bde Total Never [35.85,46.02] [44.21,60.15] [51.02,64.6] [44.38,51.96] Once [27.49,37.15] [23.81,38.57] [18.51,30.56] [26.53,33.58] Sometimes [18.53,27.17] [10.38,21.56] [9.32,18.58] [15.5,21.23] Often [1.861,5.761] [.4206,5.528] [2.257,7.146] [1.913,4.351] Very Often [.4185,3.339] [.06069,2.213] [.2185,2.191] [.3765,1.78] Total Key: column percentages [95% confidence intervals for column percentages] Pearson: Uncorrected chi2(8) = Design-based F(7.15, )= P =
193 Figure 5-127: Logistic regression tired_g1_x : 0=Never 1=At least once (running logit on estimation sample) Survey: Logistic regression Number of strata = 24 Number of obs = 974 Number of PSUs = 974 Population size = Design df = 950 F( 6, 945) = 4.00 Prob > F = Linearized tired_g1_x Odds Ratio Std. Err. t P> t [95% Conf. Interval] classifica~n BDE w/ TD BDE w/o TD non-bde gender male female ageyears _cons (running logit on estimation sample) Survey: Logistic regression Number of strata = 24 Number of obs = 974 Number of PSUs = 974 Population size = Design df = 950 F( 6, 945) = 4.00 Prob > F = Linearized tired_g1_x Odds Ratio Std. Err. t P> t [95% Conf. Interval] classifica~n BDE w/ TD BDE w/o TD non-bde gender male female ageyears _cons
194 Figure 5-128: How often do young drivers operate vehicles while tired during G2? Number of strata = 20 Number of obs = 853 Number of PSUs = 853 Population size = Design df = 833 How often do/did you drive tired classification during G2? BDE w/ TD BDE w/o TD non-bde Total Never [21.02,29.99] [24.99,41.06] [27.9,43.33] [25.5,33.05] Once [18.82,27.43] [11.58,24.32] [15.02,28.12] [17.51,24] Sometimes [26.68,36.35] [28.05,43.82] [17.85,31.49] [28.04,35.68] Often [11.48,19.03] [7.394,18.36] [7.263,17.79] [10.81,16.38] Very Often [3.715,8.778] [1.182,7.922] [4.759,14.45] [3.709,7.286] Total Key: column percentages [95% confidence intervals for column percentages] Pearson: Uncorrected chi2(8) = Design-based F(7.12, )= P =
195 Figure 5-129: Logistic regression tired_g2_x : 0=Never 1=At least once (running logit on estimation sample) Survey: Logistic regression Number of strata = 20 Number of obs = 853 Number of PSUs = 853 Population size = Design df = 833 F( 6, 828) = 2.14 Prob > F = Linearized tired_g2_x Odds Ratio Std. Err. t P> t [95% Conf. Interval] classifica~n BDE w/ TD BDE w/o TD non-bde gender male female ageyears _cons (running logit on estimation sample) Survey: Logistic regression Number of strata = 20 Number of obs = 853 Number of PSUs = 853 Population size = Design df = 833 F( 6, 828) = 2.14 Prob > F = Linearized tired_g2_x Odds Ratio Std. Err. t P> t [95% Conf. Interval] classifica~n BDE w/ TD BDE w/o TD non-bde gender male female ageyears _cons
196 Figure 5-130: How often do G2 drivers take chances while driving just for the fun of it? Number of strata = 20 Number of obs = 853 Number of PSUs = 853 Population size = Design df = 833 How often do you take chances while driving for the fun of it classification during G2? BDE w/ T BDE w/o non-bde Total Never [66.51,75.83] [68.32,83.1] [64,78.52] [69.4,76.69] Once [13.45,21.19] [9.532,22.22] [11.47,23.47] [13.34,19.47] Sometimes [4.889,10.54] [4.773,14.99] [3.176,10.93] [5.529,10.14] Often [1.646,5.297] [2.156,9.689] [1.365,3.481] Very Often [.6394,3.247] [.01567,.7914] [.1322,6.512] [.4449,1.895] Total Key: column percentages [95% confidence intervals for column percentages] Pearson: Uncorrected chi2(8) = Design-based F(6.61, )= P =
197 Figure 5-131: How often do G2 drivers operate vehicles with one or more teenage passengers? Number of strata = 20 Number of obs = 853 Number of PSUs = 853 Population size = Design df = 833 How often do you drive with one or more teen passengers classification during G2? BDE w/ T BDE w/o non-bde Total Never [5.916,11.74] [4.851,14.7] [9.121,20.72] [7.126,11.86] Once [7.4,13.61] [11.54,24.75] [12.77,25.6] [11.02,16.83] Sometimes [22.25,31.43] [27.74,43.9] [21.61,35.87] [26.18,33.77] Often [25.28,34.82] [14.99,28.03] [13.1,24.88] [21.83,28.69] Very Often [20.84,29.92] [12.54,25.43] [15.35,28.71] [19,25.71] Total Key: column percentages [95% confidence intervals for column percentages] Pearson: Uncorrected chi2(8) = Design-based F(7.15, )= P =
198 Figure 5-132: Logistic regression teen_passengers_g2_reg : 0=Not Often 1=Often or Very Often (running logit on estimation sample) Survey: Logistic regression Number of strata = 20 Number of obs = 853 Number of PSUs = 853 Population size = Design df = 833 F( 3, 831) = 5.18 Prob > F = Linearized teen_passe~g Odds Ratio Std. Err. t P> t [95% Conf. Interval] classifica~n BDE w/ TD BDE w/o TD non-bde gender male female _cons (running logit on estimation sample) Survey: Logistic regression Number of strata = 20 Number of obs = 853 Number of PSUs = 853 Population size = Design df = 833 F( 3, 831) = 5.18 Prob > F = Linearized teen_passe~g Odds Ratio Std. Err. t P> t [95% Conf. Interval] classifica~n BDE w/ TD BDE w/o TD non-bde gender male female _cons
199 Figure 5-133: How often do G2 drivers run red lights? Number of strata = 20 Number of obs = 853 Number of PSUs = 853 Population size = Design df = 833 How often do you run red lights during classification G2? BDE w/ T BDE w/o non-bde Total Never [88.24,94.21] [85.96,96.12] [89.93,97.28] [89.74,94.4] Once [3.798,8.801] [2.647,11.71] [2.721,10.07] [4.001,8.035] Sometimes [.7889,4.063] [.4515,7.207] [.7387,3.278] Often [.0412,2.07] [.02134,1.077] Very Often [.0549,2.75] [.02846,1.433] Total Key: column percentages [95% confidence intervals for column percentages] Pearson: Uncorrected chi2(8) = Design-based F(5.31, )= P =
200 Figure 5-134: How often do G2 drivers pass other cars because it is exciting? Number of strata = 20 Number of obs = 853 Number of PSUs = 853 Population size = Design df = 833 How often do you pass other cars because it is exciting classification during G2? BDE w/ T BDE w/o non-bde Total Never [80.5,88.2] [84.86,94.78] [74.72,87.55] [83.52,89.01] Once [5.422,11.38] [2.012,9.274] [5.049,14.87] [5.058,9.139] Sometimes [3.51,8.61] [1.555,9.291] [3.436,12.14] [3.543,7.299] Often [.3235,2.532] [.05792,2.899] [.5617,6.496] [.4227,1.843] Very Often [.3132,2.634] [.04975,2.494] [.09811,4.869] [.295,1.619] Total Key: column percentages [95% confidence intervals for column percentages] Pearson: Uncorrected chi2(8) = Design-based F(7.13, )= P =
201 Figure 5-135: Logistic regression passingcars_g2_x : 0=Never 1=At least once (running logit on estimation sample) Survey: Logistic regression Number of strata = 20 Number of obs = 853 Number of PSUs = 853 Population size = Design df = 833 F( 7, 827) = 3.48 Prob > F = Linearized passingcar~x Odds Ratio Std. Err. t P> t [95% Conf. Interval] classifica~n BDE w/ TD BDE w/o TD non-bde gender male female ageyears num_postal~e Rural Urban _cons (running logit on estimation sample) Survey: Logistic regression Number of strata = 20 Number of obs = 853 Number of PSUs = 853 Population size = Design df = 833 F( 7, 827) = 3.48 Prob > F = Linearized passingcar~x Odds Ratio Std. Err. t P> t [95% Conf. Interval] classifica~n BDE w/ TD BDE w/o TD non-bde gender male female ageyears num_postal~e Rural Urban _cons
202 Figure 5-136: How often do young drivers operate vehicles within 2 hours after consuming drugs other than alcohol? Number of strata = 20 Number of obs = 853 Number of PSUs = 853 Population size = Design df = 833 How often do drive within 2 hours of consuming any drug classification during G2? BDE w/ TD BDE w/o TD non-bde Total Never [90.81,96.11] [87.26,96.67] [88.57,96.77] [91.29,95.56] Once [2.245,6.617] [.9887,8.534] [1.049,7.55] [2.138,5.431] Sometimes [.4216,3.365] [1.283,8.434] [.8452,6.149] [1.117,3.878] Often [.04262,.4114] [.04375,2.197] [.09811,4.869] [.09307,.8057] Very Often [.2353,2.731] [.04027,2.023] [.147,1.416] Total Key: column percentages [95% confidence intervals for column percentages] Pearson: Uncorrected chi2(8) = Design-based F(6.04, )= P =
203 Figure 5-137: How often do G2 drivers operate vehicles within 2 hours after consuming any amount of alcohol? Number of strata = 20 Number of obs = 853 Number of PSUs = 853 Population size = Design df = 833 How often do you drive within 2 hours of consuming any amount of alcohol classification during BDE w/ TD BDE w/o TD non-bde Total Never [92.39,97.28] [90.92,98.44] [86.19,95.69] [93.06,96.73] Once [1.45,5.4] [.2897,6.172] [2.187,10.07] [1.563,4.27] Sometimes [.1683,2.759] [.6255,7.154] [1.009,7.684] [.7057,3.12] Often [.1685,2.762] [.04375,2.197] [.03254,1.638] [.1645,1.481] Very Often [.0549,2.75] [.02846,1.433] Total Key: column percentages [95% confidence intervals for column percentages] Pearson: Uncorrected chi2(8) = Design-based F(5.88, )= P =
204 Figure 5-138: How often do young drivers drive especially close to other cars to let its driver know to get out of the way? Number of strata = 20 Number of obs = 853 Number of PSUs = 853 Population size = Design df = 833 How often do you drive especially close to the car in front to let its driver classification kn BDE w/ T BDE w/o non-bde Total Never [72.45,81.24] [78.74,90.86] [74.53,87.26] [77.37,83.76] Once [9.775,16.94] [5.249,15.37] [4.233,13.28] [8.565,13.73] Sometimes [4.359,9.766] [1.986,10.15] [3.715,12.82] [4.247,8.251] Often [.9211,4.548] [.09728,2.213] [.4376,5.806] [.7608,2.758] Very Often [.5441,3.055] [.7871,5.14] [.4887,1.858] Total Key: column percentages [95% confidence intervals for column percentages] Pearson: Uncorrected chi2(8) = Design-based F(6.77, )= P =
205 Figure 5-139: Logistic regression tailgait_g2_x : 0=Never 1=At least once (running logit on estimation sample) Survey: Logistic regression Number of strata = 20 Number of obs = 853 Number of PSUs = 853 Population size = Design df = 833 F( 6, 828) = 2.04 Prob > F = Linearized tailgait_g~x Odds Ratio Std. Err. t P> t [95% Conf. Interval] classifica~n BDE w/ TD BDE w/o TD non-bde gender male female ageyears _cons (running logit on estimation sample) Survey: Logistic regression Number of strata = 20 Number of obs = 853 Number of PSUs = 853 Population size = Design df = 833 F( 6, 828) = 2.04 Prob > F = Linearized tailgait_g~x Odds Ratio Std. Err. t P> t [95% Conf. Interval] classifica~n BDE w/ TD BDE w/o TD non-bde gender male female ageyears _cons
206 Figure 5-140: What was the most important reason for deciding to take a BDE course? Number of strata = 16 Number of obs = 746 Number of PSUs = 746 Population size = Design df = 730 What was the single most important reason for taking BDE? percentages lb ub to qualify for insurance disc, to help pass the g1 road test to be a safer/skilled driver to get your g2 licence sooner your parents wanted you to to be able to get to activities other Total 100 Key: percentages = cell percentages lb = lower 95% confidence bounds for cell percentages ub = upper 95% confidence bounds for cell percentages Figure 5-141: What was the most important reason for deciding not to take a BDE course? Number of strata = 8 Number of obs = 246 Number of PSUs = 246 Population size = Design df = 238 What was the main reason that you did not complete BDE? percentages lb ub too expensive not available where you live not necessary did not have time no access to a vehicle enrolled in BDE, never completed parents did not allow it not interested in time discount plan to take BDE later currently taking the course other Total 100 Key: percentages = cell percentages lb = lower 95% confidence bounds for cell percentages ub = upper 95% confidence bounds for cell percentages 194
207 Figure 5-142: Do young drivers think BDE improved their driving skills? Number of strata = 16 Number of obs = 745 Number of PSUs = 745 Population size = Design df = 729 Did BDE improve your driving skills? percentages lb ub yes no don't know Total 100 Key: percentages = cell percentages lb = lower 95% confidence bounds for cell percentages ub = upper 95% confidence bounds for cell percentages Figure 5-143: Do young drivers think BDE enhanced their knowledge of road rules and safety? Number of strata = 16 Number of obs = 745 Number of PSUs = 745 Population size = Design df = 729 Did BDE improve knowledge of road rules and safety? percentages lb ub yes no don't know Total 100 Key: percentages = cell percentages lb = lower 95% confidence bounds for cell percentages ub = upper 95% confidence bounds for cell percentages Figure 5-144: What part of BDE do young drivers find most useful? Number of strata = 16 Number of obs = 745 Number of PSUs = 745 Population size = Design df = 729 What part of the BDE course was most useful during G1 stage? percentages lb ub classroom instruction in-vehicle instruction additional instruction Total 100 Key: percentages = cell percentages lb = lower 95% confidence bounds for cell percentages ub = upper 95% confidence bounds for cell percentages 195
208 Figure 5-145: Do young drivers take additional driving lessons outside of BDE? Number of strata = 24 Number of obs = 986 Number of PSUs = 986 Population size = Design df = 962 classific Have you taken nonbde driving lessons? ation No Yes Total BDE w/ T [89.11,94.61] [5.388,10.89] BDE w/o [87.23,95.87] [4.127,12.77] non-bde [72.32,82.98] [17.02,27.68] Total [87.04,91.38] [8.616,12.96] Key: row percentages [95% confidence intervals for row percentages] Pearson: Uncorrected chi2(2) = Design-based F(1.86, )= P = Figure 5-146: Logistic regression Number of strata = 24 Number of obs = 986 Number of PSUs = 986 Population size = Design df = 962 F( 6, 957) = 9.23 Prob > F = Linearized nonbde_les~s Odds Ratio Std. Err. t P> t [95% Conf. Interval] classifica~n BDE w/ TD BDE w/o TD non-bde gender male female ageyears _cons
209 Figure 5-147: How convenient are the public transportation systems in young driver s area? Number of strata = 24 Number of obs = 660 Number of PSUs = 660 Population size = Design df = 636 How convenient are the public transportation systems in your area postalcode to use? rural urban Total very convenient [5.777,18.74] [17.97,25.9] [17.36,24.74] convenient [6.055,21.73] [24.64,33.49] [23.61,31.86] somewhat convenient [22.75,42.88] [29.17,38.26] [29.31,37.84] not convenient at al [27.64,48.83] [9.295,15.76] [11.33,17.51] don't know / n/a [3.782,15.94] [2.34,5.922] [2.691,6.098] Total Key: column percentages [95% confidence intervals for column percentages] Pearson: Uncorrected chi2(4) = Design-based F(3.92, )= P = Figure 5-148: Logistic regression Number of strata = 24 Number of obs = 622 Number of PSUs = 622 Population size = Design df = 598 F( 5, 594) = 5.96 Prob > F = Linearized reg_transi~e Odds Ratio Std. Err. t P> t [95% Conf. Interval] num_postal~e Rural Urban gender male female ageyears _cons
210 Figure 5-149: How often do young drivers take public transportation monthly? Number of strata = 24 Number of obs = 659 Number of PSUs = 659 Population size = Design df = 635 How often do you take public transit, postalcode monthly? rural urban Total daily [3.326,13.8] [14.5,22.22] [13.89,21.05] several times p [2.659,13.63] [14.49,21.9] [13.81,20.7] once per week [4.743,20.58] [9.657,16.17] [9.634,15.75] once per month [5.365,17.64] [15.83,23.57] [15.34,22.53] never [55.71,76.3] [27.82,36.69] [30.75,39.09] Total Key: column percentages [95% confidence intervals for column percentages] Pearson: Uncorrected chi2(4) = Design-based F(3.80, )= P = Figure 5-150: Logistic regression reg_frequency_transit : 0=Less than once per week 1=At least once per week (running logit on estimation sample) Survey: Logistic regression Number of strata = 24 Number of obs = 659 Number of PSUs = 659 Population size = Design df = 635 F( 5, 631) = 7.37 Prob > F = Linearized reg_freque~t Odds Ratio Std. Err. t P> t [95% Conf. Interval] num_postal~e Rural Urban gender male female ageyears _cons
211 Figure 5-151: How often do young drivers get rides from other drivers monthly? Number of strata = 24 Number of obs = 959 Number of PSUs = 959 Population size = Design df = 935 How often do you get a ride from someone else, postalcode monthly? rural urban Total daily [5.797,12.2] [9.449,15.16] [9.183,13.99] several times per week [23.17,34.38] [27.03,35.42] [27.12,34.29] once per week [23.92,35.09] [27.27,35.79] [27.46,34.72] once per month [19.2,29.89] [15.97,23.06] [17.27,23.39] never [6.669,14.05] [4.334,9.004] [5.163,9.188] Total Key: column percentages [95% confidence intervals for column percentages] Pearson: Uncorrected chi2(4) = Design-based F(3.95, )= P = Figure 5-152: Logistic regression reg_frequency_ride : 0=Less than once per week 1=At least once per week (running logit on estimation sample) Survey: Logistic regression Number of strata = 24 Number of obs = 959 Number of PSUs = 959 Population size = Design df = 935 F( 5, 931) = 6.51 Prob > F = Linearized reg_frequ~de Odds Ratio Std. Err. t P> t [95% Conf. Interval] num_postal~e Rural Urban gender male female ageyears _cons
212 Figure 5-153: How often in the average month do young drivers walk instead of driving as a mode of transportation? Number of strata = 24 Number of obs = 958 Number of PSUs = 958 Population size = Design df = 934 How often do you walk as a mode of transporation, postalcode monthly? rural urban Total daily [16,25.62] [28.84,37.24] [27.19,34.28] several times p [11.8,20.63] [22.61,30.75] [21.25,28.1] once per week [7.574,15.4] [8.899,14.74] [9.135,14.11] once per month [5.126,11.63] [8.075,13.58] [7.928,12.58] never [39.22,51.39] [15.32,22.41] [20.5,26.7] Total Key: column percentages [95% confidence intervals for column percentages] Pearson: Uncorrected chi2(4) = Design-based F(3.97, )= P = Figure 5-144: Logistic regression reg_frequency_walk : 0=Less than once per week 1=At least once per week (running logit on estimation sample) Survey: Logistic regression Number of strata = 24 Number of obs = 958 Number of PSUs = 958 Population size = Design df = 934 F( 5, 930) = Prob > F = Linearized reg_freque~k Odds Ratio Std. Err. t P> t [95% Conf. Interval] num_postal~e Rural Urban gender male female ageyears _cons
213 Figure 5-155: How often in the average month do young drivers cycle instead of driving as a mode of transportation? Number of strata = 24 Number of obs = 958 Number of PSUs = 958 Population size = Design df = 934 How often do you cycle as a mode of transporation, postalcode monthly? rural urban Total daily [.2119,2.472] [1.016,3.985] [.9389,3.373] several times p [2.194,7.213] [5.92,11.18] [5.514,9.901] once per week [3.719,9.578] [4.752,9.333] [4.886,8.765] once per month [6.835,14.8] [10.09,16.42] [9.98,15.35] never [73.55,83.75] [65.79,74.25] [68.1,75.26] Total Key: column percentages [95% confidence intervals for column percentages] Pearson: Uncorrected chi2(4) = Design-based F(3.92, )= P = Figure 5-156: Did young drivers visit MTO s website for information on licensing requirements before obtaining their G1 licence? Number of strata = 24 Number of obs = 958 Number of PSUs = 958 Population size = Design df = 934 Before obtaining your G1 did you visit MTO's website? percentages lb ub yes no don't know / do Total 100 Key: percentages = cell percentages lb = lower 95% confidence bounds for cell percentages ub = upper 95% confidence bounds for cell percentages 201
214 Figure 5-157: Did young drivers visit MTO s website for required documentation related to licensing before obtaining their G1 licence? Number of strata = 24 Number of obs = 958 Number of PSUs = 958 Population size = Design df = 934 Before G1 did you visit MTO for required doc? percentages lb ub yes no don't know / do Total 100 Key: percentages = cell percentages lb = lower 95% confidence bounds for cell percentages ub = upper 95% confidence bounds for cell percentages 202
215 Figure 5-158: Have young drivers seen any of the available videos for young drivers listed on MTO s website entitled, Getting your driver s licence? Number of strata = 24 Number of obs = 958 Number of PSUs = 958 Population size = Design df = 934 Have you seen any videos available for young drivers? percentages lb ub yes no don't know / do Total 100 Key: percentages = cell percentages lb = lower 95% confidence bounds for cell percentages ub = upper 95% confidence bounds for cell percentages Figure 5-159: Do young drivers visit MTO s website after passing the G1 road test and obtaining their G2 licence? Number of strata = 20 Number of obs = 845 Number of PSUs = 845 Population size = Design df = 825 After passing G1 road test did you visit MTO's website? percentages lb ub yes no don't know / do Total 100 Key: percentages = cell percentages lb = lower 95% confidence bounds for cell percentages ub = upper 95% confidence bounds for cell percentages 203
216

217 APPENDIX B: G1 QUESTIONNAIRE 205
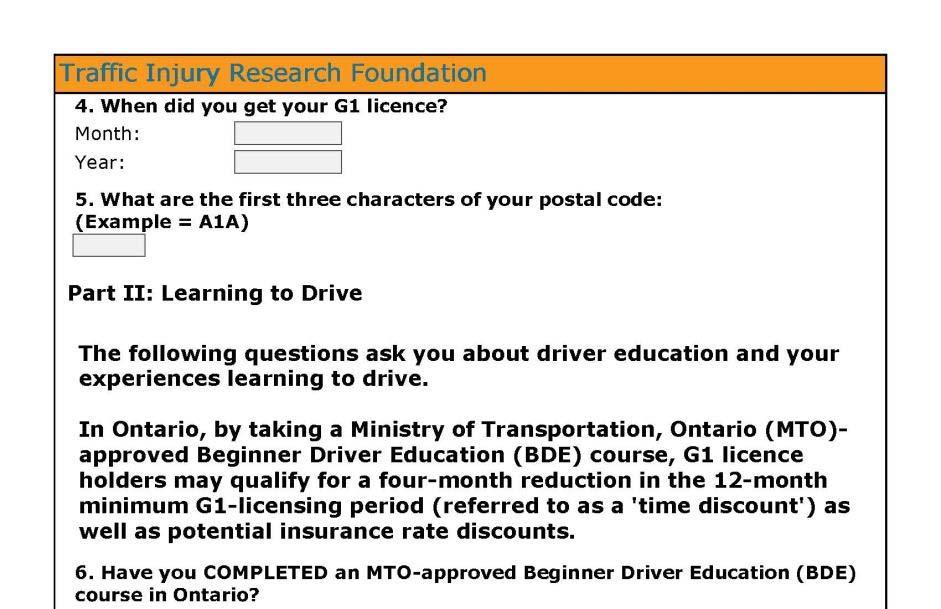
218 206
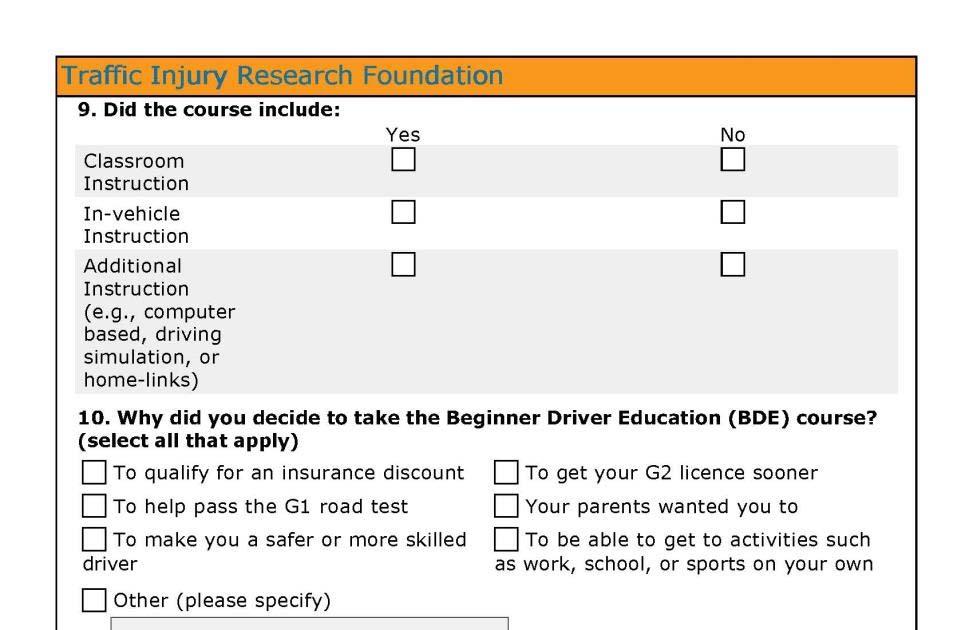
219 207
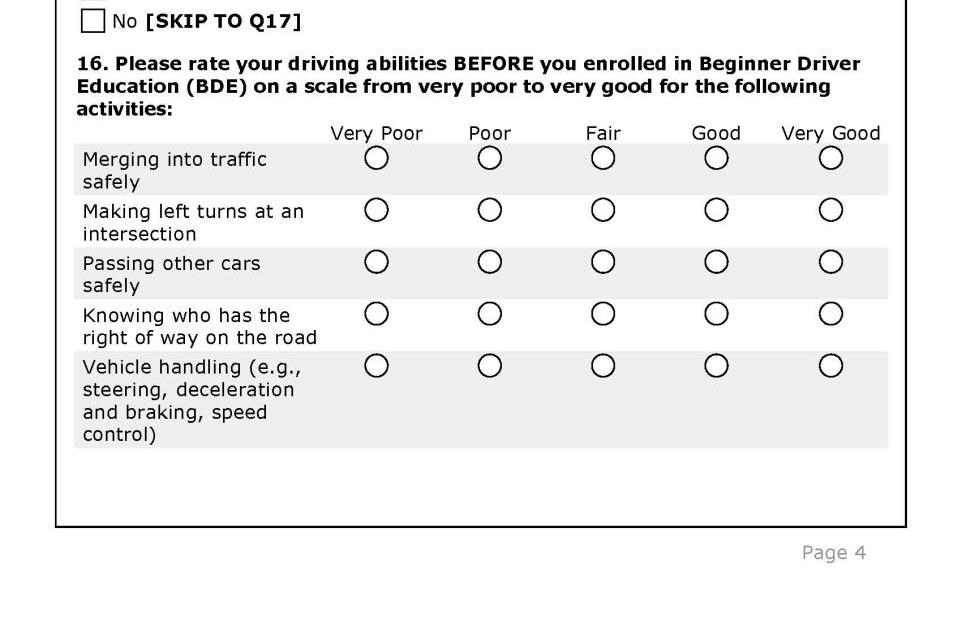
220 208
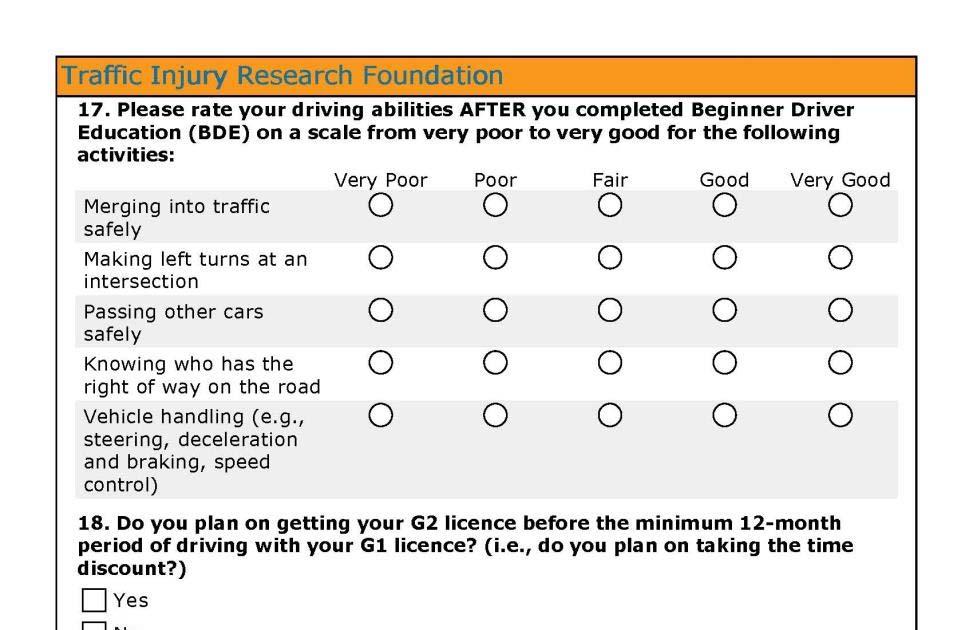
221 209
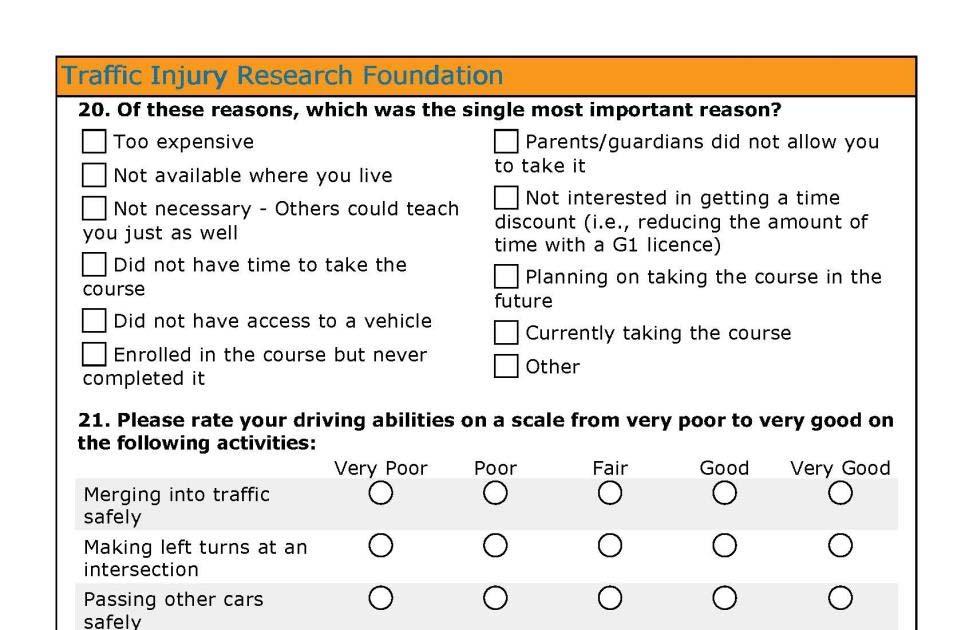

222 210
223 211
224 212
225 213
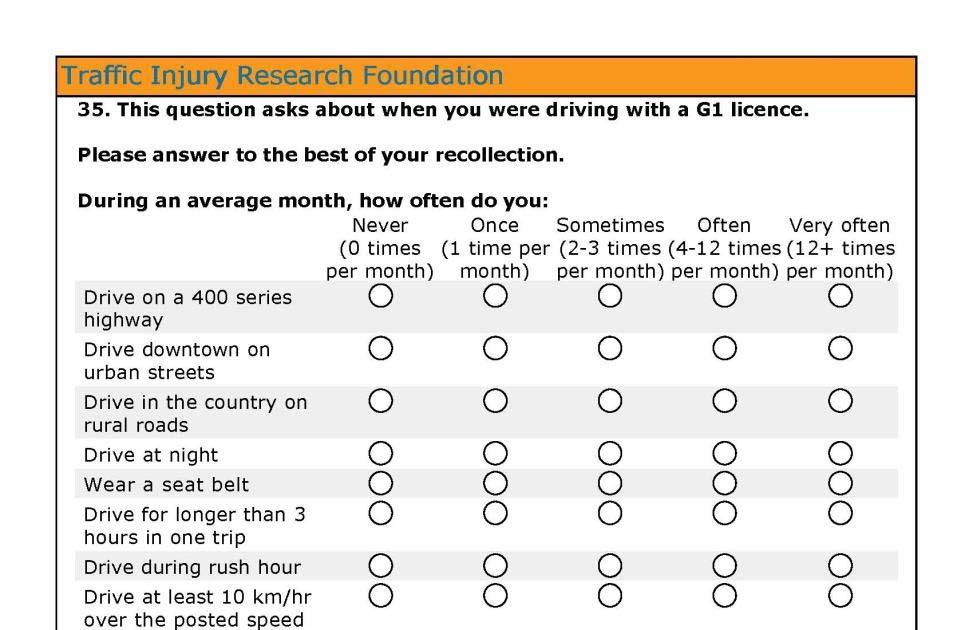

226 214
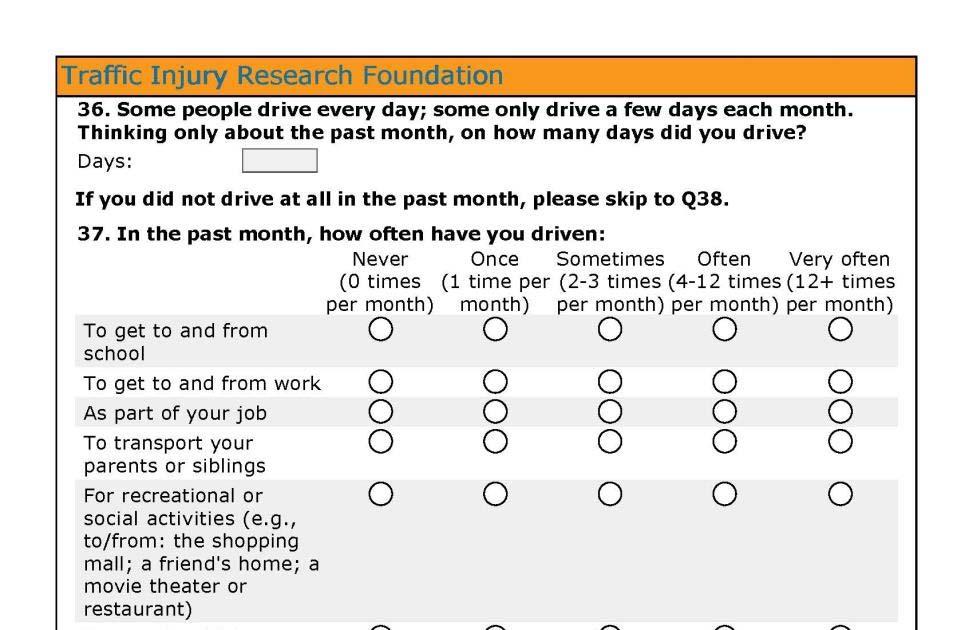
227 215
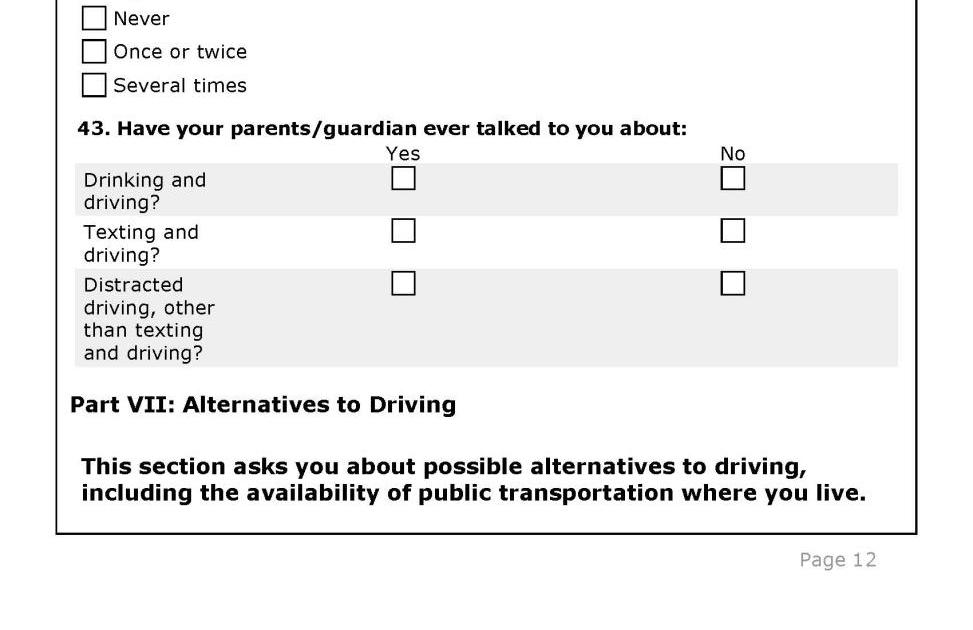
228 216
229 217
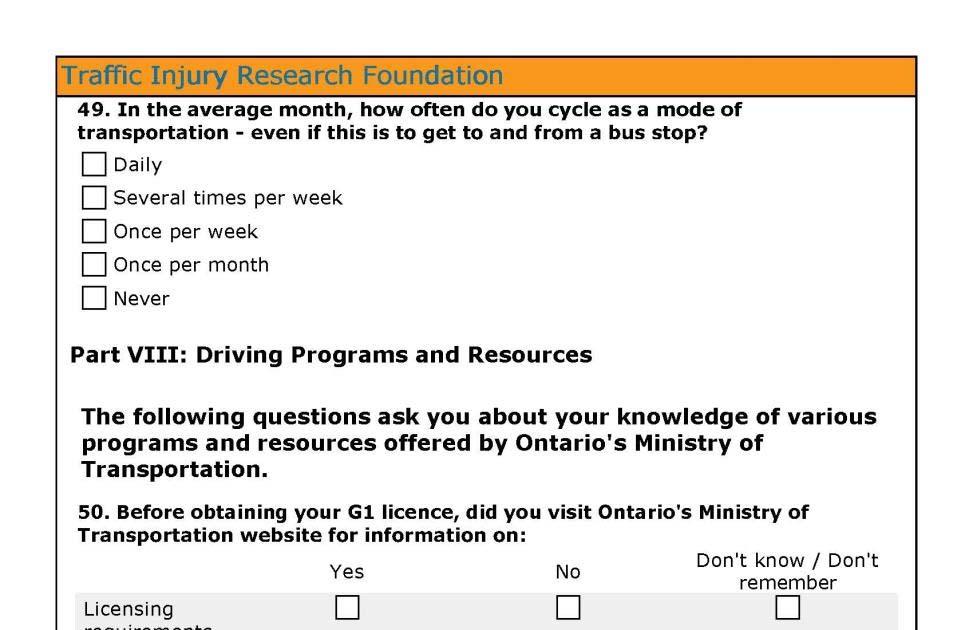
230 218
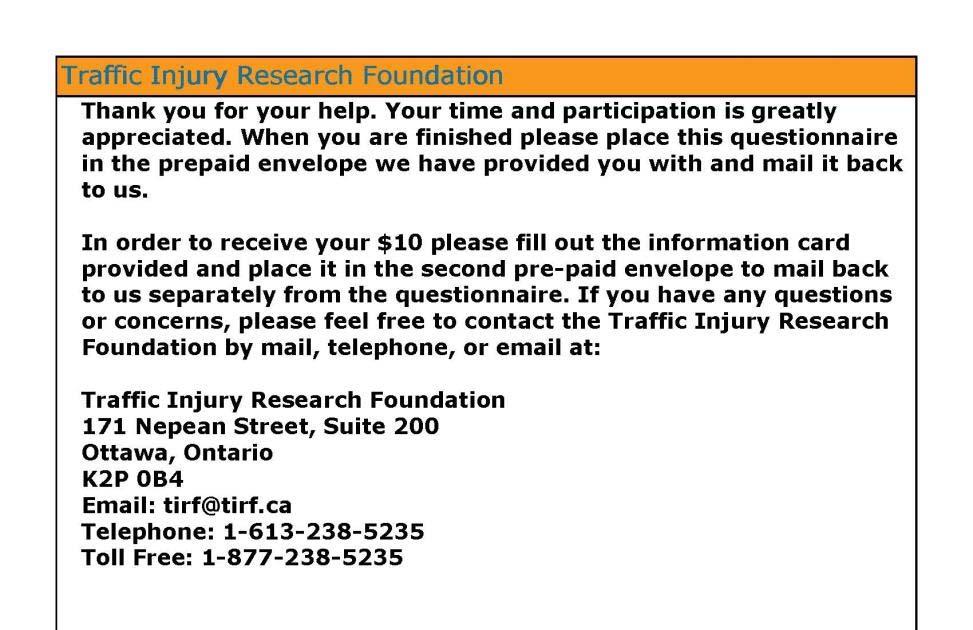
231 219
232
233 APPENDIX C: G2 QUESTIONNAIRE 221
234 222
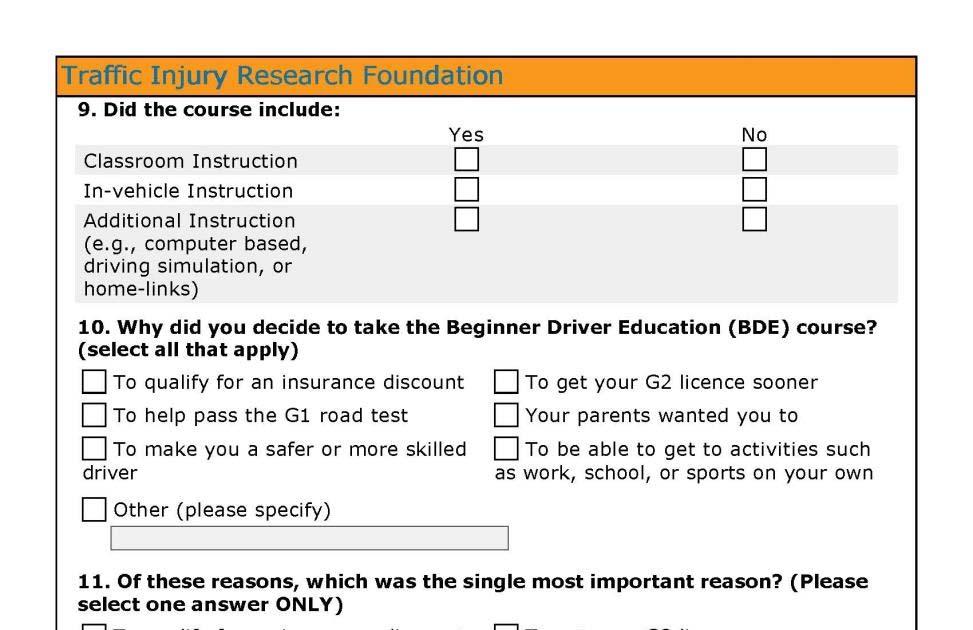
235 223
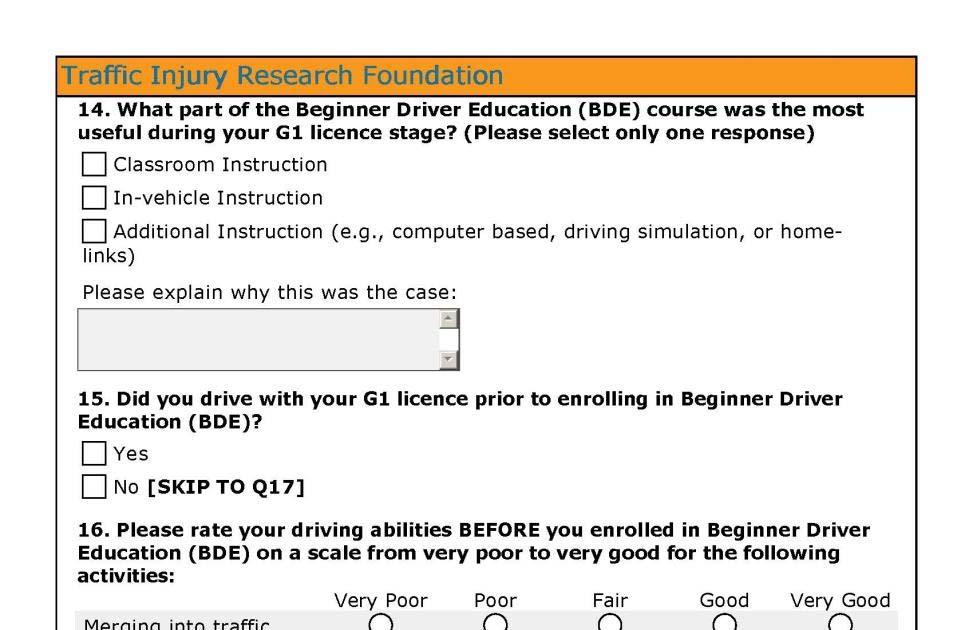

236 224
237 225
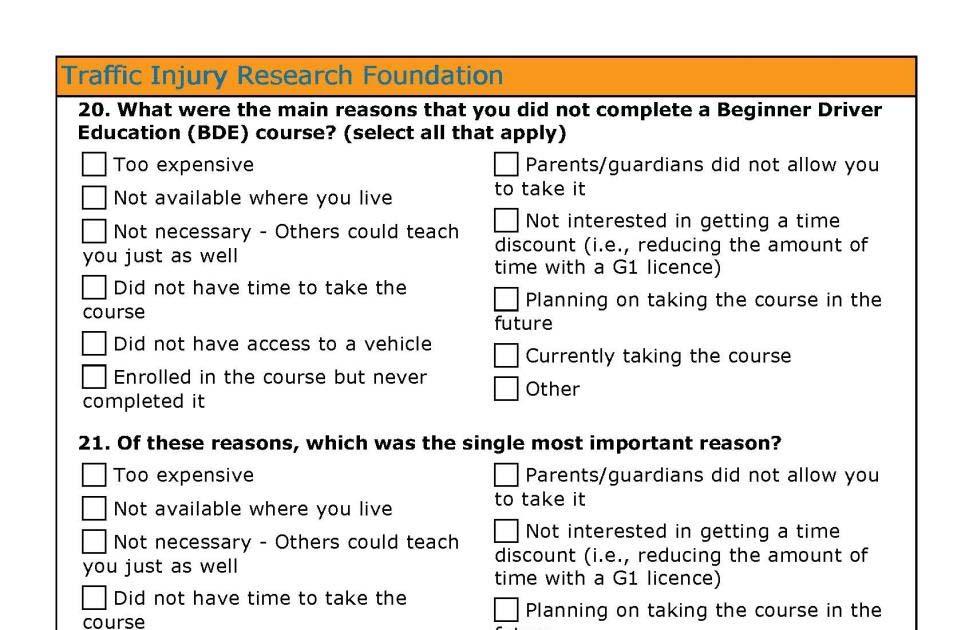

238 226
239 227
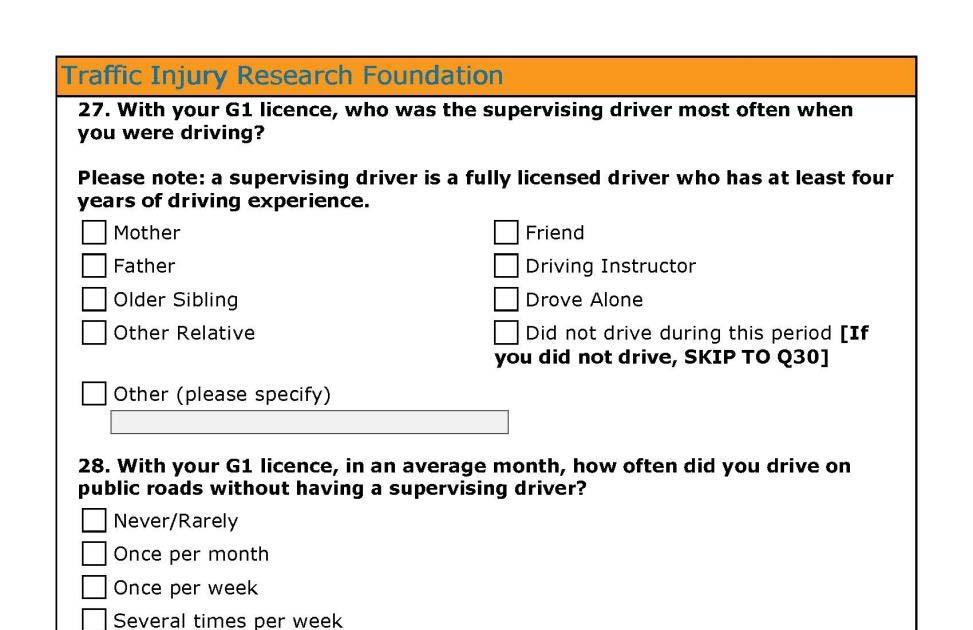
240 228
241 229
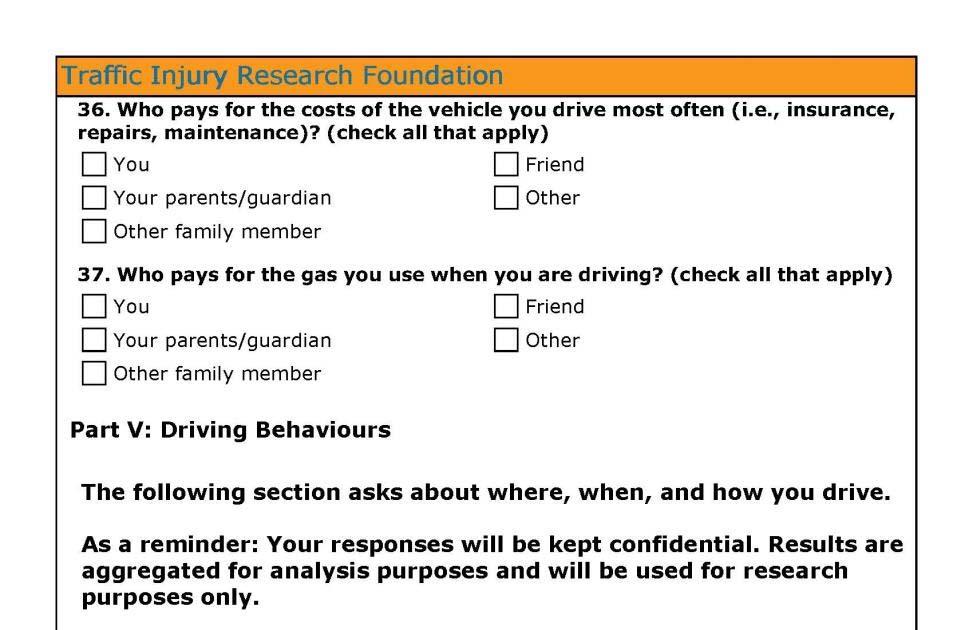
242 230
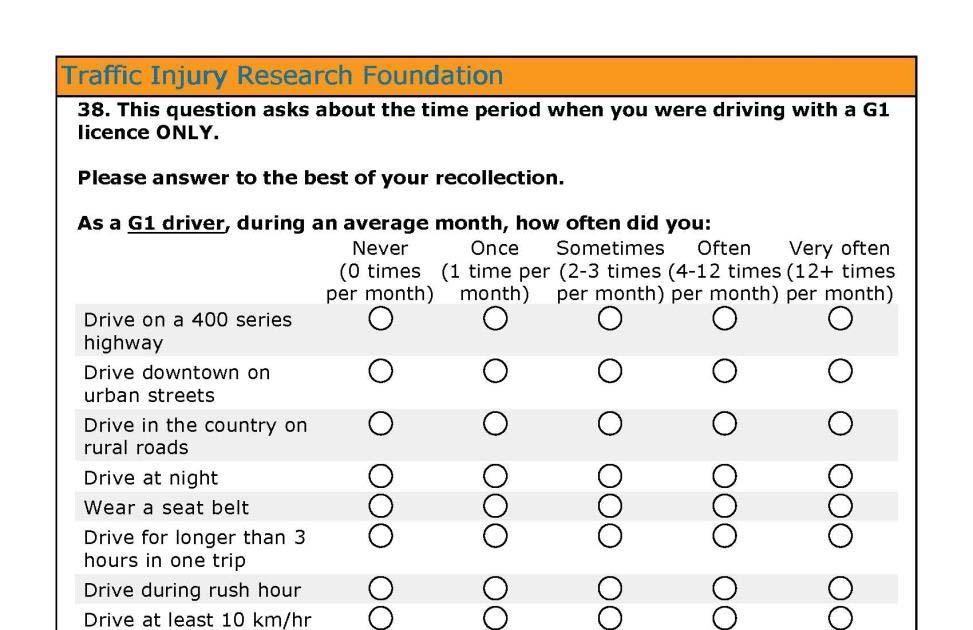

243 231
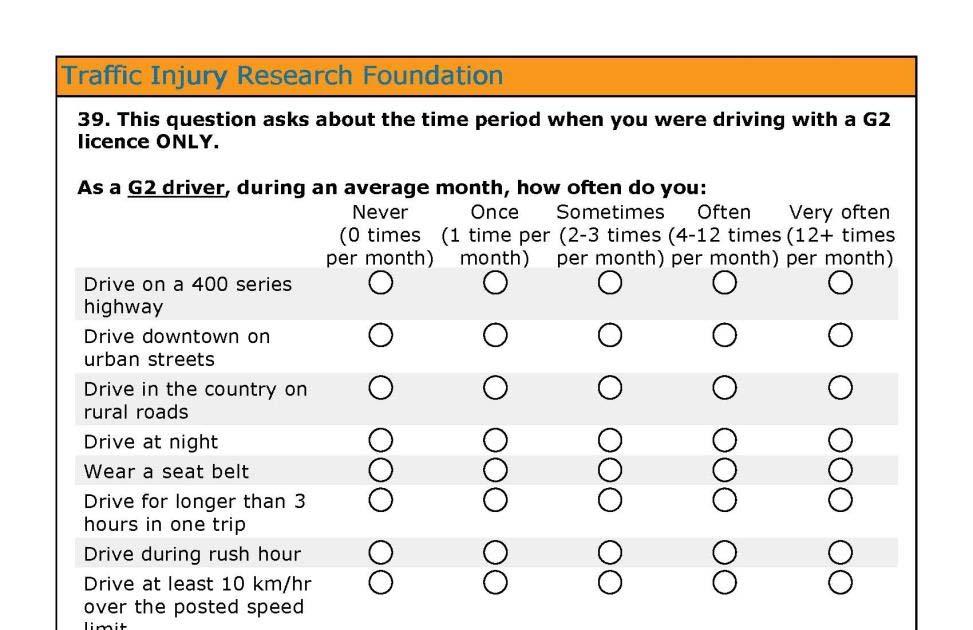

244 232
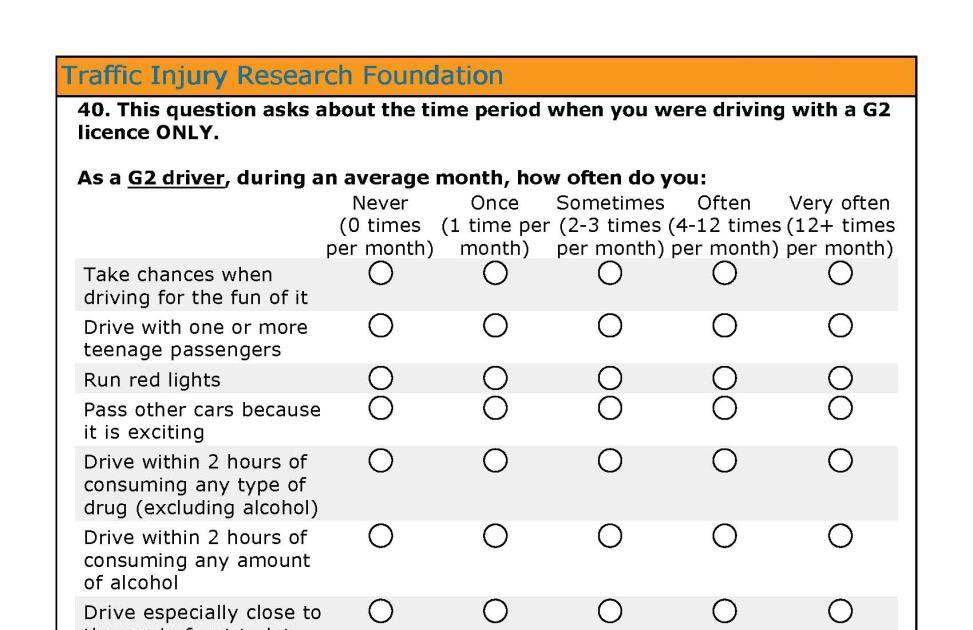
245 233
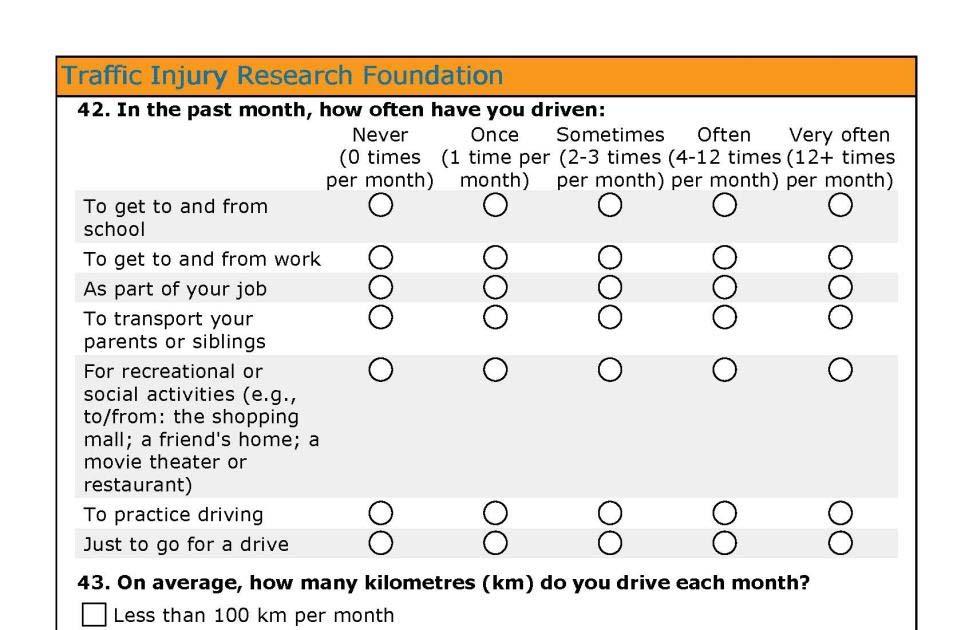
246 234
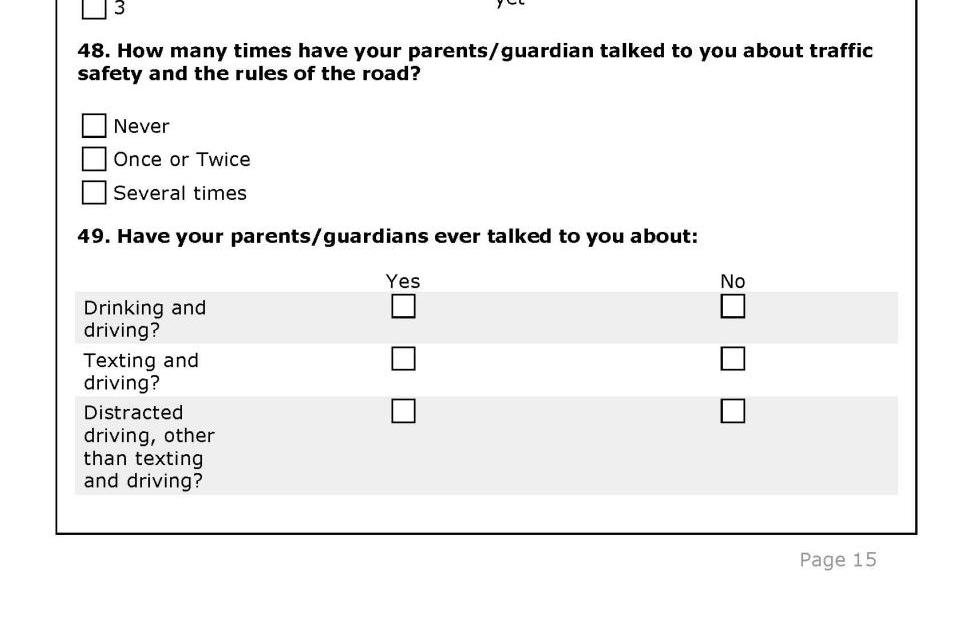
247 235
248 236
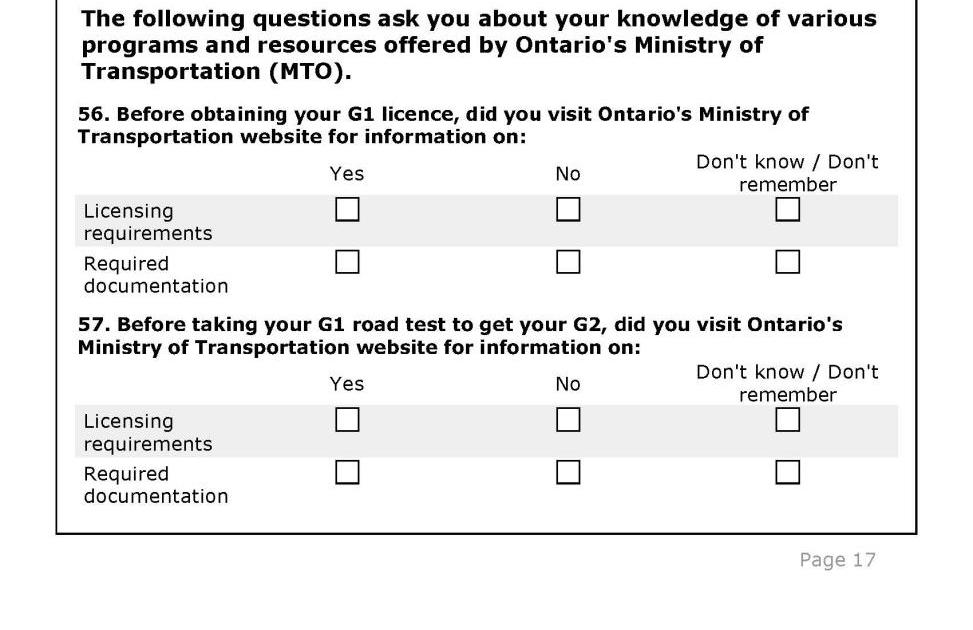
249 237
Best practices for graduated driver licensing in Canada
 Best practices for graduated driver licensing in Canada The Traffic Injury The mission of the Traffic Injury (TIRF) is to reduce traffic-related deaths and injuries. TIRF is a national, independent, charitable
INJURY PREVENTION POLICY ANALYSIS
 INJURY PREVENTION POLICY ANALYSIS Graduated Driver Licensing for Passenger Vehicles in Atlantic Canada Introduction Motor vehicle collisions (MVC) are a leading cause of death for young Atlantic Canadians.
Interim Evaluation Report - Year 3
 Performance Analysis Services Graduated Licensing Program Interim Evaluation Report - Year 3 Prepared by: Sandi Wiggins Performance Analysis Services Table of Contents Section 1. Executive Summary... 11
ROAD SAFETY MONITOR 2014: KNOWLEDGE OF VEHICLE SAFETY FEATURES IN CANADA. The knowledge source for safe driving
 T R A F F I C I N J U R Y R E S E A R C H F O U N D A T I O N ROAD SAFETY MONITOR 2014: KNOWLEDGE OF VEHICLE SAFETY FEATURES IN CANADA The knowledge source for safe driving TRAFFIC INJURY RESEARCH FOUNDATION
Keeping your new driver safe.
 Keeping your new driver safe. You re going to have a new young driver in the family! Reaching driving age is a major milestone for young people and for their parents too. A new driver s licence opens up
American Driving Survey,
 RESEARCH BRIEF American Driving Survey, 2015 2016 This Research Brief provides highlights from the AAA Foundation for Traffic Safety s 2016 American Driving Survey, which quantifies the daily driving patterns
A Question of Size: Involvement of Large Trucks in Road Crashes
 A Question of Size: Involvement of Large Trucks in Road Crashes Steve Brown Research Associate Traffic Injury Research Foundation 3 rd Ontario Road Safety Forum Toronto, Ontario March 6, 2018 Involvement
Nebraska Teen Driving Experiences Survey Four-Year Trend Report
 Nebraska Teen Driving Experiences Survey Four-Year Trend Report 2014-2015, 2015-2016, and 2017-2018 School Years April 2018 Division of Public Health Injury Prevention Program Table of Contents Executive
Rates of Motor Vehicle Crashes, Injuries, and Deaths in Relation to Driver Age, United States,
 RESEARCH BRIEF This Research Brief provides updated statistics on rates of crashes, injuries and death per mile driven in relation to driver age based on the most recent data available, from 2014-2015.
Brain on Board: From safety features to driverless cars
 Brain on Board: From safety features to driverless cars Robyn Robertson, M.C.A. President & CEO Traffic Injury Research Foundation 18 th Annual Not By Accident Conference. London, ON, October 18 th, 2016
Statement before the Maryland House Committee on Environmental Matters. Passenger Restrictions for Young Drivers. Stephen L. Oesch
 Statement before the Maryland House Committee on Environmental Matters Passenger Restrictions for Young Drivers Stephen L. Oesch The Insurance Institute for Highway Safety is a nonprofit research and communications
GRADUATED LICENSING. KITCHEN TABLE DISCUSSION GUIDE Have your say on Your PLates reforms
 YOUR GRADUATED LICENSING KITCHEN TABLE DISCUSSION GUIDE Have your say on Your PLates reforms Justice and Community Safety Directorate April - May 2018 INTRODUCTION Thank you for your interest in how we
SEGMENT 2 DRIVER EDUCATION Risk Awareness
 Fact Sheet 1 Why Should Young Drivers Be Concerned? Risk is the chance of death, injury, damage, or loss. Approximately 1 out of 11 (9%) of 16-year-old drivers will have a serious crash before his/her
Who has trouble reporting prior day events?
 Vol. 10, Issue 1, 2017 Who has trouble reporting prior day events? Tim Triplett 1, Rob Santos 2, Brian Tefft 3 Survey Practice 10.29115/SP-2017-0003 Jan 01, 2017 Tags: missing data, recall data, measurement
COMMUNITY ENGAGEMENT STRATEGIES
 COMMUNITY ENGAGEMENT STRATEGIES for Teen Driver Safety Parent Awareness Programs Chief Steve Mortenson Elko New Market Police Department Trooper Joe Dellwo Minnesota State Patrol Gordy Pehrson DPS Office
executive summary The Implementation of Alcohol Interlocks for Offenders: a roadmap
 T r a f f i c i n j u r y r e s e a r c h F o u n d a t i o n executive summary The Implementation of Alcohol Interlocks for Offenders: a roadmap The Traffic Injury Research Foundation The mission of the
Road Safety. Background Information. Motor Vehicle Collisions
 Background Information Motor Vehicle Collisions For many Canadians, the riskiest part of their job is their time spent on the road driving. Motor vehicle collisions are the leading cause of injury and
A) New zero tolerance drug presence laws for young and novice drivers. Create a new regulation to define and permit the use of federally
 New zero tolerance drug presence laws for young and novice drivers. Create a new regulation to define and permit the use of federally") Proposed Regulatory Amendments to Support Implementation of Schedule 4 of the Cannabis, Smoke-Free Ontario and Road Safety Statute Law Amendment Act, 2017 Background: For the last 16 years, Ontario has
Proposed Regulatory Amendments to Support Implementation of Schedule 4 of the Cannabis, Smoke-Free Ontario and Road Safety Statute Law Amendment Act, 2017 Background: For the last 16 years, Ontario has
Traffic Safety Facts
 Part 1: Read Sources Source 1: Informational Article 2008 Data Traffic Safety Facts As you read Analyze the data presented in the articles. Look for evidence that supports your position on the dangers
Response to. Department for Transport Consultation Paper. Allowing Learner Drivers To Take Lessons on Motorways
 Response to Department for Transport Consultation Paper Allowing Learner Drivers To Take Lessons on Motorways 6 February 2017 Introduction This is RoSPA s response to the Department for Transport s consultation
Produced by: Working in partnership with: Brake. the road safety charity
 1 Direct Line & Brake Reports on Safe Driving 2013-2014 REPORT ONE Are you ready to drive Produced by: Brake the road safety charity Working in partnership with: INTRODUCTION Julie Townsend, Brake s deputy
The Effects of Mandatory Rider Training and Licensing Incentives on Motorcycle Rider Training Enrolment A Canadian Perspective
 The Effects of Mandatory Rider Training and Licensing Incentives on Motorcycle Rider Training Enrolment A Canadian Perspective By Raynald Marchand National Coordinator Motorcycle Training Program, Manager,
GRADUATED LICENSING: YEAR SIX EVALUATION REPORT
 Performance Analysis Services GRADUATED LICENSING: YEAR SIX EVALUATION REPORT SHORT AND LONGERTERM EFFECTS ON NEW DRIVER CRASH RATES, SPECIFIC COMPONENT EFFECTS, AND EARLY EFFECTS OF OCTOBER 2003 ENHANCEMENTS
WHITE PAPER. Preventing Collisions and Reducing Fleet Costs While Using the Zendrive Dashboard
 WHITE PAPER Preventing Collisions and Reducing Fleet Costs While Using the Zendrive Dashboard August 2017 Introduction The term accident, even in a collision sense, often has the connotation of being an
BRANDON POLICE SERVICE th Street Brandon, Manitoba R7A 6Z3 Telephone: (204)
") BRANDON POLICE SERVICE 1340-10th Street Brandon, Manitoba R7A 6Z3 Telephone: (204) 729-2345 www.brandon.ca 2010-02-24 Canadian Council of Motor Transport Administrators 2323 St. Laurent Blvd. Ottawa, Ontario
BRANDON POLICE SERVICE 1340-10th Street Brandon, Manitoba R7A 6Z3 Telephone: (204) 729-2345 www.brandon.ca 2010-02-24 Canadian Council of Motor Transport Administrators 2323 St. Laurent Blvd. Ottawa, Ontario
Collect and analyze data on motorcycle crashes, injuries, and fatalities;
 November 2006 Highway Safety Program Guideline No. 3 Motorcycle Safety Each State, in cooperation with its political subdivisions and tribal governments and other parties as appropriate, should develop
Automated Vehicles: Driver Knowledge, Attitudes & Practices
 Automated Vehicles: Driver Knowledge, Attitudes & Practices Ward Vanlaar, Ph.D. Chief Operating Officer - TIRF 13 th PRI World Congress Tunis, May 3-7, 2017 Overview > Background > Methodology > Knowledge,
RESPONSE TO THE DEPARTMENT FOR TRANSPORT AND DRIVER AND VEHICLE STANDARDS AGENCY S CONSULTATION PAPER
 RESPONSE TO THE DEPARTMENT FOR TRANSPORT AND DRIVER AND VEHICLE STANDARDS AGENCY S CONSULTATION PAPER MODERNISING COMPULSORY BASIC TRAINING COURSES FOR MOTORCYCLISTS 17 APRIL 2015 Introduction The Royal
AAA ON THE ISSUES
 AAA ON THE ISSUES 2 0 1 7 TABLE OF CONTENTS Introduction Safety on Our Roadways Occupant Protection Child Passenger Safety Senior Mobility Teen Driving Motorcycle Helmets Recreational Marijuana Transportation
Global Status Report on Road Safety: Respondents' Questionnaire
 Global Status Report on Road Safety: Respondents' Questionnaire Country: Respondent's Information Name: Position: Institution: Email: Telephone: Fax: National Data Coordinator Name: Position: Institution:
Occupational Driving Consider the Risks. Sandra Wilson, OSACH
 Occupational Driving Consider the Risks Sandra Wilson, OSACH Session Outline Who is driving for work purposes? What are the risks factors? How can I minimize these risks? 2 What do you think? True or false:
Florida Strategic Highway Safety Planning Florida Strategic Highway Safety Plan (SHSP) Update and Performance Overview
 Update and Performance Overview") Session 1 Florida Strategic Highway Safety Planning Florida Strategic Highway Safety Plan (SHSP) Update and Performance Overview Joe Santos, PE, FDOT, State Safety Office October, 23, 2013 Florida Statistics
Session 1 Florida Strategic Highway Safety Planning Florida Strategic Highway Safety Plan (SHSP) Update and Performance Overview Joe Santos, PE, FDOT, State Safety Office October, 23, 2013 Florida Statistics
An Evaluation of the Relationship between the Seat Belt Usage Rates of Front Seat Occupants and Their Drivers
 An Evaluation of the Relationship between the Seat Belt Usage Rates of Front Seat Occupants and Their Drivers Vinod Vasudevan Transportation Research Center University of Nevada, Las Vegas 4505 S. Maryland
Where are the Increases in Motorcycle Rider Fatalities?
 Where are the Increases in Motorcycle Rider Fatalities? Umesh Shankar Mathematical Analysis Division (NPO-121) Office of Traffic Records and Analysis National Center for Statistics and Analysis National
Road Safety s Mid Life Crisis The Trends and Characteristics for Middle Aged Controllers Involved in Road Trauma
 Road Safety s Mid Life Crisis The Trends and Characteristics for Middle Aged Controllers Involved in Road Trauma Author: Andrew Graham, Roads and Traffic Authority, NSW Biography: Andrew Graham has been
Road fatalities in 2012
 Lithuania 1 Inhabitants Vehicles/1 000 inhabitants Road fatalities in 2012 Fatalities /100 000 inhabitants in 2012 2.98 million 751 301 10.1 1. Road safety data collection Definitions Road fatality: person
The Evolution of Side Crash Compatibility Between Cars, Light Trucks and Vans
 2003-01-0899 The Evolution of Side Crash Compatibility Between Cars, Light Trucks and Vans Hampton C. Gabler Rowan University Copyright 2003 SAE International ABSTRACT Several research studies have concluded
Riders Helping Riders: An Alcohol Peer Intervention Program for Motorcyclists
 Riders Helping Riders: An Alcohol Peer Intervention Program for Motorcyclists A. Scott McKnight and Les R. Becker Pacific Institute for Research and Evaluation Robert L. Hohn National Highway Traffic Safety
NHTSA / ANSTSE. Traffic Safety for Teen Drivers Presenter:
 NHTSA / ANSTSE Traffic Safety for Teen Drivers Presenter: Presentation Topics NHTSA s Support for Driver Education The Stakeholder Association - ANSTSE Young Motor Vehicle Crashes NHTSA Initiatives Vermont
RAA Member Panel Graduated Licencing System for Motorcyclists
 RAA Member Panel Graduated Licencing System for Motorcyclists Motorcycle crashes have been trending up over recent years. The Department of Planning, Transport and Infrastructure (DPTI) released a series
2017 Traffic Safety Culture Index
 2017 Traffic Safety Culture Index March 2018 607 14th Street, NW, Suite 201 Washington, DC 20005 202-638-5944 Title 2017 Traffic Safety Culture Index Authors AAA Foundation for Traffic Safety 2018, AAA
REQUIREMENTS FOR APPROVAL OF AN ONLINE - DEFENSIVE DRIVING COURSE (O-DDC) Defensive Driving. Course. Online. Online DDC December 2007 Page 1 of 11
 Defensive Driving. Course. Online. Online DDC December 2007 Page 1 of 11") Defensive Driving Course Online Online DDC December 2007 Page 1 of 11 Alberta Transportation Alberta Transportation Driver Programs & Licensing Standards Driver Programs & Licensing Standards 1 st Floor,
Defensive Driving Course Online Online DDC December 2007 Page 1 of 11 Alberta Transportation Alberta Transportation Driver Programs & Licensing Standards Driver Programs & Licensing Standards 1 st Floor,
2011 Tennessee Traffic Safety Culture Survey
 2011 Tennessee Traffic Safety Culture Survey UT Center for Transportation Research and The Center for Applied Research and Evaluation Acknowledgements The authors would like to thank the Tennessee Governor
Missouri Seat Belt Usage Survey for 2017
 Missouri Seat Belt Usage Survey for 2017 Conducted for the Highway Safety & Traffic Division of the Missouri Department of Transportation by The Missouri Safety Center University of Central Missouri Final
National Center for Statistics and Analysis Research and Development
 U.S. Department of Transportation National Highway Traffic Safety Administration DOT HS 809 271 June 2001 Technical Report Published By: National Center for Statistics and Analysis Research and Development
Abstract. 1. Introduction. 1.1 object. Road safety data: collection and analysis for target setting and monitoring performances and progress
 Road Traffic Accident Involvement Rate by Accident and Violation Records: New Methodology for Driver Education Based on Integrated Road Traffic Accident Database Yasushi Nishida National Research Institute
GRADUATED DRIVER LICENSING (GDL): SEARCHING FOR THE BEST COMPOSITION OF COMPONENTS 1. THE EMERGENCE OF GRADUATE DRIVER LICENCING
: SEARCHING FOR THE BEST COMPOSITION OF COMPONENTS 1. THE EMERGENCE OF GRADUATE DRIVER LICENCING") GRADUATED DRIVER LICENSING (GDL): SEARCHING FOR THE BEST COMPOSITION OF COMPONENTS Truls Vaa, Institute of Transport Economics, Gaustadalléen 21, NO-0349 Oslo, Norway, email: tva@toi.no Alena Høye, Institute
GRADUATED DRIVER LICENSING (GDL): SEARCHING FOR THE BEST COMPOSITION OF COMPONENTS Truls Vaa, Institute of Transport Economics, Gaustadalléen 21, NO-0349 Oslo, Norway, email: tva@toi.no Alena Høye, Institute
Silent Danger Zone for Highway Users
 Silent Danger Zone for Highway Users March 21, 2017 Dr. Kelly Regal Federal Motor Carrier Safety Administration Associate Administrator, Research and Information Technology Agenda Introduction to FMCSA
Alcohol Ignition Interlocks: Research, Technology and Programs. Robyn Robertson Traffic Injury Research Foundation NCSL Webinar, June 24 th, 2009
 Alcohol Ignition Interlocks: Research, Technology and Programs Robyn Robertson Traffic Injury Research Foundation NCSL Webinar, June 24 th, 2009 Overview of presentation Reductions in recidivism Predicting
Conduct on-road training for motorcycle riders
 Page 1 of 5 Conduct on-road training for motorcycle riders Level 5 Credits 10 Purpose This unit standard is for licensed motorcycle riding instructors who wish to conduct on-road motorcycle training. People
Stronger road safety. in South Australia. Presented by Tamra Fedojuk Senior Statistician Road Safety Policy
 Stronger road safety performance monitoring in South Australia Presented by Tamra Fedojuk Senior Statistician Road Safety Policy Outline Introduction Challenges for road safety in South Australia Current
HAS MOTORIZATION IN THE U.S. PEAKED? PART 2: USE OF LIGHT-DUTY VEHICLES
 UMTRI-2013-20 JULY 2013 HAS MOTORIZATION IN THE U.S. PEAKED? PART 2: USE OF LIGHT-DUTY VEHICLES MICHAEL SIVAK HAS MOTORIZATION IN THE U.S. PEAKED? PART 2: USE OF LIGHT-DUTY VEHICLES Michael Sivak The University
An Overview of Warn Range Administrative Licence Suspension Programs in Canada 2010
 An Overview of Warn Range Administrative Licence Suspension Programs in Canada 200 January 202 Introduction The provinces and territories first enacted warn range administrative licence suspension programs
Enhancing School Bus Safety and Pupil Transportation Safety
 For Release on August 26, 2002 (9:00 am EDST) Enhancing School Bus Safety and Pupil Transportation Safety School bus safety and pupil transportation safety involve two similar, but different, concepts.
Northeast Autonomous and Connected Vehicle Summit
 Northeast Autonomous and Connected Vehicle Summit June 12, 2018 Cathie Curtis, Director, Vehicle Programs AAMVA 1 1 Founded in 1933, the American Association of Motor Vehicle Administrators (AAMVA) represents
Vehicle Safety Risk Assessment Project Overview and Initial Results James Hurnall, Angus Draheim, Wayne Dale Queensland Transport
 Vehicle Safety Risk Assessment Project Overview and Initial Results James Hurnall, Angus Draheim, Wayne Dale Queensland Transport ABSTRACT The goal of Queensland Transport s Vehicle Safety Risk Assessment
License To Survive. Jay Carnes & Theo Mink. Mark Mithuen. Presented by: South Metro Safety Foundation. Douglas County Sheriff s Office
 License To Survive Presented by: Jay Carnes & Mark Mithuen Douglas County Sheriff s Office Theo Mink South Metro Safety Foundation Douglas County Sheriff s Office Douglas County School District South Metro
2015 IPWEA Queensland Conference Mackay. 14 th October 2015
 2015 IPWEA Queensland Conference Mackay 14 th October 2015 Session 6c Driver Safety Safer Driving Can You afford not to be proactive? THINK Differently ACT Differently DRIVE Differently Presenter Stephen
2010 Motorcycle Risk Study Update
 2010 Motorcycle Risk Study Update Introduction This report provides an update to the Motorcycle Risk Study from AI.16 of the 2005 Rate Application. The original study was in response to Public Utilities
STATE OF MAINE. Motor Vehicle Permittee's Driving Log For persons under 21 years of age. A message from:
 STATE OF MAINE Motor Vehicle Permittee's Driving Log For persons under 21 years of age A message from: Charles E. Summers, Jr. Secretary of State Dear Applicant: As a future driver in Maine, you are important
A new motorcycle graduated licensing system
 Home > Licences > Licence and permit types > Motorcycle licence and learner permits > A new motorcycle graduated licensing system A new motorcycle graduated licensing system VicRoads has been working with
The Case for and Strategies to Implement Graduated Licensing in the United States
 The Case for and Strategies to Implement Graduated Licensing in the United States Allan F. Williams* and Barry M. Sweedler** * Insurance Institute for Highway Safety, Arlington, Virginia, USA ** National
TRANSPORT SA EVALUATION OF COMPETENCY-BASED DRIVER TRAINING & ASSESSMENT IN SOUTH AUSTRALIA
 TRANSPORT SA \ \ EVALUATION OF COMPETENCY-BASED \ DRIVER TRAINING & ASSESSMENT IN SOUTH AUSTRALIA TRANSPORT SA DOCUMENT INFORMATION REPORT NUMBER: 212001 DATE: February 2001 PAGES: 61 ISBN: 0 7590 0066
NOVA SCOTIA ALCOHOL IGNITION INTERLOCK PROGRAM: OUTCOME EVALUATION EXECUTIVE REPORT
 T R A F F I C I N J U R Y R E S E A R C H F O U N D A T I O N NOVA SCOTIA ALCOHOL IGNITION INTERLOCK PROGRAM: OUTCOME EVALUATION EXECUTIVE REPORT The knowledge source for safe driving THE TRAFFIC INJURY
#1Motor vehicle. crashes are the leading cause of death for American teens.
 #1Motor vehicle crashes are the leading cause of death for American teens. In 2015, 2,333 teens (that s 6 per day) were killed in car accidents and another 221,313 were treated in emergency departments
House of Commons Standing Committee on Agriculture and Agri-Food: Perception of Public Trust in the Canadian Agriculture Sector
 Canadian Trucking Alliance CTA House of Commons Standing Committee on Agriculture and Agri-Food: Perception of Public Trust in the Canadian Agriculture Sector March 19th, 2019 Canadian Trucking Alliance
Vehicle Replacement Policy - Toronto Police Service
 STAFF REPORT June 21, 2000 To: From: Subject: Policy and Finance Committee Chairman, Toronto Police Services Board and City Auditor Vehicle Replacement Policy - Toronto Police Service Purpose: The purpose
The Emerging Risk of Fatal Motorcycle Crashes with Guardrails
 Gabler (Revised 1-24-2007) 1 The Emerging Risk of Fatal Motorcycle Crashes with Guardrails Hampton C. Gabler Associate Professor Department of Mechanical Engineering Virginia Tech Center for Injury Biomechanics
Act 229 Evaluation Report
 R22-1 W21-19 W21-20 Act 229 Evaluation Report Prepared for Prepared by Table of Contents 1. Documentation Page 3 2. Executive Summary 4 2.1. Purpose 4 2.2. Evaluation Results 4 3. Background 4 4. Approach
Analysis of Road Crash Statistics Western Australia 1990 to Report. December Project: Transport/21
 Analysis of Road Crash Statistics Western Australia 1990 to 1999 Report December 2000 Project: Transport/21 Analysis of Road Crash Statistics Western Australia 1990 to 1999 December 2000 Client: Transport
Denver Car Share Program 2017 Program Summary
 Denver Car Share Program 2017 Program Summary Prepared for: Prepared by: Project Manager: Malinda Reese, PE Apex Design Reference No. P170271, Task Order #3 January 2018 Table of Contents 1. Introduction...
MOTORISTS' PREFERENCES FOR DIFFERENT LEVELS OF VEHICLE AUTOMATION: 2016
 SWT-2016-8 MAY 2016 MOTORISTS' PREFERENCES FOR DIFFERENT LEVELS OF VEHICLE AUTOMATION: 2016 BRANDON SCHOETTLE MICHAEL SIVAK SUSTAINABLE WORLDWIDE TRANSPORTATION MOTORISTS' PREFERENCES FOR DIFFERENT LEVELS
ROAD SAFETY ANNUAL REPORT 2018 LITHUANIA
 ROAD SAFETY ANNUAL REPORT 2018 LITHUANIA LITHUANIA In 2017, 192 persons lost their lives in traffic crashes. Lithuania is one of the IRTAD countries that has achieved the strongest reduction in the number
Associations between advanced driver training, involvement in four-wheeled motor sport, and collisions on public roads: Report on a Survey Study
 Associations between advanced driver training, involvement in four-wheeled motor sport, and collisions on public roads: Report on a Survey Study by Kristiann Heesch, DrPH, MPH Athena Ng, MPH School of
What We Heard Report - Metro Line NW LRT
 What We Heard Report - Metro Line NW LRT by Metro Line NW LRT Project Team LRT Projects City of Edmonton April 11, 2018 Project / Initiative Background Name Date Location Metro Line Northwest Light Rail
2017 MDTSEA Manual - How it Corresponds to the ADTSEA 3.0 Curriculum for Segment 1 and 2 Classroom Education
 2017 MDTSEA - How it Corresponds to the ADTSEA 3.0 Curriculum for Segment 1 and 2 Classroom Education Section 5A Segment 1 Classroom Content, Objectives, and Resources 1 Introduction to Novice Driver Responsibilities
License To Survive. Jim Jensen. Theo Mink. Presented by: Douglas County Sheriff s Office. South Metro Safety Foundation
 License To Survive Presented by: Jim Jensen Douglas County Sheriff s Office Theo Mink South Metro Safety Foundation Douglas County Sheriff s Office Douglas County School District South Metro Safety Foundation
Course Syllabus. Time Requirements. Course Timeline. Grading Policy. Contact Information Online classroom Instructor: Kyle Boots
 Course Syllabus Course Overview This course is designed to meet the classroom requirement of your driver s education experience. It is approved by the State of Indiana. Time Requirements The State of Indiana
Evaluating Stakeholder Engagement
 Evaluating Stakeholder Engagement Peace River October 17, 2014 Stakeholder Engagement: The Panel recognizes that although significant stakeholder engagement initiatives have occurred, these efforts were
Safety: a major challenge for road transport
 www.maids-study.eu Safety: a major challenge for road transport The growing amount of traffic on European roads requires to address the issue of safety with a thorough and scientific understanding. Effective
Produced by: Working in partnership with: Brake. the road safety charity
 1 Direct Line & Brake Reports on Safe Driving 2015-2017 REPORT ONE Produced by: Brake the road safety charity Working in partnership with: INTRODUCTION Julie Townsend, Brake s deputy chief executive, says:
Defensive Driving. Monthly Training Topic NV Transport Inc. Safety & Loss Prevention
 Defensive Driving Monthly Training Topic NV Transport Inc. Safety & Loss Prevention According to the National Safety Council Introduction Every accident in which a driver is involved shall be considered
1 Background and definitions
 EUROPEAN COMMISSION DG Employment, Social Affairs and Inclusion Europe 2020: Employment Policies European Employment Strategy Youth neither in employment nor education and training (NEET) Presentation
Final Report. LED Streetlights Market Assessment Study
 Final Report LED Streetlights Market Assessment Study October 16, 2015 Final Report LED Streetlights Market Assessment Study October 16, 2015 Funded By: Prepared By: Research Into Action, Inc. www.researchintoaction.com
Break The Law, Pay The Price
 Page 1 of 6 Break The Law, Pay The Price Break The Law, Pay The Price Ontario has cracked down on some of the worst offenders on our roads drinking drivers and drivers suspended for Criminal Code convictions*.
Alcohol interlocks in Finland. 22 April 2015, Lisbon
 ETSC Safe & Sober Alcohol interlocks and the fight against drink-driving Alcohol interlocks in Finland 22 April 2015, Lisbon Marita Löytty, Special Adviser Responsible traffic. A joint effort. Content
Passenger seat belt use in Durham Region
 Facts on Passenger seat belt use in Durham Region June 2017 Highlights In 2013/2014, 85 per cent of Durham Region residents 12 and older always wore their seat belt when riding as a passenger in a car,
Variable Speed Limit Pilot Project in BC
 Variable Speed Limit Pilot Project in BC Road Safety Engineering Award Nomination Project Description and Road Safety Benefits British Columbia is unique in its challenges. The highways network has more
Respecting the Rules Better Road Safety Enforcement in the European Union. ACEA s Response
 Respecting the Rules Better Road Safety Enforcement in the European Union Commission s Consultation Paper of 6 November 2006 1 ACEA s Response December 2006 1. Introduction ACEA (European Automobile Manufacturers
Driver Improvement and Control. Program
 Driver Improvement and Control Program The Driver Improvement and Control (DI&C) Program aims to make Manitoba s roads safer for all. It encourages Manitobans to make safe driving behaviour a habit for
CIF # City of Barrie. Large Curbside Containers. Final Report. Final Project Report, September City of Barrie. CIF Project # 801.
 Final Report CIF #801.5 City of Barrie Large Curbside Containers Final Project Report, September 2015 City of Barrie CIF 801.5 City of Barrie: Large Curbside Containers, September 2015 1 CIF Project #
Class Licences. mpi.mb.ca. Notes
 Notes Class Licences 2/18 FBR0041 Professional and non-professional licences Applying for your licence Taking knowledge and road tests Chart showing the class of licence you require Ce document existe
THE HUMAN ELEMENT Motorcycle Rider Training and Education
 THE HUMAN ELEMENT Motorcycle Rider Training and Education Paper Title: INTERMEDIATE RIDER TRAINING Submitted by: Steve Garets, Director TEAM OREGON Motorcycle Safety Program In 2000 TEAM OREGON launched
 This page no longer exists on the MTO website, this is a copy http://www.mto.gov.on.ca/english/pubs/recreational-vehicles/frequently-asked-questions.shtml Search Home About the Ministry News Publications
Improving Rural Road Safety. National Conference of State Legislatures NCSL 2010 Legislative Summit Transportation Safety Committee July 26, 2010
 Improving Rural Road Safety National Conference of State Legislatures NCSL 2010 Legislative Summit Transportation Safety Committee July 26, 2010 Overview What is CERS? Why Focus on Rural? SafeRoadMaps
Driver Improvement and Control. Program
 Driver Improvement and Control Program The Driver Improvement and Control (DI&C) Program aims to make Manitoba s roads safer for all. It encourages Manitobans to make safe driving behaviour a habit for
Quarterly Content Guide Driver Education/Traffic Safety Classroom (Course # )
") Adopted Instructional : Quarterly Content Guide Driver Education/Traffic Safety Classroom (Course #1900300) Pearson Drive Right (11 th Edition) Quarter 1 43 Days Quarter 2 47 Days Quarter 3 47 Days Quarter
Adopted Instructional : Quarterly Content Guide Driver Education/Traffic Safety Classroom (Course #1900300) Pearson Drive Right (11 th Edition) Quarter 1 43 Days Quarter 2 47 Days Quarter 3 47 Days Quarter
SUMMARY AND ANALYSIS: FMCSA Notice of Proposed Rule-Making (NPRM)
") SUMMARY AND ANALYSIS: FMCSA Notice of Proposed Rule-Making (NPRM) Minimum Training Requirements for Entry-Level Commercial Motor Vehicle Operators Issued: March 7, 2016 PURPOSE To provide members of NYAPT
SUMMARY AND ANALYSIS: FMCSA Notice of Proposed Rule-Making (NPRM) Minimum Training Requirements for Entry-Level Commercial Motor Vehicle Operators Issued: March 7, 2016 PURPOSE To provide members of NYAPT
the Ministry of Transport is attributed as the source of the material
 Young Drivers 2016 Disclaimer All reasonable endeavours are made to ensure the accuracy of the information in this report. However, the information is provided without warranties of any kind including
Internal Audit Report. Fuel Consumption Oversight and Coordination TxDOT Internal Audit Division
 Internal Audit Report Fuel Consumption Oversight and Coordination TxDOT Internal Audit Division Objective To determine if a process exists to ensure retail fuel consumption is appropriately managed and