Trip and parking generation at transit-oriented developments: a case study of Redmond TOD, Seattle region
|
|
|
- Claire Jennings
- 5 years ago
- Views:
Transcription
1 DOI /s x Trip and parking generation at transit-oriented developments: a case study of Redmond TOD, Seattle region Guang Tian 1 Reid Ewing 1 Rachel Weinberger 2 Kevin Shively 2 Preston Stinger 3 Shima Hamidi 4 Springer Science+Business Media New York 2016 Abstract The decision on how best to allocate land around transit stations is a debated topic, with transit officials often opting for park-and-ride lots over active uses such as multifamily housing, office, and retail organized into transit-oriented developments (TODs). In this study, we identify the ten best self-contained TODs in ten regions across United States based on seven criteria: dense, mixed-use, pedestrian-friendly, adjacent to transit, built after transit, fully developed, and with self-contained parking. We measure trip and parking generation at one of these TODs, the Redmond TOD in the Seattle region, as a pilot study, using an onsite count and intercept survey. The results show that the Redmond TOD has 1.7 times more trips made by walking and 3 times more trips made by transit than Seattle s regional average. The actual vehicle trips we observed are only 37 % of the Institute of Engineers (ITE) expected value. The actual residential peak period parking demand is only 65 % of the ITE s peak demand, and the actual commercial peak period parking demand is only 27 % of the ITE s peak demand. Additionally, the peak period of transit parking was daytime, while the peak periods of commercial and residential were evening and nighttime. There is a real opportunity for sharing parking spaces among these different uses, something which is not realized at present. Keywords Transit oriented development TOD Trip generation Parking generation & Guang Tian guang.tian@utah.edu Department of City and Metropolitan Planning, College of Architecture? Planning, University of Utah, 375 S 1530 E, ARCH Room 235, Salt Lake City, UT 84112, USA Nelson\Nygaard Consulting Associates, 1402 Third Avenue, Suite 1200, Seattle, WA 98101, USA Fehr & Peers Associates, 2180 South 1300 East, Suite 220, Salt Lake City, UT 84106, USA College of Architecture, Planning and Public Affairs, University of Texas, Arlington, TX, USA
2 Introduction The decision on how best to allocate land around transit stations is a debated topic, with transit officials often opting for park-and-ride lots over active uses such as multifamily housing, office, and retail organized into transit-oriented developments (TODs). Providing large park-and-ride lots has been the default strategy to maximize transit ridership in the short-run. But is it the best strategy in the long run? The debate continues when land is developed, with officials usually assuming that TODs require the same number of parking spaces as conventional development and that transit stations require the same number of park-and-ride spaces as non-tod stations, even if much of the travel demand is captured internally and much of the transit demand is generated by TODs themselves. Transit operators often require one-to-one parking replacement when surface parking lots are redeveloped as mixed-use development projects with structured parking. Balancing the amount of parking at TODs with the need to create a pedestrian-friendly environment and encourage mixed-use development can be complicated. There are only a few studies of vehicle trip generation (Arrington and Cervero 2008; Cervero and Arrington 2008; Zamir et al. 2014) and parking demand (Cervero et al. 2010; Rowe et al. 2011; Serafin et al. 2010) at multifamily development near transit. And, to our knowledge, there is only one study of vehicle trip generation at TODs (defined as mixed-use developments Handy et al. 2013) and no study of parking demand at TODs (again, defined as mixed-use developments). The question of how much vehicle trip and parking demand reduction occurs with TOD is largely unexplored in the literature. Everyone agrees that there should be some reduction, but is it 20 or 30 or 40 %? This study gives an answer, albeit for only one TOD. And the reduction is huge. We hope these findings will spur additional research. In this study, we define TODs with seven criteria and identify the 10 best TODs that meet these criteria in 10 metropolitan areas as an initial pool, and as a benefit to other researchers Atlanta, Boston, Denver, Los Angeles, New York, Portland, Salt Lake City, San Diego, Seattle, and Washington, D.C. We measure trip and parking generation at Redmond TOD, Seattle region, using a methodology that is the most robust published to date. We want, in particular, to test whether TODs generate as many vehicle trips as the Institute of Engineers (ITE) Trip Generation Manual estimates and need as much parking as the ITE Parking Generation manual suggests. A consulting partner, Nelson\Nygaard, helped with data collection, analysis, and report and article writing. Specifically, they conducted parking supply and occupancy studies and building access counts as well as intercept surveys at Redmond TOD. We used these data to analyze travel modes and parking use at Redmond TOD, which allow us to develop numerical models of trip and parking demand and recommendations for land use and parking policies at new TOD developments. Literature review The Trip Generation Manual and Parking Generation, an informational report by the ITE (2010, 2012), are key sources of analysis of traffic impacts and parking demands of new development projects for planners, engineers, developers, and government decision makers in the United States (Shoup 2003; Millard-Ball 2015). ITE s trip and parking generation manuals provide estimates of the number of vehicle trips and parking demand generated by
3 a specific land use based on trip and parking surveys of suburban developments constructed after the 1960s. The trip and parking rates given by ITE are mostly generated in single-use suburban developments dominated by automobile travel. First we review the literature on trip generation at TODs. The ITE Trip Generation Manual itself states that Data were primarily collected at suburban locations having little or no transit service, nearby pedestrian amenities, or travel demand management (TDM) programs (ITE 2004, p. 1). It goes on to say: At specific sites, the user may wish to modify trip generation rates presented in this document to reflect the presence of public transportation service, ridesharing, or other TDM measures; enhanced pedestrian and bicycle trip-making opportunities; or other special characteristics of the site or surrounding area (ITE 2004, p. 1). This kind of modification is seldom done in practice. Surveying 17 TODs in five U.S. metropolitan areas, Cervero and Arrington (2008) found that vehicle trips per dwelling unit were substantially below the ITE s estimates. Over a typical weekday period, the surveyed TOD housing projects averaged 44 % fewer vehicle trips than that estimated by using the ITE manual (3.754 vs ). Another study by the San Francisco Bay Area Metropolitan Commission found that residents of the Bay Area living near transit generated half as many vehicle miles traveled (VMT) as their suburban and rural counterparts (SFBAMTC 2006). At the same time, residents living within developments near transit are reported to have higher rates of transit trips than those who are living at greater distance (Faghri and Venigalla 2013; SFBAMTC 2006; Zamir et al. 2014), especially for commuting trips (Arrington and Cervero 2008; Cervero 1994; Faghri and Venigalla 2013; Lund et al. 2004, 2006). Next we review the literature on parking generation by properties within TODs. The ITE Parking Generation manual notes that study sites upon which the manual is based are primarily isolated, suburban sites (ITE 2010). Rowe et al. (2011) found that the parking demand in an urban center abutting downtown Seattle and exhibited higher levels of transit service is about 50 % less than the parking demand in a growing mixed-use suburban center in Seattle. Other studies also show that the vehicle ownership is lower in transitserved areas than those that are not transit-served (Faghri and Venigalla 2013; Zamir et al. 2014). By comparing parking generation rates for housing projects near rail stops with parking supplies and with ITE s parking generation rates, Cervero et al. (2010) found there is an oversupply of parking at TODs, sometimes by as much as %. Serafin et al. (2010) found the oversupply of parking of transit related residential projects in Santa Clara County too. Oversupply of parking spaces may result in an increase in vehicle ownership (Cervero and Arrington 2008). This is supported by the strong positive correlation between parking supply and vehicle ownership (Chatman 2013; Guo 2013) and auto use (Chatman 2013; Weinberger 2012; Weinberger et al. 2009). The literature shows that a barrier to create TODs in many areas is parking replacement policies from transit agencies that require the developer to replace park-and-ride spaces on a one-to-one basis at a cost of $10,000 to $15,000 per parking space (Arrington and Cervero 2008). These policies increase the cost of TOD development substantially, especially because some estimates peg the price of a single parking stall even higher, at $20,000 to $40,000, or as much as $60,000 in high-value real estate markets (i.e., San Francisco) (Reconnecting America 2009). According to Cervero and Landis (1997), An oversupply of park-and-ride lots at transit stations can undermine regional land-use benefits. Developers and policy makers should agree upon parking supply and pricing policies that support the overall objectives of TODs (Willson 2005). The Bay Area Rapid
4 Transit (BART) system previously had a one-to-one parking replacement requirement, but came to realize that this policy was discouraging transit-oriented development around stations (Knepper 2015). Our review of the Research Board s (TRB s) Research Information Services (TRID) database found few resources on parking at TODs. One team of researchers sought to understand the tension between access (parking and otherwise) and transit-oriented development (TOD) and learn how practitioners successfully resolved these tensions (Edgar et al. 2013). The team performed a scan to learn of parking policies and TOD practices in five regions: San Francisco/Oakland, Denver, Los Angeles/ South Pasadena, San Diego, and Boston. They found that parking could be a source of tension in areas where land value is at a premium, density is high, and where transit riders are accustomed to large park-and-ride lots. Too much parking may interfere with the human design of a TOD and compromise what should be a pedestrian-friendly environment. The parking policy recommended by Martin and Hurrell (2012) is one of constrained parking that is not included in lease or other TOD operational costs. This will result in the greatest line-haul ridership for the TOD. In addition, they recommend that transit riders pay for parking once parking capacity is reached in order to cover maintenance costs for the parking lot or garage. The idea here is that when riders have to pay for parking, they demand less of it. Because data are difficult and expensive to collect, much of the research on parking at TODs presents more general findings. Our study will ultimately quantify trip and parking generation at TODs in 10 diverse metropolitan areas. For now, this study is limited to a single pilot study, of the Redmond TOD in Seattle. TOD definition TODs are widely defined as compact, mixed-use developments with high-quality walking environments near transit facilities (Calthorpe 1993, p. 56; Cervero et al. 2004, p. 7; ITE 2004, pp. 5 7). For our purposes, TODs are developed by a single developer under a master development plan, and can also include a clustering of development projects near transit facilities that are developed by one or more developers pursuant to a master development plan. This definition excludes mixed-use catchment areas around transit stations in the typical downtown. These mixed-use areas are too large for such a study, and do not have dedicated parking, one of the criteria for project selection. The first three criteria used to select TODs for this study are consistent with the definition above. TODs must be (1) dense (with mid-rise or higher multifamily housing), (2) mixed use (with residential, retail, entertainment, and sometime office uses in the same development), and (3) pedestrian-friendly (with streets built for pedestrians as well as autos and transit). We have added four additional criteria to maximize the utility of the sample and data. TODs must be (4) adjacent to transit (literally abutting transit passengers spill out into the TOD), (5) built after a high-quality transit line was constructed or proposed (and hence with a parking supply that reflects the availability of high quality transit),
5 (6) fully developed or nearly so, and (7) with self-contained parking. By self-contained parking we mean having dedicated parking for the buildings that comprise the TOD, in one or more parking lots or garages. This criterion is dictated by our need to measure parking demand for the combination of different land uses that comprise the TOD. The criterion precludes TODs in a typical downtown that share public parking with non-tod uses. This obviously constitutes a limitation on our study s external validity, but one that was self-imposed. In a typical downtown with public parking, it is impossible to tell which parked cars are associated with which land uses. Thus, our findings will be most applicable to the many proposed and self-contained TODs in less urban or more suburban locations. Since the TODs of interest to us are self-contained, and are under a single development plan, they will necessarily be small compared to a typical downtown or even relative to the typical quarter mile buffer around a transit station. They are likely to have small internal capture rates. This too is a limitation. The sizes of the TODs in our initial sample are discussed below. TOD selection Given our seven criteria, we selected the best self-contained TODs in each of 10 regions. For each region, we tried to identify TOD candidates from multiple sources in a multi-step process. The first step was to consider mixed use developments (MXDs) near transit from an MXD database collected for another purpose (Tian et al. 2015). The MXD database includes developments in six of the 10 study regions: Atlanta, Boston, Denver, Portland, Salt Lake City, and Seattle. We identified all MXDs in close proximity to transit stations in the six regions. The second step was to ask our teaming partners branch offices to identify candidate sites within their regions that meet our seven criteria. Concurrently, we contacted regional transit operators and/or metropolitan planning organizations in the ten regions with the same question. A surprising number of transit agencies and MPOs have staff specifically dedicated to promoting TODs. These were contacted, told our criteria, and asked for the best local examples of TOD, as we defined it. The third step was to review candidate sites with Google Satellite Imagery to see if there was clustering of buildings around transit stations, typically with well-defined boundaries. This was followed by the use of Google Street View to establish that TOD criteria (dense, mixed use, pedestrian-friendly with self-contained parking) were actually met. Several top candidate TODs were ranked in this manner for each metropolitan area. The final step was to visit each of the metropolitan areas in turn, and once there, take transit from one candidate station area to the next. In each location, we walked around and through the development to determine if our criteria were in fact met, and went to the property management office to get contact information. We also made a photographic record of each development. In virtually all cases the relative ranking of sites changed with on-the-ground inspections. Finally, we identified the 10 best TODs, one in each region, that meet our criteria. Indeed, it proved hard to find TODs that met all of our TOD criteria. In the typical region, there were only one or two. The process we used rank them was, firstly, they needed to meet the yes-and-no criteria, including (4), (5), (6), and (7). And then the TODs that
6 Table 1 The journey to work mode share for the CBGs that contain our TOD sites TOD Metropolitan area Area of TOD (acres) GISJOIN (census block group ID) Area of CBG (acres) Journey to work Walk share (%) Transit share (%) Lindbergh City Atlanta 38 G Center Station Landing Boston 17 G Englewood Denver 38 G Del Mar Los Angeles 4 G G Orenco Station Portland 50 G City Creek Center Salt Lake City 20 G Redmond TOD Seattle 5 G City College Trolley Station San Diego 2 G Fruitvale Village Rhode Island Row San Francisco Washington, D.C. 3 G G were denser, more diverse in their land uses, and with more pedestrian-friendly designs were ranked at the top. Table 1 provides descriptive statistics of mode share for work trips for the census block groups (CBGs) that contain these TODs. Generally, the CBGs containing TODs have fairly high walk or transit mode shares on the journey to work. A case study: Redmond TOD, Seattle region We identified the ten TODs as an initial pool, and as a benefit to other researchers. We then selected one as a pilot study, the Redmond TOD in the Seattle region. The choice was a matter of convenience, considering the relatively small size of the Redmond TOD and the immediate availability of consulting staff to conduct the study. We plan to eventually study them all, but the cost of these labor intensive studies exceeds our current budget. The Redmond TOD is our choice in the Seattle region, which is served by local and commuter buses. The King County Department of, the City of Redmond, and Sound Transit jointly developed a new Redmond Downtown Transit Center and adjacent TOD. The westbound bus stops of the Transit Center and Redmond Skate Park are on the north side of NE 83rd Street, while the TOD, eastbound bus stops, and Park-and- Ride Garage are on the south side. With NE 83rd Street having low traffic volumes and a pedestrian-friendly design, the four components form a unified whole. The Transit Center was built on the site of the existing bus transfer facility, while the TOD was built on Metro s Redmond Downtown Park-and-Ride Lot (Fig. 1). The former replaced a smaller, cramped set of bus stops originally constructed in The $7.2
, b before the project, c after the project million transit center was designed and constructed by Metro, with $6 million from Sound Transit and the remainder from a federal grant.")
7 Fig. 1 Redmond Transit Center and TOD. a Site plan (source kcdot/planningandpolicy/regionalplanning/transitorienteddevelopment/projects/redmond. aspx), b before the project, c after the project million transit center was designed and constructed by Metro, with $6 million from Sound Transit and the remainder from a federal grant. The transit center was constructed on county property and city street right-of-way. Metro designed, constructed, and funded the new garage, while private developer Trammell Crow Residential built the TOD project. The city reviewed and permitted all of the projects, which were designed to meet goals of Redmond s Downtown Master Plan. The Transit Center officially opened in 2008, while the TOD was completed in The Redmond Downtown Transit Center is served by Metro bus lines 221, 224, 232, 248, 930 DART, 931 DART, and RapidRide B Line; and Sound Transit Express 542 and 545 lines (Fig. 2). Sound Transit doubles midday service on ST Express 545, adding extra peak period trips during times when loads are heaviest. The new transit center has six bus bays and a separate bus layover area that concentrates transit service into a central downtown location. Improvements to the preexisting bus

8 Fig. 2 Transit services at Redmond. a Buses that go through Redmond Transit Center (source redmond.gov/common/pages/userfile.aspx?fileid=160128). b Redmond Transit Center Boarding Locations (source transfer facility increased transit passenger loading capacity, expanded the bus loop north of NE 83rd Street to improve transit operations, and added bus layover capacity to the loop. Features include custom architectural transit passenger shelters and a streetscape design that complements the existing City of Redmond Skate Park. The new transit center improves safety by providing continuous sidewalks on both sides of NE 83rd Street. Other improvements include more visible pedestrian crossings, better site distances for buses using the turnaround, and fewer vehicle/bus/pedestrian conflicts due to removal of the middle park-and-ride driveway. The addition of off-street layover space and the transit turnaround significantly improves transit efficiency. These two elements allow King County Metro Transit to invest service hours in carrying passengers instead of deadheading empty buses to satellite layover locations. Redmond TOD (called Veloce Building) is a 322-unit multifamily mixed use project that is the focal point of the transit oriented core of the city. Twenty percent of the units are affordable at 80 % of the area s median income. The podium style building has street level retail and two levels of parking below the 3 5 story apartment buildings. The project caters
9 Table 2 Development summary of Redmond TOD project Land uses Description Unit Occupancy (%) a Commercial Ground floor 11,740 square feet (sq. ft.) 56.8 Residential (called Veloce Building) 5 stories above commercial 322 units (37 studio units, 173 one bedroom units, and 112 two bedroom units) Parking Description Unit Occupancy (%) b 96.9 Transit parking-andride Veloce development parking 3-level parking structure 383 stalls level underground parking 415 stalls (66 stalls for retail customers and employees; 379 stalls for residents) 69.6 a On May 28, 2015 b The peak occupancy at May 28, 2015 to young professionals, who desire urban living, as well as to commuters. Light rail will eventually run next to the building, making it the hub of downtown Redmond. This project won the City of Redmond s 2012 Outstanding Design Award in recognition of its exceptional architectural contribution to the City. The multifamily units were almost fully leased at the time this study was conducted (Table 2). More than half of the retail space was leased to a restaurant, an animal hospital, and a financial services office. The two-level parking garage/structure has 415 stalls located below the residential component of the project. The parking garage includes 379 stalls for building residents, and 36 public parking stalls, with 3 signed for new residents, 3 for guests, 4 for carpools, and 26 for retail customers and employees. The residential parking is leased at $90/month for the reserved parking in the lower level, and $80/month for access to non-reserved/resident shared parking in the upper level. Retail, guest, and carpool parking are separated from the residential parking (outside the gates), and available at no charge. Street parking with short-term parking capacity for up to eight vehicles in front (west frontage only) is free, but limited to 2-h, from 9:00 am to 5:00 pm, Monday to Friday, except holidays, as posted. In addition, a 40 0 short-term loading zone is provided at the curb on the west frontage, immediately in front of the main pedestrian entrance to the building. Additional parking is provided for commuters; the Redmond Park-and-Ride Garage is a three-story structure with 383 free parking stalls and 12 Bike Lockers (Fig. 3). Data collection The multimodal transportation planning firm of Nelson\Nygaard developed a data collection plan and protocols, and managed data collection in the field and subsequent data entry for three types of travel data: (1) a full count of all persons entering and exiting the Veloce Building, (2) a brief intercept survey of a sample of individuals entering and exiting the building, and (3) parking inventory and occupancy surveys of all off-street parking accessory to the commercial and residential uses of the Veloce building, and the colocated, but separate off-street parking facility owned and operated by King County Metro Transit for all day use by transit riders.
10
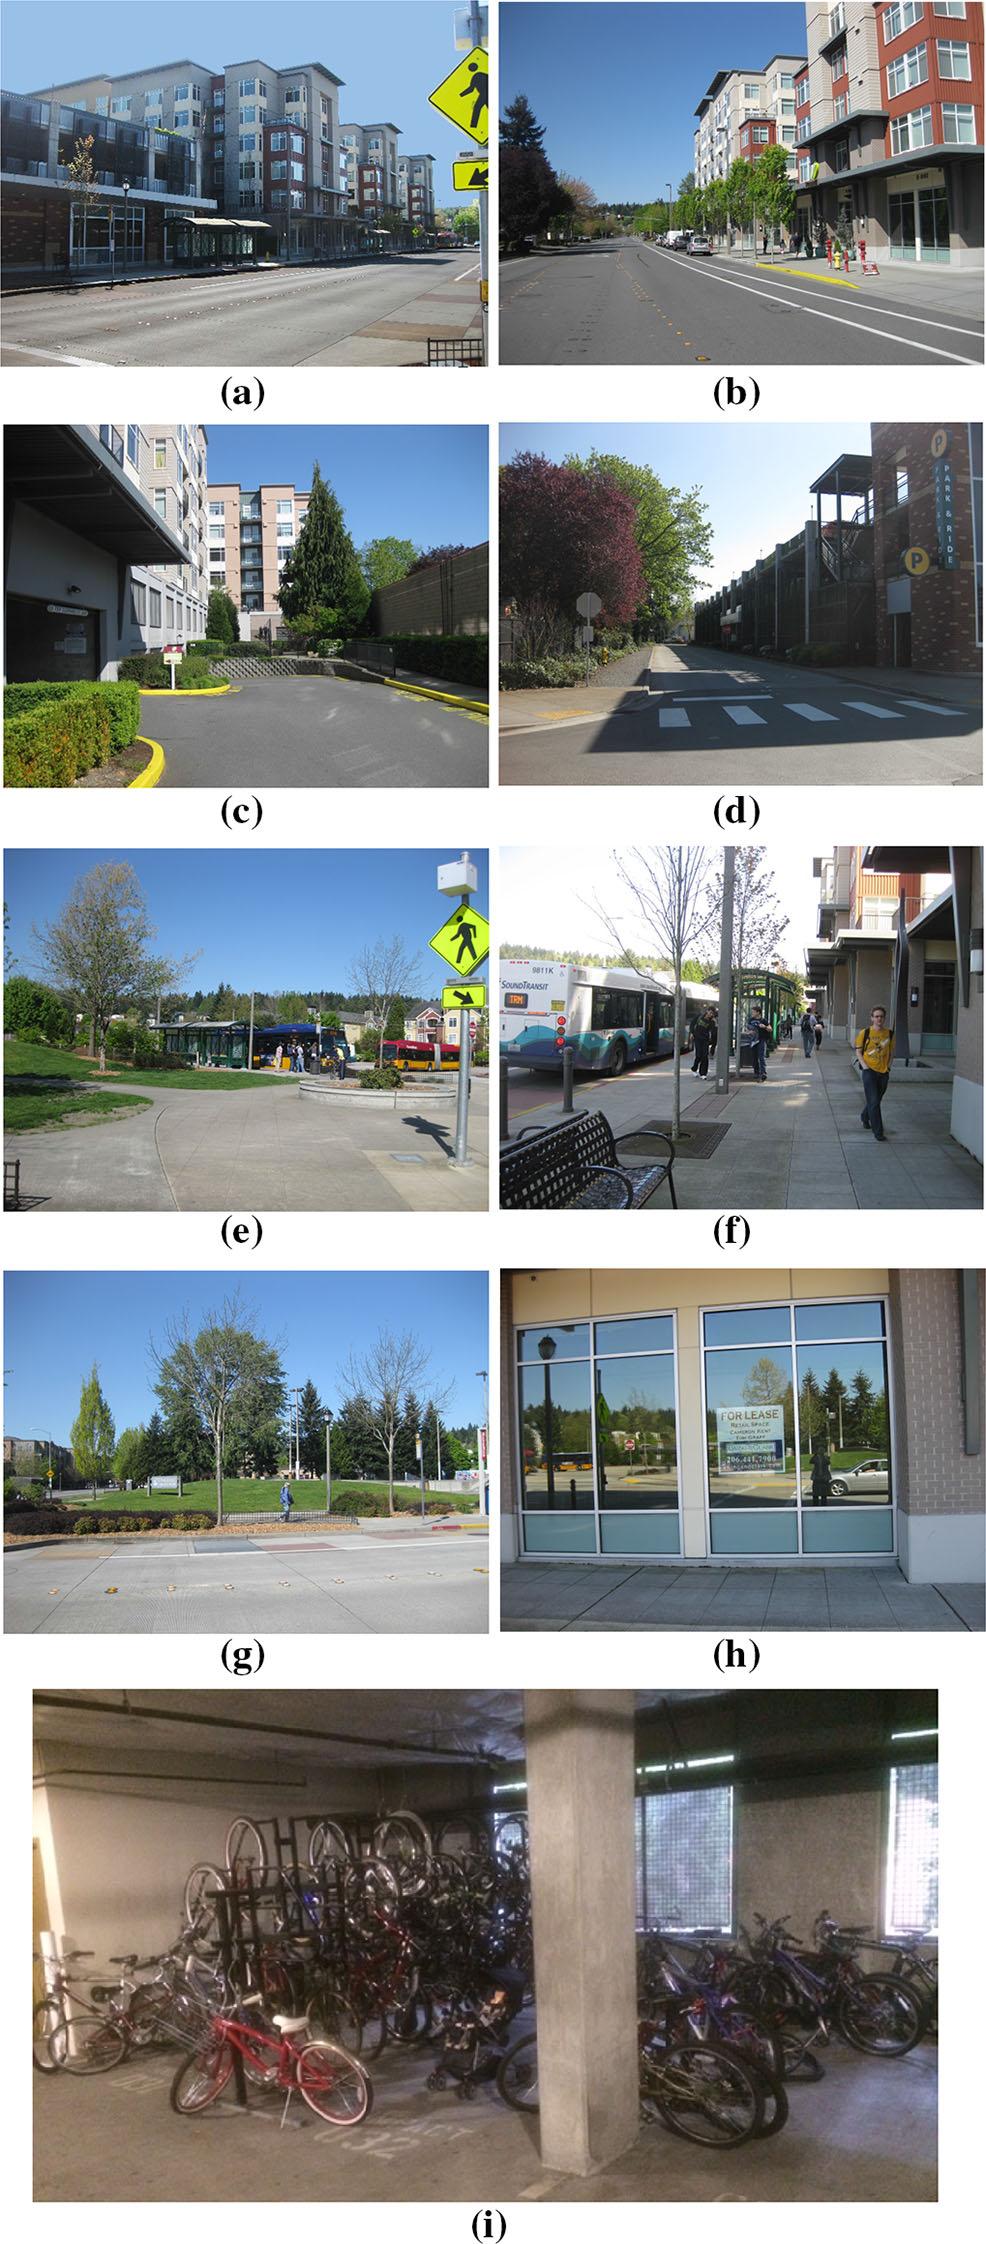
11 b Fig. 3 Redmond TOD. a Apartment building and park-and-ride garage. b Apartment building with ground floor retail. c Apartment building with underground parking. d Park-and-ride garage. e Redmond Transit Center. f Transit users. g Redmond edge skate park. h Unleased space. i Spillover bike parking at the apartment garage The intent of this approach was to develop an accurate measure of total trip generation associated with the commercial and residential space at the site, as well as a complementary sample of travel survey and parking utilization data that could be weighted by hour to provide a picture of the mode of travel, origin/destination, parking location if applicable and purpose for all trips to and from the building throughout the course of the day. All survey and trip count data were recorded on location in Redmond TOD, between 7:30 am and 9:00 pm on Tuesday, May 28th, Parking utilization was surveyed at each facility approximately every 2 h, during this same period. In addition, to determine parking occupancy during the anticipated period of peak utilization associated with the predominant residential use, an overnight count of parking occupancy was conducted at both the Veloce Building garage, and the Redmond Transit Center Park-and-Ride lot, from 1:00 to 2:00 am on Tuesday, June 2, For the purpose of counting person trips generated and recording travel patterns, separate teams of surveyors were employed to (a) count people entering/exiting at each building entrance, and (b) conduct intercept surveys (most intercept surveys were completed by undergraduate and graduate students at the University of Washington Colleges of Environmental Design or Engineering). All parking inventory and occupancy counts were conducted by Nelson\Nygaard planning staff, who also supervised survey workers at building entrances. Throughout the survey period, four people were employed to conduct trip counts. These surveyors were stationed on the public sidewalk in fixed positions where they could easily and continually observe all primary entrances to the building. Counters on the north and west sides, and the northeast corner of the building tallied the number of people entering and exiting each door by hour. The counter on the southwest corner recorded pedestrians entering/exiting the lone south door, in addition to people entering/exiting the Veloce parking facility by bicycle, or motor vehicle noting vehicle occupancy when visible. A separate team of surveyors four all day, with a fifth added during peak periods (7:30 9:30 am, and 4:30 7:30 pm) were employed to intercept and survey people entering and exiting the building. 1 These surveyors were initially stationed to the north, west, northeast and southwest of the building, covering all primary pedestrian entrances to the Veloce building, but were instructed to leave their stations, as necessary to intercept and attempt to survey individuals seen moving toward an entrance, or away from a building exit. As a first step, surveyors noted whether the subject was observed coming or going to/from the building, and the type and location of entrance/exit used, and recorded the time of intercept by checking a box on the data collection form associated with one of four 15-min periods per hour. 1 Note that for up to 4 h 7:30 to 9:30 am, and 6:00 to 8:00 pm a single surveyor positioned at the southwest corner of the building was tasked with both counting and intercept surveying of people entering and exiting the Veloce Building. This surveyor was responsible for observing people entering/exiting the little used South entrance, as well as counting and surveying people on the driveway to/from the parking garage.
12 People leaving the building were asked: (1) How do you plan to get to your next destination? (e.g. by what mode of travel?), and (2) What is the purpose of your trip? (e.g. Going home, Going to work, Shopping, or other ). People arriving at the building were asked: (1) How did you get here? (e.g. by what mode of travel?), and (2) What is the purpose of your trip? (e.g. I live here/coming home, coming to work, shopping, or other ). Individuals who indicated that they had arrived, or would be leaving by automobile were also asked where they parked their vehicle (e.g. on-street, in the [Veloce Building] garage, or at an other location/facility). Surveyors counted and attempted to intercept only those individuals observed walking to or from an entrance to the Veloce building (or, in observation of the garage entrance, only those drivers and passengers in vehicles entering/exiting the garage driveway to/from the public street). Individuals waiting for the bus, or walking between the bus stops and other trip origins/destinations, including the Redmond Transit Center Park-and-Ride Lot, were not counted or surveyed. The intercept survey received 428 respondents. Mode choices and trip generation Mode choices In the intercept survey, we had one surveyor at each entrance to the development to ask people questions. We received 428 valid responses out of 437 respondents. One question in the survey was which transportation mode was used to get to this development. The mode shares from the intercept survey are presented in Table 3. We then applied these mode Table 3 Mode shares in Redmond TOD Intercept survey Entrance Count Mode share (%) Walk Bike Transit Auto Other Parking garage Residential north Residential west Commercial (west) Trip generation counts Entrance Count Count for modes Walk Bike Transit Auto Other Parking garage Residential south Residential north Residential west Commercial (west) Parking garage street exit Final mode share % 1.67 % % % 1.54 %
13 shares to the total trip generation counts by entrance to compute the final weighted mode shares. There is no sample for entrances of Residential South and Parking Garage Street Exit in the intercept survey. We used the mode shares from the entrances that were within the same building structures. The average mode shares of Residential North and West were applied to Residential South and the mode shares of Parking Garage were applied to Parking Garage Street Exit. The final mode shares for Redmond TOD are 19 % walk, 2 % bike, 13 % transit, and 65 % auto (Table 3). According to the 2014 Puget Sound regional household travel survey, the regional mode shares are 11 % walk, 1 % bike, 4 % transit, and 82 % auto (PSRC 2015). Comparing with the regional mode shares, Redmond TOD has a significant mode shift, a shift from auto to walk and transit, even bike. Redmond TOD has 1.7 times more trips made by walking and 3 times more trips made by transit than the regional average. Trip generation Our actual trip generation counts from the survey did not distinguish residential trips and commercial trips. To compare the actual trip generation with ITE s benchmarks, we will combine all estimated trips for different uses into a total that can be compared to ITE. There were 1981 person trips and 661 vehicle trips observed for the whole day of the survey. Those trips were generated by the occupied residential units, which are 312 units (322*0.969), and leased commercial spaces, which are 1905 sq. ft. for an office, 2682 sq. ft. for a restaurant, and 2081 sq. ft. for an animal hospital. For the trip generation rate of the residential building at Redmond TOD, we used the value for 223 Mid-Rise Apartment in ITE Trip Generation Manual, which is defined as apartments (rental dwelling units) in rental buildings that have between three and ten levels (floors). The ITE manual reports a trip generation rate for the peak hour but does not report a daily trip generation rate for mid-rise apartment. However, the ITE manual reports the daily trip generation rate for all apartments ( 220 Apartments ). We used this rate to compute the daily trip generation rate for mid-rise apartments. Here was the process: (1) the average daily vehicle trip generation rate for 220 Apartments is 6.65 per dwelling unit on a weekday, 0.55 per dwelling unit at the AM peak hour on a weekday, and 0.67 per dwelling unit at the PM peak hour on a weekday; (2) the average vehicle trip generation rate for 223 Mid-Rise Apartment is 0.35 per dwelling unit at the AM peak hour on a weekday and 0.44 per dwelling unit at the PM peak hour on a weekday; (3) the average daily vehicle trip generation rate for 223 Mid-Rise Apartment therefore equals 6.65*(0.35? 0.44)/(0.55? 0.67), which is 4.31 per dwelling unit. For the trip generation rate of the office at the Redmond TOD, we used 715 Single Tenant Office Building in the ITE Trip Generation Manual. The average daily vehicle trip generation rate for this type of land use is per 1000 sq. ft. gross area (GFA) on a weekday. For the trip generation rate of the restaurant at the Redmond TOD, we used 932 High- Turnover (Sit-Down Restaurant) in the ITE Trip Generation Manual. The average daily vehicle trip generation rate for this type of land use is per 1000 sq. ft. GFA on a weekday. For the trip generation rate of the animal hospital at Redmond TOD, the ITE manual has a category 640 Animal Hospital/Veterinary Clinic but only reports the average vehicle trip generation rate for the peak hour on a weekday, which is 4.08 per 1000 sq. ft. GFA.
14 Table 4 The comparison of daily vehicle trip generation between ITE guideline and Redmond TOD Trip generation rate Total units Total daily trips ITE guideline Mid-rise apartment Single tenant office building High-turnover (sit-down) restaurant 640 Animal hospital/veterinary clinic Redmond TOD 661 Instead, we used the daily average vehicle trip generation rate on a weekday for 630 Clinic, which is per 1000 sq. ft. GFA. Based on the ITE s trip generation rates, the Redmond TOD would be expected to generate 1793 daily vehicle trips (Table 4). The actual vehicle trips we observed on the survey day was 661, which is only 37.3 % of the ITE s expected value. This is consistent with the findings from District Department of (DDOT) recent pilot at 16 locations in Washington, D.C. (Weinberger et al. 2015). Parking generation Parking supply and demand recorded for the Redmond TOD project were compared to the number of parking stalls as well as occupancy rates from the 2010 ITE Parking Generation manual. Residential For the residential component in the ITE Parking Generation manual, 222 High-Rise Apartment (rental dwelling units) are defined as units located in rental buildings that have five or more levels (floors) and most likely have one or more elevators. This is the best match for the 5-story multifamily residential uses at the Redmond TOD. The average parking supply ratio reported by ITE is 2.0 parking spaces per dwelling unit at central city, not downtown, sites. As shown in Table 5, the actual parking supply for the residential units at the Redmond TOD is 1.19 parking spaces per unit or 379 total, which is much lower than ITE s guideline (2.0 spaces per unit or 644 total). The ITE average peak period parking demand from seven study sites is 1.37 vehicles per dwelling unit with standard deviation of 0.15, a range of , an 85th percentile value of 1.52, and a 33rd percentile value of Besides the average rate, the ITE manual also provides the best-fitting regression line for estimating total parked vehicles as a function of the total number of dwelling units: P ¼ 1:04x þ 130 where P is the parked vehicles and x is the dwelling units On the surveyed day, the actual peak parking demand of the residential units at the Redmond TOD was 278 at 1:00 am. That is much lower than both the ITE average of 427 (1.37*322*0.969, occupied units only) and the ITE regression estimate of 454
15 Table 5 The comparison of parking supply and demand between Redmond TOD residential and ITE guideline Residential Supply Peak period demand Parking spaces per unit Total parking spaces Vehicle per unit Total parked vehicles ITE guideline: 222 high-rise apartment Redmond TOD residential Commercial (occupied space only) Supply Peak period demand Parking spaces per 1000 sq. ft. GFA Total parking spaces Vehicle per 1000 sq. ft. GFA Total parked vehicles ITE guideline high-turnover (sit-down) restaurant 701 office building animal hospital/veterinary clinic Redmond TOD commercial (1.04*322*0.969?130, occupied units only). The actual residential peak period parking demand at Redmond TOD is only 65 % (100*278/427) of the ITE s average demand using the average parking generation rate and only 61 % (100*278/454) of ITE s average demand using the regression equation. Commercial There is a total of 11,470 square feet of leasable space for commercial uses at the Redmond TOD, and 26 parking spaces for all commercial uses (not including up to eight on-street parking spaces and an on-street loading zone with capacity for two vehicles). The leased space is 6668 square feet for a family restaurant, an animal hospital, and a retail financial services establishment. We do not have the parking supply and demand data separately for each of these three uses, so we will treat them as a whole. In the ITE Parking Generation manual, the 932 family restaurant is defined as an abbreviated version of high-turnover (sit-down) restaurant without bar or lounge facilities. The average parking supply ratio at family restaurants is 14.3 spaces per 1000 sq. ft. GFA. The average peak period parking demand is 10.6 vehicles per 1000 sq. ft. GFA during the weekday at a suburban location with a standard deviation of 5.42, a range of , an 85th percentile value of 16.3, and a 33rd percentile value of 7.4. The ITE s guideline of average parking supply ratio for office buildings is 4.0 spaces per 1000 sq. ft. GFA. The average peak period parking demand is 2.84 vehicles per 1000 sq. ft. GFA during the weekday at a suburban location with a standard deviation of 0.73, a range of , an 85th percentile value of 3.45, and a 33rd percentile value of 2.56.
16 The average parking supply ratio that ITE estimates for animal hospital/veterinary clinic is 2.3 spaces per 1000 sq. ft. GFA. The peak period parking demand ratio is 1.6 vehicles per 1000 sq. ft. GFA based on a 2-h observation. According to the ITE guideline, the parking supply for these three leased commercial spaces would be 51 spaces ([14.3*2682? 4*1905? 2.3*2081]/1000). The actual parking supply for commercial uses at the Redmond TOD is 26 total spaces for all 11,740 sq. ft. of commercial space. We cannot know precisely the actual parking supply just for the leased commercial space, but it would be about 57 % of the total spaces based on the percentage of total space currently leased. That is to say, based on the current leases, about 14 spaces might be associated with the currently leased commercial space. This is only about 27 % of the ITE guideline (as shown in Table 5). According to the ITE s guideline, the average total peak period parking demand for these three commercial uses would be 37 spaces ([10.6*2682? 2.84*1905? 1.6*2081]/ 1000), only for leased spaces). The actual peak period parking demand of the commercial uses at Redmond TOD was 12 in the evening on the survey day, which is less than onethird of the ITE s guideline. Parking demands for different land uses The parking demands for different land uses during the survey day are shown in Fig. 4. The peak period of parking demand is different for the different land uses. For the transit Park-and-Ride, demand was very high at midday. More than 90 % of parking spaces were occupied from 8 am in the morning to 3 pm in the afternoon. The demands dropped very quickly after that and down to less than 20 % occupancy after 8 pm at night. Fig. 4 Parking space occupancy rate for different uses at Redmond TOD
17 The residential peak parking demands were at night from 10 pm to 8 am. The demands started to decrease during the day and were at their lowest between 12 pm to 4 pm, and then started to increase to after 4 pm. The commercial parking demands were pretty low during daytime and increased after 6 pm in the evening. The peak commercial parking demand came at 10 pm in the evening. The peak period of transit parking was daytime, while the peak periods of commercial and residential were evening and night. Given this fact, there is a real opportunity for sharing parking spaces among these different uses, something which is not realized at present. Conclusion Redmond TOD case study Redmond TOD is not large (essentially one large building) and therefore, there probably are not many trips captured internally. It is really the parking supply and pricing as well as the proximity to transit that are producing the travel behavior benefits. Also producing benefits is the placement of this project in an urban/suburban context where neighboring uses can exchange trips with on-site uses. Based on site visits already conducted, and a review of American Community Survey data, we expect that the vehicle trip and parking reduction may be even greater at some of the other nine sites in Table 1 than at the Redmond TOD. This is the case because some of the sites are more urban/less suburban than the Redmond TOD site, are more exemplary of TOD than the Redmond TOD site (denser, more mixed, and more pedestrian-friendly), and are all rail-served, unlike the Redmond TOD, which is bus served. Still the vehicle trip and parking reduction at the Redmond TOD site is impressive: Mode choices Redmond TOD has 1.7 times more trips made by walking and 3 times more trips made by transit than the regional average. Trip and parking generation Redmond TOD only generates about 37 % of the vehicle trips estimated by ITE Trip Generation Manual. The actual residential parking demand at the Redmond TOD is only 65 % of ITE s average. The actual commercial parking demand at the Redmond TOD is only 27 % of the ITE average. This is due to mode shifts away from the automobile, and maybe to some degree to internal capture of trips within the mixed use site. Shared parking potential The peak period of transit parking is daytime, while the peak periods of commercial and residential were evening and night. There is a real opportunity for sharing parking spaces among these different uses, something which is not realized at present. Barriers to TOD There are many barriers to implement TOD and maximize TOD s benefits. For instance, one of the big barriers for infill TOD is the one-to-one parking replacement policy oneto-one replacement of any surface parking removed for the purpose of development on transit properties (Cervero et al. 2004; Willson and Menotti 2007). For the parking requirement, TOD has to meet the same minimum parking requirements as the conventional single-use development. For sharing parking between private residential parking and public transit parking, there are issues of ownership, security, etc.
18 To remove those barriers requires cooperation of cities, transit agencies, and developers. For instance, cooperation may be required to create a special zoning district or change existing zoning provisions for TOD, adopt reduced parking requirements to reflect transit shares and lower automobile ownership in a TOD, encourage or require unbundling of parking spaces for residential and commercial uses. Other barriers are the ITE Trip and Parking Generation Manuals themselves. There should be stronger statements, in the manuals, warning against the application of their generation rates to TODs. Perhaps, in time, there could be special TOD land use categories for trip and parking generation that reflect the lower rates found in this study. The subsequent case studies of the other nine sites in Table 1 could begin to build a database for such additions to the manuals. Benefits of TOD A national survey suggests that the principal aim of TODs for transit agencies is to boost ridership and revenue income (Cervero et al. 2004). This study shows the impact of TOD on residents mode choices, which confirms the most direct benefit of TOD on ridership. Ridership can increase through economic and population growth around transit stations. Encouraging mixed use developments around transit stations generates internal trips and creates an opportunity for shared parking spaces among different uses. More important for urban planners, TOD provides an opportunity for a transit station being a desirable place instead of just a transportation node. This study clearly shows some benefits of TOD. For a long term and broad perspective, TOD has economic, environmental, and social benefits. By funding public investments in infrastructure, TOD can attract private investments. By concentrating development and increasing the share of non-automobile trips, TOD can be an effective tool of dealing with urban sprawl, traffic congestion, and air pollution. Acknowledgments This study was funded with a grant from the National Institute for and Communities (NITC), a federally-funded University Center. References Arrington, G.B., Cervero, R.: Effects of TOD on Housing, Parking, and Travel (TCRP Report 128). Research Board, Washington, DC (2008) Calthorpe, P.: The next American metropolis: ecology, community, and the American dream. Princeton Architectural Press, New York (1993) Cervero, R.: Transit-based housing in California: evidence on ridership impacts. Transp. Policy 1(3), (1994) Cervero, R., Adkins, A., Sullivan, C.: Are suburban TODs over-parked? J. Public Transp. 13(2), 3 (2010) Cervero, R., Arrington, G.B.: Vehicle trip reduction impacts of transit-oriented housing. J. Public Transp. 11(3), 1 (2008) Cervero, R., Landis, J.: Twenty years of the Bay Area Rapid Transit system: land use and development impacts. Transp. Res. Part A Policy Pract. 31(4), (1997) Cervero, R., Murphy, S., Ferrell, C., Goguts, N., Tsai, Y.: Transit-oriented development in the United States: experiences, challenges, and prospects (Report No. 102). Transit Cooperative Research Program, Washington, DC (2004) Chatman, D.G.: Does TOD need the T? On the importance of factors other than rail access. J. Am. Plan. Assoc. 79(1), (2013) Edgar, S., Carr, C.R., Connors, M., Counts, D., Morrison, C., Priebe, J.: Best practices for addressing access and parking needs of nonresident users of rail and intermodal transportation stations in transit-oriented
19 developments (No. NCHRP Project 20-68A, Scan 10-02). uploads/nchrp20-68a_10-02.pdf (2013). Accessed 23 June 2015 Faghri, A., Venigalla, M.: Measuring travel behavior and transit trip generation characteristics of transitoriented developments. Transp. Res. Rec. 2397, (2013) Guo, Z.: Does residential parking supply affect household car ownership? The case of New York City. J. Transp. Geogr. 26, (2013) Handy, S., Shafizadeh, K., Schneider, R.: California smart-growth trip generation rates study. University of California, Davis for the California Department of. growth_trip_generation_rates_handy.pdf (2013). Accessed 23 June 2015 Institute of Engineers (ITE): Parking Generation, 4th edn. ITE, Washington, DC (2010) Institute of Engineers (ITE): Trip Generation Handbook, 2nd edn. ITE, Washington, DC (2004) Institute of Engineers (ITE): Trip Generation Manual, 9th edn. ITE, Washington, DC (2012) Knepper, V.: Parking structure. MTC s VPP Parking Project. (2015). Accessed 1 Mar 2016 Lund, H.M., Cervero, R., Wilson, R.W.: Travel Characteristics of Transit-Oriented Development in California. California Department of, Sacramento, CA (2004) Lund, H.M., Willson, R., Cervero, R.: A re-evaluation of travel behavior in California TODs. J. Archit. Plan. Res. 23(3), (2006) Martin, P., Hurrell, W.: Station parking and transit-oriented design: transit perspective. Transp. Res. Rec. 2276, (2012) Millard-Ball, A.: Phantom trips: overestimating the traffic impacts of new development. J. Transp. Land Use 8(1), (2015) Puget Sound Regional Council (PSRC): PSRC S 2014 Regional travel study: key comparisons of 1999, 2006, and 2014 travel survey findings. RegionalTravelSurveysComparison.pdf (2015). Accessed 23 June 2015 Reconnecting America: Briefing Report Number 3: Case studies for transit oriented development. Prepared for Local Initiatives Support Corporation Phoenix. documents/phoenix_3_tod.pdf (2009). Accessed 23 June 2015 Rowe, D., Bae, C.H., Shen, Q.: Evaluating the impact of transit service on parking demand and requirements. Transp. Res. Rec. 2245, (2011) San Francisco Bay Area Metropolitan Commission (SFBAMTC): Characteristics of rail and ferry station area residents in San Francisco Bay Area. stars/executive_summary_bats2000_station_area_residents_study.pdf (2006). Accessed 23 June 2015 Serafin, E., Swierk, R., Smith, Y., Meek, J.: A parking utilization survey of transit-oriented development residential properties in Santa Clara County. VTA-TODParkingSurveyReport-VolI.pdf (2010). Accessed 1 Mar 2016 Shoup, D.C.: Truth in transportation planning. University of California Center. escholarship.org/uc/item/999346pn#page-1 (2003). Accessed 24 Feb 2016 Tian, G., Ewing, R., White, A., Hamidi, S., Walters, J., Goates, J.P., Joyce, A.: Traffic generated by mixeduse developments 13-region study using consistent built environment measures. Transp. Res. Rec. 2500, (2015) Weinberger, R.: Death by a thousand curb-cuts: evidence on the effect of minimum parking requirements on the choice to drive. Transp. Policy 20, (2012) Weinberger, R., Dock, S., Cohen, L., Rogers, J., Henson, J.: Predicting travel impacts of new development in America s major cities: testing alternative trip generation models. In: Research Board 94th Annual Meeting (No ) (2015) Weinberger, R., Seaman, M., Johnson, C.: Residential off-street parking impacts on car ownership, vehicle miles traveled, and related carbon emissions: New York City case study. Transp. Res. Rec. 2118, (2009) Willson, R.: Parking policy for transit-oriented development: lessons for cities, transit agencies, and developers. J. Public Transp. 8(5), 5 (2005) Willson, R., Menotti, V.: Commuter parking versus transit-oriented development: evaluation methodology. Transp. Res. Rec. 2021, (2007) Zamir, K., Nasri, A., Baghaei, B., Mahapatra, S., Zhang, L.: Effects of transit-oriented development on trip generation, distribution, and mode share in Washington, DC, and Baltimore, Maryland. Transp. Res. Rec. 2413, (2014)
Understanding Transit-Oriented Development (TOD) and Transit-Adjacent Development (TAD)
 and Transit-Adjacent Development (TAD)") Understanding Transit-Oriented Development (TOD) and Transit-Adjacent Development (TAD) Reid Ewing, Guang Tian, and Keunhyun Park Metropolitan Research Center Department of City and Metropolitan Planning
Understanding Transit-Oriented Development (TOD) and Transit-Adjacent Development (TAD) Reid Ewing, Guang Tian, and Keunhyun Park Metropolitan Research Center Department of City and Metropolitan Planning
DON T TRIP OVER PARKING. Karen Hancock, City of Aurora Moderator Reid Ewing University of Utah Anthony Avery, City of Aurora
 DON T TRIP OVER PARKING Karen Hancock, City of Aurora Moderator Reid Ewing University of Utah Anthony Avery, City of Aurora Parking Fines c. 700 BC King Sennarcherib (705-681 BC) Washington DC c.1890 Omaha
Trip and Parking Generation at Transit-Oriented Developments
 Portland State University PDXScholar TREC Final Reports Transportation Research and Education Center (TREC) 1-2017 Trip and Parking Generation at Transit-Oriented Developments Reid Ewing University of
Trip and Parking Generation at Transit- Oriented Developments
 1 2 3 4 5 6 7 8 9 10 11 12 13 14 15 16 17 18 19 20 21 22 23 24 Trip and Parking Generation at Transit- Oriented Developments Reid Ewing College of Architecture+Planning, 220 AAC, University of Utah, 375
Trip Generation and Parking Study New Californian Apartments, Berkeley
 Trip Generation and Parking Study New Californian Apartments, Berkeley Institute of Transportation Engineers University of California, Berkeley Student Chapter Spring 2012 Background The ITE Student Chapter
Executive summary. iii
 Table of Contents Executive summary... iii Introduction... 1 An in-depth look at five TODs... 2 Counting trip generation and parking rates... 3 Key findings... 4 Lessons from the five TODs... 6 Conclusion...
IV. ENVIRONMENTAL IMPACT ANALYSIS K.2. PARKING
 IV. ENVIRONMENTAL IMPACT ANALYSIS K.2. PARKING ENVIRONMENTAL SETTING The following analysis summarizes the findings and conclusions of the Traffic Analysis (Traffic Study), prepared by The Mobility Group,
APPENDIX VMT Evaluation
 APPENDIX 2.7-2 VMT Evaluation MEMORANDUM To: From: Mr. Jonathan Frankel New Urban West, Incorporated Chris Mendiara LLG, Engineers Date: May 19, 2017 LLG Ref: 3-16-2614 Subject: Villages VMT Evaluation
UTA Transportation Equity Study and Staff Analysis. Board Workshop January 6, 2018
 UTA Transportation Equity Study and Staff Analysis Board Workshop January 6, 2018 1 Executive Summary UTA ranks DART 6 th out of top 20 Transit Agencies in the country for ridership. UTA Study confirms
Landscape and Urban Planning
 Landscape and Urban Planning 160 (2017) 69 78 Contents lists available at ScienceDirect Landscape and Urban Planning journal homepage: www.elsevier.com/locate/landurbplan Research Paper Trip and parking
Trip Generation Study: Provo Assisted Living Facility Land Use Code: 254
 Trip Generation Study: Provo Assisted Living Facility Land Use Code: 254 Introduction The Brigham Young University Institute of Transportation Engineers (BYU ITE) student chapter completed a trip generation
appendix 4: Parking Management Study, Phase II
 appendix 4: Parking Management Study, Phase II A4-1 A4-2 Eastlake Parking Management Study Final Phase 2 Report Future Parking Demand & Supply January 6, 2017 Submitted by Denver Corp Center III 7900 E.
Address Land Use Approximate GSF
 M E M O R A N D U M To: Kara Brewton, From: Nelson\Nygaard Date: March 26, 2014 Subject: Brookline Place Shared Parking Analysis- Final Memo This memorandum presents a comparative analysis of expected
Parking Management Element
 Parking Management Element The State Transportation Planning Rule, adopted in 1991, requires that the Metropolitan Planning Organization (MPO) area implement, through its member jurisdictions, a parking
Transit and Job Growth: Lessons for SB 375. Jed Kolko Public Policy Institute of California
 Transit and Job Growth: Lessons for SB 375 Jed Kolko Public Policy Institute of California Outline Approaches to reducing VMT The land use transportation connection California s experience with transit-oriented
This letter provides SPUR s comments on the Draft Supplemental Environmental Impact Statement/ Subsequent Environmental Impact Report.
 Tom Fitzwater, Environmental Planning Manager VTA Environmental Programs & Resources Management 3331 North First Street, Building B-2 San Jose, CA 95134 March 6, 2017 Submitted Electronically Re: VTA s
TRANSPORTATION REVIEW
 TRANSPORTATION REVIEW - PROPOSED MIX OF LAND USES IS CONSISTENT WITH THE CITY S UNDER THE GRANVILLE BRIDGE POLICIES THAT AIM TO MEET NEIGHBOURING RESIDENTS SHOPPING NEEDS AND REDUCE RELIANCE ON AUTOMOBILE
Trip Generation & Parking Occupancy Data Collection: Grocery Stores Student Chapter of Institute of Transportation Engineers at UCLA Spring 2014
 Trip Generation & Parking Occupancy Data Collection: Grocery Stores Student Chapter of Institute of Transportation Engineers at UCLA Spring 2014 Page 1 Introduction The UCLA Institute of Transportation
Office of Transportation Bureau of Traffic Management Downtown Parking Meter District Rate Report
 Office of Transportation Bureau of Traffic Management 1997 Downtown Parking Meter District Rate Report Introduction The City operates approximately 5,600 parking meters in the core area of downtown. 1
M E M O R A N D U M INTRODUCTION. POTENTIAL TDM STRATEGIES Marketing & Management. Residents & Employees. Exhibit 6
 Exhibit 6 M E M O R A N D U M To: From: Joe Ernst and Bryan Graves Nelson\Nygaard Date: February 6, 2015 Subject: Preliminary TDM Strategies INTRODUCTION The memorandum provides an overview of potential
Service Quality: Higher Ridership: Very Affordable: Image:
 Over the past decade, much attention has been placed on the development of Bus Rapid Transit (BRT) systems. These systems provide rail-like service, but with buses, and are typically less expensive to
The Green Dividend. Cities facilitate less driving, saving money and stimulating the local economy. Joseph Cortright, Impresa September 2007
 The Green Dividend Cities facilitate less driving, saving money and stimulating the local economy Joseph Cortright, Impresa September 2007 Does being green pay? Is conservation just noble self-sacrifice;
Smart Growth Parking Requirements Review
 Smart Growth Parking Requirements Review Parking needs for transit-oriented developments (TODs) are different than parking needs for traditional developments. Typical parking standards are set with traditional
EXECUTIVE SUMMARY. Introduction
 EXECUTIVE SUMMARY Introduction The purpose of this study is to ensure that the Village, in cooperation and coordination with the Downtown Management Corporation (DMC), is using best practices as they plan
Minimum parking requirements create more parking than is needed.
 Do Cities Have Too Much Parking? A N D R E W M. F R A S E R, M I K H A I L V. C H E S T E R, J U A N M. M AT U T E, A N D R A M P E N D YA L A Minimum parking requirements create more parking than is needed.
6/6/2018. June 7, Item #1 CITIZENS PARTICIPATION
 June 7, 2018 Item #1 CITIZENS PARTICIPATION 1 Item #2 APPROVAL OF MINUTES Item #3 TRAC GOALS, FRAMEWORK & AGENDA REVIEW 2 COMMITTEE GOALS Learn about Southern Nevada s mobility challenges, new developments
The Latest on Joint Development Policy Guidance
 Panelists The Latest on Joint Development Policy Guidance Moderator: Jonathan Davis Deputy General Manager and Chief Financial Officer Massachusetts Bay Transportation Authority James Blakesley, Attorney-Advisor,
Abstract. Executive Summary. Emily Rogers Jean Wang ORF 467 Final Report-Middlesex County
 Emily Rogers Jean Wang ORF 467 Final Report-Middlesex County Abstract The purpose of this investigation is to model the demand for an ataxi system in Middlesex County. Given transportation statistics for
PARKING OCCUPANCY IN WINDSOR CENTER
 PARKING OCCUPANCY IN WINDSOR CENTER TOWN OF WINDSOR, CONNECTICUT REPORT JUNE 2017 CONTENTS Background... 3 Other Relevant Data... 3 Parking Survey Design... 6 Parking Supply Inventory... 6 Parking Demand
Green Line Long-Term Investments
 Enhancements Short-term improvements to keep Austin moving. Investments Long-term projects to support our future. Mobility Hubs MetroRapid MetroRail MetroExpress Connectors Circulators Project Connect
Leveraging Land Use Changes through Transportation Funding
 Leveraging Land Use Changes through Transportation Funding Railvolution 2005 September 10, 2005 James Corless Senior Planner What is the MTC region? 9 7 101 26 San Francisco Bay Area counties Million people;
ARTICLE 8 OFF-STREET PARKING AND PRIVATE DRIVEWAY STANDARDS
 ARTICLE 8 OFF-STREET PARKING AND PRIVATE DRIVEWAY STANDARDS TABLE OF CONTENTS SECTION PAGE 8.1 GENERAL STANDARDS...8-2 8.2 PRIVATE DRIVEWAY PROVISIONS...8-4 8.3 OFF-STREET PARKING STANDARDS...8-5 8.4 OFF-STREET
Getting Parking Right in Emerging Mixed Use Environments
 Getting Parking Right in Emerging Mixed Use Environments Shana R. Johnson, AICP Senior Transportation Planner Foursquare ITP Makeover Montgomery 2 May 9, 2014 1 Parking today White Flint Mall Photo Source:
THE CORNERSTONE APARTMENTS TRAFFIC IMPACT STUDY R&M PROJECT NO
 THE CORNERSTONE APARTMENTS SITUATED AT N/E/C OF STAUDERMAN AVENUE AND FOREST AVENUE VILLAGE OF LYNBROOK NASSAU COUNTY, NEW YORK TRAFFIC IMPACT STUDY R&M PROJECT NO. 2018-089 September 2018 50 Elm Street,
2 VALUE PROPOSITION VALUE PROPOSITION DEVELOPMENT
 2 VALUE PROPOSITION The purpose of the Value Proposition is to define a number of metrics or interesting facts that clearly demonstrate the value of the existing Xpress system to external audiences including
Key Findings and Recommendations Introduction and Overview Task 1 Existing Conditions Analysis Task 2 Parking Demand Analysis...
 Table of Contents Introduction and Overview... 1 Key Findings and Recommendations... 1 Task 1 Existing Conditions Analysis... 1 Task 2 Parking Demand Analysis... 1 Task 3 Facilities Cost Analysis... 2
Speaker Information Tweet about this presentation #TransitGIS
 Making the Case for Transit: the Transit Competitiveness Index Title William E. Walter, GISP Speaker Information Tweet about this presentation #TransitGIS Understanding Conditions in Each Travel Market
Bi-County Transitway/ Bethesda Station Access Demand Analysis
 Bi-County Transitway/ Bethesda Station Access Demand Analysis Prepared for: Washington Metropolitan Area Transit Authority Office of Planning and Project Development May 2005 Prepared by: in conjunction
CEDAR AVENUE TRANSITWAY Implementation Plan Update
 CEDAR AVENUE TRANSITWAY Implementation Plan Update EECUTIVE SUMMARY DECEMBER 2015 Executive Summary In 2013, the Twin Cities metropolitan area s first bus rapid transit (BRT) line, the METRO Red Line,
Downtown Lee s Summit Parking Study
 Downtown Lee s Summit Parking Study As part of the Downtown Lee s Summit Master Plan, a downtown parking and traffic study was completed by TranSystems Corporation in November 2003. The parking analysis
Changing Behavior and Achieving Mode Shi2 Goals
 Changing Behavior and Achieving Mode Shi2 Goals Tim Papandreou - Director Strategic Planning & Policy, San Francisco Municipal TransporaBon Agency Michael KeaBng - Founder & CEO, Scoot Networks Mike Mikos
San Rafael Civic Center Station Area Plan May 2012 DRAFT FOR PUBLIC REVIEW
 CHAPTER 4. PARKING Parking has been identified as a key concern among neighbors and employers in the area, both in terms of increased demand from potential new development and from SMART passengers that
Transportation Demand Management Element
 Transportation Demand Management Element Over the years, our reliance on the private automobile as our primary mode of transportation has grown substantially. Our dependence on the automobile is evidenced
SUPPORTING TOD IN METRO CHICAGO
 www.rtachicago.org SUPPORTING TOD IN METRO CHICAGO Tuesdays at APA November 18, 2014 OVERVIEW OF RTA 2 11/18/2014 Tuesdays at APA: Supporting TOD in Metro Chicago RTA Region 8.5 million people 3,700 square
We Want Your Input! Review the design alternatives and tell us what s important to you in the design of these areas of the approved BRT Network:
 We Want Your Input! Review the design alternatives and tell us what s important to you in the design of these areas of the approved BRT Network: Richmond North of Oxford Street Richmond Row Dundas Street
Costco Gasoline Fuel Station Transportation Characteristics
 Exhibit A MEMORANDUM Date: May 23, 2013 Project #: I-10 To: Jennifer Murillo, Costco Wholesale Terry Odle, Mulvanny G2 Architecture From: Sonia Hennum, PTOE Project: Subject: Signal Hill Costco Gasoline
Parking & TOD around BART Stations. Jessica ter Schure November 1, 2009 Rail~Volution 2009 Boston, Massachusetts
 Parking & TOD around BART Stations Jessica ter Schure November 1, 2009 Rail~Volution 2009 Boston, Massachusetts Outline Background Replacement Parking Policy South Hayward BART MacArthur BART Parking Privatization
FREQUENTLY ASKED QUESTIONS
 FREQUENTLY ASKED QUESTIONS 2018 What is the More MARTA Atlanta program? The More MARTA Atlanta program is a collaborative partnership between MARTA and the City of Atlanta to develop and implement a program
Trip and Parking Generation Data Collection at Grocery Store with Gas Station and Auto Repair
 Trip and Parking Generation Data Collection at Grocery Store with Gas Station and Auto Repair Final Report 2011 ITE District 6 - Data Collection Project Institute of Transportation Engineers Student Chapter
2 EXISTING ROUTE STRUCTURE AND SERVICE LEVELS
 2 EXISTING ROUTE STRUCTURE AND SERVICE LEVELS In the Study Area, as in most of the Metro Transit network, there are two distinct route structures. The base service structure operates all day and the peak
6/11/2018. June 7, Item #1 CITIZENS PARTICIPATION
 June 7, 2018 Item #1 CITIZENS PARTICIPATION 1 Item #2 APPROVAL OF MINUTES Item #3 TRAC GOALS, FRAMEWORK & AGENDA REVIEW 2 COMMITTEE GOALS Learn about Southern Nevada s mobility challenges, new developments
CORE AREA SPECIFIC PLAN
 only four (A, B, D, and F) extend past Eighth Street to the north, and only Richards Boulevard leaves the Core Area to the south. This street pattern, compounded by the fact that Richards Boulevard is
Rapid Transit and Land-Use Integration a Reality
 City of Charlotte Rapid Transit and Land-Use Integration a Reality Transportation Oversight Committee Carolyn Flowers CEO Charlotte Area Transit System April 29, 2010 Charlotte Region Statistics Mecklenburg
The hidden prices of parking David King Graduate School of Architecture, Planning and Preservation Columbia University
 The hidden prices of parking David King Graduate School of Architecture, Planning and Preservation Columbia University Planning of the automobile city focuses on saving time. Planning for the accessible
WESTSIDE SUBWAY EXTENSION. Final Smart Growth Evaluation Report
 Final Smart Growth Evaluation Report August 2010 Table of Contents Table of Contents 1.0 INTRODUCTION... 1-1 1.1 4Ds... 1-2 1.2 Direct Ridership Model (DRM)... 1-2 2.0 4DS... 2-1 2.1 Inputs... 2-1 2.2
Denver Car Share Program 2017 Program Summary
 Denver Car Share Program 2017 Program Summary Prepared for: Prepared by: Project Manager: Malinda Reese, PE Apex Design Reference No. P170271, Task Order #3 January 2018 Table of Contents 1. Introduction...
Executive Summary. Draft Environmental Impact Statement/Environmental Impact Report ES-1
 Executive Summary Introduction The Eastside Transit Corridor Phase 2 Project is a vital public transit infrastructure investment that would provide a transit connection to the existing Metro Gold Line
1 Downtown LRT Connector: Draft Concept
 Downtown LRT Connector: Draft Concept Plan November 2010 We re moving forward. Get involved. On June 21, 2010, City Council approved a street-level downtown LRT route, including a connector for the future
Kenosha-Racine-Milwaukee (KRM)
") Kenosha-Racine-Milwaukee (KRM) Commuter Rail #147925 November 6, 2009 1 Guidance of KRM Commuter Rail Studies Intergovernmental Partnership Technical Steering Committee Temporary and Limited Authority
Kenosha-Racine-Milwaukee (KRM) Commuter Rail #147925 November 6, 2009 1 Guidance of KRM Commuter Rail Studies Intergovernmental Partnership Technical Steering Committee Temporary and Limited Authority
Getting Parking Right. Presented by Lisa Jacobson Rail~Volution Seattle October 2013
 Getting Parking Right Presented by Lisa Jacobson Rail~Volution Seattle October 2013 Parking Wastes Money $20,000 $20,000 $20,000 $20,000 $20,000 $20,000 $20,000 $20,000 $20,000 $20,000 $20,000 $20,000
Parking Management Strategies
 Parking Management Strategies Policy Program Potential Effectiveness (percent reduction in demand) Comments Parking Pricing Unbundling and Cash-Out Options Reduced Parking Requirements Transit/TOD Supportive
Whither the Dashing Commuter?
 Whither the Dashing Commuter? The MTA in a Changing Region William Wheeler Director of Special Project Development and Planning Travel in the New York Region has changed from the days of the 9 to 5 commute
ACT Canada Sustainable Mobility Summit Planning Innovations in Practice Session 6B Tuesday November 23, 2010
 ACT Canada Sustainable Mobility Summit Planning Innovations in Practice Session 6B Tuesday November 23, 2010 Presentation Outline Context t of Mississauga i City Centre Implementing Paid Parking and TDM
Submission to Greater Cambridge City Deal
 What Transport for Cambridge? 2 1 Submission to Greater Cambridge City Deal By Professor Marcial Echenique OBE ScD RIBA RTPI and Jonathan Barker Introduction Cambridge Futures was founded in 1997 as a
RE: A Traffic Impact Statement for a proposed development on Quinpool Road
 James J. Copeland, P.Eng. GRIFFIN transportation group inc. 30 Bonny View Drive Fall River, NS B2T 1R2 May 31, 2018 Ellen O Hara, P.Eng. Project Engineer DesignPoint Engineering & Surveying Ltd. 200 Waterfront
Downtown Transit Connector. Making Transit Work for Rhode Island
 Downtown Transit Connector Making Transit Work for Rhode Island 3.17.17 Project Evolution Transit 2020 (Stakeholders identify need for better transit) Providence Core Connector Study (Streetcar project
Vanpooling and Transit Agencies. Module 3: Benefits to Incorporating Vanpools. into a Transit Agency s Services
 Vanpooling and Transit Agencies Module 3: Benefits to Incorporating Vanpools into a Transit Agency s Services A common theme we heard among the reasons why the transit agencies described in Module 2 began
APPENDIX I: [FIXED-GUIDEWAY TRANSIT FEASIBILITY]
![APPENDIX I: [FIXED-GUIDEWAY TRANSIT FEASIBILITY]](/thumbs/83/87090921.jpg "APPENDIX I: [FIXED-GUIDEWAY TRANSIT FEASIBILITY]") APPENDIX I: [FIXED-GUIDEWAY TRANSIT FEASIBILITY] Jackson/Teton Integrated Transportation Plan 2015 Appendix I. Fixed-Guideway Transit Feasibility Jackson/Teton County Integrated Transportation Plan v2
APPENDIX I: [FIXED-GUIDEWAY TRANSIT FEASIBILITY] Jackson/Teton Integrated Transportation Plan 2015 Appendix I. Fixed-Guideway Transit Feasibility Jackson/Teton County Integrated Transportation Plan v2
BROWARD BOULEVARD CORRIDOR TRANSIT STUDY
 BROWARD BOULEVARD CORRIDOR TRANSIT STUDY FM # 42802411201 EXECUTIVE SUMMARY July 2012 GOBROWARD Broward Boulevard Corridor Transit Study FM # 42802411201 Executive Summary Prepared For: Ms. Khalilah Ffrench,
Policy Note. Vanpools in the Puget Sound Region The case for expanding vanpool programs to move the most people for the least cost.
 Policy Note Vanpools in the Puget Sound Region The case for expanding vanpool programs to move the most people for the least cost Recommendations 1. Saturate vanpool market before expanding other intercity
Paid Parking at Park & Ride Lots: Framing the Issues. Capital Programs Committee May 2014
 Paid Parking at Park & Ride Lots: Framing the Issues Capital Programs Committee May 2014 Outline Current Status Industry Review DART Case Study Issues Alternatives Mechanics 2 Current Status: All Lots
4.1 Land Use. SECTION CONTENTS Land Use Transit Transportation Technology
 4 FUTURE CHANGES IN THE CORRIDOR Over the next 30 years, Santa Clara County will grow by roughly 637,000 residents and 303,500 jobs increases of 31 percent and 43 percent, respectively. 1 Changes in land
King County Metro. Columbia Street Transit Priority Improvements Alternative Analysis. Downtown Southend Transit Study. May 2014.
 King County Metro Columbia Street Transit Priority Improvements Alternative Analysis Downtown Southend Transit Study May 2014 Parametrix Table of Contents Introduction... 1 Methodology... 1 Study Area...
2.0 Development Driveways. Movin Out June 2017
 Movin Out June 2017 1.0 Introduction The proposed Movin Out development is a mixed use development in the northeast quadrant of the intersection of West Broadway and Fayette Avenue in the City of Madison.
Re: Amend Sections and File No ZA Marcus Lotson, Development Services Planner
 Page 1 To: From: The Planning Commission MPC Staff Date: April 5, 2016 Subject: Re: Amend Sections 8-3082 and 8-3090 Marcus Lotson, Development Services Planner Issue: Proposed amendments to the zoning
Travel Time Savings Memorandum
 04-05-2018 TABLE OF CONTENTS 1 Background 3 Methodology 3 Inputs and Calculation 3 Assumptions 4 Light Rail Transit (LRT) Travel Times 5 Auto Travel Times 5 Bus Travel Times 6 Findings 7 Generalized Cost
Click to edit Master title style
 Nelson/Nygaard Consulting Associates SERVICE IMPROVEMENT STRATEGIES September 22, 2015 1 PROJECT OVERVIEW & WORK TO DATE 1. Extensive stakeholder involvement Throughout 2. System and market assessment
West Broadway Transit Study. Community Advisory Committee September 17, 2015
 West Broadway Transit Study Community Advisory Committee September 17, 2015 Introductions Community Engagement Summer Outreach Fall Outreach Technical Analysis Process Update Alternatives Review Economic
Trip Generation and Parking Utilization Data Collection at Mini-Mart with Gas Station
 Trip Generation and Parking Utilization Data Collection at Mini-Mart with Gas Station Final Report 2013 ITE District 6 - Data Collection Project Institute of Transportation Engineers Student Chapter at
TR15: Public Outreach
 TR15: Public Outreach Brief Summary: The Public Outreach control measure includes activities to encourage Bay Area residents to make choices that benefit air quality. This measure includes various public
Public Meeting. City of Chicago Department of Transportation & Department of Housing and Economic Development
 Public Meeting City of Chicago Department of Transportation & Department of Housing and Economic Development Funded by Regional Transportation Authority September 12, 2011 In partnership with Presentation
ANDERSON PROPERTY SITE ANALYSIS
 ANDERSON PROPERTY SITE ANALYSIS Introduction The Montgomery County Department of Transportation (MCDOT) initiated a feasibility study in the fall of 2012 to evaluate the need for transit service expansion
NEW YORK SUBURBAN RAIL SUMMARY (COMMUTER RAIL, REGIONAL RAIL)
") NEW YORK SUBURBAN RAIL SUMMARY (COMMUTER RAIL, REGIONAL RAIL) October 2003 New York: The New York commuter rail service area consists of 20.3 million people, spread over 4,700 square miles at an average
NEW YORK SUBURBAN RAIL SUMMARY (COMMUTER RAIL, REGIONAL RAIL) October 2003 New York: The New York commuter rail service area consists of 20.3 million people, spread over 4,700 square miles at an average
Metra Milwaukee District West Line Transit-Friendly Development Plan
 Metra Milwaukee District West Line Transit-Friendly Development Plan Community Input Workshop April 6, 2011 Overview of Presentation Workshop Goals Study Context Existing Conditions Market Overview Employment
Yonge-Eglinton. Mobility Hub Profile. September 19, 2012 YONGE- EGLINTON
 September 19, 2012 PEEL YORK HALTON DURHAM HAMILTON TORONTO YONGE- EGLINTON MOBILITY HUBS: places of connectivity between regional and rapid transit services, where different modes of transportation come
Image from:
 Mercer County 1. Background Information Mercer County was carved out of surrounding counties in 1838 and has a history dating back to the Revolutionary War. It has 13 municipalities covering 226 square
QUALITY OF LIFE EXECUTIVE SUMMARY REPORT I O N S TAT I O N
 QUALITY OF LIFE EXECUTIVE SUMMARY REPORT UN I O N S TAT I O N T R AV E L by TR A I N Published September 2017 2015 PROGRESS MAP This document reports FasTracks progress through 2015 BACKGROUND RTD The
November
 November 13 2008 4509.04 Mr. Rob Siddoo Siddoo Holdings 105 2277 West 2 nd Avenue Vancouver BC V6K 1H8 Dear Mr. Siddoo: Re: Transportation Assessment: 1030 Denman Street, Residential Conversion, Vancouver
TRIMET S PARK & RIDE PROGRAM
 TRIMET S PARK & RIDE PROGRAM TOD Planner Idea Exchange October 21, 2009 Young Park, TriMet 1 Presentation Overview Park & Ride Policy Guidance Program Highlights Short Term Meter Program Changing Landscape
PHILADELPHIA SUBURBAN RAIL SUMMARY (COMMUTER RAIL, REGIONAL RAIL)
") PHILADELPHIA SUBURBAN RAIL SUMMARY (COMMUTER RAIL, REGIONAL RAIL) October 2003 The Philadelphia commuter rail service area consists of 5.1 million people, spread over 1,800 square miles at an average population
PHILADELPHIA SUBURBAN RAIL SUMMARY (COMMUTER RAIL, REGIONAL RAIL) October 2003 The Philadelphia commuter rail service area consists of 5.1 million people, spread over 1,800 square miles at an average population
Appendix C. Parking Strategies
 Appendix C. Parking Strategies Bremerton Parking Study Introduction & Project Scope Community concerns regarding parking impacts in Downtown Bremerton and the surrounding residential areas have existed
DOWNTOWN CONCORD SPECIFIC PLAN
 Timeline Next Milestones Alternatives Analysis Draft Report to MTC - July 30 Draft Specific Plan Outline July 31 First Draft Specific Plan Report September 15 Schedule and Agendas July 22 nd DSC #5 Evaluation
71, 75 MONTREAL STREET PARKING STUDY
 71, 75 MONTREAL STREET PARKING STUDY Prepared for: Prepared by: Urban Core Ventures Boulevard Transportation, a division of Watt Consulting Group Our File: 1975 Date: June 20 2016 CONTENTS 1.0 INTRODUCTION...
Charlotte-Mecklenburg Region Rapid Transit and Land-Use Integration
 Charlotte-Mecklenburg Region Rapid Transit and Land-Use Integration Legislative Committee on Urban Growth and Infrastructure Carolyn Flowers CEO Charlotte Area Transit System March 23, 2010 Charlotte Region
Chapter 4 : THEME 2. Transportation
 Chapter 4 : THEME 2 Strengthen connections to keep the Central Area easy to reach and get around 55 Figure 4.2.1 Promote region-wide transit investments. Metra commuter rail provides service to the east,
King Soopers #116 Thornton, Colorado
 Traffic Impact Study King Soopers #116 Thornton, Colorado Prepared for: Galloway & Company, Inc. T R A F F I C I M P A C T S T U D Y King Soopers #116 Thornton, Colorado Prepared for Galloway & Company
Feasibility Study. Community Meeting March, North-South Commuter Rail Feasibility Study
 Feasibility Study Community Meeting March, 2017 1 Agenda 1. Welcome / Introductions 2. Background / Meeting Purpose 3. Progress to Date Options Evaluated Capital/Operating Costs Ridership 4. Financial
The Value of Travel-Time: Estimates of the Hourly Value of Time for Vehicles in Oregon 2007
 The Value of Travel-Time: Estimates of the Hourly Value of Time for Vehicles in Oregon 2007 Oregon Department of Transportation Long Range Planning Unit June 2008 For questions contact: Denise Whitney
PARKING MANAGEMENT PLAN PROPOSED MIXED-USE DEVELOPMENT AT URL STAMFORD Parcel 38 Greyrock Place and Tresser Boulevard Stamford, CT April 2, 2014
 PARKING MANAGEMENT PLAN PROPOSED MIXED-USE DEVELOPMENT AT URL STAMFORD Parcel 38 Greyrock Place and Tresser Boulevard Stamford, CT April 2, 2014 This plan has been prepared in support of a proposed mixed-use
WELCOME Open House on Parking
 WELCOME Open House on Parking Tonight we re presenting our policy responses for your input on how to best manage our public parking. Parking is a shared community resource. To best serve everyone in our