PINELLAS SUNCOAST TRANSIT AUTHORITY 2008 TRANSIT DEVELOPMENT PLAN FINAL PREPARED FOR:
|
|
|
- Bryce Wiggins
- 5 years ago
- Views:
Transcription
1 PINELLAS SUNCOAST TRANSIT AUTHORITY 2008 TRANSIT DEVELOPMENT PLAN FINAL PREPARED FOR: PINELLAS SUNCOAST TRANSIT AUTHORITY 3201 SCHERER DRIVE ST. PETERSBURG, FLORIDA (727) (727) JULY 2008 TINDALE-OLIVER & ASSOCIATES, INC N. ASHLEY DRIVE, SUITE 100 TAMPA, FLORIDA (813) (813)
2 (This page intentionally left blank.)
3 Table of Contents LIST OF TABLES... IV LIST OF FIGURES... V LIST OF MAPS... VI SECTION 1 INTRODUCTION PROJECT VISION AND GOAL CONTRIBUTION OF PUBLIC TRANSIT TO COMMUNITIES PUBLIC PARTICIPATION STRATEGIES FOR CREATING A LIVABLE COMMUNITY TDP REQUIREMENTS SECTION 2 EXISTING CONDITIONS TRENDS Population Economy Cost of Housing FIXED-ROUTE SERVICE Fares Operating Budget Ridership Productivity Service Frequency Increases in Service DEMAND RESPONSE SERVICE Response Time Trip Purposes Hours and Days of Service Fares Operating Budget NEAR-TERM FUNDING SHORTFALL Carryover from FY 2007/08 Budget Service Modifications Reductions to the FY 2008/09 Annual Operating Budget Fare Structure Modifications Use of General Reserves Millage Rate Increase PSTA Staff Recommendations Budget Approval Schedule SERVICE ANALYSIS PROCESS PEER REVIEW ANALYSIS Peer Review Analysis: Current Peers Peer Review Analysis: Future Peers SECTION 3 MILESTONES MILESTONE ACHIEVEMENTS: FIXED-ROUTE SERVICE FY 2007/08 Improvement Projects July 2008 I Final 2008 Transit Development Plan
4 3.1.2 FY 2006/07 Improvement Projects MILESTONE ACHIEVEMENTS: DEMAND RESPONSE SERVICE BUS STOP AMENITIES Passenger Amenity Plan Examples of Amenities BUS AMENITIES COMMUNITY PARTNERSHIPS AND OUTREACH PUBLIC INVOLVEMENT EFFORTS PLANNING STUDIES AND REGULATIONS Central Avenue BRT Study Countywide BRT Study Ulmerton Road BRT Corridor Downtown Clearwater to Clearwater Beach Bus Rapid Transit TBARTA Regional Transportation Master Plan Long Range Transportation Plan (LRTP) Pedestrian Safety Law DEVELOPMENT COORDINATION Tarpon Wal-Mart Transit Center Gateway Regional Multimodal Transportation District (MMTD) Pilot Project Grady Pridgen Sod Farm Largo Towne Center SECTION 4 NEEDS ASSESSMENT TRADITIONAL TRANSIT MARKETS DISCRETIONARY TRANSIT MARKETS ACCESS TO ACTIVITY CENTERS COMMUTING MARKETS JOINT WORKSHOPS (PSTA BOARD OF DIRECTORS AND PMI STEERING COMMITTEE) First Joint Workshop Second Joint Workshop PSTA TAC WORKSHOPS First TAC Workshop Second TAC Workshop SUMMARY RESULTS OF NEEDS ASSESSMENT SECTION 5 10-YEAR VISION PLAN VISION OVERVIEW SERVICE EXPANSION INFRASTRUCTURE IMPROVEMENTS LAND USE COMMUNITY SUPPORT POTENTIAL REVENUE SOURCES Fare Policy Ad Valorem Tax Sales Tax Fuel Tax Rental Car Fee Tourist Tax Vehicle Tag Fee July 2008 II Final 2008 Transit Development Plan
5 5.6.8 Impact Fee Transit Concurrency Conclusion SECTION 6 NEW DIRECTION AND NEXT STEPS PREVIOUS TDP VISION NEW DIRECTIONS Creation of a Livable Community Near-Term Budget Issues New 10-Year Ridership Objective Emphasis on Top Transit Corridors Focus on Transit-Supportive Land Use and Development Countywide BRT System Development Service to Tampa International Airport (TIA) Service to Recreational Areas Central Avenue BRT Clearwater Beach Shuttle/BRT TBARTA Planning Coordination Park-and-Ride Opportunities NEXT STEPS SECTION 7 BUDGET PROJECTIONS OPERATING COSTS CAPITAL COSTS OPERATING REVENUES CAPITAL REVENUES SECTION MAJOR UPDATE REQUIREMENTS APPENDIX A: BENEFITS OF TRANSIT...A-1 APPENDIX B: PROGRAM OF PROJECTS...B-1 APPENDIX C: TRANSIT ORIENTATION INDEX METHODOLOGY...C-1 APPENDIX D: ANNUAL FAREBOX RECOVERY RATIO REPORT D-1 APPENDIX E: FDOT DISTRICT SEVEN TDP CHECKLIST...E-1 APPENDIX F: TBARTA REGIONAL TRANSPORTATION MASTER PLAN... F-1 APPENDIX G: HYBRID BUS COST ESTIMATES... G-1 APPENDIX H: PEDESTRIAN SAFETY LAW...H-1 APPENDIX I: PSTA COMMENTS ON GATEWAY MULTI-MODAL TRANSPORTATION DISTRICT PILOT PROJECT... I-1 July 2008 III Final 2008 Transit Development Plan
6 LIST OF TABLES Table 1-1 Progress Report Requirements Table 2-1 Fixed-Route Service: PSTA Fare Structure (Effective ) Table 2-2 Fixed-Route System: Expenses and Cost per Trip (FY 1994/95 FY 2006/07) Table 2-3 Fixed-Route Service: Annual Ridership (FY 1993/94 to FY 2006/07) Table 2-4 Fixed-Route Service: Ridership Analysis by Route (FY 2006/07) Table 2-5 Fixed-Route Service: Ridership Analysis by Route (October to May) Table 2-6 Demand Response Service: PSTA Fare Structure (Effective ) Table 2-7 Demand Response Cost per Passenger (FY 1994/95 to FY 2006/07) Table 2-8 Growth in Demand Response Trip Volume Table 2-9 Demand Response Ridership Analysis (October to June) Table 2-10 Operating Budget by Revenue Source (FY 2007/08) Table 2-11 Effects of Fare Increase on Revenue and Ridership (FY 2008/09) Table 2-12 PSTA Staff Budget Recommendations Table 2-13 FY 2006 Peer Group Operating Characteristics Table 2-14 Current Peers Analysis (2006 NTD Data) Table 2-15 Future Peers Analysis (2006 NTD Data) Table 3-1 Bikes-on-Buses Ridership (FY 2001/02 FY 2006/07) Table 3-2 Bus and Trolley Purchases (FY 2004/05 FY 2007/08) Table 4-1 Transit Service Density Thresholds Table 4-2 TAC Recommendations for Improvements Table 4-3 Service Improvements Resource Allocation Results Table 4-4 Service Phasing Trade-Off Preference Results Table 4-5 Infrastructure Resource Allocation Results Table 4-6 Vehicle Size Trade-Off Preference Results Table 4-7 Transfer Center Improvements Resource Allocation Table 4-8 Vehicle Improvements Resource Allocation Results Table 6-1 FDOT Work Program Candidate Projects Table 7-1 Capital Costs July 2008 IV Final 2008 Transit Development Plan
7 LIST OF FIGURES Figure 1-1 Fixed-Route Ridership Estimates and Projections Figure 2-1 Population Growth in Pinellas County by Year Figure 2-2 School Enrollment in Pinellas County by Year Figure 2-3 Housing Costs versus Household Income in Pinellas County Figure 2-4 Fixed-Route Service: Annual Ridership Trends (FY 1993/94 to FY 2006/07) Figure 2-5 Growth in Demand Response Trip Volume Figure 2-6 Fixed-Route Service: Operating Budget by Revenue Source (FY 2007/08) Figure 3-1 New Passenger Shelter with Public Art Figure 3-2 Bus Shelter Figure 3-3 Cantilevered Bus Shelter Figure 3-4 OmniLight TM Figure 3-5 Ramp Deployment at Newly Constructed Curb Figure 3-6 Newly Constructed Curb Figure 5-1 Annual Property Tax Revenue (in Millions) Figure 5-2 Potential Annual Sales Tax Revenue (in Millions) Figure 5-3 Potential Annual Fuel Tax Revenue (in Millions) Figure 5-4 Potential Annual Rental Car Fee Revenue (in Millions) Figure 5-5 Potential Annual Tourist Tax Revenue (in Millions) Figure 5-6 Potential Annual Vehicle Tag Fee Revenue (in Millions) Figure 5-7 Potential Annual Impact Fee Revenue (in Millions) Figure 7-1 Operating Costs (in millions) Figure 7-2 Operating Revenue Shortfall Figure 7-3 Capital Revenue Shortfall Figure 8-1 TDP Major Update Checklist July 2008 V Final 2008 Transit Development Plan
8 LIST OF MAPS Map 2-1 Mobile Home Parks Map 2-2 PSTA Fixed-Route System Map 2-3 Top 10 Fixed Routes by Ridership Map 2-4 FY 2005/06 & FY 2006/07 Service Changes Map 4-1 Traditional Transit Markets Map Discretionary Transit Markets Map Discretionary Transit Markets Map 4-4 Activity Centers Map 4-5 Highest Transit Trip Intensity Corridors Map 4-6 Inter-County Commuting Patterns (2005) Map 5-1 Priority Corridor Network July 2008 VI Final 2008 Transit Development Plan
9 Section 1 INTRODUCTION Public transportation has become an increasingly important component of the transportation system in Pinellas County and the entire Tampa Bay region. The Pinellas Suncoast Transit Authority (PSTA) is the public transportation provider for Pinellas County, operating 43 bus routes throughout the community and providing nearly 12 million trips in In January 2008, the PSTA Board of Directors and the Pinellas County Metropolitan Planning Organization (MPO), through its Pinellas Mobility Initiative (PMI) Steering Committee, participated in a joint workshop to begin establishing a vision for transit in Pinellas County. Since that time, PSTA has worked closely with its partners to develop a comprehensive vision for transit in the community. 1.1 PROJECT VISION AND GOAL The vision developed by the PSTA Board, PMI Steering Committee, and PSTA staff is to use enhanced transit service, particularly on major travel corridors, to further Pinellas County s transition into a more livable community. Trends in population growth, the economy, and the cost of housing necessitate an enhanced, affordable, convenient, and effective public transit system for Pinellas County. In order to achieve this vision, PSTA established a goal of doubling fixed-route transit ridership in the next 10 years from a projected 11.7 million transit trips in FY 2007/08 to 23.4 million transit trips in FY 2017/18, an annualized ridership increase of 7 percent. Figure 1-1 illustrates transit ridership since FY 1993/94 and annual ridership increases necessary to reach the goal in FY 2017/18. As discussed throughout the plan, this aggressive goal will require a significant commitment by the PSTA Board, PMI Steering Committee, MPO Board, business community, local agencies and jurisdictions, and citizens throughout Pinellas County and the region. This commitment will need to take the form of leadership by decision makers, capital resources to support new services, and financial resources to fund new and expanded service operations. July Final 2008 Transit Development Plan
10 Figure 1-1 Fixed-Route Ridership Estimates and Projections 25,000,000 Ridership (millions) 20,000,000 15,000,000 10,000,000 5,000, ,858,669 7,975, / /95 8,271,908 8,719,341 9,077,502 9,505,696 9,701,963 9,690,296 9,289,701 9,487, / / / / / / / /03 9,701,063 10,121,402 11,021, / / /06 11,298,254 Fiscal Year 1.2 CONTRIBUTION OF PUBLIC TRANSIT TO COMMUNITIES 11,750,184 12,915,166 14,080,147 15,245,129 16,410,110 17,575,092 18,740,074 19,905,055 21,070, / / / / / / / / / /16 22,235,018 23,400, / /18 The PSTA Board, PMI Steering Committee, and PSTA staff developed the vision of transit contributing to Pinellas County as a livable community because of the numerous benefit transit brings to local communities. A list of the ways that transit contributes to the livability of a community is provided below. Local public transit systems provide much needed mobility for those with limited income who do not own a car or have access to a family vehicle. A strong local transit system is the foundation of a robust regional transportation network. Public transit enhances land use and economic development by connecting residential areas with major activity centers. This connectivity promotes education, employment, and entertainment opportunities for area residents and visitors. The emission reductions from public transit usage contribute to a cleaner, more energy-efficient, and sustainable environment. Emergency preparedness systems can effectively utilize public transit vehicles for area-wide evacuations and recovery services. July Final 2008 Transit Development Plan
11 For more detailed information regarding the benefits of transit, see Appendix A. 1.3 PUBLIC PARTICIPATION Thousands of citizens and visitors have participated in the visioning process used to define the future of transit in Pinellas County. Public involvement efforts included the following activities. A non-user telephone survey of 402 households in Pinellas County was conducted in An on-board user survey of 3,000 existing bus riders on PSTA was conducted in Two joint workshops on transit visioning with the PSTA Board and the PMI Steering Committee were conducted in early A presentation of transit funding solutions was made to the PSTA Finance Committee, the PSTA Board, and the MPO s Technical Coordinating Committee. Two workshops were conducted on transit visioning with PSTA s Transit Advisory Committee (TAC), as well as invited participants from the staff of the MPO, Florida Department of Transportation (FDOT) District Seven, and the workforce development board. Input received throughout the planning process indicates a sincere interest in expanding transit to become a more viable mode of transportation not only for individuals dependent upon transit, but also for individuals who may choose to use transit now and in the future. In addition to public input gathered by PSTA, the Tampa Bay Area Regional Transportation Authority (TBARTA) released survey results from its Regional Resident survey. The results of this survey showed that the majority of residents support transit improvements and 68% of residents surveyed indicate that using tax dollars for transit service improvements is a good use of public funds. 1.4 STRATEGIES FOR CREATING A LIVABLE COMMUNITY As stated previously, PSTA s vision is more to enhance transit services that contribute to the transition of Pinellas County into a more livable community. The vision includes the following basic principles for service provision: July Final 2008 Transit Development Plan
12 Continued provision of mobility and accessibility to traditional transit markets, including elderly, youth, persons with disabilities, and low-income populations. Improve the service provided in order to meet the needs of discretionary transit markets (primarily commuters) that choose to use transit as a transportation alternative either regularly or occasionally. The following strategies have been identified in order to make this vision a reality. Service Expansion Frequent and rapid transit service (15 minutes or better) on the top 10 transit corridors. Frequent bus service (30 minutes or better) on the next top 10 transit corridors. Comprehensive assessment and realignment of local bus service to optimize transit connectivity throughout the county. Park-and-ride facilities along major route corridors for convenient access to Bus Rapid Transit (BRT) and commuter express routes, which then travel more efficiently to major destinations. New and expanded circulator services strategically located to enhance accessibility around major transit centers and BRT stations. Community Partnerships Strong partnerships with the business community, with an emphasis on coordinated opportunities to help serve the transportation needs of major employers. Strong partnership with the TBARTA and convenient connections to regional transit services, such as Hillsborough Area Regional Transit Authority (HART), Pasco County Public Transportation (PCPT), and Manatee County Area Transit (MCAT), throughout the Tampa Bay area. Expanded focus on public relations, marketing, and education to enhance partnerships throughout the community. Infrastructure Improvements Significant expansion of vehicle fleet to include stylized buses for BRT service and support service expansion. Transition of buses from clean diesel to hybrid-electric and other alternativefueled buses. July Final 2008 Transit Development Plan
13 Focus on essential infrastructure, such as high quality buses, shelters, and customer information. Effective use of technology to improve customer service and enhance the availability of customer information. Relocation, reconstruction, or renovation of major transfer facilities, including Williams Park and Park Street Terminal. Relocation or renovation of critical transit centers to support service expansion and modifications. Coordination with county and municipal staff regarding sidewalk improvement programs, placing an emphasis on access to bus stops and sidewalk connections between bus stops and major destinations. Transit-Supportive Land Use and Development Encouragement of transit supportive development by better integrating appropriate policies and procedures in the Land Development Code and the site plan review process (e.g., Livable Communities Initiative). Consideration of the impacts of parking policies on public transportation and the potential for encouraging transit use through parking disincentives (cost and availability). Coordination with jurisdictions to secure support for transit supportive land use, including high density, mixed-use nodes and corridors. Transit Funding Expansion of partnerships with development and business community to help pay for existing and expanded transit services. Regular evaluation of fare policy to ensure that existing and future patrons are contributing to the success of the transit system. Securement of a new dedicated source of funding for transit that will support the implementation of the 2008 TDP. The 2008 TDP lays out the possibilities for achieving a vision for Pinellas County, but more importantly, it provides a blueprint for making the possibilities become a reality. 1.5 TDP REQUIREMENTS The 10-year TDP also satisfies a legal requirement for PSTA. To secure certain state funds, PSTA must complete a TDP every year. Every five years, PSTA must provide a major update. In the interim years, PSTA must provide annual progress reports. The July Final 2008 Transit Development Plan
14 last major update was completed in 2007 and this document serves as an annual progress report. On February 20, 2007, FDOT promulgated Rule , which substantially changed the TDP requirements. These changes affected major updates as well as annual progress reports. Table 1-1 provides a checklist of requirements for the annual progress report as noted in the new TDP rule. Table 1-1 Progress Report Requirements Task Completed Location Compare past year's accomplishments to original implementation program Sections 3 & 6 Analyze any discrepancies between the plan and its implementation over the past year Section 6 Describe steps to be taken to attain original goals Sections 3 & 6 If needed, revise implementation program for coming year Sections 4, 5, & 6 Revise the implementation program for the remaining years Sections 5 & 6 Add recommendations for the new tenth year of the plan Sections 5 & 6 Revise the financial plan Section 6 Revise the list of projects or service needed to meet the goals and objectives, including projects for which funding may not have been identified. Sections 5 & 6 PSTA has provided all of the required material for a progress report under the new rule. In addition to providing all of the required material, PSTA has provided in-depth information about its vision for transit services throughout Pinellas County for the next 10 years. In November 2007, Timothy Garling took over as the new executive director of PSTA. Since starting, Mr. Garling has been working with PSTA s Board of Directors as well as stakeholders throughout Pinellas County to create a new transit vision for the next 10 years. Because of the significant shift in direction PSTA has undertaken, the agency has provided significantly more data and analysis than is typical for a progress report. July Final 2008 Transit Development Plan
15 The additional information is particularly helpful as it is based on a 10-year planning horizon, which is the planning horizon now required under the new TDP rule. July Final 2008 Transit Development Plan
16 (This page intentionally left blank.) July Final 2008 Transit Development Plan
17 Section 2 EXISTING CONDITIONS This section provides background information reviewed by the PSTA Board, PMI Steering Committee, and PSTA staff in establishing the new transit vision for Pinellas County. Data regarding population, economic, and housing trends are provided. This section provides background for PSTA future operations. PSTA operational statistics and data are provided for both fixed-route and demand response services. This background information sets the stage for both near-term and long-term planning efforts. A discussion of a near-term funding shortfall and the resulting impact it will have on PSTA is presented in this section. While PSTA has to address this near-term funding shortage, the agency has been cognizant of the simultaneous need to focus on longterm planning efforts as well. The long-term vision plan is presented in Section 5. A peer review analysis is also provided to demonstrate how PSTA compared to current and future peer transit agencies in FY TRENDS Because PSTA ridership is influenced by trends in the local community, this section describes trends affecting population, the economy, and housing costs in Pinellas County. This background information provides the backdrop for PSTA s planning efforts Population The population of Pinellas County grew in the 1990s, but it has remained relatively stable in the 2000s. Between 1990 and 2000, Pinellas county s population increased by 8 percent, according to the U.S. Census. Between 2000 and 2006, the county s population has increased only one-third of a percent, according to the 2006 American Community Survey. Population density in Pinellas County is the highest of all Florida counties, making the county an ideal area for transit growth. Figure 2-1 illustrates population trends from 1990 to July Final 2008 Transit Development Plan
18 Figure 2-1 Population Growth in Pinellas County by Year Population 1,000, , , , , , , , , , Year St. Petersburg Clearwater Other Cities Unincorporated Areas Source: Pinellas County Budget FY 2007/08. In addition to the year-round population presented in Figure 2-1, the 2000 Census found that 7.1 percent of houses, or 34,111 houses, in Pinellas County are owned for seasonal, recreational, or occasional use. The Pinellas County Planning Department estimates that 78,116 people take up seasonal residence in the County each year, which places additional impact on public services and facilities in the County, but also generates additional revenue in terms of sales and ad valorem taxes. The percent of the population over the age of 65 years decreased slightly between 2000 and 2006, from 22.5 percent of the population in 2000 to 20.7 percent in A similar trend can be seen for the population share classified as having disability status. The disabled population age 5 and above decreased from 23.9 percent in 2000 to 17.8 percent in School enrollment in Pinellas County declined over the past three years. The Pinellas County School Board enrollment decreased from 111,483 in the 2005/06 school year to 106,479 in the 2007/08 school year, a decline of 4.5 percent (see Figure 2-2). July Final 2008 Transit Development Plan
19 The population and school enrollment trends presented above suggest that population growth in Pinellas has slowed. Understanding this trend, PSTA has taken this fact into account in generating its plan to double ridership over the next 10 years. The agency understands that it cannot simply rely on population growth to drive transit ridership growth. Figure 2-2 School Enrollment in Pinellas County by Year 113, , , , , , , , , , , , , , / / /08 School Year Source: Pinellas County School Board (October 2007) Economy Economic conditions in Pinellas County are becoming more conducive to transit use. While the unemployment rate has increased from 4.3 percent in 2000 to 4.7 percent in 2006, the civilian labor force in Pinellas County remained constant at 58.3 percent of the population over the age of 16 during the same time period, according to the 2006 American Community Survey. The percent of the population below the poverty level has increased from 10.0 percent in 2000 to 12.3 percent in During the same period, the median household income in Pinellas County has not kept pace with inflation, increasing from $37,111 in 2000 to $40,694 in 2005, an increase of 9.7 percent. These trends, in conjunction with increasing July Final 2008 Transit Development Plan
20 fuel prices, suggest an increased propensity for transit use, because those with lower incomes are more likely to use transit Cost of Housing As shown in Figure 2-3, the median household income in Pinellas County increased 9.7 percent between 2000 and 2005, from $37,111 to $40,694. This increase has not mirrored the median cost of housing within the County. Housing costs increased by 72 percent, from $96,500 in 2000 to $166,200 in 2006, stretching the gap between household income and housing cost (see Figure 2-3). Since 2005, housing costs have declined which may have mitigated some of the differential between income growth and housing cost growth shown in Figure 2-3. If this differential has been mitigated to some extent, some potential buyers who could not enter the market before may now be able to enter the market, but it is still expected that housing costs will create a barrier for many Pinellas County residents who would like to purchase a home. Figure 2-3 Housing Costs versus Household Income in Pinellas County $180,000 $160,000 $140,000 $120,000 $100,000 Median Cost of Owner-Occupied Housing Median Household Income $166,200 $80,000 $60,000 $40,000 $20,000 $73,500 $26,296 $96,500 $37,111 $40,694 $ Year July Final 2008 Transit Development Plan
21 Mobile home parks, often a source of affordable housing, have been affected by economic conditions as well. According to data obtained in October 2007 from the Pinellas County Planning Department and Property Appraiser s Office, 50 mobile home parks have closed and 39 may possibly close in the near future. Map 2-1 displays mobile home parks that have or may be closing. 2.2 FIXED-ROUTE SERVICE PSTA provides transit service to Pinellas County, the most densely populated county in Florida. Presently, PSTA has approximately 600 employees and 205 buses. It serves 21 of the 24 communities in Pinellas County plus unincorporated areas. PSTA's fixed-route system can be generally categorized as a hub and spoke system with three major hubs: downtown St. Petersburg, Central Plaza, and downtown Clearwater. The PSTA weekday peak fleet requirement is 171 buses. On Saturdays, the vehicle requirement is 100 buses, while the Sunday and holiday service requirement is 65 buses. PSTA buses travel over 10.4 million annual route miles and operate for more than 665,000 hours per year. PSTA operates 33 local Routes, five commuter routes, two express routes, and three shuttle/circulator routes (i.e., Route 32, Pinellas Park Shuttle [Route 444], and Municipal Service Center Shuttle [Route 111]). Map 2-2 displays PSTA s fixed-route system with the ¼-mile and ¾-mile service boundaries. Map 2-2 displays a ¼-mile buffer which represents the area in which people can easily walk to reach transit service. The ¾-mile buffer identifies the area in which the American with Disabilities Act (ADA) complementary paratransit service Fares PSTA provides a variety of passes to accommodate each passenger s needs. For the occasional user, PSTA accepts one-trip cash fares. PSTA offers unlimited ride daily, 7- day, and 31-day GO cards. Commuters traveling between Pinellas County and Tampa on Routes 100X and 300X can save 10 percent on every ride with the 20-ride Premium GO Card. Senior citizens and persons with disabilities may ride for a reduced rate on cash fares or passes. Passengers who take advantage of the reduced rate must present an original Medicare card or a PSTA photo identification card. Students may ride for a reduced cash fare with a PSTA photo identification card. July Final 2008 Transit Development Plan
22 I TRANSIT DEVELOPMENT PLAN P i n e l l a s S u n c o a s t T r a n s i t A u t h o r i t y!(!(!(!(!( KLOSTERMAN RD!(!(!(!( Pasco County ALT US 19 PINELLAS AVE ALDERMAN RD KEYSTONE RD TAMPA RD EAST LAKE RD Pinellas County Hillsborough County Map 2-1: Mobile Home Parks Legend !( Closed/Vacated!( Possible Closure PSTA Bus Routes Major Roads!(!( CURLEW RD!(!(!(!(!(!(!(!(!(!(!(!(!( GULF BLVD MISSOURI AVE SUNSET POINT RD DREW ST SR 580 MAIN ST KEENE RD BELCHER RD SR 686 EAST BAY DR GULF-TO-BAY BLVD US 19 MCMULLEN BOOTH RD ROOSEVELT BLVD Old Tampa Bay WALSINGHAM RD!( 102ND AVE PARK BLVD!( Gulf of Mexico 113TH ST!(!(!(!(!( ALT US 19 SEMINOLE BLVD GULF BLVD WELCH CSWY!(!(!(!( BRYAN DAIRY RD!(!(!(!(!(!(!(!( PARK BLVD!(!(!(!(!( 54THAVE N!(!(!(!(!(!(!( 38TH AVE N!(!(!( PARK ST!( CENTRAL AVE 118TH AVE!( 49TH ST N 49TH ST N SR 688 ULMERTON RD 22ND AVE N ROOSEVELT BLVD!(!( 5THAVE N!( 22ND AVE S 54THAVE S DR MARTIN LUTHER KING JR ST N 4TH ST N!(!(!(!(!(!(!(!(!( Tampa Bay Miles Source: Pinellas County Property Appraiser
23 I TRANSIT DEVELOPMENT PLAN P i n e l l a s S u n c o a s t T r a n s i t A u t h o r i t y Pasco County ALT US 19 PINELLAS AVE KLOSTERMAN RD ALDERMAN RD KEYSTONE RD TAMPA RD EAST LAKE RD Pinellas County Hillsborough County Map 2-2: PSTA Fixed-Route System Legend 1/4-Mile Service Area 3/4-Mile Service Area PSTA Bus Routes Major Roads CURLEW RD SR 580 MAIN ST SUNSET POINT RD MCMULLEN BOOTH RD DREW ST GULF BLVD MISSOURI AVE KEENE RD BELCHER RD SR 686 EAST BAY DR GULF-TO-BAY BLVD US 19 ROOSEVELT BLVD Old Tampa Bay SR 688 ULMERTON RD WALSINGHAM RD 102ND AVE PARK BLVD 113TH ST ALT US 19 SEMINOLE BLVD BRYAN DAIRY RD 118TH AVE PARK BLVD 49TH ST N ROOSEVELT BLVD 4TH ST N Gulf of Mexico GULF BLVD WELCH CSWY PARK ST 54THAVE N 38TH AVE N CENTRAL AVE 49TH ST N 22ND AVE N 5THAVE N 22ND AVE S 54THAVE S DR MARTIN LUTHER KING JR ST N Tampa Bay Miles
24 PSTA GO Cards are available at PSTA Customer Service Centers and 21 authorized outlets throughout Pinellas, Hillsborough, and Pasco counties. Passengers can also purchase a Daily GO Card on board the bus. PSTA photo identification cards are available at PSTA Customer Service Centers. Table 2-1 displays the current fare structure. Table 2-1 Fixed-Route Service: PSTA Fare Structure (Effective ) Fare Type Child (5 years and under except on 100X & 300X) Cost Full Cash Fare (Cash or Token) $1.50 Special Citizen Reduced Cash Fare 1 $0.75 Student Reduced Cash Fare 1 $1.00 Premium Cash Fare (Routes 100X & 300X) 2 $2.50 Special Citizen Reduced Premium Cash Fare 1 $1.25 Daily Full Fare Unlimited Ride GO Card $3.50 Daily Reduced Fare Unlimited Ride Go Card 1 $ Day Unlimited Ride GO Card $ Day Unlimited Ride GO Card $ Day Reduced Fare Unlimited Ride GO Card 1 $ Ride Premium GO Card (Routes 100X & 300X) 2 $40.00 Passport 3 $ Day Youth Platinum Pass 4 $10.00 Summer Youth Haul Pass 4 $30.00 Bulk Discount Program Free Savings Purchase 100 through 299 tokens Save 5% Save Purchase 300 or more tokens 10% Purchase 200 or more tokens or passes (purchased by 501(c)(3) and government agencies) Save 10% 1 Proper photo identification must be shown prior to paying a reduced fare or using a reduced fare GO Card. Students are not eligible for reduced fare GO Cards. PSTA photo identification cards cost $2.50 each and can be obtained at a PSTA Customer Service Center, as well as selected PSTA ticket outlets. 2 Medicare cardholders and senior/disabled citizens with PSTA-issued photo identification may pay a reduced cash fare of $0.75 on select trips. Students are not eligible for this discount and reduced fare GO Cards will not be accepted. 3 Good for unlimited travel during the stated calendar month on all PSTA and HART buses and trolleys. 4 PSTA youth identification required except for elementary age school children. July Final 2008 Transit Development Plan
25 2.2.2 Operating Budget The operating budget for PSTA fixed-route services has increased from approximately $23.9 million in FY 1994/95 to $47.9 million in FY 2006/07, an increase of almost 101 percent over the 12-year period. Cost per trip grew from $2.99 in FY 1994/95 to $4.20 in FY 2006/07, an increase of slightly more than 40 percent. See Table 2-2. Table 2-2 Fixed-Route System: Expenses and Cost per Trip (FY 1994/95 FY 2006/07) Fiscal Year Total Expenses 1 Trips Passenger Unit Cost per Trip 1994/95 $23,868,898 7,975,651 $ /96 $24,351,920 8,271,908 $ /97 $24,136,823 8,719,071 $ /98 $24,483,123 9,077,502 $ /99 $24,155,732 9,505,696 $ /00 $26,369,717 9,701,963 $ /01 $28,706,597 9,690,296 $ /02 $29,917,237 9,289,701 $ /03 $32,832,830 9,487,637 $ /04 $35,676,304 9,701,063 $ /05 1 $37,982,193 10,226,584 $ /06 1 $46,025,915 11,141,770 $ /07 1,2 $47,928,414 11,407,445 $ Total fixed-route ridership includes Looper ridership of 105,259 in FY 2004/05, 120,419 in FY 2005/06 and 109,133 in FY 2006/07. 2 Expenses for FY 2006/07 are un-audited Ridership Productivity PSTA sustained fixed-route ridership growth from 7.9 million passenger trips in FY 1993/94 to 11.4 million passenger trips in FY 2006/07, an increase of 45 percent or a three percent annual growth rate. After declines in FY 2000/01 and FY 2001/02, ridership increased in each of the last five years. Over the more recent period of FY 2001/02 to FY 2006/07, ridership increased by four percent annually (see Table 2-3 and Figure 2-4). July Final 2008 Transit Development Plan
26 Table 2-3 Fixed-Route Service: Annual Ridership (FY 1993/94 to FY 2006/07) Fiscal Year Total Ridership % Change From Previous Year 1993/94 7,858, % 1994/95 7,975, % 1995/96 8,271, % 1996/97 8,719, % 1997/98 9,077, % 1998/99 9,505, % 1999/00 9,701, % 2000/01 9,690, % 2001/02 9,289, % 2002/03 9,487, % 2003/04 9,701, % 2004/ ,226, % 2005/ ,141, % 2006/ ,407, % 1 Includes Looper ridership of 105,259 in FY 2004/05, 120,419 in 2005/06, and 109,133 in 2006/07. Figure 2-4 Fixed-Route Service: Annual Ridership Trends (FY 1993/94 to FY 2006/07) 12,000,000 Ridership 10,000,000 8,000,000 6,000,000 4,000,000 7,858,669 7,975,651 8,271,908 8,719,071 9,077,502 9,505,696 9,701,963 9,690,296 9,289,701 9,487,637 9,701,063 10,226,584 11,141,770 11,407,445 2,000, / / / / / / / / / / / / / /07 Fiscal Year July Final 2008 Transit Development Plan
27 Table 2-4 provides ridership data by route for FY 2006/07. Overall, PSTA fixed-route ridership exceeded 11.4 million in FY 2006/07 with a system-wide average of passengers per revenue hour and 1.27 passengers per revenue mile. Routes 18, 19, and 52 each topped the 1 million mark for overall ridership with a combined total of 3.6 million passenger trips in FY 2006/07. Due to route enhancements, ridership has increased on the top 10 PSTA routes, which now carry 66.4 percent of all PSTA passengers (see Map 2-3). Ridership also increased on the commuter routes by 18.2 percent between FY 2005/06 and FY 2006/07. Ridership on express routes and shuttle/circulator routes decreased by nearly 9 percent between FY 2005/06 and FY 2006/07. Table 2-5 provides ridership by route for the first eight months of FY 2007/08. Thus far in FY 2007/08, ridership has increased 9.6 percent system-wide, with very significant growth on Routes 4, 15, 32, 66, 76, 78, 80, 93, and 444. July Final 2008 Transit Development Plan
28 Table 2-4 Fixed-Route Service: Ridership Analysis by Route (FY 2006/07) Passengers per Revenue Hour Revenue Hours FY 2006/07 FY 2005/06 Passengers per Revenue Mile Revenue Miles Total Ridership Total Ridership Percent Change (FY 2005/06 to FY 2006/07) Local Routes , ,897 46,498 51, % , , , , % , , , , % , , , , % , , , , % , , , , % , , , , % , ,674 1,215,999 1,122, % , ,852 1,401,929 1,323, % , , , , % , ,219 50,896 48, % , , , , % , ,648 30,808 41, % , , , , % , , , , % , ,623 1,013, , % , , , , % , , , , % , , , , % , , , , % , , , , % , , , , % , , ,946 97, % , ,517 90,500 98, % , , , , % , , , , % , , , , % , , ,456 93, % , , , , % , , , , % , , , , % , ,469 50,393 49, % 777/ , , , , % Subtotal , ,461,663 11,002,619 10,736, % July Final 2008 Transit Development Plan
29 Table 2-4 (continued) Fixed-Route Service: Ridership Analysis by Route (FY 2006/07) Passengers per Revenue Hour Revenue Hours FY 2006/07 FY 2005/06 Passengers per Revenue Mile Revenue Miles Total Ridership Total Ridership Percent Change (FY 2006/07 to FY 2007/08) Shuttle/Circulator Routes , ,508 34,224 33, % ,321 11,323 13, % , ,065 6,407 6, % , % Subtotal , ,743 52,843 57, % Commuter Routes , ,190 34,008 34, % , ,043 21,845 19, % , ,655 18,639 17, % , ,086 45,759 28, % , ,089 32,846 29, % Subtotal , , , , % Express Routes , ,569 54,639 62, % , ,781 35,059 35, % Subtotal , ,350 89,698 98, % Special Service Revenue % Looper Service 109, , % Grand Total , ,969,819 11,407,445 11,142, % 1 This route is also known as the Suncoast Beach Trolley SM. 2 Special Service Revenue includes Airport Fire Department, Alternative Transportation Week, Clearwater Jazz Fest, Dunedin High School, Federal Transit Association, Oldsmar Oktoberfest, Stuff-A-Bus, Pinellas County Economic Development Department, Pinellas County Department of Public Affairs, Pinellas Park Christmas Parade, and Pinellas County Sherriff's Department. 3 Looper service is a non-profit service that receives an annual grant from PSTA. It leases PSTA trolleys. Fares are $0.25 and it runs between the Renaissance Vinoy Resort and Golf Club and the Arts District in St. Petersburg. July Final 2008 Transit Development Plan
30 I TRANSIT DEVELOPMENT PLAN P i n e l l a s S u n c o a s t T r a n s i t A u t h o r i t y Pasco County ALT US 19 PINELLAS AVE KLOSTERMAN RD ALDERMAN RD KEYSTONE RD TAMPA RD EAST LAKE RD Pinellas County Hillsborough County Map 2-3: Top 10 Fixed Routes by Ridership Legend Top 10 Routes PSTA Bus Routes Major Roads CURLEW RD SR 580 MAIN ST SUNSET POINT RD MCMULLEN BOOTH RD DREW ST GULF BLVD MISSOURI AVE KEENE RD BELCHER RD SR 686 EAST BAY DR GULF-TO-BAY BLVD US 19 ROOSEVELT BLVD Old Tampa Bay SR 688 ULMERTON RD WALSINGHAM RD 102ND AVE PARK BLVD 113TH ST ALT US 19 SEMINOLE BLVD BRYAN DAIRY RD 118TH AVE PARK BLVD 49TH ST N ROOSEVELT BLVD 4TH ST N Gulf of Mexico GULF BLVD WELCH CSWY PARK ST 54THAVE N 38TH AVE N CENTRAL AVE 49TH ST N 22ND AVE N 5THAVE N 22ND AVE S 54THAVE S DR MARTIN LUTHER KING JR ST N Tampa Bay Miles
31 Table 2-5 Fixed-Route Service: Ridership Analysis by Route (October to May) Passengers per Revenue Hour Revenue Hours FY 2007/08 FY 2006/07 Passengers per Revenue Revenue Total Total Mile Miles Ridership Ridership Percent Change (FY 2006/07 to FY 2007/08) Local Routes , ,190 29,534 32, % , , , , % , , , , % , , , , % , , , , % , , , , % , , , , % , , , , % , , , , % , , , , % , ,071 32,324 36, % , , , , % , ,545 22,681 20, % , , , , % , , , , % , , , , % , ,364 88,277 85, % , , , , % , , , , % , , , , % , , ,870 96, % , , , , % , ,126 79,567 75, % , ,156 64,575 62, % , ,248 95,218 86, % , , , , % , ,419 84,859 81, % , ,742 84,614 68, % , , , , % , , , , % , , , , % , ,398 34,601 34, % 777/ , , , , % Subtotal , ,840,745 7,978,778 7,281, % July Final 2008 Transit Development Plan
32 Table 2-5 (continued) Fixed-Route Service: Ridership Analysis by Route (October to May) Passengers per Revenue Hour Revenue Hours FY 2007/08 FY 2006/07 Passengers per Revenue Mile Revenue Miles Total Ridership Total Ridership Percent Change (FY 2006/07 to FY 2007/08) Shuttle/Circulator Routes , ,716 28,175 21, % ,251 4,899 8, % , ,000 5,601 4, % N/A Subtotal , ,966 38,675 34, % Commuter Routes , ,215 22,078 21, % , ,102 21,934 14, % , ,239 12,427 12, % , ,180 32,650 30, % , ,305 23,677 21, % Subtotal , , ,766 99, % Express Routes , ,390 37,945 36, % , ,236 24,990 23, % Subtotal , ,626 62,935 59, % Grand Total 2, , ,209,378 8,193,154 7,475, % 1 This route is also known as the Suncoast Beach Trolley SM. 2 There have been 60 passenger trips provided under Special Service Revenue ridership to date in FY 2007/08. 3 Looper ridership is not included in the grand total figure Service Frequency Fifteen (35%) of PSTA's routes have peak-hour frequencies of 30 minutes and seven (16%) have peak-hour frequencies of 20 minutes or less. Fourteen routes (33%) have 60-minute, peak-hour frequency. Two routes operate with headways that are greater than 120 minutes. The five commuter routes operate between four and 10 one-way trips per day Increases in Service In FY 2005/06, PSTA undertook the largest single service increase in its history. Service frequency was increased on six routes (Routes 5, 7, 15, 18, 78, and 79). Commuter Route 97, which travels between St. Petersburg and Mid-County, was added to the system. Other service improvements were also initiated at this time. In 2006/07, PSTA July Final 2008 Transit Development Plan
33 increased frequency on Routes 4, 59, 60, and 74. Evening service was extended on Routes 11, 18, 38, 52, 59, 60, 61, 62, 66, 74, and 79. Map 2-4 displays the changes to the system that were undertaken in FY 2005/06 and FY 2006/ DEMAND RESPONSE SERVICE PSTA offers a door-to-door, shared ride service that is often referred to as Demand Response Transportation (DART). DART is provided as part of PSTA s efforts to meet the requirements of the ADA. DART service must be reserved one day in advance. Passengers are picked up in sedans or wheel-chair accessible vans. Demand response service is provided for those individuals who cannot use fixed-route services. The ADA requires that transit systems provide demand response service to anyone who cannot access the fixed-route system and lives within and travels to within ¾ miles of the fixed route. While ADA implementing regulations require complementary paratransit service for those persons whose disability prevents use of the fixed-route system, it is expected that as new equipment and facilities are put into place, transportation for persons with disabilities will largely be provided by fixed-route services. This shift will cause demand for demand response services to decline. The PSTA demand response system serves 21 incorporated communities, plus a portion of the unincorporated areas of Pinellas County. The origin and destination of demand response trips are closely monitored to ensure that all trips correspond with a ¾-mile corridor dimension of fixed-route service availability. The ADA does not require complementary paratransit service in areas where the provider does not have the legal authority to operate. In Pinellas County, these areas include Belleair Beach, Belleair Shores, and Kenneth City. In addition, complementary paratransit service does not have to be provided along fixed routes that provide only commuter service, such as PSTA s commuter routes Response Time Next-day scheduling is provided until 5:00 P.M. Pick-up times are negotiated with the rider in an effort to maximize the multi-loading of passenger trips and avoid capacity constraints. However, pick-up times in excess of one hour must be agreed to by the rider (i.e., the rider has the right to require a pick up time within an hour before or after his/her requested time). Pick-up times are negotiated whenever possible in an effort to increase the possibilities for multi-loading trips and to maximize the efficiency of the demand response system. July Final 2008 Transit Development Plan
34 I TRANSIT DEVELOPMENT PLAN P i n e l l a s S u n c o a s t T r a n s i t A u t h o r i t y Pasco County ALT US 19 PINELLAS AVE KLOSTERMAN RD ALDERMAN RD KEYSTONE RD TAMPA RD CURLEW RD EAST LAKE RD Pinellas County Hillsborough County Map 2-4: FY 2005/06 & FY 2006/07 Service Changes Legend No Change Extended Service Increased Frequency Increased Frequency & Extended Service Realignment of Service Major Roads SR 580 MAIN ST SUNSET POINT RD MCMULLEN BOOTH RD DREW ST GULF BLVD MISSOURI AVE KEENE RD BELCHER RD SR 686 EAST BAY DR GULF-TO-BAY BLVD US 19 ROOSEVELT BLVD Old Tampa Bay SR 688 ULMERTON RD WALSINGHAM RD 102ND AVE PARK BLVD 113TH ST ALT US 19 SEMINOLE BLVD BRYAN DAIRY RD 118TH AVE PARK BLVD 49TH ST N ROOSEVELT BLVD 4TH ST N Gulf of Mexico GULF BLVD WELCH CSWY PARK ST 54THAVE N 38TH AVE N CENTRAL AVE 49TH ST N 22ND AVE N 5THAVE N 22ND AVE S 54THAVE S DR MARTIN LUTHER KING JR ST N Tampa Bay Miles
35 2.3.2 Trip Purposes PSTA does not prioritize trips by purpose. Trips are scheduled on a first-come, firstserved basis. Subscription service is not required according to ADA implementing regulations; however, eligible passengers can schedule subscriptions for repetitive trips for employment and acute medical treatment Hours and Days of Service Demand response transportation is a complement to PSTA s regular bus service. Therefore, service for eligible passengers is available during the same days and hours as the regular bus service for any given trip request. In this way, comparable service levels are maintained on both the fixed-route and demand response systems Fares Under the ADA, fares for demand response services cannot be more than twice the rate of fixed-route services offered at a similar time. In compliance with this rule, PSTA charges a one-way cash fare of $3.00 for demand response service, while a one-way cash fare on fixed-route service is $1.50. PSTA does not sell discounted fare passes for demand response service. Currently, demand response trips that would require more than one bus are not charged a higher fare. Table 2-6 provides the current fare rates for the demand response system Operating Budget Table 2-6 Demand Response Service: PSTA Fare Structure (Effective ) Fare Type Cost Demand Response Cash Fare $ Ride Punch Ticket $ Ride Demand Response Punch Ticket $30.00 Note: Demand response service is for people who, because of their disability, are unable to independently use the regular, accessible PSTA buses. Certification and reservations are required. Prior to October 1995, private operators were responsible for the provision of a large portion of PSTA demand response trips. In order to achieve additional cost savings, PSTA amended its contract with these local operators to allow for complete privatization July Final 2008 Transit Development Plan
36 of all functional areas of PSTA demand response service, effective October Privatization also presented an opportunity to proceed with full next-day scheduling earlier than anticipated, effective January 1996, rather than January 1997 as originally proposed. With full privatization of demand response service, the unit cost per passenger trip declined from $14.12 in FY 1994/95 to $9.52 in FY 1995/96 (i.e., a decrease of 32.6 percent). Because new rates are negotiated, new contracts with private operators often lead to an increase in cost per trip such as in FY 1998/99 and FY 2003/04. It is expected that the new contract awarded at the beginning of FY 2008/09 will not deviate from this trend. Table 2-7 provides detailed cost per passenger data for demand response services. The current contract for demand response service was executed in October A new contract will be awarded at the beginning of FY 2008/09 following a Request for Proposals process. PSTA budgeted $4.9 million in FY 2007/08 for demand response service, which is nearly nine percent of PSTA s annual operating budget. July Final 2008 Transit Development Plan
37 Table 2-7 Demand Response Cost per Passenger (FY 1994/95 to FY 2006/07) Fiscal Year Total Expenses 1,2 Total Trips Unit Cost per Trip 1994/95 $2,354, ,711 $ /96 $1,707, ,346 $ /97 $1,865, ,637 $ /98 $2,077, ,236 $ /99 $3,090, ,305 $ /00 $3,394, ,437 $ /01 $3,664, ,353 $ /02 $3,808, ,777 $ /03 $4,089, ,383 $ /04 $4,375, ,560 $ /05 $4,459, ,413 $ /06 $4,524, ,714 $ /07 3 $4,534, ,237 $ Expenses for the demand response system exclude fare revenues collected by PSTA s contract carriers. 2 Demand response expenses include a subsidy for Looper service. 3 Expenses for FY 2006/07 are un-audited. Demand response for the first seven months of FY 2007/08 is down almost nine percent when compared to demand response ridership in FY 2006/07. See Table 2-9. July Final 2008 Transit Development Plan
38 Table 2-8 Growth in Demand Response Trip Volume Fiscal Year Total Ridership % Change From Previous Year 1993/94 189, % 1994/95 166, % 1995/96 179, % 1996/97 183, % 1997/98 192, % 1998/99 237, % 1999/00 249, % 2000/01 242, % 2001/02 239, % 2002/03 242, % 2003/04 257, % 2004/05 255, % 2005/06 258, % 2006/07 256, % Figure 2-5 Growth in Demand Response Trip Volume 300, , , , , , , , , , , , , , , , , , ,367 50, / / / / / / / / / / / / / /07 July Final 2008 Transit Development Plan
39 Table 2-9 Demand Response Ridership Analysis (October to June) Month Passengers FY 2007/08 FY 2006/07 Percent Change October 21,620 23, % November 20,107 21, % December 19,137 20, % January 20,487 22, % February 19,672 21, % March 19,446 23, % April 20,049 21, % May 20,226 22, % June 19,228 19, % Total 179, , % 2.4 NEAR-TERM FUNDING SHORTFALL The current adopted operating budget for FY 2007/08 is $56.2 million for both fixed-route and demand response service. Ad valorem taxes from the 19 communities participating in the Authority (excluding Belleair Beach, Belleair Shores, Kenneth City, St. Pete Beach, and Treasure Island) and property within unincorporated Pinellas County generate 65.9 percent of revenue for PSTA. St. Pete Beach and Treasure Island, which are not part of the Authority, contract with PSTA for transit services. Belleair Beach, Belleair Shores, and Kenneth City do not have transit service provided by PSTA. Approximately 19.4 percent of operating revenue is from passenger revenue, and another 10.0 percent of revenue is from state and federal grants. The remaining 4.7 percent is derived from special transit fares, auxiliary revenue (e.g., bus and shelter advertising), investment income, non-transportation revenue, State of Florida reimbursement for fuel taxes, and purchased service (see Table 2-10 and Figure 2-6). Table 2-10 Operating Budget by Revenue Source (FY 2007/08) Revenue Source Revenue Generated % of Total Revenue Ad Valorem Taxes $37,076, % Passenger Revenue $10,890, % State & Federal Grants $5,623, % Fuel Tax Reimbursement & Misc. Revenue $2,655, % Total $56,245, % Note: The above breakdown is from the FY 2007/08 adopted budget. July Final 2008 Transit Development Plan
40 Figure 2-6 Fixed-Route Service: Operating Budget by Revenue Source (FY 2007/08) State and Federal Grants 10.0% 19.4% 4.7% Passenger Revenue Fuel Tax Reimbursement & Misc. Revenue 65.9% Ad Valorem Taxes On January 29, 2008, the citizens of Florida voted to enact Amendment 1, which rolled back ad valorem rates. As ad valorem taxes make up 65.9 percent of PSTA s revenue, the loss of revenue combined with rapidly increasing fuel prices has left PSTA with a deficit in the FY 2008/09 budget. The deficit is approximately $5.8 million. The following options are being explored by the PSTA Board in an effort to balance the budget. The PSTA Board of Directors first met May 5, 2008, for a special workshop to discuss how to balance the FY 2008/09 budget. The finance committee of the Board of Directors then followed with a meeting on May 16, The Board is tasked with the decision as to how to balance the budget for FY 2008/09. Options include the following: carryover from FY 2008 budget, service modifications, reductions to the FY 2008/09 annual operating budget, fare increases, use of general reserves, and millage rate increases. Details on these options are presented in the following subsections. recommendations and the schedule for budget approval are also presented below. PSTA staff July Final 2008 Transit Development Plan
41 2.4.1 Carryover from FY 2007/08 Budget PSTA staff projects approximately $0.94 million from the FY 2007/08 budget will be unspent. Staff recommends that this surplus be carried forward into FY 2008/09 in order to alleviate some of the projected budget shortfall Service Modifications To assist the Board of Directors in its decision as to whether or not to cut service in order to balance the FY 2008/09 budget, PSTA staff analyzed and presented five service modification scenarios: no change, 2.5 percent reduction, 5 percent reduction, 7.5 percent reduction, and 10 percent reduction in fixed-route service. PSTA staff recommended the 5-percent service reduction plan, which would result in 41,250 fewer hours of service and the elimination of 22 transportation positions, one administration position, and three bus maintenance positions. In total, the 5-percent reduction plan would eliminate 26 positions in the FY 2008/09 budget. The 5-percent reduction plan requires the following service modifications: restructuring five routes, re-aligning 17 (possibly 18) routes, eliminating selected trips on 21 routes, reducing frequency on five (possibly seven) routes, eliminating Sunday service on one route, and eliminating three routes. In most cases, the eliminated routes would be served by nearby parallel routes. It is estimated that this plan will save PSTA $1.43 million in FY 2008/09. This service modification plan was approved on June 25, Reductions to the FY 2008/09 Annual Operating Budget PSTA staff also explored further reduction of the budget for FY 2008/09. recommended cutting several budget items: PSTA staff $72,000 for lobbying, $192,000 for bus stop custodial services, $750,000 in labor, fringe benefits, and DART contract fees, July Final 2008 Transit Development Plan
42 $150,500 in bus part purchases, and $200,000 in advertising. Other costs savings that were less than $50,000 each were identified. These cuts were proposed by each department and include cuts in training, field observations, custodial services, and office equipment repair. These cuts, when combined with the major budget cuts above, equal $1,524,222. PSTA is currently under a soft hiring freeze. Only mission critical positions will be filled if there is a job vacancy Fare Structure Modifications Another option to help balance the budget in FY 2008/09 is to increase revenues by increasing fares. On June 25, 2008, the PSTA Board approved an increase in fares that would extend across almost all fare categories. PSTA staff believes that ridership will remain constant despite the fare increases. Table 2-11 provides an overview of the approved fare increase by cash or pass. Under the proposed fare structure, the base cash fare would increase by $0.25 to $l.75. PSTA staff projects an increase in revenue of $2 million from the fare increase, which would help offset increasing operational costs Use of General Reserves Another option for bridging the funding shortfall projected for FY 2008/09 is to use reserve funds. Approximately $5.4 million in reserve funds are unassigned. The Board could tap a portion of this resource for next year s budget Millage Rate Increase PSTA s Board of Directors can increase the millage rate that is levied on behalf of PSTA as part of the ad valorem taxes in Pinellas County. It is projected that the current millage rate of will generate approximately $34.2 million in FY 2008/09. If the Board were to increase the rate by mills to mills, revenues would increase to approximately $37.3 million. If the Board were to increase the rate by mills to mills, revenues would increase to approximately $40.3 million. The millage rate is capped by law at 0.75 mills. July Final 2008 Transit Development Plan
43 In January 2008, Florida voters approved Amendment One which rolled back property tax rates. This vote suggests that voters may not support future increases in the millage rate by the PSTA Board. Therefore, property taxes may not be a realistic future funding source for PSTA. July Final 2008 Transit Development Plan
44 Table 2-11 Effects of Fare Increase on Revenue and Ridership (FY 2008/09) Current Fare Structure Revenue per Ride Proposed Fare Structure Revenue per Ride Fare Increase Percent Change Fare Category Price Price Non-Fare Categories Free $0.00 Free $0.00 $ % Full Cash Fare (Cash or Token) $1.50 $1.50 $1.75 $1.75 $ % Special Citizen Reduced Cash Fare $0.75 $0.75 $0.85 $0.85 $ % Student Reduced Cash Fare $1.00 $1.00 $1.25 $1.25 $ % Premium Cash Fare $2.50 $2.50 $3.00 $3.00 $ % Special Citizen Reduced Premium Cash Fare $1.25 $1.25 $1.50 $1.50 $ % DART $3.00 $3.00 $3.50 $3.50 $ % Daily Full Fare Unlimited Ride GO Card $3.50 $0.93 $4.00 $1.08 $ % Daily Reduced Fare Unlimited Ride Go Card $1.75 $0.48 $2.00 $0.58 $ % 7-Day Unlimited Ride GO Card $15.00 $0.63 $20.00 $1.04 $ % 31-Day Unlimited Ride GO Card $45.00 $0.59 $55.00 $1.03 $ % 31-Day Reduced Fare Unlimited Ride GO Card $30.00 $0.44 $35.00 $0.61 $ % 20-Ride Premium GO Card (Routes 100X & 300X) $40.00 $2.00 $48.00 $2.40 $ % Passport 1 $85.00 $0.57 $85.00 $0.57 $ % 7 -Day Youth Platinum Pass $10.00 $0.57 $12.50 $0.71 $ % Summer Youth Haul Pass $30.00 $0.40 $35.00 $0.47 $ % DART 10-Ride $30.00 $3.00 $35.00 $3.50 $ % 1 Only 150 passes are sold annually so no increase is proposed at this time. July Final 2008 Transit Development Plan
45 2.4.7 PSTA Staff Recommendations PSTA staff presented the PSTA Board with a set of recommendations to begin balancing the budget. The recommendations leave the Board a $1.3 million deficit to find funding to cover. Table 2-12 presents PSTA staff s recommendations for the budget. Table 2-12 PSTA Staff Budget Recommendations Budget Category Funding Level FY 2008/09 Budget Gap 1 ($5,801,582) FY 2007/08 Budget Carryover 2 $941,300 Reductions to Annual Operating Budget 3 $1,524,222 Fare Increase Revenue 4 $2,000,000 Remaining Shortfall ($1,336,060) 1 The budget gap was estimated May 5, This funding source is discussed in Section These cuts would include the departmental budget cuts presented in Section Additional revenue to be generated from current ridership paying increased fares. See Section Budget Approval Schedule The Board of Directors will meet July 16, 2008, for its first budget workshop. The Board will adopt a tentative millage rate at its regular meeting July 23, The second Board budget workshop is scheduled for August 27, Budget public hearings will be held September 3 and 10, The Board will adopt the final budget on September 10, SERVICE ANALYSIS PROCESS PSTA is in the process of developing a more formal service analysis process to be conducted annually. This process will be presented to the PSTA Board of Directors at a future Board meeting. July Final 2008 Transit Development Plan
46 2.6 PEER REVIEW ANALYSIS A peer review analysis was conducted for PSTA to compare its performance with other transit agencies with similar operating characteristics. The peer review was conducted using validated FY 2005/06 National Transit Database (NTD) reports for all selected peers. Selected performance indicators, effectiveness measures, and efficiency measures are provided throughout this section to illustrate the performance of PSTA s fixed-route system relative to the selected peer groups. The identification of PSTA peers was based on a number of factors. The first factor is geography. Transit agencies from the southeastern and central U.S. were considered for the peer analysis: Alabama, Arkansas, Louisiana, Florida, Georgia, Kentucky, Mississippi, Missouri, North Carolina, South Carolina, Tennessee, Texas, and Virginia. To further narrow the field, fixed-route systems meeting this geographical requirement were analyzed based on seven factors, as listed below. vehicles operated in maximum service passenger trips revenue miles revenue hours total operating expense service area population service area population density Using these criteria, the following Florida and non-florida transit agency peers were identified as peers for PSTA. Greater Richmond Transit Company - GRTC (Richmond, VA) Hillsborough Area Regional Transit Authority - HART (Tampa, FL) Jacksonville Transportation Authority - JTA (Jacksonville, FL) Kansas City Transportation Authority - The Metro (Kansas City, MO) Memphis Area Transit Authority - MATA (Memphis, TN) Transit Authority of River City - TARC (Louisville, KY) These peers are considered PSTA s current peers as they had similar operating characteristics to PSTA in FY 2005/06. PSTA staff also wanted to understand how the system would be expected to change if it were to grow in accordance with the vision July Final 2008 Transit Development Plan
47 presented in Section 5. PSTA s vision seeks to attain the doubling of ridership to approximately 23.4 million annual trips in 10 years. The following three systems were selected as PSTA s future peers because they currently serve between 20 and 26 million trips annually. Central Florida Regional Transportation Authority - LYNX (Orlando, FL) Charlotte Area Transit System CATS (Charlotte, NC) Southwest Ohio Regional Transit Authority go Metro (Cincinnati, OH) Table 2-13 provides data for the seven factors used to identify the nine peers selected for the peer group analysis. Three types of measures are used to compare PSTA to its peers: performance measures, effectiveness measures, and efficiency measures. Performance indicators include ridership, level of service, and expenses. Effectiveness measures utilize a system s performance indicators and refine them to measure the extent to which various service-related goals are being achieved. Categories of effectiveness measures include service supply, service consumption, and quality of service. Each of these categories is represented by one variable: vehicle miles per capita, passenger trips per revenue mile, and revenue miles between system failures, respectively. Efficiency measures examine the relationship between a system s level of output and the corresponding resources necessary to achieve that output. Categories of efficiency measures include operating expense per passenger trip, operating expense per revenue mile, and farebox recovery ratio. July Final 2008 Transit Development Plan
48 Vehicles Operated in Maximum Service Table 2-13 FY 2006 Peer Group Operating Characteristics Passenger Trips Revenue Miles Revenue Hours Total Operating Expense Service Area Population Service Area Population Density Current Peers GRTC ,449,342 4,744, ,640 $30,713, ,572 1,980 HART ,434,557 6,962, ,023 $48,290, ,252 2,277 JTA ,125,128 10,157, ,326 $59,677, ,453 3,419 The Metro ,363,212 9,329, ,815 $60,339, ,159 1,963 MATA ,519,005 6,432, ,478 $37,654, ,627 3,086 PSTA ,021,266 8,550, ,734 $40,680, ,705 3,901 TARC ,669,924 7,775, ,942 $49,065, ,756 2,667 Average ,511,776 7,707, ,851 $46,631, ,361 2,756 Future Peers CATS ,671,841 12,206, ,068 $68,852, ,310 1,531 go METRO ,294,117 11,016, ,841 $72,855, ,303 3,226 LYNX ,624,906 13,593, ,844 $70,854,096 1,536, Average ,530,288 12,271, ,584 $70,854,299 1,021,171 1,788 Source: National Transit Database, Federal Transit Administration, July Final 2008 Transit Development Plan
49 2.6.1 Peer Review Analysis: Current Peers In this analysis, PSTA is compared to six current peers using NTD data from FY 2005/06. The following conclusions can be drawn from the information presented in Table PSTA carried approximately 12 percent fewer passengers annually than the current peer group, but PSTA operated about 11 percent more revenue miles annually. PSTA s operating expenses were almost 13 percent less than the current peer group average. PSTA traveled over 8 percent fewer miles per capita than the current peers. At 18.9 passenger trips per revenue hour, PSTA operated approximately 17 percent fewer passenger trips per revenue hour than the current peer average. PSTA provided 1.29 passenger trips per revenue mile while the current peer average was 1.72, a 25 percent difference. PSTA traveled 48 percent fewer miles between system failures than the current peers. PSTA s operating expense per revenue hour and revenue mile were lower than its current peers. Local funding per capita was significantly lower (32.0%) than the current peer group. Farebox recovery was 7.6 percent higher than the current peer average. Conclusion Local funding levels are lower for PSTA than its peers. Because funding is lower, PSTA provides less service than its peers. However, PSTA s higher farebox recovery rate suggests that PSTA is comparatively cost efficient. With a more robust dedicated funding source, PSTA could provide more service to the residents of Pinellas County and begin to catch up with the peer group. July Final 2008 Transit Development Plan
50 Performance Measures Table 2-14 Current Peers Analysis (2006 NTD Data) Peer Group Measure PSTA Minimum Maximum Mean PSTA Percent Deviation from Mean Passenger Trips 11,021,266 10,519,005 14,669,924 12,511, % Revenue Miles 8,550,652 4,744,467 10,157,162 7,707, % Operating Expenses $40,680,470 $30,713,769 $60,339,146 $46,631, % Effectiveness Measures Vehicle Miles per Capita % Passenger Trips per Revenue Hour % Passenger Trips per Revenue Mile % Revenue Miles Between System Failures 3,569 1,645 16,523 6, % Efficiency Measures Operating Expense per Passenger Trip $3.69 $2.28 $5.36 $ % Operating Expense per Revenue Mile $4.76 $4.76 $6.94 $ % Local Funding per Capita 1 $28.86 $21.65 $63.53 $ % Farebox Recovery Ratio 20.2% 12.9% 28.4% 18.8% 7.6% Source: National Transit Database, Federal Transit Administration, FY 2005/06. 1 Local funding is local revenue minus fare revenue, purchased transportation, and all other directly generated funds. Local funding per capita is calculated by dividing local funding by service area population. July Final 2008 Transit Development Plan
51 2.6.2 Peer Review Analysis: Future Peers Because PSTA has set a goal of doubling its ridership over the next 10 years, an additional peer review analysis has been conducted. The future peer analysis compares PSTA to larger systems. This analysis is meant to demonstrate where PSTA will need to grow and where it may identify economies of scale as it moves toward the goal of doubling its ridership. Systems were chosen for this comparison because they have greater than 20 million passenger trips per year, along with other performance characteristics that are similar to PSTA. The results of the future peer analysis are presented in Table conclusions can be drawn from this data. The following While operating 53 percent fewer trips and 30 percent fewer hours, PSTA s operating expenses were only 43 percent lower than the future peer group average. PSTA provided 27 percent fewer vehicle miles per capita than the future peer group. Passenger trips per revenue hour and per revenue mile were both about 30 percent lower than the average for the future peer group. Revenue miles between system failures were 51 percent lower than the future peer group. At $3.69, PSTA spent about 22 percent more per passenger trip than the future peer group average of $3.03. PSTA spent approximately 18 percent more per revenue mile than the future peer group. PSTA receives 32 percent less local funding than the future peer group average. PSTA s farebox recovery was over 20 percent as compared to the 25 percent average of the future peer group. July Final 2008 Transit Development Plan
52 Performance Measures Table 2-15 Future Peers Analysis (2006 NTD Data) Peer Group PSTA Minimum Maximum Mean PSTA Percent Deviation from Mean Passenger Trips 11,021,266 20,671,841 25,294,117 23,530, % Revenue Miles 8,550,652 11,016,477 13,593,266 12,271, % Operating Expenses $40,680,470 $68,852,814 $72,855,986 $70,854, % Effectiveness Measures Vehicle Miles per Capita % Passenger Trips per Revenue Hour % Passenger Trips per Revenue Mile % Revenue Miles Between System Failures 3, ,511 7, % Efficiency Measures Operating Expense per Passenger Trip $3.69 $2.88 $5.36 $ % Operating Expense per Revenue Mile $4.76 $5.21 $6.61 $ % Local Funding per Capita 1 $28.86 $28.12 $ $ % Farebox Recovery Ratio 20.2% 17.3% 33.0% 25.3% -20.1% Source: National Transit Database, Federal Transit Administration, FY 2005/06. 1 Local funding is defined as local revenue minus fare revenue, purchased transportation, and all other directly generated funds. Local funding per capita is calculated by dividing local funding by service area population. July Final 2008 Transit Development Plan
53 Conclusion As would be expected, PSTA provides less service than the future peer group. PSTA does not benefit from the same economies of scale that those systems providing more service benefit from. As PSTA grows, it is expected it would benefit from these economies of scale to a greater extent. July Final 2008 Transit Development Plan
54 (This page intentionally left blank.) July Final 2008 Transit Development Plan
55 Section 3 MILESTONES In the Milestones section, SPTA examines how it is meeting the needs and desires of the riding public. Improvements may include service improvements or infrastructure improvements on the fixed-route and demand response systems. PSTA s relationship with the public is also evaluated. Information on community outreach, public involvement, planning activities, and development coordination is presented in the following sections. 3.1 MILESTONE ACHIEVEMENTS: FIXED-ROUTE SERVICE PSTA is constantly examining and exploring ways to improve fixed-route service for its passengers. In the following sections, the efforts PSTA has undertaken to improve service in the last two years are presented FY 2007/08 Improvement Projects PSTA undertook several projects in FY 2007/08 to improve service and infrastructure. These improvements are described below. Community Shelter Design PSTA ordered and is currently installing 20 gable-roofed passenger shelters. These new shelters have a more streamlined appearance, which tends to blend in better in residential areas. Another 20 gable-roofed shelters are currently on order. Transfer Center Upgrade PSTA is undertaking concept planning for a new transfer center at the redeveloped Largo Towne Center. Public Art PSTA is trying to incorporate more public art into its facilities. Through a public-private venture, a new passenger shelter was designed to include public art (see Figure 3-1). The facility is adjacent to the new Kohl s Store in Seminole, Florida. Public art is also incorporated as part of the overall design in the new transfer center at the Largo Towne Center. July Final 2008 Transit Development Plan

56 Figure 3-1 New Passenger Shelter with Public Art Pre-Engineered Bathrooms PSTA is proceeding with the purchase of pre-engineered restrooms, which are manufactured off-site. The facilities are tailored to meet PSTA s design specifications. The completed structure is shipped directly to the site and installed. It takes just days to install and is ready for use without site disruption. The first application is programmed for the 34 th Street Transfer Facility adjacent to PSTA s Administration building. Credit and Debit Card Acceptance Passengers can now use their credit and debit cards to purchase bus passes at PSTA customer service centers and online FY 2006/07 Improvement Projects Service and infrastructure improvement projects undertaken in FY 2006/07 are described below. Improved Service Frequency Routes 59 and 74 were enhanced to provide 20-minute, peak-period service frequency. Routes 4 and 60 were enhanced to provide 15- and 20-minute weekday service frequency, respectively. These improvements went into effect in June These service enhancements provide a nucleus of very frequent fixed-route service for intracounty trips. July Final 2008 Transit Development Plan
57 Evening Service Later evening service was implemented on Routes 11, 18, 38, 52, 61, 62, 66, and 79, effective February 11, Routes 59, 60, and 74 were enhanced with later evening service improvements effective June Transfer Center Upgrade The Central Plaza Intermodal Terminal rehabilitation project included concrete, sewer, and utility repair to correct structural defects and provide additional clear space for bus movements. A new transfer center was established on South Clearwater Beach for connections between the Suncoast Beach Trolley SM and Route 80. Both of these projects were completed in February Technology Improvements The installation of Automatic Passenger Counters (APCs) on 36 buses is now complete. These units record passenger activity by stop and use sensors that record wheelchair ramp and bike rack deployments as well. This information is utilized to prioritize bus stops for additional passenger amenities, monitor ridership activity by time of day, review running times, and monitor schedule adherence by route segment. Another five units are on order. After these five new APCs are installed, 25 percent of peak-period buses will be APC-equipped. Bus Stop and Accessibility PSTA is improving accessibility at bus stops throughout the service area. This includes passenger landing pads, curb retrofits, and connectivity to adjacent sidewalks that provide a complete accessible route for passenger travel. 3.2 MILESTONE ACHIEVEMENTS: DEMAND RESPONSE SERVICE The following summary reflects service improvements implemented pursuant to Americans with Disabilities Act (ADA) complementary paratransit service requirements. Paratransit Feeder Connections Demand response service has been utilized for connections to fixed routes when there are architectural barriers, which in combination with a person s disability, impede or prevent fixed-route travel. When these circumstances exist, applicants for demand response service are certified for feeder connections to/from transfer points where they can access fixed-route service. These registrants are also provided with a courtesy bus pass for fixed- July Final 2008 Transit Development Plan
58 route travel. The feeder service program provides access to the fixed-route system for persons with disabilities, which is the primary emphasis of the ADA. In-Person Assessments and Travel Training Some applications for demand response service require a face-to-face interview, which provides more detailed information regarding the person s disability and travel capabilities. In-person assessments are scheduled after a demand response service application is received and reviewed by staff. This application provides basic information regarding the person s disability and travel needs. The in-person assessment is utilized on an asneeded basis as part of the overall eligibility determination process. The reviewer s written report is incorporated into the applicant file before a final eligibility determination is rendered. The interview is tailored to the person s particular disability and provides an opportunity for the reviewer to inform the applicant about the regular bus system, accessibility features, passenger amenities, bus pass programs, and the use of travel aids for specific disabilities. Travel training is offered to applicants who have the potential to use the regular bus system, but do not possess the skills and/or knowledge necessary for travel. In-person assessments provide an opportunity to market travel-training assistance and determine whether an applicant is a candidate for travel training. Group travel-training assistance is sometimes provided for individuals with common origins and/or destinations, particularly for assisted living facility residents participating in same day treatment programs. Upgraded Computer Software The contract carrier for PSTA s Demand Response Transportation (DART) service installed new software that allows the system to calculate the pickup time for DART clients based on the following criteria: appointment time, load time, and travel time. When a client calls the system, the reservationist asks for the client s appointment time and date. Once this information is entered, the system will calculate the best time for the pickup to ensure the client arrives at his/her destination prior to the scheduled appointment. The computer also keeps a running account of trip volume in 15-minute July Final 2008 Transit Development Plan
59 increments. Based upon the availability of vehicles, the software system makes a determination if another trip can be scheduled during that 15-minute period. Once the computer determines the best available time for the pickup, the reservationist will be shown the available times in 15-minute increments. The reservationist then tells the client the available times, and the client selects his/her pickup time. The new software ensures that trips are scheduled when service is available and that the client reaches the destination in time for his/her appointment. Real-Time Monitoring Beginning in 2008, real-time monitoring of DART vehicles became possible with the installation of Mobile Data Terminals (MDTs) in the wheelchair-accessible vans and Global Positioning Systems (GPS) in the sedans. A video screen and terminal were installed in the Planning Department to allow PSTA staff to monitor vehicle movements as they occur. Voice communication, GPS mapping, and text messaging are all available to the operators, which allows for reduced time spent on the phone with dispatchers. Contract carrier staff monitor vehicle movements and can determine a vehicle s arrival time, location, and its speed in transit. Spot Checks and Compliance Monitoring A Planning Department staff member conducts daily spot checks of demand response vehicles. Trips are chosen at random. As operators arrive, a PSTA staff member checks schedule adherence based upon the vehicle s arrival time, checks the vehicle for safety equipment (e.g., first-aid kit and fire extinguisher that are up-to-date), and monitors the passenger s arrival. Since January 1st, 2008, nearly 600 spot checks have been performed. Passenger s Guide In April 2008, PSTA s Planning Department issued the first edition of the DART Passenger s Guide. The primary purpose of this guide is to provide more detailed information regarding the program to area agencies, which often have staff with questions as to the eligibility requirements for the program and DART service parameters. The Passenger s Guide is available in a downloadable format at demandresponse.htm. July Final 2008 Transit Development Plan
60 Courtesy Door Hanger A door hanger that can be hung on a door knob is used when a client cannot be found at the pickup address. The card indicates the time DART arrived for pickup, the name of the client, and driver number. On the back side of the card are a few basic rules governing DART service. The card also has telephone numbers if clients need to call for further assistance. Customer Courtesy Cards A card was developed to include the telephone numbers for both ambulatory and wheelchair transportation providers, as well as a telephone number the client can call with specific service comments, concerns, or compliments. On the back side of the card are the basic rules governing DART service and information to help the client comply with service regulations. These cards are provided to all clients by DART drivers so the client will have the telephone numbers for scheduling trips or to register a complaint associated with the carrier. 3.3 BUS STOP AMENITIES PSTA has developed a method for identifying which bus stops should receive which type of amenities. The Passenger Amenity Plan also helps PSTA prioritize which stops should receive the improvements first. Amenities may include shelters, lighting, benches, bike racks, and real-time passenger information Passenger Amenity Plan PSTA has developed a passenger amenity plan, which ensures amenities are provided at bus stops in a prioritized fashion. The plan provides for the identification and prioritization of bus stops that need amenities. PSTA s Transportation Department identifies potential locations through APC ridership data and passenger and bus operator requests. From this information, an installation schedule is developed. The plan calls for all bus stops to have benches as long as the layout and space provide for the safe provision of this amenity. Beyond a bench, bus stops are prioritized for additional amenities if they meet certain criteria which include the following: July Final 2008 Transit Development Plan
61 bus stops with a minimum of 20 to 25 passengers per day; bus stops serving large public or private facilities such as libraries, hospitals, municipal buildings, shopping centers, educational, residential and employment centers; or bus stops that frequently serve bicycle passengers. Stops meeting these criteria are prioritized for amenities beyond benches such as shelters and bike racks. If the criteria are met, the staff proceeds with securing the right of way and the permitting process. Once permitted, installation is scheduled. PSTA s Planning Department plans for the purchase of amenities in the annual Program of Projects submission Examples of Amenities Passenger amenities include items of comfort and convenience such as passenger benches and shelters. Improving the convenience of transit service for passengers and accommodating ridership growth through new and expanded facilities continues to be a major emphasis area for PSTA. PSTA has a number of amenities that it uses at various bus stops, depending upon passenger needs at the stop. These amenities are described below. Benches As part of an ongoing program, PSTA purchases passenger benches that require permanent installation and permit review prior to construction. These bench installations also include accessibility improvements to ensure that persons with disabilities have access to the fixed-route system. The passenger bench installation program complements the public seating program conducted through the Jaycees, thereby resulting in a maximum number of bus stops with seating available for passengers awaiting the arrival of their bus. Pinellas County. There are currently 2,087 passenger benches in In addition to traditional bus benches, PSTA is also experimenting with the Simme- Seat. Designed by a transit expert, the Simme-Seat is an innovative seating system consisting of opposing cantilevered seats attached to a bus stop pole. The streamlined profile is equally successful in residential or commercial areas, and the unit installs on existing sidewalks or adjacent concrete surfaces. These seats meet ADA requirements. Currently, there are 61 Simme-Seats installed in Pinellas County. July Final 2008 Transit Development Plan


62 Shelters A passenger bus shelter program was initiated by PSTA in Shelters are typically installed where high levels of bus stop boarding occur and at activity centers such as libraries, hospitals, municipal buildings, shopping centers, educational or residential facilities, and employment sites. There are currently 650 passenger shelters in Pinellas County (see Figure 3-2). PSTA tries to use shelters that complement surrounding architecture. To further this goal, PSTA uses prefabricated barrel-roofed and gableroofed shelters. Figure 3-2 Bus Shelter In 2006, PSTA began installing small footprint shelters with a cantilevered design (see Figure 3-3), which allows for placement immediately behind a sidewalk in the right-of-way. This shelter application allows PSTA to place a passenger shelter at boarding locations where minimal right-of-way exists, using shelter pads that are only 24 inches wide and placed directly behind the sidewalk. The new cantilevered shelter provides passenger seating, and standees have shelter while waiting on the sidewalk. A total of 10 units were installed as part of the initial demonstration project. July Final 2008 Transit Development Plan
 allow passengers to activate a flashing light as the bus approaches to alert the bus operator to stop at the bus stop (see Figure 3-4).")

63 Figure 3-3 Cantilevered Bus Shelter Lighting To enhance passenger safety and access during nighttime hours, PSTA uses solar lighting units to illuminate bus stops. These solar-powered lighting units (OmniLight ) allow passengers to activate a flashing light as the bus approaches to alert the bus operator to stop at the bus stop (see Figure 3-4). This is particularly important along poorly lit corridors or bus stops situated between light poles, making it difficult for bus operators to see waiting passengers during early morning or evening periods. addition, these units provide security lighting and route schedule illumination. Figure 3-4 OmniLight TM In Loading Pads PSTA has been working cooperatively with FDOT, Pinellas County, and local jurisdictions on the construction of passenger loading pads at PSTA bus stops whenever July Final 2008 Transit Development Plan
64 a roadway is resurfaced or reconstructed. These pads have been constructed along some of Pinellas County s major roadways and blanket permit authority is often granted by local jurisdictions. These pads provide a firm, stable surface for passenger loading and wheelchair deployment along PSTA fixed routes. While there is no requirement for construction of concrete bus stop pads, there are design standards that must be followed. These standards are listed below: minimum clear length of 96 inches, minimum clear width of 60 inches, connection to an accessible sidewalk (if available), and maximum slope of 2 percent. A total of $600,000 was programmed in PSTA s FY 2006/07 FTA Section 5307 grant for passenger loading pad installation system wide. This funding was utilized for curb retrofits as well. PSTA identified the following route corridors as priority for these types of improvements: 4, 18, 19, 52, 59, 60, 74, and 79. Curb Retrofits Higher volume, high-speed roadways are often designed as rural cross-sections, where a paved shoulder is present rather than a curb. The rural cross-section results in additional slope when low-floor buses deploy the wheelchair ramp. The added slope can present problems for boarding passengers who use the ramp. An innovation to mitigate these slope problems is to construct a concrete pad on a newly constructed curb, positioned at the bus stop with a curb ramp leading to the passenger loading pad. This design provides reduced slope and improves accessibility at select bus stops and is now programmed with roadway construction on rural cross-sections. A program of bus stop improvements is underway to add curb retrofits along many rural cross-sections (see Figures 3-5 and 3-6). July Final 2008 Transit Development Plan


65 Figure 3-5 Ramp Deployment at Newly Constructed Curb Figure 3-6 Newly Constructed Curb Signs Using FTA Section 5307 funding, the PSTA Marketing Department is preparing to upgrade bus stops including new, more visible signs and decals. As part of this upgrade, accessible bus stop signs will be purchased with raised and Braille characters. These accessible bus stop signs facilitate bus stop access for passengers with visual impairments. Bike Racks As bicycle passenger ridership continues to grow, PSTA is installing bike racks at strategic bus stops. Bike racks (sets of two) are purchased each year, so that passengers can secure their bikes at stops and travel on the fixed-route system. This is July Final 2008 Transit Development Plan
66 an extremely important passenger amenity as PSTA s Bikes-on-Buses program is the most productive in the State of Florida. 3.4 BUS AMENITIES In addition to bus stop amenities, PSTA is committed to improving the bus fleet as well. The following describes the amenities PSTA is incorporating on its bus fleet. Bike Racks PSTA initiated a Bikes-on-Buses program in January By installing bus racks on the front of all PSTA buses, passengers can ride a bike to the bus stop, load the bike onto the bus, ride to the destination bus stop, and unload the bike for continued use to their ultimate destination. Bike racks are now standard on all PSTA buses and trolleys. Since its inception, the Bikes-on-Buses Program has exceeded ridership expectations with 130,237 passenger trips in FY 2001/02 and steady increases since inception (see Table 3-1). In FY 2006/07, ridership was 322,726, which is an almost 148 percent increase since FY 2001/02. Of the 11.3 million passenger trips taken in FY 2006/07, nearly three percent were passengers with bicycles. Bus Replacement Table 3-1 Bikes-on-Buses Ridership (FY 2001/02 FY 2006/07) Fiscal Year Ridership % Increase 2001/02 130, /03 147, % 2003/04 163, % 2004/05 183, % 2005/06 233, % 2006/07 322, % In March 2005, PSTA replaced 21 of its 1993-model buses with new low-floor models. In addition, the 2005 and newer models include PSTA s new, distinctive colors and logo. A Special Congressional Appropriation of $9.6 million enabled PSTA to replace 31 of its 1994-model buses in This Special Appropriation allowed PSTA to utilize FTA July Final 2008 Transit Development Plan
67 Section 5307 formula funds to purchase 17 buses to expand the fleet and improve transit services. In February 2006, PSTA started the phase-out of the high-floor buses that had been used for fixed-route service, with delivery of 48 low-floor buses. The 48 buses included 31 replacement buses and 17 expansion buses. The remaining high-floor vehicles are MCI Commuter Coaches that are used for the commuter and express routes that serve Tampa. Trolley vehicles are being transitioned to low-floor buses with a trolley replica retro-fit. With this transition, the problems of malfunctioning wheelchair lifts will be reduced to a minimum and customers can board without navigating steps. Twenty-one buses were received in May Eleven of these were expansion buses to continue with the service frequency enhancement program for the most productive fixed routes. A total of 27 replacement buses and low-floor trolley replicas were placed in service in PSTA has purchased 117 new buses for its fleet of 205 buses in a four-year period (see Table 3-2). Table 3-2 Bus and Trolley Purchases (FY 2004/05 FY 2007/08) FY 2004/05 FY2005/06 FY2006/07 FY 2007/08 1 Total Replacement Buses Expansion Buses Total Real-Time Passenger Information System PSTA s FY 2007/08 FTA Section 5307 funding will be used to purchase equipment and software necessary for real-time passenger information system development. This purchase will enable passengers to check next-bus arrival information for specific bus stops via personal digital assistants (PDAs). The investment will also allow for next-bus arrival information signage at transfer centers. Biodiesel Pilot Program PSTA s Maintenance Department will be using a grant from the Environmental Protection Agency to implement the use of biodiesel on its fleet in FY 2008/09. The grant provides funding for purchasing biodiesel which is more expensive than traditional diesel fuel. Other local fleets may benefit with PSTA serving as the grant/project sponsor. July Final 2008 Transit Development Plan
68 Hybrid-Electric Bus Pilot Program PSTA is embarking on a hybrid-electric bus pilot program in FY 2007/08. Three 35-foot buses and seven trolleys will be hybrid-electric vehicles. Hybrid-electric buses cost approximately $200,000 more than a typical bus, but they also use less fuel and reduce emissions. The pilot program will allow PSTA to determine the feasibility of replacing its fleet with hybrid-electric buses. 3.5 COMMUNITY PARTNERSHIPS AND OUTREACH PSTA works closely with several local organizations in order to assist the other organizations in meeting the needs of their clients. These efforts allow PSTA to increase ridership and promote its services. WorkNET Pinellas Marketing staff work with case managers at WorkNET Pinellas to provide PSTA information that is relevant to jobseekers and employers. PSTA regularly participates in WorkNET job fairs. Community Presentations and Local Public Involvement Programs Upon request, the marketing staff will make special presentations to community and social groups. The presentations provide general information regarding PSTA service and programs. These presentations can include life skills presentations for bus travel, if appropriate. Employer s Choice Program PSTA s Marketing Department vigorously promotes the Employer s Choice program where employers and employees can enjoy tax benefits on transit purchases. There are three options under the program. Under the first option, an employer can fully subsidize the cost of public transit by purchasing transit passes for its employees. By doing this, employees get a tax-free transit benefit and the employer receives a tax deduction for the expense. Another option is to allow the employee to pay for the pass, but for the employer to enable the employee to pay for transit passes with pre-tax salary dollars. Finally, the employer and employees can share the cost of transit passes and share the tax benefit. Due to the great interest in this program, program information has been disseminated and presentations have been made to the following groups. July Final 2008 Transit Development Plan
69 National Mortgage Acceptance Wage Works Home Shopping Network Chiro Med-Arrowhead Management Adams Tank & Lift Merchants Association Pinellas Education Foundation McDonalds Home Builders of America Wired Commute Alden Beach Resort Ed White Hospital Adaptive Learning Systems City of St. Pete Tradewinds 4th Street Shrimp Store Don CeSar Resort Sterling Cleaners Federal Loan Source Pinellas County Batan Business Associates Sand Pearl Resort Speakers Bureau/ Show Me Service The PSTA Marketing Department has a very ambitious group of volunteers that offer presentations to community groups regarding the role of PSTA as a transportation provider, route and schedule information, and fare options. Also, "Show Me" service volunteers escort first-time riders on a complete round-trip journey that includes route schedule use, fare information, and travel tips. Accessible Bus Stop Signage In coordination with PSTA s TAC, new bus stop signs were developed to differentiate the bus stop from other poles along roadways. These tactile signs include raised and Braille characters for 100 select PSTA bus stops, which were identified through input from visually impaired passengers. Social Service Agency Coordination For many years, PSTA has leased surplus paratransit vehicles to area social service agencies to increase accessibility to the Transportation Disadvantaged (TD) system. Monthly, unlimited ride bus passes are provided by PSTA free of charge to approximately 12 agencies for use during the travel training process. Most recently, PSTA leased surplus staff cars for use by job coaches for supported employment programs. Staff also works with local agencies on the provision of passenger amenities including benches, shelters, curb cuts, and passenger loading pads for those bus stop locations serving agency clients. Inter-Agency Cooperation PSTA is a very active partner in transit and transportation planning efforts in Pinellas County. Staff attends monthly MPO meetings, MPO sub-committees meetings, and other important meetings: July Final 2008 Transit Development Plan
70 Bicycle Advisory Committee (BAC), Citizens Advisory Committee (CAC), Intelligent Transportation Systems (ITS) Committee, Local Coordinating Board (LCB), Pedestrian Transportation Advisory Committee (PTAC), PMI Steering Committee, Technical Coordinating Committee (TCC), and TBARTA Board and Transit Management Committee (TMC). PSTA staff participate in several regional forums that include the Joint Citizens Advisory Committee, the Joint Chairs Committee on Regional Needs and Priorities, and the Executive Transportation Team s efforts to locate intermodal terminal sites in the Tampa Bay area. Other activities involve assisting and supporting the Pinellas County government and all 24 cities. Staff attends coordination meetings with various county offices, divisions of city government that include planning departments, community development offices, and special meetings. Some of these meetings involve the review of development plans. PSTA actively works with local communities to review development and redevelopment plans in order to ensure that transit needs are addressed. Often, PSTA is successful in getting a developer to pay for passenger amenities along a bus line such as a bench, shelter, or transit center. In addition to those agencies within Pinellas County, PSTA also coordinates with HART, PCPT, and MCAT. PSTA, PCPT, and HART also share FTA Section 5307 formula funding and coordinate connecting services in the region. PSTA Website In February 2001, PSTA launched a website, Passengers can find information on fares, schedules, routes, etc. The site also provides trip planning services. The site is continually updated with minutes of the monthly Board meeting, special events, employment opportunities, planning information, and financial reports. At the end of the first year of operation, the website had received 100,576 visits. number of visitors increased to 460,059 in 2007, a 357 percent increase in six years. The July Final 2008 Transit Development Plan
71 Public Access Television The show Progressive Pinellas featured a story on BRT and the efforts of PSTA to develop a BRT network in Pinellas County. Bus Information Each bus has interior ad cards that address topics such as passenger seating and assistance, fares, Employer s Choice, Emergency Ride Home Program, service improvements, and PSTA Board meetings. 3.6 PUBLIC INVOLVEMENT EFFORTS For transit agencies, formal processes for gathering public input include activities such as focus groups, user groups and advisory committees, workshops, public hearings, surveys, and market research. These efforts are usually employed in response to a particular change in service or desire to improve services. PSTA uses these methods from time to time when circumstances indicate a need for this type of activity. PSTA also employs ongoing community outreach activities that complement the more traditional public involvement activities listed previously. These activities are described below. Household Travel Survey In 2007, PSTA conducted a household transit survey to ascertain information about household travel patterns and socio-demographic information about Pinellas County households (both those that use transit and those that do not). The results of this survey provided information to PSTA on how to improve service so as to capture new passengers. On-Board Survey In January 2007, PSTA conducted an on-board survey to gather input from its current passengers. A total of 2,970 PSTA bus passengers responded to the survey. This intensive public involvement effort provided valuable input from current transit users concerning service improvements, infrastructure improvements, and general satisfaction with the system. Major Employer Interviews Interviews were conducted with four major Pinellas County employers to gain information on the transportation needs of the working community. These interviews revealed that employers know very little about transit services in the community. July Final 2008 Transit Development Plan
72 Transit Advisory Committee The PSTA TAC comprises passengers and interested citizens that provide ongoing input to the PSTA staff and Board. The TAC meets monthly and provides input regarding service enhancement priorities and proposed service and fare modifications. Regular TAC bus ride reports provide information such as passenger volumes, activity at terminal and transfer facilities, construction activity and resulting problems/concerns, stop locations and spacing, bus operator commendations, and operational concerns. The membership assists with mid-range visioning, service modifications, and passenger surveys that facilitate planning efforts. PSTA Website Passengers can use PSTA s website to request new and improved transit services. Each request is reviewed by staff and a written or verbal response is provided to the passenger. Recently, a survey feature was added to the site which allows the public to provide feedback on proposed service modifications and route performance. Board of Director Meetings Each PSTA Board meeting includes an open forum when the public may comment on topics not on the Board Agenda. Before the Board votes on any action item, public input is also solicited. Customer Service The PSTA information line receives 800 to 1,200 calls per day Monday through Saturday, and 400 to 600 calls on Sundays and holidays. Customer service staff are located at Park Street Terminal, Central Plaza Intermodal Terminal, and Williams Park where bus passes are sold, route and schedule information is disseminated, and assistance is provided for passenger questions and concerns. Passengers may express concerns or provide comment through these venues. Bus Drivers Each bus operator receives customer service training and uses a form known as From the Driver Seat to document passengers complaints, concerns, or requests. The driver can also use the form to inform supervisors about issues that arise during daily service provision (e.g., proposed passenger amenities, damaged bus stops, additional areas of concern, etc.). Supervisors review these forms and look for opportunities for further review, investigation, and action. July Final 2008 Transit Development Plan
73 3.7 PLANNING STUDIES AND REGULATIONS As a member of an ever-evolving community, PSTA continuously monitors the activities of other organizations that may impact PSTA. To do this, PSTA reviews and contributes to reports and studies. A description of some of the planning studies currently under production in Pinellas County is provided in the following section. PSTA s participation in the production of the study or report varies from project to project. A review of the new pedestrian law that will impact pedestrian access to bus stops is also provided Central Avenue BRT Study In cooperation with the Pinellas County MPO, PSTA secured $2.3 million to move the Central Avenue BRT into the project development phase. A detailed Alternative Analysis (AA) report was submitted to the Federal Transit Administration (FTA) in August A conceptual plan for the corridor of Central Avenue from downtown St. Petersburg to the Central Plaza Intermodal Terminal was begun in February At the same time, an extended corridor analysis was initiated for BRT service west of Central Plaza, with three alternatives: southwest to St. Petersburg Beach, northwest to Tyrone Square Mall/Madeira Beach, and west to Treasure Island. Efforts continue in the pursuit of this project to run from downtown St. Petersburg to St. Petersburg Beach Countywide BRT Study The Pinellas County MPO agreed to use approximately $375,000 in funding from a Congressional earmark to fund a study that would explore the feasibility of BRT service along major arterial roadways in Pinellas County. Corridors would be ranked to determine those that are the most feasible, and the highest priority corridors could be studied in more detail for BRT implementation. This study is underway, and the initial screening process is complete. The Countywide BRT Study is expected to continue once direction is provided from the 2008 TDP and the MPO s PMI Steering Committee Ulmerton Road BRT Corridor Starting in 2003, PSTA began exploring the Ulmerton Road corridor for the early phases of an integrated BRT system. The studies continued into 2004, and staff entered into negotiations with FDOT over designing BRT bus bays into the expansion and improvements scheduled for the next 14 years. PSTA, in conjunction with Kittelson and Associates, produced a set of BRT bus bay designs for nearside and far side stops as well July Final 2008 Transit Development Plan
74 as a partial open bay design. The Ulmerton Road FDOT reconstruction project is scheduled to take many years and be divided into several segments. The PSTA BRT stops are currently included in the design of the segment between 49 th Street and US 19 with agreements on the segments from 119 th Street to El Centro. The two segments west of 119 th Street were too far along in design for BRT bus bays to be included in the final design. The PSTA 10-year TDP includes the top 10 route corridors for local bus service enhancement and BRT service development Downtown Clearwater to Clearwater Beach Bus Rapid Transit A study is currently under development to identify route and bus preferential treatment options needed to implement shuttle or BRT service between downtown Clearwater and Clearwater Beach. The study will also identify and evaluate potential station locations, ridership levels, and capital and operational costs. The study is set to begin in fall TBARTA Regional Transportation Master Plan The Tampa Bay Area Regional Transportation Authority (TBARTA) was created by the state legislature on July 1, 2007, with the authority to plan and develop a multimodal transportation system that will connect the seven counties of our region. PSTA, the Pinellas County MPO, and FDOT District Seven are working together to develop PSTA s component of the TBARTA Regional Transportation Master Plan, which must be completed by July 1, This coordinated effort ensures consistency in methodology and system development, which in turn will contribute to a single plan/concept that uses PSTA s 10-year TDP as the guiding document for mid- and long-range transit planning in Pinellas County. As TBARTA is developing as a functional transportation agency, PSTA and the other transit operators in the region are actively engaged in Board and advisory committee meetings Long Range Transportation Plan (LRTP) The MPO is currently in the process of developing the 2035 LRTP, which assesses the transportation needs of Pinellas County and sets forth improvements necessary to meet those needs over a 20-plus year period. To update the transit element, which may include regular and enhanced bus, BRT, and/or rail, the MPO uses information from the adopted 2025 LRTP, PSTA s TDP, and the priorities that emerge from the TBARTA Master Plan. A visioning and scenario planning process is also being used to develop July Final 2008 Transit Development Plan
75 and test alternative land use and transportation scenarios for Pinellas County. Through this process, transit scenarios currently being discussed will be reviewed, including those proposed by the 2025 LRTP Update, the Strategic Regional Transit Needs Assessment, and One Bay. Two additional scenarios will be developed, including one that incorporates the district types and planned redevelopment areas defined in the MPO s Livable Communities Model Development Code and another that looks at the effect of various transit investments on corridors and redevelopment areas Pedestrian Safety Law The State of Florida recently passed a new law requiring that vehicular traffic stop rather than just yield to pedestrians in crosswalks at signalized intersections or when the crosswalk is so labeled. A copy of the memorandum issued by the Pinellas County MPO, which includes the text of the new law, is contained in Appendix G. 3.8 DEVELOPMENT COORDINATION An extensive public outreach program is undertaken for PSTA s capital and operating budget programs including: in-depth TAC review, Board workshops, public notices and informational flyers, website notifications, public hearings, and an opportunity for public comment prior to final Board action. Written comments are welcome and shared with staff and the PSTA Board to facilitate decision making. Many times, TAC recommendations are formally presented to the PSTA Board of Directors by the TAC Chairperson or designee Tarpon Wal-Mart Transit Center Beginning in late 2004, PSTA staff started working with the City of Tarpon Springs and Wal-Mart on planning for a new transfer facility that would be constructed on the northeast corner of Tarpon Avenue and US 19. The facility would be of sufficient size to accommodate buses from PSTA and PCPT. Wal-Mart has agreed to pay for the facility, which will include sheltered waiting areas, benches, bike racks, water hook-up, electricity, and lighting Gateway Regional Multimodal Transportation District (MMTD) Pilot Project The purpose of the Gateway Regional MMTD Pilot Project is to provide a report identifying the challenges and benefits of the regional MMTD to the State legislature. July Final 2008 Transit Development Plan
76 The goals of an MMTD include mitigating the impact to the Strategic Intermodal System (SIS), providing a mix of modes, shifting automobile trips to other modes, and expanding the mix of land uses within the district. Phase One of the project is to be completed this month while Phase Two will be completed in fall The final report is scheduled to be delivered to the legislature in January PSTA provided comments to the consultant preparing the MMTD report on July 3, A copy of these comments can be found in Appendix I Grady Pridgen Sod Farm In the fall of 2005, PSTA made contact with the Grady Pridgen organization and requested the integration of passenger amenities with the planning for the Sod Farm complex. The Sod Farm is located between Roosevelt Boulevard and 28th Street and is bordered by 110th Avenue and Gandy Boulevard. The complex is currently under construction with two large manufacturing facilities and several hundred housing units. This initial phase is a small part of a much larger project that will be immediately to the west of 28th Street in the Gateway. The developer has a vision to build a community where residents will be working, living, and shopping in a self-contained community with transit-friendly design features along the roadway corridors Largo Towne Center The City of Largo shared multi-use redevelopment concepts for the former Crossroads Mall (Largo Towne Center), and staff participated in the review of these concepts, including a new multimodal transfer facility/bus stop. The Development Order includes a new transfer facility with a full array of passenger amenities. PSTA is now preparing a concept plan for the new transfer facility and an operating agreement will be finalized later this year. July Final 2008 Transit Development Plan
77 Section 4 NEEDS ASSESSMENT In this section, an assessment of the transit needs in Pinellas County is undertaken. PSTA s goal is to serve both traditional transit-dependent markets and discretionary markets. To serve these markets, PSTA has identified areas in the County where greater concentrations of potential transit users live and work. PSTA has also identified major activity centers that tend to generate large numbers of trips to and from these destinations. PSTA also reviewed transit travel patterns in order to identify corridors with higher transit demand. In addition to the analytical approach, PSTA sought input from its Board of Directors, its TAC, and the MPO s PMI Steering Committee. The results of the workshops and meetings held with these groups are presented in this section. 4.1 TRADITIONAL TRANSIT MARKETS The traditional transit market refers to population segments in Pinellas County that have historically had a higher propensity to use transit. These population segments include the following groups: elderly, youth, low-income households, zero-vehicle households, and residents of more densely populated areas. Using data from the 2000 Census, a Transit Orientation Index (TOI) was developed for Pinellas County. The five population segments identified previously were used to develop an index that identifies areas of the county with higher concentrations of transitoriented population relative to other areas in the county. The results of the TOI are illustrated in Map 4-1. Map 4-1 illustrates locations throughout the county where the proportion of the transit-oriented population is very high, high, medium, low, and very low. July Final 2008 Transit Development Plan
78 I TRANSIT DEVELOPMENT PLAN P i n e l l a s S u n c o a s t T r a n s i t A u t h o r i t y Pasco County ALT US 19 PINELLAS AVE KLOSTERMAN RD ALDERMAN RD KEYSTONE RD TAMPA RD EAST LAKE RD Pinellas County Hillsborough County Map 4-1: Traditional Transit Markets Legend Very High High Medium Low PSTA Bus Routes CURLEW RD Major Roads SR 580 MAIN ST SUNSET POINT RD MCMULLEN BOOTH RD DREW ST GULF BLVD MISSOURI AVE KEENE RD BELCHER RD SR 686 EAST BAY DR GULF-TO-BAY BLVD US 19 ROOSEVELT BLVD Old Tampa Bay SR 688 ULMERTON RD WALSINGHAM RD 102ND AVE PARK BLVD 113TH ST ALT US 19 SEMINOLE BLVD BRYAN DAIRY RD 118TH AVE PARK BLVD 49TH ST N ROOSEVELT BLVD 4TH ST N Gulf of Mexico GULF BLVD WELCH CSWY PARK ST 54THAVE N 38TH AVE N CENTRAL AVE 49TH ST N 22ND AVE N 5THAVE N 22ND AVE S 54THAVE S DR MARTIN LUTHER KING JR ST N Tampa Bay Miles
79 The orientation index provides a starting point for understanding where transit needs are concentrated throughout the area. Existing bus routes are overlaid on the map to determine the extent to which traditional markets are served. Visual review of the map indicates that PSTA offers a service area that effectively serves this market. For more detailed information on the TOI methodology, see Appendix C. 4.2 DISCRETIONARY TRANSIT MARKETS Discretionary passengers are those who use transit by choice as opposed to necessity. These passengers choose to ride transit for a myriad of reasons which include cost savings and environmental concerns. Discretionary passengers often live in areas that are transit supportive. A Density Threshold Assessment (DTA) was conducted based on industry standard relationships between an area s density and its ability to support transit services. Understanding that transit services operate most efficiently in areas with high residential and employment densities, the DTA assists in determining the presence of optimal conditions for varying levels of fixed-routes transit service. Three levels of density thresholds were developed to indicate whether or not an area contains sufficient densities to sustain efficient fixed-route transit operations. Table 4-1 presents the density thresholds for each of the noted categories. Transit Service Threshold Level Table 4-1 Transit Service Density Thresholds Population Density Threshold 1 Employment Density Threshold Minimum 3-5 dwelling units/acre 4 employees/acre High 6-7 dwelling units/acre 5-6 employees/acre Very High 8 dwelling units/acre 7 employees/acre Sources: FDOT, TRB, National Research Council TCRP Report 16, Volume 1 (1996). 1 TRB, National Research Council TCRP Report 16, Volume 1 (1996), Transit and Land Use Form, November 2002, MCT Resolution 3434 TOD Policy for Regional Transit Expansion Projects. The levels from Table 4-1 are explained in detail below. Minimum Reflects minimum population or employment densities to consider basic fixed-route transit service (e.g., local bus service). July Final 2008 Transit Development Plan
80 High Reflects high population or employment densities that may be able to support higher levels of transit service than areas that meet only the minimum density threshold (e.g., increased frequency and service span, express bus, etc.). Very High Reflects very high population or employment densities that may be able to support progressively greater levels of transit investment than areas that meet the minimum or high density thresholds (e.g., progressively greater frequencies, premium transit service, etc.). Using 2009 and 2018 dwelling unit and employment projections by traffic analysis zone (TAZ), areas of the county that meet either or both of these thresholds for a particular density threshold level are illustrated in Maps 4-2 and 4-3. The existing bus route network is overlaid on the DTA to determine the extent to which areas meeting various thresholds are served by bus service. The 2009 Discretionary Transit Markets map indicates a large portion of Pinellas County has residential densities that can support bus service. Currently, most of these areas are being served by transit. There are a few areas with residential densities that support BRT or rail. The areas that have dense employment are likely to be high enough in Pinellas County to support rail. A visual comparison does not reveal much change in residential development densities between 2009 and Over the same time period, employment densities have increased slightly in some TAZs. 4.3 ACCESS TO ACTIVITY CENTERS Transit systems often benefit from providing service to activity centers that attract large numbers of people. Activity centers include large private employers, public employers, airports, and colleges/universities. Map 4-4 displays activity centers in Pinellas County. The transit system is overlaid on the map in order to better determine if transit is effectively serving major activity centers in Pinellas County. A visual review of Map 4-4 indicates that the transit system is serving most of the major activity centers in the County. While not in Pinellas County, Tampa International Airport is a major activity center currently not being served by PSTA. July Final 2008 Transit Development Plan
81 I TRANSIT DEVELOPMENT PLAN P i n e l l a s S u n c o a s t T r a n s i t A u t h o r i t y Pasco County ALT US 19 PINELLAS AVE KLOSTERMAN RD ALDERMAN RD KEYSTONE RD TAMPA RD CURLEW RD EAST LAKE RD Pinellas County Hillsborough County Map 4-2: 2009 Discretionary Transit Markets Legend Employment Density Threshold (Emp/Acre) Minimum High Very High Population Density Threshold (DU/Acre) Minimum High SR 580 MAIN ST SUNSET POINT RD MCMULLEN BOOTH RD Very High PSTA Bus Routes Major Roads DREW ST GULF BLVD MISSOURI AVE KEENE RD BELCHER RD SR 686 EAST BAY DR GULF-TO-BAY BLVD US 19 ROOSEVELT BLVD Old Tampa Bay SR 688 ULMERTON RD WALSINGHAM RD 102ND AVE PARK BLVD 113TH ST ALT US 19 SEMINOLE BLVD BRYAN DAIRY RD 118TH AVE PARK BLVD 49TH ST N ROOSEVELT BLVD 4TH ST N Gulf of Mexico GULF BLVD WELCH CSWY Miles PARK ST 54THAVE N 38TH AVE N CENTRAL AVE 49TH ST N 22ND AVE N 5THAVE N 22ND AVE S 54THAVE S DR MARTIN LUTHER KING JR ST N Discretionary Transit Markets Minimum High Very High Tampa Bay Population Density Threshold (1) 3-5 dwelling units/acre 6-7 dwelling units/acre > or = 8 dwelling units/acre Employment Density Threshold No fewer than 4 employees/acre 5 6 employees/acre > or = 7 employees/acre (1) Note: Dwelling units are used as a proxy for population
82 I TRANSIT DEVELOPMENT PLAN P i n e l l a s S u n c o a s t T r a n s i t A u t h o r i t y Pasco County ALT US 19 PINELLAS AVE KLOSTERMAN RD ALDERMAN RD KEYSTONE RD TAMPA RD CURLEW RD EAST LAKE RD Pinellas County Hillsborough County Map 4-3: 2018 Discretionary Transit Markets Legend Employment Density Threshold (Emp/Acre) Minimum High Very High Population Density Threshold (DU/Acre) Minimum High SR 580 MAIN ST SUNSET POINT RD MCMULLEN BOOTH RD Very High PSTA Bus Routes Major Roads DREW ST GULF BLVD MISSOURI AVE KEENE RD BELCHER RD SR 686 EAST BAY DR GULF-TO-BAY BLVD US 19 ROOSEVELT BLVD Old Tampa Bay SR 688 ULMERTON RD WALSINGHAM RD 102ND AVE PARK BLVD 113TH ST ALT US 19 SEMINOLE BLVD BRYAN DAIRY RD 118TH AVE PARK BLVD 49TH ST N ROOSEVELT BLVD 4TH ST N Gulf of Mexico GULF BLVD WELCH CSWY Miles PARK ST 54THAVE N 38TH AVE N CENTRAL AVE 49TH ST N 22ND AVE N 5THAVE N 22ND AVE S 54THAVE S DR MARTIN LUTHER KING JR ST N Discretionary Transit Markets Minimum High Very High Tampa Bay Population Density Threshold (1) 3-5 dwelling units/acre 6-7 dwelling units/acre > or = 8 dwelling units/acre Employment Density Threshold No fewer than 4 employees/acre 5 6 employees/acre > or = 7 employees/acre (1) Note: Dwelling units are used as a proxy for population
83 I TRANSIT DEVELOPMENT PLAN P i n e l l a s S u n c o a s t T r a n s i t A u t h o r i t y Pasco County ALT US 19 PINELLAS AVE KLOSTERMAN RD "n ALDERMAN RD KEYSTONE RD TAMPA RD CURLEW RD EAST LAKE RD Pinellas County Hillsborough County "J " Map 4-4: Activity Centers "J "J Legend Private Employers Public Employers "` Airport "n College/University PSTA Bus Routes Major Roads GULF BLVD WALSINGHAM RD 102ND AVE PARK BLVD Gulf of Mexico "" "J "J "J " "J " 113TH ST MISSOURI AVE ALT US 19 SEMINOLE BLVD "n GULF BLVD WELCH CSWY "J " "J " SUNSET POINT RD DREW ST SR 580 MAIN ST KEENE RD BELCHER RD SR 686 EAST BAY DR "n "n US 19 "J " "J " "n BRYAN DAIRY RD PARK ST GULF-TO-BAY BLVD "n "n "J " "J " "n "n "J " ROOSEVELT BLVD 118TH AVE PARK BLVD 54THAVE N 38TH AVE N CENTRAL AVE MCMULLEN BOOTH RD 49TH ST N 49TH ST N 22ND AVE N 5THAVE N "n "n "` "J " "J " SR 688 ULMERTON RD 22ND AVE S ROOSEVELT BLVD 54THAVE S Old Tampa Bay "J " DR MARTIN LUTHER KING JR ST N "n 4TH ST N "J " " "J "J "n "` Tampa Bay Miles
84 4.4 COMMUTING MARKETS The 2007 Market Research Study included an on-board survey of existing riders, which is useful for analyzing travel origin-destination pairs. The most frequent origin-destination pairs reflect travel connecting residential areas with major employment and mixed-use activity centers. The highest intensity origin-destination transit corridors (see Map 4-5) are listed below: Downtown St. Petersburg to the Tyrone area, Gateway area to Tyrone, and Downtown St. Petersburg to the Gateway area. Origin-destination pairs with the next level of intensity include travel to/from downtown St. Petersburg, Mid-County, and Clearwater. Another secondary desire line connects the Tyrone area, south St. Petersburg, and Mid-County. These origin-destination pairs also include PSTA s most active bus stop locations: Central Plaza, Williams Park, Park Street Terminal, Tyrone Square Mall, and Shoppes at Park Place. Commuting patterns for non-transit users in 2007 include 217,300 individuals who commute to employment locations outside of Pinellas County. Nearly 67 percent of these commuters travel to Hillsborough County, mostly to and from Tampa. Approximately 21 percent commute to Pasco County, while 12 percent work in Manatee County. Conversely, similar commuting patterns can be seen coming into Pinellas County. With 214,300 commuters travelling into the County, approximately 67 percent are from Hillsborough County. Approximately 21 percent travel from Pasco County, and 12 percent commute from Manatee County. See Map 4-6 for a visual depiction of intercounty commuting patterns for of Pinellas County. 4.5 JOINT WORKSHOPS (PSTA BOARD OF DIRECTORS AND PMI STEERING COMMITTEE) The PSTA Board of Directors and the MPO s PMI Steering Committee held two joint workshops to discuss transit needs in Pinellas County. The PMI is a transit task force organized to study ways of enhancing the transportation system in a built-out environment. July Final 2008 Transit Development Plan
85 I TRANSIT DEVELOPMENT PLAN P i n e l l a s S u n c o a s t T r a n s i t A u t h o r i t y North Beaches Downtown Clearwater! GULF BLVD! WALSINGHAM RD 102ND AVE Seminole! PARK BLVD Tarpon Springs #! Belleair 113TH ST MISSOURI AVE ALT US 19 SEMINOLE BLVD # #!! Pasco County! KLOSTERMAN RD! SUNSET POINT RD DREW ST ALDERMAN RD KEENE RD ALT US 19 PINELLAS AVE Palm Harbor Dunedin Largo SR 580 MAIN ST! BELCHER RD SR 686 EAST BAY DR BRYAN DAIRY RD TAMPA RD GULF-TO-BAY BLVD US 19 KEYSTONE RD #!!! ROOSEVELT BLVD 118TH AVE PARK BLVD EAST LAKE RD East Lake CURLEW RD MCMULLEN BOOTH RD 49TH ST N Pinellas County!! SR 688 ULMERTON RD Hillsborough County Oldsmar Safety Harbor ROOSEVELT BLVD 4TH ST N! # # Old Tampa Bay Feather Sound! Gandy North St. Petersburg Map 4-5: Highest Transit Trip Intensity Corridors Legend Transit Trip Intensity High Low! Origin/Destination # Top 10 Bus Stop PSTA Bus Routes Major Roads! Tampa Gulf of Mexico GULF BLVD WELCH CSWY! South Beaches! PARK ST Bay Pines #!! # 54THAVE N 38TH AVE N CENTRAL AVE! 49TH ST N Gulfport South Pasadena 22ND AVE N #!# 5THAVE N 22ND AVE S!! 54THAVE S DR MARTIN LUTHER KING JR ST N South St. Petersburg Tampa Bay Miles! Tierra Verde Source: 2007 PSTA On-Board Survey Sample
86 I TRANSIT DEVELOPMENT PLAN P i n e l l a s S u n c o a s t T r a n s i t A u t h o r i t y # Pasco County 45,300 ALT US 19 PINELLAS AVE KLOSTERMAN RD ALDERMAN RD KEYSTONE RD TAMPA RD EAST LAKE RD #45,800 Pinellas County Hillsborough County Map 4-6: Inter-County Commuting Patterns (2007) Legend PSTA Bus Routes Major Roads CURLEW RD SR 580 MAIN ST SUNSET POINT RD MCMULLEN BOOTH RD GULF BLVD DREW ST GULF-TO-BAY BLVD KEENE RD BELCHER RD US 19 ROOSEVELT BLVD # 146,500 MISSOURI AVE SR 686 EAST BAY DR #143,500 Old Tampa Bay SR 688 ULMERTON RD WALSINGHAM RD 102ND AVE PARK BLVD 113TH ST ALT US 19 SEMINOLE BLVD 118TH AVE BRYAN DAIRY RD PARK BLVD 49TH ST N ROOSEVELT BLVD 4TH ST N Gulf of Mexico GULF BLVD WELCH CSWY Miles PARK ST 54TH AVE N 38TH AVE N CENTRAL AVE 49TH ST N # 25,000 22ND AVE N 5TH AVE N 22ND AVE S 54TH AVE S DR MARTIN LUTHER KING JR ST N #25,500 To/From Manatee County Tampa Bay Source: 2007 FDOT Florida Traffic Information
87 4.5.1 First Joint Workshop On January 16, 2008, a joint workshop of the PSTA Board and the MPO s PMI Steering Committee was held at PSTA. The workshop was organized into five segments: introduction, objectives, and overview, background presentation, confirmation of the one-year strategy, identification of the preliminary 10-year themes (FY 2008/09 to 2017/18), and workshop wrap-up. Introduction, Objectives, and Overview PSTA Executive Director Tim Garling discussed the importance of establishing a vision for PSTA. He indicated that that one of the objectives for the workshop was to begin to shape a vision for PSTA s future. Background Presentation The background presentation included information on the following topics: recent trends in Pinellas County, recent trends at PSTA, an overview of the current TDP, and critical rider information (most recent on-board survey results). Confirm One-Year Strategy Due to budget cuts after the passage of Amendment 1 on January 29, 2008, PSTA must seek to implement cost containment strategies, fare policy changes, and service reductions. It was noted that PSTA staff is working to identify potential new funding sources as well as service cuts, but it is trying to minimize the impact to riders. (See Section 2 for more details on service cuts, fare policy changes, and funding strategies.) Identify Preliminary 10-Year Themes FY 2008/09 to 2017/18 During this portion of the workshop, participants discussed ridership, critical corridors, and corridor development. Participants discussed the possibility of doubling ridership over the next 10 years, and there was consensus among the group that this should be PSTA s goal. In furtherance of this goal, the group examined the corridors with the highest level of ridership. The top 10 corridors in terms of transit ridership were July Final 2008 Transit Development Plan
88 identified for the group. There was consensus among the group that growth in transit should be focused along the top 10 corridors. The group discussed strategies for corridor development which are listed below. The group acknowledged the need for improved passenger amenities that would help attract new riders and retain current ones. The need for the implementation of new technology to improve passenger information systems was discussed. The most important factor in increasing ridership growth on the system was identified as service improvements. It was acknowledged that, while land use and density surrounding the top 10 corridors are very important to the success of the transit system, neither PSTA, its Board, nor the PMI Steering Committee have control over these factors. The need for a dedicated funding source that would support increased operational costs was noted. The group discussed the need to get community input in order to develop a system with community support. Workshop Wrap-Up The group agreed to meet again in April 2008 after receiving input from the TAC and further development of these long-term strategies by staff Second Joint Workshop On April 7, 2008, the PSTA Board and PMI met to continue collaborating on a vision for transit in Pinellas County, reiterate the 10-year themes (FY 2008/09 to FY 2017/18), and build consensus on the direction of the TDP. The agenda included the following items: introduction, Central Avenue Bus Rapid Transit (BRT), Downtown Clearwater to beach shuttle, TDP presentation, and workshop wrap-up. These items are discussed in more detail below. July Final 2008 Transit Development Plan
89 Introduction A general welcome was extended to the group. The group reviewed the accomplishments of the previous joint meeting that was held January 16, Central Avenue BRT Tim Garling made a presentation on BRT in Pinellas County. The presentation included the following topics: vision and goals, routes, demographic data, major destinations, operating characteristics and buses, costs and funding, economic development, project status, and schedules. Mr. Garling identified the key reasons for implementing BRT service: to create momentum for public transit, to demonstrate public transit as a viable alternative to citizens, and to enhance economic development and livability. The BRT route that was discussed starts in downtown St. Petersburg and travels to St. Pete Beach via Central Avenue. Downtown Clearwater to Beach Shuttle Brian Smith, Executive Director of the Pinellas County MPO, updated the group on the status of the proposed shuttle service being examined between downtown Clearwater and Clearwater Beach. Traffic on the bridge to the beach can be excessive, especially during the peak season. The shuttle would be a way to alleviate some of the congestion. The main concerns at this point are bus stop siting and how to get the shuttle in and out of traffic quickly. Further study of this project is being conducted. See Section TDP Presentation The participants were presented with a review of some of the information presented in the last joint workshop. The top 10 corridors identified in the last meeting were presented graphically. July Final 2008 Transit Development Plan
90 A presentation was made that explained the service and infrastructure requirements needed to reach PSTA s goal of doubling ridership. The group discussed service improvements, which included 15-minute or better service on the top 10 corridors and 30-minute or better service on the next 10 corridors. Infrastructure requirements included new buses, new transit centers, and new operations and maintenance facilities. The group debated whether it was better to save money and rehabilitate older buses to get a longer useful life out of them or if it was better to buy all new buses. Total operating costs were projected to range from $45 million in 2009 to $126.5 million in Capital costs were estimated at over $200 million for the 10-year period. (Note; These projections have been updated as more details about the 10-year vision plan have been established. Updated figures can be found in Section 7.) The presentation included information on the following funding options: property tax, sales tax, gas tax, and other sources. The group also discussed the lack of control PSTA has over land use and development around transit corridors. The group determined that it was important to develop the land around the transit system in transit-supportive ways. As a wrap-up, the schedule for the TDP development and adoption was presented. 4.6 PSTA TAC WORKSHOPS The TAC is a mixed group of transit users and other interested citizens appointed by the PSTA Board of Directors to provide input into the transit planning process and the dayto-day operation of the transit system. To assist in determining PSTA s direction over the next 10 years, PSTA held two TAC workshops where committee members were asked to participate in a discussion group process to help identify service improvement priorities for PSTA over the next 10 years First TAC Workshop The first TAC workshop was held at the regularly scheduled TAC meeting for February 12, In addition to the members of the TAC, representatives from FDOT, PSTA, MPO, and WorkNET Pinellas were in attendance. The workshop began with a brief presentation regarding the January 16, 2008, PSTA Board of Directors and PMI Steering July Final 2008 Transit Development Plan
91 Committee workshop, the purpose of the workshop, and the process to be undertaken during the workshop. The Nominal Group Technique, designed to increase and balance participation, was employed during this workshop. The following is a list of the primary steps involved in the NGT process: silent generation of ideas in writing, recorded round-robin listing of ideas on a chart, discussion of each idea on the chart, vote on priorities from items listed on the chart, and review of the vote. The TAC was asked to answer the following question: What PSTA service improvements should be priorities over the next 10 years? The results of the vote are provided in Table 4-2. Table 4-2 TAC Recommendations for Improvements Rank Improvement Total Score 1 More frequent service 20 2 Expanded service hours minute headways on the top ten major PSTA routes 14 4 Implement more express routes 12 5 Reallocate BRT resources to major PSTA routes 9 Priority 1 More Frequent Service The results of the TAC workshop indicate that the participants believe that supplying more frequent service is the highest priority for PSTA. TAC members conveyed this message through several of the initial brainstorming improvements identified. In fact, five of the nine TAC members noted this as one of their initial brainstorming improvements prior to the voting and prioritization step. TAC members strongly believe that improving service frequency would increase ridership by making the service more attractive to those who do not regularly use transit as their primary form of transportation. Priority 2 Expanded Service Hours Expansion of service hours scored a close second to more frequent service in terms of the priority scoring. The TAC indicated that more weekend and evening service was a July Final 2008 Transit Development Plan
92 critical factor in being able to capture more trips associated with second and third work shifts. It is important to note here that comments from the TAC in regard to this priority were premised on providing additional service to those who were in need of transportation as opposed to capturing more choice riders. Priority 3 Five-Minute Headways on the Top 10 Major PSTA Routes A common theme throughout the priorities discussion was the need to continue to enhance existing PSTA services. The presentation portion of the workshop included a discussion of the 10 most productive PSTA routes. Those routes include Routes 4, 18, 19, 35, 52, 59, 60, 74, 79, and the Suncoast Beach Trolley SM. Consistent with the number one ranking priority from the workshop (more frequent service), TAC members indicated that service frequency needed to be improved to five minutes for PSTA s top 10 major routes. In addition, TAC members indicated that if the PSTA Board has set a goal of doubling ridership in 10 years, significant service expansion needs to occur on these routes. As such, this priority was considered as being consistent with meeting the PSTA Board s ridership goal. Priority 4 Implement More Express Routes TAC members indicated that more express routes and express service were needed on a countywide basis. Such express service would operate during peak hours of the day and would primarily be directed toward commuters. An emphasis was made by the group that express services should be implemented for both north/south and east/west travel throughout the county. Priority 5 Reallocate BRT Resources to Major PSTA Routes The fifth-highest ranking priority identified by the TAC was the need to reallocate BRT resources to expansion and improvement of existing PSTA local bus service. Specifically, the TAC indicated that those resources planned for any near-term BRT service should be redirected toward improving PSTA s major bus routes. The TAC believes that PSTA should focus on building and improving the current bus service before considering alternative modes. This priority is consistent with Priority 3, (fiveminute headways on the top 10 major PSTA routes) Second TAC Workshop At the regularly scheduled meeting of the TAC on March 11, 2008, a workshop was held to discuss PSTA s service vision for the next 10 years. In addition to TAC members, July Final 2008 Transit Development Plan
93 representatives from the general public, FDOT, and WorkNET Pinellas attended the meeting as well. The meeting began with a brief presentation of the results of the vote from the previous meeting. TAC members were shown a transit trip origin-destination map based on the results of a PSTA on-board survey (see Map 4-5). They were also shown the service frequency improvements projected to be needed to double ridership in the next 10 years. TAC members participated in two group exercises: a resource allocation exercise and a trade-off preferences exercise. For the resource allocation exercise, participants were asked to allocate a specific budget among a series of options. Giving participants the opportunity to distribute limited financial resources mimics real budget constraints. For the trade-off preferences exercise, TAC members were presented with two options, the advantages and disadvantages of the options were explained, and then they were asked to select a preferred option. During the trade-off exercise, participants had difficulty making a choice so they were allowed to use a percentage distribution. Separate scores were kept for TAC and non-tac participants. For the resource allocation exercises, dollar amounts indicated by each TAC member for each response category were summed and averaged. The response category receiving the largest average funding level was considered to be the most important among the corresponding response categories within each topic. For the trade-off preferences exercises, preferences are presented in terms of the percent of TAC members selecting each trade-off choice. Because some respondents indicated trade-off preferences in terms of percents, those percents were summed and averaged to develop an average response rate for each choice in the trade-off exercises. Service Improvements The decision concerning where to allocate resources first in terms of service improvements is one with which transit agencies routinely struggle. The question lends itself very well to a resource allocation exercise in that not all service improvements are possible when working within a constrained budget. For this exercise, TAC members were asked to allocate their allowed budget among four types of service improvements: improve frequency on existing routes, improve the span of service (i.e., more late night and weekend service), July Final 2008 Transit Development Plan
94 implement more express routes, and provide service to new areas. Table 4-3 presents the results of the service improvements resource allocation exercise. Both the TAC and the non-tac group allocated at least half of their budget to frequency improvements. The response category receiving the smallest share of the budget for both groups was new express service. Service Phasing Table 4-3 Service Improvements Resource Allocation Results Non- Response Category TAC TAC Frequency Improvements $55 $50 Span of Service $22 $32 Express Service $4 $7 Service to New Areas $19 $11 Total $100 $100 To achieve PSTA s vision of doubling ridership over the next 10 years, a strategic approach must be taken to appropriately time the implementation of new or expanded services. As such, two approaches for prioritizing service improvements were presented to the TAC. The first approach emphasized expanding existing services where high levels of ridership are already in place. This approach would be consistent with the TAC service enhancement priority to improve frequencies to five minutes on PSTA s top 10 bus routes. The second approach presented to the TAC was a market potential-based approach that emphasized expanding existing service or implementing new service based on economic development, future land use, and future ridership potential. Table 4-4 presents the results of the service phasing trade-off preferences exercise. Sixty-five percent of the TAC group indicated that the best approach for achieving PSTA s goal of doubling ridership over the next 10 years should be based on improving successful existing PSTA bus routes. Conversely, sixty-six percent of the non-tac group indicated that the approach should be market-based with a focus on future ridership opportunities. July Final 2008 Transit Development Plan
95 Table 4-4 Service Phasing Trade-Off Preference Results Response Category TAC Non-TAC Market Based 34% 66% Existing Ridership 65% 35% Total 100% 100% Infrastructure Because of budget constraints, transit agencies are unable to equip all bus stops with adequate infrastructure. In addition, new technology and the need for more dynamic and diverse bus stops have begun to shift the concept of what a bus stop is traditionally considered to be. Consequently, the question of where to spend infrastructure funding was posed and participants were asked to allocate their limited budget to a variety of different infrastructure types. Participants allocated their budgets among four options: more infrastructure at bus stops, passenger information systems, improvements at major transfer centers, and more park-and-ride facilities. The first option, more infrastructure at bus stops, reflects traditional bus stop improvements, including benches, shelters, trash receptacles, lighting, bike racks, and boarding and alighting areas. Table 4-5 presents the results of the infrastructure resource allocation exercise. The response category receiving the largest average budget by TAC members was More infrastructure at bus stops. For non-tac participants, improvements at major transfer centers received the largest average share of the budget. Table 4-5 Infrastructure Resource Allocation Results Response Category TAC Non- TAC More infrastructure at bus stops $55 $26 Passenger information systems $16 $21 Improvements at major transfer centers $16 $42 More park-and-ride facilities $13 $11 Total $100 $100 July Final 2008 Transit Development Plan
96 Vehicle Size An important aspect of planning for transit services is choosing the correct vehicle. The basis for choosing the correct vehicle can involve a variety of vehicle features and/or service characteristics. For the purposes of conducting the TAC workshop, the TAC was presented with the advantages and disadvantages of both small and full-size vehicles. Small vehicles were defined as those vehicles less than 30 feet long and full-size vehicles were defined as being greater than 30 feet long. Table 4-6 presents the results of the vehicle size trade-off preferences exercise. Fullsize vehicles were the preferred vehicle type selected by both the TAC and the non-tac respondent groups. The preference was based on the greater reliability of the larger buses and the greater flexibility with regard to seating arrangement. Larger buses also reduce the likelihood passengers will have to stand during peak periods. Table 4-6 Vehicle Size Trade-Off Preference Results Response Category TAC Non-TAC Full size vehicles (> 30 feet) 90% 100% Small vehicles (< 30 feet) 10% 0% Total 100% 100% Transfer Center Improvements In the past, PSTA has made efforts to respond to customer requests for improvements at transfer centers. Transfer centers serve as the hub for passenger activity and transfers and, as such, commonly include a host of customer comfort and service amenities. For the transfer center improvements resource allocation exercise, participants were asked to allocate their $100 budget among the following improvements: food and drink vendors, passenger information systems, ticket vending machines, and other. The other category was included in the set of options so that TAC members could fill in another improvement type not listed in the list of choices. Table 4-7 presents the results of the resource allocation exercise for the transfer center improvements. Both the TAC and the non-tac response groups allotted the largest part July Final 2008 Transit Development Plan
97 of their average budget to passenger information systems. TAC fill-in responses provided for the other response category included solar-powered shelters. Non-TAC fill-in responses included restrooms and traditional bus stop improvements, such as seating areas and better signage. Table 4-7 Transfer Center Improvements Resource Allocation Response Category TAC Non-TAC Food and drink vendors $30 $21 Passenger information systems $39 $30 Ticket vending machines $22 $24 Other $9 $25 Total $100 $100 Vehicle Improvements Important aspects of providing quality customer service to transit users include the level of services and comfort on vehicles. Recent technological advancements now afford bus passengers a variety of different services that can make their trip easier and/or more enjoyable. TAC members were asked to allocate their financial resources to the following group of vehicle amenities: passenger information systems, transit television, automated stop announcements, Smart Card fare payment, and other. The other category was included in the set of options so that TAC members could fill in another improvement type not listed in the set of options. Table 4-8 presents the results of the vehicle improvements resource allocation exercise. Responses from the TAC group were relatively evenly distributed with the largest share of the average budget going to Smart Card fare payment options. For non-tac respondents, passenger information systems received the largest share of the average budget. Although several TAC and non-tac respondents allotted part of their budget to the other response category, none indicated a specific improvement type. July Final 2008 Transit Development Plan
98 Table 4-8 Vehicle Improvements Resource Allocation Results Response Category TAC Non-TAC Passenger information systems $22 $30 Transit television $21 $10 Automated stop annunciations $23 $19 Smart Card fare payment $29 $19 Other $5 $2 Total $100 $ SUMMARY RESULTS OF NEEDS ASSESSMENT The Needs Assessment included several analytical tools and numerous interactive workshops. Key results of these efforts are summarized below. Traditional Markets: Historically, traditional markets have been the target of PSTA services. PSTA has served this market well, but service improvements designed to capture broader markets will offer substantial benefits to traditional markets, as well. Discretionary Markets: While existing bus services are available to the higherdensity areas in the county, the levels of service, especially service frequencies, are generally insufficient to capture a significant share of the discretionary market. PSTA s 10-year vision was conceived to increasingly penetrate this market over the next 10 years. Access to Activity Centers: PSTA s existing bus services provide access to most, if not all, major activity centers in Pinellas County. However, similar to the discussion of discretionary markets, the levels of service are insufficient to capture significant choice riders. The levels and quality of services must improve to provide enhanced and more convenient access to activity centers. Commuting Markets: Inter-county travel and commuting patterns have significant implications for transit needs. Regional commuter express and limited-stop services will be critical to addressing these needs. In addition coordination with TBARTA and the regional master plan will be crucial. Joint Workshops: Pinellas County leaders are supportive of PSTA s vision of doubling ridership in 10 years. To achieve this vision, decision makers support focusing service frequency improvements on PSTA s top 10 corridors. In addition, transit supportive land use and development must be pursued within these top 10 corridors and throughout Pinellas County. July Final 2008 Transit Development Plan
99 TAC Workshops: TAC participants see the need for more frequent service, expanded service hours, five-minute headways on the top 10 routes, more express routes, and the reallocation of BRT resources toward major PSTA routes. July Final 2008 Transit Development Plan
100 (This page intentionally left blank.) July Final 2008 Transit Development Plan
101 Section 5 10-YEAR VISION PLAN Building on the 2007 TDP, PSTA is presenting a more robust and detailed 10-year vision plan in its 2008 TDP. The improvements noted in the 2007 TDP are still provided for in the 2008 TDP, but they have been integrated into a cohesive plan that does not focus on individual routes but rather focuses on developing the transit system as a whole. In fact, routes are not the basic unit for improvement in the 2008 TDP. PSTA used the top performing routes to identify priority corridors on which to focus improvements. It is these priority corridors and the network that they create that are the focus of improvement in this plan. The vision along with the service and infrastructure improvements needed to make the vision a reality are presented in this section. PSTA will face some significant challenges to making this vision a reality. These are also discussed in this section. 5.1 VISION OVERVIEW The vision developed by the PSTA Board, PMI Steering Committee, and PSTA staff is to use enhanced transit service, particularly on major travel corridors, to further Pinellas County s transition into a more livable community. Trends in population growth, the economy, and the cost of housing necessitate an enhanced, affordable, convenient and effective public transit system for Pinellas County. To attain this goal of doubling ridership, frequencies on the top 20 transit corridors will have to be substantially increased and development/redevelopment will have to be transit supportive. Under this newly developed vision plan, PSTA will continue to meet its mission of providing safe, convenient, attractive, and affordable alternative transportation service for residents and visitors, thereby enhancing the quality of life in Pinellas County. The vision calls for a two-pronged approach to increasing ridership: Continue to improve the mobility and accessibility of traditional transit markets such as elderly, youth, persons with disabilities, and low-income populations. Provide services that meet the needs of the community and attract discretionary riders, particularly commuters. July Final 2008 Transit Development Plan
102 PSTA will need both markets in order to achieve its ridership goal by FY 2017/18. To achieve its vision, PSTA will begin with a comprehensive operations analysis (COA) to optimize transit connectivity throughout the county on its current system. Then improved frequencies will be implemented on the top 10 corridors followed by increased frequencies on the next 10 corridors. Frequencies on the top 10 corridors will be 15 minutes or better while frequencies on the next 10 corridors will be 30 minutes or better. PSTA will implement BRT service on Central Avenue and between downtown Clearwater and Clearwater Beach. The top 10 corridors along with the Central Avenue and Clearwater/Clearwater Beach corridors will become the basis for the countywide BRT network. Additional efforts to improve the effectiveness of the BRT network will also be implemented. These improvements include organizing local feeder routes that will deliver passengers from other areas to the BRT network. Circulator routes will be developed along these corridors in order to improve accessibility around major transit centers. Other facilities such as park-and-ride facilities will also be studied and implemented to support the BRT network as deemed appropriate. 5.2 SERVICE EXPANSION As noted in the previous section, the first step to achieving PSTA s goal is to conduct a COA. The COA will identify ways to optimize the efficiency of the current local bus route system. These improvements will most likely take the form of route re-alignments and schedule changes that make the system work better as a unit. The COA will assist in improving the current system, but it will also lay the foundation for the implementation of increased frequencies on the top 20 corridors. After the COA, PSTA will work to phase in increased frequencies on the top 10 transit corridors. The corridors were identified based on current ridership levels found on the routes that serve these corridors. The top 10 corridors form a network that is currently served by Routes 4, 18, 19, 35, 52, 59, 60, 74, 79, and the Suncoast Beach Trolley SM (Route 777/888). Frequencies in these corridors would be 15 minutes or better. Phasing of these frequency improvements will probably occur over the course of three or four years. Map 5-1 displays the proposed frequencies for the top 10 corridors. Then the improvement of frequencies on the next 10 corridors will begin. Improvement to 30-minute or better service on the next 10 corridors will be phased in over a three- to July Final 2008 Transit Development Plan
 Next 10 Corridors (30 minutes or better)")
103 I TRANSIT DEVELOPMENT PLAN P i n e l l a s S u n c o a s t T r a n s i t A u t h o r i t y Pasco County ALT US 19 PINELLAS AVE KLOSTERMAN RD ALDERMAN RD KEYSTONE RD TAMPA RD EAST LAKE RD Pinellas County Hillsborough County Map 5-1: Priority Corridor Network Legend Top 20 Corridors by Future Frequency Top 10 Corridors (15 minutes or better) Next 10 Corridors (30 minutes or better) PSTA Bus Routes Major Roads CURLEW RD SR 580 MAIN ST SUNSET POINT RD MCMULLEN BOOTH RD DREW ST GULF BLVD MISSOURI AVE KEENE RD BELCHER RD SR 686 EAST BAY DR GULF-TO-BAY BLVD US 19 ROOSEVELT BLVD Old Tampa Bay SR 688 ULMERTON RD WALSINGHAM RD 102ND AVE PARK BLVD 113TH ST ALT US 19 SEMINOLE BLVD BRYAN DAIRY RD 118TH AVE PARK BLVD 49TH ST N ROOSEVELT BLVD 4TH ST N Gulf of Mexico GULF BLVD WELCH CSWY PARK ST 54THAVE N 38TH AVE N CENTRAL AVE 49TH ST N 22ND AVE N 5THAVE N 22ND AVE S 54THAVE S DR MARTIN LUTHER KING JR ST N Tampa Bay Miles
104 four-year period. The corridors that have been identified as the next 10 corridors are those that generally align with Routes 5, 7, 11, 14, 20, 23, 61, 66, 78, and 80. Map 5-1 displays the proposed frequencies for the next 10 corridors. During the phasing of improvements on the top 10 and next 10 corridors, the improvement of service along two additional corridors will be undertaken. PSTA has identified the Central Avenue corridor and the corridor that extends from downtown Clearwater to Clearwater Beach as corridors for BRT service. 5.3 INFRASTRUCTURE IMPROVEMENTS Doubling ridership in 10 years will not just require service improvements, but a significant investment in infrastructure will be required also. Increased frequencies on the top 10 corridors and the next 10 corridors will require significant addition of buses. A satellite maintenance and parking facility will be needed to house the new buses. New or renovated transfer centers and stations will be needed to accommodate the increased passenger load. The level of infrastructure present at bus stops will need to be increased. The following infrastructure investments are part of the 10-year vision. The purchase of 210 stylized buses will need to be made for the county-wide BRT system. Stylized buses have a sleeker, more rail-like look than the typical transit bus. A transition from clean diesel to hybrid-electric buses and/or other alternative-fueled vehicles will also be examined. New transit centers will have to be added to the system to better serve existing patrons and to accommodate the increased demand. Current transit centers will need to be upgraded, modified, or moved to accommodate growing demand. As the BRT network is implemented, these centers will be transformed into stations. Williams Park Terminal in downtown St. Petersburg will need to be relocated. Park Street Terminal in Clearwater will either need to be relocated or renovated. These facilities will become BRT stations when BRT service begins. A new satellite preventative maintenance and bus parking facility will eventually need to be established. The current 205-bus fleet will outgrow the Scherer Drive facility when it reaches approximately 300 buses. This facility will not be needed until near the end of the 10-year period. July Final 2008 Transit Development Plan
105 Advanced technologies will be integrated to provide real-time passenger information. A real-time information system is already in development in the FY 2007/08 Program of Projects (see Appendix B). Real-time passenger information systems provide information such as when the next bus will be arriving, which allows passengers to plan the use of their time in a more efficient manner. The use of priority treatments such as signal priority or queue jumps for buses on the increased frequency corridors will be explored. PSTA will also coordinate with County and municipal staff regarding sidewalk improvement programs so as to increase accessibility to bus stops. PSTA will need to invest in additional infrastructure at bus stops in order to make the system more comfortable for its passengers. Infrastructure at bus stops includes shelters, benches, lighting, trash receptacles, bike racks, and boarding and alighting areas. 5.4 LAND USE Pinellas by Design is a county-wide initiative led by the Pinellas Planning Council (PPC) and Pinellas County Economic Development, which was initiated in response to the diminishing number of large vacant parcels available for development. As the community reaches build-out, the Pinellas by Design initiative hopes to drive quality economic investment and redevelopment through the creation of a redevelopment strategy. Pinellas by Design produced a study in 2005 entitled Pinellas by Design: An Economic Development & Redevelopment Plan for the Pinellas Community. PSTA staff and Board recognize that land uses surrounding transit corridors can support or hinder transit development. These land uses are guided by the Future Land Use Plan developed by the PPC. While PSTA does not have control over land use, transitsupportive development initiatives are critical to PSTA meeting its goals. The synergy between the complementary visions of the PCC, MPO, and PSTA requires effective implementation for the overall transition to a more livable community. PSTA will also be working closely to strengthen its relationships with Pinellas County and its municipalities in hopes of working more closely with them to encourage policies that produce transit-supportive land uses. PSTA understands that the implementation of its vision will take the support and buy-in of the municipalities in the county and it will work to secure that support. Such efforts would include working with municipalities to implement parking policies that provide a disincentive to driving and therefore encourage July Final 2008 Transit Development Plan
106 transit use. PSTA will also work with localities to implement policies that support the development of high-density nodes and corridors. On the regional level, PSTA will be working with TBARTA, HART, PCPT, and MCAT to ensure convenient connections with regional transit services. Increasing regional connectivity is an important step to strengthening the transit network as a whole. 5.5 COMMUNITY SUPPORT As has been noted several times throughout this document, PSTA s vision plan can only come to fruition with the support of all community stakeholders: political leaders, local businesses, community groups, social service agencies, transit users, and the general public. PSTA will be expanding its focus on public relations, marketing, and education in order to enhance these relationships. PSTA is interested in increasing the number of public/private partnerships that it has with private developers and the business community. Private developers and businesses can be a great source of assistance when it comes to expanding transit infrastructure such as benches, shelters, bike racks, and other bus stop amenities. PSTA will also emphasize its work with major employers so as to better serve the needs of their employees. Promoting programs such as the Employer s Choice Program (see Section 3.5 for more details) will help PSTA secure increased ridership as well as help build relationships within the business community. To secure support for this vision from the local community, PSTA will need to demonstrate the benefit stakeholders can gain from supporting PSTA s vision. PSTA staff will need to promote awareness of the benefits of transit. If the benefits can be presented in a tangible format for community members, it will be easier for PSTA to secure community support. A few examples of the tangible benefits of transit are provided below. Every $10 million invested in public transit saves more than $15 million for both highway and transit users. This includes savings of about $200 to $4,500 worth of gasoline per year for a transit user (American Public Transit Association - APTA). Every dollar taxpayers invest in public transit generates an average of $6 in economic returns (APTA). July Final 2008 Transit Development Plan
107 PSTA is an integral part of Pinellas County s disaster preparedness plan. PSTA trains with the Pinellas County Emergency Management Department on a regular basis. Last year, PSTA evacuated residents during a fire at a nursing home. Because of the specially designed attributes of PSTA buses and other vehicles, PSTA increases the mobility and freedom of many disabled individuals living in the County. Public transit produces 95 percent less carbon monoxide (CO), 92 percent fewer volatile organic compounds (VOCs), and nearly half as much carbon dioxide (CO 2) and nitrogen oxides (NO x ) for every passenger mile traveled as compared to traveling with private vehicles (APTA). Public transportation saves more than 855 million gallons of gasoline or 45 million barrels of oil per year in the U.S. (APTA). Given similar origins and destinations, transit system travel results in 200,000 fewer deaths, injuries, and accidents than travel made by car. It is estimated the benefit is between $2 and $5 billion per year in safety benefits. In 2005, public transportation in America s most congested cities saved travelers 541 million hours in travel time (Shrank and Lomax). A recent study by the Corporation for National and Community Service suggested that the length of a commute impacts the rate at which community members participate in volunteer activities. Cities that have longer average commute times have a lower rate of citizen volunteer participation (APTA). Depending on how many miles driven annually and the size of the vehicle, car ownership can cost between $5,987 and $11,444 per year (APTA). For a full discussion of the benefits of transit, see Appendix A. 5.6 POTENTIAL REVENUE SOURCES Because the new vision plan will require additional operating and capital expenditure, PSTA will need to find additional revenue sources. Numerous funding sources were examined by PSTA staff and the Board. Presentations providing information on the following funding sources were made to the PSTA Finance Committee and Board of Directors. These sources are described in the following sections and include the following: fare policy, ad valorem tax, July Final 2008 Transit Development Plan
108 sales tax, fuel tax, rental car fee, tourist tax, vehicle tag fee, impact fee, and concurrency. PSTA currently receives funding from an ad valorem tax which is assessed to property owners in the member communities. Twenty-one of Pinellas County s 24 municipalities have joined the authority. A new, more robust funding source could establish a truly county-wide transit authority that would be seamless Fare Policy PSTA is considering raising fares. See Section for further discussion of this topic Ad Valorem Tax An ad valorem assessment is a tax on property for certain services. Pinellas County uses dedicated ad valorem taxes to fund PSTA. Other counties fund public transportation through a County general fund that is composed largely of revenues from ad valorem tax revenue. While local governments are constitutionally limited to 10 mills (where 1 mill is equal to $1 per $1,000 of property value) for operating purposes, local voters may authorize additional mills for other purposes by referendum. PSTA currently employs an ad valorem tax to fund itself. Under the current millage rate of mills, PSTA receives approximately $37 million annually. If the millage rate were raised to the cap of 0.75 mills, PSTA could receive as much as $50 million annually, as shown in Figure 5-1. In January 2008, Florida voters voted to reduce property taxes by endorsing Amendment One. PSTA is exploring alternative revenue sources that would help ensure an enhanced, viable transit service program in the long term. July Final 2008 Transit Development Plan
109 Figure 5-1 Annual Property Tax Revenue (in Millions) $60 $50 $40 $30 $20 $10 $37 $50 $0 Current Rate ( Mills) Cap Rate (0.75 Mills) Sales Tax There are two types of sales taxes that can be used to fund transit. Charter County Transit System Surtax Local Government Infrastructure Surtax Charter County Transit System Surtax The Charter County Transit System Surtax was first authorized in 1976 by s (1) F.S. as a means to aid in funding the Dade Area Rapid Transit (DART) system. The sales surtax may be levied at a rate of up to 1 percent by charter counties that adopted a charter prior to January 1, 1984, as well as by a county government that consolidates with one or more municipalities. For charter counties, the tax must be approved by a majority vote of the county s governing body. For consolidated governments, the tax is subject to voter approval in a countywide referendum. The proceeds shall be placed in a county trust fund or provided by the county s governing body to an expressway or transportation authority. Generally, the proceeds may be used for the planning, development, construction, operation, and maintenance of fixed guideway rapid transit systems, bus systems, roads, and bridges. The eligible counties include Broward, Duval, Hillsborough, Miami-Dade, Pinellas, Sarasota, and Volusia. The tax is currently levied in Duval and Miami-Dade at 0.5 percent. July Final 2008 Transit Development Plan
110 Local Government Infrastructure Surtax A Local Government Infrastructure Surtax may be levied at the rate of half a percent or one percent pursuant to an ordinance enacted by a majority vote of a county s governing body and approved by voters in a countywide referendum. Generally, the proceeds must be used to finance, plan, and construct infrastructure; to acquire land for public recreation or conservation or natural resources; or to finance the closure of local government-owned solid waste landfills that are already closed or are required to close. Infrastructure is defined as any fixed capital expenditure or fixed capital outlay associated with the construction, reconstruction, or improvement of public facilities that have a life expectancy of five or more years, and any related land acquisition, land improvement, design, and engineering costs. Proceeds are to be distributed to the county and its associated municipalities according to an interlocal agreement, and cannot be used to fund the operational expenditures of infrastructure. Up to 15 percent of the proceeds may be allocated for the purpose of funding county economic development projects of a general public purpose targeted to improve local economies, including the funding of operational costs and incentives related to economic development. The referendum ballot must state this intention in order to have a valid use of the proceeds. All counties are eligible to levy this surtax. Figure 5-2 displays the potential revenue to be gained by implementing a sales tax in Pinellas County dedicated to funding transit. At a one-half percent rate, revenue would be over $71 million, and at a one percent tax rate, revenue would be almost $143 million annually. July Final 2008 Transit Development Plan
111 Figure 5-2 Potential Annual Sales Tax Revenue (in Millions) $160.0 $140.0 $120.0 $100.0 $80.0 $60.0 $40.0 $20.0 $0.0 $71.5 $ % 1.0% Sales Tax Rate Fuel Tax Taxes imposed on motor and diesel fuel vary between counties within Florida. There are three separate fuel taxes that counties have the option to levy. These taxes total up to 12 cents on every net gallon of motor and diesel fuel sold within a county. One-Six Cents Local Option Fuel Tax Originally called the Local Option Gas Tax until 1996, the 1-6 Cents Local Option Fuel Tax, or First Local Option, is a tax of 1 to 6 cents on every net gallon of motor and diesel fuel sold within a county. The tax is adopted through a majority vote of a county s governing body or voter approval in a countywide referendum. This tax is automatically imposed on diesel fuel in all counties. The county distributes proceeds to municipalities according to an interlocal agreement. The counties and cities are authorized to use the proceeds to fund numerous projects, including public transportation capital and/or operating costs. Pinellas County adopted all six cents of this tax and it is currently approved through However, PSTA currently understands that these revenues are obligated to roadway projects. July Final 2008 Transit Development Plan
112 One-Five Cents Local Option Fuel Tax The 1-5 Cents Local Option Fuel Tax, or Second Local Option, is in addition to the previous 1-6 Cents Local Option in which the Legislature authorized an additional tax of 1 to 5 cents on every net gallon of motor fuel sold within a county. Diesel fuel is not subject to this tax. The tax is adopted through a majority vote of a county s governing body or voter approval in a countywide referendum. The county distributes proceeds to municipalities according to an interlocal agreement. The counties and cities are authorized to use the proceeds for transportation expenditures needed to meet the requirements of the capital improvements element or an adopted comprehensive plan, or for expenditures needed to meet the immediate local transportation problems and for other transportation-related expenditures critical for building comprehensive roadway networks by local governments. Only capital improvements are eligible for funding using the 1-5 Cents Local Option Fuel Tax. Pinellas County has not adopted any of the possible 5 cents of the Second Local Option Fuel Tax. If this tax were to be adopted in Pinellas County, it could generate as much as $18 million annually. Figure 5-3 displays the revenue if a one-, three-, or five-cent tax were adopted. Figure 5-3 Potential Annual Fuel Tax Revenue (in Millions) $20.0 $15.0 $10.0 $5.0 $0.0 $18.0 $10.8 $3.6 1 /gal 3 /gal 5 /gal Fuel Tax Rate July Final 2008 Transit Development Plan
113 Ninth-Cent Fuel Tax The Ninth-Cent Fuel Tax is a tax of one cent on every net gallon of motor and diesel fuel sold within a county. The tax was first authorized in 1972 by , F.S. Diesel fuel was not added to the tax until The most recent change to the tax came in 1993 when the Legislature removed a previous referendum requirement and stated that any county can impose the tax by extraordinary vote of its board of county commissioners. The county may distribute tax proceeds to incorporated municipalities, but it is not required to do so. Among other authorized uses, the proceeds can go towards public transportation operations and maintenance. The Ninth-cent Fuel Tax has been adopted in Pinellas County Rental Car Fee A rental car fee can be structured as a percent of the rental price or as a per-day tax. In Greensboro, North Carolina, five percent of rental car transactions go toward funding the regional public transportation system. Rental car fees are not an authorized form of funding in Florida so this option is not currently viable. Projections of the potential revenue this source could generate are provided in Figure 5-4. With a five percent rental car fee, annual revenues in Pinellas County are projected to be approximately $300,000. With a 10 percent rental car fee, annual revenues would be approximately $600,000. Figure 5-4 Potential Annual Rental Car Fee Revenue (in Millions) $0.75 $0.50 $0.25 $0.3 $0.6 $0.00 5% 10% Rental Car Fee Rate July Final 2008 Transit Development Plan
114 5.6.6 Tourist Tax A tourist tax is a tax on hotel room revenues. Pinellas County already has a five percent tourist development tax. Tax revenues are used to strengthen the local economy and increase employment through the ongoing development and promotion of tourism. Depending upon the tax rate, the tourist tax could generate between $11.5 and $23.0 million annually as shown in Figure 5-5. While not yet tested from a legal perspective, it is believed that tourist tax revenues could potentially be used to support tourist-related transit services; however, existing revenues are currently obligated to other uses. Figure 5-5 Potential Annual Tourist Tax Revenue (in Millions) $30 $25 $20 $15 $10 $5 $0 $23.0 $ % 5.0% Tourist Tax Rate Vehicle Tag Fee Vehicle tag fees are fees assessed for every license plate issued in a county. Depending on the magnitude of the fee, revenue generation could range from $1.5 million to $7.5 million annually. Figure 5-6 provides details of revenue generation using this source. Such a fee is not currently permitted by law and additional research and legislation would be required. July Final 2008 Transit Development Plan
115 Figure 5-6 Potential Annual Vehicle Tag Fee Revenue (in Millions) $10.00 $7.50 $5.00 $2.50 $0.00 $7.5 $4.5 $1.5 $1.00 $3.00 $5.00 Vehicle Tag Fee Impact Fee An impact fee is a one-time fee levied against new development to cover capital expansion consumed by the new development. The fee is not a tax, as it is a condition for improving property. There are no example applications in Florida regarding the use of impact fees to fund public transit, but initiatives are being undertaken in other parts of the country. In San Francisco, for example, impact fees from new downtown office construction are helping fund peak-hour transit services in the area. Figure 5-7 shows the revenue potential of a $300 or $500 impact fee levied on residential land uses. Pursuing this revenue source would require an extensive impact fee study to justify a fee for new and expanded development. July Final 2008 Transit Development Plan
116 Figure 5-7 Potential Annual Impact Fee Revenue (in Millions) $6 $5 $4 $3 $2 $1 $2.7 $4.5 $0 $300 Fee $500 Fee Impact Fee Transit Concurrency This funding option is somewhat more innovative than the ones discussed previously. The basic tenet is to use the state s concurrency requirement to fund transit. There is no clear legislative guidance on this issue at this time, but new legislation is being proposed by the Department of Community Affairs. The revenue potential from this type of funding source is uncertain at this time but could be explored further to facilitate discussion with Pinellas County and its municipalities Conclusion While numerous funding sources are documented in this section, few offer significant potential for a long-term funding solution. It is more likely that multiple funding sources will be necessary as part of a broader local transit funding package. PSTA is also pursuing the establishment of a Transit Funding Task Force to discuss and lead the development of local transit funding solutions. July Final 2008 Transit Development Plan
117 Section 6 NEW DIRECTION AND NEXT STEPS A market-driven implementation strategy was identified in the 2007 TDP Update and this philosophy continues in the 2008 TDP Update. Since the top 20 PSTA corridors generate nearly 70 percent of PSTA s ridership, service improvements along these corridors will be critical to doubling PSTA ridership in the next 10 years. In particular, continued development on the top 10 corridors will form the basis for a countywide BRT network. An important element in the new TDP implementing rule is that annual progress reports must identify deviations with respect to the prior-year plan. The purpose of this section of the progress report is to document new directions established since the adoption of the 2007 TDP and begin defining an action plan for implementing the vision developed as part of this TDP update. 6.1 PREVIOUS TDP VISION In the 2007 TDP, several route-specific projects were identified as part of the vision plan for PSTA. The projects noted in the 2007 TDP are not being rewritten by the 2008 TDP, but they are rather being integrated into a much more detailed and comprehensive planning program. The projects in the 2007 TDP included increased frequency on the most productive routes, scheduling upgrades for the most productive routes, BRT, improved weekend and evening service, and new service corridors. All of these improvements continue to be a part of the 2008 TDP, but as opposed to being identified individually by route, they are grouped together under a more strategic, system-wide approach. As noted in the 2007 TDP, PSTA maintains a list of candidate service-enhancement and service development projects. PSTA updates the list of candidate projects as market demand changes or the vision for the system changes. The following projects will be programmed in the FDOT Work Program as Candidate status and advanced when funding is available. See Table 6-1. July Final 2008 Transit Development Plan
118 Table 6-1 FDOT Work Program Candidate Projects Project Type Description Total Estimated Cost FDOT Participation Candidate Urban Corridor Project Route 100X (Express) 1 $471,330 $471,330 Candidate Urban Corridor Project Route 300X (Express) 1 $540,580 $540,580 Candidate Urban Corridor Project Route 18 2 $1,351,422 $1,351,422 Candidate Intermodal Project Candidate TRIP Project (Regional) Pinellas County Intermodal Center (PCIC) $2,000,000 $2,000,000 Real-time Passenger Information Systems 3 $200,000 $200,000 Service Development Project Gulfport Trolley 4 $408,000 $204,000 1 Routes 100X and 300X are currently funded by FDOT using Urban Corridor funding. Urban Corridor projects can be fully funded by FDOT (100% FDOT funding) with no local match requirements since these projects improve capacity, relieve congestion, and provide mobility along congested roadway corridors. 2 Funding proposed for improved peak-period service frequency only. This service enhancement is partially funded with FDOT Service Development funds. 3 Local match already programmed/secured through private sources. 4 CIty of Gulfport to provide local matching funds. 6.2 NEW DIRECTIONS New leadership and significant visionary discussions with decision makers have resulted in a number of new directions for PSTA. Major new directions identified as part of the recent planning and visioning processes include the following: creation of a more livable community, near-term budget issues, new 10-year ridership objective, emphasis on top transit corridors, focus on transit-supportive land use and development, countywide BRT system development, July Final 2008 Transit Development Plan
119 service to Tampa International Airport, service to recreational areas, Central Avenue BRT, Clearwater Beach Shuttle/BRT, TBARTA planning coordination, and park-and-ride opportunities Creation of a Livable Community The new vision for PSTA is to use transit to help create a livable community in Pinellas County. Transit is an integral part of a well-rounded transportation system. Having an effective and efficient system will provide residents of Pinellas County with a convenient, inexpensive, and environmentally friendly option for getting around their community Near-Term Budget Issues In response to property tax reform, PSTA is currently dealing with a budget shortfall for the coming fiscal year. As discussed previously in this report (see Section 2.4), the primary solutions to this issue involve cost containment, fare increases, and service cuts. It is hoped that the near-term budget issues will be addressed and that progress will continue toward the transit vision in the subsequent fiscal year New 10-Year Ridership Objective The PSTA Board and the PMI Steering Committee achieved consensus on an objective of doubling ridership over the next 10 years, from a projected 11.7 million trips in FY 2007/08 to 23.4 million trips in FY 2017/18. Service and infrastructure improvements, transit-supportive land use concepts, and funding needs are defined in this plan as mechanisms that would be necessary to achieve this ridership objective Emphasis on Top Transit Corridors As documented previously in this report, the PSTA Board and the PMI Steering Committee collaborated on two joint workshop sessions in early The purpose of these sessions was to accomplish the following tasks: review population, employment, demographic, and service area characteristics and trends; July Final 2008 Transit Development Plan
120 review existing transit services and recent service enhancements; and develop consensus among PSTA Board and PMI Committee members regarding a 10-year vision for PSTA and transit in Pinellas County. One of the major outcomes of the workshops is the emphasis on the top 10 existing transit corridors, as measured by ridership observed on existing bus routes. This approach is similar to the market-driven approach in the previous TDP; however, the 2008 TDP focuses on more aggressive service enhancements on the top transit corridors as a means of achieving the ambitious ridership goal. In addition to consensus on the ridership objective, agreement was also reached on the following action steps. To achieve the ridership goal, provide enhanced service frequencies, when appropriate, on the 10 corridors with the greatest ridership productivity. Develop stable new funding source(s) for the capital and operating costs required for the enhanced PSTA system. Introduce specific premium transit service characteristics as appropriate for the top 10 transit corridors. Establish the top 10 transit corridors as the planning focus for countywide BRT service development Focus on Transit-Supportive Land Use and Development While PSTA lacks direct control over land use and development in Pinellas County, the future development of the county will greatly impact PSTA s ability to serve the community. PSTA has a vested interest in seeing land development patterns emerge that are transit supportive. PSTA will be seeking support from cities public officials, the development community, and the public at large in this endeavor Countywide BRT System Development As service frequencies and ridership develop on the most productive PSTA corridors, planning studies can identify and evaluate supportive BRT characteristics. As PSTA believes that BRT development must be context sensitive, BRT characteristics implemented on different corridors may be different. In other words, BRT service consists of many attributes. PSTA may implement a different set of these attributes on different corridors depending on the need of the corridor. July Final 2008 Transit Development Plan
121 For instance, a corridor where signal systems and Intelligent Transportation System (ITS) components are already in place, may present an opportunity to improve travel speed using conditional transit signal priority. The ITS components could also present an opportunity for real-time passenger information kiosks at key transit centers and major transfer points. Another corridor may be more ridership productive and, with continued growth, service could be enhanced with 10- or 15-minute peak-period service frequency and limited stop service. Thus, BRT could be in various stages of simultaneous development on several major urban corridors in the PSTA system Service to Tampa International Airport (TIA) PSTA and HART are working toward a plan for improved service to TIA with the opportunity for more seamless inter-county travel and intermodal connectivity. The PSTA system includes commuter express service along the major urban corridors linking Mid-County and St. Petersburg to downtown Tampa using commuter coaches. These services could be deviated on select trips to serve TIA or new services may be proposed. HART is currently developing a concept plan for an intermodal terminal near TIA Service to Recreational Areas PSTA will work to extend service to recreational areas within Pinellas County. Providing service to recreational areas is an important component of a livable community Central Avenue BRT BRT service on Central Avenue will be explored as part of the vision development process. The Central Avenue corridor is a major one, and BRT will almost definitely be implemented along it in the future Clearwater Beach Shuttle/BRT The MPO PMI Steering Committee will evaluate shuttle/brt service concepts linking downtown Clearwater and Clearwater Beach. The study will explore preferential treatments, park-and-ride opportunities, and PSTA system connectivity to facilitate travel across the Memorial Causeway, particularly during the peak season. This study will begin in fall July Final 2008 Transit Development Plan
122 TBARTA Planning Coordination TBARTA was created by the state legislature on July 1, 2007 with the authority to plan and develop a multimodal transportation system that will connect the seven counties of the region. PSTA, the Pinellas County MPO, and FDOT District Seven are working together to develop PSTA s component of the TBARTA Regional Transportation Master Plan, which must be completed by July 1, The transit plan will include the following analyses: 2030 Baseline for PSTA service enhancements (see Appendix F), 2030 Transit Needs (see Appendix F), and 2050 Transit Needs (in development). This coordinated effort ensures consistency in methodology and system development, which in turn will contribute to a single plan/concept that uses PSTA s 10-year TDP as the guiding document for mid- and long-range transit planning in Pinellas County. As TBARTA is developing as a functional transportation agency, PSTA and the other transit operators in the region are actively engaged in Board and advisory committee meetings Park-and-Ride Opportunities PSTA will need to explore potential park-and-ride locations near major route corridor connection points. PSTA will coordinate with FDOT and Pinellas County to develop park-and-ride facilities in conjunction with major roadway projects. 6.3 NEXT STEPS A preliminary action plan was developed as part of the 2008 progress report. A moredetailed action plan will be prepared as part of subsequent planning efforts. Major components of this future action plan are highlighted below. Implement PSTA s FY 2008/09 Program of Projects - PSTA developed a program of projects for FY 2007/08. The Program of Projects provides a breakdown of how PSTA will spend its Federal FTA Section 5307 and Section 5309 Funds. Section 5307 funds totaled $12.6 million while Section 5309 funds totaled $0.6 million in FY 2007/08. Projects on the Program include the purchase of hybrid-electric buses and bus parts, computer hardware and software, realtime passenger information systems, transit security services, and a digital radio July Final 2008 Transit Development Plan
123 system. A copy of the Program of Projects is located in Appendix B. The program is supportive of PSTA s 10-year vision for transit in Pinellas County. Establish Transit Funding Task Force The PSTA Board is considering the establishment of a Pinellas County Transit Funding Task Force. The task force would comprise stakeholders throughout the county and be charged with consensus-building toward the identification and securement of long-term funding solutions for PSTA. The task force would work with the local business community to establish partnerships. Coordinate with the MPO on Countywide BRT Study It is envisioned that the TDP will provide input and guidance for the Pinellas MPO and the PMI Steering Committee to move forward with the Countywide BRT Study. Prepare Implementation and Action Plan The 2008 TDP defines an aggressive vision for the expansion of transit services in Pinellas County. A major next step will be the development of a detailed implementation and action plan. Critical to this detailed action plan will be the identification of specific roles, responsibilities, and deadlines for completing actions and making progress toward the 10-year transit vision. Perform Comprehensive Operations Analysis - A Comprehensive Operations Analysis (COA) is needed to evaluate each fixed bus route operated by PSTA. The objective of the COA is to ensure that existing bus services are operated as efficiently as possible. Route productivity would be analyzed by route segment, time of day, and day of week. Strengths, weaknesses, and opportunities for improvement would be identified for each route. Major elements of the fixedroute operational analysis include the following: o Line-by-line profile and analysis service description service and operating summary market profile route and segment performance weekday, Saturday, and Sunday performance overall performance assessment o Schedule Performance (completed as part of separate project to be integrated here) July Final 2008 Transit Development Plan
124 schedule adherence analysis running time analysis o Blocking and Runcutting/Rostering Performance time-transfer issues interlining opportunities o Service Plan Recommendations immediate recommendations (low-cost improvements) low-cost efficiency improvements increased directness of service reduced travel time enhanced connectivity short-term and Long-Term Recommendations service philosophy major service modifications Secure New and Dedicated Funding Source for PSTA To implement the vision in this transit plan, a new and dedicated funding source must be identified and implemented for PSTA. Funding from this new source must become available for operations in FY 2010/11 for the vision to be implemented as outlined in this 10-year plan. July Final 2008 Transit Development Plan
125 Section 7 BUDGET PROJECTIONS PSTA s goal is an aggressive one. Doubling ridership in the next 10 years will require a significant monetary investment. The magnitude of that investment is reviewed in this section. (Note: These are preliminary projections. Further study will be needed to determine the exact costs.) 7.1 OPERATING COSTS The service improvements discussed in Section 5.2 result in significant increases in operating expenditure. Figure 7-1 provides an overview of operating cost projections. While the exact phasing plan has not been identified, it is assumed for the purposes of Figure 7-1 that the increased frequencies on the top 10 and next 10 corridors occurs in the following fashion. It is assumed that the frequency improvements (15 minutes or better) on the first 10 corridors will be phased in between FY 2010/11 and FY 2013/14. It is assumed that the frequency improvements (30 minutes or better) on the next 10 corridors will be completed between FY 2014/15 and FY 2017/18. It is also assumed that a permanent funding source that would fund operations would be secured in FY 2009/10. Highlights of Figure 7-1 are presented in the following bullets. The bottom layer of each bar reflects the current cost of providing existing services. The middle layer is the projected inflation to be expected for providing existing services in the future. The top layer is the projected cost of new services. Annual operating cost of maintaining existing services increases from $58.0 million in FY 2008/09 to $82.5 million in FY 2017/18. Annual operating cost of existing plus expanded services increases from $58.0 million in FY 2008/09 to $144.9 million in FY 2017/18. July Final 2008 Transit Development Plan
126 Figure 7-1 Operating Costs (in millions) Operating Costs (millions) $160 $140 $120 $100 $80 $60 $40 $20 $0 $62.4 $58.7 $51.1 $54.5 $44.6 $47.8 $40.2 $34.3 $2.3 $4.7 $7.2 $9.8 $12.6 $15.4 $18.3 $21.4 $24.5 $58.0 $58.0 $58.0 $58.0 $58.0 $58.0 $58.0 $58.0 $58.0 $ / / / / / / / / / /18 Existing Services Inflation on Existing Services Expanded Services Note: FY 2008/09 operating costs were calculated by subtracting budget cuts recommended at the May 28, 2008, Board of Directors meeting from the projected FY 2008/09 budget also presented at the meeting. See Section CAPITAL COSTS Capital costs will also significantly increase under the new vision. Capital costs include those for bus stop infrastructure, buses, transit centers, and the parking and maintenance facility (see Section 5.3). Bus stop improvement costs will vary depending upon the amount of infrastructure and the number of stops to be improved, but these costs are estimated at $250,000 per year for a total of $2.5 million over the 10-year period. The cost of purchasing the 210 new hybrid-electric buses, purchasing hybridelectric replacement buses, and refurbishing older buses is projected to be approximately $204 million. For a more detailed breakdown of capital and operating costs for hybrid-electric buses, see Appendix H. The cost of new transit centers is estimated to be between $40 and $60 million depending upon whether or not PSTA is able to purchase previously improved sites that only require renovation or vacant land which requires the construction of a facility. The cost of the satellite facility needed to house the additional buses as well as provide preventative maintenance is projected to be between $15 and $25 million, excluding land costs. These improvements are shown in Table 7-1. July Final 2008 Transit Development Plan
127 Capital Expenditure Bus Stop Infrastructure Buses Transit Centers Satellite Facility Total Table 7-1 Capital Costs Cost Estimate $2.5 million $204 million $40 to $60 million $15 to $25 million $261.5 to $291.5 million 7.3 OPERATING REVENUES As discussed in Section 5.6, additional revenue sources will need to be identified in order to fund the operating and capital costs identified in the previous two sections. At this time, no new funding sources have been secured for the 10-year vision plan, but PSTA is pursuing the creation of a Transit Funding Task Force to initiate discussions of new local transit funding sources Figure 7-2 displays the projected funding shortfall under the 2008 TDP vision plan. Figure 7-2 highlights are bulleted below. The bottom layer of each bar represents PSTA s current funding level. The middle layer of each bar represents fare revenues to be generated from the projected new ridership generated from the increased services. It does not include fare revenues from current service as that is included under current funding. The top layer of each bar represents the portion of the operational costs for which a funding source has not been identified. Operating revenue shortfalls range between $2.3 million in FY 2008/09 and $76.2 million in FY 2017/18. Total revenue shortfall between FY 2008/09 and FY 2017/18 totals over $450 million. July Final 2008 Transit Development Plan
128 Figure 7-2 Operating Revenue Shortfall $160 $140 Revenue (millions) $120 $100 $80 $60 $40 $20 $0 $51.0 $56.6 $62.7 $69.5 $76.2 $47.6 $43.1 $37.2 $2.3 $4.6 $4.1 $6.6 $9.1 $11.7 $12.2 $12.5 $12.8 $13.1 $55.7 $55.7 $55.7 $55.7 $55.7 $55.7 $55.7 $55.7 $55.7 $ / / / / / / / / / /18 Existing Revenue Fare Revenue from New Services Unfunded Costs Note: Currently, PSTA is working to resolve the funding shortfall projected for FY 2008/09. See Section 2.4. For purposes of this analysis, it is assumed that PSTA will generate $2 million in revenue in FY 2008/09 from a fare increase. 7.4 CAPITAL REVENUES In FY 2007/08, PSTA received approximately $12.6 million in Sections 5307 and 5309 capital funding revenues. Assuming this funding remains constant over the 10-year vision period, Figure 7-3 shows the capital funding shortfall projected under this plan. Highlights from Figure 7-3 are presented below. The bottom layer of each bar is projected Sections 5307 and 5309 revenue assuming it remains steady over the 10-year period. The top layer of each bar represents the funding shortfall for capital. Under the low-cost scenario, the funding shortfall for capital over the 10-year period would be $129 million. Under the high-cost scenario, it would be $159 million. July Final 2008 Transit Development Plan
129 Figure 7-3 Capital Revenue Shortfall $350 Revenue (millions) $300 $250 $200 $150 $100 $50 Funding Shortfall Existing Revenue $159 $129 $132 $132 $0 Low-Cost Scenario High-Cost Scenario July Final 2008 Transit Development Plan
130 (This page intentionally left blank.) July Final 2008 Transit Development Plan
131 Section MAJOR UPDATE REQUIREMENTS In 2010, PSTA will be required to submit a major update to its last TDP, which was completed in June Under the new TDP rule, the next major update will be different from previous TDPs submitted by PSTA. The major changes required by the new rule are listed below. The new rule extends the planning horizon from five years to 10 years. It requires major updates only every five years as opposed to every three years, as was previously required. Complying agencies must now submit a public involvement plan to FDOT for approval prior to beginning the TDP process. The new rule explicitly requires that agencies notify FDOT, the regional workforce board, and the local MPO of all public meetings where the TDP is to be presented or discussed. PSTA must provide the opportunity to these entities for review and comment on the TDP during the development of its mission, goals, objectives, alternatives, and 10-year implementation program. Additionally, PSTA is required to use a demand estimation tool approved or provided by FDOT. For this purpose, FDOT has developed the Transit Boardings Estimation and Simulation Tool, commonly known as TBEST. A farebox recovery analysis must be included in the TDP. (Note: A copy of the most recent farebox recovery analysis has been provided in Appendix D.) The TDP must be approved by FDOT by September 1 st of the year it is due. Certain funding is conditioned upon meeting this deadline. In preparing this progress report, PSTA has already made significant progress toward compliance with the new rule. Full compliance will be achieved as part of PSTA s next major update in Table 8-1 provides a checklist of items that must be included in the major update of PSTA s TDP in A more extensive checklist was provided by FDOT District Seven as the guidance they will use to review future TDP submittals. For a copy of this checklist, see Appendix E. July Final 2008 Transit Development Plan
132 Figure 8-1 TDP Major Update Checklist Public Involvement Process Public Involvement Plan (PIP) Drafted PIP Approved by FDOT TDP Includes Description of Public Involvement Process Provide Notification to FDOT Provide Notification to Regional Workforce Board Provide Notification to MPO Situational Appraisal Land Use State and Local Transportation Plans Other Governmental Actions and Policies Socioeconomic Trends Organizational Issues Technology 10-Year Annual Projections of Transit Ridership using Approved Model Do Land Uses and Urban Design Patterns Support/Hinder Transit Service Provision? Calculate Farebox Recovery Mission and Goals Provider's Vision Provider's Mission Provider's Goals Provider's Objectives Alternative Courses of Action Develop and Evaluate Alternative Strategies and Actions Benefits and Costs of Each Alternative Financial Alternatives Examined Implementation Program 10-Year Implementation Program Maps Indicating Areas to be Served Maps Indicating Types and Levels of Service Monitoring Program to Track Performance Measures 10-Year Financial Plan Listing Operating and Capital Expenses Capital Acquisition or Construction Schedule Anticipated Revenues by Source Relationship to Other Plans TDP Shall Be Consistent with Florida Transportation Plan TDP Shall Be Consistent with Local Government Comprehensive Plan TDP Shall Be Consistent with MPO Long-Range Transportation Plan TDP Shall Be Consistent with Regional Transportation Goals and Objectives Submission Adopted by BOCC Submitted by September 1, 2010 July Final 2008 Transit Development Plan
133 APPENDIX A: BENEFITS OF TRANSIT 1. Improved Mobility: Access to employment, community resources, medical care and recreational opportunities are necessary particularly for those with limited income, who do not own a car or do not have access to a family vehicle. Transit may be a permanent means of transport or a temporary transportation mode for those who may eventually purchase a vehicle or pay for repairs. Transit offers those under the age of 16 who cannot legally drive or those older citizens who can no longer drive an opportunity to be independent. Transit trips tend to be high value to users and society such as providing transport to work, school, or medical facilities. Over 60 percent of PSTA users indicate PSTA is their only transportation option. Over 80 percent of PSTA users ride the bus every day of the week. PSTA ridership is approaching 12 million passenger trips per year. In 2006, nearly 21 percent of the Pinellas County population was age 65 or older. For the portion of these citizens that can no longer drive, the bus can be an important source of independence. 2. Improved Bike/Pedestrian Facilities, Connectivity, and Livability: Public transit is a pedestrian function that requires sidewalks, accessible routes, and connectivity of the roadway corridors and adjacent developments. As these improvements occur, the overall community is more pedestrian-friendly and livable. This contributes to a healthier walking and cycling environment, better land use policies, and improved quality of life. PSTA s Bikes-on-Buses ridership totaled 322,726 in FY 2006/07, a 68 percent increase since FY 2001/02. PSTA staff coordinates with local governments, the Pinellas Planning Council, and the Tampa Bay Regional Planning Council to ensure developments include transit-supportive elements, public art, and pedestrian system connectivity and safety features. 3. Enhanced Land Use and Economic Development: Public transit connects residential areas with major activity centers, which promotes education, employment, and entertainment opportunities. Business and location advantages accrue as new July 2008 A-1 Final 2008 Transit Development Plan
134 development and redevelopment occur along major transit corridors. This focuses development around transit, which can reduce sprawl and create central transportation/development nodes with mixed land uses to maximize transportation and location efficiencies. PSTA s top 10 Routes provide 7.5 million passenger trips annually. These 10 Route corridors provide connections between populated residential areas and major employment centers. Every $10 million invested in public transit saves more than $15 million for both highway and transit users. This includes savings of about $200 to $4,500 worth of gas per year for a transit user (American Public Transit Association - APTA). Every dollar taxpayers invest in public transit generates an average of $6 in economic returns (APTA). 4. Increased Emergency Preparedness/Enhanced Security: Public transit is critical to safe and efficient evacuation for residents and visitors prior to major storm events and during the recovery phase after natural disasters. Transit is critical to the evacuation of high-rise apartments, mobile home parks, and assisted living facilities, and can effectuate the movement of people in large numbers to/from public shelter locations. PSTA evacuated Patrick Nursing Home last year due to a fire. Buses were utilized to transport residents comfortably to temporary shelter at the Knights Inn on 34th Street in St. Petersburg. PSTA participates in S.W.A.T. exercises, which includes table-top and fullscale drills with the Pinellas County Emergency Management Department and local, state, and Federal law enforcement officials. These exercises are used to test and evaluate PSTA s notification and response procedures and interagency communication and operations. A PSTA representative serves on the Pinellas County Emergency Management Coordinating Committee. This group makes operational recommendations to the Pinellas County Disaster Advisory Committee in the event of an impending local disaster. All PSTA Managers and Directors have received the National Incident Management System (NIMS) certification by the Federal Emergency Management Institute. The NIMS is comprised of several components that July 2008 A-2 Final 2008 Transit Development Plan
135 work together as a system to provide a national framework for preparing for, preventing, responding to, and recovering from domestic incidents. 5. Increased Accessibility: Public transit vehicles and facilities are fully accessible to persons with disabilities. Also, paratransit is available to those who cannot utilize regular fixed-route service, due to their disability. As a result, persons with disabilities have access to a wide range of community services and opportunities for mainstreaming that would not be available otherwise. All PSTA buses and trolleys include accessibility features for persons with disabilities. Wheelchair ridership has grown to over 50,000 passenger trips per year. PSTA has an active travel-training program tailored for persons with disabilities. PSTA is improving bus stops with accessibility features, including ADA landing pads, curb retrofits, and connectivity to existing sidewalks. 6. Cleaner Environment: Public transit plays a vital role in reducing vehicle miles traveled (VMT), which in turn helps to reduce mobile source pollution. As public transit becomes more viable with compact/mixed use development, household travel and average trip lengths can decrease. Reduction in vehicle miles traveled effectively lowers emissions and contributes to a cleaner, more sustainable environment. In the U.S., public transportation reduces annual emissions for the pollutants that create smog and nitrogen oxides by more than 70,000 tons and 27,000 tons respectively (APTA). Public transit produces 95 percent less carbon monoxide (CO), 92 percent fewer volatile organic compounds (VOCs), and nearly half as much carbon dioxide (CO 2) and nitrogen oxides (NO x ) for every passenger mile traveled as compared to traveling with private vehicles (APTA). A single commuter switching from driving a private automobile to existing public transportation can reduce their carbon emissions by 20 pounds/day or 4,800 pounds/year. This reduction is approximately 10 percent of the average two-car household s annual carbon footprint (Davis and Hale). 7. Reduced Energy Consumption: Public transportation can significantly reduce dependency on gasoline. For every passenger mile traveled, public transportation July 2008 A-3 Final 2008 Transit Development Plan
136 uses about one-half of the fuel consumed by cars, and about a third of that used by sport utility vehicles and light trucks. According to a survey sponsored by the National Association of Realtors and Smart Growth America, approximately 75 percent of Americans believe that being smarter about development and improving public transportation are better long-term solutions for reducing traffic congestion than building new roads. Public transportation saves more than 855 million gallons of gasoline or 45 million barrels of oil per year in the U.S. (APTA). A bus with seven passengers is about twice as energy efficient as an average automobile and a bus with 50 passengers is about ten times as efficient (Litman). 8. Increased Safety: Transit is a significantly safer mode of travel than the private automobile. The National Safety Council estimates that riding a bus is over 170 times safer than traveling by car (APTA). Given similar origins and destinations, transit system travel results in 200,000 fewer deaths, injuries, and accidents than travel made by car. It is estimated the benefit is between $2 and $5 billion per year in safety benefits. 9. Increased Travel Time Savings: Using transit saves time. Transit use reduces congestion for all users of the road which reduces overall travel times. When travel time is reduced, commuters have more time for other activities, such as spending time with family, preparing dinner, or working in the yard. For those using transit, they can occupy their commute time with other activities such as reading. In 2005, public transportation in America s most congested cities saved travelers 541 million hours in travel time (Shrank and Lomax). A recent study by the Corporation for National and Community Service suggested that the length of a commute impacts the rate at which community members participate in volunteer activities. Cities that have longer average commute times have a lower rate of citizen volunteer participation (APTA). The presence of transit can reduce the amount of time certain family members spend chauffeuring other family members around. Without July 2008 A-4 Final 2008 Transit Development Plan
137 transit, some family members may find themselves chauffeuring children to school activities, family to jobs, or elderly to run errands (Litman). A 5 percent reduction in traffic volume created through shifting travel to transit can reduce congestion delays by 10 to 30% (Litman). 10. Reduced Transportation Costs: Using transit saves money on automobile costs. Depending on how many miles driven annually and the size of your vehicle, car ownership can cost between $5,987 and $11,444 per year (APTA). Using transit can enable a two-adult household to own only one car. Using transit can reduce parking costs. July 2008 A-5 Final 2008 Transit Development Plan
138 PRIMARY SOURCES American Public Transportation Association (APTA), The Benefits of Public Transportation An Overview, Davis, Todd and Monica Hale, Public Transportation s Contribution to Greenhouse Gas Reduction, October Litman, Todd, Evaluating Public Transit Benefits and Costs: Best Practices Guidebook, Victoria Transport Policy Institute, December Shrank, David and Tim Lomax, The 2007 Urban Mobility Report, The Texas Transportation Institute and The Texas A&M University System, September July 2008 A-6 Final 2008 Transit Development Plan
139 APPENDIX B: PROGRAM OF PROJECTS FY 2007/2008 Section 5307 Formula Funds Purchase Three (3) 35 Hybrid-Electric Replacement Buses: $1,636,131 Purchase of three (3) 35 hybrid-electric replacement buses with BRT package. These buses replace 1997 model year buses, which are currently eligible for replacement under FTA guidelines (in excess of 500,000 miles on each bus). Replacement bus features would include; a low floor design for easy accessibility, interior/exterior cameras and automatic vehicle locators (AVL) for security, LED lighting, vapor photo sensor, and bike racks to facilitate intermodal travel opportunities Purchase Seven (7) 35 Hybrid-Electric Replacement Trolleys: $4,108,489 Purchase of seven (7) 35 hybrid-electric replacement trolleys. These trolleys would replace the 2002 model year trolleys, which are currently eligible for replacement under FTA guidelines on a 7-year cycle. Replacement trolley features would include; a low floor design for easy accessibility, interior/exterior cameras and automatic vehicle locators (AVL) for security, LED lighting, vapor photo sensors, and bike racks to facilitate intermodal travel opportunities Bus Parts: $500,000 Major bus parts used in the maintenance of the bus fleet will be purchased and will include engines, transmissions, alternators, etc Tire Lease: $200,000 PSTA leases its bus tire rather than purchasing them. The lease price includes all shipping and handling, storage, and inventory at PSTA, as well as dismounting and mounting of tires. PSTA mechanics simply remove a mounted tire assembly from inventory when a new tire is needed Pre-Engineered Bathroom: $200,000 PSTA will purchase and install one pre-engineered bathroom including slab and sidewalk connectivity at the 34 th Street transfer facility Computer Hardware: $2,009,390 The project will consist of upgrading PSTA s current DVR program that captures all the video images from the fleet. Currently PSTA has Mobileview 3 digital video recorders (DVR s) on each of the buses with a number of spare units available. Upgrading the system to Mobileview 4 provides for some additional functionality. The Mobileview 4 DVR s system stores more images that can be viewed via laptop, docking station, or through a wireless network. The wireless July 2008 B-1 Final 2008 Transit Development Plan
140 network provides for wireless DVR downloads within the facility to save time and resources. With an established wireless network, other features can be made available such as WIFI on the bus, real time information to wireless devices (PDA, cell phone, Blackberry), web notification ( and text), and terminal signage that provides next bus arrival information. This project will also include the purchase of Smartcard printer/encoder, GFI portable probe, and 10 workstations Computer Software: $315,990 The project will consist of upgrading PSTA s current DVR software that captures all the video images from the fleet and purchase additional software, software licenses, and network configurations for Real Time Passenger Information for bus arrivals. The project will also include the software that will work with the new Smartcard printer/encoder Farebox Replacement $130,000 PSTA will purchase 10 (ten) GFI Odyssey fareboxes including smartcard reader and cashbox Digital Radio System: $2,100,000 This project would upgrade PSTA s analog radio console to a digital system. PSTA currently shares the Pinellas County 900 Mhz radio system with EMS and police. The County is "migrating" the radio system in phases from analog to digital. When all the channels are converted, the system will operate only in a digital mode. This will mandate that PSTA trade out their analog voice radios for a higher speed digital radio. The first part of this process is replacement of the main radio console in the dispatch area. Consistency in radios systems is crucial to safety, security, and emergency preparedness Transit Security Services (1%): $125,700 This line item funds security services at PSTA s Park Street and Central Plaza Terminals Passenger Shelters: $475,700 PSTA will purchase and install approximately 50 new passenger shelters including slabs. Sub Total: $11,801, Contingency (5%): $642, Project Administration (1%): $125,700 TOTAL SECTION 5307: $12,569,840 July 2008 B-2 Final 2008 Transit Development Plan
141 Section 5309 Special Appropriation Purchase Two (2) Replacement Buses: $646,800 Purchase of two (2) 35 clean diesel replacement buses. These buses would replace model year 1997 fleet, which are currently eligible for replacement under FTA guidelines (in excess of 500,000 miles on each bus). Replacement bus features would include; a low floor design for easy accessibility, interior/exterior cameras and automatic vehicle locators (AVL) for security, and bike racks to facilitate intermodal travel opportunities. By adding onto a current procurement contract, this purchase can be executed quickly. TOTAL 5309 SPECIAL APPROPRIATION: $646,800 COMBINED TOTALS (5307 & 5309): $13,216,640 July 2008 B-3 Final 2008 Transit Development Plan
142 (This page intentionally left blank.) July 2008 B-4 Final 2008 Transit Development Plan
143 APPENDIX C: TRANSIT ORIENTATION INDEX METHODOLOGY There are five steps to developing the TOI, as summarized below. Step 1: Compile data by block group for the five demographic characteristics. The first step involves the compilation of Census demographic data by block group for each of the following five characteristics: population density (persons per square mile), proportion of the population age 60 and over (elderly), proportion of the population under age 16 (youth), proportion of population below the poverty level, and proportion of households with no vehicle (0-vehicle households). In particular, the percent distributions for the demographic characteristics are compiled for every block group in the county. These proportions are then ranked in descending order from block groups with the greatest proportion of each characteristic to those with the smallest proportion. Step 2: Compute an average proportion and standard deviation for each of the demographic characteristics. An average percent (mean) and standard deviation is then computed for each demographic characteristic. A standard deviation measures the extent to which the actual percent values for each block group vary from the average percent value. With a normal bell-shaped distribution, approximately 68 percent of the values will be within one standard deviation of the average percent, while 95 percent will be within two standard deviations of the average. Step 3: Stratify the proportions into four segments using the following breaks. The resulting percent values for each block group fall into one of four categories for each demographic characteristic: below average (low), above average but within one standard deviation (medium), above average but between one and two standard deviations (high), and above average and more than two standard deviations (very high). July 2008 C-1 Final 2008 Transit Development Plan
144 Step 4: Assign discrete numerical scores to each of the four categories established for each demographic characteristic. Scores are assigned through the use of a comparative probability distribution methodology. This is done by first estimating the probability that a block group would end up in a given category for a given demographic characteristic. For example, 7 of 123 block groups are above average and more than two standard deviations above average for elderly population, which translates to 5.69 percent (seven divided by 123). There is a 5.69 percent probability for any given block group in the County to fall within this above average category. The probability percentage for each group is then divided into the probability percentage for the below average category. Continuing the previous example, the category score for above average elderly population is (60.16 percent probability percentage for below average category divided by 5.69 probability percentage for above average category is equal to 10.57). Step 5: Calculate composite scores. Composite scores are computed for each block group by summing the individual category scores for each of the demographic characteristics. The block groups are then ranked in descending order using the composite score and then stratified using the same method applied to individual demographic characteristics in Step 3. Block groups in the highest category are indicated as having a very high orientation for transit use based on the five demographic characteristics used to develop the TOI. Other categories are indicated as having a high, medium, and low orientation, respectively. July 2008 C-2 Final 2008 Transit Development Plan
145 APPENDIX D: ANNUAL FAREBOX RECOVERY RATIO REPORT 2008 PINELLAS SUNCOAST TRANSIT AUTHORITY MAY 2008 HB 985, passed in 2007, requires that PSTA monitor its farebox recovery ratio. The rule also requires that PSTA specifically address potential enhancements to productivity and performance which would have the effect of increasing farebox recovery ratio. This section contains farebox recovery ratio calculations along with potential enhancements. CURRENT FAREBOX RECOVERY RATIO The following section contains a calculation of farebox recovery over time. recovery was 22.6 percent in FY 2006/07. Farebox Farebox Recovery (FY 1995/96 to FY 2006/07) Fiscal Year Total Expenses Fare Revenue Farebox Recovery 1995/96 $24,351,920 $5,670, % 1996/97 $24,136,823 $6,106, % 1997/98 $24,483,123 $6,656, % 1998/99 $24,155,732 $6,938, % 1999/00 $26,369,717 $7,562, % 2000/01 $28,706,597 $7,747, % 2001/02 $29,917,237 $7,817, % 2002/03 $32,832,830 $7,985, % 2003/04 $35,676,304 $8,060, % 2004/05 $37,982,193 $8,252, % 2005/06 $46,025,915 $9,045, % 2006/07 1 $47,928,414 $10,841, % 1 Expenses for FY 2006/07 are un-audited. PROPOSED FARE CHANGES FOR THE UPCOMING YEAR PSTA is considering a fare increase for the upcoming fiscal year. The fare increase would adjust base fare from $1.50 to $1.75 per one-way trip. Applying fare elasticities calculated using data from FY 1995/96 to FY 2005/06, total fare revenue under the proposed fare structure would be almost 11 percent higher than if fares remained constant. The fare elasticity analysis assumes all other factors (e.g., population, fuel prices, etc.) remain constant. July 2008 D-1 Final 2008 Transit Development Plan
146 PSTA staff analyzed the impact of the fare increase on farebox recovery. The analysis revealed that farebox recovery could increase by as much as four percentage points by FY 2008/09 over FY 2006/07 levels. STRATEGIES THAT WILL AFFECT THE FAREBOX RECOVERY RATIO The following section provides a listing of the enhancements PSTA is undertaking to enhance the farebox recovery ratio. Fare increase: PSTA is considering a fare increase. Monitoring: PSTA continuously monitors its performance to determine whether adjustments need to be made. Public Input: PSTA continuously seeks input from the public. The input provides valuable information on how to make services more convenient and useful to patrons. By providing services that better meet the needs of its customers, PSTA can increase ridership. Increasing ridership can increase farebox recovery. PSTA has an open-door policy with regards to public input; public comments are always welcome. Paratransit: PSTA will continue to increase ridership by transitioning passengers from paratransit service to fixed-route service. Marketing: PSTA s vigorous marketing campaign, which includes television and print advertisements, helps bring in additional passengers and revenue. Cost Reductions: PSTA is currently working to cut its budget for the upcoming fiscal year. Cutting costs will help increase farebox recovery ratios. July 2008 D-2 Final 2008 Transit Development Plan
147 APPENDIX E: FDOT DISTRICT SEVEN TDP CHECKLIST July 2008 E-1 Final 2008 Transit Development Plan
148 Florida Department of Transportation District Seven, Modal Development Office, Public Transit Transit Development Plan Reviews: Requirements per Chapter 14-73, Florida Administrative Code Section Provider Requirement The TDP is in compliance? Yes No 14- The TDP shall be a planning, (3) development and operational guidance document The TDP shall be based on a tenyear planning horizon The TDP shall cover the year for which funding is being sought The TDP shall also cover the subsequent nine years The Provider s governing body adopted the TDP The TDP shall be updated every five years Comments/ Notes Record the date: (3)(a) Does the Provider have a Public Involvement Plan? Did the Department approve the Public Involvement Plan? If the Provider is using the MPO s Public Involvement Plan, did the Federal Highway Administration and the Federal Transit Administration both approve the Public Involvement Plan? Did the Provider s TDP preparation process include opportunities for public involvement? Did the Provider establish time Content Requirements Public Involvement Process Identify if it is: the Provider s or the MPO s Provider s MPO s If yes, specify what time Florida Department of Transportation, District Seven, Modal Development Office, Public Transit Transit Development Plan Reviews: Requirements per Chapter 14-73, Florida Administrative Code
149 limits for receipt of comments? Does the TDP include a description of the Public Involvement Process used? Does the TDP include a description of public involvement activities the Provider carried out? Did the Provider solicit comments from the Regional Workforce Development Board(s)? limits: Did the Provider give an opportunity to Department, the workforce development board(s), and the MPO to review and comment on the TDP during the development of the mission, goals, objectives, alternatives, and ten-year implementation program? (3)(b) Situation Appraisal Is this TDP a strategic planning document? Does this TDP include an appraisal of factors within and outside the Provider that affect the provision of transit service? Does the situation appraisal include, at a minimum: 1a. The effects of land use plans, actions, policies, and trends? 1b. The effects of state and local transportation plans, actions, policies, and trends? 1c. The effects of other governmental actions and policies? 1d. The effects of other organizational issues? If yes, what specifically? If yes, what specifically? If yes, what specifically? If yes, what specifically? 1e. The effects of technology on If yes, what specifically? Florida Department of Transportation, District Seven, Modal Development Office, Public Transit Transit Development Plan Reviews: Requirements per Chapter 14-73, Florida Administrative Code
150 (3)(c) (3)(d) the transit system? 2a. An estimation of the community s demand for public transit using the planning tools the Department Provided? 2b. An estimation of the community s demand for public transit using a Department approved demand estimation technique? 2b1. If the Provider used a Department approved demand estimation technique, does it a. a. include: a. demographic data? b. b. b. land use data? c. c. c. transit data? 2b2. Is the result of the transit demand estimation process a tenyear annual projection of transit ridership? 3a. Does the assessment of the extent to which the land use and urban design patterns in the Provider s service area support or hinder the efficient provision of transit service, including efforts the Provider or local land use authorities undertake to foster a more transit-friendly operating environment. Provider s Mission and Goals 1. Does the TDP contain the Providers: a. Vision b. Mission c. Goals d. Objectives? 2. Regarding the Mission and Goals, does the TDP take into consideration the findings of the situation appraisal? 1. Does the TDP develop and evaluate alternative strategies and actions for achieving the a. b. c. d. a. b. c. d. Alternative Courses of Action If yes, specifically what planning tool(s)? If yes, specifically what Department approved demand estimation technique? Florida Department of Transportation, District Seven, Modal Development Office, Public Transit Transit Development Plan Reviews: Requirements per Chapter 14-73, Florida Administrative Code
151 provider s goals and objectives? 2. Does the alternatives assessment (See No. 1, above) identify the benefits and costs of each alternative? 3. Does the TDP develop and evaluate financial alternatives? 4. Does the TDP identify options for new revenue sources? List the alternatives: List the alternatives: List the sources: (3)(e) 5. Does the TDP identify dedicated revenue sources? Ten-year Implementation Program List the sources: 1a. Does the TDP identify policies for achieving the Provider s goals and objectives? 1b. Does the TDP present a tenyear program for implementation of the policies identified in No. 1, above? 2a. Does the TDP identify strategies for achieving the Provider s goals and objectives? Identify the policies: Identify the strategies: 2b. Doe the TDP present a tenyear program for implementation of the policies identified in No. 1, above? 3.Does the ten-year implementation program include maps: a. Indicating the areas to be served? b. Type of service the Provider will provide? c. Level of service the provider a. b. c. a. b. c. Florida Department of Transportation, District Seven, Modal Development Office, Public Transit Transit Development Plan Reviews: Requirements per Chapter 14-73, Florida Administrative Code
152 will Provide? 4. Does the ten-year implementation program include a monitoring program to track performance measures? 5. Does the ten-year implementation program include a ten-year financial plan listing: a. Operating expenses; b. Capital expenses; c. A capital acquisition schedule; d. A construction schedule; e. anticipated revenues by source? 6a. Does the implementation program include a detailed list of projects the Provider needs to meet the goals and objectives in the TDP? 6b. Are there projects identified in 6a, above, for which the provider has not identified funding? a. b. c. d. e. a. b. c. d. e. Identify the projects: Identify the projects: 7. Does the implementation Program include a detailed list of services the Provider needs to meet the goals and objectives in the TDP? 7b. Are there services identified in 7a, above, for which the provider has not identified funding? Identify the services: Identify the services: (3)(f) Relationship to Other Plans 1. Is the TDP consistent with the Note specifically how: Florida Transportation Plan? 2. Is the TDP consistent with the Note specifically how: local government comprehensive plan? 3. Is the TDP consistent with the Note specifically how: MPO s long-range transportation plan? 4. Is the TDP consistent with the Note specifically how: Florida Department of Transportation, District Seven, Modal Development Office, Public Transit Transit Development Plan Reviews: Requirements per Chapter 14-73, Florida Administrative Code
153 (4) regional planning council s regional transportation goals? 5. Is the TDP consistent with the regional planning council s regional transportation objectives? 6. Does the TDP address (speak to or discuss) the relationship between the ten-year implementation program and other local plans? 1. Is the annual update in the form of a progress report on the tenyear implementation plan? 2a. Does the progress report include the past year s accomplishments compared to the original implementation program? 2b. Does the progress report include an analysis of any discrepancies between the TDP and its implementation for the past year? 2b1. In relation to 2b. above, does the progress report include steps the Provider will take to attain the original goals? 2b2. In relation to 2b. above, does the progress report include steps the Provider will take to attain the original objectives? 3. Does the progress report include any revisions to the implementation plan for the coming year? 4. Does the progress report include the revised implementation program for the tenth year? 5. Does the progress report include added recommendations for the new tenth year of the updated plan? 6. Does the progress report include a revised financial plan? 7a. Does the progress report Annual Update Note specifically how: If so, specifically what other Plans? Note here the accomplishments Note here the discrepancies: Note here the revisions: Note here the added recommendations: Florida Department of Transportation, District Seven, Modal Development Office, Public Transit Transit Development Plan Reviews: Requirements per Chapter 14-73, Florida Administrative Code
154 (5) include a revised list of projects or services needed to meet the goals and objectives? 7a1. Does the progress report include a list of projects, pertinent to 7a. above, for which the Provider did not identify funding? Plan Submission and Approval 1. Does this TDP meet all applicable deadlines? 2. Does this TDP address all requirements of this rule? 3. Does this TDP include a Public Involvement Plan? 4a. Did the Public Involvement Process include opportunities for review and comment by interested agencies? 4b. Did the Public Involvement Process include opportunities for review and comment by citizens? 4c. Did the Public Involvement Process include opportunities for review and comment by passengers? If no, specify: If no, specify 4d. For each of the groups identified above in 4a c, inclusive, did the Provider make available Public Involvement Process participation opportunities during: 1. Development of the mission? 2. Development of the goals? 3. Development of the objectives? 4. Development of the alternatives? 5. Development of the tenyear implementation plan? Did the Provider submit the TDP to the Department by Specify the date of Department receipt of the Florida Department of Transportation, District Seven, Modal Development Office, Public Transit Transit Development Plan Reviews: Requirements per Chapter 14-73, Florida Administrative Code
155 September 1? adopted TDP? Specify what governing body adopted the TDP: 5a. If late, were there extenuating circumstances beyond the Provider s control? 5b, If late, will the Department be able to complete its review and approval process by the last business day in December? 5c. Is the TDP in compliance with the the TDP rule? If yes, specify: If not, specify how the TDP is not in compliance: 5c1. Did the Department notify the Provider within 60 (sixty) days of receiving the adopted TDP or the annual update as to whether or not the TDP or annual update is in compliance with the requirements of the TDP rule? 5c2. If the Department determined the Provider s submitted TDP to not be in compliance with the TDP rule, did the Department provide the Provider a list of deficiencies within 60 (sixty) days? 5c3. Identify here the date the Provider resubmitted the TDP in connection with 5c2, above. 5c4. Did the Department advise the Provider within 30 (thirty) days of its receipt of the Provider s resubmitted TDP that the TDP is or is not in compliance with the TDP rule? Specify the date: Specify the date: Specify the date: Specify the date: 14- Grant Administration Florida Department of Transportation, District Seven, Modal Development Office, Public Transit Transit Development Plan Reviews: Requirements per Chapter 14-73, Florida Administrative Code
156 73.001(6) 1. Does the TDP adequately Provide to the Department sufficient information to enable the Department to make funding decisions pertinent to the Provider? 2. Doe the TDP contain information about funding needs that could qualify for Department funding through Chapter 341, Florida Statutes? 3. What fully-executed Joint Participation Agreements are already in place with respect to this TDP? 4. Is the Provider eligible to receive state public transit grants from the Department? 5. Has the Provider sent the Department (that is, to the District) a written request for appropriated public transit funds? 5a. For No. 5, above, did the Provider include: a. Its name? b. Its address? c. Level of funding requested? d. Type of funding or program participation requested? e. And use (purpose) for the requested funds? a. b. c. d. e. a. b. c. d. e. Provide list as a separate attachment. 6a. Is the Provider s annual update or approved TDP on file at the District One office by the last business day of December? Caution: Transit systems are at risk of losing an entire year s allocation of any state grant funds See (6)(f) 7. Is this Provider eligible to receive State Transit Block Grant funds effective July 1? Florida Department of Transportation, District Seven, Modal Development Office, Public Transit Transit Development Plan Reviews: Requirements per Chapter 14-73, Florida Administrative Code
157 Notes: Florida Department of Transportation, District Seven, Modal Development Office, Public Transit Transit Development Plan Reviews: Requirements per Chapter 14-73, Florida Administrative Code
158 Florida Department of Transportation, District Seven, Modal Development Office, Public Transit Transit Development Plan Reviews: Requirements per Chapter 14-73, Florida Administrative Code
159 APPENDIX F: TBARTA REGIONAL TRANSPORTATION MASTER PLAN TBARTA was created by the state legislature on July 1, 2007 with the authority to plan and develop a multimodal transportation system that will connect the seven counties of the region. PSTA, the Pinellas County MPO, and FDOT District Seven are working together to develop PSTA s component of the TBARTA Regional Transportation Master Plan, which must be completed by July 1, Provided in this appendix are the following maps which are the master plan maps for Pinellas County: 2030 Baseline for PSTA service enhancements, 2030 Transit Needs, and 2050 Transit Needs (in development and therefore not included in this appendix). This coordinated effort ensures consistency in methodology and system development, which in turn will contribute to a single plan/concept that uses PSTA s 10-year TDP as the guiding document for mid- and long-range transit planning in Pinellas County. As TBARTA is developing as a functional transportation agency, PSTA and the other transit operators in the region are actively engaged in Board and advisory committee meetings. July 2008 F-1 Final 2008 Transit Development Plan
160 (This page intentionally left blank.) July 2008 F-2 Final 2008 Transit Development Plan


161
162


163


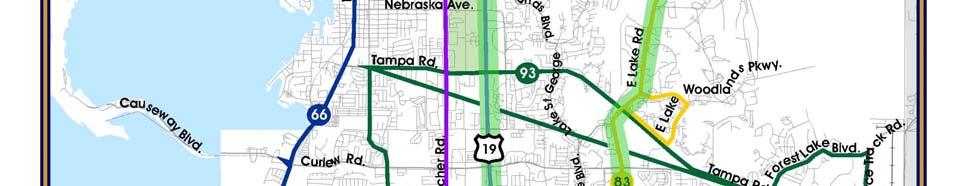

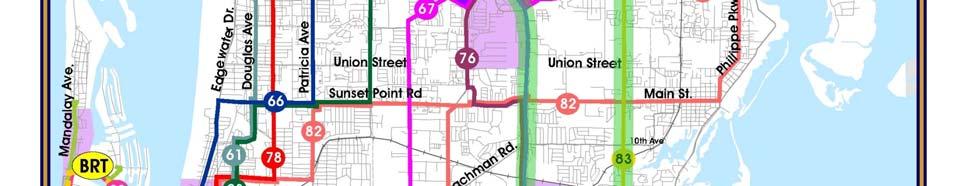

164
165
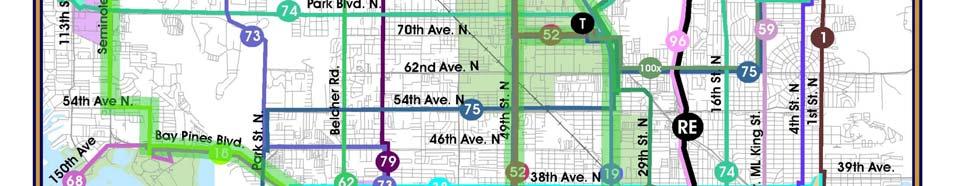


166
COMMUNITY REPORT FISCAL YEAR We are making progress, are you on board? GOLD COAST TRANSIT DISTRICT
 FISCAL YEAR 178 GOLD COAST TRANSIT DISTRICT COMMUNITY REPORT We are making progress, are you on board? OJAI OXNARD PORT HUENEME VENTURA COUNTY OF VENTURA GENERAL MANAGER S MESSAGE STEVEN P. BROWN DEAR
TRANSIT FEASIBILITY STUDY Town of Bradford West Gwillimbury
 TRANSIT FEASIBILITY STUDY Town of Bradford West Gwillimbury Open House Presentation January 19, 2012 Study Objectives Quantify the need for transit service in BWG Determine transit service priorities based
Executive Summary October 2013
 Executive Summary October 2013 Table of Contents Introduction... 1 Rider Transit and Regional Connectivity... 1 Plan Overview... 2 Network Overview... 2 Outreach... 3 Rider Performance... 4 Findings...
A Transit Plan for the Future. Draft Network Plan
 A Transit Plan for the Future Draft Network Plan Project Overview and Status Completed Market Analysis and Service Evaluation. Developed Plan Framework and Guiding Principles. Developed a draft Five Year
Parking Management Element
 Parking Management Element The State Transportation Planning Rule, adopted in 1991, requires that the Metropolitan Planning Organization (MPO) area implement, through its member jurisdictions, a parking
Transit Development Plan. Progress Report FY 2018 FY Prepared By: 3201 Scherer Drive St. Petersburg, FL 33716
 PINELLAS SUNCOAST TRANSIT AUTHORITY Transit Development Plan Progress Report FY 2018 FY 2027 Prepared By: 3201 Scherer Drive St. Petersburg, FL 33716 Phone: (727) 540 1800 Fax: (727) 540-1913 TABLE OF
Sean P. McBride, Executive Director Kalamazoo Metro Transit. Presentation to Michigan Transportation Planning Association July 13, 2016
 Sean P. McBride, Executive Director Kalamazoo Metro Transit Presentation to Michigan Transportation Planning Association July 13, 2016 Metro Transit in Kalamazoo County Square Miles = 132 Urbanized Population:
5. OPPORTUNITIES AND NEXT STEPS
 5. OPPORTUNITIES AND NEXT STEPS When the METRO Green Line LRT begins operating in mid-2014, a strong emphasis will be placed on providing frequent connecting bus service with Green Line trains. Bus hours
6/6/2018. June 7, Item #1 CITIZENS PARTICIPATION
 June 7, 2018 Item #1 CITIZENS PARTICIPATION 1 Item #2 APPROVAL OF MINUTES Item #3 TRAC GOALS, FRAMEWORK & AGENDA REVIEW 2 COMMITTEE GOALS Learn about Southern Nevada s mobility challenges, new developments
Charlotte-Mecklenburg Region Rapid Transit and Land-Use Integration
 Charlotte-Mecklenburg Region Rapid Transit and Land-Use Integration Legislative Committee on Urban Growth and Infrastructure Carolyn Flowers CEO Charlotte Area Transit System March 23, 2010 Charlotte Region
Strategic Plan Performance Metrics & Targets
 San Francisco Municipal Transportation Agency Strategic Plan Performance Metrics & Targets Fiscal Year 2019 Fiscal Year 2020 April 3, 2018 SAFETY Goal 1: Create a safer transportation experience for everyone.
UTA Transportation Equity Study and Staff Analysis. Board Workshop January 6, 2018
 UTA Transportation Equity Study and Staff Analysis Board Workshop January 6, 2018 1 Executive Summary UTA ranks DART 6 th out of top 20 Transit Agencies in the country for ridership. UTA Study confirms
US 29 Bus Rapid Transit Planning Board Briefing. February 16, 2017
 US 29 Bus Rapid Transit Planning Board Briefing February 16, 2017 Project Goals Improve the quality of transit service Improve mobility opportunities and choices Enhance quality of life Support master
Public Meeting. City of Chicago Department of Transportation & Department of Housing and Economic Development
 Public Meeting City of Chicago Department of Transportation & Department of Housing and Economic Development Funded by Regional Transportation Authority September 12, 2011 In partnership with Presentation
Sustainability SFMTA Path to Platinum
 Sustainability SFMTA Path to Platinum Ed Reiskin San Francisco Municipal Transportation Agency, Director of Transportation San Francisco, CA Timothy Papandreou Deputy Director Strategic Planning & Policy
Help shape your community investment in Wake Transit. Fiscal Year 2019 Draft Work Plan Summary
 Help shape your community investment in Wake Transit Fiscal Year 2019 Draft Work Plan Summary Wake County, growth and transit The Triangle is one of the fastest-growing regions in the nation. Wake County
Regional Transportation Commission, Washoe County Lee Gibson, Executive Director Roger Hanson, Senior Planner
 Regional Transportation Commission, Washoe County Lee Gibson, Executive Director Roger Hanson, Senior Planner Presentation Outline Transit System Facts Economic Challenges in the Truckee Meadows RTC Transit
GODURHAM PROGRESS REPORT
 GODURHAM PROGRESS REPORT OVERVIEW OPERATIONS & PERFORMANCE With the service enhancements, total revenue hours increased In 2016, GoDurham connected 5.9 million passengers to jobs, education and health
Rapid Transit and Land-Use Integration a Reality
 City of Charlotte Rapid Transit and Land-Use Integration a Reality Transportation Oversight Committee Carolyn Flowers CEO Charlotte Area Transit System April 29, 2010 Charlotte Region Statistics Mecklenburg
FREQUENTLY ASKED QUESTIONS
 FREQUENTLY ASKED QUESTIONS 2018 What is the More MARTA Atlanta program? The More MARTA Atlanta program is a collaborative partnership between MARTA and the City of Atlanta to develop and implement a program
ROCHESTER, MINNESOTA
 ROCHESTER, MINNESOTA Rochester Public Works TRANSIT AND PARKING DIVISION Transit and Parking Manager Tony Knauer tknauer@rochestermn.gov SERVICE ATTITUDE CONSISTENCY - TEAMWORK ROCHESTER TRANSIT & PARKING
Metropolitan Council Budget Overview SFY
 Metropolitan Council Budget Overview SFY 2016-2017 H T t ti C itt House Transportation Committee February 4, 2015 Transit connects us to the places that matter Transportation Needs Grow as the Region Grows
Waco Rapid Transit Corridor (RTC) Feasibility Study
 Feasibility Study") Waco Rapid Transit Corridor (RTC) Feasibility Study Chris Evilia, Director of Waco Metropolitan Planning Organization Allen Hunter, General Manager Waco Transit System Jimi Mitchell, Project Manager AECOM
Waco Rapid Transit Corridor (RTC) Feasibility Study Chris Evilia, Director of Waco Metropolitan Planning Organization Allen Hunter, General Manager Waco Transit System Jimi Mitchell, Project Manager AECOM
Sales and Use Transportation Tax Implementation Plan
 Sales and Use Transportation Tax Implementation Plan Transportation is more than just a way of getting from here to there. Reliable, safe transportation is necessary for commerce, economic development,
Draft Results and Open House
 Waco Rapid Transit Corridor (RTC) Feasibility Study Draft Results and Open House Chris Evilia, Director of Waco Metropolitan Planning Organization Allen Hunter, General Manager Waco Transit System Jimi
PSTA as a Mobility Manager
 PSTA as a Mobility Manager CTA Annual Conference Riverside, CA Bonnie Epstein, Transit Planner November 8, 2017 Pinellas Suncoast Transit Authority (PSTA) St. Petersburg, Florida Introduction 1 PSTA and
The Case for. Business. investment. in Public Transportation
 The Case for Business investment in Public Transportation Introduction Public transportation is an enterprise with expenditure of $55 billion in the United States. There has been a steady growth trend
CNG Strategy/Overview
 CNG Strategy/Overview JACKSONVILLE TRANSPORTATION Future of Transit AUTHORITY Managing Mobility Brad Thoburn Vice President, Planning, Development and Innovation CNG State Strategy/Overview of the Industry
Feasibility Study. Community Meeting March, North-South Commuter Rail Feasibility Study
 Feasibility Study Community Meeting March, 2017 1 Agenda 1. Welcome / Introductions 2. Background / Meeting Purpose 3. Progress to Date Options Evaluated Capital/Operating Costs Ridership 4. Financial
BROWARD BOULEVARD CORRIDOR TRANSIT STUDY
 BROWARD BOULEVARD CORRIDOR TRANSIT STUDY FM # 42802411201 EXECUTIVE SUMMARY July 2012 GOBROWARD Broward Boulevard Corridor Transit Study FM # 42802411201 Executive Summary Prepared For: Ms. Khalilah Ffrench,
Blue Ribbon Committee
 Blue Ribbon Committee February 26, 2015 Kick-off Meeting Blue Ribbon Committee 1 2,228 Metro CNG Buses 170 Bus Routes 18 are Contract Lines Metro Statistics 2 Transitway Lines (Orange/Silver Lines) 20
Office of Transportation Bureau of Traffic Management Downtown Parking Meter District Rate Report
 Office of Transportation Bureau of Traffic Management 1997 Downtown Parking Meter District Rate Report Introduction The City operates approximately 5,600 parking meters in the core area of downtown. 1
Draft Results and Recommendations
 Waco Rapid Transit Corridor (RTC) Feasibility Study Draft Results and Recommendations Chris Evilia, Director of Waco Metropolitan Planning Organization Allen Hunter, General Manager Waco Transit System
Car Sharing at a. with great results.
 Car Sharing at a Denver tweaks its parking system with great results. By Robert Ferrin L aunched earlier this year, Denver s car sharing program is a fee-based service that provides a shared vehicle fleet
MOTION NO. M Preferred Alternative for the Puyallup Station Access Improvement Project
 MOTION NO. M2014 64 Preferred Alternative for the Puyallup Station Access Improvement Project MEETING: DATE: TYPE OF ACTION: STAFF CONTACT: Capital Committee Board PROPOSED ACTION 8/14/14 8/28/14 Recommendation
FasTracks News. RTD s Eagle P3 Transit Project Nears Halfway Mark to Opening Day EP3 will add three commuter rail lines to metro area in 2016
 July 29, 2013 Welcome to Inside RTD FasTracks a monthly e- update to keep you informed about the progress of the Regional Transportation District's FasTracks program. FasTracks News RTD s Eagle P3 Transit
An Overview of Transportation Responsibility
 1 An Overview of Transportation Responsibility Fast Facts Our Business History of Budget Cuts (2007 2013) Benchmark Comparison Proposed Budget Cuts for FY14 Community Input Peer Comparison 2 Mission Statement:
JOINT FACILITIES ADVISORY COMMISSION. ART and APS Bus Parking Informational Session July 27, :30 pm
 ART and APS Bus Parking Informational Session July 27, 2017 7 8:30 pm 2 Agenda Introductions & overview APS Bus Parking APS Bus Facts APS Bus Operations ART Bus Parking Story of ART and its role in County
Transportation Demand Management Element
 Transportation Demand Management Element Over the years, our reliance on the private automobile as our primary mode of transportation has grown substantially. Our dependence on the automobile is evidenced
REPORT CARD FOR CALIFORNIA S INFRASTRUCTURE WHAT YOU SHOULD KNOW ABOUT CALIFORNIA S TRANSIT FACILITIES
 TRANSIT GRADE: C- WHAT YOU SHOULD KNOW ABOUT TRANSIT FACILITIES California needs robust, flexible and reliable transit systems to reduce peak congestion on our highways, provide options for citizens who
MARTA s blueprint for the future. COFFEE AND CONVERSATION Kyle Keahey, More MARTA Atlanta Dec. 5, 2018
 MARTA s blueprint for the future COFFEE AND CONVERSATION Kyle Keahey, More MARTA Atlanta Dec. 5, 2018 TODAY S AGENDA About MARTA Economic development/local impact More MARTA Atlanta program Program summary/timeline
Valley Metro Overview. ITE/IMSA Spring Conference March 6, 2014
 Valley Metro Overview ITE/IMSA Spring Conference March 6, 2014 Valley Metro Who Are We? Operate Regional Transit Services Valley Metro and Phoenix are region s primary service providers Light Rail and
CEDAR AVENUE TRANSITWAY Implementation Plan Update
 CEDAR AVENUE TRANSITWAY Implementation Plan Update EECUTIVE SUMMARY DECEMBER 2015 Executive Summary In 2013, the Twin Cities metropolitan area s first bus rapid transit (BRT) line, the METRO Red Line,
PEACHTREE CORRIDOR PARTNERSHIP. Current Status & Next Steps
 PEACHTREE CORRIDOR PARTNERSHIP Current Status & Next Steps PEACHTREE CORRIDOR PARTNERSHIP Why Peachtree? Why Now? I. THE CONTEXT High Level View of Phasing Discussion Potential Ridership Segment 3 Ease
EUGENE-SPRINGFIELD, OREGON EAST WEST PILOT BRT LANE TRANSIT DISTRICT
 EUGENE-SPRINGFIELD, OREGON EAST WEST PILOT BRT LANE TRANSIT DISTRICT (BRIEF) Table of Contents EUGENE-SPRINGFIELD, OREGON (USA)... 1 COUNTY CONTEXT AND SYSTEM DESCRIPTION... 1 SYSTEM OVERVIEW... 1 PLANNING
PUBLIC TRANSPORTATION
 PUBLIC TRANSPORTATION PROJECT TITLE U-MED DISTRICT MULTI-MODAL IMPROVEMENTS- PHASE II Transit Vehicles and Upgrades MUNICIPALITY OF ANCHORAGE Capital Improvement Program PROJECT LIST BY DEPARTMENT Public
CITY of GUELPH Transit Growth Strategy and Plan, Mobility Services Review. ECO Committee
 CITY of GUELPH Transit Growth Strategy and Plan, Mobility Services Review ECO Committee July 19, 2010 1 Study Purpose Vision and growth strategy for Guelph Transit, ensuring broad consultation Operational
Appendix C. Parking Strategies
 Appendix C. Parking Strategies Bremerton Parking Study Introduction & Project Scope Community concerns regarding parking impacts in Downtown Bremerton and the surrounding residential areas have existed
Executive Summary. Treasure Valley High Capacity Transit Study Priority Corridor Phase 1 Alternatives Analysis October 13, 2009.
 Treasure Valley High Capacity Transit Study Priority Corridor Phase 1 Alternatives Analysis October 13, 2009 Background As the Treasure Valley continues to grow, high-quality transportation connections
Vanpooling and Transit Agencies. Module 3: Benefits to Incorporating Vanpools. into a Transit Agency s Services
 Vanpooling and Transit Agencies Module 3: Benefits to Incorporating Vanpools into a Transit Agency s Services A common theme we heard among the reasons why the transit agencies described in Module 2 began
TORONTO TRANSIT COMMISSION REPORT NO.
 Revised: March/13 TORONTO TRANSIT COMMISSION REPORT NO. MEETING DATE: March 26, 2014 SUBJECT: COMMUNITY BUS SERVICES ACTION ITEM RECOMMENDATION It is recommended that the Board not approve any routing
Kendall Drive Premium Transit PD&E Study Project Kick-Off Meeting SR 94/Kendall Drive/SW 88 Street Project Development and Environment (PD&E) Study
 Study") Florida Department of Transportation District Six Kendall Drive Premium Transit PD&E Study Project Kick-Off Meeting SR 94/Kendall Drive/SW 88 Street Project Development and Environment (PD&E) Study What
Florida Department of Transportation District Six Kendall Drive Premium Transit PD&E Study Project Kick-Off Meeting SR 94/Kendall Drive/SW 88 Street Project Development and Environment (PD&E) Study What
Exhibit A Sound Transit Board Resolution R Selecting the bicycle, pedestrian, and parking access improvements to be built for the Puyallup
 Exhibit A Sound Transit Board Resolution R2016-07 Selecting the bicycle, pedestrian, and parking access improvements to be built for the Puyallup Access Improvement Project. RESOLUTION NO. R2016-07 Selecting
More than $9 Million coming to Central Valley for transportation
 More than $9 Million coming to Central Valley for transportation From free bus service to electric buses Part of overall $97 Million awarded to public transportation projects A total of 152 local public
2030 Multimodal Transportation Study
 2030 Multimodal Transportation Study City of Jacksonville Planning and Development Department Prepared by Ghyabi & Associates April 29,2010 Introduction Presentation Components 1. Study Basis 2. Study
Transit System Technical Report
 Transit System Technical Report Table of Contents Introduction... 1 Regional Setting... 1 Road Network... 1 The Mass Transportation Authority FY 2016-2020 Plan... 2 Other Growth Areas... 5 Senior Citizens...
The Engineering Department recommends Council receive this report for information.
 CORPORATE REPORT NO: R161 COUNCIL DATE: July 23, 2018 REGULAR COUNCIL TO: Mayor & Council DATE: July 19, 2018 FROM: General Manager, Engineering FILE: 8740-01 SUBJECT: Surrey Long-Range Rapid Transit Vision
Click to edit Master title style
 Nelson/Nygaard Consulting Associates SERVICE IMPROVEMENT STRATEGIES September 22, 2015 1 PROJECT OVERVIEW & WORK TO DATE 1. Extensive stakeholder involvement Throughout 2. System and market assessment
Commuter Transit Service Feasibility
 Commuter Transit Service Feasibility West Michigan Transit Linkages Study Submitted to: Ottawa County, Michigan Submitted by: MP2PLANNING, LLC AUGUST 2012 Table of Contents 1. Introduction... 2 2. Overall
Northeast Corridor Alternatives Analysis. Public Involvement Round 2 Input on Alternatives for Further Study
 Northeast Corridor Alternatives Analysis Public Involvement Round 2 Input on Alternatives for Further Study Feb. 7-9, 2012 Agenda Review project background Progress summary Recommended alternatives for
12/5/2018 DRAFT. December 6, Item #1 CITIZENS PARTICIPATION
 December 6, 2018 Item #1 CITIZENS PARTICIPATION 1 Item #2 APPROVAL OF MINUTES Item #3 TRAC GOALS, FRAMEWORK & AGENDA REVIEW 2 COMMITTEE GOALS Learn about Southern Nevada s mobility challenges, new developments
August 2, 2010 Public Meeting
 Public Meeting LYMMO Expansion Alternatives Analysis Study Purpose of study is to provide a fresh look at potential LYMMO expansion, following Federal Transit Administration (FTA) Alternatives Analysis
Treasure Island Toll Policy, Affordability and Transit Pass Programs. TIMMA Board Meeting December 11, 2018
 Treasure Island Toll Policy, Affordability and Transit Pass Programs TIMMA Board Meeting December 11, 2018 Avoiding Island Gridlock 2 Island Mobility Goals Incentivize transit, walking, and biking Discourage
Improving Accessibility of Regional Bus Stops and Pathways
 Customer Service and Operations Committee Board Information Item III-A March 13, 2014 Improving Accessibility of Regional Bus Stops and Pathways Page 3 of 17 Washington Metropolitan Area Transit Authority
Denver Car Share Program 2017 Program Summary
 Denver Car Share Program 2017 Program Summary Prepared for: Prepared by: Project Manager: Malinda Reese, PE Apex Design Reference No. P170271, Task Order #3 January 2018 Table of Contents 1. Introduction...
Memorandum. To: The Arlington County Board Date: June 29, 2018 From: Subject:
 OFFICE OF THE COUNTY MANAGER 2100 Clarendon Boulevard, Suite 302, Arlington, VA 22201 TEL 703.228.3120 FAX 703.228.3218 TTY 703.228.4611 www.arlingtonva.us Memorandum To: The Arlington County Board Date:
METRO TRANSIT a n n ua l re p o r t. madison, wisconsin // mymetrobus.com
 METRO TRANSIT 2016 a n n ua l re p o r t madison, wisconsin // mymetrobus.com metro transit In 2016, Metro Transit took steps to address capacity issues both on and off the road. Off the road, Metro began
Mass Transit in Charlotte and San Antonio. Keith T. Parker, AICP
 Mass Transit in Charlotte and San Antonio Keith T. Parker, AICP President/CEO Presentation Overview Charlotte Agency and Customer Profile San Antonio Agency and Customer Profile Attracting New Customers
Executive Summary. Draft Environmental Impact Statement/Environmental Impact Report ES-1
 Executive Summary Introduction The Eastside Transit Corridor Phase 2 Project is a vital public transit infrastructure investment that would provide a transit connection to the existing Metro Gold Line
Chapter 7: Travel Demand Analysis. Chapter 8. Plan Scenarios. LaSalle Community Center. Image Credit: Town of LaSalle
 Chapter 7: Travel Demand Analysis Chapter 8 Plan Scenarios LaSalle Community Center. Image Credit: Town of LaSalle 164 Chapter 8: Plan Scenarios Moving Ahead for Progress in the 21 st Century Act (MAP
Broward County Intermodal Center And People Mover. AASHTO Value Engineering Conference Presentation. September 1, 2009 San Diego, CA
 Project Development & Environment Study Broward County Intermodal Center And People Mover AASHTO Value Engineering Conference Presentation September 1, 2009 San Diego, CA Background P D & E Study Regional
Martha s Vineyard Regional Transit Authority
 Martha s Vineyard Regional Transit Authority Annual Report Fiscal Year 2005 Martha s Vineyard Transit Authority Fiscal Year ending June 30, 2005 Annual Report Angela E. Grant, Administrator Advisory Board
STRATEGIC PRIORITIES AND POLICY COMMITTEE MAY 5, 2016
 STRATEGIC PRIORITIES AND POLICY COMMITTEE MAY 5, 2016 Shift Rapid Transit Initiative Largest infrastructure project in the city s history. Rapid Transit initiative will transform London s public transit
Metro Transit Update. Christina Morrison, Senior Planner Metro Transit BRT/Small Starts Project Office. John Dillery, Senior Transit Planner
 Metro Transit Update Christina Morrison, Senior Planner Metro Transit BRT/Small Starts Project Office John Dillery, Senior Transit Planner Metro Transit Service Development May 16, 2013 1 Transit Planning
2/1/2018. February 1, Item #1 CITIZENS PARTICIPATION
 February 1, 2018 Item #1 CITIZENS PARTICIPATION 1 Item #2 APPROVAL OF MINUTES Item #3 TRAC GOALS, FRAMEWORK & AGENDA REVIEW 2 COMMITTEE GOALS Learn about Southern Nevada s mobility challenges, new developments
Back ground Founded in 1887, and has expanded rapidly Altitude about 2500 meters above MSL Now among the ten largest cities in Sub Saharan Africa
 Back ground Founded in 1887, and has expanded rapidly Altitude about 2500 meters above MSL Now among the ten largest cities in Sub Saharan Africa Annual growth rate is 3.8% By 2020 population growth would
CTfastrak Expansion. Stakeholder Meeting #4 Manchester Town Hall June 3, 2016
 CTfastrak Expansion Stakeholder Meeting #4 Manchester Town Hall June 3, 2016 Today s Agenda Phase I Update 2016 Service Plan Implementation Schedule & Cost Update Phase II Services Timeline Market Analysis
I-26 Fixed Guideway Alternatives Analysis
 I-26 Fixed Guideway Alternatives Analysis Steering & Technical Advisory Committees Joint Meeting January 15, 2016 @ 10:00 AM SC/TAC Meeting Winter 2016 Agenda I. Welcome & Introductions II. III. Project
STAFF REPORT CITY COUNCIL MEETING SEPTEMBER 15, 2015
 SHED BUSINESS a "making a positive difference now" TO: FROM: RE: STAFF REPORT CITY COUNCIL MEETING SEPTEMBER 15, 2015 Honorable Mayor and City Council Nancy Kerry, City Manager Discussion and Possible
RE: Comments on Proposed Mitigation Plan for the Volkswagen Environmental Mitigation Trust
 May 24, 2018 Oklahoma Department of Environmental Quality Air Quality Division P.O. Box 1677 Oklahoma City, OK 73101-1677 RE: Comments on Proposed Mitigation Plan for the Volkswagen Environmental Mitigation
The WRTA is your community s link to Public Transportation.
 Welcome to the WRTA The WRTA is your community s link to Public Transportation. Did you know The Worcester Regional Transit Authority (WRTA) is the second largest regional transit authority in Massachusetts,
CITY OF LONDON STRATEGIC MULTI-YEAR BUDGET ADDITIONAL INVESTMENTS BUSINESS CASE # 6
 2016 2019 CITY OF LONDON STRATEGIC MULTI-YEAR BUDGET ADDITIONAL INVESTMENTS BUSINESS CASE # 6 STRATEGIC AREA OF FOCUS: SUB-PRIORITY: STRATEGY: INITIATIVE: INITIATIVE LEAD(S): BUILDING A SUSTAINABLE CITY
Charlotte Area Transit System: Moving Forward John Lewis CATS Chief Executive Officer
 Charlotte Area Transit System: Moving Forward John Lewis CATS Chief Executive Officer House Select Committee March 2018 1 Charlotte Long-Term Growth Management Strategy Centers, Corridors and Wedges Five
Leadership NC. November 8, 2018
 v Leadership NC November 8, 2018 Planning for our region s growth The Triangle is one of the fastestgrowing regions in the nation. More than 2 million people are already part of the equation, and the
Program Overview. February 2018
 Program Overview February 2018 Nashville is growing 2 and traffic is getting worse 5 Nashville spoke; we listened Transit Improvement Program Frequent Transit Bus AccessRide and Mobility on Demand Neighborhood
Seoul. (Area=605, 10mill. 23.5%) Capital Region (Area=11,730, 25mill. 49.4%)
 Capital Region (Area=11,730, 25mill. 49.4%)") Seoul (Area=605, 10mill. 23.5%) Capital Region (Area=11,730, 25mill. 49.4%) . Major changes of recent decades in Korea Korea s Pathways at a glance 1950s 1960s 1970s 1980s 1990s 2000s Economic Development
Seoul (Area=605, 10mill. 23.5%) Capital Region (Area=11,730, 25mill. 49.4%) . Major changes of recent decades in Korea Korea s Pathways at a glance 1950s 1960s 1970s 1980s 1990s 2000s Economic Development
Downtown Transit Connector. Making Transit Work for Rhode Island
 Downtown Transit Connector Making Transit Work for Rhode Island 3.17.17 Project Evolution Transit 2020 (Stakeholders identify need for better transit) Providence Core Connector Study (Streetcar project
2011 Saskatoon Transit Services Annual Report
 2011 Annual Report Saskatoon Transit provides a high quality of service for all citizens in our community, and is undertaking initiatives focused on building its ridership. Saskatoon, like most North American
April 2010 April 2010 Presented by Alan Eirls
 April 2010 April 2010 Presented by Alan Eirls A Partnership Between the Coeur d Alene Tribe, the State of Idaho, the KMPO, and Kootenai County. Current System The Citylink system began on the Coeur d Alene
Utah Transit Authority Rideshare. CTAA Conference June 12, 2014
 Utah Transit Authority Rideshare CTAA Conference June 12, 2014 UTA Statistics and Info A Public Transit Agency Six counties, about 1600 square miles Within this area is 80% of the state s population, an
Amman Green Policies Projects and Challenges. Prepared by: Eng. Sajeda Alnsour Project coordinator Sept. 20, 2017
 Amman Green Policies Projects and Challenges Prepared by: Eng. Sajeda Alnsour Project coordinator Sept. 20, 2017 Amman: Demographics Greater AMMAN Municipality GAM Amman is the capital of Jordan with a
Proposed Program of Interrelated Projects
 DALLAS AREA RAPID TRANSIT Proposed Program of Interrelated Projects Federal Transit Administration Capital Investment Program Summer 204 INTRODUCTION The current federal transportation bill, Moving Ahead
Sound Transit Operations July 2016 Service Performance Report. Ridership
 Ridership Total Boardings by Mode Mode Jul-15 Jul-16 % YTD-15 YTD-16 % ST Express 1,618,779 1,545,852-4.5% 10,803,486 10,774,063-0.3% Sounder 333,000 323,233-2.9% 2,176,914 2,423,058 11.3% Tacoma Link
Whither the Dashing Commuter?
 Whither the Dashing Commuter? The MTA in a Changing Region William Wheeler Director of Special Project Development and Planning Travel in the New York Region has changed from the days of the 9 to 5 commute
I-26 Fixed Guideway Alternatives Analysis
 I-26 Fixed Guideway Alternatives Analysis Public Meetings: North Charleston, January 25, 2016 Charleston: January 26, 2016 Summerville: January 28, 2016 Agenda I. Project Update II. III. IV. Screen Two
Tarrant County Projected Population Growth
 Based on the information provided in the preceding chapters, it is apparent that there are a number of issues that must be addressed as The T works to develop an excellent transit system for Fort Worth
Green Line Long-Term Investments
 Enhancements Short-term improvements to keep Austin moving. Investments Long-term projects to support our future. Mobility Hubs MetroRapid MetroRail MetroExpress Connectors Circulators Project Connect
2 EXISTING ROUTE STRUCTURE AND SERVICE LEVELS
 2 EXISTING ROUTE STRUCTURE AND SERVICE LEVELS In the Study Area, as in most of the Metro Transit network, there are two distinct route structures. The base service structure operates all day and the peak
Tempe Streetcar. March 2, 2016
 Tempe Streetcar March 2, 2016 Tempe Profile 40 sq. miles, highest density in state University Town, center of region Imposed growth boundaries (density increase) Mixed use growth/intensifying land use
Husky Stadium: TMP Modernization Project
 Husky Stadium: TMP Modernization Project 1 Husky Stadium: TMP History 2 Husky Stadium TMP History 1986-1987 Husky Stadium adds the north upper deck. City of Seattle and UW agree on a plan (TMP) to mitigate