UPM THE BIOFORE COMPANY. Investor presentation December 2017
|
|
|
- Michael Allen
- 5 years ago
- Views:
Transcription


1 UPM THE BIOFORE COMPANY Investor presentation December 217

2 UPM today UPM BIOREFINING Pulp Biofuels Timber UPM ENERGY Electricity generation and trading UPM RAFLATAC Label materials for product and information labelling UPM SPECIALTY PAPERS Label papers, release liners, office papers and flexible packaging UPM PAPER ENA Magazine papers, newsprint and fine papers UPM PLYWOOD Plywood and veneer products UPM BIOCOMPOSITES UPM BIOCHEMICALS WOOD SOURCING AND FORESTRY 2 UPM


3 Global businesses local presence 13% North America UPM s sales by market 216 EUR 9,812 million 63% Europe 18% Asia 54 production plants in 12 countries 12, customers in 12 countries 85, shareholders in 4 countries 6% Rest of the world 19,3 employees in 45 countries 55, suppliers in 7 countries 3 UPM
4 UPM in transformation 28 vertically integrated paper company 216 six separate businesses Operating model Promotes value creation Sales 1 % 8 % 6 % 4 % 2 % Paper Plywood Raflatac Sawmilling 1 % 8 % 6 % 4 % 2 % Paper ENA Plywood Energy Specialty Papers Raflatac Biorefining Others Business portfolio Increasing share of businesses with strong long-term fundamentals for profitability and growth % % Sales EBIT *) ROE *) EUR 9.5bn EUR 513m 3.5% EUR 9.8bn EUR 1,143m 1.9% Business performance Continuous improvement in financial, social and environmental performance Net debt Market cap EUR 4.3bn EUR 4.7bn EUR 1.1bn EUR 12.5bn Disciplined capital allocation Driving value creation *) excluding special items for 28, comparable figures for UPM


5 Competitive businesses with strong market positions Operating on healthily growing markets UPM PLYWOOD Plywood, veneer ~3% UPM PAPER ENA Graphic papers ~ 4% Growth drivers: Private consumption Sustainability Population growth Urbanisation E-commerce Construction Transportation 5 UPM UPM Specialty Papers Label papers ~4% High-end office papers ~4% UPM ENERGY Electricity ~1% UPM RAFLATAC Self-adhesive labels ~4% UPM BIOREFINING Pulp ~3% Biofuels strong Timber ~2% By comparable EBIT 216 Demand trend growth, % pa

6 CAPACITY CLOSURES AND DIVESTMENTS FOCUSED INVESTMENTS Increasing share of businesses with strong longterm fundamentals for profitability and growth Sales 216 1% 75% Sustainable growth UPM Biorefining UPM Raflatac UPM Specialty Papers UPM Plywood Pulp +7, t Pulp +1, t Pulp +17, t Label stock expansions Renewable diesel +12m litres Specialty papers +36, t Pulp mill efficiency improvement Plywood +4, m 3 Pulp +17, t Specialty labels expansion Label stock Plywood expansion Pulp +45, m 3 +3, t UPM Energy 5% 25% Maintaining strong cash flow UPM Paper ENA , t magazine 16, t fine 46, t magazine 28, t news 345, t news 195, t magazine 35, t magazine Hydropower 128, t magazine 19 % 6 UPM
7 Value creation through sustainable growth and cash generation 1% Sales 216 EURm 1 Comparable EBIT, growing businesses combined % of sales 2 75% 5% UPM Biorefining UPM Raflatac UPM Specialty Papers UPM Plywood UPM Energy LTM Sustainable growth Commercial success Cost efficiency Focused growth investments Product mix development 25% UPM Paper ENA EURm Operating cash flow, UPM Paper ENA Maintain strong cash flow Commercial success Cost efficiency Efficient use of assets, including restructuring % 7 UPM LTM

8 Growth initiatives focused growth projects have contributed well to UPM s profits and returns Current ongoing focused growth projects Kymi pulp mill expansion 2 Raflatac expansions in Poland and Finland Kaukas pulp mill expansion 2 Chudovo plywood mill expansion Long term growth opportunity in pulp Agreement with the Government of Uruguay to establish a competitive operating platform in Uruguay New biomolecule businesses Evaluation of building a biochemicals refinery Lappeenranta Biorefinery reached designed capacity and generates a good financial return 8 UPM

9 Focused investments are delivering growth Sales 216 1% UPM Biorefining Pulp CAGR +3% Biofuels New business 75% Average delivery growth UPM Raflatac UPM Specialty Papers Standard products CAGR +4% Films and specials CAGR +8% Label materials CAGR +4% Cut-size CAGR +6% 5% UPM Plywood Plywood CAGR +3% 25% % 9 UPM
10 Business area long-term targets compared with realised returns UPM Energy ROCE % * ) UPM Biorefining ROCE % ) UPM Specialty Papers 3 ROCE % UPM Paper ENA FCF/CE % UPM Plywood ROCE % UPM Raflatac ROCE % * ) UPM Energy shareholdings valued at fair value 1 UPM Long-term return target
11 Group financial performance EURm 1 4 Comparable EBIT % Comparable ROE 12 Net debt EURm 4 5 Net debt and leverage Net debt/ EBITDA (x) 3, 1 2 Target: EBIT growth 1 Target: 1% , Policy: 2x 2, , , , LTM LTM LTM, 11 UPM Comparable figures for , excluding special items for earlier years
12 5-year cumulative cash flow disciplined capital allocation in action Strong operating cash flow EUR 5.9bn Focused investments EUR 1.9bn Deleveraging Attractive dividend EUR 2.1bn EUR 1.9bn Industry-leading balance sheet Net debt /EBITDA.41x 12 UPM
13 Capital allocation maintaining capability for future opportunities 1. Maintain strong balance sheet, investment grade metrics Net debt/ebitda 2x or less Attractive dividend 3-4% of operating cash flow per share Capex in attractive focused growth projects IRR exceeds ROCE targets Capex in attractive larger growth opportunities IRR exceeds ROCE targets M&A, if the opportunity and timing are right IRR exceeds ROCE targets 4. Additional shareholder distribution selectively balance long term free cash flow cycles 13 UPM
14 Strong cash flow and balance sheet EURm UPM Free cash flow Operating cash flow Operating cash flow 1, Q3/17 LTM Q3/17 operating cash flow EUR 486m Working capital decreased by EUR 54m Net debt EURm Net debt Net debt / EBITDA (trailing12 months) 4, 3,5 3, Net debt / EBITDA 2,5 2, 1,5 1, 623 Net debt,5.41x, Q3/17 LTM
15 Dividend EUR per share 1,,8 % of operating cash flow per share 1 8 Dividend policy UPM aims to pay an attractive dividend, 3 4% of operating cash flow per share,6,4, Dividend for 216 EUR.95 (.75) per share, totalling EUR 57m 3% of 216 operating cash flow, UPM
16 Low investment needs in existing assets allow growth projects with modest total capex EURm Uruguay acquisition Capital expenditure Myllykoski acquisition Strategic investments Operational investments Depreciation Focused growth investments Good returns and fast payback Low implementation risk Financed from operating cash flow Low replacement investments Asset quality in 486 all businesses, e.g. large competitive pulp mills UPM Paper ENA Modest total capex and attractive returns 16 UPM
17 Q3 217 excellent quarter and further steps in transformation Comparable EBIT increased by 12% to EUR 351m (314m) Good growth in deliveries and strong operational efficiency with no significant maintenance activity Operating cash flow was EUR 486m (56m), net debt decreased to EUR 623m (1,479m) EURm Comparable EBIT UPM transformation continues with new initiatives for future growth UPM

18 Q3 217 Good market demand UPM BIOREFINING Good demand, pulp deliveries +5%, strong growth in biofuels Pulp prices higher No significant maintenance UPM SPECIALTY PAPERS Good demand, deliveries +3% Significant progress in product mix, higher release liner deliveries Input cost inflation mitigated UPM PAPER ENA Graphic paper deliveries 1% Seasonally low fixed costs, including maintenance Fibre costs higher UPM ENERGY Electricity deliveries 7% Hydropower generation recovered to normal level, below last year s high level UPM RAFLATAC Good demand globally, deliveries +9% driven in particular by developing markets Input cost inflation in sales margins UPM PLYWOOD Good demand, deliveries +4% Modest input cost inflation in sales margins 18 UPM
19 Comparable EBIT by business area EURm 18 UPM Biorefining % of sales 3 EURm 12 UPM Energy % of sales 6 EURm 12 UPM Paper ENA % of sales EURm 5 UPM Specialty Papers % of sales EURm UPM Raflatac % of sales 12,5 5 12,5 EURm 25 UPM Plywood % of sales ,5 3 7, ,5 1 2, UPM
20 Comparable EBIT in Q3 217 vs. Q3 216 Prices increased more than variable costs. Growth in deliveries continued. Currencies had a negative impact. Growth in deliveries in Biorefining, Raflatac, Specialty Papers and Plywood. Pulp prices increased. EURm % Prices Deliveries Fixed costs Variable costs Currency, net impact Depr., forests, plantations % EURm % Biorefining Energy Raflatac Specialty Papers Paper ENA Plywood Other operations and eliminations % Q3/16 Q3/17 Q3/16 Q3/17 2 UPM

21 Outlook for 217 UPM s profitability improved significantly in 216 and is expected to continue on a good level in 217. Comparable EBIT is expected to increase in 217 compared with 216. Demand growth is expected to continue for most of UPM s businesses, while demand decline is expected to continue for UPM Paper ENA. The focused growth projects continue to contribute to UPM s performance. Following a deflationary environment in recent years, 217 is expected to show modest input cost inflation. UPM will continue measures to reduce fixed and variable costs to mitigate this. Q4 217 is expected to include more maintenance activity than Q3 217 in UPM Biorefining and UPM Paper ENA. 21 UPM


22 Responsibility is good business Creating value through products and innovation Creating competitive advantage and long-term value by efficiency Risk mitigation by responsible value chain and production "We believe that customers, investors and other stakeholders value responsible operations that keep risks under control and add to our business opportunities, thereby increasing the company value. 22 UPM
23 Creating competitive advantage and long-term value by engagement Per million hours Safety Index Employee engagement EUR million Productivity 25 9, Lost-time accident frequency Manager effectiveness Employee engagement,55,5,45,4,35,3,25 Sales per employee 3,2 5-year change: 76% 5-year change: +9 5-year CAGR: +4% pa 23 UPM


24 Creating competitive advantage and long-term value by efficiency Case: UPM Changshu mill in China Water 6% Per tonne of paper COD in effluent 75% Per tonne of paper water intake water discharge Energy 3% Per tonne of paper SO 2 emission 9% Per tonne of paper Waste to landfill 6% Per tonne of paper Certified fibre 85% In compared to 25 Source: UPM 24 UPM
 investors form a significant part of UPM s")

25 Consistent long-term work receives external recognition UPM in sustainability indices Sustainable and Responsible (SRI) investors form a significant part of UPM s shareholders SRI, % of total institutional shareholders CDP s Climate Change Program: A- score UPM Industrials & Materials Europe 25 UPM Source: Nasdaq, September 216
26 UPM Biorefining Market pulp consumed in growing end-uses supply of alternative white fibres declines Global paper and board production Specialty Tissue Market pulp consumption in growing end-uses Cartonboard Stressed supply of white recycled fibre Graphic papers Containerboard Mixed collection crowding out white recycled fibre 26 UPM

27 UPM Biorefining Case: Market pulp consumption in growing end-uses Fibre consumption in tissue, cartonboard and specialty end-uses White integrated pulp White market pulp 1 3 5% demand increase in tissue, cartonboard and specialty end-uses +1.5 Increase in market pulp consumption Other fibres (RCP, mechanical pulps ) 85 Million tonnes Source: Pöyry, Hawkins Wright, UPM 27 UPM
28 UPM Biorefining Case: Stressed supply of white recycled paper 5% fall in global graphic paper production Fall in market pulp demand Market pulp to replace fall in white recycled paper supply Net increase in market pulp demand 125 Million tonnes Source: Pöyry, UPM 28 UPM
29 UPM Biorefining Case: Mixed collection crowding out white recycled fibre White RCP grades 75 5%-point increase in mixed collection share Mixed RCP Market pulp to replace fall in white recycled paper Old corrugated boxes 135 Million tonnes Source: Pöyry, UPM 29 UPM
30 UPM Biorefining Summary of pulp demand outlook Increase in end use will drive fibre demand in coming decades Mt 6 Mt Decline in Graphic papers 5 4 Growth in Market pulp vs. decline in Integrated pulp 3 Healthy growth in other White Papers & Boards 3 Declining White RCP Strong growth in Containerboards (brown fibre) Demand of Brown fibre may overwhelm the supply Newsprint WF Spec. & other Container-boards WC Tissue & fluff Carton-boards WF: Wood-free graphical papers WC: Wood-containing graphical papers (magazine grades) Market pulp RCP White Non-wood RCP Brown Integrated pulp Mechanical pulp Unbleached pulp Estimated growth of White RCP + Integrated Pulp + Market Pulp is still conservative (~1 Mt/a) Source: UPM, Pöyry, RISI 3 UPM

31 UPM Biorefining White fibres in different stages of life-cycle; 64 Mt capacity closed within UPM
32 UPM Biorefining Demand-supply drivers of pulp market 32 UPM Demand Supply Short term Re- and destocking of inventories Maintenance stoppages Production issues End use demand Capacity closures Conversions New mill starts Debottleneck investments Sustainable, renewable and recyclable Food product safety Replacing plastics Decline of graphic paper production and scarcity of recycled fibre Long term Population growth Urbanisation Middle class expansion Aging demography Availability of competitive mill locations E-commerce Plantations, sustainable wood raw material Water availability Infrastructure
33 UPM Biorefining Chemical pulp market prices EUR/tonne 9 Pulp market prices, EUR USD/tonne 11 Pulp market prices, USD BHKP, Europe, EUR BHKP, China, EUR NBSK, Europe, EUR NBSK, China, EUR BHKP, Europe BHKP, China NBSK, Europe NBSK, China 33 UPM Source: FOEX Indexes Ltd, ECB


34 UPM Biorefining Potential pulp mill in Uruguay could be a competitive alternative time schedule is several years Investment Agreement signed Potential UPM Investment Decision Phase I Phase II Phase III 34 UPM


35 UPM Biorefining Establishing a competitive operating platform in Uruguay Current operations Uruguay prospect Plantation base at the littoral Plantation base at Rio Negro basin Fray Bentos pulp mill 1.3 million tonnes ~1 km of river barging for outbound logistics Sea port in Nueva Palmira loading half vessels Ocean vessels to pulp markets Potential new pulp mill about 2 million tonnes Railway with high technical standards Deep sea port in Montevideo loading full vessels Ocean vessels to pulp markets 35 UPM
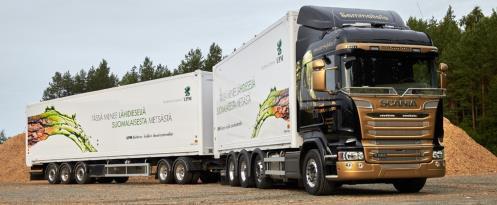
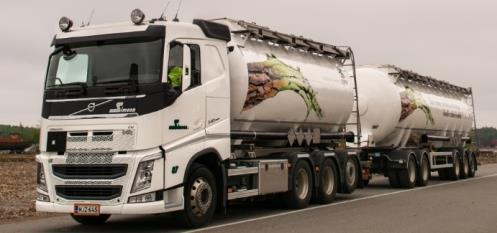
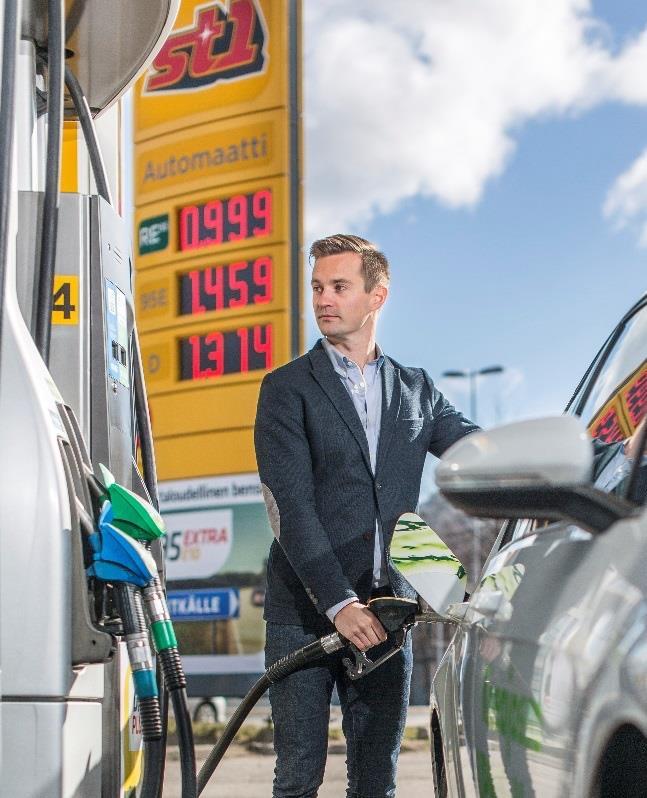
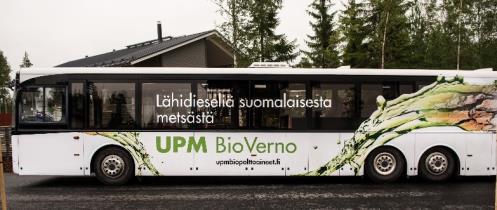


36 UPM Biorefining UPM Biofuels in existing and future end-use Fuel retail Dedicated green fleets Marine/Aviation 36 UPM
37 UPM Biorefining UPM Biofuels business evolving Technology and Business case proven Commercial start 215 UPM enters Biofuels Investment decision 212 Biocrude concept shaping Evaluate technologies, define business case Build Lappeenranta Biorefinery and Biofuels organization Establish Bioverno as a benchmark product and brand in biofuels Start evaluation of future growth opportunities UPM
38 UPM Biorefining Significant emission cuts needed in transportation sector EU s greenhouse gas reduction targets cannot be met without significant emission cuts in transport actions needed in all sectors 8% by 25 EU s overall GHG reduction targets 4% by 23 25% of total emissions in Europe from transport Marine 14% Aviation 13% Road transport, heavy-duty 18% Road transport, light-duty 55% Drop-in biofuels are a solution for GHG reduction in all transport sectors Electric vehicles can be applied in light-duty road transport 6% by 24 Transport emissions by sector 38 UPM
39 UPM Energy Cost competitive and flexible asset base Power generation breakdown Condensing power Flexible hydro production with optimisation opportunities Nuclear as reliable base load with worldclass availability performance 39 UPM
40 UPM Energy UPM Energy power generation assets UPM Energy s power generation MW EURm Hydropower holdings Nuclear power OL1 and OL2 58 1,31 Nuclear power OL3 under construction (5) 178 Condensing power 19 8 Illustration Cost of sourced electricity from shareholdings UPM Energy s shareholdings in total, valued at fair value 1,335 1,94 UPM own hydropower assets 16 UPM Energy s in total (excl. OL3) 1,495 UPM Energy capital employed 2,267 In addition to its own power generation, UPM Energy sources electricity from part owned energy companies at full cost (cost-price principle) Sales Opex Depreciation Interest and Contribution to finance costs EBITDA from shareholdings EBITDA from UPM ow n hydropow er assets UPM Energy EBITDA 4 UPM
41 UPM Energy Cost efficient generation enables robust profitability also in challenging market environment MWh Market electricity prices vs UPM sales price Helsinki Front Year System Front Year UPM average sales price UPM Energy profitability Q117 Q217 Q317 Comparable EBIT, EURm % of sales UPM


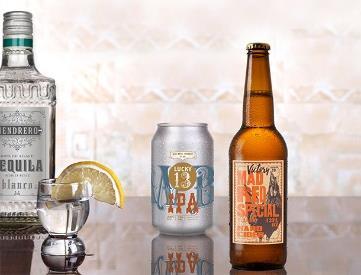

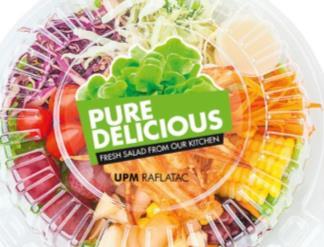


42 UPM Raflatac Self-adhesive labels in end-use PHARMACEUTICALS WINE, SPIRITS & CRAFT BEVERAGE FOOD HOME & PERSONAL CARE DURABLES TRANSPORT & LOGISTICS RETAIL, OIL & INDUSTRIAL A4 & CUT-SIZE SECURITY & BRAND PROTECTION TYRE 42 UPM

43 UPM Raflatac Leading position in a growing market The self adhesive labelstock market > EUR 8bn global market ~ 4% p.a. growth Private consumption driven UPM Raflatac market shares EMEIA 25 % Americas 15 % APAC 1 % UPM Raflatac 75 % 85 % 9 % #2 globally Business in 12 countries > 8, customers 3, people in six continents 43 UPM

44 UPM Raflatac Continuing growth 1. Capturing the market growth in the current markets and product areas 2. Increased distribution coverage and customer reach 3. Wider product portfolio 4. M&A when opportunities emerge Enabled by scalable operating platform & efficient investments Tailored marketing Population growth Productivity Single households Reliability Consumerism Packaged food Private consumption Label demand Urbanisation E-commerce Sustainability Differentiation Retailing changes Regulation Shelf-appeal Higher standard of living Product safety Ease of use 44 UPM


45 UPM Specialty Papers Focus on global Labelling materials, Packaging in Europe and Office paper in APAC LABELLING MATERIAL PACKAGING OFFICE PAPER APAC 45 UPM
46 UPM Specialty Papers Our end use markets are growing LABELING MATERIAL PACKAGING OFFICE PAPER ASIA CASE: Siliconized release liner market, 44 Bn m CAGR 5% 9% 3% Paper flexpack, k tonnes CAGR 2% 5% % Asian cut size market, million tonnes OTH AUS SEA KOR JPN CAGR 2.5 % 6% -2% 3% 1%.6% E 2.5% 4% 4% E -,5% 3% 2% CHN E 5% ~$12 Bn ~$4 Bn ~$58 Bn Mkt value Asia North America Europe South America MEA 46 UPM


47 UPM Specialty Papers Global release liner market: Applications Medical 3 % Graphic film 5 % Food & bakery 5 % Envelope 2 % Others 3 % Hygiene 9 % Industrial 11 % 48.6 Bn m 2 Label 49 % Product functions: Release liner carries the adhesive and face material Prevents the adhesive from sticking permanently Important and often critical feature of a layered construction Tapes 13 % 47 UPM Source: AWA
, regulation (archiving) and lack of common")


48 UPM Paper ENA Paper demand by end use different trends Million tonnes 2 Mt 6 Mt Book & Directories Home & Office Historically Home & Office end-use has been the most resilient to structural changes Despite the digital alternatives personal preferences (way of working and learning), regulation (archiving) and lack of common standards have mitigated the change A moderate decline has taken place in Direct marketing end-use Paper based marketing is still recognized to be the most effective medium for retailers and cataloguers 1 Mt Direct marketing Steady decline in Magazine Publishing circulation and pagination, however number of titles increasing Publishers still rely heavily on the revenues from print 7 Mt Magazine publishing Newspaper publishing being historically the most vulnerable to structural changes but remarkable differences between countries 6 Mt Newspaper publishing Monetizing digital circulation for Magazines and Newspapers continue to be challenging Source: Euro-Graph 48 UPM
49 UPM Paper ENA Paper price vs. cash cost of marginal cost producer EUR/t Price Cash cost of a marginal producer UPM Sources: PPI, RISI, Pöyry
50 Graphic paper prices EUR/t 1 Europe USD/t 11 North America USD/t 11 China News SC LWC WFC WFU News SC LWC WFC WFU WFC r (1% chemical pulp) Uncoated Woodfree Reels (1% chemical pulp) Sources: PPI, RISI 5 UPM


51 UPM Plywood UPM Plywood in end-use Construction Vehicle flooring LNG shipbuilding 51 UPM
52 UPM Plywood Relevant high-end market offers meaningful growth potential Low-end markets EMEA market 12 Mm 3 Relevant market ~5 million m 3 High-end demanding applications & customers Medium range standard products EMEA region Global LNG business Global plywood market ~84 Mm 3 Europe is net importer of plywood Imports focus mainly on standard products in mid-low ranges Non-footprint markets Source: FEIC; FAOSTAT; UPM 52 UPM


53 EVOLUTION OF WOOD USAGE Biofuels and biochemicals are natural evolutionary steps in wood based value creation BIOMOLECULE Biofuels Biochemicals FIBER Pulp, Paper and Packaging Label Biocomposite LOG Sawn goods Plywood 53 UPM TREE PUU Energy


 3% Hemicellulose")

54 Biochemicals biorefinery targeting to produce bio- MEG, bio-mpg and lignin from hardwood BIOREFINERY PROCESS 4% Cellulose STEP 1: SUGAR PULPING Disintegrating wood into sugars, lignin and green energy STEP 2: CHEMICAL CONVERSION Conversion of sugars into targeted biochemicals Bio-Monoethylene glycol (MEG) 3% Hemicellulose BIOMASS 2 % SUGARS Bio-Monopropylene glycol (MPG) 25% Lignin Lignin GREEN ENERGY 54 UPM


55 Biochemicals products are sustainable and competitive drop-in alternatives for brand owners bmeg Mono Ethylene Glycol Existing fossil-based market Market demand > 26 mio tons CAGR >3% Application examples: bmpg Mono Propylene Glycol Existing fossil-based market Market demand >2 mio tons Monopropylene glycol CAGR >5% Application examples: Lignin Performance chemical Application driven Monopropylene glycol Strong IP position Application examples: Textiles Composites Wood resins Bottles & Packaging Pharma & Cosmetics Plastics Deicing fluids Detergents Foams & Coatings 55 UPM
56
UPM FINANCIAL STATEMENTS RELEASE Jussi Pesonen President and CEO 31 January 2018
 UPM FINANCIAL STATEMENTS RELEASE 217 Jussi Pesonen President and CEO 31 January 218 Q4 217 Excellent finish to the record-strong year 217 Comparable EBIT increased by 29% to EUR 366m (283m) EURm 4 Comparable
UPM THE BIOFORE COMPANY. Investor presentation February 2018
 UPM THE BIOFORE COMPANY Investor presentation February 218 UPM today UPM BIOREFINING Pulp Biofuels Timber UPM ENERGY Electricity generation and trading UPM RAFLATAC Label materials for product and information
UPM HALF YEAR FINANCIAL REPORT Jussi Pesonen President and CEO 25 July 2017
 UPM HALF YEAR FINANCIAL REPORT 217 Jussi Pesonen President and CEO 25 July 217 Q2 217 Good performance and favourable market demand continued Comparable EBIT increased by 2% to EUR 27m (264m) Temporarily
UPM INTERIM REPORT Q Jussi Pesonen President and CEO 26 April 2018
 UPM INTERIM REPORT Q1 218 Jussi Pesonen President and CEO 26 April 218 Q1 218 UPM continues to grow earnings, strong customer demand in all businesses Comparable EBIT increased by 17% to EUR 355m (35m)
UPM Half Year Financial Report Jussi Pesonen President and CEO 24 July 2018
 UPM Half Year Financial Report 218 Jussi Pesonen President and CEO 24 July 218 Q2 218: Commercial success drives growth in sales and earnings strong outlook for H2 218 Sales grew by 5% to EUR 2,589m (2,464m
UPM THE BIOFORE COMPANY. Investor presentation September 2017
 UPM THE BIOFORE COMPANY Investor presentation September 217 UPM today UPM BIOREFINING Pulp Biofuels Timber UPM ENERGY Electricity generation and trading UPM RAFLATAC Label materials for product and information
UPM Interim Report Q Jussi Pesonen President and CEO 24 October 2018
 UPM Interim Report Q3 218 Jussi Pesonen President and CEO 24 October 218 Q3 218: strong quarter sets a new benchmark for UPM s performance Sales grew by 6% to EUR 2,65 million (2,493m) Comparable EBIT
UPM THE BIOFORE COMPANY. Investor presentation July 2017
 UPM THE BIOFORE COMPANY Investor presentation July 217 UPM today UPM BIOREFINING Pulp Biofuels Timber UPM ENERGY Electricity generation and trading UPM RAFLATAC Label materials for product and information
UPM THE BIOFORE COMPANY. Investor presentation February 2017
 UPM THE BIOFORE COMPANY Investor presentation February 217 UPM in transformation 28 vertically integrated paper company 216 six separate businesses Business model Promotes value creation Sales 1 % 8 %
ANNUAL GENERAL MEETING Jussi Pesonen President and CEO
 ANNUAL GENERAL MEETING 216 Jussi Pesonen President and CEO UPM in transformation Business portfolio, sales 23: integrated paper company 28: towards marketdriven businesses 215: six separate businesses
UPM The Biofore Company. Investor Presentation June 2018
 UPM The Biofore Company Investor Presentation June 218 Competitive businesses with strong market positions UPM BIOREFINING Pulp Biofuels Timber UPM ENERGY Electricity generation and trading UPM RAFLATAC
UPM RESULTS Q Jussi Pesonen President and CEO 26 July 2016
 UPM RESULTS Q2 216 Jussi Pesonen President and CEO 26 July 216 13 Q313 14 Q314 Q3 16 Q2 216 comparable EBIT increased by 21%, cash flow reaching new highs EBITDA increased by 21% + Cost efficiency measures
UPM The Biofore Company. Investor Presentation July 2018
 UPM The Biofore Company Investor Presentation July 218 Competitive businesses with strong market positions UPM BIOREFINING Pulp Biofuels Timber UPM ENERGY Electricity generation and trading UPM RAFLATAC
UPM The Biofore Company. Investor Presentation October 2018
 UPM The Biofore Company Investor Presentation October 218 Competitive businesses with strong market positions UPM BIOREFINING Pulp Biofuels Timber UPM ENERGY Electricity generation and trading UPM RAFLATAC
UPM RESULTS Q Jussi Pesonen President and CEO 28 October 2014
 UPM RESULTS Q3 214 Jussi Pesonen President and CEO 28 October 214 Successful profit improvement programme prompted strong Q3 214 results Q3 214 vs. Q3 213: Sales EUR 2,415m -2% EBITDA EUR 346m +35m Operating
UPM The Biofore Company
 UPM The Biofore Company Investor Presentation February 219 Competitive businesses with strong market positions UPM BIOREFINING Pulp Biofuels Timber UPM ENERGY Electricity generation and trading UPM RAFLATAC
UPM THE BIOFORE COMPANY. Investor presentation December 2016
 UPM THE BIOFORE COMPANY Investor presentation December 216 UPM in transformation 28 vertically integrated paper company 215 six separate businesses Business model Promotes value creation Sales 1 % 8 %
UPM THE BIOFORE COMPANY. Investor presentation September 2016
 UPM THE BIOFORE COMPANY Investor presentation September 216 UPM in transformation 28 vertically integrated paper company 215 six separate businesses Business model Promotes value creation Sales 1 % 8 %
WOOD-BASED BIOREFINERIES PAVE THE WAY TO SUCCESSFUL BIOECONOMY. Sari Mannonen, Vice president, UPM Biofuels FAO, AFCSI meeting, Rome 5.4.
 WOOD-BASED BIOREFINERIES PAVE THE WAY TO SUCCESSFUL BIOECONOMY Sari Mannonen, Vice president, UPM Biofuels FAO, AFCSI meeting, Rome 5.4.2018 UPM today pulp, plantations, biofuels, timber BIOCHEMICALS BIOKOMPOSITES
UPM THE BIOFORE COMPANY
 UPM THE BIOFORE COMPANY Nordea Forest Products & Paper Seminar 2013 President and CEO Jussi Pesonen Strategic direction of UPM s businesses Advancing in growth markets Label Paper in China, label papers
UPM Strategy. Jussi Pesonen President and CEO 31 May 2018
 UPM Strategy Jussi Pesonen President and CEO 31 May 2018 We create value by seizing the limitless potential of bioeconomy Sustainable and safe solutions for global consumer demand 2020 2030 Innovation
UPM Q2 RESULTS Jussi Pesonen President and CEO 5 August 2014
 UPM Q2 RESULTS 214 Jussi Pesonen President and CEO 5 August 214 Successful profit improvement programme prompted strong Q2 214 results Q2 214 vs. Q2 213: Sales EUR 2,441m -3% EBITDA EUR 298m +4m Operating
UPM. The Biofore Company UPM
 UPM The Biofore Company 2018 April 4 th, 2017 Finland 2 April 4 th, 2017 Finland 3 June 29th, 2017 Beijing 4 Global businesses local presence UPM s sales by market 2017 EUR 10 billion 12,000 customers
WOOD-BASED BIOREFINERIES PAVE THE WAY TO SUCCESFUL BIOECONOMY. Marko Janhunen UPM Biorefining, Gothenburg,
 WOOD-BASED BIOREFINERIES PAVE THE WAY TO SUCCESFUL BIOECONOMY Marko Janhunen UPM Biorefining, Gothenburg, 18.05.2017 2 UPM UPM today UPM BIOREFINING UPM ENERGY UPM RAFLATAC UPM SPECIALTY PAPERS UPM PAPER
Welcome! Safety first.
 Welcome! Safety first. Please take the time to read the safety instructions given to you Keep your visitor badge visible Stay with your host and follow instructions Mind the steps, hold onto the railings
UPM corporate presentation Balance between supply and demand
 UPM corporate presentation Balance between supply and demand 2011-2014 SHB Materials Seminar Jussi Vanhanen President, Engineered Materials Business Group 10 March, 2011 Contents UPM's strategy and financials
UPM Specialty Papers Confidence Delivered. Bernd Eikens EVP, UPM Specialty Papers 31 May 2018
 Confidence Delivered Bernd Eikens EVP, UPM Specialty Papers 31 May 2018 Sustainable and safe products for everyday use Labelling & other application papers Packaging papers Fine papers LABEL MATERIALS
UPM REPOSITIONING FOR THE FUTURE
 UPM REPOSITIONING FOR THE FUTURE UBS Global Paper and Forest Products Conference September 2008 Jussi Pesonen President and CEO Repositioning for the future In the forest and paper industry, paper making
UPM-Kymmene Corporation Interim Report January September Jussi Pesonen President and CEO October 31, 2006
 UPM-Kymmene Corporation Interim Report January September 2006 Jussi Pesonen President and CEO October 31, 2006 Q3 2006 in focus 2006 paper demand in Europe is expected to grow slightly under 3% from 2005
UPM BIOFUELS From wood to biofuels, biochemicals & biomaterials
 UPM BIOFUELS From wood to biofuels, biochemicals & biomaterials Maiju Helin Head of Sustainability and Market Development, UPM Biofuels Zero s fossil free plastics forum 3/2018 Oslo UPM Roots run deep
STRATEGY WITH FOCUS CREDIT SUISSE GLOBAL PAPER & PACKAGING CONFERENCE NEW YORK. February 2010 Jussi Vanhanen President Engineered Materials
 STRATEGY WITH FOCUS CREDIT SUISSE GLOBAL PAPER & PACKAGING CONFERENCE NEW YORK February 2010 Jussi Vanhanen President Engineered Materials UPM IN BRIEF STRATEGY WITH FOCUS UPM IN BRIEF UPM's business portfolio
YEAR OF PROGRESS ANNUAL REPORT
 The Biofore Company YEAR OF PROGRESS ANNUAL REPORT 214 Contents UPM Group 1 UPM in brief 3 Review by the President and CEO 5 Strategy 11 UPM as an investment 13 Financial targets and earnings sensitivities
Focus on value creation
 Focus on value creation Matti Lievonen President & CEO Capital Markets Day 2011 21 September 2011 Results and outlook EBITDA shows our ability to generate cash flow Comparable EBITDA has been over EUR
UPM-Kymmene Corporation Interim Report January-June Jussi Pesonen, President and CEO July 28, 2005
 UPM-Kymmene Corporation Interim Report January-June 2005 Jussi Pesonen, President and CEO July 28, 2005 Contents Business drivers Financials January-June 2005 Current topics Market outlook UPM 2 Business
AIMING HIGHER WITH BIOFORE
 AIMING HIGHER WITH BIOFORE Annual Report 217 Contents UPM Group 4 UPM in brief 6 Year 217 in brief 8 Review by the President and CEO 1 UPM Aiming higher 12 Moving forward 14 UPM aims higher with renewed
UPM-Kymmene Corporation Interim Report January March Jussi Pesonen President and CEO April 25, 2006
 UPM-Kymmene Corporation Interim Report January March 2006 Jussi Pesonen President and CEO April 25, 2006 Q1 2006 in focus Good growth in paper demand in Europe and Asia Overcapacity in coated grades Meaningful
UPM-Kymmene Corporation Interim Report January- March Jussi Pesonen President and CEO April 24, 2007
 UPM-Kymmene Corporation Interim Report January- March 2007 Jussi Pesonen President and CEO April 24, 2007 Q1 2007 IN BRIEF UPM's result consistently improved Improved efficiency visible in the results
GROWDEX - AN INNOVATIVE WOOD CELLULOSE- BASED MATRIX FOR 3D CELL CULTURING
 GROWDEX - AN INNOVATIVE WOOD CELLULOSE- BASED MATRIX FOR 3D CELL CULTURING EuroNanoForum June 21, 2017 Juuso Konttinen VP, UPM Biochemicals 2 UPM COMPANY NANOCELLULOSE COMMERCIALIZATION 3 UPM COMPANY NANOCELLULOSE
Jyrki Ovaska, President Magazine Papers Division UPM-Kymmene Corporation
 UPM Competitive Advantage in Magazine Paper Business Jyrki Ovaska, President Magazine Papers Division UPM-Kymmene Corporation Capital Market Day November 9, 2004 UPM Strategic Frame We lead. We learn.
UPM Biofuels gains ISCC PLUS certification for bio-based applications
 Sites About us UPM Biofuels gains ISCC PLUS certification for bio-based applications (UPM, Helsinki, 18 April 2016 at 13:00 EET) - UPM Biofuels has extended sustainability certification to cover all of
Interim Review Q1 2007
 Interim Review Q1 2007 25 April 2007 25 April 2007 www.ruukki.com Ruukki today Net sales in 2006: 3.7 billion 13,000 employees in 23 countries Supplies metal-based components, systems and integrated systems
IMPROVED NEWSPRINT FOR HIGH-VALUE PRODUCTS. Ian Hamilton, Area Sales Director, South East Asia, UPM Asia Pacific PTE LTD
 IMPROVED NEWSPRINT FOR HIGH-VALUE PRODUCTS Ian Hamilton, Area Sales Director, South East Asia, UPM Asia Pacific PTE LTD CONTENT 1 CHANGE IN MEDIA WORLD 2 PULL FOR PAPER 3 PUSH FOR PAPER 4 WHAT DOES IT
Orlando, Florida March 25 th, 2013 Automation and Power World 2013 Investor Event
 Orlando, Florida March 25 th, 2013 Automation and Power World 2013 Investor Event Safe-harbor statement This presentation includes forward-looking information and statements including statements concerning
Financial Statements Matti Lievonen, President & CEO 7 February 2017
 Financial Statements 2016 Matti Lievonen, President & CEO Agenda 1 2 3 4 Year 2016 Financials 2016 Segment reviews Current topics 5 Appendix 2 Disclaimer The following information contains, or may be deemed
Presentation to Investors Q results ROYAL DSM HEALTH NUTRITION MATERIALS
 Presentation to Investors Q3 2016 results ROYAL DSM HEALTH NUTRITION MATERIALS Safe harbor statement This presentation may contain forward-looking statements with respect to DSM s future (financial) performance
2013 Autumn Conference
 KEPLER CHEUVREUX 2013 Autumn Conference Paris, September 18, 2013 1 Kepler Cheuvreux 2013 Autumn Conference September 18, 2013 September 18, 2013 2013 AUTUMN CONFERENCE 1 STRATEGY MOVING FORWARD AS SCHEDULED
Voith Group On a good footing for future growth
 Voith Group On a good footing for future growth Stuttgart, December 7, 2017 Annual press conference Stuttgart December 7, 2017 Public 1 Contents 1. Where we now stand 1.1 Highlights in the 2016/17 fiscal
Earnings conference call
 Earnings conference call Full year 2017 Åke Bengtsson, President & CEO Andreas Ekberg, Acting CFO February 14, 2018 1 Agenda Business Summary Market Update Sales Financials Way forward 2 Business Summary
Full-year Report 2009
 Full-year Report 2009 Joakim Olsson CEO and President February 12, 2009 Innovative Vehicle Technology 2010-02-12 Summary 2009 Sales of SEK 5,622m (8,403) Adjusted for currency effects sales decreased by
2003 fourth quarter and full-year results
 Dinesh Paliwal Member of Group Executive Committee, Head of Automation Technologies Division 2003 fourth quarter and full-year results Automation Technologies Copyright 2003 ABB. All rights reserved. -
Bernstein Strategic Decisions Conference 2018
 Bernstein Strategic Decisions Conference 2018 Forward-Looking Statements Certain statements in this presentation, other than statements of historical fact, including estimates, projections, statements
UPM-Kymmene Corporation Jussi Pesonen CEO UBS Global Paper and Forest Products Conference New York September 19, 2006
 UPM-Kymmene Corporation Jussi Pesonen CEO UBS Global Paper and Forest Products Conference New York September 19, 2006 Contents UPM in brief Business environment UPM's positions for sustainable profitability
Respect for customers, partners and staff. Service: another name for the respect that a company owes its customers, partners and staff.
 Respect for customers, partners and staff Service: another name for the respect that a company owes its customers, partners and staff. Vehicle glass KEY FIGURES (in EUR million) 2004 2003 % change Total
WÄRTSILÄ CORPORATION SEB FINNISH BLUE CHIP SEMINAR 28 AUGUST Marco Wirén, CFO. Wärtsilä
 WÄRTSILÄ CORPORATION SEB FINNISH BLUE CHIP SEMINAR 28 AUGUST 2015 Marco Wirén, CFO 1 This is Wärtsilä Energy Solutions, 23% Marine Solutions, 30% Services, 47% 2 Net sales and profitability MEUR 6000 14%
Q Financial Results
 Q3 2018 Financial Results 1 Forward-looking statement The statements on the future in this presentation, including expected sales and earnings, are associated with risks and uncertainties and may be affected
Volvo Group THIRD QUARTER 2015 JAN GURANDER. Volvo Group Headquarters Third quarter
 Volvo Group THIRD QUARTER 2015 JAN GURANDER 1 VOLVO GROUP Third quarter highlights NET SALES SEK bn 12 months 310 bn IMPROVED PROFITABILITY ON FLAT VOLUMES UNDERLYING OPERATING MARGIN 6.9% 67 73 OPERATING
Third quarter AB Volvo
 Third quarter 2013 Third quarter 2013 TRUCKS EUROPE Excellent reception of the new products decision to optimize manufacturing Highlights in Commercial launch of the new product ranges Strong order situation
First in Mind First in Choice. Capital Markets Day 2006 Gunnar Brock, President and CEO
 First in Mind First in Choice Capital Markets Day 26 Gunnar Brock, President and CEO 1 December 4, 26 www.atlascopco.com Atlas Copco in a Snapshot Continuing operations A world leading provider of industrial
ABB Fact Sheet Full-year ABB Slide 1
 ABB Fact Sheet Full-year 2014 Slide 1 ABB at a glance ABB is a global leader in power and automation technologies with over 120 years of experience. Our success has been driven by a strong focus on R&D
THREE MONTHS REPORT, JAN MARCH 2016
 THREE MONTHS REPORT, JAN MARCH 2016 TELEPHONE CONFERENCE 26 APRIL, 2016, AT 14:30 CET TOMMY ANDERSSON, PRESIDENT AND CEO HELENA WENNERSTRÖM, EVP AND CFO TO PARTICIPATE, PLEASE CALL 5 MINUTES BEFORE THE
Second quarter AB Volvo
 1 VOLVO GROUP Strengthened focus on core business divests Volvo Aero Enterprise value of SEK 6.9 billion. Completion expected during the third quarter of 2012. acquires shares in Deutz AG Largest shareholder
Kongsberg Automotive ASA. Fourth quarter February 28, 2019
 Kongsberg Automotive ASA Fourth quarter - February 28, 2019 Highlights Q4 Sales Revenues grew by 21 (7.3%) YoY to 288 including negative FX effects of 1. We booked new business with 77 in expected annual
UPM-Kymmene Corporation Interim Report January June Jussi Pesonen President and CEO July 27, 2006
 UPM-Kymmene Corporation Interim Report January June 2006 Jussi Pesonen President and CEO July 27, 2006 Q2 2006 in focus Good growth in paper demand in Europe and Asia Overcapacity continues in coated grades
Proposed acquisition of Areva Distribution. December 2, 2009
 Proposed acquisition of Areva Distribution December 2, 2009 Disclaimer All forward-looking statements are Schneider Electric management s present expectations of future events and are subject to a number
Uncoated Fine Paper and Corrugated Business in context Peter Oswald. Investor and Analyst site visit, Syktyvkar and Świecie 2 4 November 2010
 Uncoated Fine Paper and Corrugated Business in context Peter Oswald Investor and Analyst site visit, Syktyvkar and Świecie 2 4 November 2010 Europe & International Division Peter J Oswald CEO Franz Hiesinger
Earnings conference call Q4 & FY 2016
 Earnings conference call Q4 & FY 2016 Bo Annvik, CEO / Åke Bengtsson, CFO February 10, 2016 1 Agenda Business Highlights Market Update Sales Financials Way forward 2 Business Summary FY 2016 A year with
Long-Term Corporate Resilience
 Presentation to Swiss-American Chamber of Commerce Long-Term Corporate Resilience Ton Büchner, CEO of Sulzer Ltd March 23, 2009 Long Term Corporate Resilience It s all common sense living it is the hard
NET SALES at September 30, 2014
 NET SALES at September 30, 2014 October 22, 2014 1 Net sales at September 30, 2014 October 22, 2014 Net sales of 14,558m in a still slowing global market The market slowdown observed since the second quarter
2010 Interim Results Presentation. August 23, 2010 Hong Kong
 Sinopec Corp. 21 Interim Results Presentation August 23, 21 Hong Kong Disclaimer i This presentation and the presentation materials distributed herein include forwardlooking statements. All statements,
2015 Interim Results Announcement
 China Petroleum & Chemical Corporation 2015 Interim Results Announcement August 27, 2015 Hong Kong Cautionary Statement This presentation and the presentation materials distributed herein include forward-looking
Third quarter AB Volvo
 1 VOLVO GROUP Slowing demand and lower earnings driven by one-offs and under-absorption SALES TREND SEK bn 12 months 318 bn OPERATING INCOME SEK bn 12 months* 25 bn 64 73 69 4.9 5.8 4.0* Q3 Q4 Q1 Q2 Q3
JANUARY 22, 2019 MICHELIN ACQUIRES MULTISTRADA, THEREBY GAINING EFFICIENT PRODUCTION CAPACITY OF 180 KT IN INDONESIA
 JANUARY 22, 2019 MICHELIN ACQUIRES MULTISTRADA, THEREBY GAINING EFFICIENT PRODUCTION CAPACITY OF 180 KT IN INDONESIA With leading Indonesian tire manufacturer Multistrada, Michelin gains competitive Tier
Fredrik Nilsson, CFO and acting CEO Anne Mette Olesen, CMO. Interim report Second quarter 2017
 Fredrik Nilsson, CFO and acting CEO Anne Mette Olesen, CMO Interim report Second quarter 2017 Agenda Second quarter 2017 Business area information The AAK Way Responsible growth Q & A 2 The Co-Development
Interim Review Q1 2006
 Interim Review Q1 2006 April 26, 2006 April 26, 2006 www.ruukki.com Strategy Moving Ahead Recent Structural Changes Business Environment Financials 1-3/2006 Near-term Outlook Summary 2 April 26, 2006 www.ruukki.com
Orders received grew in all business areas
 26 October 2018 Orders received grew in all business areas Cargotec s January September 2018 interim report Mika Vehviläinen, CEO Mikko Puolakka, CFO Cargotec s January September 2018 interim report 26/10/2018
UPM-Kymmene Corporation Annual General Meeting Report of the President and CEO. Jussi Pesonen March 27, 2007
 UPM-Kymmene Corporation Annual General Meeting Report of the President and CEO Jussi Pesonen March 27, 2007 Contents Business drivers 2006 Financials 2006 Changed business environment UPM's strategy in
BMW GROUP QUARTERLY REPORT. TO 30 SEPTEMBER 2014
 . BMW GROUP QUARTERLY REPORT. TO 30 SEPTEMBER 2014 THE BMW GROUP IS WELL ON TRACK AND PERFORMS IN LINE WITH THE GUIDANCE. The BMW Group is well on track to reach its targets for 2014. Full year guidance
Third quarter results Matti Lievonen, President & CEO 26 October 2017
 Third quarter results 2017 Matti Lievonen, President & CEO 26 October 2017 Agenda 1. Q3/17 Group financials 2. January-September 2017 review 3. Q3/17 Segment reviews 4. Current topics 5. Appendix 2 Disclaimer
WÄRTSILÄ CORPORATION JP MORGAN CAZENOVE EUROPEAN CAPITAL GOODS CEO CONFERENCE
 WÄRTSILÄ CORPORATION JP MORGAN CAZENOVE EUROPEAN CAPITAL GOODS CEO CONFERENCE Jaakko Eskola President & CEO 1 Wärtsilä PUBLIC 9.6.2016 Jaakko Eskola Wärtsilä s net sales by business Q1/2016 SERVICES, 52%
I remind you that our presentation is available on our website. We can start from the first 2 slides that show Piaggio Group First
 CONFERENCE CALL 2009 1 st HALF RESULTS Good afternoon and welcome to everybody. I remind you that our presentation is available on our website. We can start from the first 2 slides that show Piaggio Group
BRINGING BUILDINGS TO LIFE
 2017 Q3 Mattias Johansson, CEO Nils-Johan Andersson, CFO 10 November 2017 BRINGING BUILDINGS TO LIFE Today s presenters Mattias Johansson, CEO and Group President Nils-Johan Andersson, CFO CEO since 1
BERNSTEIN STRATEGIC DECISIONS CONFERENCE 2018
 ABB LTD, NEW YORK CITY, USA, 31 MAY 2018 Positioned for profitable growth BERNSTEIN STRATEGIC DECISIONS CONFERENCE 2018 Ulrich Spiesshofer, CEO Important notice This presentation includes forward-looking
Q3 & 9M 2018 Results Presentation. October 24 th, 2018
 Q3 & 9M 2018 Results Presentation October 24 th, 2018 Q3 & 9M HIGHLIGHTS & CATEGORY SPOTLIGHTS Gonzalve BICH 3Q and 9M 2018 Results Presentation 2 9 Months 2018 Key Messages Continued challenging trading
Q Analyst Teleconference. 9 August 2018
 9 August 218 Disclaimer This presentation contains forward-looking statements that reflect the Company management s current views with respect to certain future events. Although it is believed that the
Q1 Report Joakim Olsson CEO and President April 23, Innovative Vehicle Technology
 Q1 Report 2010 Joakim Olsson CEO and President April 23, 2010 Innovative Vehicle Technology 2010-04-23 Summary 1st quarter 2010 Sales of SEK 1,600m (1,562) Adjusted for currency-exchange fluctuations and
Investor Presentation. March 2017
 Investor Presentation March 2017 Disclaimer During this presentation management may discuss certain forwardlooking statements concerning Nemak s future performance that should be considered as good faith
Kongsberg Automotive ASA. Third quarter November 7, 2018
 Kongsberg Automotive ASA Third quarter - November 7, Q3 Highlights Continued improvements in turbulent times Revenues increased YoY by MEUR 18.3 (~8%) to MEUR 259 including negative FX effects of MEUR
Evonik Corporate Venturing. Dr. Jürgen Finke Ecosummit 2012, Neuss November 14, 2012
 Evonik Corporate Venturing Dr. Jürgen Finke Ecosummit 2012, Neuss November 14, 2012 Focus on specialty chemicals Evonik is one of the global leaders in specialty chemicals Strong integrated technology
Record CY 2016 EPS-diluted-adjusted of $6.12, an increase of $1.10 Y-O-Y. Q EPS-diluted-adjusted of $1.28, a decrease of $0.11 Y-O-Y.
 1 2 3 Q4 2016 global deliveries up 0.1 million units year-over-year (Y-O-Y), a 3.3% increase. Volume gains primarily in North America and China, offset by reductions in International Operations (excluding
Report for Q Mr. Tom Erixon President and CEO Alfa Laval Group.
 Report for Q3 2018 Mr. Tom Erixon President and CEO Alfa Laval Group Key figures July September 2018 Orders received grew 35% to SEK 11,357 million. Net sales increased 24% to SEK 10,131 million. Adjusted
24/05/2012. Alfa Laval 1. No. 1 in all its product areas. Food. Environment. Energy. Alfa Laval Slide 2
 Alfa Laval s position No. 1 in all its product areas An unparalleled global presence Energy Environment Food 3-4% acquired growth p.a. Alfa Laval Slide 2 Alfa Laval 1 We have three key technologies - with
Annual Press Conference
 Annual Press Conference Stuttgart, 16 December 2016 Prof. Dr. Michael Kaschke President & Chief Executive Officer Thomas Spitzenpfeil Chief Financial Officer ZEISS Group, 2015/16 Annual Press Conference
Financing and roadmap for roll-out of clean inland ship technologies
 Financing and roadmap for roll-out of clean inland ship technologies Friday 13th of April, Nijmegen Funded by: Martin Quispel, partner STC-NESTRA Contents Urgency to green the inland vessel fleet Costs
FISCAL YEAR MARCH 2018 FIRST HALF FINANCIAL RESULTS
 FISCAL YEAR MARCH 2018 FIRST HALF FINANCIAL RESULTS PRESENTATION OUTLINE Highlights Fiscal Year March 2018 First Half Results Fiscal Year March 2018 Full Year Forecast Progress of Key Initiatives/ Business
CAPITAL MARKETS DAY DR FRIEDRICH EICHINER MEMBER OF THE BOARD OF MANAGEMENT OF BMW AG, FINANCE.
 March 26, 2015 CAPITAL MARKETS DAY DR FRIEDRICH EICHINER MEMBER OF THE BOARD OF MANAGEMENT OF BMW AG, FINANCE. AGENDA. 1 Financial Status of 2014 2 Chances and Challenges in 2015 3 Towards a strong future
Overcapacity in the Xylenes Chain
 Overcapacity in the Xylenes Chain Steve Jenkins PCI Xylenes & Polyesters Asia Sdn Bhd AUGUST 214, MUMBAI Polyester Chain Vital Statistics Since 2, 669 million tonnes of polyester have been produced Polyester
1 st Half 2018 Results. August 1 st, 2018
 1 st Half 2018 Results August 1 st, 2018 H1 HIGHLIGHTS & CATEGORY SPOTLIGHTS Gonzalve BICH 2 First Half 2018 Key Messages Challenging market and business environment Continued investment in targeted Brand
On track. Investor and Analyst Presentation On the Occasion of the Release of the Preliminary Figures for FY 2011 Hanover, 19 January 2012
 On track. Investor and Analyst Presentation On the Occasion of the Release of the Preliminary Figures for FY 2011 Agenda Delticom at a Glance Business Model Profit & Loss Balance Sheet Outlook 2 Agenda
April Título da apresentação DD.MM.AAAA
 Aquisition of Shell Argentina downstream assets April 2018 Título da apresentação DD.MM.AAAA DISCLAIMER This presentation contains estimates and forward-looking statements regarding our strategy and opportunities
CONFERENCE CALL RESULTS Q1 2017
 CONFERENCE CALL RESULTS Q1 2017 May 5, 2017 Marc Bunz (CFO) Nicolas-Fabian Schweizer (CTO) AGENDA Market & Strategy Update Financials 2016 Financials Q1 2017 Outlook SCHWEIZER Share Schweizer Electronic