STATUS OF AMBIENT NOISE LEVEL IN INDIA 2017
|
|
|
- Melina Mitchell
- 5 years ago
- Views:
Transcription


1 NATIONAL AMBIENT NOISE MONITORING NETWORK: NANMN/5/17 STATUS OF AMBIENT NOISE LEVEL IN INDIA 17 CENTRAL POLLUTION CONTROL BOARD PARIVESH BHAWAN, EAST ARJUN NAGAR, DELHI
2
3 DEDICATED TEAM Supervision and Co-ordination ShSuneel Dave Scientist E Project Co-ordination & Report Editing Sh. Vishal Gandhi Scientist D Sh.Ramakrishna Chinthapalli JRF Report Preparation Sh. Vishal Gandhi Scientist D Sh.RamakrishnaChinthapalli JRF Sh. Jagdeep Kumar SA Graphics and SequencingSh.Ramakrishna ChinthapalliJRF Sh.Jagdeep Kumar SA Monitoring & Survey Sh. Vishal Gandhi Scientist D Sh.Ramakrishna Chinthapalli JRF Sh. Jagdeep Kumar SA Central Pollution Control Board acknowledges the efforts and sincere support in successfull implementation & management of National Ambient Noise Monitoring Network(NANMN) programme by all concerned zonal offices (Bengaluru, Kolkata, Vadodara & Lucknow) and SPCBs (Karnataka, West bengal, Maharashtra, Delhi, U.P, Tamilnadu& Telangana).
4 Table of Contents 1. INTRODUCTION 1 2. OBJECTIVE OF NOISE MONITORING METHODOLOGY INSTRUMENTATION NOISE MONITROING SYSTEM OUTDOOR MICROPHONE NOISE PROCESSOR AND DATA LOGGER 6 4. ACT AND RULES AIR ACT NOISE RULES RESULTs & OBSERVATIONS AMBIENT NOISE MONITORING OF BENGALURU ANALYSIS OF AMBIENT NOISE MONITORING ON DAILY BASIS ANALYSIS OF AMBIENT NOISE MONITORING ON MONTHLY BASIS ANALYSIS OF AMBIENT NOISE MONITORING ON YEARLY BASIS AMBIENT NOISE MONITORING OF CHENNAI 7.1 ANALYSIS OF AMBIENT NOISE MONITORING ON DAILY BASIS ANALYSIS OF AMBIENT NOISE MONITORING ON MONTHLY BASIS ANALYSIS OF AMBIENT NOISE MONITORING ON YEARLY BASIS AMBIENT NOISE MONITORING OF DELHI ANALYSIS OF AMBIENT NOISE MONITORING ON DAILY BASIS ANALYSIS OF AMBIENT NOISE MONITORING ON MONTHLY BASIS ANALYSIS OF AMBIENT NOISE MONITORING ON YEARLY BASIS AMBIENT NOISE MONITORING OF HYDERABAD ANALYSIS OF AMBIENT NOISE MONITORING ON DAILY BASIS ANALYSIS OF AMBIENT NOISE MONITORING ON MONTHLY BASIS ANALYSIS OF AMBIENT NOISE MONITORING ON YEARLY BASIS AMBIENT NOISE MONITORING OF KOLKATA ANALYSIS OF AMBIENT NOISE MONITORING ON DAILY BASIS ANALYSIS OF AMBIENT NOISE MONITORING ON MONTHLY BASIS ANALYSIS OF AMBIENT NOISE MONITORING ON YEARLY BASIS AMBIENT NOISE MONITORING OF LUCKNOW ANALYSIS OF AMBIENT NOISE MONITORING ON DAILY BASIS ANALYSIS OF AMBIENT NOISE MONITORING ON MONTHLY BASIS ANALYSIS OF AMBIENT NOISE MONITORING ON YEARLY BASIS AMBIENT NOISE MONITORING OF MUMBAI ANALYSIS OF AMBIENT NOISE MONITORING ON DAILY BASIS ANALYSIS OF AMBIENT NOISE MONITORING ON MONTHLY BASIS ANALYSIS OF AMBIENT NOISE MONITORING ON YEARLY BASIS MAJOR FINDINGS RECOMMENDATIONS 82 ANNEXURE
5 1. INTRODUCTION Sound is such a common part of everyday life that we rarely appreciate all of its functions. It provides enjoy-able able experiences such as listening to music or to the singing of birds. It can alert or warn us for for example with the ringing of a telephone, or a wailing siren. Sound can be heard underwater too, just as in air. Whales are familiar with this and communicate with one another. Dolphins too have complex system of communication. A sound source radiates power and d this result in a sound pressure. Sound power is the cause. Sound pressure is the effect. An electric heater radiates heat into a room and temperature is the effect. Temperature is also the physical quantity that makes us feel hot or cold. The temperature in the room is obviously dependent on the room itself, the insulation, and whether other sources of heat are present. The relationship between sound power and sound pressure is similar. What we hear is sound pressure but it is caused by the sound power emitted itted from the source. The sound pressure that we hear, or measure with a microphone is dependent on the distance from the source and acoustic environment (or sound field) in which sound waves are present. This is in turn depends on the size of the room andd the sound absorption of the surfaces.sound may be defined as any pressure variation (in air, water or other medium) that human ear can detect. If variation in atmospheric pressure occur more rapidly i.e at least times a second, then it can be heard an and hence are called sound. Sound travels as small waves of pressure through air at a speed of about 1

6 7 miles per hour and what we hear are sound waves provided by vibrations of air molecules. The word "noise" descends from the Latin word "nausea," meaning seasickness, or, more generally, any similar sensation of disgust, annoyance, or discomfort. Noise is usually defined as unwanted sound pollutant which produces undesirable physiological and psychological effects in an individual, by interfering with one s social activities like work, rest, recreation, sleep etc. A sound might be unwanted because it is: Loud Unpleasant or annoying Intrusive or distracting Usually the sound of a violin is referred to as music - is something pleasing. Depending on other factors, the sound may be perceived as noise. Noise perception is subjective. Factors such as the magnitude, characteristics, duration, and time of occurrence may affect one's subjective impression of the noise.noise is also considered a mixture of many different sound frequencies at high decibel levels. Noise pollution refers to sounds in the environment that are caused by humans and that threaten the health or welfare of human or animal inhabitants. The most common source of noise pollution by far, the one that affects the most people on the planet is motor vehicles. Aircraft and industrial machinery are also major sources. Additional noise pollution is contributed by office machines, sirens, power tools, and other equipment. The response of ear to sound is very dependent on the frequency content of the sound. The ear has a peak response around khz and has a relatively low response at low frequencies. 2. OBJECTIVE OF NOISE MONITORING As per section (IV) of National Environment Policy (NEP)-6, Ambient Noise included as environmental quality parameter and to be monitored in specified urban areas regularly. Therefore, Central Pollution Control Board developed National Ambient Noise Monitoring Network Programme which includes installation of Noise Monitoring Stations all over India, which in turn will provide necessary information for decision makers. 2
7 The National Ambient Noise Monitoring Network comprising 7 Noise Monitoring Stations spread over 7 metropolitan citieswhich include Bangalore,Chennai,Delhi,Hyderabad, Kolkata,Lucknowand Mumbai(1 stations in each city). The network was developed in two phase. In first phase, 35 stations were installed in above said seven cities (5 each) during 11 and another 35 stations were added in same seven cities (5 each) in second phase during the year 15. The continuous monitoring was conducted at locations mentioned in Table-1. Table-1 Detail of monitoringlocations as below City Monitoring Point Category Delhi Bangalore Chennai Dilshad Garden Silence CPCB Commercial DCE Silence ITO Commercial NSIT Silence Civil Lines Commercial Zone R.K. Puram Residential Zone Anand Vihar Commercial Zone Mandir Marg Silence Zone Punjabi Bagh Residential Zone Parisar Bhawan Commercial Peenya Industrial Nisarga bhawan Residential Marathali Commercial BTM Residential Yeshwantpur Commercial Zone R.V.C.E Silence Zone Whitefield Industrial Zone Dolmur Residential Zone Nimhans Silence Zone Eye Hosp. Silence T. Nagar Commercial Perambur Commercial Guindy Industrial Triplicane Residential Pallikarnai Commercial Zone Velachery Residential Zone Washermanpet Commercial Zone Anna Nagar Silence Zone Sowcarpet Residential Zone Abids Commercial TSPCB Commercial Jeedimetla Industrial Zoo Silence Julee Hills Residential 3
8 City Monitoring Point Category Hyderabad Tarnaka Residential Zone Gaddapothram Industrial Zone Gachibowli Silence Zone Paradise Commercial Zone Kukatpalli Commercial Zone SSKM Hosp. Silence Kolkata Gole Park Industrial WBPCB HQ Commercial Patauli Residential New Market Commercial Birati N. Residential Zone RG Kaur Silence Zone Kolkata Tollygunge Commercial Zone Bag Bazar Residential Zone Tartala Industrial Zone Talkatora Industrial Hazrat ganj Commercial P.G.I. Silence Indira Nagar Residential Lucknow Gomti nagar Silence Chinhat Industrial Zone Vibhuti Khand Residential Zone IT College Silence Zone CCS Airport Commercial Zone Aligunj Commercial Zone Thane Commercial Vashi Hsp. Silence Ashp Silence Bandra Commercial Mumbai MPCB HQ Commercial M&M Kandivali Industrial Zone Ambassador Hotel Commercial Zone L&T Powai Industrial Zone Pepsico Chembur Residential Zone Bisleri Andheri Industrial Zone The sound level data fetched from Real time Noise Monitoring Station was compared with Ambient Noise Standards. The extent of violation with respect to prescribed standards was also assessed. The main objective is to find collective significant factor and its collective impacts as to help the concern authorities and planners for decision making at pro-active stage. The status of noise pollution be communicated and placed in public domain for mass awareness. 4


9 3. METHODOLOGY 3.1 INSTRUMENTATION Sound Level Meter is an instrument designed to respond in approximately the same way as the human ear and to give objective, reproducible measurements of sound pressure level. Sound level meter consist of a microphone, a processing unit and read-out unit.the microphone converts the sound signal to an equivalent electrical signal. There are many type of microphone like condenser microphone, electrets condenser, dynamic microphone, carbon microphone, piezoelectric microphone, fiber optic microphone, which is used for various purposes. The most suitable type of microphone for sound level meters is the condenser microphone, which combines precision with stability and reliability. The electrical signal produced by the microphone is quite small and so it is amplified by a preamplifier before being processed. Noise Monitoring System (NMS) is used for measuring real time noise since large number of stations can be managed easily using this technology. It comprises of microphone, data logger and mounting stand. The details of system are mentioned in subsequent section. 3.2 NOISE MONITORING SYSTEM Noise Monitoring System (NMS) is used for measuring real time noise since large number of stations can be managed easily using this technology. NMSs are optimized for outdoor use with small, custom designed enclosure, and also designed for use in all climatic environments. NMS consist of a weatherproof cabinet containing a noise level analyzer and a battery, a communication device for transmitting data to receiving station, a back plate and an outdoor microphone (for measuring sound) all of which can be mounted on a mast OUTDOOR MICROPHONE 5
 and")
10 The outdoor microphone is a major factor in ensuring that the NMS complies with IEC Class 1 requirements, with either or 9 reference direction. For permanent outdoor installation, in community such as noise or traffic noise monitoring systems, it has built-in weighting, ± db amplifier (for shifting the dynamic range of up or down by db) and electrostatic actuator for complete check of system functionality. The microphone is used for R E F E R E N C E D I R E C T I O N S permanent outdoor installation and for community noise or traffic noise monitoring systems. It has electrostatic actuator for complete check of system functionality for excellent performance in adverse conditions It has protectors for; Foam cover against wind and dust protection Birds protector Humidity protector NOISE PROCESSOR AND DATA LOGGER High quality microphone connected to an advanced acquisition signal processing unit, completed with an electronic measurement and processed-data storage unit, provided as well with an integrated GPRS modem. It allows the connection of one Outdoor Microphone Model 41CN. The Noise Processor NP receives and digitizes, the output signal generated by the microphone, performing A and C weighting. The system computes acoustic parameters A and C weighting (Fast and Slow). Remote Automatic Data Acquisition and Transmission Unit, tele-programmable; total compact are mounted in a heavy duty Weatherproof Polypropylene housing with IP-67 protection. 4. ACT AND RULES 4.1 AIR ACT Under section 2(a) of Air (Prevention and Control of Pollution) Act, 1981 noise is defined as air pollutant Air pollutant" means any solid, liquid or gaseous substance [(including noise)] present in the atmosphere in such concentration as may be or tend to be injurious to human beings or other living creatures or plants or property or environment. Increasing ambient noise level in public places from various sources, inter-alia, industry activity, construction activity, generators sets, loud speakers, public address systems, music systems, vehicular horns and other mechanical devices have deleterious effects on human health and the psychological well being of the people. Therefore, it is considered necessary 6
11 to regulate and control of noise producing and generating sources with the objective of maintaining the ambient air quality standards in respect of noise. 4.2 NOISE RULES Central Government notified the Noise Pollution (Regulation and Control) Rules, as it is published in the Gazette of India, Extraordinary, Part-II section 3(ii), vide S.O 123 (E) dated In reference to abovementioned rules following responsibilities are vested with State Governments, District Magistrate, Police Commissioner, or any other officer not below the rank of Deputy Superintendent of Police: 1. Enforcement of Noise Pollution control measures and the due compliance of ambient air quality standards in respect of noise. 2. Restriction on the use of Loud Speakers/Public Address system. 3. Restriction on the use of Horns, Sound emitting construction equipment and bursting of Fire crackers. 4. Prohibition of continuance Music Sound or Noise. 5. Authority shall act on the complaint and take action against the violator in accordance with the provisions of rules. 6. Disallowing sound producing instrument after 1 p.m to 6 a.m except in closed premises. 7. State Government may permit loud speakers or public address system in night hours (between 1. p.m. to 12. midnight not exceeding 15 days in year. Area Code Category of Area/ Limit in db(a) Leq* Zone A Industrial Area 75 7 B Commercial Area C Residential Area D Silence Zone 5 Ambient Air Quality Standards in Respect of Noise is notified under Noise Pollution (Regulation and Control) Rules,. Note: 1. time shall mean from 6 AM to 1 PM 2. time shall mean from 1 PM to 6 AM 3. Silence Zone is defined as areas up to 1 meters around such premises as hospitals, educational institutes and courts. The Silence Zones are to be declared by competent authority. 4. Mixed categories of areas may be declared as one of the four above mentioned categories by the competent authority. *db(a) Leq denotes the time weighted average of the level of sound in decibels on scale A which is relatable to human hearing. 7
12 A decibel is a unit in which noise is measured. A, in db (A) Leq, denotes the frequency weighting in the measurement of noise and corresponds to frequency response characteristics of the human ear. Leq: It is energy mean of the noise level over a specific period. 5. RESULTS & OBSERVATIONS As mentioned earlier, Real Ambient Noise Monitoring Stations were installed in 7 locations in 7 metropolitan cities (Bengaluru, Chennai, Delhi, Hyderabad, Kolkata, Lucknow and Mumbai (1 stations in each)). The stations were installed as per the categorization of Ambient Noise standards (Silence, Residential, Commercial and Industrial). The sound level data for the year 17 of each city was compiled and processed for interpretation on daily, monthly and yearly basis. 8

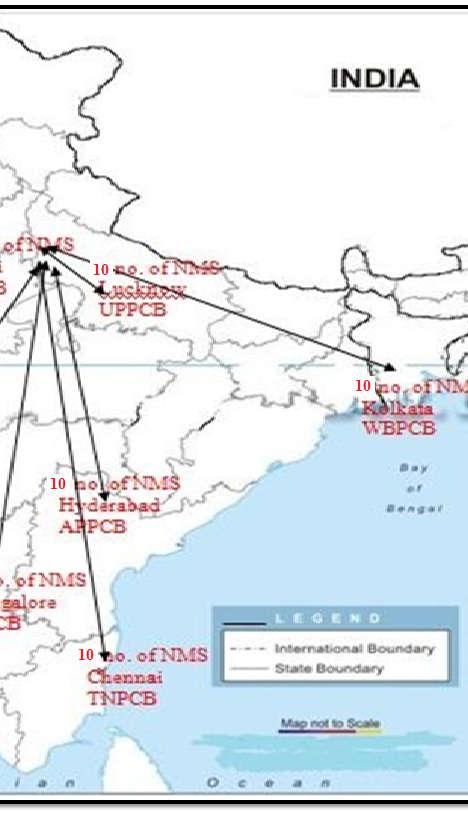
13 Figure 1: Map depicting monitoring network 9


14 6. AMBIENT NOISE MONITORING OF BENGALURU Bangalore, officially known as Bengaluru, the capital of the Indian state of Karnataka, is located at N, E and lies in the Southeastern region in the Deccan Plateau. Bengaluru is spread over an area of 741 sq. kilometers. Current Population of Bengaluru in 14 is 1,178,146 as per census-11. In Bengaluru, five monitoring stations are installed and details are depicted in Table 2 and Figure2. Table 2: Monitoring locations of Bengaluru Sl. No. Station location Category Latitude 1. Parisar Bhawan Commercial Zone 12º58' 32.18'' N 2. Peeniya Industrial Zone 13º1' 4.28'' N 3. Nisarga bhawan Residential Zone 12º59'.54'' N 4. Marathali Commercial Zone 12º54' 45.45'' N 5. BTM Residential Zone 12º54' 3.36'' N 6. Yeshwantpur Commercial Zone 13º1' 5.4'' N 7. R.V.C.E Silence Zone 12º55' 23.15'' N 8. Whitefield Industrial Zone 12º58' 38.47'' N 9. Dolmur Residential Zone 12º57' 48.86'' N 1. Nimhans Silence Zone 12º56' 15.27'' N Longitude 77º36' 12.38'' E 77º3' 11.45'' E 77º35'.15'' E 77º34' 34.58'' E 77º35' 1.96'' E 77º33' 28.13'' E 77º29' 58.5'' E 77º45' 5.18'' E 77º38' 17.78'' E 77º35' 32.95'' E Figure2: Satellite Map depicts the monitoring locations of Bengaluru 1
15 6.1 ANALYSIS OF AMBIENT NOISE MONITORING ON DAILY BASIS As stated earlier, Real time Ambient Noise Monitoring of Bengaluru has been carried out at 1 locations. The Sound level data of said data is processed for daily basis and the data is compared with Ambient Air Quality Standards in Respect of Noise is notified under Noise Pollution (Regulation and Control) Rules,. The Sound Level Data on daily basis for the year 17 is mentioned Table-1 of Annexure-I. Statistical discussion of sound level data for the year 17 is presented in Table-3 and Table-4. Table 5 and 6 depicts the frequency distribution data for the year 17. Graphical representation of each station for the year 16 is shown in Figures-3 to 12. Table-3: Statistical behavior of sound level data of first 5 stations for the year 17 Stations BTM Marathali (C ) NIMHANS Nisarga Bhawan Parisar Bhawan Standard No of Exceedence No of Observations Percentage of Exceedence Max Min Median L L L Note: All values are in Leq db (A) Table-4: Statistical behavior of sound level data of remaining 5 stations for the year 17 Stations Peeniya RVCE Teri Dolmur(R ) White Field Yashwantpur(C ) Standard Tim e No of Exceedence No of Observations Percentage of Exceedence Max Min Median L L L
16 Stations Peeniya RVCE Teri Dolmur(R ) White Field Yashwantpur(C ) Standard Tim e Note: All values are in Leq db(a) Frequency of Sound level data Table-5: Frequency analysis of sound level data of first 5 stations for the year 17 BTM Marathali (C ) NIMHANS Nisarga Bhawan Parisar Bhawan < > Frequency of Sound level data Leq Values in db(a) Table-6: Frequency analysis of sound level data of remaining 5 stations for the year 17 Peeniya RVCE Teri Dolmur White Field ( I) Yashwanthpur < > Figure 3 : and Variation of BTM Leq Values in db(a) Figure 4: time and time variation of Marathali 12
17 Leq Values in db(a) Leq Values in db(a) Figure 5: time and time variation of NIMHANS Figure 7: time and time variation of Parisar Bhawan Leq Values in db(a) Leq Values in db(a) Figure 6: time and time variation of Nisarga Bhawan Leq Values in db(a) Leq Values in db(a) Figure 8: time and time variation of RVCE Figure 9: time and time variation of TERI Figure 1: time and time variation of White Field 13
18 Leq Values in db(a) Figure 11: time and time variation of Yashwantpur Based on above facts and statistical values, following observations are made: Figure 12: time and time variation of Peeniya Out of 1 stations, 3 stations (BTM, Nisarga Bhawan and Teri Dolmur) are installed at residential zone, 3 stations (Marathali, Parisar Bhawan and Yashwantpur) are installed at commercial zone, 2 stations (NIMHAN and RVCE) are installed at silence zone and remaining 2 stations (Peeniya and White Field) are installed at industrial zone. 365 observations were made at BTM noise monitoring station both at day and night time. During day and night time 1% of exceedance of prescribed standard was observed. observations were recorded in range of 65 to 75 db(a) during day time whereas 173 observations were made in range of db(a) at night time. At Marathali station, 8% of exceedance was observed during day and 37% exceedance was observed in the night time. Out of 347 observations, 123 observations were recorded in the range of 55 to 65 db(a) at day time. During night time, 341 observations were recorded and 187 observations falls in the range of 45 to 55 db(a). 9% of the time sound level is 47 db(a) during day time whereas at night time 45 db(a). Noise Monitoring station installed at NIMHANS have 3 observations during day time and 363 observations during night time. Sound level ranges between 41 to 69 db(a) during day time and to 7 db(a) during night time. 94% exceedance of prescribed standard was observed during day time whereas 1% of exceedance was observed during night time. 9% of the time, 53 db(a) of sound level observed during day time whereas 53 db(a) observed during night time. Sound level ranges between 55 to 65 db(a) for 286 observations during day time whereas sound level falls between 45 to 55 db(a) for 41 observations. 365 observations were recorded at Nisarga Bhawan (NISA) Noise monitoring station during day time and 365 observations were made during night time. Sound level ranges between 53 to 65 db(a) during day time and 46 to 56 db(a) at night time. During day time 62% of exceedance of prescribed norms was observed whereas 1% of exceedance was observed during night time. 227 observations fall in the range of 55 to 65 db (A) at day time whereas 137 observation recorded in the range of 45 to 55 db(a). At Parisar Bhawan (PARI), sound level ranges from 62 to 7 db (A) during day time and 57 to 67 db(a) during night time. 9% of exceedance of prescribed standard was observed during day time whereas 1% exceedance was observed during night time. 9% of the time sound level of 65 db(a) was observed during day time and subsequently 58 db(a) at night time. 365 observations were made during the year 17. During day time, 328 times sound level ranges between 65 to 75 db(a) and 35 times sound levels fall in the range of 55 to 65 db(a). During night time, 359 observations fall in the range of 55 to 65 Leq Values in db(a)
19 db(a), 5 observations were made in the range of 65 to 75 db(a). Sound level not exceeding the 75 db(a) at day time and in the night time. Noise Monitoring station installed at Peeniya (PNYA) have 365 observations during day time and also 365 observations during night time. Sound level ranges between 54 to 74 db(a) during day time and 49 to 7 db(a) during night time. Zero percentage (%) of exceedance of prescribed standard was observed during day time as well as during night time also. 9% of the time, 59 db(a) of sound level observed during day time whereas 54 db(a) observed during night time. Sound level ranges between 55 to 65 db (A) for 127 observations during day time whereas sound level falls between 45 to 55 db(a) for 6 observations. At RVCE station, 1% of exceedance was observed during day and also in the night time. Out of 365 observations, 359 observations were recorded in the range of 55 to 65 db(a) at day time. During night time, 365 observations were recorded and 222 observations falls in range of 45 to 55 db (A) and there is only 1 observation was found during day time and no observations were recorded in the range of 65 to 75 db(a). 9% of the time sound level is 57 db(a) during day time whereas at night time 53 db(a). 362 observations were made at Teri Dolmur noise monitoring station during day time and 361 observations were made at night time. During day time and night time 1% of exceedance of prescribed standard was observed. 16 observations were recorded in range of 65 to 75 db(a) during day time whereas 25 observations were made in the range of db(a) at night time. Noise Monitoring station installed at White Field have 359 observations during day time and 361 observations during night time. Sound level ranges between 62 to 72 db(a) during day time and 5 to 73 db(a) during night time. There is no exceedance of prescribed standard was observed during day time and only 1% of exceedance of prescribed standard was observed during night time. 9% of the time, 65 db(a) of sound level observed during day time whereas 61 db(a) observed during night time. Sound level ranges between 55 to 65 db(a) for 43 observations during day time. At Yashwantpur station, 1% exceedance was observed during day and night time also. Out of 364 observations, there is 1 observation was recorded in the range of 55 to 65 db(a) at day time. During night time, 363 observations were recorded and no observations falls in range of 45 to 55 db(a) and 238 observations were recorded in the range of 65 to 75 db(a). 9% of the time sound level is 71 db(a) during day time whereas at night time 64 db(a). 6.2 ANALYSIS OF AMBIENT NOISE MONITORING ON MONTHLY BASIS Sound level data of 1 stations of Bengaluru is analysed on monthly basis. The data is averaged on monthly basis both for day and night time for the year 17 and mentioned in Table 7 and 8. Graph showing monthly trend for 1 stations is shown in Figures 13 to 22. Table 7: Monthly Average Sound level of first 5 stations of Bengaluru Stations Parisar Bhawan Peeniya (I) Nisarga Bhawan Marathali BTM Month January February March April May


20 Stations Parisar Bhawan Peeniya (I) Nisarga Bhawan Marathali Month June July August September October November December BTM Stations Table 8: Monthly Avg. Sound level of remaining 5 stations of Bengaluru Yashwanthpur RVCE Whitefield Area Dolmur NIMHANS Month January February March April May June July August September October November December Leq Values in db(a) January February Parisar Bhawan March April May June July August Septem October Novemb December Month Month Figure 13: Monthly trend of Parisar Bhawan station Figure 14: : Monthly trend of Peeniya station Leq Values in db(a) 8 Peeniya January February March April May June July August September October November December 16
21 Leq Values in db(a) (Leq Values in db(a) Nisarga Bhawan January February March April May June July August Month Figure 15: Monthly trend of Nisarga Bhawan station 8 BTM September October November December (Leq Values in db(a) (Leq Values in db(a) January February March April May Marathali June July August Septem Month Figure 16: Monthly trend of Marathali station Yeshwantp i October Novem Decemb pur (Leq Values in db(a) January February March April May June July Month August September October November December Figure 17: Monthly trend of BTM station R.V.C.E January February March April May June July Month August September October November December Figure 19: Monthly trend of R.V.C.E station (Leq Values in db(a) January February March April May June Month July August Figure 18: Monthly trend of Yashwanthpur station 1 8 Whitefield Are January February March April May June July August Septemb October September October November December ea November Month Figure : Monthly trend of Whitefield Area station December 17

 for day time at Peeniya whereas sound level varies from 46 to 74 db(a) during night time.")
 and minimum sound level recorded to 66 db(a) for day time whereas sound level ranges between 59 to 62 db(a) for night time.")
22 (Leq Values in db(a) 1 8 January February March April May Dolmur June July Month August Septem October Novem Decemb Figure 21: Monthly trend of Dolmur station (Leq Values in db(a) Nimhans January February March April May June July August s September October November Month Figure 22: Monthly trend of NIMHANS station December Close examination to above data and graph reveals following observations: At Parisar Bhawan, sound level varies between 63 to 7 db(a) for day time whereas 63 to 7 db(a) for night time. Sound level ranges between 48 to 76 db(a) for day time at Peeniya whereas sound level varies from 46 to 74 db(a) during night time. At Nisarga Bhawan, range of sound level recorded for day time is 56 to 59 db(a) and 48 to 51 db(a) for night time. At Marathali, maximum sound level observed was 67 db(a) and minimum sound level recorded to 66 db(a) for day time whereas sound level ranges between 59 to 62 db(a) for night time. At BTM, sound level varies between 58 to 7 db(a) for day time whereas 54 to 67 db(a) for night time. At Yashwantpur, sound level was recorded 71 to 73 db(a) for day time whereas 62 to 65 db(a) for night time. Sound level ranges between 58 to 63 db(a) for day time at R.V.C.E whereas sound level varies from 54 to 56 db(a) during night time. At Whitefield Area, range of sound level recorded for day time is 66 to 86 db(a) and to 75 db(a) for night time. At Dolmur, maximum sound level observed was 83 db(a) and minimum sound level recorded to 62 db(a) for day time whereas sound level ranges between 54 to 77 db(a) for night time. At NIMHANS, sound level was recorded to 78 db(a) for day time whereas 53 to 83 db(a) for night time. 6.3 ANALYSIS OF AMBIENT NOISE MONITORING ON YEARLY BASIS Sound level data of 1 stations of Bengaluru is analysed on yearly basis. The data for the year 17 is averaged on yearly basis both for day and night time and mentioned in Table-9. Graph showing yearly trend for 1 stations is shown in Figure
23 Table 9: Yearly Avg. Sound level of 1 stations of Bengaluru` Station Leq. db(a) Leq. db(a) 24(hrs.) Leq. db(a) Parisar Bhawan Peeniya(I) Nisarga Bhawan(R) Marathali BTM(R) Yeshwantpur R.V.C.E.(S) Whitefield(I) Dolmur(R) Nihmans(S) Leq Values in db(a) Bengaluru Leq. db(a) Leq. db(a) 24 (hrs.) Leq. Stations Figure 23: Yearly trend of Bengaluru s noise monitoring stations Close examination of Noise Data reveals that noise level at Bengaluru s ranges between 57 db(a) at Nisarga Bhawan (R) to 72 db(a) at Yashwantpur and Whitefield (I) during day time whereas 5 db(a) at Nisarga Bhawan to 66 db(a) at BTM, Whitefield (I) and Nimhans (S) during night time. 19

24 7. AMBIENT NOISE MONITORING OF CHENNAI Chennai, the capital city of Tamil Nadu, is located at N, E, and lies in the Southern India on the Coromandel Coast off the Bay of Bengal. It is the biggest industrial and commercial Centre in South India, and a major cultural, economic and educational Centre. Chennai is known as the "Detroit of India" for its automobile industry. Chennai is spread over an area of 426 sq. Kilometers. Current Population of Chennai in 14 is 4,792,949 as per census In Chennai, 1 monitoring stations are installed and details are depicted in Table -1 and Figure - 24 Table-1: Monitoring locations of Chennai Sl. Station location Category Latitude Longitude No. 1. Eye Hospital Silence Zone 13º6' 16.13'' N 8º17' 3.35'' E 2. T. Nagar Commercial Zone 13º2' 24.34'' N 8º13' 57.44'' E 3. Perambur Commercial Zone 13º6' 43.46'' N 8º14' 16.85'' E 4. Guindy Industrial Zone 13º' 42.79'' N 8º13' 9.46'' E 5. Triplicane Residential Zone 13º3' 17.91'' N 8º16' 28.44'' E 6. Pallikaranai Commercial Zone 12º56' 14.67'' N 8º12' 55.27'' E 7. Velachery Residential Zone 12º58' 35.9'' N 8º13' 15.27'' E 8. Washermanpet Commercial Zone 13º7' 53.84'' N 8º16' 43.95'' E 9. Anna Nagar Silence Zone 13º5' 21.45'' N 8º13' 23.93'' E 1. Sowcarpet Residential Zone 13º5' 42.4'' N 8º16' 32.2'' E Figure 24: Map shows the monitoring locations of Chennai
25 7.1 ANALYSIS OF AMBIENT NOISE MONITORING ON DAILY BASIS As stated earlier, Real time Ambient Noise Monitoring of Chennai has been carried out at 1 locations. The Sound level data of said data is processed for daily basis and the data is compared with Ambient Air Quality Standards in Respect of Noise is notified under Noise Pollution (Regulation and Control) Rules,. The Sound Level Data on daily basis for the year 17 is mentioned in Table 2 of Annexure-I. Statistical discussion of sound level data for the year 17 is presented in Tables 11 and 12.Tables 13 and 14 depict the frequency distribution data for the year 17. Graphical representation of each station for the year 17 is shown in Figures 25 to 34. Table 11: Statistical behavior of sound level data of first 5 stations for the year 17 ANNA NAGAR EYEH GUINDY PALLIKARAN AI (C ) PERAMBUR Standard No of Exceedance No of Observations Percentage of Exceedance Max Min Median L L L Table 12: Statistical behavior of sound level data of remaining 5 stations for the year 17 SOWCARPET T.NAGAR TRIPLICANE VELACHERRY WASHERMAN (R) PET Standard No of Exceedance No of Observations Percentage of Exceedence Max Min Median L L L
26 Table 13: Frequency analysis of sound level data of first 5 stations for the year 17 ANNA EYEH GUINDY PALLIKARA NAGAR NAI (C ) Frequency of Sound level data PERAMBUR < > Table 14: Frequency analysis of sound level data of remaining 5 stations for the year 17 Frequency of Sound level data SOWCARPET T.NAGAR TRIPLICANE (R) VELACHERRY WASHERMANPET < > Leq Valuesin db(a) Figure 25: time and time variation of Eye Hospital Leq Values in db(a) Figure 26: time and time variation of Guindy
27 Leq Values in db(a) Leq Values Figure 27: time and time variation of Pallikaranai Figure 28: time and time variation of Perambur Leq Values in db(a) Leq Values in db(a) Leq Values in db(a) Figure 29: time and time variation of Show carpet Figure 31: time and time variation of Triplicane Figure 3: time and time variation of T.Nagar Leq Values in db(a) Figure 32: time and time variation of Velacherry 23
28 Leq Values Figure 33: time and time variation of Washermanpet Figure 34: time and time variation of Anna Nagar Based on above facts and statistical values, following observations are made: At Anna Nagar, sound level ranges from to 72 db(a) during day time and 52 to 67 db(a) during night time. 1% of exceedance of prescribed standard was observed during day time whereas 1% exceedance was observed during night time also. 9% of the time sound level of 62 db(a) was observed during day time and subsequently 54 db(a) at night time. 365 observations were made during the year 17. During day time, 166 times sound level ranges between 55 to 65 db(a) and 198 times sound level fall in the range of 65 to 75 db(a). During night time, 85 observations falls in the range of 45 to 55 db(a), 267 observations were made in the range of 55 to 65 db(a). At Eye hospital, sound level ranges from to 74 db(a) during day time and 46 to 69 db(a) during night time. 94% of exceedance of prescribed standard was observed during day time whereas 1% of exceedance was observed during night time. 9% of the time sound level of db(a) was observed during day time and subsequently 56 db(a) at night time. 365 observations at day time and 364 observations at night time were made during the year 17. During day time, 56 times sound level ranges between 55 to 65 db(a) and 28 times sound level fall in the range of 65 to 75 db(a). 12 times, sound level below the 45 db(a) at day time. During night time, 31 observations falls in the range of 45 to 55 db(a), 38 observations were made in the range of 55 to 65 db(a). At Guindy (GNDY) station, 95% exceedance was observed during day and 99% exceedance was observed at night time. Out of 365 observations, 344 observations were recorded more than 75 db(a) and 19 observation was recorded in range of 65 to 75 db(a) during day time. During night time, 365 observations were recorded and 362 observations falls in the range of 65 to 75 db(a) and 1 observation was above the 75 db(a). 9% of the time sound level is 75 db(a) during day time whereas at night time 72 db(a). Noise Monitoring station installed at Pallikarnai have 343 observations during day time and 338 observations during night time. Sound level ranges between 62 to 88 db(a) during day time and 63 to 87 db(a) during night time. 99% exceedance of prescribed standard was observed during day time and 1% exceedance was observed during night time. Sound level ranges between 65 Leq Values in db(a)
29 to 75 db(a) for 265 observations during day time whereas sound level ranges between 55 to 65 db(a) for 5 observations at night. 74 times sound level exceeded 75 db(a) at day time. 363 observations were recorded at Perambur (PMB) Noise monitoring station during day time and 357 observations were recorded during night time. Sound level ranges between 42 to 84 db(a) during day time and 41 to 84 db(a) at night time. During day time 86% of exceedance of prescribed norms was observed and 93% of exceedance was observed during night time. 237 observations fall in the range of 65 to 75 db(a) at day time. 73 times sound level exceeded 75 db(a) at day time whereas 1 times during night time. 359 observations were made at SOWCARPET noise monitoring station at day time and 357 observations were made at night time. During day time and also night time 1% of exceedance of prescribed standard was observed. 28 observations were recorded in the range of 65 to 75 db(a) during day time whereas 343 observations were made in the range of db(a) at night time. No sound level exceeded the 75 db(a) during day time and night time. Noise Monitoring station installed at T. Nagar (TNGR) have 365 observations during day time and night time. Sound level ranges between 66 to 8 db(a) during day time and 41 to 76 db(a) during night time. 1% exceedance of prescribed standard was observed during day time whereas 98% exceedance was observed during night time. Sound level ranges between 65 to 75 db(a) for 121 observations during day time whereas sound level ranges between 55 to 65 db (A) for 3 observations at night time. 243 times sound level exceeded 75 db(a) at day time and 4 times exceedance was observed during night time. 365 observations were made at Triplicane (TRLN) noise monitoring station at day time and night time. During day time, 16% of exceedance of prescribed standard was observed whereas 98% of exceedance was observed during night time. 11 observations were recorded in range of 65 to 75 db(a) during day time whereas 46 observations were made in range of db(a) at night time. No sound level exceeded the 75 db(a) during day time and night time. 3 observations were recorded at Velacherry s Noise monitoring station during day time and 352 observations were recorded during night time. Sound level ranges between 62 to 8 db(a) during day time and 54 to 79 db(a) at night time. During day time 1% of exceedance of prescribed norms was observed whereas 1% of exceedance was observed during night time also. 259 observations fall in the range of 65 to 75 db(a) at day time whereas 69 observations recorded in range of 55 to 65 db (A). 11 times sound level exceeded 75 db(a) at day time whereas 15 times during night time. Noise Monitoring station installed at Washermanpet have 361 observations during day time and 362 observations during night time. Sound level ranges between 63 to 79 db(a) during day time and 55 to 75 db(a) during night time. 98% exceedance of prescribed standard was observed during day time and also 1% exceedance was observed during night time. Sound level ranges between 65 to 75 db(a) for 335 observations during day time whereas sound level ranges between 55 to 65 db(a) for 177 observations at night time. 17 times sound level exceeded 75 db(a) at day time and times during night time. 7.2 ANALYSIS OF AMBIENT NOISE MONITORING ON MONTHLY BASIS Sound level data of 1 stations of Chennai is analyzed on monthly basis. The data is averaged on monthly basis both for day and night time for the year 17 and mentioned in Tables 15 and 16. Graphs showing monthly trend for 1 stations is shown in Figures 35 to


 1 8 January February March April")
30 Stations Table 15: Monthly Average Sound level of first 5 stations of Chennai Eye Hospital T. Nagar Perambur Guindy Month January February March April May June July August September October November December Table 16: Monthly Average Sound level of remaining 5 stations of Chennai Stations Pallikaranai Velacherry Anna Nagar Sowcarpet Washermanpet Month January February March April May June July August September October November December Triplicane Leq Values in db(a) 8 January February March April May June July Month August Septe October Novem Decem Figure 35: Monthly trend of Eye Hospital Garden station Leq Values in db(a) 1 8 January February March April May June July August Septem October Novemb Month December Figure 36: Monthly trend of Perambur station 26
31 Leq Values in db(a) Leq Values in db(a) Leq Values in db(a) 8 January February March April May June July August Septemb October Month Figure 37: Monthly trend of Guindy Garden station January February March April May June July Month August September October November December Figure 39: Monthly trend of T. Nagar station 1 8 January February March April May June July Month November December August Septemb October November December Figure 41: Monthly trend of Velacherry station Leq Values in db(a) Leq Values in db(a) Leq Values in db(a) January February March April May June July August Septem October Month Figure 38: Monthly trend of Triplicane station 1 January February March April May June July August Septe Month Figure : Monthly trend of Pallikaranai station January February March April May June July August Septem October Novemb Month November December October Novem Decem December Figure 42: Monthly trend of Anna Nagar station 27

 during night time. At Perambur, range of sound level recorded for day time is 69 to 81 db(a) and 68 to 83 db(a).")
32 8 8 Leq Values in db(a) January February March April May June July Month August Septem October November December Figure 43: Monthly trend of Sowcarpet station Leq Values in db(a) January February March April May June July August Month September October November December Figure 44: Monthly trend of Washermanpet station Close examination to above data and graph reveals following observations: At Eye Hospital, sound level varies between 62 to 7 db(a) for day time whereas 56 to 68 db(a) for night time. Sound level ranges between 75 to 76 db(a) for day time at T. Nagar whereas sound level varies from 7 to 73 db(a) during night time. At Perambur, range of sound level recorded for day time is 69 to 81 db(a) and 68 to 83 db(a). At Guindy, maximum sound level observed was 76 db(a) and minimum sound level recorded to 74 db(a) for day time whereas sound level ranges between 63 to 7 db(a) for night time. At Triplicane, sound level was recorded 51 to 86 db(a) for day time whereas 51 to 64 db(a) for night time. At Pallikaranai, sound level varies between 73 to 87 db(a) for day time whereas 66 to 88 db(a) for night time. Sound level ranges between 66 to 87 db(a) for day time at Velacherry whereas sound level varies from 57 to 82 db(a) during night time. At Anna Nagar, range of sound level recorded for day time is 64 to 68 db(a) and 54 to 64 db (A) for the night time. At Sowcarpet, maximum sound level observed was 77 db(a) and minimum sound level recorded to 65 db(a) for day time whereas sound level ranges between 59 to 8 db(a) for night time. At Washermanpet, sound level was recorded 69 to 77 db(a) for day time whereas 63 to 73 db(a) for night time. 7.3 ANALYSIS OF AMBIENT NOISE MONITORING ON YEARLY BASIS Sound level data of 1 stations of Chennai is analyzed on yearly basis. The dataa for the year 17 is averaged on yearly basis both for day and night time and mentioned in Table 17. Graph showing yearly trend for 1 stations is shown in Figure 45. Table 17: Yearly Average Sound level of 1 stations of Chennai STATION 24 28
33 Leq. db(a) Leq. db(a) (hrs.) Leq. db(a) Eye Hospital(S) T.Nagar Perambur Guindy(I) Triplicane(R) Pallikarnai Velachery(R) Washermanpet Anna Nagar(S) Sowcarpet(R) Leq Values in db(a) Chennai Leq. db(a) Leq. db(a) 24 (hrs.) Leq. db(a) Stations Figure 45: Yearly trend of Chennai s noise monitoring stations Close examination of Noise Data reveals that noise level at Chennai range between 66 db(a) at Anna Nagar (S) to 78 db(a) at Pallikarnai during day time whereas sound level ranges between 58 to 77 db(a) at Triplicane and Pallikarnai respectively during night time. 29

34 8. AMBIENT NOISE MONITORING OF DELHI Delhi, the capital of India, is located at N E, and lies in Northern India. It stands on the west bank of Yamuna River bounded by Uttar Pradesh and on the north, west and south by Haryana. Delhi is spread over an area of 1483 sq. kilometers, therefore making it the largest city in terms of area in the country. It has a length of 51.9 km and a width of km. The vehicles and industrial activities are the major source of noise pollution in Delhi. In Delhi, 1 monitoring stations are installed and details are depicted in Table 18 and Figure 46. Table 18: Monitoring locations of Delhi Sl. Station location Category Latitude Longitude No. 1. Delhi College of Engineering Silence Zone 28º44' 44.49'' N 77º5' 1.56'' E 2. Netaji Subhas Institute of Silence Zone 28º36' 14.46'' N 77º2' 28.78'' E Technology (NSIT) 3. IHBAS, Dilshad Garden Silence Zone 28º' 53.76'' N 77º19' 6.2'' E 4. ITO Commercial Zone 28º37' 41.21'' N 77º14' 27.22'' E 5. Central Pollution Control Commercial Zone 28º39'.99'' N 77º17' 39.91'' E Board 6. Civil Lines Commercial Zone 28º' 55.97'' N 77º13' 25.75'' E 7. R.K. Puram Silence Zone 28º33' 46.23'' N 77º11' 12.4'' E 8. AnandVihar Commercial Zone 28º38' 51.22'' N 77º18' 57.2'' E 9. Mandir Marg Silence Zone 28º38' 11.41'' N 77º12' 2.36'' E 1. Punjabi Bagh Residential Zone 28º' 12.83'' N 77º7' 54.14'' E Figure 46: Map shows the monitoring locations of Delhi 3
35 8.1 ANALYSIS OF AMBIENT NOISE MONITORING ON DAILY BASIS As stated earlier, Real time Ambient Noise Monitoring of Delhi has been carried out at 1 locations. The Sound level data of said data is processed for daily basis and the data is compared with Ambient Air Quality Standards in Respect of Noise is notified under Noise Pollution (Regulation and Control) Rules,. The Sound Level Data on daily basis for the year 17 is mentioned Table 3 of Annexure-I. Statistical discussion of sound level data for the year 17 is presented in Tables 19 and. Table 21 and 22 depicts the frequency distribution data for the year 17. Graphical representation of each station for the year 17 is shown in Figures 47 to 56. Table 19: Statistical behavior of sound level data of first 5 stations for the year 17 ANAND VIHAR CIVIL LINES CPCB DCE DILSHAD GARDEN (S) Standard No of Exceedance No of Observations Percentage of Exceedance Max Min Median L L L Table : Statistical behavior of sound level data of remaining 5 stations for the year 17 ITO MANDIR MARG (S ) NSIT (S) PUNJABI BAGH RK PURAM (S) Standard No of Exceedance No of Observations Percentage of Exceedance Max
36 ITO MANDIR MARG (S ) NSIT (S) PUNJABI BAGH RK PURAM (S) Min Median L L L Table 21: Frequency analysis of sound level data of first five noise monitoring stations under Phase- I for the year 17 ANAND VIHAR CIVIL LINES CPCB DCE DILSHAD GARDEN (S) Frequency of Sound level data < >75 Table 22: Frequency analysis of sound level data of remaining five noise monitoring stations under phase-ii for the year 17 Frequency of Sound level data ITO MANDIR MARG (S ) NSIT (S) PUNJABI BAGH RK PURAM (S) < >


37 Figure 47: time and time variation of ANAND VIHAR Figure 48: time and time variation of CIVIL LINES Figure 49: time and time variation of CPCB Figure 5: time and time variation of DCE Figure 51: time and time variation of ITO Figure52: time and time variation of MANDIR MARG 33
 are installed at silence zone, 4 stations")
 during day time and 62 to 72 db(a) during night time.")
38 Figure 53: time and time variation of NSIT Figure 54: time and time variation of PUNJABI BAGH Figure 55: time and time variation of Dilshad Garden Figure 56: time and time variation of R K PURAM Based on above facts and statistical values, following observations are made: Out of 1 stations, 4 stations (Mandir Marg, Dilshad Garden, NSIT and DCE) are installed at silence zone, 4 stations (Anand Vihar, Civil Lines, CPCB and ITO) are installed at Commercial zone and remaining 2 stations at Punjabi bagh and RK Puram are installed in Residential zone.. At Anand Vihar, sound level ranges from 62 to 71 db(a) during day time and 62 to 72 db(a) during night time. 99% of exceedance of prescribed standard was observed during day time whereas 1% exceedance was observed during night time. 9% of the time sound level of 67 db(a) was observed during day time and subsequently 63 db(a) at night time. 364 observations were made during the year 17. During day time, no sound level ranges between 45 to 55 db(a) and 4 times sound level fall in the range of 55 to 65 db(a). No sound level exceeded the 75 db(a). During night time, no observations fall in the range of 45 to 55 db(a), 1 observations made in the range of 55 to 65 db(a). 34
39 Noise Monitoring station installed at Civil Lines have 361 observations during day time and 362 observations during night time. Sound level ranges between 56 to 69 db(a) during day time and 56 to 66 db(a) during night time. 5% exceedence of prescribed standard was observed during day time whereas 1% exceedence was observed during night time. 9% of the time, db(a) of sound level observed during day time whereas 57 db(a) observed during night time. Sound level ranges between 55 to 65 db(a) for 343 observations during day time whereas no sound level falls between 45 to 55 db(a). Noise Monitoring station installed at CPCB have 365 observations during day time and night time. Sound level ranges between 57 to 69 db(a) during day time and 53 to 68 db(a) during night time. 78% exceedence of prescribed standard was observed during day time whereas 99% exceedence was observed during night time. 9% of the time, 64 db(a) of observed during day time whereas 56 db(a) observed during night time. Sound level ranges between 55 to 65 db(a) for 81 observations during day time whereas sound level falls between 45 to 55 db(a) for 4 observations during night time. 365 observations were recorded at DCE s Noise monitoring station during day time and night time. Sound level ranges between 48 to 67 db(a) during day time and 45 to 59 db(a) at night time. During day time and night time 1% of exceedance of prescribed norms was observed. 184 observations fall in the range of 45 to 55 db(a) at day time whereas 283 observations recorded during night time in the range of 45 to 55 db(a). No sound level exceeded 75 db(a) at day time and night time. At Dilshad Garden, sound level ranges from 48 to 57 db(a) during day time and 47 to 55 db(a) during night time. 99% of exceedence of prescribed standard was observed during day time whereas 1% exceedence was observed during night time. 9% of the time sound level of 53 db(a) was observed during day time and subsequently 52 db(a) at night time. 365 observations at day time and night time were made during the year 17. During day time, 3 times - sound level ranges between 45 to 55 db(a) and 5 times, sound level fall in range of 55 to 65 db(a). There is no sound level exceeded the 75 db(a). During night time, 361 observations fall in the range of 45 to 55 db(a), 2 observations made in the range of 55 to 65 db(a). At ITO station, 1% exceedence was observed during day time and night time. Out of 365 observations, 364 observations recorded in the range of 65 to 75 db(a) and no observations were more than 75 db(a) during day time. During night time, 365 observations were recorded and 364 observations falls in range of 65 to 75 db(a) and no observations above the 75 db(a). 9% of the time sound level is 7 db(a) whereas at night time 67 db(a). 365 observations were recorded at Mandir Marg Noise monitoring station during day time and night time. Sound level ranges between 48 to 66 db(a) during day time and 44 to 69 db(a) at night time. During day time 96% of exceedence of prescribed norms was observed whereas 1% of exceedence was observed during night time. 123 observations falls in the range of 45 to 55 db(a) at day time whereas 35 observations recorded during night time in the range of 45 to 55 db(a). No sound level exceeded 75 db(a) at day time and night time. 365 observations were made at NSIT noise monitoring station at day time and at night time. During day time and night time, 1% of exceedence of prescribed standard was observed. 351 observations were recorded in range of 55 to 65 db(a) during day time whereas 233 observations were made in range of db(a) at night time. 35
40 At Punjabi Bagh station, 99% exceedence was observed during day and 1% exceedence was observed during night time. Out of 364 observations, 4 observations were recorded in the range of 45 to 55 db(a) during day time. During night time, 37 observations were recorded in the range of 45 to 55 db(a). 9% of the time sound level is 56 db(a) during day time whereas at night time 5 db(a). Noise Monitoring station installed at RK Puram have 364 observations during day time and night time. Sound level ranges between 55 to 67 db(a) during day time and 47 to 61 db(a) during night time. 99% exceedance of prescribed standard was observed during day time whereas 1% exceedence was observed during night time. 9% of the time, 58 db(a) of sound level observed during day time whereas 52 db(a) observed during night time. Sound level ranges between 55 to 65 db(a) for 359 observations during day time whereas sound level falls between 45 to 55 db(a) for 2 observations. 8.2 ANALYSIS OF AMBIENT NOISE MONITORING ON MONTHLY BASIS Sound level data of 1 stations of Delhi is analyzed on monthly basis. The data is averaged on monthly basis both for day and night time for the year 17 and mentioned in Tables 23 and 24. Graph showing monthly trend for 1 stations is shown in Figures 57 to 66. Table 23: Monthly Avg. Sound level of first 5 stations of Delhi Stations Dilshad Garden CPCB HQ DCE ITO NSIT Month January February March April May June July August September October November December Note: *Station was non-operational due to construction work 36


41 Table 24: Monthly Avg. Sound level of remaining 5 stations of Delhi Stations Civil Lines R.K. Puram AnandVihar Mandir Marg Punjabi Bagh Month January February March April May June July August September October November December Figure 57: Monthly trend of Dilshad Garden station Figure 58: Monthly trend of DCE station 37


42 Figure 59: Monthly trend of NSIT station Figure : Monthly trend of CPCB station Figure 61: Monthly trend of ITO station Figure 62: Monthly trend of Civil Lines station Figure 63: Monthly trend of R.K. Puram station Figure 64: Monthly trend of AnandVihar station Figure 65: Monthly trend of Mandir Marg station Figure 66: Monthly trend of Punjabi Bagh station 38
43 Close examination to above data and graph reveals following observations: At Dilshad Garden, sound level varies between 53 to 58 db(a) for day time whereas 52 to 53 db(a) for night time. Sound level ranges between 65 to 66 db(a) for day time at CPCB whereas sound level varies from 55 to db(a) during night time. At ITO, Sound level roam around 71 to 73 db(a) for day time whereas 66 to 68 db(a) during night time. At NSIT, maximum sound level observed was 58 db(a) and minimum sound level recorded to 56 db(a) for day time whereas sound level ranges between 53 to 56 db(a) for night time. Sound level ranges between 53 to 59 db(a) for day time at DCE whereas sound level varies from 47 to 57 db(a) during night time. At Civil Lines, Sound level roam around 61 to 78 db(a) for day time whereas 58 to 75 db(a) during night time. At R.K Puram, maximum sound level observed was 7 db(a) and minimum sound level recorded to 59 db(a) for day time whereas sound level ranges between 5 to 69 db(a) for night time. Sound level ranges between 67 to 72 db(a) for day time at Anand Vihar whereas sound level varies from 63 to 67 db(a) during night time. At Punjabi Bagh, maximum sound level observed was 75 db(a) and minimum sound level recorded to 58 db(a) for day time whereas sound level ranges between 51 to 78 db(a) for night time. Sound level ranges between 56 to 82 db(a) for day time at Mandir Marg whereas sound level varies from 48 to 53 db(a) during night time. 8.3 ANALYSIS OF AMBIENT NOISE MONITORING ON YEARLY BASIS Sound level data of 1 stations of Delhi is analyzed on yearly basis. The data for the year 17 is averaged on yearly basis both for day and night time and mentioned in Table 25. Graph showing yearly trend for 1 stations is shown in Figure 67. Table 25: Yearly Avg. Sound level of 1 stations of Delhi STATIONS Dilshad Garden(S) CPCB HQ. DCE(S) ITO NSIT(S) Civil Lines Leq. db(a) Leq. db(a) 24(hrs.) Leq. db(a)
 at Dilshad Garden to 72 db(a) at ITO during day time whereas sound level ranges from 49 db(a) at Mandir Marg (S) to 67 db(a) at ITO during night time.")
44 RKPuram(S) AnandVihar Mandir Marg(S) Punjabi Bagh(R) Figure 67: Yearly trend of Delhi s noise monitoring stations Close examination of Noise Data reveals that sound level at Delhi varies between 54 db(a) at Dilshad Garden to 72 db(a) at ITO during day time whereas sound level ranges from 49 db(a) at Mandir Marg (S) to 67 db(a) at ITO during night time.
.")
45 9. AMBIENT NOISE MONITORING OF HYDERABAD Hyderabad, the common capital of both the southern Indian states of Andhra Pradesh and Telangana, is located at N, E and lies on hilly terrain in Southern India along the banks of the Musi River. Hyderabad is spread over an area of 65 square kilometers (25 sq. mi). Current Population of Hyderabad in 14 is 6,89,97 as per census 11. In Hyderabad, 1 monitoring stations are installed and details are depicted in Table -26 and Figure 68. Table 26: Monitoring locations of Hyderabad Sl. Station location Category Latitude Longitude No. 1. Abids Commercial Zone 17º23' 27.42'' N 78º28' 25.59'' E 2. Punjagutta Commercial Zone 17º25' 27.77'' N 78º27' 3.74'' E 3. Jeedimetla Industrial Zone 17º3' 44.12'' N 78º28' 1.43'' E 4. Zoo Silence Zone 17º22' 8.44'' N 78º28' 17.42'' E 5. Jubilee Hills Residential Zone 17º26' 22.8'' N 78º23' 58.28'' E 6. Tarnaka Residential Zone 17º25' 43.57'' N 78º32' 15.83'' E 7. Gaddapotharam Industrial Zone 17º36' 4.1'' N 78º22' 19.8'' E 8. Gachibowli Silence Zone 17º27' 36.1'' N 78º' 3.3'' E 9. Paradise Commercial Zone 17º26' 36.7'' N 78º29' 15.9'' E 1. Kukatpalli Commercial Zone 17º29' 45.3'' N 78º23' 39'' E Figure 68: Map shows the monitoring locations of Hyderabad 9.1 ANALYSIS OF AMBIENT NOISE MONITORING ON DAILY BASIS As stated earlier, Real time Ambient Noise Monitoring of Hyderabad has been carried out at 1 locations. The Sound level data of said data is processed for daily basis and the data is compared with Ambient Air Quality Standards in Respect of Noise is notified under Noise Pollution (Regulation and Control) Rules,. The Sound Level Data on daily basis for the year 17 is mentioned Table 4 of Annexure-I. Statistical discussion of sound level data for the year 17 is presented in the Table 27 and 28. Table 29 and 3 depicts the frequency 41
46 distribution data for the year 17. Graphical representation of each station for the year 17 is shown in Figure 69 to 78. Table 27: Statistical behavior of sound level data of first 5 stations for the year 17 ABIDS Gachibowli (S) Gaddapotharam (I) Jeedimetla(I) Jublee hills (R) Standard No of Exceedances No of Observations Percentage of Exceedances Max Min Median L L L Table 28: Statistical behavior of sound level data of remaining 5 stations for the year 17 TSPCB JNTU Paradise Tarnaka (R) Zoo (S) Standard No of Exceedances No of Observations Percentage of Exceedance Max Min Median L L L Table 29: Frequency analysis of sound level data of first 5 stations for the year 17 Frequency of Sound level data ABIDS Gachibowli Gaddapotharam Jeedimetla jubilee hills < > Table 3: Frequency analysis of sound level data of remaining 5 stations for the year 17 Frequency of Sound level data TSPCB JNTU Paradise Tarnaka (R) Zoo (S) 42
47 < > Leq Values in db(a) Leq Values in db(a) Figure 69: time and time variation of Abids Leq Values in db(a) Figure 71: time and time variation of Zoo DAy Figure73: time and time variation of Jubilee Hills Leq Values in db(a) Leq Values in db(a) Leq Values in db(a) Figure7: time and time variation of Jeedimetla Figure72: time and time variation of TSPCB Figure74: time and time variation of Gachibowli
48 Leq Values in db(a) Leq Values in db(a) Leq values in db(a) Figure75: time and time variation of JNTU Figure77: time and time variation of Paradise Leq Values in db(a) Figure76: time and time variation of Tarnaka Figure78: time and time variation of Gaddapotharam Based on above facts and statistical values, following observations are made: At Abids, sound level ranges from 71 to 77 db(a) during day time and 65 to 75 db(a) at night time. 1% of exceedance of prescribed standard was observed during day time and also 1% exceedance was observed during night time. 9% of the time sound level of 73 db(a) was observed during day time and subsequently 66 db(a) at night time. 365 observations were made during the year 17. During day time, 275 times - sound level ranges between 65 to 75 db(a). 89 times, sound level exceeded the 75 db (A). During night time, there are 2 observations fall in the range of 55 to 65 db(a), 357 observations made in the range of 65 to 75 db(a). Noise monitoring station installed at Gachibowli has 365 observations during day time and also 365 observations during night time. Sound level ranges between 51 to 68 db(a) during day time and 47 to 66 db(a) during night time. 1% exceedance of prescribed standard was observed during day time and 1% exceedance was observed during night time also. Sound level not exceeding more than 75 db(a) during day time whereas sound level falls between 65 to 75 db(a) for 8 observations. At Gaddapotharam station, 23% exceedance was observed during day time and 36% exceedance was observed during night time. Out of 359 observations, 22 observations recorded in the range of 45 to 55 db(a) at day time. During night time, out of
49 observations, 12 observations were recorded in the range of 45 to 55 db(a). 9% of the time sound level is 58 db(a) during day time whereas at night time 57 db(a). 357 observations were recorded at Jeedimetla Noise monitoring station during day time and 357 observations were made during night time also. Sound level ranges between 61 to 85 db(a) during day time and 5 to 83 db(a) at night time. During day time 6% exceedance of prescribed norms was observed. Whereas 11% of exceedance was observed during night time. 48 observations fall in the range of 55 to 65 db(a) at day time whereas 293 observations recorded in range of 55 to 65 db(a) at night time. 28-times sound level exceeded 75 db(a) at day time whereas 24 times exceedance during night time. 361 observations were made at Jubilee Hills noise monitoring station at day time and 365 observations were made at night time. During day time, 1% of exceedance of prescribed standard was observed and 1% of exceedance was observed during night time also. 356 observations were recorded in range of 55 to 65 db(a) during day time whereas 112 observations were made in the range of db(a) at night time. There is no sound level exceeded 75 db(a) at day time as well as during night time also. Noise monitoring station installed at TSPCB has 364 observations during day time and 364 observations during night time also. Sound level ranges between 69 to 79 db(a) during day time and 62 to 76 db(a) during night time. 1% exceedance of prescribed standard was observed during day time as well as during night time also. Sound level ranges more than 75 db(a) for 11 observations during day time whereas 353 sound level falls between 65 to 75 db(a). At JNTU station, 1% exceedance was observed during day and also night time. Out of 364 observations, there is no observation was recorded in the range of 45 to 55 db(a) at day time. During night time also out of 364 observations, there is no observation was recorded in the range of 45 to 55 db(a). 9% of the time sound level is 69 db(a) whereas at night time 66 db(a). 337 observations were made at Paradise noise monitoring station at day time and 344 observations were made at night time. During day time, 88% of exceedance of prescribed standard was observed and 95% of exceedance was observed during night time also. There are 35 observations were recorded in range of 55 to 65 db(a) during day time whereas 34 observations were made in the range of db(a) at night time. 7 times sound level exceeded 75 db(a) at day time whereas 11 times during night time. Noise monitoring station installed at Tarnaka has 365 observations during day time and 365 observations during night time also. Sound level ranges between 57 to 67 db(a) during day time and 5 to 67 db(a) during night time. 1% exceedance of prescribed standard was observed during day time as well as during night time also. There is no Sound level ranges more than 75 db(a) was observed during day time whereas sound level falls between 65 to 75 db(a) is 11. At Zoo station, 1% exceedance was observed during day and night time. Out of 365 observations, 171 observations were recorded in the range of 45 to 55 db(a) at day time. During night time, out of 365 observations, 353 observations recorded in the range of 45 to 55 db(a). 9% of the time sound level is 53 db(a) whereas at night time 49 db(a). 9.2 ANALYSIS OF AMBIENT NOISE MONITORING ON MONTHLY BASIS Sound level data of 1 stations of Hyderabad is analysed on monthly basis. The data is averaged on monthly basis both for day and night time for the year 17 and mentioned in Table 31 and 32. Graph showing monthly trend for 5 stations is shown in Figure 79 to 88. Table 31: Monthly Avg. Sound level data of first 5 stations of Hyderabad Stations Abids TSPCB Jeedimetla Zoo Jubilee Hills Month 45
50 Stations Abids TSPCB Jeedimetla Zoo Jubilee Hills Month January February March April May June July August September October November December Table 32: Monthly Avg. Sound level data of remaining 5 stations of Hyderabad Stations Tarnaka Gaddapotharam Gachibowli Paradise JNTU Month January February March April May June July August September October November December Leq Values in db(a) Leq Values in db(a) 8 Month Figure 79: Monthly trend of Abids station Month Figure 8: Monthly trend of TSPCB station 46
51 Leq Values in db(a) Leq Values in db(a) Months Figure 81: Monthly trend of Jeedimetla station Leq Values in db(a) Months Figure 82: Monthly trend of Zooo station Leq Values in db(a) 8 Months Figure 83: Monthly trend of Jubilee Hills station Leq Values in db(a) 1 8 Month Figure 84: Monthly trend of Tarnaka station Leq Values in db(a)8 Month Figure 85: Monthly trend of Gaddapotharam station Leq Values in db(a) 1 8 Month Figure 86: Monthly trend of Gachibowli station Leq Values in db(a) Month Figure 87: Monthly trend of Paradise station Month Figure 88: Monthly trend of JNTU station 47
52 Close examination to above data and graph reveals following observations: At Abids, sound level varies between 73 to 75 db(a) for day time whereas 65 to 7 db(a) for night time. Sound level ranges between 64 to 78 db(a) for day time at TSPCB whereas sound level varies from 57 to 8 db(a) during night time. At Jeedimetla, Sound level roam around db(a) for day time whereas 56 db(a) during night time. Range of sound level recorded for day time is to 65 db(a) and 53 to 58 db(a) for night time. At Zoo, maximum sound level observed was 61 db(a) and minimum sound level recorded to 54 db(a) for day time whereas sound level ranges between 48 to 53 db(a) for night time. At Jubilee Hills, sound level was recorded 71 to 73 db(a) for day time whereas 63 to 67 db(a) for night time. At Tarnaka, sound level varies between to 78 db(a) for day time whereas 51 to 75 db(a) for night time. Sound level ranges between 71 to 84 db(a) for day time at Gaddapotharam whereas sound level varies from 65 to 8 db(a) during night time. At Gachibowli, range of sound level recorded for day time is 56 to 74 db(a) and 5 to 77 db(a) for night time. At Paradise, maximum sound level observed was 88 db(a) and minimum sound level recorded to 71 db(a) for day time whereas sound level ranges between 64 to 85 db(a) for night time. At JNTU, sound level was recorded 69 to 72 db(a) for day time whereas 64 to 7 db(a) for night time. 9.3 ANALYSIS OF AMBIENT NOISE MONITORING ON YEARLY BASIS Sound level data of 1 stations of Hyderabad is analyzed on yearly basis. The data for the year 17 is averaged on yearly basis both for day and night time and mentioned in Table 33. Graph showing yearly trend for 1 stations is shown in Figure 89. Table 33: Yearly Avg. Sound level of 1 stations of Hyderabad Station Leq. db(a) Leq. db(a) 24(hrs.) Leq. db(a) Abids TSPCB Jeedimetla(I) Zoo(S) Jubilee Hills(R) Tarnaka(R) Gaddapotharam(I) Gachibowli(S) Paradise Kukatpalli
53 9 8 Hyderabad Leq. db(a) Leq. db(a) 24 (hrs.) Leq. db(a) Leq Values in db(a) Stations Figure 89: Yearly trend of Hyderabad s noise monitoring stations Close examination of Noise Data reveals that sound level at Hyderabad ranges between 56 db(a) at Zoo (S) to 78 db(a) at Gaddapotharam (I) during time whereas sound level ranges between 5 db(a) at Zoo (S) to 85 db(a) at Jeedimetla (I) during time. 49

54 1. AMBIENT NOISE MONITORING OF KOLKATA Kolkata, the capital of Indian state of West Bengal, is located at N, E, and lies on East bank of the Hooghly River bounded by Bangladesh and Bay of Bengal. Kolkata spread over an area of 148 square kilometers. In Kolkata, 1 monitoring stations are installed and details are depicted in Table -34 and Figure -9. Table 34: Monitoring locations of Kolkata Sl. No. Station location Category Latitude Longitude 1. SSKM Hospital Silence Zone 22º32' 19.58'' N 88º' 35.29'' E 2. Gole Park Industrial Zone 22º31' 1.2'' N 88º24' 15.8'' E 3. Kolkata HQ Commercial Zone 22º33' 42.67'' N 88º24' 32.46'' E 4. Patauli Residential Zone 22º28' 21.7'' N 88º23' 29.71'' E 5. New Market Commercial Zone 22º33' 41.4'' N 88º21' 1.4'' E 6. Birati N. Residential Zone 22º' 13.99'' N 88º26' 1.74'' E 7. RG Kaur Silence Zone 22º36' 16.18'' N 88º22' 43.'' E 8. Tollygunge Commercial Zone 22º29' 56.48'' N 88º' 43.79'' E 9. Bag Bazar Residential Zone 22º36' 4.61'' N 88º22' 1.1'' E 1. Tartala Industrial Zone 22º3' 56'' N 88º18' 19.2'' E Figure 9: Map shows the monitoring locations of Kolkata 5
55 1.1 ANALYSIS OF AMBIENT NOISE MONITORING ON DAILY BASIS As stated earlier, Real time Ambient Noise Monitoring of Kolkata has been carried out at 1 locations. The Sound level data of said data is processed for daily basis and the data is compared with Ambient Air Quality Standards in Respect of Noise is notified under Noise Pollution (Regulation and Control) Rules,. The Sound Level Data on daily basis for the year 17 is mentioned in Table-5 of Annexure-I. Statistical discussion of sound level data for the year 17 is presented in Table-35 and 36. Graphical representation of each station for the year 15 is shown in Figure 91 to1. Table 35: Statistical behavior of sound level data of first 5 stations for the year 17 BAG BAZAR (R) BIRATI GOLE PARK HEAD QUARTER NEW MARKET Standard No of Exceedance No of Observations Percentage of Exceedance Max Min Median L L L Table 36: Statistical behavior of sound level data of remaining 5 stations for the year 17 PATAULI RGKAUR SSKM TARATALA TOLLYGUNJ Standard No of Exceedance No of Observations Percentage of Exceedance Max Min Median L L L Table 37: Frequency analysis of sound level data of first 5 stations for the year 17 51
56 Frequency of Sound level data BAG BAZAR (R) BIRATI GOLE PARK HEAD QUARTER NEW MARKET < > Table 38: Frequency analysis of sound level data of remaining 5 stations for the year 17 Frequency of Sound level data PATAULI RGKAUR SSKM TARATALA TOLLYGUNJ < > Leq Values in db(a) Figure 91: time and time variation of Bag Bazar Leq Values in db(a) Figure 92: time and time variation of Birati Figure 93: time and time variation of Gole Park Figure 94: time and time variation of Kolkata Leq Values in db(a) Leq Values in db(a)
57 Leq Values in db(a) Figure 95: time and time variation of New Market Leq Values in db(a) HQ Leq Values in db(a) Figure 96: time and time variation of Patauli Leq Values in db(a) Figure 97: time and time variation of RGKAUR Leq Values in db(a) Figure 99: time and time variation of Tartala Leq Values in db(a) Figure 98: time and time variation of SSKM Hospital Figure 1: time and time variation of Tollygunj Based on above facts and statistical values, following observations are made: 362 observations were recorded at BAG BAZAR Noise monitoring station during day and 363 observations were recorded at night time. Sound level ranges between 69 to 79 db(a) during day time and 65 to 77 db(a) at night time. During day time and night time 1 % of exceedance of 53
58 prescribed norms was observed. No observations fall in the range of 45 to 55 db(a) at day time as well as during night time. 18 times sound level exceeded 75 db(a) at day time and 3 times during night time. At BIRATI, sound level ranges from 53 to 76 db(a) during day time and 49 to 7 db(a) during night time. 95% of exceedance of prescribed standard was observed during day time whereas 1% exceedance was observed during night time. 9% of the time sound level of 56 db(a) was observed during day time and subsequently 51 db(a) at night time. 364 observations were made during the year 17. During day time, 282 times - sound level ranges between 55 to 65 db(a) and 62 times, sound level fall in range of 65 to 75 db(a). There are 2 times sound level exceeded the 75 db(a). During night time, 214 observations fall in the range of 45 to 55 db(a), 135 observations made in the range of 55 to 65 db(a). Noise Monitoring station installed at GOLE PARK have 345 observations during day time and night time. Sound level ranges between 46 to 79 db(a) during day time and 48 to 77 db(a) during night time. 4% exceedance of prescribed standard was observed during day time whereas 35% exceedance was observed during night time. 9% of the time, 61 db(a) of sound level observed during day time whereas 61 db(a) observed during night time. Sound level ranges between 55 to 65 db(a) for 84 observations during day time whereas sound level ranges between 55 to 65 db(a) for 74 observations during night time. 365 observations were recorded at KOLKATA HEAD QUARTERS Noise monitoring station during day and night time. Sound level ranges between 58 to 68 db(a) during day time and 56 to 63 db(a) at night time. During day time 7% of exceedance of prescribed norms was observed whereas 1% of exceedance was observed during night time. 3 observations fall in the range of 55 to 65 db(a) at day time whereas 364 observations recorded in range of 55 to 65 db(a) at night time. No sound level exceeded 75 db(a) at day time and also during night time. 345 observations were made at NEW MARKET noise monitoring station at day time and 336 observations were made at night time. During day time, as well as at night time 1% of exceedance of prescribed standard was observed. 268 observations were recorded in range of 65 to 75 db(a) during day time whereas 259 observations were made in the range of 65 to 75 db(a) at night time. At PATAULI station, 96% exceedance was observed during day time and 1% exceedance was observed during the night time. Out of 365 observations, 16 observations were recorded in range of 45 to 55 db(a) and 11 observations were more than 75 db(a) during day time. During night time, 364 observations were recorded and 27 observations falls in range of 45 to 55 db(a) and 6 times, sound level ranges more than 75 db(a). 9% of the time sound level is 59 db(a) whereas at night time 57 db(a). At RGKAUR, sound level ranges from 61 to 7 db(a) during day time and 57 to 68 db(a) during night time. 1% of exceedance of prescribed standard was observed during day time and also 1% exceedance was observed during night time. 9% of the time sound level of 63 db(a) was observed during day time and subsequently 58 db(a) at night time. 365 observations were made during the year 17. During day time, 287 times - sound level ranges between 55 to 65 db(a) and 77 times, sound level fall in range of 65 to 75 db(a). No sound level exceeded the 75 db(a). During night time, zero observations were fall in the range of 45 to 55 db(a), 357 observations were made in the range of 55 to 65 db(a). 54
59 At SSKM Hospital, sound level ranges from 61 to 75 db(a) during day time and 55 to 72 db(a) during night time. 1% of exceedance of prescribed standard was observed during day time and also 1% exceedance was observed during night time. 9% of the time sound level of 63 db(a) was observed during day time and subsequently 57 db(a) at night time. 3 during day time and 365 observations during night time were made for the year 17. During day time, 117 times - sound level ranges between 55 to 65 db(a) and 241 times, sound level fall in range of 65 to 75 db(a). One time sound level exceeded the 75 db(a). During night time, 1 observations fall in the range of 45 to 55 db(a), 35 observations were made in the range of 55 to 65 db(a). Noise Monitoring station installed at TARATALA have 364 observations during day time and night time. Sound level ranges between 59 to 73 db(a) during day time and 57 to 7 db(a) during night time. There is no exceedance of prescribed standard was observed during day time and also during night time. 9% of the time, 62 db(a) of sound level observed during day time whereas db(a) observed during night time. Sound level ranges between 55 to 65 db(a) for 212 observations during day time whereas sound level ranges between 55 to 65 db(a) for 345 observations during night time. 365 observations were recorded at TOLLY GUNJ Noise monitoring station during day and night time. Sound level ranges between 64 to 69 db(a) during day time and 61 to 67 db(a) at night time. During day time 99% of exceedance of prescribed norms was observed whereas 1% of exceedance was observed during night time. 3 observations fall in the range of 55 to 65 db(a) at day time whereas 348 observations recorded in range of 55 to 65 db(a) at night time. There is no sound level exceeded 75 db(a) at day time and also during night time. 1.2 ANALYSIS OF AMBIENT NOISE MONITORING ON MONTHLY BASIS Sound level data of 1 stations of Kolkata is analysed on monthly basis. The data is averaged on monthly basis both for day and night time for the year 17 and mentioned in Table 39 and. Graph showing monthly trend for 1 stations is shown in Figure 11 to 11. Table 39: Monthly Avg. Sound level of first 5 stations of Kolkata Stations SSKM Hospital Gole Park Head Quarters Patauli New Market Month January February March April May June July August September October November December Table : Monthly Avg. Sound level of remaining 5 stations of Kolkata 55


60 Stations Birati Neelanchal R G Kar Hospital Tollygunj Bag Bazaar Month D January February March April May June July August September October November December Taratala Leq Values in db(a) 1 8 Leq Values in db(a) 1 8 Leq Values in db(a) Month Figure 11: Monthly trend of SSKM Hospital Garden station Month Figure 12: Monthly trend of Gole Park station Leq Values in db(a)8 Month Figure 13: Monthly trend of Head Quarter station Month Figure 14: Monthly trend of Patauli station 56
61 Leq Values in db(a) Leq Values in db(a) Month Month Figure 15: Monthly trend of New Market station Figure 16: Monthly trend of Birati Neelanchal Station Leq Values in db(a) Leq Values in db(a) Month Month Figure 17: Monthly trend of R G Kar Hospital Figure 18: Monthly trend of Bag Bazaar station station Leq Values in db(a) Leq Values in db(a) Month Figure 19: Monthly trend of Taratala Month Figure 11: Monthly trend of Tollygunj station Close examination to above data and graph reveals following observations: At SSKM Hospital, sound level varies between 64 to 82 db(a) for day time whereas 65 to 82 db(a) for night time. Sound level ranges between 71 to 86 db(a) for day time at Gole Park whereas sound level varies from 71 to 82 db(a) during night time. 57
62 At Kolkata HQ, range of sound level recorded for day time is 59 to 71 db(a) and 55 to 72 db(a). At Patauli, maximum sound level observed was 73 db(a) and minimum sound level recorded to 64 db(a) for day time whereas sound level ranges between 56 to 64 db(a) for night time. At New Market, sound level was recorded 62 to 64 db(a) for day time whereas 56 to 58 db(a) for night time. At Birati Neelanchal, sound level varies between 61 to 68 db(a) for day time whereas 51 to 64 db(a) for night time. Sound level ranges between 63 to 66 db(a) for day time at R G Kar Hospital whereas sound level varies from 57 to 63 db(a) during night time. At Taratala, Sound level roam around 64 db(a) for day time whereas 61 db(a) during night time. Range of sound level recorded for day time is 63 to 68 db(a) and to 64 db(a) for the night time. At Bag Bazar, maximum sound level observed was 76 db(a) and minimum sound level recorded to 74 db(a) for day time whereas sound level ranges between 68 to 71 db(a) for night time. At Tollygunj, sound level was recorded 66 to 68 db(a) for day time whereas 62 to 64 db(a) for night time. 1.3 ANALYSIS OF AMBIENT NOISE MONITORING ON YEARLY BASIS Sound level data of 1 stations of Kolkata is analyzed on yearly basis. The data for the year 17 is averaged on yearly basis both for day and night time and mentioned in Table 41. Graph showing yearly trend for 1 stations is shown in Figure-111. Table 41: Yearly Avg. Sound level of 1 stations of Kolkata STATION Leq. db(a) Leq. db(a) 24(hrs.) Leq. db(a) SSKM Hospital(S) Gole Park(I) Head Quarter Patauli(R) New Market Birati N.(R) RG Kar (S) Tollygunge Bag Bazar(R) Tartala(I)
63 Leq Values in db(a) Kolkata Leq. db(a) Leq. db(a) 24 (hrs.) Leq. db(a) Stations Figure 111: Yearly trend of Kolkata s noise monitoring stations Close examination of Noise Data reveals that sound level at Kolkata ranges between 63 db(a) at Head Quarter to 78 db(a) at New Market during day time whereas sound level ranges between 57 db(a) at Head Quarter to 78 db(a) at New Market during night time. 59

64 11. AMBIENT NOISE MONITORING OF LUCKNOW Lucknow the capital of Uttar Pradesh is located at N, E and lies in Northern India. It stands on the northwestern shore of the Gomti River. It is the 8th most populated city of India and the largest in Uttar Pradesh. The city stands at an elevation of approximately 123 meters (4 ft.) above sea level and covers an area of 2,528 square kilometers (976 sq. mi). In Lucknow, 1 monitoring stations are installed and details are depicted in Table-42 and Figure Table 42: Monitoring locations of Lucknow Sl. Station location Category Latitude Longitude No. 1. Talkatora (I) Industrial Zone 26º5' 2.44'' N 8º53' 3.25'' E 2. Hajrat Gunj Commercial Zone 26º51'.66'' N 8º56' 51.59'' E 3. PGI (S) Silence Zone 26º45' 17.68'' N 8º55' 59.53'' E 4. Indira Nagar (R) Residential Zone 26º53' 25.8'' N 8º59' 57.29'' E 5. Gomti Nagar (S) Silence Zone 26º52' 58.2'' N 8º59' 58.2'' E 6. Chinhat Industrial Zone 26º54' 17.9'' N 81º3' 13.8'' E 7. Vibhuti Khand Residential Zone 26º52' 6.75'' N 81º' 12.54'' E 8. IT College Silence Zone 26º52' 22.47'' N 8º56' 3.28'' E 9. CCS Airport CommercialZone 26º45' 55.41'' N 8º53' 1.91'' E 1. Aligunj CommercialZone 26º53' 21.89'' N 8º56' 24.43'' E Figure 112: Map shows the monitoring locations of Lucknow 61
65 11.1 ANALYSIS OF AMBIENT NOISE MONITORING ON DAILY BASIS As stated earlier, Real time Ambient Noise Monitoring of Lucknow has been carried out at 1 locations. The Sound level data of said data is processed for daily basis and the data is compared with Ambient Air Quality Standards in Respect of Noise is notified under Noise Pollution (Regulation and Control) Rules,. The Sound Level Data on daily basis for the year 17 is mentioned Table 6 of Annexure-I. Statistical discussion of sound level data for the year 17 is presented in Table 43 and 44.Graphical representation of each station for the year 17 is shown in Figure 113 to 122. Table 43: Statistical behavior of sound level data of first 5 stations for the year 17 Aligunj CCS Airport Chinhat (I) Gomti Nagar(S) Hajrat Ganj Standard No of Exceedances No of Observations Percentage of Exceedance Max Min Median L L L Table 44: Statistical behavior of sound level data of remaining 5 stations for the year 17 Indira Nagar IT College P.G.I. Talkatora Vibhuti Khand Standard No of Exceedances No of Observations Percentage of Exceedances Max Min Median L L L Table 45: Frequency analysis of sound level data for the year 17 Frequency of Sound level data Aliganj CCS Airport( C ) Chinhat (I) Gomti Nagar(S) Hazrat Ganj (C ) <
66 Frequency of Sound level data Aliganj CCS Airport( C ) Chinhat (I) Gomti Nagar(S) Hazrat Ganj (C ) > Table 46: Frequency analysis of sound level data for the year 17 Frequency of Sound level Indira Nagar IT College ( S ) P.G.I. Talkatora ( I ) Vibhuti Khand data < >75 1 Leq Values in db(a) Leq Values Figure 113: time and time variation of Hajrat Gunj Leq Values in db(a) Figure 114: time and time variation of PGI Leq Values in db(a) Figure 115: time and time variation of Indira Nagar Figure 116: time and time variation of Aligunj 63
67 Leq values in db(a) s Figure117: time and time variation of Gomti Nagar Leq Values in db(a) Leq Values in db(a) Figure118: time and time variation of CCS Airport Leq Values in db(a) Figure 119: time and time variation of IT College Figure 1: time and time variation of Chinhat Leq Values in db(a) Leq Values in db(a) Figure 121: time and time variation of Vibhuti Khand Figure 122: time and time variation of Talkatora Based on above facts and statistical values, following observations are made: Out of 1 stations, 3 stations (at Gomti Nagar, IT College and PGI) are installed at silence zone, 3 stations (Hazrat gunj, CCS Airport and Aligunj) are installed at Commercial Zone, 2 stations (Talkatora and Chinhat) are installed at Industrial Zone and remaining 2 stations ( Indira Nagar and Vibhuti Khand) are installed at Residential Zone. 64
68 At Aligunj, sound level ranges from 73 to 78 db(a) during day time and 65 to 7 db(a) during night time. 1% of exceedance of prescribed standard was observed during day time and also 1% exceedance was observed during night time. 9% of the time sound level of 75 db(a) was observed during day time and subsequently 67 db(a) at night time. 364 observations were made during the year 17. During day time, 29 times - sound level ranges between 65 to 75 db(a) and there is no sound level fall in range of 55 to 65 db(a). 334 times, sound level exceeded the 75 db(a). During night time, 1 observation fall in the range of 55 to 65 db(a), 362 observations made in the range of 65 to 75 db(a). There was no sound level exceeded the 75 db(a) during night time. Noise Monitoring station installed at CCS Airport have 365 observations during day time and night time. Sound level ranges between 56 to 7 db(a) during day time and 51 to 68 db(a) during night time. 11% exceedance of prescribed standard was observed during day time whereas 95% exceedance was observed during night time. Sound level ranges between 55 to 65 db(a) for 325 observations during day time whereas sound level falls between 65 to 75 db(a) for 39 observations. During night time, 345 times, sound level ranges between 55 to 65 db(a) and the 16 sound level falls between 45 to 55 db(a). Zero time, sound level exceeded the 75 db(a) at day time and night time also. 365 observations were recorded at Chinhat Noise monitoring station during day time and night time. Sound level ranges between 52 to 74 db(a) during day time and 44 to 65 db(a) at night time. During day time % of exceedance of prescribed norms was observed and also % of exceedance was observed during night time. 6 observations were fall in the range of 45 to 55 db(a) at day time whereas 155 observations were recorded in the range of 45 to 55 db(a) during night time. 363 observations were made at Gomti Nagar noise monitoring station at day time and also night time. During day time and night time, 1% of exceedance of prescribed standard was observed. 235 observations were recorded in the range of 65 to 75 db(a) during day time whereas 361 observations were made in range of db(a) at night time. times sound level exceeded the 75 db (A) at day time and in the night. Noise Monitoring station installed at Hajrat Ganj have 365 observations during day time and night time. Sound level ranges between 54 to 79 db(a) during day time and 51 to 78 db(a) during night time. 79% exceedance of prescribed standard was observed during day time whereas 96% exceedance was observed during night time. Sound level ranges between 55 to 65 db(a) for 75 observations during day time whereas sound level falls between 65 to 75 db(a) for 169 observations. During night time, 86 times, sound level ranges between 55 to 65 db(a) and there is 13 sound level falls between 45 to 55 db(a). 118 times, sound level exceeded the 75 db(a) at day time. At Indira Nagar station, 88% exceedance was observed during day and 95% exceedance was observed during night time. Out of 365 observations, 42 observations recorded in the range of 45 to 55 db(a) during day time. During night time, 334 observations were recorded in the range of 45 to 55 db (A). 9% of the time sound level is 55 db(a) during day time whereas at night time 47 db(a). At IT College station, 1% exceedance was observed during day and also 1% exceedance was observed during night time. Out of 365 observations, only one observation recorded in the range of 45 to 55 db(a) during day time. During night time, no observations were recorded in the range of 45 to 55 db(a). 9% of the time sound level is 63 db(a) during day time whereas at night time 58 db(a). 65
69 362 observations were recorded at PGI s Noise monitoring station during day time and 364 observations were made during night time. Sound level ranges between 55 to 67 db(a) during day time and 48 to 66 db(a) at night time. During day time 1% exceedance of prescribed norms was observed and also 1% of exceedance was observed during night time. 2 observations are falls in the range of 45 to 55 db(a) at day time whereas 213 observations recorded in the range of 45 to 55 db(a) during night time. At Talkatora, sound level ranges from 59 to 74 db(a) during day time and 51 to 67 db(a) during night time. % exceedance of prescribed standard was observed during day time and night time. 9% of the time sound level of 63 db(a) was observed during day time and subsequently 56 db(a) at night time. 364 observations were made at day time and 358 observations were made at night time for the year 17. During day time, 2 times - sound level ranges between 65 to 75 db(a) and 13 times, sound level fall in range of 55 to 65 db(a). 1 time, had sound level exceeded the 75 db(a). During night time, 336 observations fall in the range of 55 to 65 db(a), 8 observations made in the range of 65 to 75 db(a). No sound level exceeded the 75 db(a) during night time. Noise Monitoring station installed at Vibhuti Khand have 359 observations during day time and 363 observations during night time. Sound level ranges between 61 to 7 db(a) during day time and 53 to 67 db(a) during night time. 1% exceedance of prescribed standard was observed during day time and also 1% exceedance was observed during night time. Sound level ranges between 55 to 65 db(a) for 245 observations during day time whereas sound level falls between 65 to 75 db(a) for 113 observations. During night time, 348 times, sound level ranges between 55 to 65 db(a) and the 8 sound levels falls between 45 to 55 db(a) ANALYSIS OF AMBIENT NOISE MONITORING ON MONTHLY BASIS Sound level data of 1 stations of Lucknow is analysed on monthly basis. The data is averaged on monthly basis both for day and night time for the year 17 and mentioned in Table 47 and 48. Graph showing monthly trend for 1 stations is shown in Figure 123 to 132. Table 47: Monthly Avg. Sound level of first 5 stations of Lucknow Stations Talkatora Hazrat Ganj PGI Hospital Indira Nagar Gomti Nagar Month January February March April May June July August September October November December Table 48: Monthly Avg. Sound level of remaining 5 stations of Lucknow Stations Chinhat IT College RSC Aliganj UPPCB HQ CCS Airport Month 66

70 Stations Chinhat IT College RSC Aliganj UPPCB HQ CCS Airport January February March April May June July August September October November December Leq Values in db(a) Leq Values in db(a) 8 Leq Values in db(a) Months Figure 123: Monthly trend of Talkatora station 8 Months Figure 124: Monthly trend of Hajrat Ganj station Months Figure 125: Monthly trend of P.G.I. station Months Figure 126: Monthly trend of Indira Nagar station 67
 8 7 5 3 1 Month Figure 13: Monthly trend of RSC Aligunj station Leq Values in db(a) 7 65 55 5 Month Figure 131: Monthly trend of")
 for day time whereas 58 to 68 db(a) for night time. Sound level ranges between to 76 db(a) for day time at Hazrat Ganj whereas sound level varies from 58 to 75 db(a) during night time.")
71 8 Leq Values in db(a) Months Figure 127: Monthly trend of Gomti Nagar station 8 Leq Values in db(a) Months Figure 128: Monthly trend of Chinhat station 8 Leq Values in db(a) Months Figure 129: Monthly trend of IT College station Leq Values in db(a) Month Figure 13: Monthly trend of RSC Aligunj station Leq Values in db(a) Month Figure 131: Monthly trend of UPPCB HQ station Month Figure 132: Monthly trend of CCS Airport station Close examination to above data and graph reveals following observations: At Talkatora, sound level varies between 63 to 69 db(a) for day time whereas 58 to 68 db(a) for night time. Sound level ranges between to 76 db(a) for day time at Hazrat Ganj whereas sound level varies from 58 to 75 db(a) during night time. At PGI, Sound level ranges between 59 to 7 db(a) for day time and 53 to 66 db(a) for night time. 68
72 At Indira Nagar, maximum sound level observed was db(a) and minimum sound level recorded to 56 db(a) for day time whereas sound level ranges between 46 to 53 db(a) for night time. At Gomti Nagar, sound level was recorded 65 to 69 db(a) for day time whereas 56 to 61 db(a) for night time. At Chinhat, sound level varies between to 69 db(a) for day time whereas 53 to 59 db(a) for night time. Sound level ranges between 64 to 75 db(a) for day time at IT College whereas sound level varies from 56 to 7 db(a) during night time. At RSC Aliganj, Sound level roam around 76 db(a) for day time whereas 67 db(a) during night time. Range of sound level recorded for day time is 75 to 76 db(a) and 66 to 68 db(a). At UPPCB HQ, maximum sound level observed was 71 db(a) and minimum sound level recorded to 64 db(a) for day time whereas sound level ranges between 56 to 63 db(a) for night time. At CCS Airport, sound level was recorded 63 to 66 db(a) for day time whereas 57 to 63 db(a) for night time ANALYSIS OF AMBIENT NOISE MONITORING ON YEARLY BASIS Sound level data of 1 stations of Lucknow is analyzed on yearly basis. The data for the year 17 is averaged on yearly basis both for day and night time and mentioned in Table 49. Graph showing yearly trend for 1 stations is shown in Figure 133. Table 49: Yearly Avg. Sound level of 1 stations of Lucknow STATION Leq. db(a) Leq. db(a) 24(hrs.) Leq. db(a) Talkatora(I) Hazrat Gunj P.G.I.(S) Indira Nagar(R) Gomti Nagar(S) Chinhat(I) IT College(S) CSS Airport RSC Aliganj Vibhuti Khand(R)
73 Leq Values in db(a) Lucknow Leq. db(a) Leq. db(a) 24 (hrs.) Leq. db(a) Stations Figure 133: Yearly trend of Lucknow s noise monitoring stations Close examination of Noise Data reveals that sound level at Lucknow ranges between 51 db(a) at Indira Nagar (R) to 69 db(a) at Hazratgunj during night time whereas sound level ranges between 57 db(a) at Indira Nagar(R) to 76 db(a) at CSS Airport during day time. 7

74 12. AMBIENT NOISE MONITORING OF MUMBAI Mumbai, the capital of Maharashtra, is located at N, E, and lies in west coast of India and has a deep natural harbor. Mumbai is spread over an area of 3.4 sq. kilometers. In Mumbai, 1 monitoring stations are installed and details are depicted in Table 5 and Figure 134. Table 5: Monitoring locations of Mumbai Sl. Station location Category Latitude Longitude No. 1. Thane Commercial Zone 19º' 57.38'' N 72º51' 29.24'' E 2. Vashi Hospital Silence Zone 19º4' 45.49'' N 73º'.12'' E 3. Acworth Hospital Silence Zone 19º1' 15.83'' N 72º51' 33.24'' E 4. Bandra Commercial Zone 19º3'.77'' N 72º49' 49.41'' E 5. MPCB Head Quarter Commercial Zone 19º6' 42.73'' N 73º' 43.8'' E 6. M&M Kandivali Industrial Zone 19º12' 3.87'' N 72º52' 12.14'' E 7. Ambassador Hotel Commercial Zone 18º56'.67'' N 72º49' 29.61'' E 8. L&T Powai Industrial Zone 19º7' 18.31'' N 72º53' 34.27'' E 9. Pepsico Chembur Residential Zone 19º2' 52.89'' N 72º54' 37.12'' E 1. Bisleri Andheri Industrial Zone 19º6' 44.49'' N 72º51'.71'' E Figure 134: Map shows the monitoring locations of Mumbai 12.1 ANALYSIS OF AMBIENT NOISE MONITORING ON DAILY BASIS As stated earlier, Real time Ambient Noise Monitoring of Mumbai has been carried out at 1 locations. The Sound level data of said data is processed for daily basis and the data is compared with Ambient Air Quality Standards in Respect of Noise is notified under Noise Pollution (Regulation and Control) Rules,. The Sound Level Data on daily basis for the year 17 is mentioned in Table 7 of Annexure-I. Statistical discussion of sound level data for the year 17 is presented in Table 51 and 52. Graphical representation of each station for the year 16 is shown in Figure 135 to
75 Table 51: Statistical behavior of sound level data of first 5 stations for the year 17 Acworth Hospital (S) Ambassador Hotel Bisleri Andheri (I) Bandra MPCB HQ Standard No of Exceedances No of Observations Percentage of Exceedance Max Min Median L L L Table 52: Statistical behavior of sound level data of remaining 5 stations for the year 17 LT Powai (I) MM Kandivali (I) Pepsico Chembur (R) Thane TMCO Vashi Hospital (S) Standard No of Exceedances No of Observations Percentage of Exceedances Max Min Median L L L Table 53: Frequency analysis of sound level data for the year 17 Frequency of Acworth Ambassador Bisleri Bandra MPCB HQ Sound level Hospital (S) Hotel Andheri (I) data < > Table 54: Frequency analysis of sound level data for the year 17 72
76 Frequency of LT Powai (I) MM Pepsico Thane Vashi Sound level Kandivali (I) Chembur (R) TMCO Hospital (S) data <45 Leq Values in db(a) > Figure 135: time and time variation of Acworth Hospital Leq Values in db(a) Figure 137: time and time variation of Bisleri Andheri Leq Values in db(a) Figure 136: time and time variation of Ambassador Figure 138: time and time variation of Bandra Figure 139: time and time variation of MPCB HQ Figure 1: time and time variation of LT Powai Leq Values in db(a) Leq Values in db(a) Leq Values in db(a)
77 Leq Values in db(a) Figure 141: time and time variation of MM Kandivali Leq Values in db(a) Figure 143: time and time variation of Thane Based on above facts and statistical values, following observations are made: Figure 142: time and time variation of Pepsico Chembur Figure 144: time and time variation of Vashi Hospital Out of 1 stations, 2 stations (at Acworth and Vashi hospital) are installed at silence zone, 3 stations (at Bisleri Andheri, LT Powai and MM Kandivali) are installed at Industrial zone, 4 stations are installed at commercial zone (at Ambassador Hotel, Bandra, MPCB HQ and Thane [TMCO]) and remaining 1 station (Pepsico Chembur) is installed at Residential Zone. 356 observations were recorded at Acworth hospital Noise monitoring station during day time and 353 observations were made during night time. Sound level ranges between 67 to 79 db(a) during day time and 67 to 78 db(a) at night time. During day time 1% of exceedance of prescribed norms was observed whereas 1% of exceedance was observed during night time also. 33 observations fall in the range of 65 to 75 db(a) at day time whereas observations recorded in range of 55 to 65 db(a). At Ambassador Hotel station, 1% exceedance was observed during day and night time. Out of 362 observations, 357 observations were recorded in the range of 65 to 75 db(a) and 5 observations were more than 75 db(a) during day time. During night time, 363 observations were recorded and 347 observations falls in range of 65 to 75 db(a) and no observations above the 75 db(a). 9% of the time sound level is 73 db(a) whereas at night time 69 db(a). Noise Monitoring station installed at Bisleri Andheri have 363 observations during day time and 361 observations during night time. Sound level ranges between 65 to77 db(a) during day time and 61 to 74 db(a) during night time. 4% exceedance of prescribed standard was observed during day time whereas 6% exceedance was observed during night time. 9% of the time, 74 db(a) of sound level observed during day time whereas 69 db(a) observed Leq Values in db(a) Leq Values in db(a)
78 during night time. Sound level ranges between 65 to 75 db(a) for 348 observations during day time whereas sound level falls between 55 to 65 db(a) for 2 observations. At Bandra station, 94% exceedance was observed during day whereas 1% exceedance was observed during night time. Out of 362 observations, 332 observations were recorded in range of 65 to 75 db(a) and 8 observations were more than 75 db(a) during day time. During night time, 362 observations were recorded and 336 observations falls in range of 65 to 75 db(a) and no observations were above the 75 db(a). 9% of the time sound level is 73 db(a) whereas at night time 73 db(a). 35 observations were made at MPCB HQ noise monitoring station at day time and 351 observations were made at night time. During day time, 61% of exceedance of was prescribed standard was observed whereas 1% of exceedance observed during night time. 213 observations were recorded in the range of 65 to 75 db(a) during day time whereas 136 observations were made in the range of db(a) at night time. No sound level exceeded the 75 db(a) at day and night time. Noise Monitoring station installed at LT Powai have 365 observations during day time and 365 observations during night time also. Sound level ranges between 52 to 67 db(a) during day time and 48 to 66 db(a) during night time. There is no exceedance of prescribed standard was observed during day time and also during night time. 9% of the time, 61 db(a) of sound level observed during day time whereas 58 db(a) observed during night time. Sound level ranges between 65 to 75 db(a) for 1 observations during day time whereas sound level falls between 55 to 65 db(a) for 341 observations. At MM Kandivali station, % of exceedance was observed during day and night time also. Out of 364 observations, 48 observations were recorded in range of 65 to 75 db(a) and 1 observations were more than 75 db(a) during day time. During night time, 364 observations were recorded and observations falls in range of 65 to 75 db(a) and 5 observations above the 75 db(a). 9% of the time sound level is 66 db(a) whereas at night time 66 db(a). 3 observations were made at Pepsico Chembur noise monitoring station at day time and also 365 observations were made at night time. During day time, 99% of exceedance of prescribed standard was observed whereas 1% of exceedance was observed during night time. 129 observations were recorded in the range of 65 to 75 db(a) during day time whereas 318 observations were made in range the of db(a) at night time. No sound level exceeded the 75 db(a) at day time and night time. At Thane (TMCO), sound level ranges from 52 to 67 db(a) during day time and 52 to 65 db(a) during night time. 7% of exceedance of prescribed standard was observed during day time whereas 5% exceedance was observed during night time. 9% of the time, sound level of 65 db(a) was observed during day time and subsequently 64 db(a) at night time. 365 observations were made at day time and 365 observations were made at night time during the year 17. During day time, 173 times - sound level ranges between 55 to 65 db(a) and 25 times, sound level fall in range of 65 to 75 db(a) there is no sound level exceeded the 75 db(a). During night time, 183 observations fall in the range of 45 to 55 db(a), 182 observations were made in the range of 55 to 65 db(a). Noise Monitoring station installed at Vashi Hospital (Vhsp) have 361 observations during day time and 284 observations during night time. Sound level ranges between 63 to 78 db(a) during day time and 58 to 79 db(a) during night time. 1% exceedance of prescribed standard was observed during day time and also at night time. 9% of the time, 74 db(a) of sound level observed during day time whereas 71 db(a) observed during night time. Sound 75
79 level ranges between 65 to 75 db(a) for 348 observations during day time whereas 1 sound level falls between 55 to 65 db(a) ANALYSIS OF AMBIENT NOISE MONITORING ON MONTHLY BASIS Sound level data of 1 stations of Mumbai is analysed on monthly basis. The data is averaged on monthly basis both for day and night time for the year 17 and mentioned in Table 55 and 56. Graph showing monthly trend for 1 stations is shown in Figure 145 to 154. Table 55: Monthly Avg. Sound level of first 5 stations of Mumbai Stations Thane Vashi Hospital Acworth Hospital Bandra MPCB HQ Month January February March April May June July August September October November December Table 56: Monthly Avg. Sound level of remaining 5 stations of Mumbai Stations Kandivali Powai Chembur Andheri CST Month January February March April May June July August September October November December
 8 Months Figure 149: Monthly trend of MPCB, Head Quarter station Figure")
80 Leq Values in db(a) Leq Values in db(a) Months Figure 145: Monthly trend of Thane station Months Figure146: Monthly trend of Vashi Hospital station Leq Values in db(a) 8 8 Months Figure 147: Monthly trend of Ashp station Figure 148: Monthly trend of Bandra station Leq Values in db(a) 8 Months Figure 149: Monthly trend of MPCB, Head Quarter station Figure 15: Monthly trend of Kandivalistation 77

81 65 7 Leq Values in db(a) Leq Values in db(a) Months Figure 151: Monthly trend of Powai station Months Figure 152: Monthly trend of Chembur station Figure 153: Monthly trend of Andheri station Figure 154: Monthly trend of CST station Close examination to above data and graph reveals following observations: At Thane, sound level varies between 71 to 78 db(a) for day time whereas 71 to 79 db (A) for night time. Sound level ranges between 67 to 73 db(a) for day time at Vashi hospital whereas sound level varies from 67 to 72 db(a) during night time. At Acworth Hospital, Sound level varies between 62 to71 db(a) for day time whereas 55 to 69 db(a) during night time. At Bandra, maximum sound level observed was 65 db(a) and minimum sound level recorded to 54 db(a) for day time whereas sound level ranges between 53 to 64 db(a) for night time. At MPCB HQ, sound level was recorded 68 to 85 db(a) for day time whereas 58 to 93 db(a) for night time. Sound level ranges between to 68 db(a) for day time at Kandivali whereas sound level varies from 52 to 67 db(a) during night time. At Powai, Sound level roam around db(a) for day time whereas 55 db(a) during night time. Range of sound level recorded for day time is 56 to 61 db(a) and night time is 51 to db(a). At Chembur, sound level was recorded 61 to 66 db(a) for day time whereas 55 to 66 db(a) for night time. Sound level ranges between 69 to 74 db(a) for day time at Andheri whereas sound level varies from 65 to 71 db(a) during night time. 78
STATUS OF AMBIENT NOISE LEVEL IN INDIA 2016
 NATIONAL AMBIENT NOISE MONITORING NETWORK: NANMN/4/16 STATUS OF AMBIENT NOISE LEVEL IN INDIA 16 CENTRAL POLLUTION CONTROL BOARD PARIVESH BHAWAN, EAST ARJUN NAGAR, DELHI 1132 ACKNOWLEDGEMENT Supervision
Effect of odd-even vehicular restrictions on ambient noise levels at ten sites in Delhi city
 Indian Journal of Pure & Applied Physics Vol. 55, September 2017, pp. 687-692 Effect of odd-even vehicular restrictions on ambient noise levels at ten sites in Delhi city N Garg a *, A K Sinha b, V Gandhi
Assessment of Air Quality during the Odd-Even Scheme of Vehicles in Delhi
 Indian Journal of Science and Technology, Vol 9(48), DOI: 10.17485/ijst/2016/v9i48/105801, December 2016 ISSN (Print) : 0974-6846 ISSN (Online) : 0974-5645 Assessment of Air Quality during the Odd-Even
Report on Ambient Air Quality during ODD and EVEN Period, 15
 Report on Ambient Air Quality Data during ODD and EVEN Period, 15 th to 30 th April, 2016 [ In compliance to the order of Hon ble NGT, Principle Bench, New Delhi in Original Application No. 179 of 2016,
Press Release. Deepawali Monitoring Report: Monitoring of Ambient Air & Noise Monitoring conducted
 Press Release Deepawali Monitoring Report: 2017 Monitoring of Ambient Air & Noise Monitoring conducted क न द र य प रद षण न य त रण ब र ड पर य वरण, वन एव जलवयर पररवर न म त रयलर, भयरर सरकयर CENTRAL POLLUTION
Ambient PM 10 Monitoring Sechelt, B.C Update
 Ministry of Environment LOWER MAINLAND REGION Ambient PM 10 Monitoring Sechelt, B.C. 2004-2005 Update E N V I R O N M E N T A L Q U A L I T Y Library and Archives Canada Cataloguing in Publication Data
inter.noise 2000 The 29th International Congress and Exhibition on Noise Control Engineering August 2000, Nice, FRANCE
 Copyright SFA - InterNoise 2000 1 inter.noise 2000 The 29th International Congress Exhibition on Noise Control Engineering 27-30 August 2000, Nice, FRANCE I-INCE Classification: 0.2 ITALIAN LEGISLATION
Inventory Of GHGs And Other Urban Pollutants From Transport Sector In Delhi And Calcutta
 Proceedings of IGES/APN Mega-City Project 23-25 January 22 (Rihga Royal Hotel Kokura, Kitakyushu Japan) 22 Institute for Global Environmental Strategies All rights reserved. Inventory Of GHGs And Other
Delhi-NCR. Ambient Air Quality Data of AIR LABORATORY. For the Month of November, 2017
 Ambient Air Quality Data of Delhi-NCR For the Month of November, 2017 AIR LABORATORY क न द र य प रद षण न य त रण ब र ड पययडवरण, व एव जलवयय पररवर ड म त रयलय, भयरर सरकयर CENTRAL POLLUTION CONTROL BOARD Website:
NOISE LOCAL LAW FOR VILLAGE OF ROUND LAKE
 NOISE LOCAL LAW FOR VILLAGE OF ROUND LAKE 130-1. Declaration of policy. It is hereby declared to be the public policy of the Village to reduce the ambient noise level in the Village so as to preserve,
PROPOSED HELICOPTER LANDING PAD 85 MILL ROAD LARA
 PROPOSED HELICOPTER LANDING PAD 85 MILL ROAD LARA Assessment of Helicopter Noise A report Prepared on behalf of: JamCo Constructions Pty Ltd PO Box 631 Yarraville Victoria 3013 Ref: 11573-3jg March 2015
Chapter NOISE CONTROL Sections: FOOTNOTE(S): --- (8) --- Prior ordinance history: Ord. 440.
: --- (8) --- Prior ordinance history: Ord. 440.") Chapter 7.34 - NOISE CONTROL Sections: FOOTNOTE(S): --- (8) --- 7.3020 - De nitions. A. The following words, terms and phrases, when used in this chapter, shall have the meanings ascribed to them in this
Chapter 7.34 - NOISE CONTROL Sections: FOOTNOTE(S): --- (8) --- 7.3020 - De nitions. A. The following words, terms and phrases, when used in this chapter, shall have the meanings ascribed to them in this
Mysuru PBS Presentation on Prepared by: Directorate of Urban Land Transport
 Mysuru PBS Presentation on 04.11.2017 Prepared by: Directorate of Urban Land Transport Introduction to Mysuru Public Bicycle Sharing System Mysuru Public Bicycle Sharing System Bicycle based transportation
CHAPTER 20 MOTOR VEHICLES
 CHAPTER 20 MOTOR VEHICLES 20.1 In India the first car ran on roads in 1897. Prior to independence in the 1940s India had no automobile industry to speak of. Cars were brought into the country in a knocked
Ambient Air Quality Data of. Delhi-NCR. For the Month of December, 2017 AIR LABORATORY
 Ambient Air Quality Data of Delhi-NCR For the Month of December, 2017 AIR LABORATORY क न द र य प रद षण न य त रण ब र ड पययडवरण, व एव जलवयय पररवर ड म त रयलय, भयरर सरकयर CENTRAL POLLUTION CONTROL BOARD Website:
ORDINANCE CONCERNING NOISE LEVELS IN UNINCORPORATED LARIMER COUNTY. Ordinance No
 ORDINANCE CONCERNING NOISE LEVELS IN UNINCORPORATED LARIMER COUNTY Ordinance No. 97-03 BE IT ORDAINED by the Board of County Commissioners of Larimer County: Section 1. Purpose: The Board of County Commissioners
Evaluating Stakeholder Engagement
 Evaluating Stakeholder Engagement Peace River October 17, 2014 Stakeholder Engagement: The Panel recognizes that although significant stakeholder engagement initiatives have occurred, these efforts were
Paper No. 150 VALIDATING STATED PARKING DURATION OF DRIVERS IN KOTA CITY, INDIA
 Paper No. 150 VALIDATING STATED PARKING DURATION OF DRIVERS IN KOTA CITY, INDIA Dr. Rajat Rastogi Assistant Professor, Indian Institute of Technology Roorkee Roorkee 247 667, Uttarakhand, India Email:
CHAPTER 40A NOISE CONTROL
 40A.01 Purpose 40A.05 Noise Disturbance Prohibited 40A.02 Definitions 40A.06 Vehicle Noise 40A.03 Measurement of Noise and Sound 40A.07 Permits 40A.04 Test Measurement and Requirements for 40A.08 Exemptions
1 [94. NOISE LIMIT FOR GENERATOR SETS RUN WITH DIESEL
 [94. NOISE LIMIT FOR GENERATOR SETS RUN WITH DIESEL. Noise limit for diesel generator sets (upto 000 KVA) manufactured on or after the [ st January, 005]. The maximum permissible sound pressure level for
Plug-in Electric Vehicles
 Plug-in Electric Vehicles Florida Public Service Commission Staff - PEV Workshop September 6, 2012 FPL s experience with Plug-in Electric Vehicles (PEVs) is extensive, and we operate one of the largest
Delhi-NCR. Ambient Air Quality Data of AIR LABORATORY. For the Month of November, 2017
 Ambient Air Quality Data of Delhi-NCR For the Month of November, 2017 AIR LABORATORY क न द र य प रद षण नय त रण ब डर पय र वरण, वन एव जलव य प रवतर न म त र लय, भ रत सरक र CENTRAL POLLUTION CONTROL BOARD Website:
Mercedes-Benz takes road safety awareness campaign to Kerala
 Mercedes-Benz takes road safety awareness campaign to Kerala by Autocar Pro News Desk Aug 31, 2016 Manu Saale, MD and CEO, MBRDI and Jochen Feese, Head of Accident Research, Pedestrian Protection and Sensor
THE UNIVERSITY OF HONG KONG LIBRARIES. Hong Kong Collection
 THE UNIVERSITY OF HONG KONG LIBRARIES Hong Kong Collection TECHNICAL MEMORANDUM ON NOISE FROM PERCUSSIVE PILING Environmental Protection Department Noise Control Authority This Technical Memorandum, originally
August 2018 MLS Statistical Report
 January February March April May June July August Septem October Novem Decem August 218 MLS Statistical Report Total Sales Overall, sales are down 3%; however, total volume sold is up 7% and Median Sale
Fairbanks, Alaska. A Climate Almanac
 A Climate Almanac History of Climate Observations at Fairbanks Cooperative climate observations were initiated in Fairbanks by the Rev. Hudson Stuck on September!, "#$!. Observations were made with Weather
Mr. John Aitken June 6, 2017 Page 2
 Mr. John Aitken June 6, 2017 Page 2 quarterly period of 2016. Fluctuations in noise exposure from reporting period to reporting period are to be expected due to ongoing changes in aircraft activity levels,
2016 Meteorological and Oceanographic Summary for the Bocas del Toro Research Station. Prepared by: Steven Paton
 0 2016 Meteorological and Oceanographic Summary for the Bocas del Toro Research Station Prepared by: Steven Paton 1 Introduction This is the forth of a series of yearly reports summarising the past year
ANTI-NOISE AND PUBLIC NUISANCE TUSCARORA TOWNSHIP ORDINANCE NO. 4
 ANTI-NOISE AND PUBLIC NUISANCE TUSCARORA TOWNSHIP ORDINANCE NO. 4 An ordinance to secure the public health, safety and general welfare of the residents and property owners of Tuscarora Township, Cheboygan
BEFORE THE CANTERBURY REGIONAL COUNCIL. Act 1991 AND. of Plan Change 3 to the Waitaki Catchment Water Allocation Regional Plan
 BEFORE THE CANTERBURY REGIONAL COUNCIL IN THE MATTER of the Resource Management Act 1991 AND IN THE MATTER of Change 3 to the Waitaki Catchment Water Allocation Regional STATEMENT OF EVIDENCE OF DAVID
[TO BE PUBLISHED IN THE GAZETTE OF INDIA, EXTRAORDINARY, PART II, SECTION 3, SUB-SECTION (i)]
![[TO BE PUBLISHED IN THE GAZETTE OF INDIA, EXTRAORDINARY, PART II, SECTION 3, SUB-SECTION (i)]](/thumbs/77/75565318.jpg "[TO BE PUBLISHED IN THE GAZETTE OF INDIA, EXTRAORDINARY, PART II, SECTION 3, SUB-SECTION (i)]") [TO BE PUBLISHED IN THE GAZETTE OF INDIA, EXTRAORDINARY, PART II, SECTION 3, SUB-SECTION (i)] GOVERNMENT OF INDIA MINISTRY OF FINANCE (DEPARTMENT OF REVENUE) NOTIFICATION No. 4 /2015-Central Excise (N.T.)
[TO BE PUBLISHED IN THE GAZETTE OF INDIA, EXTRAORDINARY, PART II, SECTION 3, SUB-SECTION (i)] GOVERNMENT OF INDIA MINISTRY OF FINANCE (DEPARTMENT OF REVENUE) NOTIFICATION No. 4 /2015-Central Excise (N.T.)
Employees' Provident Fund Organisation, India Ministry of Labour & Employment, Government of India
 Employees' Provident Fund Organisation, India Ministry of Labour & Employment, Government of India Date 20th December, 2018 NET PAYROLL DATA EPFO PROVISIONAL ESTIMATE OF NET PAYROLL IN AGE BUCKETS AS PER
Greater Albuquerque Area Monthly Housing Trends vs. 2011
 Greater Albuquerque Area Monthly Housing Trends - 2010 vs. 2011 Class R1 (Existing Single-Family Detached) and Class R2 (Existing Condo/Townhome Attached) homes Data on this page was obtained from the
OPERATIONS NOISE STUDY FOR A PROPOSED AUTOMATIC CAR WASH IN THE SHERMAN OAKS DISTRICT OF LOS ANGELES
 OPERATIONS NOISE STUDY FOR A PROPOSED AUTOMATIC CAR WASH IN THE SHERMAN OAKS DISTRICT OF LOS ANGELES October 12, 2017 PREPARED FOR: Ms. Chantly Banayan 4822 Van Nuys Blvd. Sherman Oaks, CA 91403 PREPARED
Who has trouble reporting prior day events?
 Vol. 10, Issue 1, 2017 Who has trouble reporting prior day events? Tim Triplett 1, Rob Santos 2, Brian Tefft 3 Survey Practice 10.29115/SP-2017-0003 Jan 01, 2017 Tags: missing data, recall data, measurement
FRIDLEY CITY CODE CHAPTER 124. NOISE (Ref. 733, 834, 1075)
") FRIDLEY CITY CODE CHAPTER 124. NOISE (Ref. 733, 834, 1075) 124.01. PURPOSE The Council of the City of Fridley deems that certain levels and amounts of noise are detrimental to the health, safety and general
FRIDLEY CITY CODE CHAPTER 124. NOISE (Ref. 733, 834, 1075) 124.01. PURPOSE The Council of the City of Fridley deems that certain levels and amounts of noise are detrimental to the health, safety and general
Fish in Art, Craft and Culture
 Fish in Art, Craft and Culture Fish is not only liked on the plate but is also a much desired subject in art, craft and culture. Fish (Pisces) is one of the 12 zodiac signs. Indian mythology has several
Federal Railroad Administration, DOT CFR section Description Guideline PART 179
 Federal Railroad Administration, DOT 210.3 PENALTY ASSESSMENT GUIDELINES Continued 49 CFR section Description Guideline PART 179 179.1(e)... Tank car not constructed according to specifications also cite
Ch. 157 ESTABLISHED SOUND LEVELS CHAPTER 157. ESTABLISHED SOUND LEVELS
 Ch. 157 ESTABLISHED SOUND LEVELS 67 157.1 CHAPTER 157. ESTABLISHED SOUND LEVELS Subchap. A. GENERAL PROVISIONS... 157.1 B. NOISE LIMITS... 157.11 C. ADMINISTRATIVE PROVISIONS... 157.21 D. INSTRUMENTATION...
CHAPTER 20 MOTOR VEHICLES
 CHAPTER 20 MOTOR VEHICLES 20.1 In India the first car ran on roads in 1897. Prior to independence in the 1940s India had no automobile industry to speak of. Cars were brought into the country in a knocked
2017 Meteorological and Oceanographic Summary for the Bocas del Toro Research Station. Prepared by: Steven Paton
 0 2017 Meteorological and Oceanographic Summary for the Bocas del Toro Research Station Prepared by: Steven Paton 1 Introduction This is the 5 th of a series of yearly reports summarising the past year
2014 Meteorological and Oceanographic Summary for the Bocas del Toro Research Station. Prepared by: Steven Paton
 0 2014 Meteorological and Oceanographic Summary for the Bocas del Toro Research Station Prepared by: Steven Paton 1 Introduction This is the second of a series of yearly reports summarising the past year
MONTHLY NEW RESIDENTIAL SALES, APRIL 2017
 FOR RELEASE AT 10:00 AM EDT, TUESDAY, MAY 23, MONTHLY NEW RESIDENTIAL SALES, APRIL Release Number: CB17-80 May 23, - The U.S. Census Bureau and the U.S. Department of Housing and Urban Development jointly
1 st Quarter Summary of Meteorological and Ambient Air Quality Data Kennecott Utah Copper Monitoring Stations. Prepared for:
 1 st Quarter 2018 Summary of Meteorological and Ambient Air Quality Data Kennecott Utah Copper Monitoring Stations Prepared for: Prepared by: Mr. Bryce C. Bird Director Division of Air Quality 195 North
NOISE AND NOISE LIMITS
 CHAPTER 53 NOISE AND NOISE LIMITS 53.01 Definitions 53.03 Enforcement 53.02 Noise Prohibitions and Limited Sound Sources 53.04 Permits to Exceed Limits 53.01 DEFINITIONS. For use in this chapter, the following
Act 229 Evaluation Report
 R22-1 W21-19 W21-20 Act 229 Evaluation Report Prepared for Prepared by Table of Contents 1. Documentation Page 3 2. Executive Summary 4 2.1. Purpose 4 2.2. Evaluation Results 4 3. Background 4 4. Approach
WIM #37 was operational for the entire month of September Volume was computed using all monthly data.
 SEPTEMBER 2016 WIM Site Location WIM #37 is located on I-94 near Otsego in Wright county. The WIM is located only on the westbound (WB) side of I-94, meaning that all data mentioned in this report pertains
Regulation of Unmanned Aircraft
 Technical & General Meeting Berlin, 18-19 March 2017 EASA RMT 0230 Regulation of Unmanned Aircraft Model Flyers Perspective Dave Phipps Technical Officer for UA 1 Background to RMT 0230 Problems giving
Households Inflation Expectations Survey
 Households Inflation Expectations Today, the Reserve Bank released the results of the September 2017 round of the Inflation Expectations of Households (IESH) 1. The survey was conducted in 18 cities and
Driver-Perceived Noise Level of Agricultural Tractors - Method of Measurement
 AUTOMOTIVE INDUSTRY STANDARD Driver-Perceived Noise Level of Agricultural Tractors - Method of Measurement PRINTED BY THE AUTOMOTIVE RESEARCH ASSOCIATION OF INDIA P.B. NO. 832, PUNE 411 004 ON BEHALF OF
Ex-Ante Evaluation (for Japanese ODA Loan)
") Japanese ODA Loan Ex-Ante Evaluation (for Japanese ODA Loan) 1. Name of the Project Country: India Project: Delhi Mass Rapid Transport System Project Phase 2 (V) Loan Agreement: March 31, 2010 Loan Amount:
Japanese ODA Loan Ex-Ante Evaluation (for Japanese ODA Loan) 1. Name of the Project Country: India Project: Delhi Mass Rapid Transport System Project Phase 2 (V) Loan Agreement: March 31, 2010 Loan Amount:
No. CONSUMER PRICE INDICES. Information bulletin. Moscow 2019
 No. January 209 CONSUMER PRICE INDICES Information bulletin Moscow 209 No. (87) January 209 Consumer prices by group of goods and services (per cent change month-on-month) Table Inflation Core inflation
Mississauga Bus Rapid Transit Preliminary Design Project
 Mississauga Bus Rapid Transit Preliminary Design Project PUBLIC INFORMATION CENTRE OCTOBER 2008 WELCOME The Mississauga Bus Rapid Transit (BRT) Project Thank you for attending this Public Information Centre.
Sec Noise disturbances prohibited. (a) General provisions. (1)
 General provisions. (1)") Se 38-441. - Noise disturbances prohibite (a) General provisions. It shall be unlawful for any person or entity to knowingly, willfully or recklessly make, permit, cause to be made, or continue any noise
Se 38-441. - Noise disturbances prohibite (a) General provisions. It shall be unlawful for any person or entity to knowingly, willfully or recklessly make, permit, cause to be made, or continue any noise
2485. Airborne Toxic Control Measure to Limit Diesel-Fueled Commercial Motor Vehicle Idling.
 2485. Airborne Toxic Control Measure to Limit Diesel-Fueled Commercial Motor Vehicle Idling. (a) (b) Purpose. The purpose of this airborne toxic control measure is to reduce public exposure to diesel particulate
A9 Data Monitoring and Analysis Report. January Content. 1. Executive Summary. 2. Overview. 3. Purpose. 4. Baseline Data Sources
 A9 Data Monitoring and Analysis Report January 2018 Content 1. Executive Summary 2. Overview 3. Purpose 4. Baseline Data Sources 5. Casualty Analysis 6. Vehicle Speed Data 7. Incident Frequency & Impact
SULPHUR IN DIESEL FUEL REGULATIONS [FEDERAL]
![SULPHUR IN DIESEL FUEL REGULATIONS [FEDERAL]](/thumbs/88/116043249.jpg "SULPHUR IN DIESEL FUEL REGULATIONS [FEDERAL]") PDF Version [Printer-friendly - ideal for printing entire document] SULPHUR IN DIESEL FUEL REGULATIONS [FEDERAL] Published by Quickscribe Services Ltd. Updated To: [includes SOR/2006-163 amendments] Important:
PDF Version [Printer-friendly - ideal for printing entire document] SULPHUR IN DIESEL FUEL REGULATIONS [FEDERAL] Published by Quickscribe Services Ltd. Updated To: [includes SOR/2006-163 amendments] Important:
Report Addendum. Terry Keller, SDDOT. Noise Study Technical Report I-29 from Tea Interchange to Skunk Creek Sioux Falls, South Dakota
 Report Addendum To: Terry Keller, SDDOT From: HDR Project: Noise Study Technical Report I-29 from Tea Interchange to Skunk Creek Sioux Falls, South Dakota cc: file Date: May 28, 2010; rev July 16, July
T h e 2002 Annual Noise Report
 2002 Annual Noise Report (January 1, 2002 - December 31, 2002) T h e 2002 Annual Noise Report 2/15/2003 5:00 PM 2002 Annual Results For the 2002 reporting period, Class II exceedances decreased substantially
2010 Motorcycle Risk Study Update
 2010 Motorcycle Risk Study Update Introduction This report provides an update to the Motorcycle Risk Study from AI.16 of the 2005 Rate Application. The original study was in response to Public Utilities
REAL WORLD DRIVING. Fuel Efficiency & Emissions Testing. Prepared for the Australian Automobile Association
 REAL WORLD DRIVING Fuel Efficiency & Emissions Testing Prepared for the Australian Automobile Association - 2016 2016 ABMARC Disclaimer By accepting this report from ABMARC you acknowledge and agree to
MONTHLY NEW RESIDENTIAL SALES, SEPTEMBER 2018
 FOR RELEASE AT 10:00 AM EDT, WEDNESDAY, OCTOBER 24, MONTHLY NEW RESIDENTIAL SALES, SEPTEMBER Release Number: CB18 160 October 24, The U.S. Census Bureau and the U.S. Department of Housing and Urban Development
Natural Gas Well Development and Emergency Response & Management
 County of Lycoming Community Natural Gas Task Force Public Safety Sub-committee County of Lycoming Natural Gas Well Development and Emergency Response & Management Western North Dakota Emergency Response
Greater Albuquerque Area Monthly Housing Trends vs. 2014
 Month Greater Albuquerque Association of REALTORS Greater Albuquerque Area Monthly Housing Trends - 2013 vs. 2014 Class R1 (Existing Single-Family Detached) and Class R2 (Existing Condo/Townhome Attached)
THE CORNERSTONE APARTMENTS TRAFFIC IMPACT STUDY R&M PROJECT NO
 THE CORNERSTONE APARTMENTS SITUATED AT N/E/C OF STAUDERMAN AVENUE AND FOREST AVENUE VILLAGE OF LYNBROOK NASSAU COUNTY, NEW YORK TRAFFIC IMPACT STUDY R&M PROJECT NO. 2018-089 September 2018 50 Elm Street,
AIR QUALITY PERMIT. 7 Foundation Drive Savannah, Georgia (Chatham County)
") AIR QUALITY PERMIT Permit No. Effective Date April 11, 2016 In accordance with the provisions of the Georgia Air Quality Act, O.C.G.A. Section 12-9-1, et seq and the Rules, Chapter 391-3-1, adopted pursuant
AIR QUALITY PERMIT Permit No. Effective Date April 11, 2016 In accordance with the provisions of the Georgia Air Quality Act, O.C.G.A. Section 12-9-1, et seq and the Rules, Chapter 391-3-1, adopted pursuant
11. Electrical energy tariff rating
 799 11. Electrical energy tariff rating 800 11. ELECTRICAL ENERGY TARIFF RATING There is no universal system for billing electrical energy. Each country generally adopts its own method, taking into account
Automotive CNG/LPG Vehicles Test Method to Evaluate the Range
 AIS-055 AUTOMOTIVE INDUSTRY STANDARD Automotive CNG/LPG Vehicles Test Method to Evaluate the Range PRINTED BY: THE AUTOMOTIVE RESEARCH ASSOCIATION OF INDIA P.B. NO. 832, PUNE 412 004 ON BEHALF OF : AUTOMOTIVE
Free Static GK E-book Indian Railways at a glance
 Free Static GK E-book Indian Railways at a glance Static GK is an integral part of the general awareness section. Questions related to Indian Railways are common in the general awareness section of Bank
MONTHLY NEW RESIDENTIAL SALES, AUGUST 2017
 FOR RELEASE AT 10:00 AM EDT, TUESDAY, SEPTEMBER 26, MONTHLY NEW RESIDENTIAL SALES, AUGUST Release Number: CB17-161 Notice: For information on the impact of Hurricanes Harvey and Irma on the compilation
Village Green in Philadelphia
 Village Green in Philadelphia Dennis Sosna Hallie Weiss City of Philadelphia Department of Public Health Air Management Services 2015 MARAMA Monitoring Committee Meeting December 17, 2015 Towson, MD ABSTRACT
Analysis of Road Crash Statistics Western Australia 1990 to Report. December Project: Transport/21
 Analysis of Road Crash Statistics Western Australia 1990 to 1999 Report December 2000 Project: Transport/21 Analysis of Road Crash Statistics Western Australia 1990 to 1999 December 2000 Client: Transport
ARTICLE 23 OFF-STREET PARKING
 ARTICLE 23 OFF-STREET PARKING ;SECTION 23-1. Residential Uses. No structure or land shall be used for any use listed in Table A of Section 8-7 under Use Items Nos. 1, 1A, 2, 3, 4, 5, 6, 7, 7A, 7B, 8, 9,
<Nationwide> Improving moderately ( )
") Regional Economic and Industrial Research Results (from April to June 2017) Material 1 Improving moderately ( ) < Region > ( ) < Region > Improving ( ) < Region > Continuing to improve ( ) < Region
Regional Economic and Industrial Research Results (from April to June 2017) Material 1 Improving moderately ( ) < Region > ( ) < Region > Improving ( ) < Region > Continuing to improve ( ) < Region
Maximum retail price list. For SIBCO range of bearing housings and accessories Bearing housings, sleeves, locknuts, lock washers and locating rings
 Maximum retail price list For SIBCO range of bearing housings and accessories Bearing housings, sleeves, locknuts, lock washers and locating rings Effective from 1 st April, 2017 Engineered for optimized
Proposed Rule Amendment
 Department of Environmental Protection Promulgation of Amendments to Chapter 2 of Title 15 of the Rules of the City of New York Rules Governing the Emissions from the Use of #4 and #6 Fuel Oil in Heat
Embracing Smart Parking The Gurugram Story By Dr. Gaurav Antil, Joint Commissioner, MCG
 Embracing Smart Parking The Gurugram Story By Dr. Gaurav Antil, Joint Commissioner, MCG Gurugram: A Journey 1966 State of Haryana Formed, Gurgaon designated district 1990s Second wave of growth with real
Item No. 10 Town of Atherton
 Item No. 10 Town of Atherton CITY COUNCIL STAFF REPORT REGULAR AGENDA TO: FROM: HONORABLE MAYOR AND CITY COUNCIL GEORGE RODERICKS, CITY MANAGER MICHAEL KASHIWAGI COMMUNITY SERVICES DIRECTOR DATE: DECEMBER
3.1 Air Pollution Control Officer (APCO): as defined in Rule 1020 (Definitions).
: as defined in Rule 1020 (Definitions).") RULE 4352 SOLID FUEL FIRED BOILERS, STEAM GENERATORS AND PROCESS HEATERS (Adopted September 14, 1994; Amended October 19, 1995; Amended May 18, 2006; Amended December 15, 2011) 1.0 Purpose The purpose
RULE 4352 SOLID FUEL FIRED BOILERS, STEAM GENERATORS AND PROCESS HEATERS (Adopted September 14, 1994; Amended October 19, 1995; Amended May 18, 2006; Amended December 15, 2011) 1.0 Purpose The purpose
NATIONAL HOUSING BANK. Press Release
 NATIONAL HOUSING BANK Press Release NHB RESIDEX RESIDENTIAL HOUSING PRICE INDEX Update for the Quarter July-September, 2017 (Q2 2017) NHB RESIDEX, India s first official housing price index (HPI), was
Ambient Air Quality Data of. Delhi-NCR. For the Month of January, 2018
 Ambient Air Quality Data of Delhi-NCR For the Month of January, 2018 क न द र य प रद षण न य त रण ब र ड पययडवरण, व एव जलवयय पररवर ड म त रयलय, भयरर सरकयर CENTRAL POLLUTION CONTROL BOARD Website: http://www.cpcb.nic.in
ACCIDENT STATISTICS. petrol/diesel have further lured the people for owning private cars. Road Accidents in Delhi 2015
 2 VEHICLE REGISTRATION AND ACCIDENT STATISTICS The city of Delhi is quite old and big; it also attracts a lot of people from different parts of the country being the capital and center of numerous activities,
MONTHLY NEW RESIDENTIAL CONSTRUCTION, NOVEMBER 2017
 FOR RELEASE AT 8:30 AM EST, TUESDAY, DECEMBER 19, MONTHLY NEW RESIDENTIAL CONSTRUCTION, NOVEMBER Release Number: CB17-206 December 19, - The U.S. Census Bureau and the U.S. Department of Housing and Urban
NOISE ORDINANCE SUMMARY
 NOISE ORDINANCE SUMMARY Prepared by Jim Massey for the Cecil County Council July 26, 2013 I. COUNTIES WITH LOCAL NOISE ORDINANCE The following Maryland Counties have a noise ordinance: Anne Arundel, Baltimore
United Community Services Board of Directors Minutes 9.5 linear feet (9 SB, 1 MB) United Community Services of Metropolitan Detroit
 United Community Services of Metropolitan Detroit") United Community Services Board of Directors Minutes 9.5 linear feet (9 SB, 1 MB) 1906-1997 Walter P. Reuther Library, Wayne State University, Detroit, MI Finding aid written by Dallas Pillen on February
United Community Services Board of Directors Minutes 9.5 linear feet (9 SB, 1 MB) 1906-1997 Walter P. Reuther Library, Wayne State University, Detroit, MI Finding aid written by Dallas Pillen on February
Water Consumption Statistics Report
 Water Consumption Statistics Report Operations and Maintenance Department 29 Edition TABLE OF CONTENTS 29 Water Consumption Statistics Report October 21 SYSTEM AND MUNICIPAL CONSUMPTION 29 GVWD Statistics
RPO-REC Framework: Emerging Challenges and way forward. Background Presentation
 RPO-REC Framework: Emerging Challenges and way forward Background Presentation Ashwin Gambhir, Vishal Toro, Vijaypal Singh Prayas (Energy Group), Pune 10 th June, 2013, IHC, New Delhi Prayas Energy Group,
1996, or for which modification is commenced on or before March 16, 1998, shall not exceed the
 15A NCAC 02D.1206 HOSPITAL, MEDICAL, AND INFECTIOUS WASTE INCINERATORS (a) Applicability. This Rule applies to any hospital, medical, and infectious waste incinerator (HMIWI), except: (1) any HMIWI required
Environmental Noise Assessment Stonebridge Golf & Country Club Maintenance Facility. Nepean, Ontario
 Environmental Noise Assessment Stonebridge Golf & Country Club Maintenance Facility Nepean, Ontario REPORT: GmE 09-042-Noise Prepared For: Rob Pierce 3584 Jockvale Road Nepean, Ontario K2C 3H2 Prepared
Appendix E Hydrology, Erosion and Sediment Transport Studies
 Appendix E Hydrology, Erosion and Sediment Transport Studies Hatch 2012/10 Appendix E1 EA Hydrology Memorandum February 2011 (Hatch. 2011a) Hatch 2012/10 Project Memo February 23, 2011 TO: Larry King FROM:
Assessment of emissions from transport sector in Delhi
 Journal of Scientific SINGH & Industrial & SHARMA: ResearchASSESSMENT OF EMISSIONS FROM TRANSPORT SECTOR IN DELHI Vol. 71, February 2012, pp. 155-160 155 Assessment of emissions from transport sector in
1st Quarter Summary of Meteorological and Ambient Air Quality Data Kennecott Utah Copper Monitoring Stations
 1st Quarter 2014 Summary of Meteorological and Ambient Air Quality Data Kennecott Utah Copper Monitoring Stations Steven A. Root Digitally signed by Steven A. Root DN: cn=steven A. Root, o=weatherbank,
4th Quarter Summary of Meteorological and Ambient Air Quality Data Kennecott Utah Copper Monitoring Stations
 4th Quarter 2016 Summary of Meteorological and Ambient Air Quality Data Kennecott Utah Copper Monitoring Stations Steven Root Digitally signed by Steven Root DN: cn=steven Root, o=weatherbank, Inc., ou,
e t Performance of Extended Inlet and Extended Outlet Tube on Single Expansion Chamber for Noise Reduction
 e t International Journal on Emerging Technologies 7(1): 37-41(2016) ISSN No. (Print) : 0975-8364 ISSN No. (Online) : 2249-3255 Performance of Extended Inlet and Extended Outlet Tube on Single Expansion
Abstract. 1. Introduction. 1.1 object. Road safety data: collection and analysis for target setting and monitoring performances and progress
 Road Traffic Accident Involvement Rate by Accident and Violation Records: New Methodology for Driver Education Based on Integrated Road Traffic Accident Database Yasushi Nishida National Research Institute
SUB-REGIONAL WORKSHOP OCTOBER 2017 WORKING GROUP 2: ULTRA-LOW SULPHUR FUELS AND ENFORCEMENT
 GLOBAL FUEL ECONOMY INITIATIVE SUB-REGIONAL WORKSHOP 12-13 OCTOBER 2017 WORKING GROUP 2: ULTRA-LOW SULPHUR FUELS AND ENFORCEMENT Venue: The Ravenala Hotel, Balaclava Republic of Mauritius Presented by:
BASELINE STUDY ON VEHICLE INVENTORY AND FUEL ECONOMY FOR MALAWI (KEY FINDINGS)
") BASELINE STUDY ON VEHICLE INVENTORY AND FUEL ECONOMY FOR MALAWI (KEY FINDINGS) TASK TEAM- LEAD INSTITUTION Ministry of Natural Resources, Energy and Mining Mount Soche Hotel, Blantyre. 11 th December 2017
BASELINE STUDY ON VEHICLE INVENTORY AND FUEL ECONOMY FOR MALAWI (KEY FINDINGS) TASK TEAM- LEAD INSTITUTION Ministry of Natural Resources, Energy and Mining Mount Soche Hotel, Blantyre. 11 th December 2017
Cobenefit of Urban Railway Development Funded by Japanese ODA Loans
 Cobenefit of Urban Railway Development Funded by Japanese ODA Loans ~ Addressing Climate Change ~ UCHIDA Tsutomu Deputy Director General Japan Bank for International Cooperation 18 March 2008 Contents
SIAM Viewpoint for improved Inspection & Maintenance in India GITE Regional Workshop on Transport Sector Inspection & Maintenance Policy
 Viewpoint for improved Inspection & Maintenance in India GITE Regional Workshop on Transport Sector Inspection & Maintenance Policy 10 th -12 th December 2001 Bangkok Indian Scenario Two types of I&M programmes
Greater Albuquerque Area Monthly Housing Trends vs. 2016
 Month Greater Albuquerque Area Monthly Housing Trends - 2015 vs. 2016 Class R1 (Existing Single-Family Detached) and Class R2 (Existing Condo/Townhome Attached) homes Data on this page was obtained from