Risk factors, driver behaviour and accident probability. The case of distracted driving.
|
|
|
- Nelson Quinn
- 5 years ago
- Views:
Transcription
1 Risk factors, driver behaviour and accident probability. The case of distracted driving. Panagiotis Papantoniou PhD, Civil - Transportation Engineer National Technical University of Athens Vienna, June 2016 Transport Safety: Societal Challenges, Research Solutions, 4-5 December 2014, Genoa, Palazzo Ducale

2 Objective The analysis of the effect of road, traffic and driver risk factors on driver behaviour and accident probability at unexpected incidents, with particular focus on distracted driving The development of risky driver profiles and road characteristics leading to increased possibility of driver error

3 Methodological steps Literature review Methodological review Research questions Driving simulator experiment Statistical analysis Methodological contributions Key research findings Further research


4 Literature review Several literature reviews were implemented in the following research topics: Driver behaviour and road safety Driver distraction Types of assessing driver distraction Driving simulator characteristics Driving simulator studies on driver distraction

5 Methodological review Two targeted literature reviews took place in order to investigate: key driving performance parameters A lot of different methods and measures exist for evaluating driving performance statistical analyses implemented In more than half of the examined studies the main statistical analysis is repeated measures Anova Latent model analysis and especially structural equation models have never been implemented in the field of driver distraction.

6 Research questions 1. Design and implementation of a simulator experiment aiming to deal with the basic limitations found in the literature: Large and representative sample Randomisation of trials Adequate practice drive Investigation of an optimum number of driving factors 2. Need to demonstrate a composite driving performance measure in order to examine driver distraction as a multidimensional phenomenon 3. Development and application of an innovative statistical analysis methodology 4. Estimation of the combined effect of distraction sources, driver as well as road and traffic environment characteristics directly on driving performance.


7 Driving simulator experiment (1/2) A common simulator experiment in the framework of two research projects: Distract - Analysis of causes and impacts of driver distraction DriverBrain - Analysis of the performance of drivers with cerebral diseases An interdisciplinary research team: Dpt. of Transportation Planning and Engineering NTUA Dpt. of Neurology of the University of Athens Medical School, UoA Dpt. of Psychology, School of Philosophy, Pedagogy and Psychology, UoA


8 Driving simulator experiment (2/2) Driving simulator characteristics Foerst Driving Simulator FPF 3 LCD wide screens 40 total angle view 170 ο driving position and support base Driving criteria Have a valid driving license Had driven for more than 3 years Had driven more than 2500km during the last year Had driven at least once a week during the last year Had driven at least 10km/week during the last year
9 Design of experiment (1/2) The design of the driving scenarios is a central component of the present PhD thesis and includes: Area type Rural area 2,1 km long, single carriageway and the lane width was 3m, with zero gradient and mild horizontal curves Urban area 1,7km long, lane width 3,5m, separated by guardrails Distraction conditions No distraction Cell phone use Conversation with the passenger Urban area Rural area Q L Q H Q L Q H No distraction Cell phone use Conversation with the passenger


10 Traffic scenarios Low traffic Q L =300 vehicles/hour High traffic Q H =600 vehicles/hour Unexpected incidents Child crossing the road Sudden appearance of an animal Randomisation Design of experiment (2/2) The purpose of randomisation is to remove bias and other sources of extraneous variation, which are not controllable


11 Familiarisation During the familiarizationwith the simulator, the participant practiced in: handling the simulator (starting, gears, wheel handling etc.) keeping the lateral position of the vehicle keeping stable speed, appropriate for the road environment Braking and immobilization of the vehicle During this practice drive, two unexpected incidents took place. The following criteria must be verified (there is no time restriction) before the participant moves on to the next phase of the experiment:
12 Questionnaires Driving behaviour questionnaire Driving experience - car use Self -assessment of the older driver Distraction-related driving habits Emotions and behaviour of the driver Anger expression inventory during driving History of accidents, near misses, and traffic violations Self-Assessment and memory questionnaire Memory Self assessment Driving skills

13 Sample characteristics The sample of the analysis consists of 95 participants 28 young drivers aged years old 31 middle aged drivers aged years old 36 older driver aged years old YEARS Education Experience Young Middle Aged Old NUMBER OF DRIVERS Rural Urban Young Middle Aged Old TRIAL NUMBER
14 Statistical analysis methodology Data collected from the driving simulator experiment and the respective questionnaires are analysed by means of a dedicated statistical analysis method: 1. Descriptive analysis (correlation table, boxplots) 2. Regression analysis (6 general linear mixed models) 3. Factor Analysis (2 factor analysis) 4. Latent analysis (4 structural equation models) Variable Explanation 1 Time current real-time in milliseconds since start of the drive. 2 x-pos x-position of the vehicle in m. 3 y-pos y-position of the vehicle in m. 4 z-pos z-position of the vehicle in m. 5 road road number of the vehicle in [int]. 6 richt direction of the vehicle on the road in [BOOL] (0/1). 7 rdist distance of the vehicle from the beginning of the drive in m. 8 rspur track of the vehicle from the middle of the road in m. 9 ralpha direction of the vehicle compared to the road direction in degrees. 10 Dist driven course in meters since begin of the drive. 11 Speed actual speed in km/h. 12 Brk brake pedal position in percent. 13 Acc gas pedal position in percent. 14 Clutch clutch pedal position in percent. 15 Gear chosen gear (0 = idle, 6 = reverse). 16 RPM motor revolvation in 1/min. 17 HWay headway, distance to the ahead driving vehicle in m. 18 DLeft distance to the left road board in meter. 19 DRight distance to the right road board in meter. 20 Wheel steering wheel position in degrees. 21 THead time to headway, i. e. to collision with the ahead driving vehicle, in seconds. 22 TTL time to line crossing, time until the road border line is exceeded, in seconds. 23 TTC time to collision (all obstacles), in seconds. 24 AccLat acceleration lateral, in m/s 2 25 AccLon acceleration longitudinal, in m/s 2 26 EvVis event-visible-flag/event-indication, 0 = no event, 1 = event. 27 EvDist event-distance in m. 28 ErrINo number of the most important driving failure since the last data set 29 ErrlVal state date belonging to the failure, content varies according to type of failure. 30 Err2No number of the next driving failure (maybe empty). 31 Err2Val additional date to failure Err3No number of a further driving failure (maybe empty). 33 Err3Val additional date to failure 3.
15 Descriptive analysis Database development Type of variable Min, max, average value Several boxplots were developed in order to explain the effect of specific driver, road and traffic parameters as well as the examined distraction sources on selected driving performance measures Average speed Young MiddleAged Old NO CONV MOB NO CONV MOB NO CONV MOB Distraction source R U F M A correlation table is investigating any of a broad class of statistical relationships between driving simulator variables Reaction time QH QL 1000 NO CONV MOB NO CONV MOB Distraction source
16 Regression analysis Within the framework of regression analysis, 6 general linear mixed models are developed in order to identify several sets of explanatory variables that covary with specific driving performance measures of the driving simulator dataset. Average speed Reaction time Lateral position Residuals Residuals vs Fitted Std. deviance resid Scale-Location Average headway Predicted values Predicted values Speed variability Lateral position variability Std. deviance resid Normal Q-Q Std. Pearson resid Residuals vs Leverage Cook's distance Theoretical Quantiles Leverage
17 Factor analysis Two factor analysis are developed in order to investigate which observed variables are most highly correlated with the common factors of driving performance and driver error and how many common factors are needed to give an adequate description of the data Regarding driving performance, 5 factors are best fitted in the specific database. The interpretation of the results revealed that the five factors are: lateral measures, speed measures, vehicle direction measures, headway as well as vehicle revolvation The variables that tend to explain better the Driver Error factor are: numbers of Outside Road Lines, Sudden Brakes and High Rounds per Minute

18 Latent analysis overview
19 SEM regarding driving performance (1/2) The latent variable reflects the underlying driving performance and the objective is the quantification of the impact of distraction, driver characteristics as well as road and traffic environment on driving performance
20 SEM regarding driving performance (2/2) The effect of cell phone on driving performance is definitely negative Conversation with the passenger does not has a statistically significant effect Risk factors that affect driving performance include driver characteristics (age, gender, driving experience), area type and traffic conditions
21 SEM regarding driver error (1/2) The latent variable reflects the underlying driver error and the objective is the quantification of the impact of distraction, driver characteristics as well as road and traffic environment on driving error
22 SEM regarding driver error (2/2) Neither conversing with a passenger nor talking on the cell phone has a statistical significant impact on driver error Risk factors that affect driver error include gender, age, experience, education and area type

23 SEM regarding driving performance and driver error (1/2) Two latent variables are created regarding driving performance and driver error while the objective of this analysis is the quantification of the impact of driving errors, distraction, driver characteristics as well as road and traffic environment on driving performance
24 SEM regarding driving performance and driver error (2/2) Driver error is a crucial factor that negatively affects driving performance Neither road characteristics (area type, traffic conditions) nor the distraction sources examined (cell phone use, conversation with a passenger) have a significant impact on this model

25 SEM regarding accident probability (1/2) The latent variable reflects again the underlying driving performance of the participants and the objective is the quantification of the impact of driving performance, distraction, driver characteristics as well as road and traffic environment directly on accident probability at unexpected incidents
26 SEM regarding accident probability (2/2) Cell phone use has a negative effect on accident probability Drivers self-regulate their driving performance better while conversing with a passenger Female drivers at low traffic are more prone to accidents at unexpected incidents
27 Scientific contributions

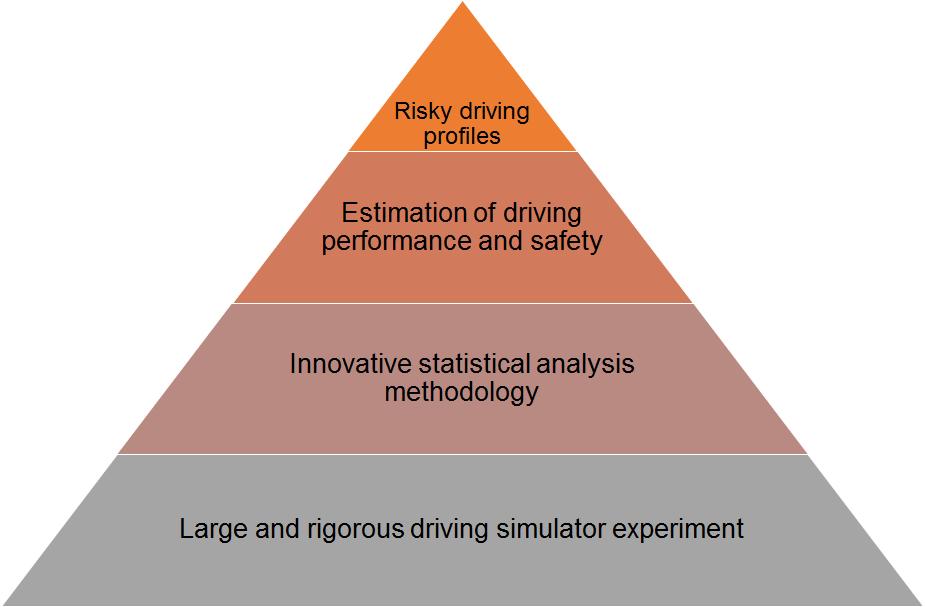
28 Methodological contributions (1/2) Design and implementation of a large and rigorous driving simulator experiment The basic limitations found in the literature that the present experiment tackled are the following: Large and representative sample Randomisation of trials Adequate practice drive Investigation of an optimum number of driving factors

29 Methodological contributions (2/2) Development and application of an innovative statistical analysis methodology Latent analysis through Structural Equation models is implemented for the first time in the field of driving performance and traffic safety Estimation of the combined effect of distraction sources, driver as well as road and traffic environment characteristics directly on driving performance
 Driving performance is worst in urban areas and high traffic conditions probably due to the complex driving")
30 Key research findings (1/2) Results regarding the effect of driver distraction indicate the different effect on driving performance between cell phone use and conversation with the passenger Driver characteristics play the most crucial role in driving performance (gender, age, experience) Driving performance is worst in urban areas and high traffic conditions probably due to the complex driving environment

31 Key research findings (2/2) Development of risky driver profiles regarding driver error and accident probability at unexpected incident. Results indicate that: more likely to commit driving errors are young or old female drivers at urban areas more likely to be involved in an accident at an unexpected incident are female drivers in low traffic conditions while talking on the cell phone

 Further investigation of the parameters that affect the compensatory behaviour of the driver Investigation of")
32 Further research Investigation of the effect of other parameters such as alcohol, fatigue etc. on driving performance through latent analysis Development of Structural Equation Model on different experimental methods (Naturalistic experiments, field test etc.) Further investigation of the parameters that affect the compensatory behaviour of the driver Investigation of different types of cell phone use such as a hands-free, Bluetooth, typing an sms etc.)

33 Risk factors, driver behaviour and accident probability. The case of distracted driving. Panagiotis Papantoniou PhD, Civil - Transportation Engineer National Technical University of Athens Vienna, June 2016 Transport Safety: Societal Challenges, Research Solutions, 4-5 December 2014, Genoa, Palazzo Ducale
DRIVING PERFORMANCE PROFILES OF DRIVERS WITH PARKINSON S DISEASE
 14th International Conference Mobility and Transport for Elderly and Disabled Persons Lisbon, Portugal, 28-31 July 2015 DRIVING PERFORMANCE PROFILES OF DRIVERS WITH PARKINSON S DISEASE Dimosthenis Pavlou
TEST SUMMARY AND FRAMEWORK TEST SUMMARY
 Washington Educator Skills Tests Endorsements (WEST E ) TEST SUMMARY AND FRAMEWORK TEST SUMMARY TRAFFIC SAFETY Copyright 2014 by the Washington Professional Educator Standards Board 1 Washington Educator
DRIVER SPEED COMPLIANCE WITHIN SCHOOL ZONES AND EFFECTS OF 40 PAINTED SPEED LIMIT ON DRIVER SPEED BEHAVIOURS Tony Radalj Main Roads Western Australia
 DRIVER SPEED COMPLIANCE WITHIN SCHOOL ZONES AND EFFECTS OF 4 PAINTED SPEED LIMIT ON DRIVER SPEED BEHAVIOURS Tony Radalj Main Roads Western Australia ABSTRACT Two speed surveys were conducted on nineteen
Assessment of driver fitness: An alcohol calibration study in a high-fidelity simulation 26 April 2013
 Assessment of driver fitness: An alcohol calibration study in a high-fidelity simulation 26 April 2013 Dr. Yvonne Kaussner WIVW Wuerzburg Institute for Traffic Sciences Methodological issues on the assessment
DETERMINATION OF ACCIDENT CAUSATION AND RISK FACTORS IN TRAFFIC ACCIDENTS FROM THE POINT OF VIEW OF MOTORCYCLIST USERS
 DETERMINATION OF ACCIDENT CAUSATION AND RISK FACTORS IN TRAFFIC ACCIDENTS FROM THE POINT OF VIEW OF MOTORCYCLIST USERS A. Molinero*, J. M. Perandones*, D. Pedrero*, A. Mansilla*, O. Martín* * Department
An Evaluation on the Compliance to Safety Helmet Usage among Motorcyclists in Batu Pahat, Johor
 An Evaluation on the Compliance to Safety Helmet Usage among Motorcyclists in Batu Pahat, Johor K. Ambak 1, *, H. Hashim 2, I. Yusoff 3 and B. David 4 1,2,3,4 Faculty of Civil and Environmental Engineering,
Magnus HJÄLMDAHL Sverker ALMQVIST András VÁRHELYI
 Magnus HJÄLMDAHL Sverker ALMQVIST András VÁRHELYI The effects on speeds and speed distribution were studied in a large scale field trial with an in-car system for speed adaptation in the city of Lund,
DRIVERS PERCEPTION OF AND RESPONSE TO BRAKE FAILURE
 DRIVERS PERCEPTION OF AND RESPONSE TO BRAKE FAILURE Hamish Jamson* and Paul Smith *Institute for Transport Studies School of Psychology University of Leeds Leeds, U.K. E-mail: hamish@psyc.leeds.ac.uk Summary:
2017 MDTSEA Manual - How it Corresponds to the ADTSEA 3.0 Curriculum for Segment 1 and 2 Classroom Education
 2017 MDTSEA - How it Corresponds to the ADTSEA 3.0 Curriculum for Segment 1 and 2 Classroom Education Section 5A Segment 1 Classroom Content, Objectives, and Resources 1 Introduction to Novice Driver Responsibilities
Support for the revision of the CO 2 Regulation for light duty vehicles
 Support for the revision of the CO 2 Regulation for light duty vehicles and #3 for - No, Maarten Verbeek, Jordy Spreen ICCT-workshop, Brussels, April 27, 2012 Objectives of projects Assist European Commission
Predicting Drivers Crash Risk Based-on Previous Crash History
 Predicting Drivers Crash Risk Based-on Previous Crash History Xiaoduan Sun, Ph.D., and P.E. (Corresponding author) Professor Civil Engineering Department University of Louisiana Lafayette, LA 70504 337-739-6732
Level of Service Classification for Urban Heterogeneous Traffic: A Case Study of Kanapur Metropolis
 Level of Service Classification for Urban Heterogeneous Traffic: A Case Study of Kanapur Metropolis B.R. MARWAH Professor, Department of Civil Engineering, I.I.T. Kanpur BHUVANESH SINGH Professional Research
Powered Two Wheeler critical risk factors Behaviour - Infrastructure - Weather
 Powered Two Wheeler critical risk factors Behaviour - Infrastructure - Weather John Golias, George Yannis, Eleni Vlahogianni, NTUA Phan Vuthy, CEESAR - Peter Saleh, AIT Martin Winkelbauer, KfV Objectives
PLUMSTED TOWNSHIP SCHOOL DISTRICT
 - Driver Education Content Area: Health Grade Level(s): Tenth Course Description: Driver s Education is a mandatory course to fulfill graduation requirements. The ultimate goal in this class is for students
Driver Response to Active Front Steer and Power-Assist Failures
 Driver Response to Active Front Steer and Power-Assist Failures Hamish Jamson*, Phil Wiffin and Peter Burchill *Institute for Transport Studies, University of Leeds, LS2 9JT. Jaguar Research Abstract Active
REQUIREMENTS FOR APPROVAL OF AN ONLINE - DEFENSIVE DRIVING COURSE (O-DDC) Defensive Driving. Course. Online. Online DDC December 2007 Page 1 of 11
 Defensive Driving. Course. Online. Online DDC December 2007 Page 1 of 11") Defensive Driving Course Online Online DDC December 2007 Page 1 of 11 Alberta Transportation Alberta Transportation Driver Programs & Licensing Standards Driver Programs & Licensing Standards 1 st Floor,
Defensive Driving Course Online Online DDC December 2007 Page 1 of 11 Alberta Transportation Alberta Transportation Driver Programs & Licensing Standards Driver Programs & Licensing Standards 1 st Floor,
Abstract. 1. Introduction. 1.1 object. Road safety data: collection and analysis for target setting and monitoring performances and progress
 Road Traffic Accident Involvement Rate by Accident and Violation Records: New Methodology for Driver Education Based on Integrated Road Traffic Accident Database Yasushi Nishida National Research Institute
State-of-the-Art and Future Trends in Testing of Active Safety Systems
 State-of-the-Art and Future Trends in Testing of Active Safety Systems Empirical Study Results with the Swedish Alessia Knauss (Chalmers), Christian Berger (GU), and Henrik Eriksson (SP) A-TEAM project
Identification of safety hazards on existing road network regarding road Geometric Design: Implementation in Greece
 4 th International Conference on Road Safety and Simulation RSS 2013 23 rd -25 th October 2013 Rome, Italy Identification of safety hazards on existing road network regarding road Geometric Design: Implementation
Research Challenges for Automated Vehicles
 Research Challenges for Automated Vehicles Steven E. Shladover, Sc.D. University of California, Berkeley October 10, 2005 1 Overview Reasons for automating vehicles How automation can improve efficiency
Fleet Penetration of Automated Vehicles: A Microsimulation Analysis
 Fleet Penetration of Automated Vehicles: A Microsimulation Analysis Corresponding Author: Elliot Huang, P.E. Co-Authors: David Stanek, P.E. Allen Wang 2017 ITE Western District Annual Meeting San Diego,
CONNECTED AUTOMATION HOW ABOUT SAFETY?
 CONNECTED AUTOMATION HOW ABOUT SAFETY? Bastiaan Krosse EVU Symposium, Putten, 9 th of September 2016 TNO IN FIGURES Founded in 1932 Centre for Applied Scientific Research Focused on innovation for 5 societal
Ricardo-AEA. Passenger car and van CO 2 regulations stakeholder meeting. Sujith Kollamthodi 23 rd May
 Ricardo-AEA Data gathering and analysis to improve understanding of the impact of mileage on the cost-effectiveness of Light-Duty vehicles CO2 Regulation Passenger car and van CO 2 regulations stakeholder
Interim Evaluation Report - Year 3
 Performance Analysis Services Graduated Licensing Program Interim Evaluation Report - Year 3 Prepared by: Sandi Wiggins Performance Analysis Services Table of Contents Section 1. Executive Summary... 11
ANALYSIS OF THE ACCIDENT SCENARIO OF POWERED TWO- WHEELERS ON THE BASIS OF REAL-WORLD ACCIDENTS
 ANALYSIS OF THE ACCIDENT SCENARIO OF POWERED TWO- WHEELERS ON THE BASIS OF REAL-WORLD ACCIDENTS Author: Dipl.-Ing. H. Liers Verkehrsunfallforschung an der TU Dresden GmbH Zellescher Weg 24 01217 Dresden
Simulation of Collective Load Data for Integrated Design and Testing of Vehicle Transmissions. Andreas Schmidt, Audi AG, May 22, 2014
 Simulation of Collective Load Data for Integrated Design and Testing of Vehicle Transmissions Andreas Schmidt, Audi AG, May 22, 2014 Content Introduction Usage of collective load data in the development
Testing of Emissions- Relevant Driving Cycles on an Engine Testbed
 Testing of Emissions- Relevant Driving Cycles on an Engine Testbed Dr. Klaus Rothbart RDE as a Challenge for the Development TRAFFIC EXTREME CONDITIONS MOUNTAIN RANDOMNESS Driving style has a strong impact
Towards a driver-centred brake assist system
 Towards a driver-centred brake assist system N. GKIKAS, J. H. RICHARDSON, J. R. HILL Ergonomics & Safety Research Institute, Loughborough University UK ABSTRACT Active safety systems relevant to longitudinal
Approach for determining WLTPbased targets for the EU CO 2 Regulation for Light Duty Vehicles
 Approach for determining WLTPbased targets for the EU CO 2 Regulation for Light Duty Vehicles Brussels, 17 May 2013 richard.smokers@tno.nl norbert.ligterink@tno.nl alessandro.marotta@jrc.ec.europa.eu Summary
EMISSION FACTORS FROM EMISSION MEASUREMENTS. VERSIT+ methodology Norbert Ligterink
 EMISSION FACTORS FROM EMISSION MEASUREMENTS VERSIT+ methodology Norbert Ligterink Symposium Vehicle Emissions November 3, 2016 GETTING THE COMPLETE PICTURE fuels SCR DPF hybrid technology downsizing dynamometer
RESEARCH ON ASSESSMENTS
 hmhco.com RESEARCH ON ASSESSMENTS HMH Reading Inventory: Estimated Average Annual Growth 3 4 Houghton Mifflin Harcourt (HMH) is committed to developing innovative educational programs and professional
Insights into experiences and risk perception of riders of fast e-bikes
 Insights into experiences and risk perception of riders of fast e-bikes Young Researchers Seminar, 17-19th of June 2015, Rome Andrea Uhr, MSc in Psychology a.uhr@bfu.ch Contents 1. Background 2. Survey
WHITE PAPER. Preventing Collisions and Reducing Fleet Costs While Using the Zendrive Dashboard
 WHITE PAPER Preventing Collisions and Reducing Fleet Costs While Using the Zendrive Dashboard August 2017 Introduction The term accident, even in a collision sense, often has the connotation of being an
Measurement methods for skid resistance of road surfaces
 Measurement methods for skid resistance of road surfaces Presented by Martin Greene (TRL) and Veronique Cerezo (IFSTTAR) 11 October 2016 Background and requirements for Common Scale 1 Background Measurement
Analyzing Crash Risk Using Automatic Traffic Recorder Speed Data
 Analyzing Crash Risk Using Automatic Traffic Recorder Speed Data Thomas B. Stout Center for Transportation Research and Education Iowa State University 2901 S. Loop Drive Ames, IA 50010 stouttom@iastate.edu
Driver Speed Compliance in Western Australia. Tony Radalj and Brian Kidd Main Roads Western Australia
 Driver Speed Compliance in Western Australia Abstract Tony Radalj and Brian Kidd Main Roads Western Australia A state-wide speed survey was conducted over the period March to June 2 to measure driver speed
2018 Linking Study: Predicting Performance on the Performance Evaluation for Alaska s Schools (PEAKS) based on MAP Growth Scores
 based on MAP Growth Scores") 2018 Linking Study: Predicting Performance on the Performance Evaluation for Alaska s Schools (PEAKS) based on MAP Growth Scores June 2018 NWEA Psychometric Solutions 2018 NWEA. MAP Growth is a registered
2018 Linking Study: Predicting Performance on the Performance Evaluation for Alaska s Schools (PEAKS) based on MAP Growth Scores June 2018 NWEA Psychometric Solutions 2018 NWEA. MAP Growth is a registered
Aria Etemad Volkswagen Group Research. Key Results. Aachen 28 June 2017
 Aria Etemad Volkswagen Group Research Key Results Aachen 28 June 2017 28 partners 2 // 28 June 2017 AdaptIVe Final Event, Aachen Motivation for automated driving functions Zero emission Reduction of fuel
Statistics and Facts About Distracted Driving
 Untitled Document Statistics and Facts About Distracted Driving What does it mean to be a distracted driver? Are you one? Learn more here. What Is Distracted Driving? There are three main types of distraction:
SEGMENT 2 DRIVER EDUCATION Risk Awareness
 Fact Sheet 1 Why Should Young Drivers Be Concerned? Risk is the chance of death, injury, damage, or loss. Approximately 1 out of 11 (9%) of 16-year-old drivers will have a serious crash before his/her
Meeting product specifications
 Optimisation of a diesel hydrotreating unit A model based on operating data is used to meet sulphur product specifications at lower DHT reactor temperatures with longer catalyst life Jose Bird Valero Energy
ROAD SAFETY RESEARCH, POLICING AND EDUCATION CONFERENCE, NOV 2001
 ROAD SAFETY RESEARCH, POLICING AND EDUCATION CONFERENCE, NOV 2001 Title Young pedestrians and reversing motor vehicles Names of authors Paine M.P. and Henderson M. Name of sponsoring organisation Motor
Traffic Micro-Simulation Assisted Tunnel Ventilation System Design
 Traffic Micro-Simulation Assisted Tunnel Ventilation System Design Blake Xu 1 1 Parsons Brinckerhoff Australia, Sydney 1 Introduction Road tunnels have recently been built in Sydney. One of key issues
GRADUATED LICENSING. KITCHEN TABLE DISCUSSION GUIDE Have your say on Your PLates reforms
 YOUR GRADUATED LICENSING KITCHEN TABLE DISCUSSION GUIDE Have your say on Your PLates reforms Justice and Community Safety Directorate April - May 2018 INTRODUCTION Thank you for your interest in how we
THE ACCELERATION OF LIGHT VEHICLES
 THE ACCELERATION OF LIGHT VEHICLES CJ BESTER AND GF GROBLER Department of Civil Engineering, University of Stellenbosch, Private Bag X1, MATIELAND 7602 Tel: 021 808 4377, Fax: 021 808 4440 Email: cjb4@sun.ac.za
Ontario s Large Truck Studies A s t r o n g t r a n s p o r t a t i o n f u t u r e t o g e t h e r
 Ontario s Large Truck Studies Fatigue and Carrier vs Driver Risk 11-06-18 A s t r o n g t r a n s p o r t a t i o n f u t u r e t o g e t h e r Two Studies One Goal Truck Safety Oversight Evaluation Determine
National Road Safety Action Plan in China
 Sixth SHRP 2 Safety Research Symposium National Road Safety Action Plan in China Dr. Yan Wang July 14, 2011 Washington DC, USA Outline 1 Initiative of Road Safety Action Plan 2 Phase I 3 For Next Phase?
HOW MUCH DRIVING DATA DO WE NEED TO ASSESS DRIVER BEHAVIOR?
 0 0 0 0 HOW MUCH DRIVING DATA DO WE NEED TO ASSESS DRIVER BEHAVIOR? Extended Abstract Anna-Maria Stavrakaki* Civil & Transportation Engineer Iroon Polytechniou Str, Zografou Campus, Athens Greece Tel:
WHAT IS THE PROFIT OF DRIVING FAST? -THE COMPARISON OF THE SPEEDY DRIVING AND SAFE DRIVING IN TERMS OF TRAVELING TIME-
 WHAT IS THE PROFIT OF DRIVING FAST? -THE COMPARISON OF THE SPEEDY DRIVING AND SAFE DRIVING IN TERMS OF TRAVELING TIME- Yuji MATSUKI, Katsuya MATSUNAGA, Kazunori SHIDOJI Kyushu University Graduate School
Strategic Planning Directorate General of Traffic. VI International Conference of European Traffic Policies Barcelona, 16 May 2014
 Strategic Planning Directorate General of Traffic VI International Conference of European Traffic Policies Barcelona, 16 May 2014 Script Objective Context: Present and Evolution. Assessments Strategy Areas
FHWA Motorcycle Crash Causation Study
 Office of Safety Research and Development FHWA Motorcycle Crash Causation Study Carol H. Tan, Ph.D Office of Safety Research & Development 2017 SMSA Sept 28, 2017 1 Presentation Overview Background Data
Oregon DOT Slow-Speed Weigh-in-Motion (SWIM) Project: Analysis of Initial Weight Data
 Project: Analysis of Initial Weight Data") Portland State University PDXScholar Center for Urban Studies Publications and Reports Center for Urban Studies 7-1997 Oregon DOT Slow-Speed Weigh-in-Motion (SWIM) Project: Analysis of Initial Weight Data
Portland State University PDXScholar Center for Urban Studies Publications and Reports Center for Urban Studies 7-1997 Oregon DOT Slow-Speed Weigh-in-Motion (SWIM) Project: Analysis of Initial Weight Data
Young Researchers Seminar 2009
 Young Researchers Seminar 2009 Torino, Italy, 3 to 5 June 2009 Car drivers perceptions of Electronic Stability Control (ESC) and Anti-lock Braking Systems (ABS) Background In Europe, about 40 000 people
University Of California, Berkeley Department of Mechanical Engineering. ME 131 Vehicle Dynamics & Control (4 units)
") CATALOG DESCRIPTION University Of California, Berkeley Department of Mechanical Engineering ME 131 Vehicle Dynamics & Control (4 units) Undergraduate Elective Syllabus Physical understanding of automotive
CATALOG DESCRIPTION University Of California, Berkeley Department of Mechanical Engineering ME 131 Vehicle Dynamics & Control (4 units) Undergraduate Elective Syllabus Physical understanding of automotive
VEHICLE AUTOMATION. CHALLENGES AND POTENTIAL FOR FUTURE MOBILITY.
 VEHICLE AUTOMATION. CHALLENGES AND POTENTIAL FOR FUTURE MOBILITY. Dr. Thomas Helmer, BMW AG SESAR Innovation Days 11.2017 ROAD TRAFFIC: MANY INDIVIDUALS WITH LITTLE OVERALL MANAGEMENT. A SHORT GLANCE AT
Study of the Performance of a Driver-vehicle System for Changing the Steering Characteristics of a Vehicle
 20 Special Issue Estimation and Control of Vehicle Dynamics for Active Safety Research Report Study of the Performance of a Driver-vehicle System for Changing the Steering Characteristics of a Vehicle
Analysis of Road Crash Statistics Western Australia 1990 to Report. December Project: Transport/21
 Analysis of Road Crash Statistics Western Australia 1990 to 1999 Report December 2000 Project: Transport/21 Analysis of Road Crash Statistics Western Australia 1990 to 1999 December 2000 Client: Transport
Road safety in Greece
 Athens, Greece April 23-26 2012 Transport Research Arena Europe 2012 Road safety in Greece George Yannis, Eleonora Papadimitriou National Technical University of Athens, Greece Background and objectives
Highly Automated Driving: Fiction or Future?
 The future of driving. Final Event Highly Automated Driving: Fiction or Future? Prof. Dr. Jürgen Leohold Volkswagen Group Research Motivation The driver as the unpredictable factor: Human error is the
Post 50 km/h Implementation Driver Speed Compliance Western Australian Experience in Perth Metropolitan Area
 Post 50 km/h Implementation Driver Speed Compliance Western Australian Experience in Perth Metropolitan Area Brian Kidd 1 (Presenter); Tony Radalj 1 1 Main Roads WA Biography Brian joined Main Roads in
Quarterly Content Guide Driver Education/Traffic Safety Classroom (Course # )
") Adopted Instructional : Quarterly Content Guide Driver Education/Traffic Safety Classroom (Course #1900300) Pearson Drive Right (11 th Edition) Quarter 1 43 Days Quarter 2 47 Days Quarter 3 47 Days Quarter
Adopted Instructional : Quarterly Content Guide Driver Education/Traffic Safety Classroom (Course #1900300) Pearson Drive Right (11 th Edition) Quarter 1 43 Days Quarter 2 47 Days Quarter 3 47 Days Quarter
CHANGE IN DRIVERS PARKING PREFERENCE AFTER THE INTRODUCTION OF STRENGTHENED PARKING REGULATIONS
 CHANGE IN DRIVERS PARKING PREFERENCE AFTER THE INTRODUCTION OF STRENGTHENED PARKING REGULATIONS Kazuyuki TAKADA, Tokyo Denki University, takada@g.dendai.ac.jp Norio TAJIMA, Tokyo Denki University, 09rmk19@dendai.ac.jp
Factors Affecting Vehicle Use in Multiple-Vehicle Households
 Factors Affecting Vehicle Use in Multiple-Vehicle Households Rachel West and Don Pickrell 2009 NHTS Workshop June 6, 2011 Road Map Prevalence of multiple-vehicle households Contributions to total fleet,
Structural Analysis Of Reciprocating Compressor Manifold
 Purdue University Purdue e-pubs International Compressor Engineering Conference School of Mechanical Engineering 2016 Structural Analysis Of Reciprocating Compressor Manifold Marcos Giovani Dropa Bortoli
Keeping your new driver safe.
 Keeping your new driver safe. You re going to have a new young driver in the family! Reaching driving age is a major milestone for young people and for their parents too. A new driver s licence opens up
2018 Linking Study: Predicting Performance on the NSCAS Summative ELA and Mathematics Assessments based on MAP Growth Scores
 2018 Linking Study: Predicting Performance on the NSCAS Summative ELA and Mathematics Assessments based on MAP Growth Scores November 2018 Revised December 19, 2018 NWEA Psychometric Solutions 2018 NWEA.
COMPARING THE GAP ACCEPTANCE AND TURN TIME PATTERNS OF NOVICE WITH EXPERIENCED DRIVERS FOR TURNS ACROSS TRAFFIC
 COMPARING THE GAP ACCEPTANCE AND TURN TIME PATTERNS OF NOVICE WITH EXPERIENCED DRIVERS FOR TURNS ACROSS TRAFFIC Eve Mitsopoulos-Rubens, Thomas Triggs & Michael Regan Monash University Accident Research
inter.noise 2000 The 29th International Congress and Exhibition on Noise Control Engineering August 2000, Nice, FRANCE
 Copyright SFA - InterNoise 2000 1 inter.noise 2000 The 29th International Congress and Exhibition on Noise Control Engineering 27-30 August 2000, Nice, FRANCE I-INCE Classification: 0.0 EFFECTS OF TRANSVERSE
NUMERICAL ANALYSIS OF IMPACT BETWEEN SHUNTING LOCOMOTIVE AND SELECTED ROAD VEHICLE
 Journal of KONES Powertrain and Transport, Vol. 21, No. 4 2014 ISSN: 1231-4005 e-issn: 2354-0133 ICID: 1130437 DOI: 10.5604/12314005.1130437 NUMERICAL ANALYSIS OF IMPACT BETWEEN SHUNTING LOCOMOTIVE AND
The MathWorks Crossover to Model-Based Design
 The MathWorks Crossover to Model-Based Design The Ohio State University Kerem Koprubasi, Ph.D. Candidate Mechanical Engineering The 2008 Challenge X Competition Benefits of MathWorks Tools Model-based
ENTUCKY RANSPORTATION C ENTER
 Research Report KTC-05-39/TA19-05-1F T K ENTUCKY RANSPORTATION C ENTER College of Engineering SOCIO-ECONOMIC ANALYSIS OF FATAL CRASH TRENDS (Final Report) Our Mission We provide services to the transportation
MAIDS Workshop. 01 April 2009
 MAIDS Workshop 01 April 2009 Road Safety: the Industry Strategy Improve the knowledge Safety Plan for Action: Integrated approach Act on the product Act on the human factor Act on the infrastructure Cooperate
Identification of Contributing Factors for Work Zone Crashes
 Identification of Contributing Factors for Work Zone Crashes Qing Wang Jian John Lu Zhenyu Wang Transportation Group Department of Civil and Environmental Engineering University of South Florida November
Effect of Sample Size and Method of Sampling Pig Weights on the Accuracy of Estimating the Mean Weight of the Population 1
 Effect of Sample Size and Method of Sampling Pig Weights on the Accuracy of Estimating the Mean Weight of the Population C. B. Paulk, G. L. Highland 2, M. D. Tokach, J. L. Nelssen, S. S. Dritz 3, R. D.
DRIVER CONTRIBUTING CIRCUMSTANCES
 DRIVER CONTRIBUTING CIRCUMSTANCES Primary Driver Contributing Circumstances Frequency Coded % of Total Failed to Give Full Time and Attention 3,943 4.4% Failed to Yield RightofWay 1,346 13.5% Too Fast
Automated Driving - Object Perception at 120 KPH Chris Mansley
 IROS 2014: Robots in Clutter Workshop Automated Driving - Object Perception at 120 KPH Chris Mansley 1 Road safety influence of driver assistance 100% Installation rates / road fatalities in Germany 80%
ISA: The Research Evidence
 Institute for Transport Studies ISA: The Research Evidence Oliver Carsten Institute for Transport Studies University of Leeds UK Speed Speed remains a very important risk factor. It has a greater effect
2018 Linking Study: Predicting Performance on the TNReady Assessments based on MAP Growth Scores
 2018 Linking Study: Predicting Performance on the TNReady Assessments based on MAP Growth Scores May 2018 NWEA Psychometric Solutions 2018 NWEA. MAP Growth is a registered trademark of NWEA. Disclaimer:
Road Safety s Mid Life Crisis The Trends and Characteristics for Middle Aged Controllers Involved in Road Trauma
 Road Safety s Mid Life Crisis The Trends and Characteristics for Middle Aged Controllers Involved in Road Trauma Author: Andrew Graham, Roads and Traffic Authority, NSW Biography: Andrew Graham has been
Contributory factors of powered two wheelers crashes
 Contributory factors of powered two wheelers crashes Pierre Van Elslande, IFSTTAR George Yannis, NTUA Veronique Feypell, OECD/ITF Eleonora Papadimitriou, NTUA Carol Tan, FHWA Michael Jordan, NHTSA Research
Naturalistic Research on Powered Two-Wheelers. Martin Winkelbauer (KFV) Martin Donabauer (KFV) Alexander Pommer (KFV) Reinier Jansen (SWOV)
 Martin Donabauer (KFV) Alexander Pommer (KFV) Reinier Jansen (SWOV)") Naturalistic Research on Powered Two-Wheelers Martin Winkelbauer (KFV) Martin Donabauer (KFV) Alexander Pommer (KFV) Reinier Jansen (SWOV) 2017 03 07 UDRIVE Webinar Two worlds two populations 2 Typical
Naturalistic Research on Powered Two-Wheelers Martin Winkelbauer (KFV) Martin Donabauer (KFV) Alexander Pommer (KFV) Reinier Jansen (SWOV) 2017 03 07 UDRIVE Webinar Two worlds two populations 2 Typical
Analysis of Speeding Behaviour During Approaching the U-Turn Facility Road Segment Based On Driving Simulation Test
 Analysis of Speeding Behaviour During Approaching the U-Turn Facility Road Segment Based On Driving Simulation Test M. S. Nemmang 1, R. Rahman 1,*, M. M. Rohani 1, N. Mashros 2, and J. Md Diah 3 1 Department
A R T I C L E S E R I E S
 Comprehensive Safety Analysis Initiative A R T I C L E S E R I E S BASIC 1: UNSAFE DRIVING Staying on top of safety and compliance under the CSA 2010 initiative will mean getting back to the BASICs. This
Traffic Safety Measures with Image Processing Sensors And Analysis of Vehicle Behaviors
 Traffic Safety Measures with Image Processing Sensors And Analysis of Vehicle Behaviors Hideto Hatakenaka,* Takayuki Hirasawa,* Hiroyuki Mizutani,** Yuji Munehiro*** * Intelligent Transport System Division,
Eco-driving simulation: evaluation of eco-driving within a network using traffic simulation
 Urban Transport XIII: Urban Transport and the Environment in the 21st Century 741 Eco-driving simulation: evaluation of eco-driving within a network using traffic simulation I. Kobayashi 1, Y. Tsubota
Poul Greibe 1 CHEVRON MARKINGS ON FREEWAYS: EFFECT ON SPEED, GAP AND SAFETY
 Poul Greibe 1 CHEVRON MARKINGS ON FREEWAYS: EFFECT ON SPEED, GAP AND SAFETY Submission: 13 October 2009 Revised: 2 Marts 2010 Word count: 3130 + 8 tables/figures = 5130 words. Author: Mr. Poul Greibe M.Sc.,
Preliminary Study of the Response of Forward Collision Warning Systems to Motorcycles
 Preliminary Study of the Response of Forward Collision Warning Systems to Motorcycles Vorläufige Studie über Kollisionswarnsysteme mit Blick auf Motorräder John F. Lenkeit, Terrance Smith PhD Dynamic Research,
AN OPTIMAL PROFILE AND LEAD MODIFICATION IN CYLINDRICAL GEAR TOOTH BY REDUCING THE LOAD DISTRIBUTION FACTOR
 AN OPTIMAL PROFILE AND LEAD MODIFICATION IN CYLINDRICAL GEAR TOOTH BY REDUCING THE LOAD DISTRIBUTION FACTOR Balasubramanian Narayanan Department of Production Engineering, Sathyabama University, Chennai,
Methods and Metrics of Evaluation of an Automated Real-time Driver Warning System Transportation Research Board Paper No.
 Methods and Metrics of Evaluation of an Automated Real-time Driver Warning System Transportation Research Board Paper No. TRB 05-1423 C. Arthur MacCarley California Polytechnic State University San Luis
Draft Project Deliverables: Policy Implications and Technical Basis
 Surveillance and Monitoring Program (SAMP) Joe LeClaire, PhD Richard Meyerhoff, PhD Rick Chappell, PhD Hannah Erbele Don Schroeder, PE February 25, 2016 Draft Project Deliverables: Policy Implications
I-95 Corridor-wide safety data analysis and identification of existing successful safety programs. Traffic Injury Research Foundation April 22, 2010
 I-95 Corridor-wide safety data analysis and identification of existing successful safety programs Traffic Injury Research Foundation April 22, 2010 Overview Background Methodology Purpose Crash analysis
Automated Vehicles: Driver Knowledge, Attitudes & Practices
 Automated Vehicles: Driver Knowledge, Attitudes & Practices Ward Vanlaar, Ph.D. Chief Operating Officer - TIRF 13 th PRI World Congress Tunis, May 3-7, 2017 Overview > Background > Methodology > Knowledge,
P5 STOPPING DISTANCES
 P5 STOPPING DISTANCES Practice Questions Name: Class: Date: Time: 85 minutes Marks: 84 marks Comments: GCSE PHYSICS ONLY Page of 28 The stopping distance of a car is the sum of the thinking distance and
THE INFLUENCE OF VISIBILITY CONDITIONS IN HORIZONTAL ROAD CURVES ON THE EFFICIENCY OF NOISE PROTECTION BARRIERS
 DOI: 10.1515/rjti-2015-0016 ROMANIAN JOURNAL THE INFLUENCE OF VISIBILITY CONDITIONS IN HORIZONTAL ROAD CURVES ON THE EFFICIENCY OF NOISE PROTECTION BARRIERS Tamara Džambas, Assistant, MCE, University of
Excessive speed as a contributory factor to personal injury road accidents
 Excessive speed as a contributory factor to personal injury road accidents Jonathan Mosedale and Andrew Purdy, Transport Statistics: Road Safety, Department for Transport Summary This report analyses contributory
Investigation into the effect on safety of the assistance factor of speed pedelecs in sub-category L1e-B November 2018.
 Investigation into the effect on safety of the assistance factor of speed pedelecs in sub-category L1e-B November 2018 Introduction TRL have been asked by the European Commission to investigate whether
REDUCING THE OCCURRENCES AND IMPACT OF FREIGHT TRAIN DERAILMENTS
 REDUCING THE OCCURRENCES AND IMPACT OF FREIGHT TRAIN DERAILMENTS D-Rail Final Workshop 12 th November - Stockholm Monitoring and supervision concepts and techniques for derailments investigation Antonella
AEBS/LDWS General Safety Regulation. ACEA discussion paper. Paris, June Renzo Cicilloni. Director Safety
 AEBS/LDWS-01-11 General Safety Regulation ACEA discussion paper Paris, 24-26 June 2009 Renzo Cicilloni Direcr Safety General Safety Regulation Legislative Framwork Focus of the EU Road traffic safety policy:
HEAVY VEHICLE DRIVERS INVOLVED IN ROAD CRASHES IN SOUTH AUSTRALIA
 FACT SHEET HEAVY VEHICLE DRIVERS INVOLVED IN ROAD CRASHES IN SOUTH AUSTRALIA OVERVIEW Heavy vehicles 1 travel more than 1.3 billion kilometres per year in South Australia. represent 8% of the kilometres
Driver behavior characterization in roundabout crossings
 Driver behavior characterization in roundabout crossings EWGT 2014, 17 TH MEETING OF THE EURO WORKING GROUP ON TRANSPORTATION, SEVILLE JULY, 4 TH, 2014 Ana Bastos Silva abastos@dec.uc.pt Sílvia Santos