TABLE OF CONTENTS INTRODUCTION
|
|
|
- Jocelin Cobb
- 6 years ago
- Views:
Transcription
1
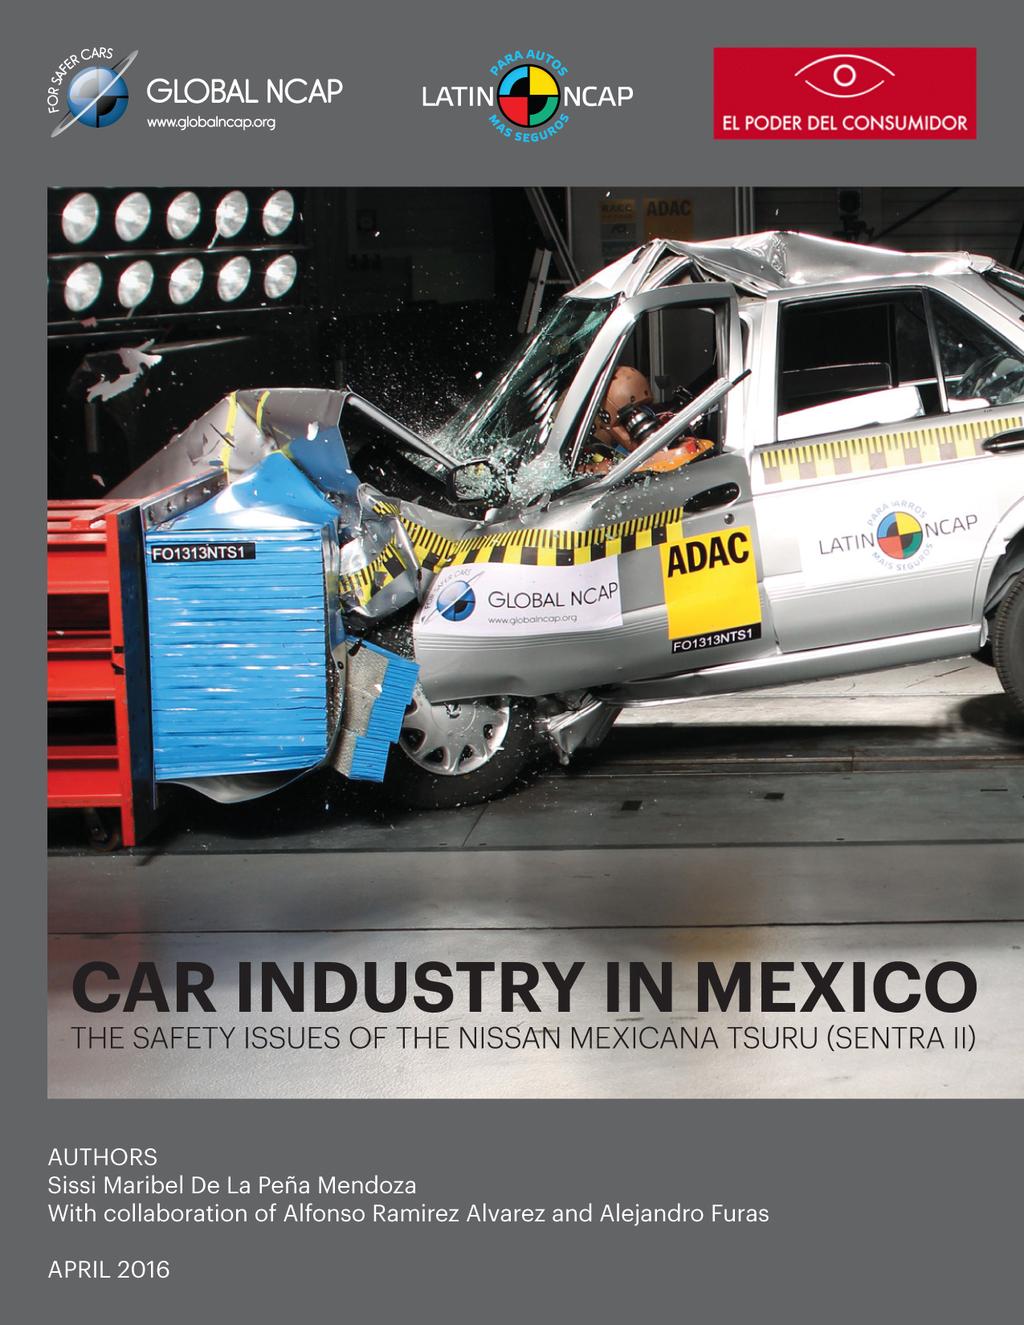
2 TABLE OF CONTENTS INTRODUCTION 3 BACKGROUND 4 The Mexican Car Industry 4 Mexican Car Industry - Annual Production 4 Exports Mexican Car Industry 6 Domestic Market Share by brand (light vehicles) - Mexican Car Industry 7 NISSAN MEXICANA - CAR INDUSTRY 10 Nissan in Mexico 10 The Tsuru (Sentra) 11 Tsuru s safety issues 13 The Tsuru as the vehicle with the worst index fatality score in Mexico 13 The scale of a Tsuru involved in fatal accidents and number of deaths 16 Estimated number of deceased people in Mexico in accidents that involved a Tsuru, 16 Estimated number of Deadly accidents where a Tsuru was involved 17 CONCLUSIONS 18 ANNEX I 19 ANNEX II 20 Calculating the probability of having an accident at a national level (i) 20 Calculating the probability of having a Tsuru involved in an accident (ii) 21 Calculating the probability to have a fatal accident in a Tsuru given the fact that there was a Tsuru accident (iii) 21 Calculating the probability of experiencing a fatal accident in a Tsuru given the fact that there was an accident at a national level 22 i
3 Index of Graphs Figure 1 Total vehicle production in Mexico by type of production...5 Figure 2. Exports Car vs. Oil Industry Figure 3 Market share of the vehicle production in Mexico by region...7 Figure 4 Car models for the most significant brands established in the country...8 Figure 5 Market share participation by brand for light vehicles sold in the country...9 Figure 6 Best Sellers Cars in Mexico Figure 7 Nissan Mexico production by type of vehicle...11 Figure 8 - Light Vehicle Production Plants by brand...19 Index of Figures Table 1 - Main World Light Vehicle Exporters...6 Table 2 Nissan Mexico vehicle production by year and by type...10 Table 3 Fatal accidents per every 1,000 accidents by year and by brand for the top three highest index of accident rate...14 Table 4 Comparison - Number of X- brand fatal accidents and deaths per 1,000 X- brand accidents by year...15 Table 5 - Probability of having a Fatal accident in a Tsuru given the fact that there was an accident at a national level...16 Table 6 Estimated deceased people in accidents that involved a Tsuru...16 Table 7 Estimated deadly accidents where a Tsuru was involved...17 Table 8 Calculation of total number of fatal accidents occurred in the country Table 9 Probability of experiencing a fatal accident at a national level (i)...20 Table 10 Probability for a Tsuru to be involved in an accident (ii)...21 Table 11 Probability of experiencing a fatal accident in a Tsuru given the fact that a Tsuru accident occurred (iii)...22 Table 12 Probability of having a Fatal accident in a Tsuru given the fact that there was an accident at a national level...23 ii
4 INTRODUCTION This document describes the results of an analysis regarding the vehicle industry in Mexico and is particularly focussed on the Nissan Tsuru. This study aims to identify the historical annual production of Nissan vehicles and, in particular, the Tsuru in Mexico. This will provide a general overview to understand the Tsuru s impact on the Mexican car industry and market as one of the top sellers. In addition, this study also aims to assess the safety issues related to this vehicle in order to identify the number of people killed in Mexico in accidents that involved a Tsuru, and the number of deadly accidents where a Tsuru was involved. Relevant sources of information have been analysed and correlated in order to identify the required outputs. All analysis, graphs and tables presented in this document have used data from the following sources: The National Institute of Statistics and Geography (INEGI 1 ) The Mexican Association for the Automobile Industry (AMIA 2 ) The Mexican National Commission for Insurance and Bonds (CNSF 3 ); The 3 rd CONAPRA report for road safety accidents in Mexico 4 ; and A technical monograph from the car industry published by the Mexican Ministry of Economy 5 This document provides a brief overview of the importance of the car industry in the Mexican economy. It describes the establishment of Nissan Mexicana, its production and top seller cars including the Tsuru (Sentra II). It also includes a thorough analysis of the safety issues concerning the Tsuru. Given the official national statistics and calculating probabilities, this report also estimates the minimum number of deaths and crashes observed in an accident involving a Tsuru. 1 INEGI Instituto Nacional de Estadística y Geografía. 2 AMIA Asociación Mexicana de la Industria Automotriz. 3 CNSF Comisión Nacional de Seguros y Fianzas. 4 CONAPRA Comisión Nacional para la prevención de accidentes negocios/industria- y- comercio/informacion- sectorial 3
5 BACKGROUND The Mexican Car Industry The vehicle industry in Mexico dates back to The first vehicle manufacturing company established in Mexico was Ford Company in In 1935 General Motors started operations and, in 1938, Automex, which later became Chrysler, opened. All the vehicle manufacturing plants were established in Mexico to meet the domestic demand. In 1962, the Government issued a Decree to strengthen the domestic market. This Decree eliminated vehicle imports, imposed a minimum of auto- parts made in Mexico (60%) and set prices in the market to raise productivity. In 1977, a new Decree was issued to foster the automobile market as an export sector. The new Decree cut the minimum of auto- parts made in Mexico and established that 30% of the production of vehicles had to be exported. In 1990, the Former President, Carlos Salinas, issued a new Decree to authorize the imports of brand new vehicles. In 1994 the North- American Trade Agreement (NAFTA) came into effect. NAFTA reduced the import fees from 20% to 10% and eliminated them in 2004 and also reduced the margin of auto- parts made in Mexico to 29% in 1998 and eliminated the margin altogether in In 2004, the Former President, Vicente Fox, issued a new Decree to raise productivity and reduce costs in the automobile industry. The Decree promoted the foreign investment inflow and authorized the entry of new automobile manufacturers. By 2013 the car industry in the country had reached a historic figure in terms of volume production, increasing from 1, 055 million units in 1993 to approximately 3 million in In 2009 the industry experienced a decrease in production of (- 21%) in relation to 2008, this was associated to the global financial crisis. However the sector experienced a strong improvement in production in the following years with an annual increase of 53%, 22%, 12% and 10% for 2010, 2011, 2012 and 2013 respectively. The success of the following years after the recession may be associated with the commercial policies the Mexican government implemented that encouraged vehicle trade where more than 82% of the total vehicle production in the country is for units that get exported. Mexican Car Industry - Annual Production The following graph shows the total vehicle production for the last two decades. It is worth noticing the strong link that this industry has in the NAFTA region (see figures for 1994). The automotive industry is without doubt NAFTA s most representative success story. 4
6 Figure 1 Total vehicle production in Mexico by type of production Source: Graph elaborated with data from the Mexican Association for the Automobile Industry (AMIA) The car industry in Mexico is the most important and dynamic sector in the country. In 2015 the car industry represented 20.3% of the total national exports that reached US 380,201 million 6, compared to 19% in In the last 20 years (since 2013) the car industry has increased its contribution to the Mexican economy by 8.5 times, compared with only 1.59 for oil industry in the same period. The car industry in México has been a strategic driver for the Mexican economy. Exports from this industry are the greatest contributor to foreign currency in the country, above the oil industry. In 2015, car industry exports represented 25.5% of total exports and 30.9% 7 of the manufacturing sector. 6 INEGI Trade Balance December Monography in Car Industry. February Mexican Ministry of Economy 5

7 Figure 2. Exports Car vs. Oil Industry Source: Ministry of Economy with data from the Mexican Central Bank. The Mexican Ministry of Economy reported that in 2013 it ranked 4 th as a world light vehicle exporter, only below South Korea and above Spain. According to data from the International Organization of Motor Vehicle Manufacturers (OICA), in 2015, Mexico ranked as the 6 th largest vehicle producer in the world, and in Table 1 Main World Light Vehicle Exporters million units Rank Country % change 1 China % 2 USA % 3 Japan % 4 Germany % 5 South Korea % 6 Mexico % 7 Spain % 8 Brazil % 9 Canada % 10 France % 11 United Kingdom % 12 Check Republic % Source: OICA Exports Mexican Car Industry The following graph shows that most of the vehicle units produced in Mexico are exported to the US and Canada. This represents a share of 82.8% from the total production in An average rate of exports to US and Canada has remained constant and over 70% for the last nine years. 6
 Domestic Market Share by brand")
8 For the same year, Figure 3 shows that exports to Latin America reached 8.2% and Europe and Asia with a share of 5.3% and 2.9% respectively. Figure 3 Market share of the vehicle production in Mexico by region Source: Graph elaborated with data from the Mexican Association for the Automobile Industry (AMIA) Domestic Market Share by brand (light vehicles) - Mexican Car Industry There are 19 production car plants in the country across 11 states. Currently, Mexico produces more than 50 car models of light trucks and vehicles as shown in the following chart. Nissan is the brand with the highest number of car models in the production line. This is the result of Nissan s successful strategy to provide affordable, low cost and convenient vehicles. 7

9 Figure 4 Car models for the most significant brands established in the country The following graph shows the market share of the main brands producing light vehicles that are sold in the country for the period 2008 to Among the most significant brands, Nissan has reached a considerable market share of more than 25% for more than a decade, followed by General Motors and Volkswagen. 8
 For the last three years, the top three selling cars in Mexico included the Aveo, Versa and Tsuru.")

10 Figure 5 Market share participation by brand for light vehicles sold in the country Source: Graph elaborated with data from the Mexican Association for the Automobile Industry (AMIA) For the last three years, the top three selling cars in Mexico included the Aveo, Versa and Tsuru. This indicates that Nissan s vehicles are still very in much favour in the Mexican market. The Tsuru in particular remains popular among new buyers looking for convenient and low cost cars. Figure 6 Best Sellers Cars in Mexico Source: Graph elaborated with data from the Mexican Association for the Automobile Industry (AMIA) 9
 and the Aguascalientes plant (with the production of the Platina, Versa/Tiida,")
11 NISSAN MEXICANA - CAR INDUSTRY Nissan in Mexico Nissan Mexicana was established in Mexico in It owns two plants: the Cuernavaca vehicle production plant (with the production of the Tsuru, Versa/Tiida and Pickup) and the Aguascalientes plant (with the production of the Platina, Versa/Tiida, Sentra, Renault Clio) as shown in Figure 8 in Annex I. In addition it owns three development centres. In 1966 Nissan Mexicana commenced vehicle production at the Cuernavaca plant, as Nissan's first overseas plant. By 1971 it commenced export to Latin America and the USA in The company acquired the number one market share in Mexico by 1987, the success promoted the engine production at the Aguascalientes plant in 1983 and a full vehicle production by In 2007 it initiated exports to Europe. According to the Mexican Association for the Automobile Industry Statistics, Nissan Mexicana had more than 40% of the market share in October 2013 for the production of light vehicles (ranked the first in the country). One of Nissan's characteristics in Mexico is its high sales efficiency and one of its most successful cars was the Sentra introduced in Mexico in In Mexico the Sentra (B11 model) was called the Datsun/Nissan Tsuru, the first three generations of the Sentra were known as the Tsuru (Japanese for crane) introduced in The 1994 model is still sold under that name, having gone through three model changes, alongside the current Sentra. Table 2 Nissan Mexico vehicle production by year and by type The following graph shows Nissan Mexico production by type of vehicle. The chart demonstrates that the Tsuru is the most popular vehicle for Nissan Mexico. Its production reached the highest volume in 2001 and it remains one of the top sellers for Nissan in 2013, and it is also among the top sellers in the Mexican internal market alongside the Versa. 10
 was launched as a replacement of the Datsun 160J under the name \"Tsuru\".")
12 Figure 7 Nissan Mexico production by type of vehicle Source: Graph elaborated with data from the Mexican Association for the Automobile Industry (AMIA) The Tsuru (Sentra) The Datsun 160J was the first Nissan vehicle introduced in Mexico. In 1984 the first Nissan Sentra (B11/ ) was launched as a replacement of the Datsun 160J under the name "Tsuru". The Tsuru was quickly accepted by the Mexican market as a comfortable and affordable choice of car, however it did not replace the VW Sedan as the top- selling car in Mexico. A second- generation Tsuru was launched in 1989 (B12/ ), with a more square- shaped and larger design. Neither generation managed to replace the Tsuru to become the best- selling car in Mexico. The third generation Tsuru (the Sentra III, B13/1992- ongoing) was introduced in This Tsuru featured a more rounded 1990s type design scheme. Soon the third generation Tsuru came to be known as powerful and comfortable, yet affordable. With the Chevrolet Corsa in 1994, however, the Tsuru had a new rival. It didn't take long for it to overtake the Chevy, and soon the Sedan. It reached the top in 1998 and it didn't missed until 2005, with the VW Pointer. The Nissan Platina was thought to be its successor, but the incredible volume of Tsuru sales kept the Platina further down in the rankings. The Renault- based Platina remains to date in the top
13 The Mexican- built Sentra B13 is still sold in Mexico as well as parts of Asia, Africa, the Middle East, Central America and South America. Tsuru vehicles destined for the Mexican market were modified by Nissan de Mexico specifically for the Mexican market and for the most part are identical to the 1991 model except for a new Renault clutch/transmission, updated Mexican made electronic systems and minor cosmetic and ergonomic upgrades. The Tsuru was the most popular car in Mexico from 1997 until 2011 when it was surpassed by the Mexican made Volkswagen Jetta. The Tsuru includes a catalytic converter, which is compulsory in Mexico and South America. Its affordable price, relatively good fuel economy, easy to fix and find spare parts make it popular among local taxi drivers and low income families in Mexico, South America, Central America, and the Caribbean. The Tsuru remains the most popular choice for city taxi cab drivers in Mexico (Airport and hotel taxis usually consist of higher end vehicles) and are a replacement for the VW Beetle. Much like its predecessor, Tsurus have been sighted in the Southwest United States since Mexican nationals can operate them in the USA as long as they have the valid registration documents (they are illegal for sale and/or export into the USA since they do not meet the DOT's safety requirements e.g. airbags and electronic stability control). 12
14 Tsuru s safety issues Regarding the safety of the B13 model (Tsuru), this study analyses and correlates information from the most relevant sources of data in relation to road accidents and crash fatalities where a Tsuru has been involved. The Tsuru as the vehicle with the worst index fatality score in Mexico Official National Statistics (INEGI & CENAPRA) data only provide information of total fatal accidents but this data is not segregated by type/brand of vehicle (this database provides the number of accidents and fatalities by road in a specific region). Therefore, this report also consulted information provided by insurance companies, which are collected and published by the Mexican National Commission for Insurance and Bonds (CNSF). Note: it is important to highlight that CNSF only provides information from insured vehicles (not all vehicles in the country) and so merging with INEGI information was necessary. In order to identify the fatality score of a certain brand/type of vehicle, both databases were merged. Only data from the period of 2007 to 2012 allowed to match both sources of information. The results can be translated as: The probability or the index fatality score for a certain type of vehicle involved in an accident. The index fatality score provides information about the safety of a car. Meaning that in a given year, the Tsuru experienced the highest index of accidents (Table 3) An index measure allows the comparison across all vehicles. So the rank/score is not determined by the number of vehicles but by the ratio of X- brand fatal accidents per 1,000 to x- brand total accidents experienced at a national level It is worth highlighting that if two cars have the same number of fatal accidents, it is not possible to conclude that the safety protection in both cars is similar. However, the number of fatal accidents and deaths per 1,000 accidents provide statistical information about how the safety protection prevents a fatal accident in a specific car. 13
15 Table 3 Fatal accidents per every 1,000 accidents by year and by brand for the top three highest index of accident rate Year Highest fatality score Type of Vehicle Brand Number of x- brand fatal accidents per 1,000 x- brand accidents Number of x- brand drivers deaths per 1,000 x- brand accidents 1st Tsuru NISSAN nd Chevy General Motors rd Tsuru NISSAN st Tsuru NISSAN nd Sentra NISSAN rd Jetta Mod 99_11 (1) Volkswagen / (1) 2.71 (2) Chevy (2) General Motors 1st Tsuru NISSAN nd Sentra NISSAN rd Jetta Mod Volkswagen st Tsuru NISSAN nd Sentra NISSAN rd Jetta Mod Volkswagen st Tsuru NISSAN nd Jetta Mod Volkswagen rd Sentra NISSAN st Tsuru NISSAN nd Sentra NISSAN st Tsuru NISSAN nd Sentra NISSAN rd Jetta Mod Volkswagen st Vectra General Motors nd Tsuru NISSAN rd Micra NISSAN Source: results obtained with data from the National Commission for Insurance (CNSF) and INEGI Note: for the years of 2007 to 2010 the highest rank was for others (a variety of cars aggregated in others ), but these are not properly classified by the CNSF and comparison with single type of cars is not possible. Therefore, are not included in this rank. Note: 2013 information used a different universe of vehicle due to a new database, so a ranking should not be compared From the above it can be said that: In 2013 for every 1,000 Tsuru accidents occurred, the number of fatal Tsuru accidents was In for every 1,000 Tsuru accidents occurred, the number of fatal Tsuru accidents was In 2012 for every 1,000 Tsuru accidents occurred, the number of (driver) deaths was 7.23 In 2008 for every 1,000 Jetta accidents occurred, the number of fatal Jetta accidents was In 2008 for every 1,000 Chevy accidents occurred, the number of (driver) deaths was
16 For most of all the years analysed, the Tsuru experienced the highest index fatality score for the number of fatal accidents where it was involved. From the brands that result in the highest index for number of driver deaths, it can be concluded that: the Tsuru is the vehicle within the top three highest index of fatal accidents among all brands 8. Comparing the ranking score of the Tsuru with other brands, the following table shows that: In for every 1,000 Tsuru accidents that occurred, the number of fatal Tsuru accidents was In for every 1,000 Peugeot accidents that occurred, the number of fatal Peugeot accidents was 0.82 Table 4 Comparison - Number of X- brand fatal accidents and deaths per 1,000 X- brand accidents by year Year 2007 (Tsuru/NISAAN) 2007 (Solara/Toyota) Number of fatal X- brand accidents per 1,000 Total Tsuru accidents Number of deaths (driver) per 1,000 Total accidents Number of deaths (passengers) per 1,000 total accidents (Tsuru/NISAAN) (PEUGEOT) Source: Data obtained with information from the Mexican National Commission for Insurance and Bonds (CNSF) in addition to INEGI data. From all above it can be concluded that: From 2007 to 2013 the Tsuru was one of the most unsafe vehicle when it is involved in an accident. The Tsuru is the vehicle with the worst index fatality score. 8 This analysis includes all brands reported by the insurance companies 15
17 The scale of a Tsuru involved in fatal accidents and number of deaths In order to identify the number of deceased people in accidents that involved a Tsuru and the number of deadly accidents where a Tsuru was involved, it was necessary to identify the probability of a Tsuru being involved in a fatal accident compared to the number of fatal accidents occurring at a National Level. The calculation of this probability is described in greater detail in Annex II, but generally speaking we used data to identify the probabilities: i. To have an accident at a national level; ii. To have an accident where a Tsuru was involved; and iii. To experience a fatal accident in a Tsuru given the fact that a Tsuru was involved. Analysis of the probabilities shown in the following table are described in detailed in annex II. Table 5 - Probability of having a Fatal accident in a Tsuru given the fact that there was an accident at a national level Year Probability (ii) Probability (iii) Having Probability for a Tsuru to get Probability (i) A Having a Tsuru a fatal accident in a Tsuru involved in an fatal accident fatal accident at a involved in an given there was a Tsuru given there was a fatal national level accident accident accident at a National Level % 3.224% 2.957% 5.92% % 3.224% 2.610% 4.94% % 3.273% 2.800% 5.00% % 2.242% 2.021% 2.52% % 2.524% 2.771% 3.64% % 2.593% 1.823% 2.62% Estimated number of deceased people in Mexico in accidents that involved a Tsuru, Once the probability of experiencing a fatal accident in a Tsuru is known and the number of fatal accidents at a national level is established, it will be possible to ascertain the number of killed people in an accident that involved a Tsuru. These figures represent the minimum number of deaths, it is understood that figures may be much higher depending on national deaths reported by officials sources. Year Table 6 Estimated deceased people in accidents that involved a Tsuru Number of deaths national level (CONAPRA) Probability to have an accident in a Tsuru given the accident is fatal. Number of deaths on Tsuru accidents , % , % , % , % , % ,681 (a) 2.62% 438 Total 4102 Average 684 Source: results obtained with data from CONAPRA, CNSF, INEGI and IMT Note (a): Lacking data for the number of deaths at a national level in It was assumed this year as the average of 2007 to
18 Estimated number of Deadly accidents where a Tsuru was involved Similarly, the minimum number of deadly accidents involving a Tsuru was calculated as: Table 7 Estimated deadly accidents where a Tsuru was involved Year Number of fatal accidents (CONAPRA)/INEGI) 1 Probability to have an accident in a Tsuru given the accident is fatal. Number of fatal accidents where a Tsuru is involved , % , % , % , % , % , % 196 Total 2011 Average 335 Note (1): National data for urban roads and highways. Sources: INEGI/CONAPRA From the data above it can be concluded that: Between 2007 and 2012 there were 4102 deceased people after being in an accident involving a Tsuru Between 2007 and 2012 there were 2011 fatal crashes that involved Tsurus (the killed people might or might not have been passengers of the Tsurus) 17
19 CONCLUSIONS The car industry in Mexico represents one of the most successful industries in the country; The car industry in Mexico has increased from a total production of more than 1 million in 1993 to more than 3 million in 2015; In 2013 car industry exports represented 25.5% of total exports in the country; In 2015, Mexico ranked as the 6st largest vehicle producer in the world; In 2013, Mexico ranks 4th as a world light vehicle exporter, only below South Korea and above Spain; In 2015, most of the vehicle production in Mexico was for exports from which 82.8% is for USA and Canada, 8.2% for LATAM and 5.3% for Europe.; Among the most relevant brands selling light vehicles in the country, Nissan has dominated the Mexican market with more than 24%% of the total domestic market between 2008 and 2015; The top three car sellers in México for the month in between 2013 and 2015 were: Aveo, Versa and Tsuru; The Sentra II or Tsuru B13 is still the top seller car for Nissan Mexicana; Regarding the safety issues of the Tsuru collected data, statistics and probabilities show that: From 2007 to 2012 the Tsuru was the most unsafe vehicle when it gets involved in an accident. The Tsuru is the vehicle with the worst index fatality score. The number of deceased people in accidents that involved a Tsuru and the number of deadly accidents were a Tsuru was involved: o Between 2007 and 2012 there were 4102 deceased people after being in an accident involving a Tsuru; an average of 684 per year. o Between 2007 and 2012 there were 2011 fatal crashes that involved Tsurus (the killed people might or might not be passengers of the Tsurus); an average of 335 annually. 18

20 ANNEX I Figure 8 - Light Vehicle Production Plants by brand 19
21 ANNEX II Calculating the probability of having an accident at a national level (i) In order to identify the probability of having an accident at a national level, it was necessary to identify the total number of fatal accidents at a national level in the first instance. Total number of fatal accidents occurred at a national level in a given year where data collected from INEGI for urban and suburban areas were added to data from CONAPRA for Federal Highways (with the assumption that for every fatal accident there were 2 road deaths). This assumption provides a conservative position given the fact that INEGI doesn t report fatal accidents in Federal Highways (or rural areas). This assumption also considers that fatal accidents in Federal Highway are more likely to have at least one death in comparison with urban accidents due to the speed and kind of impact these accidents usually experience. Therefore Total fatal accidents at a national level are the sum of (1) + (3) as shown in the following table. Table 8 Calculation of total number of fatal accidents occurred in the country Year Number of accidents in urban and suburban areas (1) Number of deaths in Federal Highways (2) Number of fatal accidents in Federal Highways (3) Total fatal accidents at a national level (4) (1) Source: INEGI (2) Source: CONAPRA (3) Source: Assuming that for every one fatal accident, two road deaths occurred Therefore, the probability of having a fatal accident at a national level is obtained by dividing the number of fatal accidents by the total number of accidents at a national level. Table 9 Probability of experiencing a fatal accident at a national level (i) Year Number of accidents at a national level (5) Number of fatal accidents in urban, suburban and federal highways (Table 8) Probability of having a fatal accident at a national level (i) ,830 8, % ,814 8, % ,063 8, % ,106 8, % ,087 7, % ,627 7, % (5) Source: CONAPRA 20
22 Calculating the probability of having a Tsuru involved in an accident (ii) It is necessary to know the likelihood for a Tsuru to be involved in an accident. This was obtained by dividing the total number of accidents registered by the CNSF by the number of Tsuru accidents. Table 10 Probability for a Tsuru to be involved in an accident (ii) Year Number of total accidents (CNSF) (6) Number of accidents where a Tsuru is involved (CNSF) Probability of having a Tsuru involved in an accident (ii) ,641 4, % ,188 5, % ,585 5, % ,327 5, % ,951 6, % ,392 7, % (6) Source: CNSF includes only accidents involving light vehicles Calculating the probability to have a fatal accident in a Tsuru given the fact that there was a Tsuru accident (iii) Available data for the period of 2007 to 2012 allowed the calculation of the probability of the Tsuru to be involved in a fatal accident given that an accident occurred. Available data from CNSF provides information about car accidents classified by car model but it does not provide information about the fatality of the accidents. However, it is possible to identify the location where the accident occurred. Information from INEGI and CONAPRA informs about the fatality of the accident classified by municipality but they only show aggregate information about the type of vehicle such as light vehicle, heavy trucks, among others. From the information available and to detrmine the probability of experiencing a fatal accident in a Tsuru given the fact that an accident occurred were a Tsuru was involved: 1. The number of fatal accidents by private light vehicles was separated from INEGI and CONAPRA information classified by municipality. 2. From CNSF data, it was possible to identify by municipality the proportion of accidents by car model. 3. The number of fatal accidents by car model given an accident occurred in a municipality is the proportion of accidents in a municipality by car model multiply by the number of fatal accidents in a municipality. For instance, if a municipality there are 100 fatal car accidents according to INEGI and CONAPRA but the data from CNSF shows that only two types of cars (A and B) had at least one accident. Let s say that car A had 120 accidents 21
23 in this municipality and car B had 80 accidents in the same municipalities. The number of fatal car accidents by Car A is 60 = 100 * 120 / 200 where 120/200 represents the proportion of accidents in a municipality by Car A; the number of fatal car accidents by Car B is 40 using the same procedure. 4. The sum of the number of fatal accidents by car model over the municipalities represents the number of fatal accidents by car model at national level. 5. To determine the proportion of accidents (Fatal and no- Fatal accidents), the same procedure was applied except that the total number of accidents was included in point The probability of experiencing a fatal accident in a Tsuru conditional on an occurred Tsuru accident is the ratio between the number of fatal accidents by Tsuru at national level and the number of accidents by Tsuru national level. This methodology allows identifying the fatal accident probability by car model conditional on an occurred accident (fatal and non- fatal accident). The following table shows the results: Table 11 Probability of experiencing a fatal accident in a Tsuru given the fact that a Tsuru accident occurred (iii) Year Probability of experiencing a fatal accident in a Tsuru given the fact that there was a Tsuru accident (iii) % % % % % % Calculating the probability of experiencing a fatal accident in a Tsuru given the fact that there was an accident at a national level To determine this probability, we applied the conditional probability theory. Let s denote the probability of a fatal accident at national level as Pr(F), the probability of having a Tsuru involved in an accident as Pr(AT), probability of having a fatal accident in a Tsuru given an occurred Tsuru accident as Pr(FT AT) where FT represents the Fatal accident of a Tsuru and AT represents an accident in a Tsuru and finally let s denote the probability for a Tsuru get involved in a fatal accident given there was an accident as Pr(FT A) where A represents an occurred accident. By probability theory: Where Pr(FT and AT) represents the joint Probability of experiencing a Fatal Accident in a Tsuru and experiencing an accident in a Tsuru that it is equals to Pr(FT) since in order to have a fatal accident it is necessary to have an accident. 22
24 Therefore, it is possible to compute Pr(FT A) by the expression above: Pr(AT) is estimated as the ratio of the number of Tsuru accidents at national level to the total number of accidents according to the CNSF because it is the only available data that allows to identify the number of accidents by car model Pr(F) is estimated as the ratio of number of fatal accidents to the number of accidents at national level reported by INEGI and CONAPRA. Table 12 Probability of having a Fatal accident in a Tsuru given the fact that there was an accident at a national level Year Probability (i) A fatal accident at a national level Probability (ii) Having a Tsuru involved in an accident Probability (iii) Having a fatal accident in a Tsuru given there was a Tsuru accident Probability for a Tsuru to get involved in an fatal accident given there was a fatal accident at a National Level % 3.224% 2.957% 5.92% % 3.224% 2.610% 4.94% % 3.273% 2.800% 5.00% % 2.242% 2.021% 2.52% % 2.524% 2.771% 3.64% % 2.593% 1.823% 2.62% Source: results obtained with data from CONAPRA, CNSF, INEGI and IMT 23
25 24
Industria Nacional De Autopartes, A.C.
 VISION: Being the most important Organization representing companies in the automotive parts sector with manufacturing interests in Mexico. MISSION: Supporting growth and sustainable development of its
NAFTA and the Mexican Automotive Industry Eduardo J. Solís Sánchez
 NAFTA and the Mexican Automotive Industry Eduardo J. Solís Sánchez Executive President Asociación Mexicana de la Industria Automotriz December 7th, 2017 Automotive Sector Economic Relevance: Top generator
PRESS RELEASE 9:30 GMT, 20 th February 2018 London, UK
 PRESS RELEASE 9:30 GMT, 20 th February 2018 London, UK GLOBAL CAR SALES UP BY 2.4% IN 2017 DUE TO SOARING DEMAND IN EUROPE, ASIA-PACIFIC AND LATIN AMERICA Analysis of 52 markets found that 86.05 million
210 Index. diesel fuel Brazil, 73 Mexico, 99, 108 Thailand, 171, , 183n5 Turkey, 54 7 see also fuel prices
 Index AMIA (Mexican Association of the Automotive Industry), 90, 108 automobile demand ageing of population, 9 emerging economies, 206 7 financing, 8 post-recession, 1 2 role of income distribution and
Automotive industry in Colombia
 Automotive industry in Colombia Table of Contents Automotive industry in Colombia TABLE OF CONTENTS Overview 07 Changes in worldwide vehicle production by region 2013-2017 08 South America: number of new
Mercedes-Benz: Best Sales Result for the Month of June in Company History Up 13 Percent
 In the following please find the release of the Mercedes-Benz Cars concerning worldwide vehicles sales in June 2010: Mercedes-Benz: Best Sales Result for the Month of June in Company History Up 13 Percent
Industria Nacional De Autopartes, A.C.
 VISION: Being the most important Organization representing companies in the automotive parts sector with manufacturing interests in Mexico. MISSION: Supporting growth and sustainable development of its
The Case for Mexico to Improve Vehicle Fuel Efficiency
 The Case for Mexico to Improve Vehicle Fuel Efficiency Feng An Energy and Transportation Technologies LLC Katherine Blumberg International Council on Clean Transportation Workshop on Sustainable Transport
The auto industry and NAFTAlinks between the U.S. and Mexico
 The auto industry and NAFTAlinks between the U.S. and Mexico U.S.-Mexico ties in the 21 st century: trade and immigration in a new era Federal Reserve Bank of Dallas May 12, 2017 Thomas Klier Senior Economist
THE GLOBAL AUTOMOTIVE INDUSTRY. Edited by. Paul Nieuwenhuis Cardiff University, UK. Peter Wells Cardiff University, UK. WlLEY
 THE GLOBAL AUTOMOTIVE INDUSTRY Edited by Paul Nieuwenhuis Cardiff University, UK Peter Wells Cardiff University, UK WlLEY Contents Notes on Contributors Series Preface Foreword xi xvii xix 1 Introduction
Valeo reports 14% growth in consolidated sales for third quarter 2011
 24.11 Valeo reports 14 growth in consolidated sales for third quarter 2011 Third quarter 2011-14 growth in consolidated sales (12 on a like-for-like basis 1 ) to 2,662 million euros - 17 growth in original
The trends driving Saudi Arabia s Commercial Vehicles market
 7 9 May 2017 Dubai World Trade Centre www.automechanikadubai.com The trends driving Saudi Arabia s Commercial Vehicles market Get to know the market This overview of Saudi Arabia s commercial vehicles
1959 March Production commences at Yulon Motor Co., Ltd. in Taiwan, the Company s first overseas KD factory.
 Corporate History 1980 July Nissan Motor Manufacturing Corporation U.S.A. is established. 1933 1940 1935 April The first car manufactured by a fully integrated assembly system rolls off the line at the
Honda Remains the Most Satisfying Brand to Own in France
 and L Automobile Magazine Report: Toyota, BMW, Honda and Peugeot Capture Top Model Awards in France Vehicle Customer Satisfaction Study Honda Remains the Most Satisfying Brand to Own in France PARIS: 22
Two Volkswagen Models and One Honda Model Receive Segment Awards; Toyota Ranks Highest among Brands
 Reports: Ongoing Costs Weigh Heavily on New-Vehicle Owners in Brazil, Particularly among Owners of Subcompact and Compact Models Two Volkswagen Models and One Honda Model Receive Segment Awards; Toyota
P anorama 12 Brazil automotive Guide 2008
 Panorama 12 Brazil Automotive Guide 2008 Although consolidated, and prominent amongst the largest global producers, the Brazilian automotive industry wants more: to be even better. The automotive industry
Money and banking. Flow of funds for the third quarter
 Statistical tables Money and banking Page S South African Reserve Bank: Liabilities... 2 South African Reserve Bank: Assets... 3 Corporation for Public Deposits: Liabilities... 4 Corporation for Public
About J.D. Power do Brasil About J.D. Power and Associates About The McGraw-Hill Companies Media Relations Contacts:
 Reports: Ongoing Costs Weigh Heavily on New-Vehicle Owners in Brazil, Particularly among Owners of Subcompact and Compact Models Two Volkswagen Models and One Honda Model Receive Segment Awards; Toyota
Mazda Motor Corporation June 17, 2011
 FY ENDING MARCH 2012 FINANCIAL FORECAST New MAZDA Demio 13-SKYACTIV Mazda Motor Corporation June 17, 2011 1 PRESENTATION OUTLINE FY ending March 2012 Forecast Updates of Framework for Medium- and Long-term
NAFTA and the North American auto industry
 NAFTA and the North American auto industry Thomas Klier Federal Reserve Bank of Chicago GACC Midwest Business Luncheon Series Schaumburg, IL August 2nd, 2017 Disclaimer The analysis and conclusions set
BMW Group posts record earnings for 2010
 10.03.2011 BMW Group posts record earnings for 2010 Profit before tax rises to euro 4,836 million Profit before financial result climbs to euro 5,094 million Automobiles segment reports EBIT of euro 4,355
Global Polybutadiene Rubber (BR) Market Study ( )
 Market Study ( )") Global Polybutadiene Rubber (BR) Market Study (2014 2025) Table of Contents 1. INTRODUCTION 1.1. Introduction to Polybutadiene Rubber Market Product Description Properties Industry Structure Value Chain
Global Polybutadiene Rubber (BR) Market Study (2014 2025) Table of Contents 1. INTRODUCTION 1.1. Introduction to Polybutadiene Rubber Market Product Description Properties Industry Structure Value Chain
Table B1. Advanced Economies: Unemployment, Employment, and Real per Capita GDP (Percent)
") Statistical Appendix Table B1. Advanced Economies: Unemployment, Employment, and Real per Capita GDP (Percent) Unemployment Rate 2 Averages 1 1993 2002 2003 12 Advanced Economies 6.8 6.9 6.7 6.5 6.3 5.8
Statistical Appendix Table B1. Advanced Economies: Unemployment, Employment, and Real per Capita GDP (Percent) Unemployment Rate 2 Averages 1 1993 2002 2003 12 Advanced Economies 6.8 6.9 6.7 6.5 6.3 5.8
Methodology. Supply. Demand
 Methodology Supply Demand Tipping the Scale 1 Overview Latin America and the Caribbean, a major petroleum product importing region, provides an important counterbalance to surpluses in refined product
Plywood and Oriented Strand Board (OSB) in the Pacific Rim and Europe:
 in the Pacific Rim and Europe:") Plywood and Oriented Strand Board (OSB) in the Pacific Rim and Europe: 2011 2015 Market opportunities, strategies and prospects for trade and investment The forthcoming upturn will present opportunities
Plywood and Oriented Strand Board (OSB) in the Pacific Rim and Europe: 2011 2015 Market opportunities, strategies and prospects for trade and investment The forthcoming upturn will present opportunities
PIVE 1 PIVE 2 PIVE 3 PIVE 4 PIVE 5 PIVE 6 PIVE 7 PIVE
 Title of the measure: SPA51-PIVE Efficient-Vehicle Incentive Programme General description PIVE Programme was approved in Cabinet Meeting of 27 September 2012 with an initial budget allocation of 75 million,
Automotive Report August, 2014
 Automotive Report August, 2014 Noticias Automotive industry figures 2014 year to date Sales of light cars grew 11.0% in July 2014 compared with the same month 2013 totalling 96,211 vehicles. July production
Strategy Implementation of VOLKSWAGEN
 2012 Strategy Implementation of VOLKSWAGEN Department Of Business Administration, University Of Lucknow Submitted To: Prof. J.K. Sharma Submitted By: Ankit Kamal Roll No.06 MBA (EB) Sem IV Index Introduction
BASELINE STUDY ON VEHICLE INVENTORY AND FUEL ECONOMY FOR MALAWI (KEY FINDINGS)
") BASELINE STUDY ON VEHICLE INVENTORY AND FUEL ECONOMY FOR MALAWI (KEY FINDINGS) TASK TEAM- LEAD INSTITUTION Ministry of Natural Resources, Energy and Mining Mount Soche Hotel, Blantyre. 11 th December 2017
BASELINE STUDY ON VEHICLE INVENTORY AND FUEL ECONOMY FOR MALAWI (KEY FINDINGS) TASK TEAM- LEAD INSTITUTION Ministry of Natural Resources, Energy and Mining Mount Soche Hotel, Blantyre. 11 th December 2017
Closer Ties to the Customer
 Closer Ties to the Customer EVEN THE BEST PRODUCT CAN T SELL ITSELF; SALES IS THE PLACE WHERE THE ONE-TO-ONE CONNECTION IS MADE WITH THE CUSTOMER. NISSAN S NEW RANGE OF EXCITING, ATTRACTIVE PRODUCT CAN
Eurotrans General Information YEAR 2015
 Eurotrans General Information YEAR 2015 Page 1 4/12/2015 Tomaso Carraro EUROTRANS President Assiot President, Italy Page Page 2 2 4/12/2015 3 rd International Drive Technology Meeting 15 Hannover during
Table 1 ANTIGUA AND BARBUDA: MAIN ECONOMIC INDICATORS
 Antigua Tables 2006 1 Main Indicators 03/11/2006 08:05 AM Table 1 ANTIGUA AND BARBUDA: MAIN ECONOMIC INDICATORS 1996 1997 1998 1999 2000 2001 2002 2003 2004 2005 a/ Annual growth rates b/ Gross domestic
World Geographic Shares
 World Geographic Shares North America South America Europe Africa Asia Australia/ Oceania 18% 13% 7% 22% 33% 6% World Population Shares North America South America Europe Africa Asia Australia/ Oceania
Review of Operations in FY2012
 Sales Segment Profit and Ratio Sales by Region for the Fiscal Year ended March 31, 2013 (To Outside Customers) 41 With respect to construction equipment, while demand increased in North America and Japan
INDUSTRIALL GLOBAL UNION FCA-CNH NETWORK MEETING March 2017 Detroit, US
 INDUSTRIALL GLOBAL UNION FCA-CNH NETWORK MEETING 14-16 March 2017 Detroit, US IG Metall Situation in the automotive industry 2016 2016 overview IG Metall The world automarket of passenger cars has increased
Toyota captures three top model awards, while Honda earns two model awards and BMW captures one.
 and auto motor und sport/autostrassenverkehr Report: For the First Time, Honda is the Most Satisfying Brand to Own in Germany Toyota s Green Prius Leads Customer Satisfaction Rankings FRANKFURT: 10 July
Analyses. May HolidayEuro Summer Purchasing Power of the Euro Abroad. Bank Austria Economics & Market Analysis Austria
 Bank Austria Economics & Market Analysis Austria Analyses HolidayEuro Summer 2011 Purchasing Power of the Euro Abroad May 2011 http://economicresearch.bankaustria.at Overview Holiday uro in summer 2011
Aftermarket Trends: What will Drive Future Aftermarket Repair Opportunities in North America?
 Aftermarket Trends: What will Drive Future Aftermarket Repair Opportunities in North America? Mark Seng Global Aftermarket Practice Leader July 29, 2014 - Vehicles - Powertrains - Technology & How the
The Global Car Rental Market To 2018
 The Global Car Rental Market To 2018 Report Code: TT0203MR Publication Date: December 2014 www.tourism-ic.com John Carpenter House 7 Carmelite Street London EC4Y 0BS United Kingdom Tel: +44 (0)20 7936
Control Valve Market Research Report- Global Forecast to 2022
 Report Information More information from: https://www.marketresearchfuture.com/reports/1940 Control Valve Market Research Report- Global Forecast to 2022 Report / Search Code: MRFR/SEM/1408-HCRR Publish
Mercedes-Benz achieves best-selling November
 Investor Relations Release Mercedes-Benz achieves best-selling November December 4, 2015 Mercedes-Benz delivered 161,953 vehicles to customers in November (+7.4%) more than ever before in a November. Unit
CONTACT: Mike Hedge Hedge & Company, Inc. Public Relations (cell) FOR: Planning Perspectives, Inc.
 FOR: Planning Perspectives, Inc.") FOR: Planning Perspectives, Inc. Birmingham, MI HOLD FOR RELEASE UNTIL 12:01 a.m. EDT MONDAY, May 23, 2011 CONTACT: Mike Hedge Hedge & Company, Inc. Public Relations 248-789-8976 (cell) mhedge@hedgeco.com
FOR: Planning Perspectives, Inc. Birmingham, MI HOLD FOR RELEASE UNTIL 12:01 a.m. EDT MONDAY, May 23, 2011 CONTACT: Mike Hedge Hedge & Company, Inc. Public Relations 248-789-8976 (cell) mhedge@hedgeco.com
ECONOMIC BULLETIN - No. 42, MARCH Statistical tables
 ECONOMIC BULLETIN - No. 42, MARCH 2006 APPENDIX Appendix Statistical tables The world economy Table a1 Gross domestic product a2 Industrial production a3 Consumer prices a4 External current account a5
Respect for customers, partners and staff. Service: another name for the respect that a company owes its customers, partners and staff.
 Respect for customers, partners and staff Service: another name for the respect that a company owes its customers, partners and staff. Vehicle glass KEY FIGURES (in EUR million) 2004 2003 % change Total
ANNUAL STATISTICAL SUPPLEMENT
 ANNUAL STATISTICAL SUPPLEMENT with 2008 data 2009 Edition This Statistical Supplement has been prepared to provide a longer historical perspective for the oil demand, supply, trade, stocks, prices and
Innovation of Automobile Dealers in Hokkaido
 Innovation of Automobile Dealers in Hokkaido Tomomi Kaneko Wataru Hase Setsuko Takahashi Ryoju Hamada Hokkaido Automotive Engineering College, Japan Tohoku University, Japan kaneko@haec.ac.jp Abstract
GLOBAL AUTOMOBILE BUMPY ROAD AHEAD
 GLOBAL AUTOMOBILE BUMPY ROAD AHEAD WEBINAR Allianz Research/ Maxime Lemerle Paris / September 2018, 25th Copyright Allianz EXECTIVE SUMMARY 01 THE AUTOMOTIVE MARKET IS SET TO GROW BY +3.0% IN 2018 COMPARED
Africa Used. Vehicle Report. Ariadne Baskin. African Clean Mobility Week March
 Africa Used Vehicle Report Ariadne Baskin African Clean Mobility Week March 13 2018 Content Africa Used Vehicles Report Regulatory Environment Supply Chain & Scale of Used Vehicle Flows Way forward 2 ?
BLABLACAR SOCIAL INNOVATION: A CASE STUDY. Esther Val/David Murillo 14 April 2016
 BLABLACAR SOCIAL INNOVATION: A CASE STUDY Esther Val/David Murillo 14 April 2016 1 BLABLACAR SNAPSHOT Mission: To transform mobility by making it more efficient, affordable and sustainable. -Founded in
Volkswagen Group Capital Markets Day 2017 Volkswagen Truck & Bus
 Volkswagen Group Capital Markets Day 2017 Volkswagen Truck & Bus Andreas Renschler Board of Management, Commercial Vehicles Capital Markets Day, 14 th of March 2017 Disclaimer The following presentations
Global High Performance Anticorrosion Coatings Market Study ( )
") Global High Performance Anticorrosion Coatings Market Study (2014 2025) Table of Contents 1. INTRODUCTION 1.1. Introduction to High Performance Anticorrosion Coatings Market Product Description Materials,
Global High Performance Anticorrosion Coatings Market Study (2014 2025) Table of Contents 1. INTRODUCTION 1.1. Introduction to High Performance Anticorrosion Coatings Market Product Description Materials,
Roadmap Data Update and Model Validation Documentation September 2017
 Roadmap Data Update and Model Validation Documentation September 2017 This document provides an overview of the updates that were made to the Roadmap model during the summer of 2017, and indicates the
Energy Efficiency: An engine for growth and development. Philippe Benoit Head, Energy Efficiency and Environment Division, IEA 8 June 2015
 Energy Efficiency: An engine for growth and development Philippe Benoit Head, Energy Efficiency and Environment Division, IEA 8 June 2015 EE: an important role? Energy efficiency can help drive economic
ASEAN the New Chapter in Global Automotive Industry. Mr. Vichai Jirathiyut President, Thailand Automotive Institute
 ASEAN the New Chapter in Global Automotive Industry Mr. Vichai Jirathiyut President, Thailand Automotive Institute World Automobile Production Hamburge r Crisis - 12% 2013 = 81.4 mi. units. PC 61 mil units
Hyundai-HMB is followed by Toyota (783), which performs well in the vehicle quality/reliability measure.
, which performs well in the vehicle quality/reliability measure.") J.D. Power do Brasil Reports: Hyundai-HMB Ranks Highest in Vehicle Ownership Satisfaction Volkswagen Gol G4 (Subcompact Car); Hyundai-HMB HB20 (Entry Compact Hatch); Renault Logan (Entry Compact Sedan);
J.D. Power do Brasil Reports: Hyundai-HMB Ranks Highest in Vehicle Ownership Satisfaction Volkswagen Gol G4 (Subcompact Car); Hyundai-HMB HB20 (Entry Compact Hatch); Renault Logan (Entry Compact Sedan);
280 / World Cotton: FAPRI 2005 Agricultural Outlook. World Cotton
 WORLD COTTON 280 / World Cotton: FAPRI 2005 Agricultural Outlook World Cotton The 2004/05 crop can be characterized simply as record breaking. A record 35.8 mha of cotton were harvested, producing a record
Meeting Materials for FY2011
 Meeting Materials for FY2011 (Year ended March 31, 2012) May 17, 2012 Masao Usui Representative Director, President Executive Officer KYB Corporation Meeting Materials for FY2011 May 17, 2012, KYB Corporation
Transport Fuel Prices in Sub-Saharan Africa: Explanation, impact and policies
 0 Transport Fuel Prices in Sub-Saharan Africa: Explanation, impact and policies World Bank Transport Forum March 30 th, 2011 1 Five parts to the presentation 1. Why look at SSA transport fuel prices now?
FISCAL YEAR ENDING MARCH 2012 FIRST HALF FINANCIAL RESULTS
 FISCAL YEAR ENDING MARCH 2012 FIRST HALF FINANCIAL RESULTS Mazda Motor Corporation November 2, 2011 New Mazda CX-5 (European specifications) 1 PRESENTATION OUTLINE Highlights Fiscal Year Ending March 2012
Steel Exporters Association is a professional body which represents iron and steel exporters in Turkey.
 Steel Exporters Association is a professional body which represents iron and steel exporters in Turkey. The association has more than 600 members as of September 2011. MAIN ACTIVITIES OF THE ASSOCIATION
Kongsberg Automotive ASA. Fourth quarter February 28, 2019
 Kongsberg Automotive ASA Fourth quarter - February 28, 2019 Highlights Q4 Sales Revenues grew by 21 (7.3%) YoY to 288 including negative FX effects of 1. We booked new business with 77 in expected annual
Mercedes-Benz Achieves Best May Sales Figure in its History
 Investor Relations Release In the following please find the release of the Mercedes-Benz Cars concerning worldwide vehicles sales in May 2011: Date: June 6, 2011 Mercedes-Benz Achieves Best May Sales Figure
AUTOGAS A GLOBAL OVERVIEW. Michael Treloar Elaflex Pacific Pty Ltd APFI Forum 6 th September th September 2018
 A GLOBAL OVERVIEW Michael Treloar Elaflex Pacific Pty Ltd APFI Forum 6 th September 2018 6 th September 2018 INTRODUCING 2 Elaflex Pacific Pty Ltd / 6 th September 2018 AGENDA AutoGas Demand Current global
Brief on the PCFV Used Vehicle Working Group. Partnership for Clean Fuels and Vehicles (PCFV)
") Brief on the PCFV Used Vehicle Working Group Partnership for Clean Fuels and Vehicles (PCFV) Henry Kamau Establishment of the Used Vehicles Working Group The Partnership for Clean Fuels and Vehicles (PCFV)
Brief on the PCFV Used Vehicle Working Group Partnership for Clean Fuels and Vehicles (PCFV) Henry Kamau Establishment of the Used Vehicles Working Group The Partnership for Clean Fuels and Vehicles (PCFV)
Automotive Industry. Slovakia. EHSK Analysts team Peter Kellich and Andrej Krokoš. April 2017
 Automotive Industry Slovakia EHSK Analysts team Peter Kellich and Andrej Krokoš April 2017 Overview: Automotive industry in Slovakia key facts Demand context and actual situation Trade-restrictions-related
Steering Columns System - Global Market Outlook ( )
") Published on Market Research Reports Inc. (https://www.marketresearchreports.com) Home > Steering Columns System - Global Market Outlook (2015-2022) Steering Columns System - Global Market Outlook (2015-2022)
Published on Market Research Reports Inc. (https://www.marketresearchreports.com) Home > Steering Columns System - Global Market Outlook (2015-2022) Steering Columns System - Global Market Outlook (2015-2022)
Leveraging Strategies: Japan s Story
 Leveraging Strategies: Japan s Story Takashi Shimodaira Executive Vice President Japan Automobile Manufacturers Association GAIKINDO International Automotive Conference Jakarta, July 11, 2005 1 JAMA Profile
Statement Dr. Norbert Reithofer Chairman of the Board of Management of BMW AG Conference Call Interim Report to 30 June August 2014, 10:00 a.m.
 - Check against delivery - Statement Dr. Norbert Reithofer Chairman of the Board of Management of BMW AG Conference Call Interim Report to 30 June 2014, 10:00 a.m. Ladies and Gentlemen! Since July, Europe
RENAULT-NISSAN ALLIANCE POSTS SALES RECORD IN 2012 FOR 4TH STRAIGHT YEAR
 RENAULT-NISSAN ALLIANCE POSTS SALES RECORD IN 2012 FOR 4TH STRAIGHT YEAR Despite recession in Europe and slowing pace of sales in China, global sales were a record 8.1 million units Strongest growth came
Statistical tables S 0. Money and banking. Capital market. National financial account. Public finance
 Statistical tables Money and banking Page S South African Reserve Bank: Liabilities... 2 South African Reserve Bank: Assets... 3 Corporation for Public Deposits: Liabilities... 4 Corporation for Public
AUTOMOTIVE INDUSTRY MEXICONOW MARCH - APRIL 2012
 18 MEXICONOW MARCH - APRIL 2012 By Sergio L. Ornelas MexicoNOW Editor Mexico s Auto Exports Surge Over Two million Significant Investments by Global OEMs Pour In Mexico s auto industry s star continues
Global Auto Components Market Report
 Global Auto Components Market Report ----------------------------------------- 2015 Executive Summary The automotive components industry accounts for a significant share of the total production of the
FACT SHEET: Press Releases and Project Overview DAIMLER & RENAULT-NISSAN ALLIANCE. Press releases (one-sided press releases are marked with [ ])
![FACT SHEET: Press Releases and Project Overview DAIMLER & RENAULT-NISSAN ALLIANCE. Press releases (one-sided press releases are marked with [ ])](/thumbs/80/81463607.jpg "FACT SHEET: Press Releases and Project Overview DAIMLER & RENAULT-NISSAN ALLIANCE. Press releases (one-sided press releases are marked with [ ])") FACT SHEET: Press Releases and Project Overview DAIMLER & RENAULT-NISSAN ALLIANCE Press releases (one-sided press releases are marked with [ ]) Apr. 7, 2010 Jan. 8, 2012 Renault-Nissan and Daimler AG announce
FACT SHEET: Press Releases and Project Overview DAIMLER & RENAULT-NISSAN ALLIANCE Press releases (one-sided press releases are marked with [ ]) Apr. 7, 2010 Jan. 8, 2012 Renault-Nissan and Daimler AG announce
FISCAL YEAR MARCH 2014 FIRST HALF FINANCIAL RESULTS. New Mazda Axela (Overseas name: New Mazda3)
") FISCAL YEAR MARCH 2014 FIRST HALF FINANCIAL RESULTS New Mazda Axela (Overseas name: New Mazda3) Mazda Motor Corporation October 31, 2013 1 PRESENTATION OUTLINE Highlights Fiscal Year March 2014 First Half
FISCAL YEAR MARCH 2014 FIRST HALF FINANCIAL RESULTS New Mazda Axela (Overseas name: New Mazda3) Mazda Motor Corporation October 31, 2013 1 PRESENTATION OUTLINE Highlights Fiscal Year March 2014 First Half
FISCAL YEAR MARCH 2015 THIRD QUARTER FINANCIAL RESULTS. Updated Mazda CX-5 (Japanese specification model)
") FISCAL YEAR MARCH 2015 THIRD QUARTER FINANCIAL RESULTS Updated Mazda CX-5 (Japanese specification model) Mazda Motor Corporation February 4, 2015 1 PRESENTATION OUTLINE Highlights Fiscal Year March 2015
FISCAL YEAR MARCH 2015 THIRD QUARTER FINANCIAL RESULTS Updated Mazda CX-5 (Japanese specification model) Mazda Motor Corporation February 4, 2015 1 PRESENTATION OUTLINE Highlights Fiscal Year March 2015
Stronger road safety. in South Australia. Presented by Tamra Fedojuk Senior Statistician Road Safety Policy
 Stronger road safety performance monitoring in South Australia Presented by Tamra Fedojuk Senior Statistician Road Safety Policy Outline Introduction Challenges for road safety in South Australia Current
Press Release. During the third quarter of 2010/11, Alstom s order intake rose to 5.5 billion, lifted by commercial successes in emerging countries
 Press Release 20 January 2011 During the third quarter of 2010/11, Alstom s order intake rose to 5.5 billion, lifted by commercial successes in emerging countries Over the third quarter 2010/11 (from 1
UXC.COM A PUBLICATION OF. NPO Overview 1501 MACY DRIVE ROSWELL, GA PH FX
 2019 A PUBLICATION OF UXC.COM NPO Overview 1501 MACY DRIVE ROSWELL, GA 30076 PH +1 770 642-7745 FX +1 770 643-2954 NOTICE UxC, LLC ( UxC ) shall have title to, ownership of, and all proprietary rights
1 INTRODUCTION OBJECTIVES OF THE STUDY MARKET DEFINITION MARKET SCOPE... 13
 TABLE OF CONTENTS 1 INTRODUCTION... 12 1.1 OBJECTIVES OF THE STUDY... 12 1.2 MARKET DEFINITION... 12 1.3 MARKET SCOPE... 13 1.3.1 MARKETS COVERED... 13 1.3.2 YEARS CONSIDERED FOR THE STUDY... 13 1.4 CURRENCY...
Japan-Canada EPA: Free Trade Drives Growth & Prosperity
 Japan-Canada EPA: Free Trade Drives Growth & Prosperity 2013 Canada-Japan Trade Symposium Toronto, 25 April 2013 Toshihiro IWATAKE Executive Director and Secretary General Japan Automobile Manufacturers
BIODIESEL 2020: Global Market Survey, Case Studies and Forecasts. Multi-Client Study pages - Published October, 2006 by Emerging Markets Online
 Global Market Survey, Case Studies and Forecasts Multi-Client Study - 405 pages - Published October, 2006 by Emerging Markets Online Global Market Survey, Case Studies and Forecasts Introduction and Executive
ZF posts record sales in 2017; announces increased research and development activities
 Page 1/5, March 22, 2018 ZF posts record sales in 2017; announces increased research and development activities ZF chief executive officer announces further expansion of research and development activities
This is a licensed product of AM Mindpower Solutions and should not be copied
 1 TABLE OF CONTENTS 1. Indian Automobile Market Introduction 9 2. Indian Automobile Market Size, FY 2006-2011.10 3. Indian Auto-Components Industry Introduction.13 3.1. Indian Auto-Components Industry
DOWNSTREAM PETROLEUM 2017 DOWNSTREAM PETROLEUM
 DOWNSTREAM PETROLEUM International and Asian Refining The global refining industry is fundamentally changing as emerging and maturing trends re-shape the global supply and demand patterns for crude oil
CMC Operating Results and Future Plan. April 24, 2018
 CMC Operating Results and Future Plan April 24, 2018 1 Safe Harbor Notice This presentation contains forward-looking statements concerning the financial condition, results of operations and businesses
TABLE OF CONTENTS OECD/IEA, 2017
 TABLE OF CONTENTS Foreword... 3 Acknowledgements... 4 Executive Summary... 13 Coal s decade of stagnation... 13 While some demand centres are in decline, others are taking off... 13 High prices endure,
STATISTICAL TABLES RELATING TO INCOME, EMPLOYMENT, AND PRODUCTION
 A P P E N D I X B STATISTICAL TABLES RELATING TO INCOME, EMPLOYMENT, AND PRODUCTION C O N T E N T S GDP, INCOME, PRICES, AND SELECTED INDICATORS Page B 1. Percent changes in real gross domestic product,
FISCAL YEAR MARCH 2015 FIRST HALF FINANCIAL RESULTS. New Mazda Demio
 FISCAL YEAR MARCH 2015 FIRST HALF FINANCIAL RESULTS New Mazda Demio Mazda Motor Corporation October 31, 2014 1 PRESENTATION OUTLINE Highlights Fiscal Year March 2015 First Half Results Fiscal Year March
Annual Report on National Accounts for 2015 (Benchmark Year Revision of 2011) Summary (Flow Accounts)
 Summary (Flow Accounts)") Annual Report on National Accounts for 2015 (Benchmark Year Revision of 2011) Summary (Flow Accounts) I. Overview of Benchmark Year Revision of 2011 P 2 II. Expenditure Series P 3 III. Income Series P
Annual Report on National Accounts for 2015 (Benchmark Year Revision of 2011) Summary (Flow Accounts) I. Overview of Benchmark Year Revision of 2011 P 2 II. Expenditure Series P 3 III. Income Series P
About LMC Automotive. LMC Automotive the company. Global Car & Truck Forecast. Automotive Production Forecasts
 About LMC Automotive LMC Automotive the company LMC Automotive is a market leader in the provision of automotive intelligence and forecasts to an extensive client base of car and truck makers, component
Barry Callebaut Food Manufacturers Europe
 Particulars About Your Organisation 1.1 Name of your organization Barry Callebaut Food Manufacturers Europe 1.2 What is/are the primary activity(ies) or product(s) of your organization? Oil Palm Growers
Overview of Global Fuel Economy Policies
 Overview of Global Fuel Economy Policies Zifei Yang Researcher 2018 APCAP Joint Forum and Clean Air Week Theme: Solutions Landscape for Clean Air Bangkok, Mar 20, 2018 What is ICCT? ICCT is an independent
SAMPLE: Wipers intelligence service. Generated: July 11, 2016
 SAMPLE: Wipers intelligence service Generated: July 11, 2016 Table of contents Table of contents Introduction... Companies... Denso Corporation... Federal Mogul Corporation... Products... Hella KGaA Hueck
Market Outlook for Malaysian Rubber Products in th February 2014
 Market Outlook for Malaysian Rubber Products in 2014 25 th February 2014 World Economic Scenario World Economic Outlook For 2014 World growth increase from 3% in 2013 to 3.7% in 2014 Advanced economies
Global Motorcycle Market Research Report 2018
 Report Information More information from: https://www.wiseguyreports.com/reports/3271957-global-motorcycle-market-research-report-2018 Global Motorcycle Market Research Report 2018 Report / Search Code:
Corporate Communications. Media Information 15 March 2011
 15 March 2011 BMW Group aims to further increase earnings in 2011 EBIT margin of over 8% expected in Automobiles segment Sales volume of well in excess of 1.5 million vehicles targeted Margin of 8% to
Bank Austria Economics and Market Analysis. Analyses &.,+)(1%0/. '96+0)713/!'4;-6! 4.!80-!&964!%*64), March.
(1%0/. '96+0)713/!'4;-6! 4.!80-!&964!%*64), March.") Bank Austria Economics and Market Analysis &.,+)(1%0/. 'rtkpi!#"10 " '96+0)713/!'4;-6! 4.!80-!&964!%*64), # March 2010 http://economicresearch-e.bankaustria.at Overview Holiday uro worth less than a year
Bank Austria Economics and Market Analysis &.,+)(1%0/. 'rtkpi!#"10 " '96+0)713/!'4;-6! 4.!80-!&964!%*64), # March 2010 http://economicresearch-e.bankaustria.at Overview Holiday uro worth less than a year
Comparison of 2013 VMT Fatality Rates in the States and in High-Income Countries
 Comparison of 2013 VMT Fatality Rates in the States and in High-Income Countries Transportation Research Board 96th Annual Meeting Session 536 Analysis of International Road Safety Data January 10, 2017
World Fluid Power Summit Germany
 World Fluid Power Summit Germany Christian H. Kienzle CEO of ARGO-HYTOS GMBH, Kraichtal Chairman of the Board of the Fluid Power Association within Mechanical Engineering Sales and Orders 180 Sales: Orders: