FACTS & FIGURE. arch 2019 EDITION
|
|
|
- Ronald Bradley
- 5 years ago
- Views:
Transcription


1 FACTS & FIGURE M arch 2019 EDITION


2 HIGHLIGHTS IN 2018, GROUPE RENAULT ANNOUNCED THAT IT WOULD INVEST 1.4 BILLION EUROS IN FRANCE AND HIRE 5,000 EMPLOYEES OVER THREE YEARS. THESE INVESTMENTS WILL MAINLY GO TOWARDS THE PRODUCTION OF LIGHT COMMERCIAL AND ELECTRIC VEHICLES, OUR TWO GROWTH DRIVERS IN FRANCE. 85% OF EMPLOYEES ARE PROUD TO WORK FOR GROUPE RENAULT CLIO NO. 1 VEHICLE SOLD IN FRANCE NO. 2 IN EUROPE 15 MILLION CLIO SOLD WORLDWIDE SINCE ITS LAUNCH IN 1990 ELECTRIC VEHICLE LEADER IN EUROPE NEARLY ONE IN FOUR ELECTRIC VEHICLES SOLD IN EUROPE IS A RENAULT
3 CONT- ENTS ONE GROUP, FIVE BRANDS 2 KEY FIGURES 4 INDUSTRIAL SITES 6 MANUFACTURING 8 GLOBAL SALES 11 VEHICLE RANGE 21 SERVICES 28 RENAULT-NISSAN- MITSUBISHI 30 GROUPE RENAULT - 1

 Renault, the leading French brand worldwide, is present in 134 countries with nearly 12,000 points of sale.")
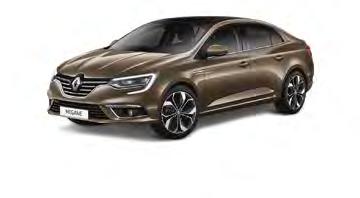
4 ONE GROUPE, FIVE BRANDS GROUPE RENAULT HAS MANUFACTURED CARS SINCE TODAY IT IS AN INTERNATIONAL MULTI-BRAND GROUP. TO ADDRESS THE MAJOR TECHNOLOGICAL CHALLENGES OF THE FUTURE, WHILE CONTINUING TO PURSUE ITS PROFITABLE GROWTH STRATEGY, GROUPE RENAULT IS FOCUSING ON INTERNATIONAL EXPANSION. TO THIS END, IT IS DRAWING ON THE SYNERGIES OF ITS FIVE BRANDS (RENAULT, DACIA, RENAULT SAMSUNG MOTORS, ALPINE AND LADA), ELECTRIC VEHICLES, AND ITS UNIQUE ALLIANCE WITH NISSAN AND MITSUBISHI MOTORS. DUSTER KADJAR RENAULT 2,532,567 VEHICLES SOLD IN 2018 (PC + LCV) Renault, the leading French brand worldwide, is present in 134 countries with nearly 12,000 points of sale. Renault has been making its customers lives easier for 120 years. As leader of the European electric vehicle market and committed to motorsport, the brand is driven by passion on a daily basis, with its sensual and warm design. DACIA 700,798 VEHICLES SOLD IN 2018 (PC + LCV) Dacia is present in 44 countries in Europe and in the Maghreb, Turkey and Israel. It has attracted more than 5.6 million customers since 2004 by offering a range of simple and reliable vehicles at affordable prices. With emblematic models such as Sandero and Duster, Dacia has a strong community spirit including online. 2 - GROUPE RENAULT


5 RSM 84,954 VEHICLES SOLD IN 2018 (PC) Created in 2000, Renault Samsung Motors operates exclusively in South Korea. Particularly reputed for its service quality, RSM was recently voted in 2018 number one on customer satisfaction in sales for the 17 th consecutive year and after-sales for the 3 rd consecutive year. SM6 ALPINE 2,091 VEHICLES SOLD IN 2018 (PC + LCV) Alpine was founded in 1955 by motorsport enthusiast Jean Rédélé. Alpine is back in 2017 with the new Alpine A110, reflecting brand DNA: lightweight, compact and agile with the promise of driving pleasure. ALPINE A110 XRAY LADA 398,282 VEHICLES SOLD IN 2018 (PC + LCV) LADA became a Groupe Renault brand in December The long-standing leader of the Russian market has the country s largest dealership network with 300 points of sale With a completely renewed design and a fast changing network, LADA has entered a new era. GROUPE RENAULT - 3
6 IN REVENUES At December 31, 2018 (1) KEY FIGURES OPERATING PROFIT At December 31, 2018 NET INCOME, GROUP SHARE (2) At December 31, ,419 MILLION 3,612 MILLION 3,302 MILLION FINANCIAL RESULTS In million of euros Revenues Automotive 54,211 56,257 financing 3,208 2,513 Total Groupe Renault 57,419 58,770 Operating profit Automotive 2,204 2,804 financing 1,204 1,050 Total Groupe Renault 3,612 3,854 As a % of revenues 6.3% 6.6% Net income Net income 3,451 5,308 Net income, Group share (2) 3,302 5,212 Free cash flow and automotive net cash position Operational free cash flow (1) Automotive net cash position (incl. AVTOVAZ) 3,702 3,209 Shareholders equity 36,145 33,442 Contribution from associated companies o/w Nissan 1,509 2,799 o/w AVTOVAZ 31 Total 1,540 2,799 Tangible and intangible investments net of disposals Automotive 4,249 3,441 financing 19 7 Total 4,268 3,448 (1) Application of IFRS 9 Financial Instruments and IFRS 15 Revenue from contracts with Customers as of January 1, (2)The figures for the year 2017 include adjustments due to the change in the accounting treatment of redeemable shares in GROUPE RENAULT
7 WORKFORCE At December 31, 2018 Breakdown by region Europe 39.9% o/w France 26.6% Breakdown by age Under % 183,002 EMPLOYEES In 37 countries and 21 functions families Eurasia 42.8% o/w AVTOVAZ 26.6% Africa, Middle East, India 8.1% Americas 6.7% Asia-Pacific 2.5% 25.3% WOMEN 74.7% MEN 20 to to to to 59 Over % 31.9% 29.5% 18.6% 2.3% STRUCTURE OF THE GROUP Simplified organization chart at December 31, 2018 (as a % of shares issued) OWNERSHIP STRUCTURE At December 31, 2017 (2018 figures will be updated ) Automotive division Associated companies financing Not included in the scope of consolidation 295,722,284 SHARES French State 15.01% 61.9% AVTOVAZ 100% RCI Bank and Services RENAULT SAS Other industrial and commercial companies Nissan 15% Daimler AG 3.10% Employees (1) 2.03% Self-owned 2.17% Public 62.69% 80% Renault Samsung Motors (1) The employee-owned shares in mutual funds corporate investment (present and former employees) included in this category. GROUPE RENAULT - 5
8 INDUSTRIAL SITES AND SALES IN 2018 OF THE 10 LEADING MARKETS GROUPE RENAULT PLANTS Passenger cars Light commercial vehicles Chassis, engines, gearboxes Foundry PARTNER PLANTS Passenger cars Light commercial vehicles Chassis, engines, gearboxes Foundry LOGISTICS SITES Logistics platform ALLIANCE SITES Renault-Nissan Alliance plants SITES IN FRANCE Batilly (Sovab) Caudan (Fonderie de Bretagne) Choisy-le-Roi Cléon Dieppe (Alpine) Douai Flins Grand-Couronne Le Mans Maubeuge (MCA) Ruitz (STA) Saint-André-de-l Eure (SFKI) Sandouville Villeurbanne Dieppe Ruitz Douai UK 103,607 SALES FRANCE 689,788 SALES Caudan Saint-André-de-l Eure Le Mans Grand-Couronne Flins Choisy-le-Roi PORTUGAL Cacia Sandouville Cléon Maubeuge Batilly Villeurbanne SPAIN 189,480 SALES Barcelona Palencia Seville Valladolid GERMANY 235,609 SALES SLOVENIA Novo Mesto ITALY 208,580 SALES COLOMBIA Envigado ARGENTINA 114,348 SALES Córdoba MEXICO Cuernavaca BRAZIL 214,822 SALES Curitiba CHILE Los Andes 6 - GROUPE RENAULT
9 SITES IN EUROPE Barcelona Cacia Novo Mesto Palencia Seville Valladolid SITES IN EURASIA Bursa (Oyak-Renault) Izhevsk (AVTOVAZ) Mioveni (Dacia) Moscow Togliatti (AVTOVAZ) SITES IN AFRICA, MIDDLE EAST, INDIA Casablanca (Somaca) Chennai (Renault-Nissan) Oran Pune Tangiers (Renault-Nissan) Tehran (Pars Khodro/Iran Khodro) (Aci-Pars) SITES IN ASIA-PACIFIC Busan (RSM) Shenyang (RBJAC) Wuhan (DRAC) SITES IN AMERICAS Córdoba Cuernavaca (Nissan) Curitiba Envigado (Sofasa) Los Andes (Cormecanica) RUSSIA 497,266 SALES Moscow, Togliatti, Izhevsk ALGERIA Oran MOROCCO Tangiers Casablanca ROMANIA Mioveni TURKEY 115,842 SALES Bursa IRAN 101,347 SALES Tehran INDIA Pune Chennai CHINA Wuhan Shenyang SOUTH KOREA Busan EUROPE EURASIA ASIA-PACIFIC AMERICAS AFRICA, MIDDLE EAST, INDIA GROUPE RENAULT - 7
10 MANUFACTURING GLOBAL PRODUCTION BY REGION At December 31, 2018 In Groupe Renault plants In partners plants In Groupe Renault plants and partners plants Europe Eurasia Americas 415, ,561 AMI 472, , ,945 Asia-Pacific 215,851 90, ,077 4,120,063 VEHICLES PRODUCED WORLDWIDE 1,451,769 1,760 1,453,529 1,290,951 1,290,951 VEHICLE PRODUCTION IN GROUPE RENAULT PLANTS FOR ITS PARTNERS At December 31, 2018 Nissan 230,329 Daimler 72,043 Fiat 25,035 GM 24,098 Datsun 23,575 Total 390,882 RVI 15,802 PRODUCTION BY PLANT AND REGION Automotive plants in Europe 2018 France Plant Activity Production Plant workforce Batilly (Sovab) Renault Master 96,346 2,185 Total vehicles Master Z.E. Nissan NV400 Other 307 6,945 39, ,619 Caudan (Fonderie de Bretagne) Casting (in tons) 18, Choisy-le-Roi Cléon Dieppe (Alpine) Total vehicles Douai Total vehicles Flins Total vehicles Le Mans Maubeuge (MCA) Total vehicles Gearboxes ES Engines ES Gearboxes Engines Electric engines Aluminum casting (in tons) Clio R.S. Alpine Espace Scénic Talisman Clio ZOE Nissan Micra Rear axles Front axles Casting (in tons) Kangoo / Citan Kangoo Z.E. 29,350 34, , ,798 73,775 19,297 3,932 3,304 7,236 10,771 89,968 18, ,639 73,966 49,472 72, ,044 1,556, , , ,941 9, , , ,180 2,642 1,755 1, GROUPE RENAULT
11 Plant Activity Production Plant workforce Ruitz (STA) Automatic gearboxes 110, Sandouville Renault Trafic 94,003 1,934 Total vehicles Nissan NV300 Other 6,310 25, ,227 Villeurbanne Front axles 306, Total vehicles France 750,271 18,440 Automotive plants in Europe 2018 outside France Plant Activity Production Plant workforce Spain Palencia Mégane 2,368 Mégane Estate Kadjar Total Palencia Seville Valladolid Total Valladolid Valladolid Motores Barcelona (Nissan) Total vehicles Spain Gearboxes Twizy Captur Other Engines Alaskan 85,161 57, , ,036 1,093,276 5, , ,092 1,438,202 1, ,888 1,132 6,321 Portugal Cacia Gearboxes 697, Slovenia Novo Mesto Clio 73,395 2,890 Total vehicles Slovenia Twingo / Smart Other 135, ,370 Total vehicles Europe outside France 703,258 13,677 Automotive plants in Africa, Middle East, India 2018 Plant Activity Production Plant workforce Algeria Oran Logan 23,837 NC Sandero 33,302 Clio 13,458 Total vehicles Algeria India Chennai (Renault-Nissan) Total vehicles India Iran Tehran (Iran Khodro-Pars Khodro) Tehran (ACI Pars) Morocco Casablanca (Somaca) Total Casablanca Tangiers Duster Kwid Lodgy Captur Logan / Logan Pick-Up / Sandero Front axles Rear axles Logan Sandero 70,597 11,270 76,190 1,194 1,608 90,262 91,000 69,446 70,715 29,689 53,745 83,434 33,483 19, ,686 96, ,086 Lodgy Logan MCV Sandero Dokker Total vehicles Morocco Total vehicles AMI 653,945 Automotive plants in Eurasia 2018 Plant Activity Production Plant workforce Romania Mioveni (Dacia) 12,003 Total vehicles Romania Russia Moscow (Avtoframos) Total vehicles Avtoframos Logan Logan MCV Sandero Duster New Duster Front axles Engines Front axles Aluminum casting (in tons) Kaptur Duster Nissan Terrano 33,841 22,354 42,146 4, , , , ,093 27, ,261 34,334 47,151 16,253 97,738 NC NC NC NC 1,502 6,748 8,250 2,602 GROUPE RENAULT - 9
12 Automotive plants in Eurasia 2018 (continued) Plant Activity Production Plant workforce Russia Togliatti (AVTOVAZ) NC Total vehicles Togliatti Izhevsk (AVTOVAZ) Total vehicles Russia Turkey Bursa (Oyak Renault) 10 - GROUPE RENAULT Logan Sandero LADA XRAY LADA Largus LADA Kalina LADA Granta LADA Priora LADA 4X4 Nissan Almera Datsun MI-DO Datsun ON-DO Gearboxes Engines LADA Vesta 38,505 37,950 40,421 58,624 18, ,047 7,224 41,161 15,847 2,746 20, , ,421 97, , ,795 2,602 6,656 Clio Clio Estate Fluence Other Gearboxes Engines Rear axles Front axles 241,294 50,747 44, , , , ,888 Total vehicles Turkey 336,895 Total vehicles Eurasia 1,290,951 21,261 Automotive plants in Asia-Pacific 2018 Plant Activity Production Plant workforce 2,082 South Korea Busan (Renault Samsung Motors) Total vehicles South Korea China Wuhan (DRAC) [partner plant] Talisman/SM6 Fluence/SM3 SM3 ZE Latitude/SM5 Koleos/QM6 SM7 Nissan Rogue Engines 26,198 5,085 1,212 10,002 61,234 4, ,251 89, ,851 Kadjar Koleos 16,459 31,299 NC Shenyang (RBJAC) [partner plant] Total vehicles China Jinbei Haise / Grand Haise / Granse / F50 / Huasong 7 42,468 90,226 Total vehicles Asia-Pacific 306,077 2,082 Automotive plants in the Americas 2018 Plant Activity Production Plant workforce Argentina Córdoba 2,049 Planta Fundicion Aluminió (PFA) Total vehicles Argentina Brazil Curitiba Logan Sandero Dokker Nissan Navara Other Aluminum casting (in tons) 11,330 15,979 12,697 5, ,314 45,221 Master 11,354 5,519 Duster 32,634 Duster Pick-up 39,827 Logan 25,059 Sandero 57,396 New Captur 42,044 Kwid 92,560 Engines 297,052 Total vehicles Brazil 300,874 Chile Los Andes (Cormecanica) Gearboxes 322, Colombia Envigado (Sofasa) Logan 14,734 1,148 Sandero 24,611 Duster 29,909 Total Colombia 69,254 Mexico Cuernavaca (Nissan) Alaskan 212 NC Total vehicles Americas 415,561 9,143
13 GLOBAL SALES 10 largest markets of Groupe Renault 2018 By volume and as a % of TIV, PCs + LCVs, incl. Renault, Dacia, Renault Samsung Motors, LADA and Jinbei & Huasong France 689, Russia 497, Germany 235, China 216, Brazil 214, Italy 208, Spain + Canaries 189, Turkey 115, Argentina 114, United Kingdom 103, Groupe Renault worldwide sales by brand Volume PCs + LCVs Renault Passenger Cars (PCs) 2,124,364 2,264,823 Light commercial vehicles 408, ,968 Total Renault 2,532,567 2,671,791 Dacia Passenger Cars (PCs) 655, ,684 Light commercial vehicles 45,626 45,131 Total Dacia 700, ,815 Renault Samsung Motors Passenger Cars (PCs) 84,954 99,846 Alpine Passenger Cars (PCs) 2,091 7 LADA Passenger Cars (PCs) 385, ,739 Light commercial vehicles 13,213 10,879 Total LADA 398, ,618 Jinbei & Huasong Passenger Cars (PCs) 13,416 0 Light commercial vehicles 152,187 0 Total Jinbei & Huasong 165,603 0 Groupe Renault Passenger Cars (PCs) 3,265,066 3,299,099 Light commercial vehicles 619, ,978 Total Groupe Renault 3,884,295 3,762,077 Groupe Renault worldwide sales (1) by brand and model Volume PCs + LCVs Passenger cars Renault Captur 229, ,765 Captur GA (2) 78,919 62,169 Clio 416, ,480 Duster 136, ,043 (1) Including non-registred vehicles. (2) Captur Global Access: Kaptur/Captur Americas. Passenger cars (continued) Renault Espace 12,704 18,572 Fluence/Fluence Z.E. 1,775 6,525 Kadjar 133, ,118 Kangoo/Kangoo Z.E. 33,886 36,815 Koleos 68,155 76,223 Kwid 170, ,146 Lodgy 1,460 3,724 Logan 194, ,821 Master 2,103 1,733 Mégane 279, ,359 Other 5,848 2,463 Sandero 188, ,033 Talisman 23,143 44,104 Trafic 17,765 18,612 Twingo 90,617 81,927 ZOE 39,469 31,191 Total Renault 2,124,364 2,264,823 Dacia Dokker 48,763 45,007 Duster 213, ,539 Lodgy 35,929 39,624 Logan 78,612 75,075 Other 39 8 Sandero 278, ,431 Total Dacia 655, ,684 Renault Samsung Motors QM3 6,367 12,228 QM6 32,999 27,837 SM3/SM3 Z.E. 6,485 7,213 SM5 9,492 7,247 SM6 24,800 39,389 SM7 4,811 5,932 Total Renault Samsung Motors 84,954 99,846 Alpine A110 2,091 7 Total Alpine 2,091 7 LADA ,279 16,674 4x4 42,072 37,030 Granta 112,550 98,731 Kalina 1,269 2,316 Largus 48,340 36,217 Other Priora 8,995 16,853 Vesta 119,150 79,102 XRAY 37,588 33,822 Total LADA 385, ,739 Jinbei & Huasong Total Jinbei & Huasong 13,416 0 Total Group, PCs 3,265,066 3,299,099 Light commercial vehicles Renault Alaskan 3,737 1,753 Captur 1,680 1,260 Clio 35,483 37,774 Dokker 14,046 4,275 GROUPE RENAULT - 11
14 Light commercial vehicles (continued) Renault Duster Oroch 36,732 31,353 Kangoo 101, ,768 Kangoo Z.E. 9,018 4,378 Logan 1,629 3,755 Master/Master Z.E. 102,024 95,504 Mégane 6,015 6,873 Other 15,594 14,255 Trafic 79,892 86,295 ZOE 1, Total Renault 408, ,968 Dacia Dokker 41,901 40,943 Duster 2,799 3,059 Lodgy Logan Other 7 1 Sandero Total Dacia 45,626 45,131 LADA 4x Granta 1,927 1,290 Largus 10,398 8,999 Other Total LADA 13,213 10,879 Jinbei & Huasong Total Jinbei & Huasong 152,187 0 Total Group, LCVs 619, ,978 Total Group, PCs + LCVs 3,884,295 3,762,077 Worldwide automotive market by region 2018 By volume and as a % of TIV, PCs + LCVs % TIV Volume (PCs + LCVs) Total Europe 17,655, % France 2,632, % G9 15,023, % Total Internationnal 75,256, % Africa, Middle East, India 7,794, % Eurasia 2,932, % Americas 6,020, % Asia-Pacific 39,213, % North America 19,295, % Total Worldwide 92,912, % Internationalization of the Group % of sales outside the Europe region 779, % 983, GROUPE RENAULT 37.4% 43.1% 1,172,696 1,277, % 50.5% 46.0% 42.5% 43.3% 49.2% 1,326, % (1) 2018 (2) (1) Inc. Lada from (2) Inc. Jinbei & Huasong from ,247,101 1,194,735 1,379,999 1,180,253 1,963,553 Groupe Renault worldwide sales by region PCs + LCVs, including Dacia, Renault Samsung Motors, LADA and Jinbei & Huasong Total Europe 1,920,742 1,911,824 France 689, ,868 G9 1,230,954 1,237,956 Total International 1,963,553 1,850,253 Africa, Middle East, India 448, ,118 Eurasia 747, ,795 Asia-Pacific 329, ,920 Americas 437, ,420 Total Worldwide 3,884,295 3,762,077 SALES, EUROPE REGION Total industry volumes, Europe region By volume of registrations PCs + LCVs nault Germany 3,724,752 3,715,174 United Kingdom 2,734,276 2,910,405 France 2,632,620 2,549,402 Italy 2,090,668 2,166,151 Spain + Canaries 1,536,545 1,434,593 Belgium + Luxembourg 689, ,174 Poland 599, ,763 Netherlands 523, ,939 Sweden 410, ,033 Austria 384, ,668 Switzerland 336, ,886 Czech Republic 281, ,706 Portugal 267, ,844 Denmark 253, ,673 Ireland 151, ,539 Norway 186, ,103 Hungary 159, ,465 Finland 136, ,583 Greece 110,554 94,852 Slovakia 107, ,689 Baltic States 86,941 78,733 Slovenia 85,571 83,041 Croatia 68,996 59,304 Balkan States 53,059 46,740 Iceland 19,871 23,496 Republic of Cyprus 15,372 15,148 Malta 9,084 8,586 TIV Europe 17,655,734 17,619,690 Market shares of main European countries 2018 As a % of TIV, PCs + LCVs Belgique + Luxembourg 3.9% Poland 3.4% Spain + Canaries 8.7% Other 20.7% 17,655,734 Italy 11.8% France 14.9% Germany 21.1% United Kingdom 15.5%
15 (1) and market share of the Renault brand As a % of TIV, PCs + LCVs Renault markets Germany 158, , Balkan States 4, , Austria 22, , Belgium + Luxembourg 66, , Republic of Cyprus Croatia 7, , Denmark 16, , Spain + Canaries 124, , Finland 4, , France 547, , Greece 4, , Hungary 8, , Ireland 10, , Iceland , Italy 142, , Malta Norway 5, , Baltic States 6, , Netherlands 48, , Poland 36, , Portugal 39, , Czech Republic 12, , United Kingdom 79, , Slovakia 5, , Slovenia 13, , Sweden 19, , Switzerland 16, , Total Renault 1,401, ,441, (1) Excluding sales to government departments. (1) and market share of the Dacia brand By volume and as a % of TIV, PCs + LCVs Dacia markets Germany 74, , Balkan States 4, , Austria 10, , Belgium + Luxembourg 21, , Republic of Cyprus Croatia 3, , Denmark 3, , Spain + Canaries 65, , Finland 2, , France 141, , Greece 1, Hungary 9, , Ireland 3, , Iceland Italy 66, , Malta Norway Baltic States 2, , Netherlands 4, , Poland 27, , Portugal 6, , Czech Republic 16, , United Kingdom 24, , Slovakia 5, , Slovenia 3, , Sweden 4, , Switzerland 8, , Total Dacia 511, , (1) Excluding sales to government departments. GROUPE RENAULT - 13
16 of the Alpine brand By sales volume PCs + LCVs Alpine markets Germany Austria 46 0 Belgium + Luxembourg 86 0 Spain + Canaries 27 0 France 1,156 7 Italy 35 0 Baltic States 1 0 Netherlands 52 0 Poland 16 0 Portugal 14 0 Czech Republic 2 0 United Kingdom Switzerland Total Alpine 1,943 7 of the Lada brand By sales volume PCs + LCVs Lada markets Germany 2,685 2,832 Balkan States Austria Belgium + Luxembourg Croatia 4 2 Spain + Canaries 2 1 Finland 9 13 Hungary 879 1,065 Italy Baltic States Poland Czech Republic Slovakia Slovenia 12 3 Sweden 6 0 Switzerland 5 24 Total LADA 5,801 5,683 Groupe Renault sales (1) by brand and model Volume, PCs + LCVs Passenger Cars Renault Captur 213, ,716 Clio 332, ,710 Espace 12,054 18,469 Kadjar 100, ,777 Kangoo/Kangoo Z.E. 20,749 22,993 Koleos 19,249 13,201 Master 1,041 1,246 Mégane 229, ,341 Other 1,094 1,104 Talisman 19,987 32,416 Trafic 17,226 18,219 Twingo 87,019 77,922 ZOE 38,425 30,562 Total Renault 1,092,610 1,140,676 Passenger Cars (continued) Dacia Dokker 32,446 30,524 Duster 171, ,211 Lodgy 28,496 28,680 Logan 36,809 37,640 Other 39 8 Sandero 208, ,174 Total Dacia 477, ,237 Alpine A110 1,943 7 Total Alpine 1,943 7 LADA 4x4 2,696 2,217 Granta Kalina 512 1,038 Other Vesta 1, Total LADA 5,421 5,343 Total Group, PCs 1,577,303 1,579,263 Light commercial vehicles Renault Alaskan 2,581 1,012 Captur 1,637 1,206 Clio 34,986 37,159 Kadjar Kangoo 82,482 82,158 Kangoo Z.E. 8,746 4,261 Master/Master Z.E. 81,575 74,619 Mégane 6,006 6,868 Other 14,310 12,779 Trafic 74,351 79,628 Twingo ZOE 1, Total Renault 308, ,674 Dacia Dokker 31,098 26,672 Duster 2,316 2,785 Lodgy Logan Other 7 1 Sandero Total Dacia 34,293 30,547 LADA 4x Other Total LADA Total Group, LCVs 343, ,561 Total Group, PCs + LCVs 1,920,742 1,911,824 (1) Including sales to government departments GROUPE RENAULT
17 SALES, AFRICA, MIDDLE EAST, INDIA REGION Total industry volumes, Africa, Middle East, India region By volume, PCs + LCVs Main markets India 3,983,507 3,675,139 Iran 959,628 1,429,172 South Africa + Namibia 525, ,828 Saudi Arabia 411, ,102 Israel 269, ,472 Pakistan 256, ,725 Morocco 177, ,593 Egypt 180, ,941 Dubai (UAE) 160, ,350 Algeria 127, ,183 Kuwait 102, ,523 Total TIV Africa, Middle East, India 7,794,511 8,006,628 Renault sales (1) and market share By volume and as a % of TIV, PCs + LCVs Main Renault markets Iran 101, , India 82, , Algeria 37, , Morocco 25, , South Africa + Namibia 25, , Egypt 18, , DOM (2) 13, , Israel 11, , Saudi Arabia 6, , Tunisia 4, , Total Renault 348, , (1) volume + brokers + Nitco. (2) DOM: Réunion, Martinique, Guadeloupe, French Guiana, and Saint-Pierre and Miquelon. Dacia sales (1) and market share By sales volume and % TIV PCs + LCVs Main Dacia markets Morocco 49, , Algeria 33, , DOM (2) 6, , Israel 4, , Tunisia 1, , Lebanon Mayotte Total Dacia 96, , (1) volume + brokers + Nitco. (2) DOM: Réunion, Martinique, Guadeloupe, French Guiana, and Saint-Pierre and Miquelon. LADA sales (1) By sales volume, PCs + LCVs Main LADA markets Egypt 2,001 1,003 Lebanon Cuba Tunisia Jordania Total LADA 3,090 1,543 (1) volume + brokers + Nitco. GROUPE RENAULT - 15
18 Jinbei & Huasong By sales volume, PCs + LCVs Main Jinbei & Huasong marketsde LADA Egypt Cuba Total Jinbei & Huasong Groupe Renault sales (1) by brand and model By volume, PCs + LCVs Passenger Cars Renault Captur 7,412 8,795 Captur GA 3,680 1,346 Clio 41,046 28,534 Duster 24,936 28,919 Kadjar 8,638 8,237 Kangoo/Kangoo Z.E. 9,424 9,296 Koleos 6,299 10,799 Kwid 77, ,790 Lodgy 1,228 3,445 Logan 88, ,839 Mégane 11,812 7,116 Other 39 1,272 Sandero 49,852 61,273 Talisman 2,120 9,404 Twingo 842 1,158 Trafic ZOE Total Renault 334, ,906 Dacia Dokker 13,094 11,383 Duster 13,666 10,696 Lodgy 3,360 5,601 Logan 14,332 14,527 Sandero 49,607 46,745 Total Dacia 94,059 88,952 LADA 4x Granta 2,047 1,022 Kalina Largus Vesta XRAY 0 0 Total LADA 3,008 1,467 Jinbei Total Jinbei 20 0 Total Group, PCs 431, ,325 Light commercial vehicles Renault Alaskan Captur Clio Dokker 2,912 1,707 Duster Oroch Kangoo/Kangoo Z.E. 3,188 3,435 Logan 1,629 3,755 Master 3,702 3,811 Other Trafic Total Renault 13,630 14,458 Dacia Dokker 2,734 3,146 Duster Sandero Total Dacia 2,830 3,259 LADA Largus Total LADA Jinbei Total Jinbei Total Group, LCVs 17,336 17,793 Total Group, PCs + LCVs 448, ,118 (1) volume + brokers GROUPE RENAULT
19 SALES, EURASIA REGION Total industry volumes, Eurasia region By volume, PCs + LCVs Main markets Russia 1,800,351 1,595,737 Turkey 620, ,194 Romania 182, ,370 Ukraine 86,613 87,634 Uzbekistan 61,400 58,800 Kazakhstan 58,276 46,840 Belarus 51,767 34,809 Bulgaria 42,907 38,394 Total TIV Eurasia 2,932,751 2,992,872 Renault sales and market share By sales volume and % TIV PCs + LCVs Main Renault markets Russia 137, , Turkey 85, , Romania 14, , Belarus 11, , Ukraine 11, , Bulgaria 4, , Total Renault 267, , Dacia sales and market share By sales volume and % TIV PCs + LCVs Main Dacia markets Romania 54, , Turkey 29, , Bulgaria 5, , Moldova 1, , Total Dacia 90, , LADA sales and market share By sales volume and % TIV PCs + LCVs Main Lada markets Russia 360, , Kazakhstan 13, , Belarus 10, , Uzbekistan 2, Azerbaijan 1, Ukraine Bulgaria Total LADA 389, , Jinbei sales By sales volume, PCs + LCVs Main Jinbei markets Armenia Total Jinbei GROUPE RENAULT - 17
20 Goupe Renault sales by brand and model By volume, PCs + LCVs Passenger Cars Renault Captur 5,926 6,866 Captur GA 32,232 32,671 Clio 33,665 42,935 Dokker 1, Duster 48,618 51,297 Kadjar 5,318 7,210 Kangoo/Kangoo Z.E Koleos 1,947 1,366 Lodgy Logan 48,106 58,299 Master Mégane 35,609 47,193 Other Sandero 36,782 35,447 Talisman 1,036 2,284 ZOE Total Renault 252, ,277 Dacia Dokker 3,223 3,100 Duster 27,792 26,843 Lodgy 4,031 5,296 Logan 27,295 22,750 Sandero 19,994 28,088 Total Dacia 82,335 86,077 LADA 110 2,050 3, ,279 16,674 4x4 38,716 33,087 Granta 110,287 97,206 Kalina 684 1,209 Largus 48,243 36,174 Priora 8,995 16,846 Vesta 117,435 78,167 XRAY 37,588 33,822 Total LADA 376, ,509 Total Group, PCs 710, ,863 Renault sales and market share By sales volume and % TIV PCs + LCVs Renault Samsung Motors sales and market share By sales volume and % TIV PCs 18 - GROUPE RENAULT Light commercial vehicles Renault Dokker 2,662 1,643 Kangoo/Kangoo Z.E. 5,533 10,966 Master 4,852 6,396 Trafic 2,198 3,148 Total Renault 15,245 22,153 Dacia Dokker 8,069 11,125 Duster Logan Total Dacia 8,503 11,325 LADA 4x Granta 1,927 1,290 Largus 10,314 8,914 Total LADA 12,749 10,454 Jinbei Total Jinbei Total Group, PCs 36,697 43,932 Total Group, PCs + LCVs 747, ,795 SALES, ASIA-PACIFIC REGION Total industry volumes, Asia-Pacific region By volume, PCs + LCVs Main markets China 27,007,879 27,496,812 Japan 5,167,111 5,121,638 South Korea 1,784,614 1,762,094 Australia 1,121,396 1,161,614 Indonesia 1,051, ,299 Thailand 1,047, ,503 Malaysia 603, ,636 Taiwan 417, ,657 Philippines 408, ,981 Vietnam 242, ,998 New Zealand 156, ,655 Singapore 93, ,127 Hong Kong 39,324 41,906 Myanmar 14,409 7,047 Brunei 13,000 12,800 Total TIV Asia-Pacific 39,213,810 39,469, Main Renault markets China 52, , Australia 10, , Japan 7, , South Korea 5, Malaysia Singapore , Tahiti Total Renault 79, , Dacia sales and market share By sales volume TIV PCs + LCVs Main Dacia markets New Caledonia Tahiti Total Dacia 1,449 1, Main Renault Samsung Motors markets South Korea 84, , Total Renault Samsung Motors 84, ,
21 Alpine sales By volume, PCs Main Alpine markets Japan Australia 32 0 Total Alpine LADA sales By volume, PCs Main LADA markets China 0 1,215 Total LADA 0 1,215 Jinbei & Huasong sales By volume, PCs + LCVs Main Jinbei & Huasong markets China 163,965 0 Myanmar 67 0 Laos 4 0 Total Jinbei & Huasong 164,036 0 Groupe Renault sales by brand and model By volume, PCs + LCVs Passenger Cars Renault Captur 2,457 2,998 Clio 6,061 2,778 Duster Fluence/Fluence Z.E Kadjar 18,744 25,894 Kangoo/Kangoo Z.E. 2,229 2,095 Koleos 36,064 46,931 Kwid Mégane 2,734 2,551 Other 2,274 1,132 Twingo 2,756 2,847 ZOE Total Renault 73,808 88,031 Dacia Duster Lodgy Logan Sandero Total Dacia 1,449 1,418 Renault Samsung Motors QM3 6,367 12,228 QM6 32,999 27,837 SM3/SM3 Z.E. 6,485 7,213 Renault Samsung Motors (continued) SM5 9,492 7,247 SM6 24,800 39,389 SM7 4,811 5,932 Total Renault Samsung Motors 84,954 99,846 Alpine A Total Alpine LADA 4x4 0 1,215 Total LADA Jinbei & Huasong Total Jinbei & Huasong 13,396 0 Total Group, PCs 173, ,510 Light commercial vehicles Renault 2018 Kangoo/Kangoo Z.E. 1,101 1,148 Master 2,242 2,129 Trafic 2,006 2,133 Total Renault 5,349 5,410 Jinbei & Huasong 150,640 0 Total Jinbei & Huasong 150,640 0 Total Group, PCs 155,989 5,410 Total Group, PCs + LCVs 329, ,920 SALES, AMERICAS REGION Total industry volumes, Americas region By volume, PCs + LCVs Main markets Brazil 2,468,434 2,172,738 Mexico 1,421,458 1,530,317 Argentina 773, ,824 Chile 417, ,029 Colombia 245, ,662 Peru 147, ,000 Ecuador 130,783 99,345 Porto Rico 90,000 90,650 Total TIV Americas 6,020,748 5,860,627 GROUPE RENAULT - 19
22 Renault sales and market share By sales volume and % TIV PCs + LCVs Main Renault markets Brazil 214, , Argentina 114, , Colombia 49, , Mexico 27, , Chile 13, , Uruguay 5, , Peru 5, , Ecuador 2, , Bolivia 1, , Total Renault 436, , of the LADA brand By volume, PCs Main LADA markets Chile Bolivia Total LADA of the Jinbei brand By volume, LCVs Main Jinbei markets ult Bolivia Peru Total Jinbei Groupe Renault sales by brand and model By volume, PCs + LCVs Passenger Cars Renault Captur 1,025 1,390 Captur GA 43,007 28,152 Clio 2,698 4,523 Dokker 1,132 1 Duster 62,820 59,594 Fluence/Fluence Z.E. 1,631 5,085 Kangoo 1,379 2,342 Koleos 4,596 3,926 Kwid 92,992 23,187 Logan 57,563 62,683 Master Other Sandero 101, ,313 ZOE Total Renault 371, ,933 LADA 4x Granta 42 0 Kalina 22 0 Largus 9 0 Vesta 32 0 Total LADA Total Group, PCs 371, ,138 Light commercial vehicles Renault Alaskan Clio 0 69 Dokker 8, Duster Oroch 36,366 31,130 Kangoo/Kangoo Z.E. 9,282 21,178 Master 9,653 8,549 Trafic Total Renault 65,213 63,273 LADA Largus 2 9 Total LADA 2 9 Jinbei Total Jinbei Total LCVs Groupe 65,768 63,282 Total PCs + LCVs Groupe 437, ,420 Groupe Renault electric vehicles world sales By volume, PCs + LCVs ZOE 40,508 31,916 Kangoo Z.E. 9,021 4,381 Master Z.E Fluence Z.E SM3 Z.E. 1,235 2,014 Total Z.E. 50,872 38,344 Twizy Total Twizy 3,916 2, GROUPE RENAULT


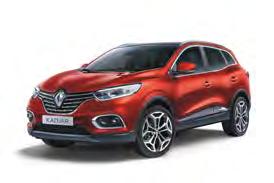
23 VEHICLE RANGE RENAULT Passenger cars Europe Scénic Also exists in an Grand Scénic version Kangoo Twingo Kadjar Trafic Combi Sport cars Clio Also exists in an Estate version Koleos Twingo GT Captur Talisman Also exists in an Estate version Clio R.S. Mégane Also exists in an Estate version Espace Mégane R.S. GROUPE RENAULT - 21


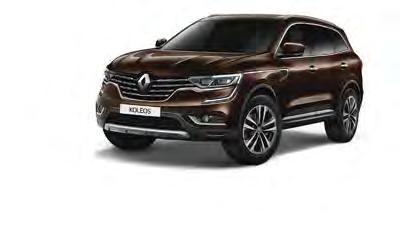
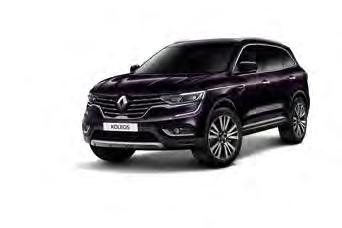
24 RENAULT Passenger cars internationally Kwid Oroch Logan Mégane Sedan Sandero Stepway Kaptur New Duster Koleos 22 - GROUPE RENAULT


25 RENAULT Light commercial vehicles Kangoo Express Master Trafic Alaskan Electric vehicles Twizy Kangoo Z.E. ZOE New Master Z.E. ALPINE Alpine A110 GROUPE RENAULT - 23


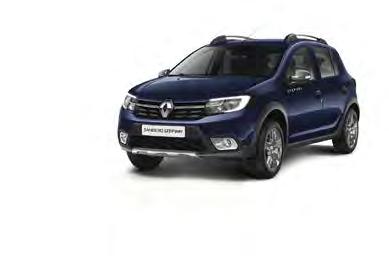
26 DACIA Passenger cars Dokker and Dokker Stepway Lodgy and Lodgy Stepway Duster Sandero and Sandero Stepway Logan Logan MCV and Logan MCV Stepway Light commercial vehicles Dokker Van 24 - GROUPE RENAULT


27 RSM SM7 QM6 SM6 SM. QM3 SM5 SM3 Z.E. SM3 GROUPE RENAULT - 25

28 LADA Vesta SW Cross Largus Vesta SW Granta XRAY 4x4 Vesta 26 - GROUPE RENAULT
29 POWERTRAIN RANGE As a full-line carmaker, Groupe Renault offers a range of powertrains adapted to the needs of its customers around the world. Engines Gearboxes Diesel engines Petrol engines Electric motors Normally aspirated Turbo Manual gearboxes Automated manual gearboxes Automatic gearboxes K9K dci 70/75/ 85/90/95/110/ Blue dci 75/95/115 R9M Single Turbo dci 90/95/ 115/120/130 R9M Twin Turbo dci 120/125/ 140/145/160/165 R9N Blue dci 120/150 M9R dci 175 Blue dci 160/200 M9T dci 110/125/ 130/150/160 M9T Twin Turbo dci130/135/ 145/165/ 170/190 YD25 dci 165/190 B4A SCe 55 H4D SCe 70 K4M 1,6 16v 95/105/110 1,6 16v Hi-Flex D4F v 65/75 B4D SCe 70/75 SCe 70 Flex / SCe 80 Flex H4M SCe 110/115 1,6 SCe Flex Sce 110/115 LPG K7M 1,6MPI 85 1,8 8v 85 M4R SCe 140/145 M5R SCe 140/145 F4R v v 150 Flex 2TR SCe 175 H4Dt TCe 100 / TCe LPG H4Bt TCe 90/110 M5Mt TCe 150/165/ 190/200/205 R.S. 200/220 F4R Turbo GT 190 R.S. 265/275 H5Ht TCe 115/130/ 140/150/160 H5Ft TCe 100/115/ 120/125/130 M5Pt TCe 225/ 250/300 H4M SCe 110/ SCe Flex SCe 110/115 LPG 3CG 4 kw/13 kw 5AM Gen2 65 kw/70 kw 5AL Gen3 63 kw 5AQ Gen3 44 kw/68 kw SG1 MT5 100 Nm JB3-JH3-JHQ MT5 160 Nm JRQ MT5 200 Nm TL4 MT6 260 Nm TL8 MT6 260 Nm ND4 ZF4 MT6 320 Nm MT6 380 Nm ND8 MT6 360/ 380 Nm PK4 MT6 400 Nm ZG64 MT6 450 Nm PF6 MT6 380 Nm ND5 MT6 360 Nm TL6 MT6 300 Nm SA1 AMT5 120 Nm JS3 MT5 160 Nm TS4 AMT6 260 Nm PA0 AMT6 380 Nm ZG6 2WD MT6 450 Nm DP AT4 2WD/4WD 250 Nm AJ AT6 2WD/4WD 450 Nm DC EDC 170/240 Nm DW6 EDC Nm DW5 EDC Nm DXK X-Tronic CVT 150/ 250/380 Nm FK X-Tronic 4WD CVT 250/380 Nm HG AT7 4WD 450 Nm GROUPE RENAULT - 27
30 SERVICES PURCHASING The Purchasing Division buys the parts, services, and equipment required for Groupe Renault s worldwide operations. Cost of Groupe Renault purchases Scope: worldwide in billion of euros Automotive components (1) Industrial goods, tertiary purchasing and services, logistics After-sales (2) Total (1) Including Alliance component purchasing (Nissan, Daimler and AVTOVAZ). (2) Including tires and accessories purchasing. Number of Groupe Renault suppliers Renault SAS, including subsidiaries. Suppliers, Legal Entities with revenue of at least 6,000 during the year Automotive components 3,629 2,895 Industrial goods, tertiary purchasing and services, logistics 13,119 11,728 After-sales SUPPLY CHAIN The Supply Chain s activities extend from parts suppliers all the way to the transport of vehicles to customers; and from the project phase through to production and delivery. AILN platform activities Volumes (in m 3 ) at December 31, 2018 AILN Platforms Total IPO (1) export activity KD (2) export activity Local distribution activity (3) Import activity Bursa (Turkey) 1,001, ,433 10, ,848 79,058 Busan (South Korea) 120, ,804 Chennai (India) 146, ,023 5,222 Córdoba (Argentina) 25,942 25,942 Curitiba (Brazil) 395, ,365 Grand-Couronne (France) 399, ,527 34,452 Mioveni (Romania) 2,448,747 2,314, ,835 Moscow (Russia) 436, ,372 Pune (India) 104, ,669 2,872 Tangiers (Morocco) 131, ,004 Valladolid (Spain) 342, ,301 27,999 42, ,312 Total 5,552,487 4,924,352 38, , ,657 (1) IPO: Individual Parts Order. (2) KD: Knock Down. (3) Local distribution activity (for after-sales). SALES NETWORK Goupe Renault sells its vehicles worldwide through more than 13,000 points of sales. There are 11,627 sites for Renault, 7,917 for Dacia (majority in common with Renault), 664 for RSM, 619 for LADA, 75 for Alpine and 160 for Jinbei. Number of Renault sites at the end of 2018 Region R1 sites incl. France R2 sites incl. France Total Europe 2, ,832 3,318 8,358 AMI 1, ,489 Eurasia Asia-Pacific Americas Total 5,482 6,145 11, GROUPE RENAULT
31 RCI BANK AND SERVICES RCI Bank and Services is a wholly-owned subsidiary of Renault SAS. New financing and outstanding loans In million of euros Penetration rate excluding companies accounted (1) (for NV) 42.9% 42.6 New vehicle financing 20,922 20,604 Number of vehicle contracts (in thousands) 1,799 1,771 Average performing assets 44,402 39,649 (1) Companies accounted for under the equity method are Russia, Turkey and India. Services activity: the group is stepping up the development of this activity, with 4,839,000 contracts sold in Penetration and net assets by region Net assets at year-end as a % and in million of euros France 47.5% 46.7% 14,324 13,315 Europe (with France) 44.9% 43.3% 41,832 39,028 Africa, Middle East, India 27.8% 21.8% Americas 35.0% 38.8% 2,769 2,637 Eurasia 27.0% 26.7% Asia-Pacific 56.8% 57.4% 1,578 1,561 RENAULT TECH Mission For the past ten years, Renault Tech, an industrial diversity assembler, has been designing, producing and marketing vehicle transformations and offering related services for the entire Groupe Renault, the Alliance and partners, in response to the needs of individual and professional customers, in compliance with the Group s Quality standards key figures 509 WORKFORCE M REVENUE 296,660 TRANSFORMATIONS Douai Maubeuge Batilly 12 satellites opened at Groupe Renault factories (including Dacia) Head office and dedicated factory department Sandouville Heudebouville Flins Le Plessis-Robinson Palencia Valladolid SPAIN FRANCE ROMANIA SLOVENIA Pitesti Novo Mesto Bursa TURKEY Tangiers Casablanca MAROCCO GROUPE RENAULT - 29
32 RENAULT-NISSAN-MITSUBISHI SYNERGIES 2017, Mitsubishi Motors reports first full year of synergies as Alliance member. The Alliance generated 5.7 billion in synergies in 2018, and is well on the way to generating more than 10 billion in synergies in Evolution of synergies In million of euros The amount of synergies is reviewed by the Controllers of each company. Only new synergies are taken into account. Synergies come from cost reductions, cost avoidance and revenue increases OBJECTIVE BILLION 300 2,465 4,316 2,115 3,802 1,687 1,332 2,872 1,540 1,528 2,691 1, , , ,851 2,300 3,100 5,700 2,700 5,025 2,265 Renault Nissan Mitsubishi SALES Renault-Nissan-Mitsubishi reported strong growth in 2018, with more than 10,756,875 vehicles sold worldwide. The Alliance maintained its position as leader of the zero-emissions-vehicle segment, with cumulated sales of 724,905 electric vehicles since Top 10 Alliance markets in 2018 By sales volume and % TIV PCs + LCVs # Countries Market share 1 China 1,920, % 2 United States 1,611, % 3 France 763, % 4 Japan 727, % 5 Russia 648, % 6 Mexico 355, % 7 Germany 343, % 8 United Kingdom 334, % 9 Italy 277, % 10 Brazil 275, % rankings by group in 2018 By volume PCs + LCVs (thousands of vehicles) R-N-MMC Alliance +1.4% Wolkswagen Group +0.9% Toyota +1.9% GM 12.7% Hyundai-KIA +0.5% Ford 9.5% Nissan 2.8% Honda +1.3% FCA +2.2% Groupe Renault incl. LADA +3.3% PSA +6.8% Suzuki +5.5% Daimler +0.4% BMW +1.1% Mazda +2.0% Subaru +18,3 % Mitsubishi +0,4% 10,757 10,629 10,390 8,384 7,294 5,982 5,654 5,255 4,842 3,884 3,878 3,334 2,773 2,491 1,615 1,219 1, GROUPE RENAULT
33 Photo credits: Cover: Julien Oppenheim P. 2-3 : Yannick Brossard, Jean-Brice Lemal, Amy Shore, Renault Samsung Motors P : Renault Marketing 3D-Commerce P. 25: Renault communication P. 26: AVTOVAZ Group Design and production: Printing: Relais Graphique.
34 Find all our latest news on and follow us on @GroupeRenault Renault 13-15, quai Le Gallo Boulogne-Billancourt Cedex France Tel.: 33 (0) Groupe Renault Communications
GROUPE RENAULT FACTS & FIGURES. March 2018 edition
 GROUPE RENAULT FACTS & FIGURES March 2018 edition CONTENTS GROUPE RENAULT 4 / Key figures 5 / One Group, 5 brands 6 / Drive the Future 2017-2022 8 / 2017 Highlights 9 / 2017 Launches/AVTOVAZ 10 / Highlights
KEY FIGURES. 1 st HALF OF 2014 ADDENTUM & UPDATE SEPTEMBER 2014 ATLAS RENAULT 2013 DRIVE THE CHANGE
 KEY FIGURES 1 st HALF OF 2014 ADDENTUM & UPDATE SEPTEMBER 2014 ATLAS RENAULT 2013 DRIVE THE CHANGE RENAULT ATLAS SEPTEMBER 2014 03 TABLE OF CONTENT RENAULT GROUP 05 Key figures 06 Structure of the Renault
BP Statistical Review of World Energy June 2017
 BP Statistical Review of World Energy June 217 Primary energy 8 Consumption 8 Consumption by fuel 9 66 th edition Primary energy Consumption* Growth rate per annum Million tonnes oil equivalent 26 27 28
ATLAS RENAULT 2015 MARCH EDITION 2016
 ATLAS RENAULT 2015 MARCH EDITION 2016 CONTENTS 1 2 3 02 / GROUPE RENAULT 04 / Key figures 05 / One group, three brands 06 / Highlights 2015 07 / Launches 2015 08 / Highlights for the Europe region 10
67 th edition. Renewable energy. Appendices. 44 Other renewables consumption 45 Biofuels production
 Renewable energy 44 Other renewables consumption 45 Biofuels production Appendices A1 Solar Generation A2 Wind Generation A3 Geothermal, biomass and other Generation A4 Geothermal Cumulative installed
2006 commercial results, a year of transition for the Renault Group
 PRESS RELEASE 2006 commercial results, a year of transition for the Renault Group International sales continue to rise, performance reduced in Europe* JANUARY 5, 2007 4% drop in worldwide sales a result
Infographics on Electromobility (January 2019)
") Infographics on Electromobility (January 2019) Publisher: BMW Group Corporate Communications Electromobility Last Update: 04.01.2019 Contact: presse@bmw.de ELECTROMOBILITY IN GERMANY. SHARE IN NEW REGISTRATIONS
Infographics on Electromobility (January 2019) Publisher: BMW Group Corporate Communications Electromobility Last Update: 04.01.2019 Contact: presse@bmw.de ELECTROMOBILITY IN GERMANY. SHARE IN NEW REGISTRATIONS
Primary energy. 8 Consumption 9 Consumption by fuel. 67 th edition
 Primary energy 8 Consumption 9 Consumption by fuel 67 th edition Primary energy Consumption* Growth rate per annum Million tonnes oil equivalent 27 28 29 2 211 212 213 214 215 216 217 217 26-16 Share 217
Imports of seed for sowing by country Calendar year 2011 Source: ISF compilation based on official statistics and international seed trade reports
 USA 157,432 15,562 464 173,458 523 318 67 908 Germany 195,159 5,913 520 201,592 595 97 22 714 France 125,701 4,389 277 130,367 522 150 11 683 Netherlands 140,899 12,253 796 153,948 250 330 48 628 Italy
Global Dialysis - Cost per Dialysis Session
 Cost per session for dialysis where a cost has been entered for a dialysis centre. All costs have been converted to US Dollars as at 19 May 2006. Note that the costs do not state what is covered by a dialysis
Summary of debt securities outstanding
 Summary of debt securities outstanding All countries........................ 22,695 15,852 6,665 3,427 1,762 Developed countries........................ 16,504 13,087 5,869 2,716 701 Austria 510 173 44
Table 5 Production, trade and supply of hard coal Thousand metric tons and kilograms per capita
 Table Notes Production includes production from other sources as defined in the previous table. Data for China include brown coal. Please refer to the Definitions Section on pages ix to xv for the appropriate
35,000 52,000 87,000 1,600 8, ,400 76,600. Mean Crop. Monthly YTD Min ,671 8,211 Max. 2017
 YTD Inventory / Shipment Report In Shell Basis Crop: 2018 Monthly Market Prices FCA Hamburg Iranian Dried In Shell 28/30 Fandoghi Pistachios Total Consumption Ending Inventory 2nd Marketing Month YTD Carry
World Air Conditioner Demand by Region
 World Air Conditioner Demand by Region April 2015 The Japan Refrigeration and Air Conditioning Industry Association 1 World Air Conditioner Demand by Region April 2015 The Japan Refrigeration and Air Conditioning
Fiche 1 Quelques données de la Banque Mondiale
 Fiche 1 Quelques données de la Banque Mondiale 274 WORLD DEVELOPMENT REPORT 2000 2001 Table 1. Size of the economy Surface Population area density Gross national product (GNP) GNP per capita GNP measured
19,000 38,500. Mean Crop. 5, ,827 Max , ,869 Last Year 6, ,
 YTD Inventory / Shipment Report In Shell Basis Crop: 2017 Monthly Market Prices FCA Hamburg Iranian Dried In Shell 28/30 Fandoghi Pistachios 10th Marketing Month YTD Carry in from previous year 3,000 Total
Spain s exports by oil product group and country of destination
 Corporación de Reservas Estratégicas de Productos Petrolíferos Castellana, 79 28046 Madrid T. +34 91 360 09 10 Updated F. +34 91 420 on39 45 www.cores.es February 13 th 2017 Spain s exports by oil product
KINGDOM OF CAMBODIA NATION RELIGION KING 3
 KINGDOM OF CAMBODIA NATION RELIGION KING 3 TOURISM STATISTICS REPORT March 2015 MINISTRY OF TOURISM Statistics and Tourism Information Department No. A3, Street 169, Sangkat Veal Vong, Khan 7 Makara, Phnom
I. World trade in Overview
 I. World trade in - Overview Table I.1 Growth in the volume of world merchandise exports and production, 2-5 (Annual percentage change) 2-5 23 24 World merchandise exports 4.5 5. 9.5 6. Agricultural products
KINGDOM OF CAMBODIA NATION RELIGION KING 3
 KINGDOM OF CAMBODIA NATION RELIGION KING 3 TOURISM STATISTICS REPORT December 2015 MINISTRY OF TOURISM Statistics and Tourism Information Department No. A3, Street 169, Sangkat Veal Vong, Khan 7 Makara,
Table 23 Production of minor oil products from refineries - by type Thousand metric tons
 Table 23 Production of minor oil from refineries - by type Table Notes Data refer to production from refineries of refinery, ethane, naphtha, lubricants, bitumen, paraffin, petroleum, white spirit, and
KINGDOM OF CAMBODIA NATION RELIGION KING 3
 KINGDOM OF CAMBODIA NATION RELIGION KING 3 TOURISM STATISTICS REPORT March 2018 MINISTRY OF TOURISM Statistics and Tourism Information Department No. A3, Street 169, Sangkat Veal Vong, Khan 7 Makara, Phnom
KINGDOM OF CAMBODIA NATION RELIGION KING 3
 KINGDOM OF CAMBODIA NATION RELIGION KING 3 TOURISM STATISTICS REPORT February 2017 MINISTRY OF TOURISM Statistics and Tourism Information Department No. A3, Street 169, Sangkat Veal Vong, Khan 7 Makara,
Spain s exports by oil product group and country of destination. Year Corporación de Reservas Estratégicas de Productos Petrolíferos
 Corporación de Reservas Estratégicas de Productos Petrolíferos Castellana, 79 28046 Madrid T. +34 91 360 09 10 Updated F. +34 91 420 on39 45 www.cores.es July 13 th 2015 Spain s exports by oil product
KINGDOM OF CAMBODIA NATION RELIGION KING 3
 KINGDOM OF CAMBODIA NATION RELIGION KING 3 TOURISM STATISTICS REPORT May 2017 MINISTRY OF TOURISM Statistics and Tourism Information Department No. A3, Street 169, Sangkat Veal Vong, Khan 7 Makara, Phnom
KINGDOM OF CAMBODIA NATION RELIGION KING 3
 KINGDOM OF CAMBODIA NATION RELIGION KING 3 TOURISM STATISTICS REPORT October 2017 MINISTRY OF TOURISM Statistics and Tourism Information Department No. A3, Street 169, Sangkat Veal Vong, Khan 7 Makara,
AlixPartners Automotive Electrification Index. Second Quarter 2017
 AlixPartners Automotive Electrification Index Second Quarter 217 AlixPartners Automotive Electrification Index e-range E-RANGE = Sum of electric range of all electric vehicles (EV) sold By automaker, segment,
KINGDOM OF CAMBODIA NATION RELIGION KING 3
 KINGDOM OF CAMBODIA NATION RELIGION KING 3 TOURISM STATISTICS REPORT September 2017 MINISTRY OF TOURISM Statistics and Tourism Information Department No. A3, Street 169, Sangkat Veal Vong, Khan 7 Makara,
Production of heat by type Terajoules
 Production of heat by type Table Notes geo represents heat used directly for district heating, agriculture etc. without a commercial transaction taking place. represents heat used for the production of
Production of minor oil products from refineries - by type Thousand metric tons
 Production of minor oil from refineries - by type Table 23 Table Notes Data refer to production from refineries of refinery, ethane, naphtha, lubricants, bitumen, paraffin, petroleum, white spirit, and
Total credit to the non-financial sector (core debt), % of GDP Table F1.1
, % of GDP Table F1.1") Total credit to the non-financial sector (core debt), % of GDP Table F1.1 2012 2013 2014 2015 2016 Q2 16 Q3 16 Q4 16 Q1 17 Q2 17 Argentina 62.6 66.4 64.6 75.5 75.3 81.7 80.1 75.3 71.6 72.7 Australia 208.0
Total credit to the non-financial sector (core debt), % of GDP Table F1.1 2012 2013 2014 2015 2016 Q2 16 Q3 16 Q4 16 Q1 17 Q2 17 Argentina 62.6 66.4 64.6 75.5 75.3 81.7 80.1 75.3 71.6 72.7 Australia 208.0
Production of heat by type Terajoules
 Production of heat by type Table Notes geo represents heat used directly for district heating, agriculture etc. without a commercial transaction taking place. Please refer to the Definitions Section on
WORLD MOTOR VEHICLE PRODUCTION BY COUNTRY AND TYPE QUARTERS June 14, 2018
 QUARTERS 2017-2018 June 14, 2018 CONTENTS BASEPROTOTAL BASEPROCARS BASEPROLCV BASEPROHCV BASEPROBC Summation of cars, LCVs, HCVs, heavy buses Cars LCVs HCVs Heavy buses Note: The production of cars and
KINGDOM OF CAMBODIA NATION RELIGION KING 3
 KINGDOM OF CAMBODIA NATION RELIGION KING 3 TOURISM STATISTICS REPORT October 2018 MINISTRY OF TOURISM Statistics and Tourism Information Department No. A3, Street 169, Sangkat Veal Vong, Khan 7 Makara,
KINGDOM OF CAMBODIA NATION RELIGION KING 3
 KINGDOM OF CAMBODIA NATION RELIGION KING 3 TOURISM STATISTICS REPORT September 2018 MINISTRY OF TOURISM Statistics and Tourism Information Department No. A3, Street 169, Sangkat Veal Vong, Khan 7 Makara,
RENAULT-NISSAN ALLIANCE DELIVERS SIGNIFICANT GROWTH IN 2016, EXTENDS ELECTRIC VEHICLE SALES RECORD
 RENAULT-NISSAN ALLIANCE DELIVERS SIGNIFICANT GROWTH IN 2016, EXTENDS ELECTRIC VEHICLE SALES RECORD Alliance sales reach 9,961,347 vehicles in 2016 one in nine cars sold worldwide. The Alliance confirms
FEDERAL RESERVE statistical release
 FEDERAL RESERVE statistical release FOR IMMEDIATE RELEASE MARCH 16, 1992 E.U C1Z1, GEOGRAPHICAL r DISTRIBUTION n OF e ASSETS AND^LIABILITIES (IN MILLIONS OF DOLLARS) ASSETS COUNTRY OF CUSTOMER 12/31/90
NEW PASSENGER CAR REGISTRATIONS EUROPEAN UNION 1
 PRESS EMBARGO: 8.00 AM (7.00 AM GMT), 14 December 2017 NEW PASSENGER CAR REGISTRATIONS EUROPEAN UNION 1 Passenger car registrations: +4.1% over 11 months; +5.9% in In 2017, registrations of new passenger
Table 13 Production, trade and supply of conventional crude oil Thousand metric tons; kilograms per capita; reserves production ratio (R/P) in years
 in years") , trade and supply of conventional crude oil Thousand metric tons; kilograms per capita; reserves production ratio (R/P) in years Table Notes The Reserves / ratio refers to crude oil and natural gas liquids.
, trade and supply of conventional crude oil Thousand metric tons; kilograms per capita; reserves production ratio (R/P) in years Table Notes The Reserves / ratio refers to crude oil and natural gas liquids.
AUSTRIA. Table 1. FDI flows in the host economy, by geographical origin. (Millions of US dollars)
") Table 1. FDI flows in the host economy, by geographical origin World 5 690 138 6 195 3 184 10 784 7 933 31 154 6 858 9 303 840 10 618 5 760 Developed economies 5 740 13 5 341 2 689 10 137 6 291 29 721
Table 1. FDI flows in the host economy, by geographical origin World 5 690 138 6 195 3 184 10 784 7 933 31 154 6 858 9 303 840 10 618 5 760 Developed economies 5 740 13 5 341 2 689 10 137 6 291 29 721
Global Competitiveness Index Rankings
 APPENDIX B Global Competitiveness Index 2017 2018 Rankings The following pages report the GCI 2017 2018 rankings for the three subindexes (Table 1) and their corresponding pillars (Tables 2 4). Detailed
Natural gas. 26 Reserves 28 Production and consumption 33 Prices 34 Trade movements. 67 th edition
 Natural gas 26 Reserves 28 Production and consumption 33 Prices 34 Trade movements 67 th edition Natural gas Total proved reserves At end 1997 At end 2007 At end 2016 At end Trillion Trillion Trillion
ACEA Report. Vehicles in use Europe 2017
 ACEA Report Vehicles in use Europe 2017 TABLE OF CONTENTS Summary... 2 Vehicles in use in Europe... 3 Passenger cars... 3 Light commercial vehicles... 4 Medium and heavy commercial vehicles... 5 Buses...
ACEA Report. Vehicles in use Europe 2018
 ACEA Report Vehicles in use Europe 2018 TABLE OF CONTENTS Summary... 2 Vehicles in use in Europe... 3 Passenger cars... 3 Light commercial vehicles... 4 Medium and heavy commercial vehicles... 5 Buses...
Table 13 Production, trade and supply of conventional crude oil Thousand metric tons; kilograms per capita; reserves production ratio (R/P) in years
 in years") Million metric tons Million metric tons Table 13, trade and supply of conventional crude oil Thousand metric tons; kilograms per capita; reserves production ratio (R/P) in years Table Notes The Reserves
Million metric tons Million metric tons Table 13, trade and supply of conventional crude oil Thousand metric tons; kilograms per capita; reserves production ratio (R/P) in years Table Notes The Reserves
Table 16 Refinery distillation capacity, throughput and output Thousand metric tons
 Table 16 Refinery distillation capacity, throughput and output Table Notes Output is equal to the sum of production from refineries for aviation gasoline, bitumen, gas/diesel oil, ethane, feedstocks, gasoline-type
RENAULT GROUP SOCIETE GENERALE CONFERENCE
 RENAULT GROUP SOCIETE GENERALE CONFERENCE DOMINIQUE THORMANN, EVP, CFO & RCI Banque CEO NOVEMBER 30th, 2011 DISCLAIMER Information contained within this document may contain forward looking statements.
Production (bbl/day)
") 1 of 5 14/09/2011 22:15 From Wikipedia, the free encyclopedia This is a list of countries by oil production mostly based on CIA World Factbook data. [1] Note that oil production refers to the sum of barrels
1 of 5 14/09/2011 22:15 From Wikipedia, the free encyclopedia This is a list of countries by oil production mostly based on CIA World Factbook data. [1] Note that oil production refers to the sum of barrels
CrimpTest-1 kn. Calibration Bracket
 CrimpTest-1 kn Calibration Bracket 431-471-02 May 2017 CrimpTest-1 kn Calibration Bracket Manual This manual describes the operation of the calibration test rig part no. 432-671, for the purpose of checking
RENAULT-NISSAN ALLIANCE POSTS SALES RECORD IN 2012 FOR 4TH STRAIGHT YEAR
 RENAULT-NISSAN ALLIANCE POSTS SALES RECORD IN 2012 FOR 4TH STRAIGHT YEAR Despite recession in Europe and slowing pace of sales in China, global sales were a record 8.1 million units Strongest growth came
Coal. 36 Reserves and prices 38 Production and consumption. 67 th edition
 Coal 36 Reserves and prices 38 Production and consumption 67 th edition Total proved reserves at end 217 Million tonnes Anthracite and bituminous Subbituminous and lignite US 228 3116 25916 24.2% 357 Canada
Table 16 Refinery distillation capacity, throughput and output Thousand metric tons
 Million metric tons Table 16 Refinery distillation capacity, throughput and output Table Notes Output is equal to the sum of production from refineries for aviation gasoline, bitumen, gas/diesel oil, ethane,
RENAULT 2016 DRIVE THE CHANGE
 PRESS RELEASE February 10, 2011 RENAULT 2016 DRIVE THE CHANGE Renault 2016 Drive the Change is founded on Renault s ambition to make sustainable mobility accessible to all, expressed in the brand tagline,
2.01 Availability of latest technologies
 2.01 Availability of latest technologies To what extent are the latest technologies available in your country? [1 = not available; 7 = widely available] 2010 2011 weighted average RANK COUNTRY/ECONOMY
Table 13 Production, trade and supply of conventional crude oil Thousand metric tons; kilograms per capita; reserves production ratio (R/P) in years
 in years") Table 13, trade and supply of conventional crude oil Thousand metric tons; kilograms per capita; reserves production ratio (R/P) in years Table Notes The Reserves / ratio refers to crude oil and natural
Table 13, trade and supply of conventional crude oil Thousand metric tons; kilograms per capita; reserves production ratio (R/P) in years Table Notes The Reserves / ratio refers to crude oil and natural
5.01 Secondary education enrollment rate
 5.01 Secondary education enrollment rate Gross secondary education enrollment rate 2011 or most recent year available RANK COUNTRY/ECONOMY Value 1 Australia 8...131.3 2 Spain...128.5 3 Seychelles...123.9
NEW PASSENGER CAR REGISTRATIONS EUROPEAN UNION 1
 PRESS EMBARGO: 8.00 AM (7.00 AM GMT), 17 January 2018 NEW PASSENGER CAR REGISTRATIONS EUROPEAN UNION 1 Passenger car registrations: +3.4% in 2017; 4.9% in In 2017, new passenger car registrations in the
1. INTERNATIONAL OVERVIEW. 1.0 Area and population. population (1,000) area
 area") 1.0 Area and population area population (1,000) km 2 2000 2010 2018 1 inhabitants per km 2 Belgium 30,530 10,251 10,920 11,443 375 Germany 357,380 82,212 81,777 82,952 232 Estonia 45,230 1,397 1,331 1,315
1.0 Area and population area population (1,000) km 2 2000 2010 2018 1 inhabitants per km 2 Belgium 30,530 10,251 10,920 11,443 375 Germany 357,380 82,212 81,777 82,952 232 Estonia 45,230 1,397 1,331 1,315
Lifting Instructions for 1336 PLUS and FORCE D Frame Drives
 Installation Instructions Lifting Instructions for 1336 PLUS and FORCE D Frame Drives This publication will guide you through the steps needed to properly lift and mount the following drives: 1336 PLUS
Global Medium & Heavy Commercial Vehicle Model Level Production Forecast Report. From 2001 to 2021
 Global Medium & Heavy Commercial Vehicle Model Level Production Forecast Report From 2001 to 2021 Global CV Markets Covered Industry Production Data Truck & Bus Model Production Forecast Engine Production
9.01 ICT use for business-to-business transactions
 9.01 ICT use for business-to-business transactions To what extent do businesses in your country use ICTs for communicating and carrying out transactions with other businesses? [1 = not at all; 7 = extensively]
LPI ranking and scores, 2014
 ing and scores, 2014 Germany 1 4.12 100.0 Netherlands 2 4.05 97.6 Belgium 3 4.04 97.5 United Kingdom 4 4.01 96.6 Singapore 5 4.00 96.2 Sweden 6 3.96 94.9 Norway 7 3.96 94.8 Luxembourg 8 3.95 94.4 United
NEW PASSENGER CAR REGISTRATIONS EUROPEAN UNION 1
 PRESS EMBARGO: 8.00 AM (6.00 AM GMT), 19 April 2017 NEW PASSENGER CAR REGISTRATIONS EUROPEAN UNION 1 Passenger car registrations: +8.4% first three months of 2017; +11.2% in In 2017, EU passenger car registrations
NEW PASSENGER CAR REGISTRATIONS EUROPEAN UNION 1
 PRESS EMBARGO: 8.00 AM (6.00 AM GMT), 17 July 2018 NEW PASSENGER CAR REGISTRATIONS EUROPEAN UNION 1 Passenger car registrations: +2.9% during first half of 2018; +5.2% in In 2018, passenger car registrations
NEW PASSENGER CAR REGISTRATIONS EUROPEAN UNION 1
 PRESS EMBARGO: 8.00 AM (6.00 AM GMT), 17 May 2018 NEW PASSENGER CAR REGISTRATIONS EUROPEAN UNION 1 Passenger car registrations: +2.7% four months into 2018; +9.6% in In 2018, the EU passenger car market
Product Overview INCH
 INCH Product Overview CERTIFIED Technology Made in Italy Since 1955 the Varvel Group has been making gearboxes and variators for light industry applications. Reliable partner in power transmission equipment
The Great Transition: Shifting from Fossil Fuels to Solar and Wind Energy Supporting Data - Hydropower
 The Great Transition: Shifting from Fossil Fuels to Solar and Wind Energy Supporting Data - Hydropower World Installed Hydroelectric Generating Capacity, 1980-2013 GRAPH: World Installed Hydroelectric
JURISDICTIONS PARTICIPATING IN THE CONVENTION ON MUTUAL ADMINISTRATIVE ASSISTANCE IN TAX MATTERS
 JURISDICTIONS PARTICIPATING IN THE CONVENTION ON MUTUAL ADMINISTRATIVE ASSISTANCE IN TAX MATTERS STATUS 27 JULY 2018 ORIGINAL CONVENTION 27-05-2010) OR OR 1. ALBANIA 01-03-2013 (AC) 08-08-2013 01-12-2013
2014/ /2015 Ghana / /2015 Syrian Arab Republic / /2015
 Exhibit C: international cotton trade data Source: International Cotton Advisory Committee, ICAC World Cotton Database, available at www.icac.org, last checked 1 April 2016. International Cotton Advisory
NEW PASSENGER CAR REGISTRATIONS EUROPEAN UNION 1
 PRESS EMBARGO: 8.00 A.M. (7.00 A.M GMT), November 18, 2014 NEW PASSENGER CAR REGISTRATIONS EUROPEAN UNION 1 PASSENGER CAR registrations: +6.1% over ten months; +6.5% in In, in the EU 1 passenger car registrations
NEW PASSENGER CAR REGISTRATIONS EUROPEAN UNION 1
 PRESS EMBARGO: 8.00 AM (6.00 AM GMT), 14 September 2017 NEW PASSENGER CAR REGISTRATIONS EUROPEAN UNION 1 Passenger car registrations: +4.5% over eight months; +5.6% in August In August 2017, passenger
NEW PASSENGER CAR REGISTRATIONS EUROPEAN UNION *
 PRESS EMBARGO: 8.00 AM (7.00 AM GMT), 17 November 2015 NEW PASSENGER CAR REGISTRATIONS EUROPEAN UNION * Passenger car registrations: +8.2% over ten months; +2.9% in In 2015, the EU passenger car market
Allen-Bradley 1397 Pulse Encoder Interface Card
 Installation Instructions IN Allen-Bradley 1397 Pulse Encoder Interface Card Cat. No. 1397-PE Table of Contents What This Option Provides........................ 1 Where This Option Is Used........................
RENAULT GROUP Q JÉRÔME STOLL DOMINIQUE THORMANN RENAULT GROUP Q1 2013
 RENAULT GROUP Q1 2013 JÉRÔME STOLL DOMINIQUE THORMANN RENAULT GROUP Q1 2013 24 APRIL 2013 DISCLAIMER Information contained within this document may contain forward looking statements. Although the Company
NEW PASSENGER CAR REGISTRATIONS EUROPEAN UNION 1
 PRESS EMBARGO: 8.00 AM (7.00 AM GMT), 15 February 2019 NEW PASSENGER CAR REGISTRATIONS EUROPEAN UNION 1 Passenger car registrations: 4.6% in 2019 In 2019, the European passenger car market saw a slow start
NEW PASSENGER CAR REGISTRATIONS EUROPEAN UNION 1
 PRESS EMBARGO: 8.00 AM (6.00 AM GMT), 16 May 2017 NEW PASSENGER CAR REGISTRATIONS EUROPEAN UNION 1 Passenger car registrations: +4.7% four months into 2017; 6.6% in In 2017, the number of passenger cars
NEW PASSENGER CAR REGISTRATIONS EUROPEAN UNION 1
 PRESS EMBARGO: 8.00 AM (6.00 AM GMT), 15 June 2018 NEW PASSENGER CAR REGISTRATIONS EUROPEAN UNION 1 Passenger car registrations: +2.4% five months into 2018; +0.8% in In 2018, the EU passenger car market
Microsoft Social Engagement Translation Guide Last Updated: October 2017
 Microsoft Social Engagement Translation Guide Last Updated: October 2017 Microsoft Social Engagement is translated and supported by Microsoft and made generally available in the countries/regions and languages
Summary of Contributions to UN Peacekeeping by Country and Post.
 Summary of Contributions to UN Peacekeeping by Country and Post. Police,UN Military, s and Troops 31/07/2018 1 Country Name POST MALE FEMALE TOTAL Algeria 2 3 4 5 6 7 Argentina Armenia Australia Austria
NEW PASSENGER CAR REGISTRATIONS EUROPEAN UNION *
 PRESS EMBARGO: 8.00 AM (6.00 AM GMT), 16 April 2015 NEW PASSENGER CAR REGISTRATIONS EUROPEAN UNION * PASSENGER CAR registrations: +8.6% in first quarter; +10.6% in In 2015, demand for new passenger cars
Section III Macroeconomic environment
 Data Tables Section III Macroeconomic environment 2.2: Data Tables Section III: Macroeconomic environment 422 3.01 Government budget balance General government budget balance as a percentage of GDP 2010
NEW PASSENGER CAR REGISTRATIONS EUROPEAN UNION 1
 PRESS EMBARGO: 8.00 AM (7.00 AM GMT), 14 December 2018 NEW PASSENGER CAR REGISTRATIONS EUROPEAN UNION 1 Passenger car registrations: +0.8% 11 months into 2018; 8.0% in In 2018, passenger car demand fell
JURISDICTIONS PARTICIPATING IN THE CONVENTION ON MUTUAL ADMINISTRATIVE ASSISTANCE IN TAX MATTERS
 JURISDICTIONS PARTICIPATING IN THE CONVENTION ON MUTUAL ADMINISTRATIVE ASSISTANCE IN TAX MATTERS COUNTRY/JURISDICTION * STATUS 15 DECEMBER 2017 1. ALBANIA 01-03-2013 (AC) 08-08-2013 01-12-2013 2. ANDORRA
World real merchandise trade grows faster than output
 I. I. world trade developments 8 Merchandise trade and GDP World real merchandise trade grows faster than output In 2006, the volume of world merchandise trade grew by 8 per cent while world gross domestic
Winners & Losers by Market - January 2019 vs January 2018
 Countries 19/18 % Chg LITHUANIA +49,0 ROMANIA +18,8 HUNGARY +9,2 PORTUGAL +8,3 DENMARK +7,0 GREECE +3,7 LATVIA +0,7 POLAND -0,3 FRANCE -1,1 GERMANY -1,4 UNITED KINGDOM -1,6 NORWAY -2,2 LUXEMBOURG -3,4
Cotton This Month. Major Changes in Supply and Demand Estimates and Projections
 1629 K Street NW, Suite 702 Washington, DC 20006, USA Cotton This Month March 1, 2018 Major Changes in Supply and Demand Estimates and Projections Brazil China Turkey United States 2017/18: production
JURISDICTIONS PARTICIPATING IN THE CONVENTION ON MUTUAL ADMINISTRATIVE ASSISTANCE IN TAX MATTERS
 JURISDICTIONS PARTICIPATING IN THE CONVENTION ON MUTUAL ADMINISTRATIVE ASSISTANCE IN TAX MATTERS COUNTRY/JURISDICTION * STATUS 10 NOVEMBER 2017 1. ALBANIA 01-03-2013 (AC) 08-08-2013 01-12-2013 2. ANDORRA
NEW PASSENGER CAR REGISTRATIONS EUROPEAN UNION 1
 PRESS EMBARGO: 8.00 AM (7.00 AM GMT), 16 January 2019 NEW PASSENGER CAR REGISTRATIONS EUROPEAN UNION 1 Passenger car registrations: +0.1% in 2018; 8.4% in In 2018, the EU passenger car market declined
Cotton This Month. Major Changes in Supply and Demand Estimates and Projections
 1629 K Street NW, Suite 702 Washington, DC 20006, USA Cotton This Month February 1, 2018 Major Changes in Supply and Demand Estimates and Projections India Mexico Pakistan United States 2017/18 production
NEW PASSENGER CAR REGISTRATIONS EUROPEAN UNION 1
 PRESS EMBARGO: 8.00 AM (7.00 AM GMT), 15 February 2018 NEW PASSENGER CAR REGISTRATIONS EUROPEAN UNION 1 Passenger car registrations: +7.1% in 2018 In 2018, demand for passenger cars in the European Union
NEW PASSENGER CAR REGISTRATIONS EUROPEAN UNION 1
 PRESS EMBARGO: 8.00 AM (6.00 AM GMT), 17 October 2018 NEW PASSENGER CAR REGISTRATIONS EUROPEAN UNION 1 Passenger car registrations: +2.5% nine months into 2018; 23.5% in In 2018, registrations of new passenger
CSM-K. high capacity clean steam generator
 CSM-K high capacity clean steam generator High capacity clean steam generator Spirax Sarco, the world s leading steam system specialist, has combined modern technology with package design expertise to
NEW PASSENGER CAR REGISTRATIONS EUROPEAN UNION 1
 PRESS EMBARGO: 8.00 AM (6.00 AM GMT), 19 September 2018 NEW PASSENGER CAR REGISTRATIONS EUROPEAN UNION 1 Passenger car registrations: +6.1% eight months into 2018; +10.5% in July and +31.2% in August In
UAE draft regulation for Electric Vehicle
 UAE draft regulation for Electric Vehicle Emirates Authority for Standardization and Metrology Eng. Khaled Ali Abdullmajeed Contents - Introduction of ESMA. - Introduction of EV Regulation in UAE - The
FLUID REPLACEM Brake fluid and engine coolant (antifreeze and water solution) must be completely replaced at specific intervals. See table below. Your
 must be completely replaced at specific intervals. See table below. Your") Routine services SERVICE REQUIREMS Routine services must be carried out throughout the life of the vehicle. Some Range Rover, Range Rover Sport, Range Rover Evoque, Discovery 4/LR4 and Freelander 2/LR2
Routine services SERVICE REQUIREMS Routine services must be carried out throughout the life of the vehicle. Some Range Rover, Range Rover Sport, Range Rover Evoque, Discovery 4/LR4 and Freelander 2/LR2
Spain s imports by oil product group and country of origin
 Corporación de Reservas Estratégicas de Productos Petrolíferos Castellana, 79 28046 Madrid T. +34 91 360 09 10 Updated F. +34 91 420 on39 45 www.cores.es February 12 th 2018 Spain s imports by oil product
 Urchin 7 cflag.ifas.ufl.edu Page 1 of 2 Standard View Export All Visits Permalink Geo Location Jul 1, 2015 - Jul 31, 2015 First Date 2015 Compare to Past Jan Feb Mar Apr May Jun Jul Aug Sep Oct Nov Dec
NEW PASSENGER CAR REGISTRATIONS EUROPEAN UNION 1
 PRESS EMBARGO: 8.00 AM (6.00 AM GMT), 19 September 2018 NEW PASSENGER CAR REGISTRATIONS EUROPEAN UNION 1 Passenger car registrations: +6.1% eight months into 2018; +10.5% in July and +31.2% in August In
NEW PASSENGER CAR REGISTRATIONS EUROPEAN UNION 1
 PRESS EMBARGO: 8.00 AM (6.00 AM GMT), 16 June 2017 NEW PASSENGER CAR REGISTRATIONS EUROPEAN UNION 1 Passenger car registrations: +5.3% five months into 2017; +7.6% in In 2017, passenger car registrations