DETAILED PROJECT REPORT
|
|
|
- Martina Reed
- 5 years ago
- Views:
Transcription


1 DETAILED PROJECT REPORT SILK BOARD KR PURAM CORRIDOR OF BANGALORE METRO VOLUME - I Bangalore Metro Rail Corporation Ltd. October 2016
2 DETAILED PROJECT REPORT SILK BOARD KR PURAM CORRIDOR OF BANGALORE METRO VOLUME - I Bangalore Metro Rail Corporation Ltd. October 2016
3 FOREWARD This DPR to construct a Metro line on the Outer Ring Road (ORR) between Central Silk Board and K.R.Puram has been prepared by an In-house Team of BMRCL. The team has relied upon the experience it has gained while implementing the Phase-1 of Namma Metro and also while preparing the DPR of Phase-2 of Namma Metro. The team was also assisted by M/s.Colliers International Bengaluru, who provided valuable inputs on the real estate growth potential in Bengaluru and specially this corridor. I would like to place on record my appreciation to the following Officers who worked untiringly in completing this DPR within a record time of one month: 1. Sri Vijay Kumar Dhir, Director (Project & Planning) 2. Sri N.M.Dhoke, Director (RSE, O&M) 3. Sri S.Vasudevan, General Manager (Finance) 4. Sri K.Muralidharan, General Manager (Finance & Accounts) 5. Sri N.P.Sharma, Chief Engineer 6. Sri B.L.Yeshwant Chavan, General Manager (O&M) 7. Sri Sanjay Singhal, Chief Engineer 8. Sri Jitendra Jha, Project Manager (RS) 9. Sri A.S.Shankar, Chief Engineer 10. Sri T.Levingston, Chief Engineer 11. Dr.G.Krishnaiah, Dy.General Manager (Finance) 12. Sri Gangaraj, Dy.Chief Engineer 13. Sri Laxman, Dy.Chief Engineer 14. Sri Vysaraj, Dy.Chief Engineer 15. Sri Krishnan, Dy.Chief Engineer 16. Sri Jitu Sharmah, Manager (Transportation) 17. Sri Jonny Prem, Assistant Executive Engineer 18. Sri Siddalingesh K Kalligud, Assistant Engineer 19. Sri Prabhakaran G, Assistant Engineer 20. Sri Veerendra Sheelawantar, Assistant Engineer 21. Sri Joe Verghese, Managing Director, Colliers International 22. Smt. Bhargavi Mutyala, Manager, Colliers International PRADEEP SINGH KHAROLA Managing Director Bangalore Metro Rail Corporation Ltd.
4 EXECUTIVE SUMMARY METRO LINE ON ORR CENTRAL SILK BOARD TO K.R.PURAM The emergence of Bangalore as IT Capital of India has been possible because of large scale growth of IT industries in the city. The IT industry in the past was concentrated in the Electronic City area in the South and the Whitefield area in the East. With these 2 areas getting saturated, the IT industry moved to along the Outer Ring Road (ORR) between Central Silk Board and K.R.Puram. This new stretch of ORR which was constructed in early 2000 acted as a major attraction for these IT industries to set up their facilities alongside. However, the rapid growth of IT sector along this corridor has placed a huge burden on the transport infrastructure. As a result, this growth corridor has become a transportation bottleneck. In spite of this, studies have shown that the growth of IT industry in this corridor has been phenomenal. It is estimated that about half a million IT professionals are employed on this corridor and with various support services and indirect employment, this corridor which measures about 17 kms is providing employment close to one million people. The biggest challenge these people are facing is the long time spent during transportation thereby bringing down their efficiency and also affecting the overall economic efficiency of this corridor. Though the Phase-1 and Phase-2 of the Metro network has been planned and Phase-1 is nearing completion, this corridor has been left untouched by both Phase-1 and Phase-2. However, the Metro line in Phase-2 passes through the two extremities of this corridor. Thus connecting these two extremities one at Central Silk Board and other at K.R.Puram is not only necessary but at the same time it is also inevitable. In this Detailed Project Report, the alignment between Central Silk Board and K.R.Puram junction has been planned. The entire stretch would be on an elevated viaduct and the availability of space in the middle of the road makes it an ideal situation for construction of the viaduct. An additional feature of this road corridor is that at all intersections, though flyovers have been constructed all these flyovers are split flyovers leaving adequate space between the two arms through which the Metro viaduct can easily run. The use of innovative financing techniques for the metro line is a unique feature of this DPR. For the first time, an attempt has been made to capture the increase in the value of the land and other properties which fall within the vicinity of the metro line. Though such an appreciation of value of land has been observed along side of Metro I
5 Phase-1 corridor, the Bangalore Metro or the State Government has not been able to leverage the increase in the value of the properties towards financing the Metro project. However, in this report an attempt has been made to use the innovative financing techniques to mobilise funds to partly fund the project and this enhances the finance and economic viability of the project. This 17 km stretch would have 13 stations in all including the 2 junctions one at Central Silk Board and other at K.R.Puram and would cost Rs.4202 crores. All the intervening stations would be over the road and land space is required only for the providing entry to these stations. This has helped in minimising the land requirement for this project. Also provision has been made to extend this line further upto Hebbal and this extension would connect this line to the airport line which is expected to run from Nagawara. The attractiveness of this project is brought by a detailed finance analysis. The FIRR of this project has been estimated to be 15.27% and EIRR of this project has been estimated to be 55.69%. The easy availability of land for construction and not many obstructions involving the shifting of utilities makes it possible to complete the project within a span of 3 years. SALIENT FEATURES 1 Guage Standard Gauge (1435mm) 2 Alignment KR Puram to Silkboard 2.1 Route Length 17 km 2.2 No. of Stations 13 (including terminal station) 3 Traffic Forecast (estimated Ridership) year 3.52 Lacs per day year 4.59 Lacs per day year 5.75 Lacs per day 4 Train Operation Plan Peak headway- 4 min year Train configuration- 6 car No. of trains in service during peak hour- 17 No. of trains trips per direction per day- 220 II
6 Peak headway- 3 min year Train configuration- 6 car No. of trains in service during peak hour- 22 No. of trains trips per direction per day Peak headway min year Train configuration 6 car No. of trains in service during peak hour - 27 No. of trains trips per direction per day Speed 5.1 Design Speed 80 kmph 5.2 Average Speed 34 kmph 6 Traction Power Supply 6.1 Traction system voltage 750 V DC 6.2 Current collection Third rail bottom collection 6.3 Power supply source 66 kv / 220kV No. of Receiving Sub Stations No. of Traction Sub Stations SCADA provided 7 Rolling Stock 7.1 Type Standard gauge 2.88m wide modern rolling stock with stainless steel body 7.2 Axle load 15t 7.3 Seating arrangement Longitudinal 7.4 Maximum Capacity of 6 coach unit 2068 Passengers 8 Maintenance Facility Baiyappanahalli Depot III
7 9 Signaling, Telecommunication & Train Control and PSG Communication Based Train Control (CBTC) Integrated system with fiber optic cable, SCADA, Train radio, PA system, etc... Train information system, control telephones and centralized clock system Platform Screen Doors 10 Construction Methodology Elevated viaduct consisting of pre-stressed concrete box/ U shaped girders on single pier/portal with pile/open foundation. 11 Automatic Fare Collection (AFC) Integrated with existing AFC system. 12 Total Estimated Cost 4202 Crores (at July,2016 Prices, w/o taxes) 13 Financial Indices 13.1 FIRR 15.27% 13.2 EIRR 55.69% PRADEEP SINGH KHAROLA Managing Director Bangalore Metro Rail Corporation Ltd. IV
8 TABLE OF CONTENTS 1 INTRODUCTION 1.1 BANGALORE CITY PROFILE POPULATION GROWTH GROWTH OF REAL ESTATE TRANSPORT NETWORK IN BANGALORE VEHICULAR GROWTH MODAL SPLIT PUBLIC TRANSPORT CURRENT INFRASTRUCTURE CHALLENGES CONCLUSION METRO ON ORR 2.1 BACKGROUND HIGH GROWTH AND DYNAMIC AREA INFRASTRUCTURE CHALLENGES INEVITABILITY OF HAVING A METRO ON ORR RETAINING THE ATTRACTIVENESS OF ORR CONCLUSION TRAFFIC DEMAND ANALYSIS 3.1 INTRODUCTION ESTIMATION OF RIDERSHIP FOR THE ORRMETRO LINE TRAVEL DEMAND MODELING METHODOLOGY FOR MODEL DEVELOPMENT MODEL STRUCTURE BASE YEAR HIGHWAY MATRICES DEVELOPMENT VEHICLE AVAILABILITY, GENERATION, AND ATTRACTION MODELS DISTRIBUTION MODELS MODAL SPLIT MODELS MODEL VALIDATION MODAL SPLIT MODELS FUTURE GROWTH SCENARIO ASSUMPTIONS FOR TRANSPORT DEMAND FORECASTING TRANSPORT DEMAND FORECAST FOR PHASE I & II CORRIDORS OF BANGALORE METRO 2021 & 2041-BUSINESS AS USUAL SCENARIO ESTIMATION OF RIDERSHIP FOR PROPOSED NEW LINE BOARDING ALIGHTING PHPDT i
9 TABLE OF CONTENTS ESTIMATION OF RIDERSHIP THROUGH ASSESSMENT OF BUILT UP AREAS ESTIMATION OF RIDERSHIP BY EXTRAPOLATING THE RIDERSHIP ON THE EAST-WEST CORRIDOR WHICH IS CURRENTLY OPERATIONAL 3.3 CONCLUSION CIVIL ENGINEERING WORKS 4.1 LINK LINE FROM SILK BOARD KR PURAM DESCRIPTION OF ALIGNMENT REFERENCE POINT REFERENCE LINE INDEX PLAN ALIGNMENT PLANNING AND DESIGN NORMS TERMINAL STATION HORIZONTAL ALIGNMENT VERTICAL ALIGNMENT CURVES GRADIENTS STATION PLANNING STATION DESIGN STATION LOCATIONS STATION FACILITIES ARCHITECTURAL FINISHES PASSENGER FACILITIES UTILITIES AND SERVICES TYPICAL STATION DRAWINGS PLANNING & DESIGN PARAMETERS 5.1 GEOMETRIC DESIGN NORMS HORIZONTAL CURVES HORIZONTAL CURVES TRANSITION CURVES VERTICAL ALIGNMENT ELEVATED SECTIONS GRADIENTS VERTICAL CURVES DESIGN SPEED 5-3 ii
10 TABLE OF CONTENTS SPACING OF TRACKS PERMANENT WAY TRACK STRUCTURE RAIL SECTION BALLASTLESS TRACK ON VIADUCTS BALLAST LESS TRACK IN DEPOT TURNOUTS BUFFER STOPS WELDING OPERATING ENVIRONMENT TRACK STRUCTURE THE TECHNICAL STANDARDS FOR TRACK STRUCTURE DEALS WITH THE FOLLOWING COMPONENTS 5.11 RAIL AND RAIL WELDING SLEEPER AND FASTENING FOR BALLASTED TRACK TRACK SLAB FOR BALLASTLESS TRACK CHECK RAIL / RESTRAINING RAIL DERAILMENT GUARDS GLUED INSULATED RAIL JOINT TURNOUTS SCISSORS CROSSOVER SWITCH EXPANSION JOINT NOISE AND VIBRATION GRADIENTS GEOTECHNICAL INVESTIGATION 6.1 REFERENCE POINT FIELD INVESTIGATION LABORATORY TESTING GENERAL STRATIFICATION ANALYSIS OF RESULTS RECOMMENDATIONS SHALLOW FOUNDATIONS DEEP FOUNDATIONS TRAIN MAINTENANCE DEPOT 7.1 INTRODUCTION FOR ROLLING STOCK MAINTENANCE NEEDS MAINTENANCE SCHEDULE 7-1 iii
11 7.1.2 TABLE OF CONTENTS YEAR-WISE PLANNING OF MAINTENANCE FACILITY SETUP AT DEPOT-CUM-WORKSHOP AT BAIYAPPANAHALLI DEPOT IS TABULATED AS BELOW DEPOT CONTROL CENTRE (DCC OPERATION CONTROL CENTRE (OCC) WASHING NEEDS OF ROLLING STOCK TRAIN DEPOT CUM WORKSHOP AT KADUGODI DEPOT PROVISION OF INFRASTRUCTURE FACILITIES AT KADUGODI DEPOT -CUM-WORKSHOPS POWER SUPPLY SYSTEM AND TUNNEL VENTILLATION SYSTEM 8.1 BACKGROUND POWER SUPPLY ARRANGEMENTS POWER DEMAND ESTIMATION NEED FOR HIGH RELIABILITY OF POWER SUPPLY SOURCE OF POWER SUPPLY DESIGN CRITERIA FOR POWER SUPPLY AND TRACTION SYSTEM TRAIN OPERATION PLAN TRACTION SUB-STATIONS (33 KV/750 V DC RATING OF MAJOR EQUIPMENT THIRD RAIL AND STINGER SYSTEM AUXILIARY SUPPLY ARRANGEMENTS FOR STATIONS & DEPOT STANDBY DIESEL GENERATOR (DG) SETS SUPERVISORY CONTROL AND DATA ACQUISITION (SCADA) SYSTEM 8.7 EMERGENCY TRIP SYSTEM (ETS STRAY CURRENT CORROSION PROTECTION MEASURES CONCEPT OF DC STRAY CURRENT CORROSION EFFECT OF CORROSION MEASURES FOR PROTECTION AGAINST STRAY CURRENT CORROSION SPECIAL ARRANGEMENTS IN DEPOT ELECTROMAGNETIC INTERFERENCE (EMI) AND ELECTROMAGNETIC COMPATIBILITY (EMC 8.10 ENERGY SAVING MEASURES ELECTRIC POWER TARIFF ROLLING STOCK 9.1 BACKGROUND SIZE OF COACH PASSENGER CARRYING CAPACITY 9-1 iv
12 TABLE OF CONTENTS 9.4 WEIGHT PERFORMANCE PARAMETERS TRACTION PERFORMANCE BRAKE PERFORMANCES SPEED VS. TIME CURVE COACH DESIGN AND BASIC PARAMETERS SELECTION OF TECHNOLOGY CAR BODY BOGIES BRAKE SYSTEM PROPULSION SYSTEM TECHNOLOGY INTERIOR AND GANGWAYS PASSENGER DOORS AIR CONDITIONING CAB LAYOUT AND EMERGENCY DETRAINMENT DOORS COMMUNICATION NOISE AND VIBRATION PASSENGER SAFETY FEATURES TRAIN OPERATION PLAN 10.1 OPERATION PHILOSOPHY STATIONS PHPDT DEMAND TRAIN OPERATION PLAN SALIENT FEATURES TRAIN FORMATION TRAIN OPERATION PLAN PLANNING FOR PLANNING FOR PLANNING FOR PHPDT CAPACITY FOR DIFFERENT HEADWAYS TRAIN FREQUENCY HOURLY TRAIN OPERATION PLAN VEHICLE KILOMETER YEAR WISE RAKE REQUIREMENT COST ESTIMATE v
13 TABLE OF CONTENTS 11 SIGNALLING SYSTEM AND TELECOMMUNICATION 11.1 SIGNALLING INTRODUCTION ADOPTION OF CBTC BASED SIGNALLING SYSTEM SYSTEM DESCRIPTION AND SPECIFICATIONS SIGNALLING SCHEME PLAN STANDARDS SPACE REQUIREMENT FOR SIGNALLING INSTALLATIONS MAINTENANCE PHILOSOPHY FOR SIGNALLING SYSTEMS TELECOMMUNICATION SYSTEM INTRODUCTION STANDARDS SPACE REQUIREMENT FOR TELECOM INSTALLATIONS MAINTENANCE PHILOSOPHY FOR TELECOM SYSTEMS AUTOMATIC FARE COLLECTION INTRODUCTION AFC EQUIPMENT REQUIREMENT STANDARDS INTEGRATION OF AFC WITH EXISTING AFC SYSTEMS OF BMRCL AND AFC SYSTEMS OF SUBURBAN/BUS SYSTEM TICKET OFFICES LAND ACQUISTION 12.1 LAND PLAN BREAK-UP OF LAND REQUIREMENT VIADUCT BETWEEN K.R.PURAM AND JYOTHIPURA STATION RELOCATION / RESETTLEMENT MAINTENANCE DEPOT ENVIRONMENTAL & SOCIAL IMPACT ASSESSMENT 13.1 BACKGROUND PROJECT DESCRIPTION ENVIRONMENTAL IMPACT LOSS OF TREES/FORESTS UTILITY/DRAINAGE PROBLEMS AIR POLLUTION NOISE POLLUTION TRAFFIC DIVERSION 13-4 vi
14 TABLE OF CONTENTS 13.4 BENEFITS OF THE PROJECT TIME SAVING SAVINGS IN COST OF EMISSIONS MITIGATION MEASURES COMPENSATION FOR LOSS OF TREES NOISE POLLUTION CONTROL AIR POLLUTION CONTROL UTILITY RESTORATION LAND ACQUISITION SOCIAL IMPACT ESTIMATING CAPITAL COST 14.1 INTRODUCTION CIVIL ENGINEERING WORKS LAND ALIGNMENT / VIADUCT STATION BUILDINGS PERMANENT WAY DEPOT UTILITY DIVERSIONS TRACTION & POWER SUPPLY ELECTRICAL AND MECHANICAL WORKS ROLLING STOCK SIGNALING, TELECOMMUNICATION, AFC, PSG WORKS ROAD RESTORATIONS OPERATION AND MAINTENANCE COST 15.1 INTRODUCTION FIXED COSTS STAFF COST STAFF COST PERMANENT EMPLOYEES STAFF COSTS - OUTSOURCED & DEPLOYED PERSONNEL MAINTENANCE COST ENERGY COST CONCLUSION DEPRECIATION COST AND INTEREST RATE vii
15 TABLE OF CONTENTS 16.1 COMPUTATION OF INTEREST COST & REPAYMENT OF PRINCIPAL FARE BOX AND NON-FARE BOX REVENUE 17.1 INTRODUCTION FARE BOX REVENUE NON-FARE BOX REVENUE FINANCIAL OPTIONS FINANCIAL ANALYSES 18.1 INTRODUCTION INNOVATIVE FINANCING INNOVATIVE FINANCING INSTRUMENTS PREMIUM FSI CESS ON APPROVAL OF NEW LAYOUTS CONSTRUCTION AND EXPLOITATION OF COMMERCIAL SPACES NEAR IMPORTANT INFRATSRUCTURE PROJECTS GENERATION OF RENEVUE THROUGH OTHER SOURCES GENERATION OF REVENUE THROUGH LEVYING OF FEES FOR CHANGE OF LAND USE IN THE VICINITY OF INFRASTRUCTURE PROJECTS BETTERMENT LEVY FINANCING OPTIONS DIFFERENT SCENARIOS FOR INNOVATIVE FINANCING TAX REIMBURSEMENT FINANCIAL ANALYSIS FIRR 19.1 INTRODUCTION FACTORS IN INNOVATIVE FINANCING ASSUMPTIONS SCENARIO 1: PESSIMISTIC SCENARIO 2: OPTIMISTIC SCENARIO 3: MOST LIKELY CONCLUSIONS ECONOMIC ANALYSIS 20.1 INTRODUCTION ECONOMIC ANALYSIS APPROACH ANALYSIS PERIOD ESTIMATION OF COSTS ESTIMATION OF BENEFITS 20-2 viii
16 TABLE OF CONTENTS 20.6 ESTIMATION OF MONEY VALUE OF TIME SAVED ESTIMATING THE SAVING IN COST OF EMISSIONS CONCLUSION IMPLEMENTATION PLAN 21.1 BACKGROUND IMPLEMENTATION PLAN FUTURE EXTENSION 22.1 BACKGROUND FUTURE EXTENSION STABLING LINES INTERCHANGE STATION RISK FACTORS AND THEIR MITIGATION CONCLUSIONS 24.1 INTRODUCTION FINANCING OF THE PROJECT APPROVALS REQUIRED FROM THE STATE GOVERNMENT APPROVALS FROM THE GOVERNMENT OF INDIA INNOVATIVE FINANCIING 24-3 ix
17 LIST OF TABLES TABLE 3-1 TABLE 3-2 TABLE 3-3 TABLE 3-4 TABLE 3-5 TABLE 3-6 TABLE 3-7 TABLE 3-8 TABLE 3-9 TABLE 3-10 TABLE 3-11 TABLE 3-12 TABLE 3-13 TABLE 3-14 TABLE 3-15 TABLE 3-16 TABLE 3-17 TABLE 3-18 TABLE 4-1 TABLE 4-2 TABLE 4-3 TABLE 4-4 TABLE 6-1 TABLE 7-1 TABLE 7-2 TABLE 7-3 TABLE 7-4 TABLE 7.5 TABLE 7.6 TABLE 7.7 VEHICLE AVAILABILITY MODEL CALIBRATION RESULTS GENERATION MODEL CALIBRATION RESULTS (HOUSEHOLD S SIZE DISTRIBUTION) ZONE WISE DISTRIBUTION OF STUDENT ENROLMENT HIS DATABASE DAILY PERSON TRIPS BY PURPOSE AND VEHICLE AVAILABILITY GROUP ATTRACTION MODEL CALIBRATION RESULTS BASE YEAR VALUES OF TIME, VEHICLE OPERATING COSTS AND VEHICLE OCCUPANCY RATES DISTRIBUTION MODELS CALIBRATION RESULTS CALIBRATED MODAL CHOICE MODELS PARAMETERS MODAL SPLIT MODELS CALIBRATION RESULTS DISTRIBUTION MODELS VALIDATION RESULTS MODAL SPLIT MODELS VALIDATION RESULTS DAILY TRIPS (INTRA-CITY) BY VARIOUS MODES IN PHASE I & II CORRIDORS OF BANGALORE METRO EMPLOYMENT ALONG SILK BOARD OUTER RING ROAD (ORR) CORRIDOR - 5 K R PURAM TO SILK BOARD ALONG ORR PHPDT DEMAND AND CAPACITY CHART ESTIMATION OF RIDERSHIP THROUGH ASSESSMENT OF BUILT UP AREAS RIDERSHIP ON HOURLY BASIS RIDERSHIP ON HOURLY BASIS STATEMENT OF CURVES STATEMENT OF GRADIENT LIST OF STATION NAMES LIST OF DRAWINGS RECOMMENDED SAFE AXIAL LOAD FOR PILES WITH DIAMETER ROLLING STOCK MAINTENANCE NEEDS MAINTENANCE SCHEDULE RAKE REQUIREMENT BARE REQUIREMENT OF STABLING, INSPECTION AND WORK SHOP LINES YEAR-WISE PLANNING OF MAINTENANCE BARE REQUIREMENT OF INSPECTION LINES DISTRIBUTION OF STABLING LINES AT DEPOT DISTRIBUTION OF SBLS, IBLS AND WSLS IN DEPOT-CUM-WORKSHOPS x
18 LIST OF TABLES TABLE 7.8 TABLE 7.9 TABLE 7.10 TABLE 8-1 TABLE 8-2 TABLE 8-3 TABLE 8-4 TABLE 8-5 TABLE 8.6 TABLE 8.7 POWER SUPPLY DETAILS LIST OF BUILDINGS AT UPCOMING DEPOT AT KADUGODI TO BE PLANNED. LIST OF PLANTS &EQUIPMENT AT UPCOMING DEPOT AT KADUGODI POWER DEMAND ESTIMATION (MVA) SOURCES OF POWER SUPPLY POWER DEMAND TRAIN OPERATION PLAN LOWEST, NOMINAL AND PERMANENT VOLTAGE POWER REQUIREMENT ENERGY CONSUMPTION TABLE 9-1 TABLE 9-2 TABLE 9-3 TABLE 9-4 TABLE 9.5 TABLE 10-1 SIZE OF THE COACH CARRYING CAPACITY OF MASS RAIL VEHICLES P/SQM OF STANDEE AREA) CARRYING CAPACITY OF MASS RAIL VEHICLES (EXCEPTIONAL DENSE P/SQM OF STANDEE AREA) WEIGHT OF MASS RAIL VEHICLES (TONNES) SALIENT FEATURES OF ROLLING STOCK FOR MASS RAPID TRANSIT SYSTEM LIST OF STATIONS FOR THE LINE 7 K.R. PURAM TO SILK BOARD JUNCTION TABLE 10-2 PHPDT DEMAND FOR THE YEAR 2021,2031 & 2041 TABLE 10-3 TABLE 10-4 TABLE 10-5 CARRYING CAPACITY OF MASS RAIL VEHICLES (CRUSH@6 P/SQM OF STANDEE AREA) CARRYING CAPACITY OF MASS RAIL VEHICLES (EXCEPTIONAL DENSE CRUSH@8 P/SQ.M OF STANDEE AREA) PEAK HOUR DEMAND AND TRAIN REQUIREMENT-2021 TABLE 10-6 TABLE 10-7 TABLE 10-8 TABLE 10-9 TABLE TABLE TABLE TABLE YEAR PHPDT AND CAPACITY CHART PEAK HOUR DEMAND AND TRAIN REQUIREMENT-2031 YEAR PHPDT AND CAPACITY CHART PEAK HOUR DEMAND AND TRAIN REQUIREMENT-2041 YEAR PHPDT AND CAPACITY CHART CAPACITY PROVIDED FOR LINE 7 SILK BOARD JUNCTION TO K R PURAM TRAIN FREQUENCY VEHICLE KILOMETER TABLE RAKE REQUIREMENT FOR THE YEAR 2021 TABLE RAKE REQUIREMENT FOR THE YEAR 2031 xi
19 LIST OF TABLES TABLE RAKE REQUIREMENT FOR THE YEAR 2041 TABLE TABLE TABLE TABLE 11-1 TABLE 11-2 TABLE 11-3 TABLE 11-4 HOURLY TRAIN OPERATION PLAN FOR K.R.PURAM TO SILK BOARD YEAR 2021 HOURLY TRAIN OPERATION PLAN FOR K.R.PURAM TO SILK BOARD YEAR 2031 HOURLY TRAIN OPERATION PLAN FOR K.R.PURAM TO SILK BOARD YEAR 2041 STANDARDS ADOPTED WITH REGARDS TO SIGNALING SYSTEM STANDARDS TO BE ADOPTED FOR TELECOMMUNICATION SYSTEMS AFC EQUIPMENTS FOR BANGALORE METRO NEW LINE FROM KR PURAM TO SILK BOARD THE STANDARD PROPOSED FOR AFC SYSTEMS TABLE 12-1 TABLE 13.1 TABLE 13.2 TABLE 13.3 TABLE 13.4 TABLE 14-1 TABLE 14-2 TABLE 14-3 TABLE 14-4 TABLE 15-1 TABLE 15-2 TABLE 15-3 TABLE 16-1 TABLE 16-2 TABLE 16-3 TABLE 17.1 LAND REQUIREMENT AND OWNERSHIP SALIENT FEATURES LIST OF STATIONS OVERALL AFFECTED TREES SAVINGS OF ACCOUNT BREAKUP COST OF TRACTION AND POWER SUPPLY TOTAL E&M COST OF ALL STATIONS COST BREAKUP OF ESCALATORS AND LIFTS COST ESTIMATE ESTIMATION OF SALARY AND COST TO COMPANY - O &M FOR KR PURAM TO SILK BOARD JUNCTION LINE ENERGY COST CALCULATIONS OPERATION & MAINTENANCE COST IN RS CRS PRINCIPAL DRAWAL, PRINCIPAL REPAYMENT AND INTEREST REPAYMENT COST SUMMARY CALCULATION OF DEPRECIATION & RESIDUAL VALUE CORRIDOR - K R PURAM TO SILK BOARD ALONG ORR TABLE 17.2 BMRCL FARE STRUCTURE IN TABLE 17.3 TABLE 17.4 TABLE 17.5 TABLE 17.6 FARE FOR THE SUCCEEDING 30 YEARS (AMOUNT IN RS.) DETAILS OF REVENUE AND RIDERSHIP NON FARE BOX REVENUE FOR 30 YEARS (RS IN CR.) DETAILS OF REVENUE (RS. IN CR.) TABLE 18.1 GOVERNMENT CONTRIBUTION IN PHASE 2 xii
20 LIST OF TABLES TABLE 18.2 TABLE 18.3 TABLE 19-1 TABLE 19-2 TABLE 19-3 TABLE 19-4 TABLE 20-1 TABLE 20-2 TABLE 20-3 TABLE 20-4 TABLE 20-5 TABLE 20-6 TABLE 21-1 ESTIMATE OF REVENUE ON INNOVATIVE FINANCING INSTRUMENTS SCENARIO ANALYSIS FOR FUNDING OPTIONS (RUPEES IN CRORE) CAPITAL COST OF PROJECT CASE 1 PESSIMISTIC SCENARIO CASE 2 OPTIMISTIC SCENARIO CASE 3 MOST LIKELY SCENARIO TOTAL MARGINAL COST OF URBAN TRANSPORT (RS/VKM) SAVINGS ON ACCOUNT SCENARIO ANALYSIS FOR FUNDING OPTIONS (RUPEES IN CRORE) CASE 1 PESSIMISTIC SCENARIO - EIRR CASE 2 MOST LIKELY SCENARIO - EIRR CASE 3 OPTIMISTIC SCENARIO EIRR IMPLEMENTATION PLAN xiii
21 LIST OF FIGURES FIGURE 1.1 FIGURE 1.2 FIGURE 3-1 FIGURE 3-2 FIGURE 3-3 FIGURE 3-4 FIGURE 3-5 FIGURE 3-6 FIGURE 3-7 FIGURE 3-8 POPULATION GROWTH TREND COMMERCIAL OFFICE SPACE SUPPLY VS ABSORPTION VS VACANCY FOUR-STAGE MODEL STRUCTURE METHODOLOGIES FOR MODEL DEVELOPMENT DISTRIBUTIONS OF HOUSEHOLDS BY INCOME AND VEHICLE AVAILABILITY GROUP DISTRIBUTIONS OF HOUSEHOLDS BY HOUSEHOLD SIZE ATTRACTION MODEL (HBW-NV LINEAR REGRESSION) GRAVITY MODEL FORMULATION MODAL SPLIT MODELS STRUCTURE MULTI-LOGIT FORMULAS (COMBINED SPLIT) FIGURE 3-9 LOGIT MODEL SENSITIVITY FIGURE 3-10 EXPECTED PEAK HOUR PT PASSENGERS ON ROAD NETWORK IN 2041 WITH PHASE I & II SCENARIO FIGURE 3-11 EXPECTED PEAK HOUR TRAFFIC VOLUME (OTHER THAN PT) ON ROAD NETWORK IN 2041 WITH PHASE I & II SCENARIO FIGURE 4.1 SILK BOARD TO KR PURAM METRO LINE FIGURE 4.2 FIGURE 4.3 FIGURE 4.4 FIGURE 4.5 FIGURE 4.6 FIGURE 6-1 FIGURE 6-2 FIGURE 6-3 FIGURE 6-4 FIGURE 7-1 FIGURE 7-2 FIGURE 7-3 FIGURE 8.1 FIGURE 9.1 FIGURE 9.2 FIGURE 9.3 TYPICAL CROSS ECTION OF VIADUCT GROUND FLOOR PLAN CONCOURSE LEVEL PLAN PLATFORM LEVEL PLAN TRANSVERSE SECTION SCHEMATIC BORE LOG DETAILS BORE LOG DETAILS BORE LOG DETAILS BORE LOG DETAILS BIAYAPPANAHALLI DEPOT WHITEFIELD DEPOT KR PURAM TO SILK BOARD WITH DEPOT LOCATIONS POWER SUPPLY ARRANGEMENTS INTERIOR VIEW OF METRO TRAIN PASSENGER DOORS DRIVING CAB xiv
22 LIST OF FIGURES FIGURE 9.4 FIGURE 9.5 FIGURE 10.1 FIGURE 10.1 FIGURE 10.1 FIGURE 11.4 FIGURE 21.1 FIGURE 22.1 FIGURE 22.3 FIGURE 24.1 GANGWAY GANGWAY ISOMETRIC VIEW YEAR PHPDT AND CAPACITY CHART YEAR PHPDT AND CAPACITY CHART YEAR PHPDT AND CAPACITY CHART CONCEPTUAL SIGNALLING SCHEME PLAN FOR NEW LINE FROM KR PURAM TO SILK BOARD IMPLEMENTATION PLAN FUTURE EXTENSION FROM KR PURAM TO HEBBAL DETAILS OF LINE FROM KR PURAM TO BIAYAPPANAHALLI MOST LIKELY - CAPITAL FUNDS INFLOW ANNEXURE 13.1 NOTIFICATION OF 14TH SEPTEMBER 2006, MoEF, GOVERNMENT OF INDIA 13.2 REHABILITATION PACKAGE - BANGALORE METRO RAIL CORPORATION LTD. xv
23 ABBREVIATIONS ASS - Auxiliary Sub-Stations AQI - Air Quality Index ATL - Average Trip Length ATO - Automatic Train Operation ATP - Automatic Train Protection ATS - Automatic Train Supervision BBMP - Brarhut Bangalore Mahangar Palike BBRS - Broad Band Radio System BDA - Bangalore Development Authority BIAAPA - Bangalore International Airport Planning Area BIEC - Bangalore International Exhibition Center BMA - Bangalore Metropolitan Area BMRCL - Bangalore Metro Rail Corporation Limited BMS - Building Management System BMTC - Bangalore Metropolitan Transport Corporation BOD - Biological Oxygen Demand BPCL - Bharat Petroleum Corporation Ltd BWSSB - Bangalore Water Supply and Sewerage Board c - Shear Cohesion of Soil CATC - Continuous Automatic Train Control CBI - Computer Based Interlocking CBTC - Communication Based Train Control CCTV - Closed Circuit Television CI - Congestion Index CPCB - Central Pollution Control Board CR - Rock Core Recovery CSBJ - Central Silk Board Junction DCC - Depot Control Centre DMC - Driving Motor Car DMI - Driver Machine Interface DMRC - Delhi Metro Rail Corporation DPCS - Digital Protection Control System DRDO - Defense Research Development Organisation EB - Emergency Brake EIRR - Economic Internal Rate of Return EIU - Environmental Impact Unit EMC - Electromagnetic Compatibility EMI - Electromagnetic Interference EMP - Environment Management Plan EPA - Environmental Protection Act ESI - Environmental and Social Impact ETS - Emergency Trip System FBR - Fare Box Revenue FIRR - Financial Internal Rate of Return FOTS - Fiber Optic Transmission System FRLS - Fire Retardant Low Smoke
24 ABBREVIATIONS FRLSOH - Fire Retardant Low Smoke Zero Halogen FSB - Full Service Brake GC - Generalized Costs GSS - Grid Sub-Station HAL - Hindustan Aeronautics Ltd HBB - Home Based Business HBE - Home Based Education HBO - Home Based Other HBW - Home Base Work HSD - High Speed Diesel HW - Hazardous Waste IFC - International Finance Corporation IGBT - Insulated Gate Bipolar Transistors IIM - Indian Institute of Management IISc - Indian Institute of Science IMD - Indian Meteorological Department IRC - Indian Road Congress ISRO - Indian Space Research Organisation KRDCL - Karnataka Road Development Corporation Limited KSISF - Karnataka State Industrial Security Force KSPCB - Karnataka State Pollution Control Board KSRTC - Karnataka State Road Transport Corporation MoEF - Ministry of Environment and Forest MRTS - Mass Rapid Transport System MS - Motor Spirit MSW - Municipal Solid Waste NAAQS - National Ambient Air Quality Standards NAL - National Aerospace Laboratories NFBR - Non Fare Box Revenue NIMHANS - National Institute of Mental Health and Neurosciences NLSIU - National Law School of India University NMS - Network Management System O&M - Operation & Maintenance OCC - Operation Control Centre OD - Origin Destination ORR - Outer Ring Road OVPD - Over Voltage Protection Device PAPs - Project Affected Persons PCU - Passenger Car Unit PHPDT - Peak Hour Peak Direction Traffic PIU - Parameter Importance Unit PSD - Platform Screen Door PT - Public Transport PWL - Pit-Wheel lathe R &R - Resettlement and Rehabilitation ROW - Right of Way. RPM - Respirable Particulate Matter RQD - Rock Quality Designation
25 ABBREVIATIONS SCADA - Supervisory Control and Data Acquisition SER-O - Environmental and Social Responsibility in Operations SEZ - Special Economic Zone SIA - Social Impact Assessment SOC - Soil Organic Carbon SOD - Schedule of Dimension SPM - Suspended Particulate Matter SPT - Standard Penetration Tests TEP - Track Earthing Panel VOC - Vehicle Operating Cost - VOT - Value of Time WHO - World Health Organization Φ - Angle of Internal Friction
 is the capital of the Indian state of Karnataka which is located in the southern part of India. Bangalore is located on the heart of Mysuru Plateau which is a part of Deccan Plateau.")


26 CHAPTER 1: INTRODUCTION 1.1. BANGALORE CITY PROFILE 1. INTRODUCTION Bangalore officially known as Bengaluru (12.97 N E) is the capital of the Indian state of Karnataka which is located in the southern part of India. Bangalore is located on the heart of Mysuru Plateau which is a part of Deccan Plateau. This city spread across 741 sq. km is at an average elevation of 920 metres from sea level. Bangalore has a tropical savanna climate with distinct wet and dry seasons. Due to its high elevation, Bangalore usually enjoys a more moderate climate throughout the year. Although due recent real estate developments leading to reduction in green area the summers has become hotter comparatively. The mean annual temperature is 24.1 degrees Celsius. The geographic and climatic conditions of Bangalore make it as one of the best cities to live in. Bangalore is an important urban centre and is recognized as the Silicon Valley of India, Technical capital of India and as the Centre for Advanced Sciences, Higher Education, Research and Development. Bangalore Generates about 5% of the national GDP and contributes over one third (33%) of the India s tax revenues. Bangalore has been acknowledged as the third wealthiest city in India according to a study. Bengaluru boasts of a total wealth of USD 320 billion. The city is home to 7,500 millionaires and 8 billionaires and is most cosmopolitan city in India, one among the top ten High-Tech cities of the world, one of the Futuristic Cities of the world and as one of the very successful commercial and industrial hubs of the Indian Sub-Continent. The city which was originally developed as a Garden City has over the years, slowly transformed into an industrial and software hub of India. Bangalore's IT industry grew during this period with the establishment of Domestic and Multi-National companies. Indian technological organizations ISRO, Infosys and Wipro are headquartered in the city. It is home to many educational and research institutions in India, such as Indian Institute of Science (IISc), Indian Institute of Management (IIMB), National Law School of India University (NLSIU) and National Institute of Mental Health and Neurosciences (NIMHANS). Numerous state-owned aerospace and defense, such as Bharat Electronics, Hindustan Aeronautics and National Aerospace Laboratories are located in Bangalore. Bangalore Metro Phase-IIA DPR K.R.Puram Silk Board October 2016 Page 1-1


27 CHAPTER 1: INTRODUCTION 1.2. POPULATION GROWTH The total population of Bangalore Urban Agglomeration is 9.62 Million as per Census Bangalore was the fastest-growing Indian metropolis after Delhi between 1991 and 2001, with a growth rate of 38% during the decade. Bangalore is the Epi-Centree of economic activity. Rapid Industrialization and urban development in the Bangalore city has seen a tremendous growth in its population and is expected to be 14.1 Millionn by It had a metropolitan population of around 8.5 million as per 2011 census, making it the third mostpopulous city and fifth fth most populous urban agglomeration in India. Figure 1.1: Population Growth Trend The city has experienced major growth in the Information Technology sector making it a major technology hub in the country. Currently, Bangalore is the most stable real estate market in India driven by robust commercial absorption and job creation. Bangalore scores in terms of quality of schools, excellent climate and a cosmopolitan culture making it one of the most desirable cities to live in India GROWTH OF REAL ESTATE Bangalore has historically been and continues to be one of the most stable real estate markets in India. The city has experienced major growth in the Information Technology sector making it a major technology hub in the country. It is now regarded as a high-tech city and is a home to professionals and a destination for investment in residential real estate assets. A large majority of the office space absorption in Bangalore is contributed by IT companies, having appetite for acquisition of larger areas. The absorption for commercial space in Bangalore had been constantly increasing from 2009 to 2011 on a year-on year basis. This increasing trend in absorption was broken when 2012 could not reach the absorption levels Bangalore Metro Phase-IIA DPR K.R.Puram Silk Board October 2016 Page 1-2

28 CHAPTER 1: INTRODUCTION the city saw in Thee year 2013 was slightly lower than 2012 in terms of the total absorption. The absorption for the CY 2013 was approximately 8.66 million sq. ft. The absorption across SEZ space was approximately 1.57 million sq. ft. i.e. 18% of the total Bangalore absorption. The absorption of commercial real estate for the calendar year 2014 was approximately million sq. ft. (including preleases). This is approximately 40% higher than the overall absorption in This is expected to be the highest absorption in the city since The absorption of commercial space for the calendar year 2015 was approximately 13.4 million sq. ft. Figure 1.2: Commercial Office Space Supply Vs Absorption Vs Vacancy The overall vacancy rate for office space in Bangalore was at its highest in 2012 at 15% and since then the same had been declining to reach 12% for the year The vacancy at the end of 2015 stood at 10%. With excellent absorption in 2015, the current vacancy in the city is approximately 9%.In 2016 (Till 30th June), Bengaluru s total unwavering demand in the office sector coupled with the inherent popularity of Bengaluru amongst global corporate is a positive sign for Bengaluru'ss residential sector in the mid and long term. Bangalore continues to be a preferred destination for software professionals and original residents of Bangalore. Thee Eastern micro-market has done well and has improved its overall share in both launches and absorption. Proximity to the commercials hubs of Whitefield and ORR (70 million Sft of commercial stock) is the major reason for this pickup in demand. Markets like Old Madrass Road, Budigere crossing, Hoskote, Varthur road etc have contributed in this regard. The below table highlights the major residential locations in Bangalore. Bangalore Metro Phase-IIA DPR K.R.Puram Silk Board October 2016 Page 1-3
29 CHAPTER 1: INTRODUCTION 1.4. TRANSPORT NETWORK IN BANGALORE The transport network of Bangalore is a ring-radial network. Ten intercity roads cut across Bangalore City. There are about 3000 Km of urban roads (about Km of arterial and major roads). The major arterial roads have right of way (ROW) less than 25 m. NH7 and NH4 (part of North South Corridor and Golden Quadrilateral, respectively) and NH209 pass through Bangalore forming five important radial roads within the Bangalore Metropolitan Area. State Highways linking Bangalore with Mysore, Bangalore with Bannerghatta, and Bangalore with Magadi form other major radial corridors. Developed as a radial town, Bangalore does not have a strong circumferential road system, except for the Outer Ring Road, despite the intervening space between the corridors developed. The main highways include: NH4 (National Highway 4) running from Mumbai to Chennai; NH7 from Varanasi to Kanyakumari; NH209 connecting Kanakapura and Kerala; and SH17 connecting Bangalore to Mysore. Railway lines, all Broad Gauge, converge into the city from five different directions, viz. Mysore, Salem, Chennai, Guntakal and Hubli. Important Railway Stations serving the city are Bangalore city, Bangalore Cantonment, Yeshwantapur and Krishnarajapuram. Total route Kms within the City account for 62 Km VEHICULAR GROWTH Bangalore population has been growing at a fast pace during the last two decades. There has been a phenomenal growth in the population of vehicles as well, especially the two and four wheelers in this period due to rising household incomes consequent to IT sector boom in the region. The number of motor vehicles registered has already crossed six millions. The issues relating to traffic and transportation in a large and growing city like Bangalore need to be viewed in the larger perspective of urban planning and development. Issues relating to land use planning and development control, public-private transportation policy, industrial locations and IT corridors would need to be integrated at the perspective planning level. The vehicle population in all cities in India started growing rapidly since later part of 1980s. It has always had a reputation of having more two wheeler users. The liberalization policy of the country made availability of not only vehicles but also loans for buying vehicles. With the rapid growth of IT sector in Bangalore, the affordability of larger segment of employees increased for ownership of vehicles, more specially two wheelers. Coupled with inadequacy of comfortable and convenient public transport gave an impetus to more and more commuters shifting to cars and two wheelers for their commuting in Bangalore. Bangalore Metro Phase-IIA DPR K.R.Puram Silk Board October 2016 Page 1-4
30 CHAPTER 1: INTRODUCTION MODAL SPLIT The main modes of transport in the city presently are two-wheelers, cars and Public Transport which comprise mainly of buses and three wheelers. The growth of registered motor vehicles has crossed 1.6 million with a growth rate of 10% per annum. There has been a 10 fold increase in the number of vehicles in the last 20 years. The share of two wheelers out of the total registered vehicles is over 70%. This is due to the inadequate supply of Public Transport along with its inadequate level of service. The bus fleet in the last 10 years has grown at less than 7.5 % per annum. With the increase in population and the expansion of the city, the problem of connectivity of the populace has arisen. Quite obviously personalized modes of transport have grown at a tremendous rate and two wheelers along with the cars almost comprise 90% of the total registered vehicular population in the city.about 35% of the daily trips are Non-Motorized Transport (NMT) trips, 27% of the trips are carried by Public transport, 31% of the trips by private vehicles and 7% of the daily trips by Intermediate Public Transport (IPT). Two wheelers constitute more than 70% of the total volume, while cars comprise 15%, autos 4% and the remaining 8% includes other vehicles such as buses, vans and tempos. All or most of the roads are operating above their capacity and the volume: capacity ranges from 1:2, 1:3 and 1: PUBLIC TRANSPORT Buses, auto three wheelers (paratransit mode) and taxis are the only mode of public transport available in the city. Buses (including factory buses) carry about 2.4 million passengers per day i.e., modal share of about 45%. BMTC The public transport in Bangalore is operated by Bangalore Metropolitan Transport Corporation (BMTC). At present BMTC is operating 2400 bus routes with a fleet size of 6,111 buses. About 43 lakh daily passengers trips are carried by BMTC. Since the city is expanding in all directions, and roads already congested, buses alone are not able to cope up with the heavy commuter demand. Rail Network Bangalore city is having a fairly good rail network - about 62 kms, but its potential for commuter rail development has not been tapped. There are a few diesel operated passenger trains run to Bangalore City from Tumkur, Mysore and Kuppam on the Chennai line in the morning and as return train in the evening, mostly for commuters coming from suburban areas and satellite towns. They are well patronized and in the recent past the patronage has shown good growth rate. The Railway network carries hardly 1 % of the commuters for want of adequate number of services and their frequency. Bangalore Metro Phase-IIA DPR K.R.Puram Silk Board October 2016 Page 1-5
31 CHAPTER 1: INTRODUCTION Metro Network Namma Metro (literally "Our Metro"), also known as Bangalore Metro, is a metro system serving the city of Bangalore in Karnataka, India. Namma Metro is India's second largest metro system in terms of both length and number of stations, after the Delhi Metro. The development of network was divided into phases, Phase I containing 2 lines is scheduled to be completed in 2016, and Phase II by 2022.Phase I comprises two lines spanning a length of Km (26.28 mi), of which about 8.82 Km (5.48 mi) is underground and about Km (20.80 mi) is elevated. There are 40 stations in Phase I, of which 8 stations are underground, 1 at grade and 32 are elevated. Phase II spans a length of km km underground, 0.48 km at grade and km elevated, and adds 61 stations to the network, of which 12 are underground CURRENT INFRASTRUCTURE CHALLENGES Bangalore's vehicular traffic has increased manifold, with lakhs registered vehicles in the city continues to grow at an annual rate of between 7-10%. The maintenance and construction of roads to address the growing traffic in the city has been a challenge to the State s governing bodies. Development of the city road infrastructure has revolved around imposing one-way traffic in certain areas, improving traffic flow in junctions, constructing ring roads, bridges, flyovers and other grade separators. Everyday more than 30 accidents occur out of which 21 persons are injured and 2 to 3 persons killed. The economic loss caused due to traffic jams & accidents are unimaginable. This demands an effective multimodal integrated mass transportation network, which is cost effective, pollution free, covering large area & population. In the present work various options are investigated looking into the multifaceted traffic problems of Bangalore. This particular approach in the study is adoptable for cities facing similar problems. The experience of creating greater Bangalore has increased the number of trips to the city centre and work places in turn increasing the transportation needs. The average commercial speed during peak hour is 15.0 kmph CONCLUSION As of now the Metro Rail Phase-1 is nearing completion and a complete corridor East-West Corridor measuring 17 Kms. is in operation. The number of passenger trips being performed on this corridor has touched a peak of 1.4 lakhs per day. On an average on this corridor about 1.3 lakhs passengers are travelling. This has an indication of the potential of the metro system for Bangalore city besides it also indicates how the citizens of Bangalore have quickly changed their earlier modes of transport and switched over to the Metro rail system. The size of the City, the ever-growing congestions on the roads, an increase in investments in the IT and other Sectors are attracting more number of industries. All necessitate a modern public transport system. Therefore, a Metro rail system with a full-fledged network would be the ultimate solution for meeting the public transport needs of the citizens of Bangalore. Bangalore Metro Phase-IIA DPR K.R.Puram Silk Board October 2016 Page 1-6
32 CHAPTER 1: INTRODUCTION However, it needs to be noted that a bare rail based metro transport system cannot provide a full and comprehensive solution to the public transport problems and the metro rail system can work as the backbone of the public transport system but it would have to be complemented so that a complete solution is made available to the daily commuters. The following actions need to be taken along with the expansion of Bangalore Metro rail system: 1. Providing an efficient bus based feeder system to the Metro lines. 2. Focusing on the last mile connectivity 3. Providing seamless transportation points between Metro, Buses and other modes of transport 4. Providing user friendly facilities for the non-motorized transport. With Phase-1 and Phase-2 getting operational, the Bangalore City would have about 114 Kms. of Metro rail systems which still be far below what is required for the city with a population of exceeding 10 million. In addition Bangalore City emerging as the growth engine for the State of Karnataka, the need for more public transport cannot be overemphasized. A Metro system, though highly efficient, is capital intensive one. The resource constraints do not permit taking up of the entire metro system in one go and therefore, the metro network is being expanded in phases. With the limited resources available, therefore the urgent metro lines need to be taken up which command the minimal marginal cost but at the same time offer the maximum benefits. The focus of this report has been on identifying the corridor which satisfy these conditions. Bangalore Metro Phase-IIA DPR K.R.Puram Silk Board October 2016 Page 1-7

33 CHAPTER 2: METRO ON ORR 2 METRO ON ORR 2.1 BACKGROUND Construction on both Phase 1 and Phase 2 Metro Line is underway right now. Commercial operations have started on 30.3 km of the km Phase 1 and the rest is expected to open in phases in Construction for 15.1 km of the 72 km Phase 2 has started is expected to be completed in As emphasized in Chapter 1, the existing metro network of km would address the immediate traffic problems within the core areas and its immediate neighborhood but by the time the Revised Master Plan proposals get implemented and development of areas beyond the potential growth corridors takes place in right earnest, the above system will fall short and a more extensive system will become necessary. This is especially true because the Revised Master Plan 2015 and its detailed Zonal plans propose the development of around Sq. Kms. of area for various urban uses. This brings very large spread of area on which various urban activities will take place. They would now be located right up to the Peripheral Ring Road in practically all directions and at a few places even beyond it. It is therefore necessary that the Metro gets ultimately extended to the most of the high density centers. In this context, the following eight corridors have been identified for assessing the growth potential. Each of the above corridors growth index has been assessed to select the most potential corridor for extension of the existing metro rail network. Bangalore Metro Phase-IIA DPR K.R.Puram Silk Board October 2016 Page2-1


34 CHAPTER 2: METRO ON ORR Detailed Assessment explores growth through two complementary lenses: A high growth index of places which identifies those places that have experienced the fastest growth over the past five years A dynamism index of places which focuses on the qualityof growth; places where growth has contributed towardslocal economic value. This analysis has been supplemented by a small numberof in-depth, semi-structured interviews with a selection of local leaders and chief executives charged with overseeing the growth of their business areas. 2.2 HIGH GROWTH AND DYNAMIC AREA Further to assessment, Outer Ring Road K.R.Puram Silk Boardstretch emerged as potential growth corridors considering economic, demographic and spatial growth. High Economicgrowth includingbusinessstockandemploymentlevels Demographic growth including resident population and growth in` working age population Spatial growth - dwelling stock and commercial floor space Out of the entire commercial office space absorption in Bangalore, ORR accounts for a staggering 55% (7.2 Millionn Sft). To put things in perspective, the ORR stretch accounts for 20% of the total commercial office space absorption in India. This staggering statistic alone gives us an idea of the amount of economic activity happening along the ORR and the level of strain being inflicted on an already fragile infrastructure. Bangalore Metro Phase-IIA DPR K.R..Puram Silk Board October 2016 Page2-2
35 CHAPTER 2: METRO ON ORR With a standing stock of 130 Million Sft, Bangalore is one of the largest commercial office markets in India and accounts for the bulk of the annual office space absorption in India. In 2015, Bangalore accounted for 33% (13.2 Million Sft) of India s total commercial office space absorption. In Million Sq.ft % % % 28% % 40% 35% 30% 25% 20% 15% 10% 5% 0% In % Pan India Absorption Bangalore Absorption Banglore Absorption vs PAN India ORR serves as the main artery between Bangalore International Airport and the IT hubs of Bangalore. The ORR has approximately 40 Million Sft of commercial office space which is 32% of the entire commercial office stock in Bangalore. The working population of ORR is 4,50,000 persons which results in approximately 800,000 commuters traveling on this stretch everyday (about 15% of Bangalore city s vehicular traffic). The stretch from K.R.Puram to Silk board is surrounded by IT companies and huge residential pockets. The road infrastructure is a 3-lane divided dual carriageway with 2- lane service roads. Grade Separators are provided at major Junctions on the corridor. 2.3 INFRASTRUCTURE CHALLENGES The city has a ring radial road pattern and the Bangalore Development Authority (BDA) had developed the Outer Ring Road (ORR) in 2002 in a bid to divert the heavy traffic load to ease the traffic situation in the city. ORR has eventually evolved as the most attractive IT growth corridors of Bangalore. Currently, with around 4.5 Lakh employees working on this corridor, it is estimated that in the next 4 years, an additional 30 Million Sft. would be available for occupancy whichinturn projects a total of 8 lakhs working population by With immense growth in intra-city traffic, ORR is under tremendous pressure with high congestion index manifested in low speeds and high travel times. With rapid urbanization, in most of the stretches of ORR, the existing traffic volumes are far higher than the intended design of 5400 PCU's. Bangalore Metro Phase-IIA DPR K.R.Puram Silk Board October 2016 Page2-3


36 CHAPTER 2: METRO ON ORR The Hebbal to Silk board stretch of ORR sees close to 4.5 Lakhs cars travel on it every day which means that on an average 18,750 vehicles are present on the ORR every hour. During peak hours, this number is almost 2-3 times of the average. As per urban planning guidelines, the minimum travel speed for a major city road is 25 Km/hour. Due to the heavy traffic presence, the average travel speed in major sections of the ORR is less than 10Km/ hour. Considering the existing and proposed network of metro rail in Bangalore City, there has been a clear identification of the Stretch from K.R.Puram to Silk Board as the missing link on the Namma Metro Network. With absence of MRTS on ORR and increasing vehicular traffic there are longer queue lengths which lead to around 2-3 hours of travel time to cover a distance of 5-10 Km in peak hours. Employees loose approximately 90 minutes every day due to traffic snarls leading to an estimated loss of productivity amounting to INR 20,713 CR. per year. 2.4 INEVITABILITY OF HAVING A METRO ON ORR The metro networks have to be planned and executed in totality. It becomes difficult to add to the metro network if the future extensions are not planned or made part of the earlier network. Bangalore Metro Phase-IIA DPR K.R..Puram Silk Board October 2016 Page2-4
37 CHAPTER 2: METRO ON ORR With Phase-1 and Phase-2, which is underway, the metro lines are passing through the two extremities of this corridor. The Electronic City line of Phase-2 which runs from Jayanagar to Electronic City passes through the Central Silk Board junction. At the same time the eastern reach of the East-West corridor which connects Majestic City Centre to Whitefield passes through the other extremity of this corridor i.e. at KR Puram. If this corridor has to be completed, the two junctions at KR Puram and Silk Board have to be designed and this corridor needs to be factored in the design of Phase-2 itself. As at present, Phase-2 does not accommodate this corridor and therefore, it is very much necessary that suitable modifications are done on the two junctions at KR Puram and Silk Board. In addition, the most important technical factor which facilitates the metro on this corridor is that all intersections on this corridor are grade separated and at each intersection the grade separators is joined through a split flyovers. The splitting of flyovers on the intersection provides an ideal condition as the metro alignment would run between the gaps of the two flyovers, thereby making construction easy without disturbances to the road traffic. Non-utilization of this space between the flyovers at present may lead this space getting committed for some other uses which the Metro may find it difficult to get back at a later date. Therefore, it would be fitness of things that this alignment between KR Puram and Central Silk Board is being taken up alongside the Metro Phase-2 so that simultaneous to the completion of the two junctions at the extremities to connect the line also gets completed. The other technical feature which offers a metro system is that the entire alignment would be an elevated corridor and would not have to face the challenges of making an underground system which substantially delayed the Phase-1. Besides, this alignment runs on the outer ring road which is about 60 meters wide road and during construction phase, diversion of traffic would not pose a major challenge. Also the ORR is well designed with no sharp, horizontal or vertical curves which again make the construction of the line easy. 2.5 RETAINING THE ATTRACTIVENESS OF ORR DECLINING ATTRACTIVENESS INDEX FOR ORR Outer Ring Road remains a preferred choice from an occupier perspective but is marred by several factors such as supply scarcity on its preferred Marathahalli-Sarjapur belt and physical infrastructure crumbling under pressure from the mammoth developments and severe traffic bottlenecks. It is gradually sliding down on crucial market attractiveness parameters but simultaneously several developments from Marathahalli K.R. Puram and K.R. Puram to Hebbal belt are also in pipeline which Bangalore Metro Phase-IIA DPR K.R.Puram Silk Board October 2016 Page2-5
38 CHAPTER 2: METRO ON ORR will keep the tenant interest alive in the long term. That said, similar tenant profile and precommitments in upcoming developments continue to drive demand in the busy ORR Belt. The retention in attractiveness is a cause of concern and one of the major factors to reduce this attractiveness is the inadequate infrastructure and access through public transport. The BMTC buses are the only modes of public transport for people to access this corridor. This is evident from the fact that the IT Companies on this corridor engage 2800 chartered buses, maxi cabs and private buses to ferry their employees. Therefore, there is an urgent need to provide mass transport facilities in order to retain if not, make the attractiveness index of this area. A decline in attractiveness index may lead to the business units to short location and this shift may take place not only to other locations of the Bangalore city but even outside the Bangalore City. 2.6 CONCLUSION Therefore, based on the above analysis it is extremely necessary that the ORR between KR Puram and Silk Board should get connected through the metro line. This line would not only offer the highest return but would also come at the least marginal cost. Bangalore Metro Phase-IIA DPR K.R.Puram Silk Board October 2016 Page2-6
39 CHAPTER 3 TRAFFIC DEMAND ANALYSIS - ESTIMATION OF RIDERSHIP 3 TRAFFIC DEMAND ANALYSIS - ESTIMATION OF RIDERSHIP 3.1 INTRODUCTION: Ridership is the most important factor to determine the desirability and also the viability of a new metro line. The ridership indicates the number of passengers using the metro train by paying notified fare. Generally, the ridership is estimated in terms of the number of people who would be travelling in the train per day. It is clarified that the ridership if the total number of passenger trips. 3.2 ESTIMATION OF RIDERSHIP FOR THE ORRMETRO LINE: The ridership can be estimated by adopting different methodologies. For the purpose of this DPR, three different methodologies have been used to arrive at the ridership for the new line. These methodologies are: Travel demand modeling Estimation of ridership through assessment of built up areas Estimation of ridership by extrapolating the ridership on the East-West Corridor which is currently operational Travel Demand Modeling (This was done by M/s. RITES) The transportation planning process consists of development of formulae (or models), enabling forecast of travel demand, and development of alternative strategies for handling this demand. It is not just one model, but also a series of inter-linked and inter-related models of varying levels of complexity, dealing with different facets of travel demand. Through these models, the transportation study process as a whole is checked and calibrated before it is used for future travel predictions. The model has been built using CUBE software developed by Citilabs and Urban Analysis Group. The normal and easily available planning variables at zonal levels such as population, employment and student enrolment have been made use of in transport demand analysis. The model uses the analyzed data from household interview and other traffic surveys conducted as a part of this study and secondary data. Bangalore Metro Phase-IIA DPR K.R.Puram Silk Board October 2016 Page 3-1
40 CHAPTER 3 TRAFFIC DEMAND ANALYSIS - ESTIMATION OF RIDERSHIP Methodology For Model Development The model developed is a traditional four-stage transportation model, as illustrated in Figure 3.1 Figure 3.1 Four-Stage Model Structure ZONING SYSTEM LANDUSE AND SOCIOECONOMIC DATA ROAD AND PUBLIC TRANSPORT NETWORKS TRIP GENERATION HOW MANY TRIPS? BY TYPE TRIP DISTRIBUTION WHAT IS THE PATTERN OF TRIP MAKING? MODAL SPLIT WHICH MODE OF TRANSPORT ISUSED? ASSIGNMENTS WHICH RO UTE IS TAKEN? Figure 3.2 provides a summary of the interactions of the different part of the proposed transport model. The main inputs to the modelling are shown to the left of the figure in the uncolored boxes and include the zoning system (representing the spatial disaggregation of the study area), land use data, policies and travel costs by competing modes. Bangalore Metro Phase-IIA DPR K.R.Puram Silk Board October 2016 Page 3-2
41 CHAPTER 3 TRAFFIC DEMAND ANALYSIS - ESTIMATION OF RIDERSHIP Figure 3.2 Methodologies for Model Development Zoning System Land Use Income Model Vehicle Avail. Model Trip Generation Model Trip Attraction Model PT Accessibility Vehicle Policies Travel Costs & Infrastructure Assumptions -Network links -Operating costs -Fares -Tolls -Parking costs -VoT Daily Travel Demand by Traffic Zone Income Level Vehicle Availability Trip Purpose Modal Split Highway Accessibility Road Speeds Commercial Vehicles Model Taxi/Rickshaw Occupants Car Occupants PT Passengers Private Distribution Model PT Distribution Model Vehicles Occupancy Model Special Generators Daily Vehicle Matrices Bus/BRT Passengers Metro/LRT/ Monorail Passengers Period Definition Peak Period Model Bus Vehicles Highway Assignment Model PT Assignment Model Congestion Analysis Operational Analysis Policy/Project Evaluation Policy & Inputs Models Outputs The blue colored boxes in the figure represent the different sub-models. The pink colored boxes are model outputs and ultimately provide information for the project evaluation that will be carried out once the model is completed. The model features a feedback loop in which the changes in public transport accessibility (i.e. through provision of enhanced public transport) can affect the number of trips generated in the first stage of the 4-stage process. Bangalore Metro Phase-IIA DPR K.R.Puram Silk Board October 2016 Page 3-3
42 CHAPTER 3 TRAFFIC DEMAND ANALYSIS - ESTIMATION OF RIDERSHIP Model Structure The model developed has the following characteristics: Motorised daily model is based on productions / attractions and internal trips of Bangalore residents for base year These modes of travel (ie. Car+Taxi, two wheelers, autorickshaw, and bus) comprise 90.7 Lakhs daily trips. The remaining 33.1 Lakhs daily trips are those relating to non-mechanised trips (walk, cycle and cycle rickshaw) as well as external trips and those on the national rail network. The different sub-models i.e. vehicle availability, generation, attraction, distribution, modal choice and assignment models have the following characteristics: Vehicle availability model estimates the distribution of households by vehicle availability group, which has an impact on the number of trips and the chosen mode and destination; Generation and attraction models calculate trips generated and attracted by each zone, by purpose and vehicle availability group; Distribution models distribute trips generated into the possible destinations and provide all modes matrices; Modal choice models split total travel demand matrices by mode; Assignment models represent the last stage of the model, build paths, assign origin / destination (OD) matrices, and finally provide loaded networks for average hour and global AM peak hour. A standard average hour factor of 7% is applied to the daily OD matrices for hourly highway and public transport (PT) assignment. The model considers four modes i.e. car+taxi, two wheelers (2W), auto-rickshaw (Auto) and public transport (PT). The model considers four purposes i.e. Home Base Work (HBW), Home Based Education (HBE), Home Based Business (HBB) and Home Based Other (HBO). Three vehicle availability groups i.e. No Vehicle available (NV), car available (Car) and 2W available (2W) have been considered. The model area covers the Bangalore Metropolitan Area (BMA) and proposed development around Bangalore International Airport Planning Area (BIAAPA) including the new airport at Devanahalli. The adjoining areas are being treated as external zones. The model zoning system contains 225 zones, 215 internal zones (BMA) and 10 external zones. The model development is largely based on the Households Interview after expansion from sample to total population. This is calculated at a zonal level Base Year Highway Matrices Development The next step was to build the base year highway matrices necessary to obtain costs for the model development (distribution and modal choice): HIS matrices are converted to vehicles using occupancy and PCU factors and added to external matrices to get total traffic to get the final highway matrices (car, auto, 2W). Bangalore Metro Phase-IIA DPR K.R.Puram Silk Board October 2016 Page 3-4
43 CHAPTER 3 TRAFFIC DEMAND ANALYSIS - ESTIMATION OF RIDERSHIP Vehicle Availability, Generation, and Attraction Models Development and Calibration The development and calibration of vehicle availability, generation, and attraction models, as estimated based on 2015 Households Interview Survey database are as follows: Vehicle availability model estimates the distribution of households by vehicle availability group (No Vehicle, car available, and two wheelers available) based on the households monthly average income by zone Generation model calculates daily person trips generated by purpose (Home Base Work, Home Based Education, Home Based Business, and Home Based Other), and households group (segmentation by size and vehicle availability); Attraction model produces daily person trip attracted by purpose and vehicle availability group Vehicle Availability Model Figure 3.3 shows the estimated distribution of households by income and vehicle availability group. The trends match the existing situation. The proportion of households with no vehicle logically decreases with income increase, and conversely the part of households with car available increases when income rises. The percentage of households with two wheelers available increases up to an income of Rs.50, 000 per month, then decreases, indicating that from this income point, households have more opportunity to buy a car. In terms of the model application, it should be noted that the households distributions are applied to the monthly average income, defined for each zone (total 215) from the HIS database. Table 3.1 presents the vehicle availability model calibration; the model household s distribution by vehicle availability is identical to the HIS data: no vehicle 21%, car available 24%, and two wheelers available 55%. Table 3.1: Vehicle Availability Model Calibration Results VA NV Car 2W Total HIS Model HIS 21.59% 23.86% 54.54% % Model 21.59% 23.83% 54.57% % Difference 0.00% 0.03% 0.03% 0.00% Bangalore Metro Phase-IIA DPR K.R.Puram Silk Board October 2016 Page 3-5
44 CHAPTER 3 TRAFFIC DEMAND ANALYSIS - ESTIMATION OF RIDERSHIP Figure 3.3 Distributions of Households by Income and Vehicle Availability Group Generation model Vehicle availability model results are an input to the generation model, which also requires household size distribution. Therefore, a model estimating the distribution of households (HH) by household s size (1, 2, 3, 4, 5, and 6+ members) was also developed, as shown in Figure 3.4. In the model application, the distribution is calculated for each individual zone based on each zone average households size. Lines trends look sensible. The proportion of households with one, two, or three persons decrease when the average household size increases, and on the opposite side, the percentage of households with 5 or 6+ members increase. As illustrated in Table 3.2, model distribution is very close to the HIS one: household proportion with only 1 member 1%, 2 members 8%, 3 members 35%, 4 members 39%, 5 members 12%, and 6+ members 5%. Table 3.2: Generation Model Calibration Results (Household s Size Distribution) HH Size HH1 HH2 HH3 HH4 HH5 HH6+ Total HIS Model HIS 0.60% 7.67% 35.21% 39.13% 11.97% 5.42% 100.0% Model 0.58% 7.69% 35.20% 39.15% 11.94% 5.43% 100.0% Difference 0.02% 0.02% 0.01% 0.02% 0.03% 0.01% 0.00% Bangalore Metro Phase-IIA DPR K.R.Puram Silk Board October 2016 Page 3-6
45 CHAPTER 3 TRAFFIC DEMAND ANALYSIS - ESTIMATION OF RIDERSHIP Figure 3.4 Distributions of Households by Household Size Vehicle availability and households size models predict the number of households per size and vehicle availability. Based on this segmentation (6 HH sizes x 3 vehicle availability group = 18 groups), daily person trip rates were extracted by purpose and are presented in Table 3.3 (18 groups x 4 trip purposes = 72 trip rates). Figures show a trip rate increase with household size increase, and the clear impact of the motorisation: people make more trips if they are motorised (even more if they have a car rather than a two wheelers) and also make longer trips. The generation is home based and therefore based on Productions / Attractions (PA), not Origins / Destinations. At the end of the generation models application, the segmentation by household size disappears since trips are aggregated by purpose and VA (4 x 3 = 12 groups). Table 3.3 Zone Wise Distribution of Student Enrolment Purpose HBW HBE HBO HBB HH size / VA NV Car W NV Car 2W NV Car 2W NVV Car 2W Note: external, walk, cycle, cycle rickshaw, and train trips not included. Bangalore Metro Phase-IIA DPR K.R.Puram Silk Board October 2016 Page 3-7

46 CHAPTER 3 TRAFFIC DEMAND ANALYSIS - ESTIMATION OF RIDERSHIP Table 3.4 shows the numbers of daily person trips by purpose and vehicle availability group in the HIS database. Table 3.4 HIS database Daily Person Trips By Purpose And Vehicle Availability Group Purpose / VA NV Car 2W Total HBW HBE HBO HBB Total Attraction Model The Generation model produces daily person trips generated by zone, whilst the attraction model estimates daily person trips attracted by zone (by purpose and vehicle availability). For each of the 12 groups (4 purposes x 3 VA), a linear regression was estimated, explaining the number of trips attracted by the socio-economic data, total employment for HBW, HBB, and HBO, and school enrolment for HBE. Figure 3.5 presents for instance the linear regression of HBW - no vehicle available group: with a R-square value equal to 0.78, it shows a good match between the data from HIS and the estimated values from the linear regression (more R2 is near to 1, more the linear regression is reliable). To be consistent with the generation model, the attraction model is based on PA. The Attraction model calibration is summarised in Table 3.5, by purpose and vehicle availability: HIS and model figures are very similar, showing a very close correspondence between modelled and observed. Figure 3.5 Attraction Model (HBW-NV Linear Regression) Bangalore Metro Phase-IIA DPR K.R.Puram Silk Board October 2016 Page 3-8
47 CHAPTER 3 TRAFFIC DEMAND ANALYSIS - ESTIMATION OF RIDERSHIP Table 3.5 Attraction Model Calibration Results Group HIS Model Difference HBW_NV % HBW_Car % HBW_2w % HBE_NV % HBE_Car % HBE_2w % HBB_NV % HBB_Car % HBB_2w % HBO_NV % HBO_Car % HBO_2w % TOTAL % Distribution Models Models were developed based on the HIS database The models were developed based on the HIS database and the Generalized Costs (GC) produced from the highway and Public Transport cost models implemented in Cube Voyager. The main features of the models are as follows: 12 segments: 4 purposes (Home Base Work, Home Based Education, Home Based Business, and Home Based Other) x 3 vehicle availability groups (No Vehicle, car available, and two wheelers available); Unit: Person (Productions / Attractions PA); Period: Daily; Model formulation: gravity model, based on composite GC presents in Figure 3.6 Bangalore Metro Phase-IIA DPR K.R.Puram Silk Board October 2016 Page 3-9
48 CHAPTER 3 TRAFFIC DEMAND ANALYSIS - ESTIMATION OF RIDERSHIP Figure 3.6 Gravity Model Formulation The composite GC is the average of the GC for individual modes weighted by modal split proportions (produced by modal split models) by Origin / Destination movements; For individual modes, the GC represents perceived costs, where the unit is minute equivalent, implying the use of Values of Time (VOT, 2007 prices, Rupees / hour) by mode to convert monetary costs (fare, Vehicle Operating Cost - VOC, and toll) into minutes. Occupancy factors (OCC) are also used for Car+Taxi, 2W, and Auto to obtain person based GC. Hereafter are described the GC by mode, IVT means In Vehicle Time; Car+Taxi GC = Time + [((VOC + Toll) / OCC) / VOT] x 60; 2W GC = Time + [((VOC + Toll) / OCC) / VOT] x 60; Auto GC = Time x Wait Time (4 ) + [(Fare / OCC) / VOT] x 60; PT GC = IVT x Walk Time + 2 x Wait Time + (Fare / VOT) x 60 + Transfer Time (Penalty of 5, apart for transfer from / to metro: 0.5 ); Table 3.6 summarises the model values of VOT, VOC, and OCC for use in the base year model calibration; Table 3.6 Base Year Values of Time, Vehicle Operating Costs and Vehicle Occupancy Rates Mode VOT (Rs/hour) VOC (Rs/km) OCC Car+Taxi W Auto PT Bangalore Metro Phase-IIA DPR K.R.Puram Silk Board October 2016 Page 3-10
49 CHAPTER 3 TRAFFIC DEMAND ANALYSIS - ESTIMATION OF RIDERSHIP Calibration results This section provides the distribution models calibration results by market segment: X1 and X2 parameters, intrazonal trips, average GC (in minutes), and trip GC distribution. As illustrated by Table 3.7, the overall models results are similar to the HIS database. Table 3.7 Distribution Models Calibration Results HIS Model Difference Segments Trips X1 X2 Trips Trips HBW NV % HBW Car % HBW 2W % HBB NV % HBB Car % HBB 2W % HBE NV % HBE Car % HBE 2W % HBO NV % HBO Car % HBO 2W % Modal split models The models were developed based on the HIS database and the Generalised Costs (GC) produced from the highway and Public Transport cost models implemented in Cube Voyager. Figure 3.7 illustrates the modal split models structure: trips are split into the four modes (Car+Taxi, 2W, Auto, and PT) by vehicle availability group (Car, 2W, and NV), then added by mode, PT trips being separated between bus and metro services during the assignment stage. It should be noted that the PT matrix produced by the modal split models contains trips using school, chartered, and public buses, but only the last two categories are retained for the PT assignment, the other two groups (school and chartered buses) not using the public network. However, these are taken into account in the highway assignment. Bangalore Metro Phase-IIA DPR K.R.Puram Silk Board October 2016 Page 3-11
50 CHAPTER 3 TRAFFIC DEMAND ANALYSIS - ESTIMATION OF RIDERSHIP Figure 3.7 Modal Split Models Structure Tripends Car Available 2W Available No Vehicle Available Car+ Taxi 2W Auto PT Car+ Taxi 2W Auto PT Car+ Taxi 2W Auto PT Car+ Taxi 2W Auto PT Bus Metro The main features of the modal split models are as follows: 12 segments: 4 purposes (Home Base Work, Home Based Education, Home Based Business, and Home Based Other) x 3 vehicle availability groups (No Vehicle, car available, and two wheelers available); modes: Car+Taxi, two wheelers, auto-rickshaw, and PT; Unit: person (Productions / Attractions PA); Period: daily; Model formulation: combined split, multi-logit formulas (equations provided in Figure 3.8, where P means Probability and C is the Generalised Cost); Figure 3.8 Multi-Logit Formulas (Combined Split) P Car taxi e ( λc Car taxi ) e ( e ( λc Car taxi ) λc2w ) e ( λc Auto ) e ( λc PT ) P 2W e ( λc Car taxi ) e e ( λc2w ) ( λc2w ) e ( λc Auto ) e ( λc PT ) P Auto e ( λc Car taxi ) e e ( λc Auto ) ( λc2w ) e ( λc Auto ) e ( λc PT ) P PT e ( λc Car taxi ) e e ( λc PT ) ( λc2w ) e ( λc Auto ) e ( λc PT ) Bangalore Metro Phase-IIA DPR K.R.Puram Silk Board October 2016 Page 3-12
51 CHAPTER 3 TRAFFIC DEMAND ANALYSIS - ESTIMATION OF RIDERSHIP Logit parameters estimation: the mode choice sensitivity revealed by the model is mainly determined by the parameter. This model parameter was developed based on statistical regression analysis, which also provided some initial estimates on the mode biases. As shown by Figure 3.17 for illustrative purpose only (example with two modes, car and PT), when increases, the model becomes more responsive to the difference in cost. The GC represents perceived costs, where the unit is minute equivalent, implying the use of Values of Time (VOT, Rupees / hour) by mode to convert monetary costs (fare, Vehicle Operating Cost - VOC, parking cost at destination, and toll) into minutes. Occupancy factors (OCC) are also used for Car+Taxi, 2W, and Auto to obtain person based GC. Below are described the GC by mode, IVT means In Vehicle Time: Car+Taxi GC = Time + [((VOC + Toll + Parking Cost) / OCC) / VOT] x 60; 2W GC = Time + [((VOC + Toll + Parking Cost) / OCC) / VOT] x 60; Auto GC = Time x Wait Time (4) + [(Fare / OCC) / VOT] x 60; PT GC = IVT x Walk Time + 2 x Wait Time + (Fare / VOT) x 60 + Transfer Time (Penalty of 5, apart for transfer from / to metro: 0.5 ). Figure 3.9 Logit Model Sensitivity Logit model sensitivity 100% 90% 80% 70% 60% % PT 50% 40% 30% Lambda 0.04 Lambda 0.02 Lambda % 10% 0% Generalized Cost Difference (Car - PT, min) Calibration Results Tables 3.8 and 3.9 demonstrate that there is close correspondence between the synthesised and observed values from the HIS. Some specific comments can be made: Bangalore Metro Phase-IIA DPR K.R.Puram Silk Board October 2016 Page 3-13
52 CHAPTER 3 TRAFFIC DEMAND ANALYSIS - ESTIMATION OF RIDERSHIP In theory, for any multi-logit model with four possible choices, there are a maximum of three bias factors available; The Lambda parameters trends are sensible, lower for car and higher for NV, meaning less sensitivity to cost for car Table 3.8 Calibrated Modal Choice Models Parameters Segments Lambda Bias mode 1 Bias mode 2 Bias mode 3 HBW-NV HBW-Car HBW-2W HBE-NV HBE-Car HBE-2W HBB-NV HBB-Car HBB-2W HBO-NV HBO-Car HBO-2W Table 3.9 Modal Split Models Calibration Results Modes HIS Model Difference Car+Taxi % 2W % Auto % PT % Total % Bangalore Metro Phase-IIA DPR K.R.Puram Silk Board October 2016 Page 3-14
53 CHAPTER 3 TRAFFIC DEMAND ANALYSIS - ESTIMATION OF RIDERSHIP Model Validation Introduction This section describes the model validation results, which is the last step in the model development. Model validation is done for daily model. All the models built are linked together through the output files and therefore the model validation only uses synthetic data, all produced by the model itself. The model validation has no impact on the vehicle availability, generation, and attraction models results, therefore they are the same as the ones presented earlier. The model validation actually consists of a slight adjustment of the model calibration data to match the observed figures: For distribution and modal choice, some biases were added to the costs; For the PT assignment, transfer time was adjusted to 7.5 minutes (apart for transfer from / to metro, 1.5 minutes), in order to replicate observed metro trips and boardings. These calibration adjustments will remain as part of the model for future years and scenario application. It should also be noted that the model validation results come from an iterative run of the model in order to ensure the convergence of the results and the consistency with the model runs for future years Distribution models Table 3.10 illustrate the distribution models validation results by segment: X1 and X2 parameters, and trip distribution. Models results are generally close to the HIS database. Table 3.10 Distribution Models Validation Results HIS Model Difference Segments Trips X1 X2 Trips Trips HBW NV % HBW Car % HBW 2W % HBB NV % HBB Car % HBB 2W % HBE NV % Bangalore Metro Phase-IIA DPR K.R.Puram Silk Board October 2016 Page 3-15
54 CHAPTER 3 TRAFFIC DEMAND ANALYSIS - ESTIMATION OF RIDERSHIP Table 3.10 Distribution Models Validation Results HIS Model Difference Segments Trips X1 X2 Trips Trips HBE Car % HBE 2W % HBO NV % HBO Car % HBO 2W % Modal Split Models This section provides the modal split models validation results, based on a slight update of the costs compared to the model calibration. Similar to the distribution models, modal split percentages from the models are very close to the HIS database as shown in Table 3.11 Table 3.11 Modal Split Models Validation Results Modes HIS Model Difference Car+Taxi 9.91% 9.95% 0.04% 2W 36.96% 36.83% 0.13% Auto 9.11% 9.12% 0.01% PT 44.02% 44.09% 0.07% Total % % 0.00% Future Growth Scenario Master Plan for Bangalore gives the likely growth to take place within the various areas of study area. The Master plan also gives locations of various land uses such as residential, commercial, industrial uses etc. The study area is estimated to have population of about Lakh in 2015, Lakh in 2021, Lakh in 2031 and Lakh by The employment in this area, which is 51.5 Lakh in 2015, is expected to grow to about Lakh in Similarly, student enrolment is expected to grow from 26.4 Lakh to 42.3 Lakh in Traffic zone wise distribution of population, employment and student enrolment in 2015, 2021, 2031 and Bangalore Metro Phase-IIA DPR K.R.Puram Silk Board October 2016 Page 3-16
55 CHAPTER 3 TRAFFIC DEMAND ANALYSIS - ESTIMATION OF RIDERSHIP The proposed growth of population and economy is expected to generate high travel demand. An integrated landuse transportation model has been built to enable estimation of future travel demand. The development of travel demand model has been discussed in detail in Chapter 5. As per travel demand modeling exercise, daily intra travel demand is expected to grow from 90 lakh person trips in year 2015 to 176 lakh in year The present chapter examines some transport scenarios to meet the travel demand and recommends the best scenario for Bangalore metro Assumptions for Transport Demand Forecasting The following assumptions have been made for forecasting transport demand for the years 2021, 2031 and (i) Calibrated and validated travel demand model has been used (ii) Land use parameters (population, employment and student enrolment) have been distributed in various traffic zones for 2021, 2031 and (iii) The fare levels of metro have been considered same as that of the existing Delhi Metro network. (iv) Inter-city passenger to / from the study area will grow at the growth rate of 3%. (v) The special generator passenger traffic of airport and railway stations in Bangalore is expected to grow at 4% per annum. (vi) Inter-city goods traffic is expected to grow at 3% per annum up to (vii) Intra-city goods traffic is expected to grow at 2% per annum up to Transport Demand Forecast For Phase I & Ii Corridors Of Bangalore Metro 2021 & 2041-Business As Usual Scenario Considering the above assumptions and calibrated / validated traffic demand model, forecasting of transport demand has been carried out for metro network with phase I and phase II network scenario only in the year The Bangalore Metro Phase I & II corridor is assumed as given metro network corridor for this scenario. Overall modal split intra trips for various modes in this scenario for the years 2015, 2021 and 2041 is given in Table The modal split (% of trips by public transport to total motorised trips) in favour of public transport in 2041 is expected to be 48.9% which is less than the 2021 level of 49.5%. It indicates that in spite of phase I & II metro corridor, expansion of high capacity mass transport network will need to be done. Table 3.12 Daily Trips (Intra-city) by Various Modes in Phase I & II Corridors of Bangalore Metro SN Mode 2015(Household) 2021 Phase I & II 2041 Phase I & II Trips Modal Share Trips Modal Share Trips Modal Share 1 Car Two Wheeler Bangalore Metro Phase-IIA DPR K.R.Puram Silk Board October 2016 Page 3-17

56 CHAPTER 3 TRAFFIC DEMAND ANALYSIS - ESTIMATION OF RIDERSHIP 3 Auto PT Total The traffic assignment in 2041 on road network in this scenario for public transport and other vehicles are given in Figures 3.10 and 3.11 respectively. These figures show that many roads will still be overloaded beyond their capacity. Therefore mass transport system such as metro will be required on many corridors to cater to future transport demand. Figure 3.10 Expected Peak Hour PT Passengers on Road Network in 2041 with Phase I & II Scenario Bangalore Metro Phase-IIA DPR K.R.Puram Silk Board October 2016 Page 3-18
. This metro line did not figure as a specific zone in the model.")
57 CHAPTER 3 TRAFFIC DEMAND ANALYSIS - ESTIMATION OF RIDERSHIP Figure 3.11 Expected Peak Hour traffic Volume (other than PT) on Road Network in 2041 with Phase I & II Scenario ESTIMATION OF RIDERSHIP FOR PROPOSED NEW LINE: The travel model generated by M/s RITES has made use of 215 traffic ones. These traffic zones were generally the wards of BBMP (Brarhut Bangalore Mahangar Palike). This metro line did not figure as a specific zone in the model. Therefore the wards (traffic zones) which were falling on this corridor were taken to project the population and employment figures. Furthermore, the employment figures Bangalore Metro Phase-IIA DPR K.R.Puram Silk Board October 2016 Page 3-19
58 CHAPTER 3 TRAFFIC DEMAND ANALYSIS - ESTIMATION OF RIDERSHIP were suitably adjusted to reflect the high concentration of Software Technology Parks in this area. With these corrections, the model was run and the ridership figures have been estimated for the years 2021, 2031, 2041 and is given in Table As the entire analysis in the present DPR starts from the year 2020, the Ridership i.e. no of passenger trips per day for the year 2020 has been taken as 3.1 lakhs. Table 3.13 Employment Along Silk Board Outer Ring Road (ORR) SN Traffic Zone Name Traffic zone Devasandra A Narayapura Vijayanagar Garudachala palya Dodda Nekkundi Marathahalli Bellanduru HSR Layout Jakkasandra Total 510, , , ,064, Boarding Alighting The boarding alighting of peak hour for 2031 and 2041 is given in table below: The total boarding and alighting for 2031 is and respectively and for 2041 boarding and alighting during peak hour is and respectively. Thus estimated ridership in this section will be about 5 lakhs trips during peak hours by Bangalore Metro Phase-IIA DPR K.R.Puram Silk Board October 2016 Page 3-20
59 CHAPTER 3 TRAFFIC DEMAND ANALYSIS - ESTIMATION OF RIDERSHIP Table 3.14 Corridor - K R Puram to Silk Board along ORR Station Name Daily Board 2021 Peak Board 2021 Daily Board 2031 Peak Board 2031 Daily Board 2041 Peak Board 2041 Board Alight Board Alight Board Alight Board Alight Board Alight Board Alight K R Puram 31,016 30,916 8,317 8,256 35,237 34,834 9,189 9,405 40,973 40,481 10,789 10,648 Mahadevapura 13,068 13,199 3,625 3,573 15,479 15,808 4,903 4,837 17,352 17,930 5,422 5,417 DRDO Sports Complex 33,379 33,370 8,793 7,413 41,895 41,867 11,188 9,489 47,116 47,102 12,381 10,450 Doddanekundi 9,974 10,011 2,609 2,608 12,981 13,011 3,228 3,222 15,578 15,615 3,845 3,819 ISRO 24,259 24,366 4,831 6,039 32,180 32,298 6,886 8,452 38,155 38,287 8,598 10,402 Marathahalli 12,357 12,833 4,688 4,473 13,753 14,328 5,376 4,868 15,405 15,967 5,831 5,624 Kodibisanahalli 38,871 38,815 13,347 13,777 40,403 40,345 14,049 14,245 45,761 45,703 16,231 16,323 Kadubeesanahalli 21,261 21,261 3,872 4,405 36,374 36,374 6,421 7,083 51,577 51,577 8,802 9,603 Bellandur 42,024 42,010 13,526 13,799 66,483 66,464 20,123 20,538 94,108 94,083 27,918 28,450 Ibbalur 3,242 3, ,563 3, ,040 4, Agara Lake 2,250 2, ,797 2,957 1, ,299 3,438 1,140 1,131 HRS Layout 56,951 57,026 18,391 16,398 73,178 72,783 22,892 20,224 90,842 90,069 26,335 24,807 Slik Board 63,161 62,363 20,417 22,054 84,245 83,947 26,872 29,101 1,10,540 1,10,490 35,311 36,226 Total 3,51,813 3,51,813 4,58,569 4,58,569 5,74,745 5,74,746 Bangalore Metro Phase-IIA DPR K.R.Puram Silk Board October 2016 Page 3-21
60 CHAPTER 3 TRAFFIC DEMAND ANALYSIS - ESTIMATION OF RIDERSHIP PHPDT: Maximum PHPDT for the above section is The table below 3.15 shows the peak hour peak direction trip for above section. Table 3.26 PHPDT Demand and Capacity Chart Table 3.15 PHPDT Demand and Capacity Chart From To Dir 1 Dir 2 PDPDT 2021 Dir 1 Dir 2 PDPDT 2031 Dir 1 Dir 2 PDPDT 2041 K R Puram Mahadevapura Mahadevapura DRDO Sports Complex DRDO Sports Complex Doddanekundi Doddanekundi ISRO ISRO Marathahalli Marathahalli Kodibisanhalli Kodibisanhalli Kadubeesanahalli Kadubeesanahalli Bellandur Bellandur Ibbalur Ibbalur Agara Lake Agara Lake HSR Layout HSR Layout Silk Board Bangalore Metro Phase-IIA DPR K.R.Puram Silk Board October 2016 Page 3-22
61 CHAPTER 3 TRAFFIC DEMAND ANALYSIS - ESTIMATION OF RIDERSHIP Estimation Of Ridership Through Assessment Of Built Up Areas. M/s Colliers International has estimated the metro ridership over the next 30 years based on the current occupied and future estimated commercial stock in the influence zone of the ORR Metro corridor. The current commercial stock estimated is around 55 Million Sq.Ft. and based upon current under construction projects, vacant land parcels available for commercial development and historical influx of commercial space in this corridor, new addition to the commercial office stock has also been estimated. Using historical data, the total annual off take of space in this region has been computed and assumed. The result is the total occupied commercial office stock in this region for each year, projected for the next 30 years. Using an industry prevalent standard of 100 Sq.Ft per employee, the total number of employees working in the corridor over the next 30 years has been computed. Using empirical data, it is assumed that around the same number of people as those working in the commercial spaces (visitors, dependents, indirect employees, business owners etc) will be present on a daily basis in the influence zone of the ORR Metro corridor. Public transport in India usage depends heavily upon the secondary category of the people working in the influence area. Professionals with higher salaries generally prefer to use their own cars/ means of transport and employees in the lower salary brackets find it convenient and economically viable to use the public transport systems like a metro. Using prevalent salary data of IT companies in India, salary pyramid of professionals working in this region has been constructed. Based upon estimates, following would be categories in income split. 2% of the employees have an annual salary of 50 Lacs Plus (Assumption: none of the people falling in this category would be regular users of the Metro) 3% of employees have an annual salary of 30 to 50 Lacs (Assumption: 5% of the people falling in this category would be regular users of the Metro) 15% of employees have an annual salary of 18 to 30 lacs (Assumption: 15% of the people falling in this category would be regular users of the Metro) 20% of employees have an annual salary of 10 to 18 lacs (Assumption: 20% of the people falling in this category would be regular users of the Metro) 60% of employees have an annual salary of 6 to 10 lacs (Assumption: 25% of the people falling in this category would be regular users of the Metro) It has been assumed that around 15% of the total visitors and 30% of the people indirectly employed in this region would be regular users of the metro corridor. Using the above estimate, the daily total number of users for the metro has been computed. It is estimated that in 2020 about 3 Lakh people would be using the metro thereby culminating a 6 lakh trips on the corridor per day. Refer the Table 3.16 for the estimate. Thus there would be 3.0 Lakh passengers who would depend upon Metro. Thus the average number of passenger trips (Ridership) will be in the range of 6.0 Lakhs. Bangalore Metro Phase-IIA DPR K.R.Puram Silk Board October 2016 Page 3-23
62 CHAPTER 3 TRAFFIC DEMAND ANALYSIS - ESTIMATION OF RIDERSHIP Table 3.16 Estimation Of Ridership Through Assessment Of Built Up Areas KR Puram to Silk Board Junction Parameter Total Stock Occupied stock New Addition Total Number of employees Visitors + dependants Indirect employment Tier I 2% 2% 2% 2% 2% 2% 2% Tier II 3% 3% 3% 3% 3% 3% 3% Tier III 15% 15% 15% 15% 15% 15% 15% Tier IV 20% 20% 20% 20% 20% 20% 20% Tier V 60% 60% 60% 60% 60% 60% 60% Estimated metro ridership (Direct) Tier I 0% 0% 5% 5% 5% 5% 5% Tier II 5% 5% 10% 10% 10% 10% 10% Tier III 15% 15% 20% 20% 20% 20% 20% Tier IV 20% 30% 50% 50% 50% 50% 50% Tier V 25% 30% 60% 70% 70% 70% 70% Visitors + dependants 15% 20% 30% 35% 40% 40% 40% Indirect employment 30% 30% 35% 40% 40% 40% 40% TOTAL DIRECT METRO RIDERSHIP (Users) 83, , , , , , ,404 DEMAND FROM VISITORS (Users) 23,484 45,947 81, , , , ,272 DEMAND FROM INDIRECT (Users) 70, , , , , , ,908 TOTAL DEMAND (Users) 177, , , , , , ,584 Bangalore Metro Phase-IIA DPR K.R.Puram Silk Board October 2016 Page 3-24
63 CHAPTER 3 TRAFFIC DEMAND ANALYSIS - ESTIMATION OF RIDERSHIP Estimation of ridership by extrapolating the ridership on the east-west corridor which is currently operational. The East West Corridor of 18.1 Kms is fully operational from May-2016 and the average daily ridership achieved is 1.20 lakhs without an interchange with North South Line. With the commissioning of North - South line in the year 2017 and an interchange at Kempegowda Station,the average daily ridership on East West line alone will contribute to about 2.40 lakhs ridership per day. With an increase of 3% in ridership year on year, the ridership of East West line of 18.1 Kms will be 2.62 lakhs per day for the year The ORR line having a length of 17 km and having two interchanges with the Phase-II lines at KR Puram and the Central Silk Board Junction, the ridership of East- West line ridership of 2.62 lakhs per day for the year 2020 can be used as a base for the line. Extrapolating this figures, the ridership for this line in the year 2020 will definitively exceed 3.0 Lakhs. On the East West Corridor of Phase -1 of length of 18.1 Kms with 17 stations the average trip length presently being achieved is 7.8 Kms.The new line between K R Puram and Central Silk Board Junction (CSBJ) having a length of 18 Kms with 13 Stations, the Average Trip Length (ATL) which can be achieved is 9.00 Kms. 3.3 CONCLUSION: The figures arrived by adopting different methodologies differ from one another. The travel demand modeling forecast a ridership of per day in 2021 as per Travel demand model. The estimation of ridership through assessment of built up areas comes to per day in 2020 and the estimation of ridership by extrapolating the ridership on the East-West Corridor, the ridership for this line comes to per day. Based on the above projections, the ridership per day for the year 2020 can be taken as per day. The breakup of this ridership on hourly basis is given in Table 3.17 Table 3.17 Ridership on Hourly Basis in the year Hrs Hrs Hrs Hrs Hrs Hrs Hrs Hrs Hrs Hrs Hrs Hrs Hrs Hrs Hrs Hrs Hrs Hrs 5240 Bangalore Metro Phase-IIA DPR K.R.Puram Silk Board October 2016 Page 3-25
64 CHAPTER 4 CIVIL ENGINEERING WORKS 4 CIVIL ENGINEERING WORKS 4.1 LINK LINE FROM SILK BOARD KR PURAM Description of Alignment Silk Board and KR Puram stations are planned station in phase 2 of BMRCL. It is now planned to connect them and convert above stations as interchange stations. The proposed line from Silk board to KR Puram will run along Outer Ring Road and will be an elevated standard gauge corridor with double line section having a route length of 17.0 km (up to KR Puram) 11 stations are planned in the route apart from KR Puram and silk board existing stations. Provision has been kept for extending the line towards Hebbal. KR Puram station at the east end of E W corridor of Ph - II is located on the Outer Ring Road as an elevated Station. This will be connected as an interchange station for the proposed route link. Silk board station is proposed station is in Reach-5 of RV road to Bommasandra section of phase 2. This proposed link will connect silk board station as an interchange station. Silk board to KR Puram line is planned along Outer Ring Road median and passes through a route in congested areas such as silk board and KR Puram. It will connect major IT industries and residential areas. This alignment will be served by existing Byappanahalli depot. Provision has been kept for extending the line in future towards Hebbal via ORR Reference point The centre line of Silk board Metro station has been taken as 0.00 km for reckoning of chainage on ORR KR Puram line. Chainage increases from Silk Board Metro station towards KR Puram Metro station Reference line Line from Silk board station to KR Puram station has been named Up Line and from KR Puram Terminal to Silk Board station has been named as Down Line Index Plan Index Plan of the alignment from the Centre line of Silk board Metro station to end of KR Puram Terminal Metro station is given in Figure Alignment Planning and Design Norms The entire alignment of this extension line is planned to be elevated. As the work on the elevated stretches of Phase-I of the project have already been completed and phase 2 works are in progress, the planning norms & design parameters viz., horizontal curves, vertical alignment, design speed, Bangalore Metro Phase-IIA DPR : K.R.Puram Silk Board October 2016 Page 4-1

65 CHAPTER 4 CIVIL ENGINEERING WORKS track centre etc as finalized for phase-i and Phase-II, the same will be used for Silk board KR Puram metro line. Section of Viaduct shown in Figure 4.2: Terminal Station 1. KR Puram: It is proposed to plan elevated terminal station at KR Puram near the KR Puram hanging bridge as the interchange station on this corridor so as to facilitate the transit towards Silk board, Hebbal and towards Whitfield. At this station, the train interchange facilities are being proposed. The C/L of the KR Puram terminal station is at chainage 17.0 km whereas the Byappanahalli depot is at chainage km. 2. Silk board: Silk board is planned as elevated station on Reach-5 metro line from RV road to Bommasandra and Silk board station is now proposed to be connected to interchange station which will allow commuters travelling from Electronic City and towards RV Road and KR Puram. Figure 4.1 Silk board to KR Puram Metro Line Horizontal Alignment The line extending from the silk board station will generally follow median of the Outer Ring Road to KR Puram. Eleven stations are planned on Silk board KR Puram line namely Silk board Jn. [Ch.(-) ], HSR Layout [Ch.(-) ], Agara Lake [Ch.(-) ], Ibbalur [Ch.(-) ], Bangalore Metro Phase-IIA DPR : K.R.Puram Silk Board October 2016 Page 4-2
66 CHAPTER 4 CIVIL ENGINEERING WORKS Bellandur [Ch.(-) ], Kadubeesanahalli [(-) ], Kodibisanahalli [(-) ], Marathahalli [(-) ], ISRO [(-) ], Doddanekundi [(-) ], DRDO Sports Complex [(-) ], Mahadevpura [(-) ], KR Puram [(-) ]. Schematic Plan of the alignment is enclosed Vertical Alignment Track supporting structures on elevated sections are to permit a vertical clearance of 5.50m above road level for vehicular traffic. For meeting this requirement the rail level is planned to be least 8.50 m above the road level. Similarly, the rail level for the stations is kept as 9.8 m as it is single level station an d concourse level is eliminated. There is footbridge under the viaduct for cross platform interchange. The minimum radius of Vertical curve is kept as 2000 Radius as per approved SOD, and track centers are kept at 4.20 m Curves 33 numbers of horizontal curves have been proposed from silk board to KR Puram. The radius of curves varies from 200 m to 3000 m. The sharpest curve is 200 m. A statement of curves is given at Table 4.1. No. Length Radius Table 4.1 Statement of Curves Start Station End Station Delta angle m m m (d) Degree of Curvature by Arc m m m m (d) (d) m m m (d) m m m (d) 2.122m m m m (d) (d) m m m (d) m m m (d) m m m m (d) (d) m m m (d) m m m (d) m m m m (d) (d) m m m (d) m m m (d) m m m m (d) (d) m m m (d) m m m (d) m m m m (d) (d) m m m (d) m m m (d) m m m m (d) (d) Bangalore Metro Phase-IIA DPR : K.R.Puram Silk Board October 2016 Page 4-3
67 CHAPTER 4 CIVIL ENGINEERING WORKS No. Length Radius Table 4.1 Statement of Curves Start Station End Station Delta angle m m m (d) m m m (d) Degree of Curvature by Arc m m m m (d) (d) m m m (d) m m m (d) 8.029m m m m (d) (d) m m m (d) m m m (d) m m m m (d) (d) m m m (d) m m m (d) 0.525m m m m (d) (d) m m m (d) m m m (d) 5.697m m m m (d) (d) m m m (d) m m m (d) 2.990m m m m (d) (d) m m m (d) m m m (d) 5.922m m m m (d) (d) m m m (d) m m m (d) m m m m (d) (d) m m m (d) m m m (d) m m m m (d) (d) m m m (d) m m m (d) m m m m (d) (d) m m m (d) m m m (d) m m m m (d) (d) m m m (d) m m m (d) m m m m (d) (d) m m m (d) m m m (d) m m m m (d) (d) m m m (d) Bangalore Metro Phase-IIA DPR : K.R.Puram Silk Board October 2016 Page 4-4
68 CHAPTER 4 CIVIL ENGINEERING WORKS No. Length Radius Table 4.1 Statement of Curves Start Station End Station Delta angle m m m (d) Degree of Curvature by Arc m m m m (d) (d) m m m (d) m m m (d) m m m m (d) (d) m m m (d) m m m (d) m m m m (d) (d) m m m (d) m m m (d) m m m m (d) (d) m m m (d) m m m (d) m m m m (d) (d) m m m (d) m m m (d) m m m m (d) (d) m m m (d) m m m (d) m m m m (d) (d) m m m (d) m m m (d) m m m m (d) (d) m m m (d) m m m (d) m m m m (d) (d) m m m (d) m m m (d) m m m m (d) (d) m m m (d) m m m (d) m m m m (d) (d) m m m (d) m m m (d) m m m m (d) (d) m m m (d) m m m (d) m m m m (d) (d) m m m (d) Bangalore Metro Phase-IIA DPR : K.R.Puram Silk Board October 2016 Page 4-5
69 CHAPTER 4 CIVIL ENGINEERING WORKS Details of Horizontal Curves: Total length of the stretch : 17.0 km Number of Horizontal Curves : 28 nos. Total length of curves : 2.5 Km % length of Curves : 14.7% Minimum Radius of horizontal curve : 200m Gradients The detail statement of gradients is placed in Table 4.2. There are no sharp gradient envisaged in the alignment as the road is fairly flat and we are following the road alignment. The straight gradient has been kept as 2.85% No. PVI Station PVI Elevation Table 4.2 Statement of Gradients Grade In Grade Out A (Grade Change) Profile Curve Type Profile Curve Length Curve Radius m m 0.00% m m 0.00% -0.66% 0.66% Crest m m m m -0.66% 0.05% 0.71% Sag m m m m 0.05% 0.00% 0.05% Crest 1.048m m m m 0.00% -0.53% 0.53% Crest m m m m -0.53% 0.36% 0.89% Sag m m m m 0.36% -0.79% 1.15% Crest m m m m -0.79% 0.00% 0.79% Sag m m m m 0.00% 0.36% 0.36% Sag 7.114m m m m 0.36% -0.91% 1.26% Crest m m m m -0.91% 0.80% 1.71% Sag m m m m 0.80% 0.00% 0.81% Crest m m m m 0.00% -0.16% 0.16% Crest 3.142m m m m -0.16% 0.24% 0.40% Sag 7.906m m m m 0.24% -2.04% 2.28% Crest m m m m -2.04% 0.00% 2.04% Sag m m m m 0.00% 0.33% 0.33% Sag 6.531m m m m 0.33% 0.85% 0.52% Sag m m m m 0.85% -0.03% 0.88% Crest m m m m -0.03% -1.67% 1.64% Crest m m m m -1.67% 0.34% 2.01% Sag m m m m 0.34% 0.00% 0.34% Crest 6.757m m m m 0.00% 0.02% 0.02% Sag 0.354m m m m 0.02% 1.61% 1.59% Sag m m m m 1.61% 0.03% 1.59% Crest m m Bangalore Metro Phase-IIA DPR : K.R.Puram Silk Board October 2016 Page 4-6
70 CHAPTER 4 CIVIL ENGINEERING WORKS No. PVI Station PVI Elevation Table 4.2 Statement of Gradients Grade In Grade Out A (Grade Change) Profile Curve Type Profile Curve Length Curve Radius m m 0.03% 2.46% 2.44% Sag m m m m 2.46% 0.15% 2.31% Crest m m m m 0.15% 0.75% 0.60% Sag m m m m 0.75% 0.00% 0.75% Crest m m m m 0.00% -2.20% 2.20% Crest m m m m -2.20% 0.00% 2.20% Sag m m m m 0.00% -0.99% 0.99% Crest m m m m -0.99% 1.22% 2.21% Sag m m m m 1.22% 0.00% 1.22% Crest m m m m 0.00% -0.74% 0.74% Crest m m m m -0.74% 0.91% 1.65% Sag m m m m 0.91% 0.06% 0.85% Crest m m m m 0.06% 2.85% 2.79% Sag m m m m 2.85% 1.13% 1.72% Crest m m m m 1.13% Details of Vertical Curves Minimum Radius : 200 m Maximum Gradient : 2.85% Station Planning Silk Board to KR Puram alignment covers km and consists of the following stations: 1 KR Puram Existing Metro station phase II 2 Mahadevpura 3 DRDO Sports Complex 4 Doddanekundi 5 ISRO 6 Marathahalli 7 Kodibisanahalli 8 Kadubeesanahalli 9 Bellandur 10 Ibbalur. 11 Agara Lake 12 HSR Layout 13 Silk board (Phase II Existing) Table 4.3 List of Station Name (DPR Locations) Bangalore Metro Phase-IIA DPR : K.R.Puram Silk Board October 2016 Page 4-7
71 CHAPTER 4 CIVIL ENGINEERING WORKS Station Design As per the configuration of alignment, all the stations would be elevated as follows: 1. On the middle of the road HSR Layout, Agara Lake, Bellandur, Kaadubeesanahalli, Kodibisanhalli, Marathahalli, ISRO, Doddanekundi, DRDO Sports Complex, Mahadevpura station. 2. Partially on the service road Silk board, Ibbalur and KR Puram Terminal station Station Locations I. Silk Board Silk board Station is the 1st station on Silk board KR Puram line. The elevated station has been proposed before the silk board junction. The chainage of the station is (-) The main access to the station is proposed by the side of the road. Ancillary Structures required for operational activities have been housed in on LHS. II. HSR Layout HSR Layout Station is the 1st station on Silk board KR Puram line. The elevated station has been proposed on the middle of ORR leading towards KR Puram. The station is located on the centre of the ORR. The chainage of the station is (-) The main access to the station is proposed across the road. Ancillary Structures required for operational activities have been housed in vacant area on LHS. III. Agara Lake This is an elevated station, on the middle of the ORR leading towards KR Puram. The station is located on the middle of ORR. The chainage of the station is (-) The main access to the station is proposed across the road. Ancillary Structures required for operational activities have been housed in vacant area on LHS. IV. Ibbalur This is the 3rd station on Silk board KR Puram line. The elevated station has been proposed on the middle of left side service road of the ORR leading towards KR Puram. The chainage of the station is (-) The accesses to the station are proposed across the road. Ancillary Structures required for operational activities have been housed in part of the area on LHS. V. Bellandur This is the 4th station on Silk board KR Puram line. The elevated station has been proposed on the middle of ORR leading towards KR Puram. The chainage of the station is (-) The access to the station is proposed across the road. Ancillary Structures required for operational activities have been housed in open area on LHS. Bangalore Metro Phase-IIA DPR : K.R.Puram Silk Board October 2016 Page 4-8
72 CHAPTER 4 CIVIL ENGINEERING WORKS VI. Kadubeesanahalli This is the 5th on Silk board KR Puram line. The elevated station has been proposed on the middle of ORR leading towards KR Puram. The chainage of the station is (-) The access to the station is proposed across the road. Ancillary Structures required for operational activities have been housed in open area on LHS. VII. Kodibisanahalli This is the 7th on Silk board KR Puram line. The elevated station has been proposed on the middle of ORR leading towards KR Puram. The chainage of the station is (-) The access to the station is proposed across the road. Ancillary Structures required for operational activities have been housed in open area on LHS. VIII. Marathahalli This is the 8th on Silk board KR Puram line. The elevated station has been proposed on the middle of ORR leading towards KR Puram. The chainage of the station is (-) The access to the station is proposed across the road. Ancillary Structures required for operational activities have been housed in open area on LHS. This Station is planned in the middle of ORR and direct entry and exit from above the under pass is considered. IX. ISRO This is the 9th on Silk board KR Puram line. The elevated station has been proposed on the middle of ORR leading towards Mysore. The chainage of the station is (-) The access to the station is proposed across the road. Ancillary Structures required for operational activities have been housed in open area on LHS. X. Doddanekundi This is the 10th on Silk board KR Puram line. The elevated station has been proposed on the middle of ORR leading towards KR Puram. The chainage of the station is (-) The access to the station is proposed across the road. Ancillary Structures required for operational activities have been housed in open area on LHS and due to hospital on the RHS. XI. DRDO Sports Complex This is the 11th on Silk board KR Puram line. The elevated station has been proposed on the middle of ORR leading towards KR Puram. The chainage of the station is (-) The access to the station is proposed across the road. Ancillary Structures required for operational activities have been housed in open area on LHS and due to IT industries on the RHS. XII. Mahadevpura This is the 12th on Silk board KR Puram line. The elevated station has been proposed on the middle of ORR leading towards KR Puram. The chainage of the station is (-) The access Bangalore Metro Phase-IIA DPR : K.R.Puram Silk Board October 2016 Page 4-9
73 CHAPTER 4 CIVIL ENGINEERING WORKS to the station is proposed across the road. Ancillary Structures required for operational activities have been housed in open area on LHS and due to Gas pipe lines on the RHS. XIII. KR Puram This is the last on Silk board KR Puram line. The elevated station has been proposed on the middle of ORR leading towards KR Puram. The chainage of the station is (-) The access to the station is proposed across the road. Ancillary Structures required for operational activities have been housed in open area on RHS. This line will further continue to Byappanahalli Depot Station Facilities The elevated alignment generally passes on median of the road and the station is also proposed above the road with entries planned on service road. The proposed stations will have two side platforms and the access to the platforms is through staircases and escalators, housed in the paid area of concourse. The commuters can access the platform at 10.8 m height. A connecting bridge is planned below the viaduct connecting the two platforms on either side to permit commuters to interchange platform. The ground level has been proposed for parking/ ancillary structures and space for movement of commuters. Ticket / token counters and information have been proposed in the unpaid area of concourse. Automatic Fare Collection machines have been proposed between paid & unpaid concourse. The commuter after purchasing ticket / token enters into the paid concourse. A conflict free circulation system is proposed for commuters and operational staff. Elevators have been proposed for elderly and physically challenged persons from ground to concourse and concourse to the platforms. There will be a special dedicated path with tactile flooring for visually impaired persons. Plaza has been proposed in front of the station for pedestrian movement, facilities for parking for private vehicles and public transport. Public Conveniences in the form of paid toilets have also been proposed at the station, and also paid toilets outside the station building Architectural Finishes Light weight and sleek steel structures have been envisaged for roof of stations with translucent fabric sheeting for ambient day lighting within the stations. Granite floor, stainless steel and balustrade etc have been proposed for aesthetic reasons and for ease of maintenance. The structural system proposed is modern, sleek and aesthetically appealing and cost effective. Bangalore Metro Phase-IIA DPR : K.R.Puram Silk Board October 2016 Page 4-10
74 CHAPTER 4 CIVIL ENGINEERING WORKS Passenger Facilities The proposed station will have the following facilities for the information of the passenger: Passenger Information Display System Public Address System Clocks Signage Utilities and Services The proposed alignment of Silk board to KR Puram is traversing along the Outer Ring Road. Number of sub-surface, surface and over head utility services viz. sewers, water supply lines, storm water drains, telephone cables, overhead electrical transmission lines, electric poles, traffic signals etc. are existing along the proposed alignment. These utility services are essential and have to be maintained in working order during different stages of construction by temporary / permanent diversions or by supporting in position. As such, these may affect construction and project implementation time schedule / costs, for which necessary planning / action needs to be initiated in advance Typical Station The station is proposed above of the road. The commuters can access the platform at 10.8 m height. A connecting bridge is planned below the viaduct connecting the two platforms on either side. The typical station plan and sections is given in Fig. 4.3 to Fig. 4.6 are enclosed Drawings The detailed drawings including the General arrangement drawings for entire section and station plans and elevation is provided in Volume 2 in this report. Bangalore Metro Phase-IIA DPR : K.R.Puram Silk Board October 2016 Page 4-11
75 CHAPTER 4 CIVIL ENGINEERING WORKS Table 4.4 List of Drawings Sl.No. Sl.No. DRAWING No. Drawings 1 INDICATIVE INDEX MAP SHOWING THE ALIGNMENT FROM SILKBOARD TO KR PURAM WITH STATION NAMES GENERAL ARRANGEMENT DRAWINGS 2 SHEET 1 TO SHEET HORIZONTAL AND VERTICAL ALIGNMENT FROM CH: m TO m (SILK BOARD TO KR PURAM) TYPICAL STATIONS (FROM AGARA TO MAHADEVPURA) BMRCL/SCH/TYP STAT/ARC/DRWG-001 BMRCL/SCH/TYP STAT/ARC/DRWG-002 BMRCL/SCH/TYP STAT/ARC/DRWG-003 BMRCL/SCH/TYP STAT/ARC/DRWG-004 BMRCL/SCH/TYP STAT/ARC/DRWG-005 BMRCL/SCH/TYP STAT/ARC/DRWG-006 BMRCL/SCH/TYP STAT/ARC/DRWG-007 BMRCL/SCH/TYP STAT/ARC/DRWG-008 INSERTION LEVEL PLAN GROUND LEVEL PLAN CONCOURSE LEVEL PLAN PLATFORM LEVEL PLAN ROOF LEVEL PLAN ELEVATION 1 & 2 CROSS SECTION C-C, D-D & E- E LONGITUDINAL SECTION A-A & B-B SILK BOARD INTERCHANGE STATION ( CH: m ) 11 1 BMRCL/SCH/SB/ARC/DRWG-001 INSERTION LEVEL PLAN 12 2 BMRCL/SCH/SB/ARC/DRWG-002 STREET LEVEL PLAN 13 3 BMRCL/SCH/SB/ARC/DRWG-003 INTERMIEDIATE LEVEL PLAN 14 4 BMRCL/SCH/SB/ARC/DRWG-004 CONCOURSE LEVEL PLAN 15 5 BMRCL/SCH/SB/ARC/DRWG-005 PLATFORM LEVEL PLAN 16 6 BMRCL/SCH/SB/ARC/DRWG-006 ROOF LEVEL PLAN 17 7 BMRCL/SCH/SB/ARC/DRWG-007 ELEVATION 1 & BMRCL/SCH/SB/ARC/DRWG-008 CROSS SECTION A-A & B-B 19 9 BMRCL/SCH/SB/ARC/DRWG-009 CROSS SECTION C-C & D-D BMRCL/SCH/SB/ARC/DRWG-010 LONGITUDINAL SECTION K. R. PURAM INTERCHANGE STATION ( CH: m ) 21 1 BMRCL/SCH/KRP/ARC/DRWG-001 GROUND LEVEL PLAN 22 2 BMRCL/SCH/KRP/ARC/DRWG-002 CONCOURSE LEVEL PLAN 23 3 BMRCL/SCH/KRP/ARC/DRWG-003 PLATFORM LEVEL PLAN 24 4 BMRCL/SCH/KRP/ARC/DRWG-004 CROSS SECTION B-B. Bangalore Metro Phase-IIA DPR : K.R.Puram Silk Board October 2016 Page 4-12
76
77
78
79
80
81 CHAPTER 5 PLANNING AND DESIGN PARAMETER 5 PLANNING AND DESIGN PARAMETERS 5.1 GEOMETRIC DESIGN NORMS The design norms related to the metro alignment described herewith have been worked out based on a detailed evaluation, experience and internationally accepted practices. Various alternatives were considered for most of these parameters but the best-suited ones have been adopted for the system as a whole. 5.2 HORIZONTAL CURVES On consideration of maximum allowable cant of 125 mm and cant deficiency of 100 mm on Metro tracks, the safe speed on curves of radii of 400 m or more is 80 km/h. On elevated section use of curves with minimum radius of 200 m, having speed of 55 km/h shall be adopted. There are, however, exceptional situations where due to site constraints; use of sharper curves is unavoidable. Under such situations sharp curves up to 120 m radius (safe speed of 40 km/h) have been adopted. In curves sharper than 190m radius check rails are to be provided. For maximum permissible speed on curve with various radii table 5.1 may be referred. Curve radius in mid section: Elevated Section Preferred Radius without check rail : >190m Minimum : 200 m Minimum curve radius at stations : 1000 m Maximum permissible cant (Ca) : 125 mm (To be avoided as far as possible) Maximum Desirable Cant (Ca) : 110 mm Maximum cant deficiency (Cd) : 100 mm If depot is coming in this reach, provision for minimum radius and curve is 100m as per SOD and the track spacing shall be suitable increased as per provisions of SOD. 5.3 TRANSITION CURVES Due to undulating terrain of Bengaluru city it is necessary to provide frequent vertical curves along the alignment. The existing roads also have frequent curves. These constraints may lead to reduced lengths of transition curves. However for safety and comfort of passengers, the transition curves have to be designed with certain minimum parameters. Minimum length of Transitions of Horizontal curves (m) : 0.5 cant gradient of 1 in 500 No overlap is allowed between transition curves and vertical curves. Minimum straight between two Transition curves : Either 25 m or NIL. Minimum curve length between Two transition curves : 25 m Bangalore Metro Phase II A DPR KR Puram to Silk board October 2016 Page 5-1
82 CHAPTER 5 PLANNING AND DESIGN PARAMETER 5.4 VERTICAL ALIGNMENT Elevated Sections Track supporting structures on Elevated sections are to permit a vertical clearance of 5.5 m above road level. Similarly, the rail level for the stations on road locations (with concourse on sides on ground) shall be at least 10.5 m above the road level in the central portion and 9.5 m at ends. With elevated concourse the rail level at stations shall be 12.8 m. For the tracks carried on portals on roads, the minimum rail level shall be 9.5 m above the road level. The track center to centre distance of 4.2 m will be provided on the elevated section keeping in view the minimum radius of 190 m Gradients Normally the stations shall be on level stretch. In exceptional cases station may be on a grade of 0.1 %. Between stations, generally the grades may not be steeper than 2.0 %. However, there are a few situations, where steeper grades are unavoidable. These are: Switch over ramp between underground and elevated sections where a grade up to 4% is adopted to minimize the length of ramp. This included the grade compensation for curves. Desirable gradient at stations level Maximum gradient at stations : 1 in 400 % Maximum gradient in mid section Normal : 2.0 % Exceptional : 4.0 % (compensated for curves) Permissible Gradients in Turnouts On Ballasted Tracks : 0.25 % Ballasted Tracks : 2.5 % There shall be no change of grade on and within 15.0 m of any turnout on ballast less track. Similarly, there shall be no change of grade on and within 30.0 m of any turnout on ballasted track. In case of turnout on gradient, there shall be no horizontal curve on and with 15.0 m of any turnout on ballast less track and 30.0 m of any turnout on ballasted track Vertical Curves Vertical curves are to be provided when change in gradient exceeds 0.4%. However it is recommended to provide vertical curves at every change of gradient. Minimum radius of vertical curves: On main line And other Locations Minimum length of vertical curve : 1500 m : 25 m Bangalore Metro Phase II A DPR KR Puram to Silk board October 2016 Page 5-2
83 CHAPTER 5 PLANNING AND DESIGN PARAMETER 5.5 DESIGN SPEED The maximum sectional speed will be 80 km/h. However, the applied cant, and length of transition will be decided in relation to normal speeds at various locations, as determined by simulation studies of alignment, vertical profile and station locations. This is with the objective of keeping down the wear on rails on curves to the minimum Spacing of Tracks The spacing of tracks shall be 4200mm. In depot, the spacing to be changed beyond 4.20 m as per provisions of SOD BMRCL 2015, for curves of gradient less than m to m 5.6 PERMANENT WAY Track Structure Track on Metro Systems is subjected to intensive usage with very little time for day-to-day maintenance. Thus, it is imperative that the track structure selected for Metro Systems should be long lasting and should require minimum or no maintenance and at the same time, ensure highest level of safety, reliability and comfort, with minimum noise and vibrations. The track structure has been proposed keeping the above philosophy in view. Two types of track structures are proposed for any Metro. The normal ballasted track is suitable for At-Grade (surface) portion of Main Lines and in Depot (except inside the Workshops, inspection lines and washing plant lines. The ballast-less track is recommended on Viaducts and inside tunnels as the regular cleaning and replacement of ballast at such location will not be possible. Only in case of the depot normal ballasted track is proposed for adoption. From considerations of maintainability, riding comfort and also to contain vibrations and noise levels, the complete track is proposed to be joint-less and for this purpose even the turnouts will have to be taken through the turnouts. The track will be laid with 1 in 20 canted rails including turnouts and the wheel profile of Rolling Stock should be compatible with the rail cant and rail profile Rail Section Keeping in view the proposed axle load and the practices followed abroad, it is proposed to adopt UIC-60 (60 kg. /m) rail section. Since on main lines, sharp curves and steep gradients would be present, the grade of rail on main lines should be 1080 Head Hardened. For the Depot lines, the grade of rails be 880 grade, which are manufactured indigenously Ballast less Track on Viaducts On the viaducts, it is proposed to adopt plinth type ballast less track structure with RCC derailment guards integrated with the plinths. Further, it is proposed to adopt fastenings System or any other suitable system on both types of ballast less track structures, with a base-plate to base-plate spacing of 70 cm on viaducts and with fastenings systems for ballast less track which satisfy performance Bangalore Metro Phase II A DPR KR Puram to Silk board October 2016 Page 5-3
84 CHAPTER 5 PLANNING AND DESIGN PARAMETER criteria of fastening system for ballast less track on Metro Rails issued by Government of India, Ministry of Railways December Ballast less Track in Depot The ballast less track in Depot may be of the following types: Discretely supported on concrete/steel pedestal for inspection lines. Embedded rail type inside the Workshop. Plinth type for Washing Plant line. Normal Ballast less (as on viaduct) for Washing lines, Stabling and other running lines Turnouts From considerations of maintainability and riding comfort, it is proposed to lay the turnouts also with 1 in 20 cant. Further, it is proposed to adopt the following two types of turnouts: On main lines, 1 in 9 type turnout with a lead radius of 300 metres which has speed potential of 45 km/h as divergent track. i. On Depot lines, 1 in 7 type turnout with a lead radius of 400 meters which has a speed potential of 35 km/h as divergent track. The Scissors cross-overs on Main Lines (1 in 9 type) will be with a minimum track centre of 5.5 m. The proposed specifications for turnouts are given below: - i. The turnouts should have fan-shaped layout so as to have same sleepers/baseplates, and slide chairs for both LH and RH turnouts. ii. The switches and crossings should be interchangeable between ballasted and ballast less turnouts (if required). The switch rail should be with thick web sections, having forged end near heel of switch for easy connection with lead rails & behind the heel of switch. The switches should have anti creep device at heel of switch for minimising the additional LWR forces transmitted from tongue rail to stock rail. The crossings should be made of cast manganese steel and with welded leg extensions. These crossings should be explosive hardened type for main lines and without surface hardening for Depot lines. The check rails should be with UIC-33 rail section without being directly connected to the running rails Buffer Stops On main lines and Depot lines, friction buffer stops with mechanical impact absorption (non-hydraulic type) need to be provided. On elevated section the spans on which friction buffer stops are to be installed are to be designed for an additional longitudinal force of 85 T, which is likely to be transmitted in case of Rolling Stock impacting the friction Buffer Stops. Bangalore Metro Phase II A DPR KR Puram to Silk board October 2016 Page 5-4
85 CHAPTER 5 PLANNING AND DESIGN PARAMETER Welding Flash Butt Welding Technique is to be used for welding of rails. Alumino-Thermic Welding is to be done only for those joints which cannot be welded by Flash Butt Welding Technique, such as joints at distressing locations and approach welds of switches & crossings. For minimizing the population of Thermit welds, mobile (rail-cum-road or portable) Flash Butt Welding Plant will have to be deployed. 5.7 OPERATING ENVIRONMENT: Track Structure should fulfill generally the following conditions: Standard gauge 1435mm. Rail Seat inclination (slope): 1 in 20 Speed potential 80 Kmph (max.) Static axle load 15 T (max.) Design rail temperature range (-) 10 degree Celsius to (+) 70 degree Celsius Maximum curvature and ruling gradient As specified in SOD 5.8 TRACK STRUCTURE: General: The track structure should fulfill the following requirements: The track structure should confirm to / satisfy Schedule of Dimension requirement and other maintenance instructions of Metro systems. Ride comfort and running safety of track vehicle dynamics should be satisfied. The track structure should be designed with long welded / continuously welded rail on main line track in case of ballasted as well as ballastless track. The horizontal alignment shall consist of a series of straights joined to circular curves generally with transition curves. Curvature and cant shall be calculated based on the train speed for each train type on the section. Compound and reverse curves are acceptable, provided they are connected by an adequate transition curve. The vertical alignment should be designed to achieve a smooth profile line with gradual changes. Changes in the profile should be connected by vertical curves, which shall be as generous in length as the location allows. Vertical curves including its transition shall not be located at stations within the length of platform. A vertical curve within the length of transition and turnouts is also not desirable. Vertical curve radius is constrained by the need to limit the vertical acceleration for passenger ride comfort. 5.9 THE TECHNICAL STANDARDS FOR TRACK STRUCTURE DEALS WITH THE FOLLOWING COMPONENTS I. Rail and Welding II. Sleeper and Fastening for ballasted track III. Track slab for ballastless track IV. Fastening system for ballastless track V. Insulated glued joint Bangalore Metro Phase II A DPR KR Puram to Silk board October 2016 Page 5-5
86 CHAPTER 5 PLANNING AND DESIGN PARAMETER VI. VII. VIII. Turnout, scissors crossover Switch Expansion Joints Gradients 5.10 RAILS AND RAIL WELDING Rails For Main Line Track: The rail used on main line on curves and approaches of stations shall be 60E1 (UIC 60), 1080 grade Head Hardened. At other locations on straight line of main line, the use of 60E1 (UIC 60), 1080 grade HH/60E1 (UIC 60), 880 grade rail shall be decided by Metro Railway depending upon speed, axle load and other factors pertaining to safety and life of rail. However on curves with small straight track in between, the 60E1 (UIC 60), 1080 grade Head hardened rail should be continued on straight patches also. It is essential to have preventive rail grinding arrangements in case 60E1 (UIC 60), 1080 HH rails are used. For Depot lines: The rail used on depot lines can be non-head hardened and shall be 60E1 (UIC 60), 880 grade. Specification: The rail shall be class A rails as per IRS-T specification with latest amendments. However, any suitable length of rail more than 13m considered appropriate by Metro on consideration of transportation and handling can be adopted, provided the rails are ultimately welded into long welded rails. The rail shall be manufactured and tested in accordance with IRS-T (with latest amendment). The chosen manufacturers shall be required to submit their inspection and test plan for approval by Metro Railway as per IRS-T Metro Railways will ensure that the inspection and test plan approved by them strictly conforms to the requirement of IRS specifications. Welding of Rail: The welding of rails should conform to Indian Railway Specifications and technical instructions issued from time to time. The present instructions are contained in following documents: Alumino Thermit Welding: i. Indian Railway Standard specifications for Alumino Thermit Welding of Rails (IRS/T-19 with latest amendments) ii. Manual for Fusion Welding of Rails by the Alumino-Thermic Process: Revised with latest amendments. Flash Butt Welding: Manual for Flash Butt Welding of Rails, January 2012 with latest amendments. Special attention is required by Metros for provisions of these instructions regarding procurement, execution of works and areas requiring prior approval / standardization by RDSO. Ultrasonic Testing of Rail and Welds: Bangalore Metro Phase II A DPR KR Puram to Silk board October 2016 Page 5-6
87 CHAPTER 5 PLANNING AND DESIGN PARAMETER The rails and welds shall be ultrasonically tested in field as per requirement of concerned specification / manual / instructions. The testing shall be ensured as per provisions of Manual for Ultrasonic Testing of Rail and Welds Revised 2012 with latest amendments. The provisions of IRS specification for Ultrasonic testing of Rails / Welds (Provisional), Revised 2012 shall also be followed SLEEPER AND FASTENING FOR BALLASTED TRACK Sleepers: Standard Gauge PSC sleeper for standard gauge will be designed by Metro Railways following in principal guidelines of Indian Railway and the same shall be approved by Metro. Fastening System: The elastic fastening system prevalent on Indian Railways shall be used duly ensuring the inspection protocol for fastening components laid down for IR. In case of use of elastic fastening other than in use on IR, prior approval shall be obtained from Railways TRACK SLAB FOR BALLASTLESS TRACK Track shall be laid on cast in situ / precast reinforced plinth or slab, herein referred to as the track slab. The track slab shall be designed as plinth beam or slab type ballast less track structure with derailment guards. It shall accommodate the base plates of the fastening system. In general, track slab (including sleeper, if any) on which the fastening and rail are to be fitted shall perform the following functions: I. Resist the track forces. (Static and dynamic). II. Have adequate edge distance of concrete beyond the anchor bolts to provide resistance against edge failure. III. Provide a level base for uniform transmission of track / rail forces. IV. Have geometrical accuracy and enable installation of track to the tolerances laid down. V. Ensure drainage. VI. Resist Weathering VII. Be construction friendly, maintainable and quickly repairable in the event of a derailment. The Repair and Maintenance Methods shall be detailed in a Manual to be prepared and made available. VIII. Ensure provision for electrical continuity between consecutive plinths / slabs by an appropriate design. IX. Plinth beam or slab of ballastless track should be suitable for embankment or viaduct or tunnel / Underground structure. X. Proper design of expansion joints suitable for joints of viaduct structure. XI. Design should be suitable for curves as per SOD of Metro system. Bangalore Metro Phase II A DPR KR Puram to Silk board October 2016 Page 5-7
88 CHAPTER 5 PLANNING AND DESIGN PARAMETER XII. XIII. Design of subgrade / embankment for slab should be furnished to ensure durability and functional stability in service. Design should be suitable and incorporate provision of utilities e.g. cable, wires, ducts, water channels, etc. The detailed design calculations of track slab along with detailed structural drawings as approved by Metro authorities shall be furnished for record CHECK RAIL / RESTRAINING RAIL: Check rails / Restraining Rails should be provided on curves on main line where radius is 190m or less on Standard gauge. The clearance of check rail / restraining rails shall be suitably decided after requisite studies. The detailed design calculations / studies in this regard shall be furnished for record. Check Rails / Restraining Rails shall not be mandatory for curves in depots, yards and non-passenger lines where speed is not more than 25 kmph. However decision in this regards may be taken by Metro themselves based on layout and maintenance requirement DERAILMENT GUARDS The derailment guard should be provided inside / outside of running rail on viaduct as well as in tunnel having multiple tracks and at grade section locations specified by the Metro Railway. For single track tunnel, location for providing derailment guard is given in note. In tunnels, the derailment guard should be preferably be provided inside the track, so that it permits less way of coach towards tunnel wall in case of derailment. NOTE: Location for providing Derailment Guard in single track tunnel I. Entry of tunnel: 200 m from tunnel portal outside the tunnel to 50m inside the tunnel. II. Exit of tunnel: 50 m from inside of tunnel portal to 200 m outside the tunnel. III. In curved track having radius 500 m or less including transition portion but excluding locations where check rail is provided. IV. Covering locations of all important installations e.g. Location of any sub-station or hazardous structures inside the tunnel, etc damage to which in the assessment of Metro rail administration can result into serious loss of life or / and infrastructure as a result of derailment in tunnel. The above is subject to the condition that Metro Railway shall carry out the risk assessment analysis for derailment in tunnels and ensure that the maintenance practices in the maintenance manual are as per the risk assessment mitigation plan. The lateral clearance between the running rail and the derailment guard shall be 210±30 mm. It shall not be lower than 25 mm below the top of the running rail and should be clear of the rail fastenings to permit installation, replacement and maintenance. Derailment guard shall be designed such that in case of derailment: Bangalore Metro Phase II A DPR KR Puram to Silk board October 2016 Page 5-8
89 CHAPTER 5 PLANNING AND DESIGN PARAMETER i. The wheels of a derailed vehicle under crush load, moving at maximum speed are retained on the viaduct or tunnel. ii. Damage to track and supporting structures is minimum The detailed design calculations of derailment guards along with detailed structural drawings shall be furnished for record GLUED INSULATED RAIL JOINT Normally glued joint should be avoided. Wherever inescapable, G3(L) type of glued insulated rail joint shall be used as per RDSO drawing no. T The glued joints shall be manufactured and tested in accordance with RDSO s Manual for Glued Insulated Rail Joints-1998 with all amendments TURNOUTS, SCISSORS CROSSOVER Standard of Turnout: On main lines, the turnouts and diamond crossing shall be of the following standards: i. Standard Gauge a. 1 in 9 type or flatter turnout (desirable) b. 1 in 7 type turnout (minimum) c. Scissors cross-over of 1 in 9 / 1 in 7 type consisting of 4 turnouts and 1 diamond crossing On depot and other non-running lines, the turnouts and diamond crossing shall be of the following standards: i. Standard Gauge a. 1 in 7 type or flatter turnout b. Scissors crossover of 1 in 7 type consisting of 4 turnouts and 1 diamond crossing c. 1 in 7 derailing switches / 1 in 7 type symmetrical split turnout If any Metro railway decides to use sharper angle layout, they should establish the adequacy of the speed potential of the turnout for the purpose for which it is used and the negotiability of the turn out by the rolling stock with a safety margin. The requirement for turnouts as specified in the following clauses shall include switch devices, crossings and associated check and lead rails as appropriate. i. Turnouts (switches, lead, crossing and associated closure & check rails) shall be suitable for installation on PSC sleepers for ballasted track or concrete slab for ballastless track. ii. Turnouts shall be manufactured to allow for installation of continuously welded track. iii. Turnout shall be compatible with proposed rolling stock and its operational characteristics. iv. The assembly must ensure continuous electrical contact with the train and all the points shall be operated by electric motors. v. The CMS crossing to be used on mainline shall be subjected to explosive hardening. Bangalore Metro Phase II A DPR KR Puram to Silk board October 2016 Page 5-9
90 CHAPTER 5 PLANNING AND DESIGN PARAMETER vi. vii. viii. All turnouts shall be laid with cant with a rail slope as that of main line towards centre of track. All turnouts and their components shall be designed to minimize electrical leakage from running rails to the ground. Scissor crossover should be designed for Track centres not infringing SOD. Type and Geometry of Turnout Detailed design of all turnouts, scissors, and crossover should comply the following geometrical parameters. (A) Standard Gauge i. 1 in 9 turnout: The design shall be tangential with a switch angle not exceeding It is desirable that the radius of lead rail of turnout is not less than 300m. Lead curve of 190m radius may be laid as an exception. All clearances shall be in accordance with relevant provisions of SOD. ii. 1 in 7 turnout: The design shall be tangential with a switch angle not exceeding It is desirable that the radius of lead rail of turnout is not less than 190m. Lead curve of 140m radius may be laid as an exception. All clearances shall be in accordance with relevant provisions of SOD. iii. Scissors Crossover The basic geometry of the turnouts of scissors crossover shall be same as that of corresponding ordinary turnouts as mentioned in clause 10.2 (i) (ii) above. Operating requirement of turnout, scissor crossover: Track layout design shall permit trains to operate at maximum capability wherever possible. Turnouts and crossover shall be selected such that they do not form a restriction to the operating speed on main line. Switches and crossings shall not be located on transition curves or vertical curves. Speed: The turnout shall be designed for the speed on mainline side equal to the speed as on mainline track. The minimum speed potential of the various turnouts and scissors crossover on the turnout side should be as follows: Standard Gauge i. 1 in 9 type turnout with 300 m radius (speed potential of 45Kmph) ii. 1 in 7 / 1 in 9 type turnout with 190 m radius (speed potential of 35Kmph) iii. 1 in 7 type turnout with 140m radius (speed potential of 25 Kmph) iv. Scissors crossover 1 in 9 type with 300 m radius (speed potential of 45 Kmph) v. Scissors crossover 1 in 9/1 in 7 type with 190 m radius (speed potential of 35 Kmph) vi. Scissors crossover 1 in 7 type with 140 m radius (speed potential of 25 Kmph) vii. 1 in 7 type symmetrical spilt turnout (speed potential of 45 Kmph) Bangalore Metro Phase II A DPR KR Puram to Silk board October 2016 Page 5-10
91 CHAPTER 5 PLANNING AND DESIGN PARAMETER Technical Specification General a) All the points shall be capable of being operated by electric motors in accordance with the signaling specification. b) The top surfaces of PSC sleeper / RCC slab supporting rail seat of turnout and scissors crossover shall be flat without any cant / slope. c) The track form of the turnout shall have uniform resilience as that of the adjoining track form. d) The fixation of turnouts, scissor cross-over on track slab shall be through base plates / bearing plates. Rails 1. The rails used in turnouts shall be 1080 grade Head Hardened, However, rails used in turnouts on depot and other non-running lines may be of 880 grade. 2. The rails used for manufacturing of turnouts shall satisfy the following conditions: a) The rails shall be manufactured and tested in accordance with IRS/T with latest amendment. b) The section of rails shall be 60E1 (UIC60) for stock, lead and 60E!A1 (ZU1-60)/60E!A4 for switch rail. c) The rails shall qualify as Class A rails as per IRS/T d) The rails shall be with ends un-drilled. e) The rails shall be of grade 1080HH and be suitable for being welded by alumnio-thermic or flash butt welding technique. Switches 1. Each switch device shall consist of two stock rails, one left hand one right hand and two switch rails, one left hand one right hand. 2. The switch rail shall be one piece with no weld or joint within the switch rail length. 3. The end of the asymmetrical switch rail shall be forged to 60E1 (UIC60) rail profile with minimum length of 500mm. The forged switch rail end shall be suitable for welding or installation of insulated rail joint. 4. Slide chairs in the switch portion shall be coated with an appropriate special coating, so as to reduce the point operating force and to eliminate the requirement of lubrication of sliding surfaces during service. 5. Switches shall provide suitable flange way clearance between the stock rail and the switch rail with the switch rail in open position (minimum 60mm). The 1 in 12 and 1 in 9 (with radius of 300 mts) and flatter turnouts shall be provided with second drive or other suitable arrangement to ensure minimum gap of 60mm at JOH as well as proper housing of switch rail with stock rail up to JoH. 1 in 8.5, 1 in 9 turnout (with radius of 190m) and 1 in 7 and sharper turnouts may not be provided with second drive arrangement, however minimum gap of Bangalore Metro Phase II A DPR KR Puram to Silk board October 2016 Page 5-11
92 CHAPTER 5 PLANNING AND DESIGN PARAMETER 60mm at JOH as well as proper housing of switch rail with stock rail up to JoH should be ensured. The normal opening of switch at toe of switch shall be kept as 160mm. 6. The switch manufacturer shall include provision for all holes required to main drive machines, stretcher bars and detection equipment to suit the requirements of the signaling and switch operating system duly chamfered to avoid stress concentration at the edge of the holes. 7. The switches shall be designed with an anti-creep device at the heel of switch to withstand thermal forces of the CWR track. 8. The switches and all slide chairs shall be same for ballasted and ballastless turnouts. Crossings 1. All crossings shall be cast manganese steel (CMS) crossings with weldable rails of minimum 1.2m length undrilled for welding into the overall turnout. 2. The CMS crossings shall be manufactured from Austenitic Manganese Steel as per UIC All CMS crossings shall have welded leg extensions of 60E1 (UIC60) rails. This shall be achieved by flash butt welding of buffer transition rail piece of suitable thickness to CMS crossings and rail leg extension. 4. All CMS crossings on main line shall have a minimum initial hardness of 340 BHN. 5. All CMS crossings and their welded leg extensions for all scissor crossover shall be suitably dimensioned so as to eliminate the necessity of providing small cut rail pieces for the purpose of inter-connection. However, the need for providing insulated glued joints from signaling requirement point of view shall be taken care of in the design, if required. 6. The provision of rail cant shall be taken care of on the tope surface of the CMS crossing and the bottom surface of all CMS crossing shall be flat. Check Rails 1. The check rail section shall be 33C1 (UIC33) or similar without any direct connection with running rails. 2. Check rails shall have the facility for the adjustment of check rail clearances upto 10mm over and above the initial designed clearance. 3. Each check rail end shall be flared by machining to have minimum clearance of 62mm at end. 4. The check rail connections in turnouts shall be through specially designed bearing plates / brackets. 5. All the check rails shall be higher by 25mm above running rails. The lengths and positions of the check rail in diamond crossings shall provide safety and be compatible with the overall track layout. Sleeper for Turnouts, Scissor Crossover (Ballasted Track) 1. Sleeper shall be of pre-stressed concrete, mono-block, suitable for installation in track both with and without signaling circuits and with and without electrification. Bangalore Metro Phase II A DPR KR Puram to Silk board October 2016 Page 5-12
93 CHAPTER 5 PLANNING AND DESIGN PARAMETER 2. Sleepers shall be designed to provide a minimum service life of fifty years under nominal axle load as that of main line for the Metro system. Rail seat pads and rail clip etc shall be designed to provide a minimum service life of 15 years. 3. The sleeper base surface shall be rough cast while the top and side surface shall be smooth to prevent retention of moisture and foreign materials. 4. Sleepers must be suitable for installation by track laying machines and sleeper insertion equipment of a type used for isolated sleeper laying. 5. The sleeper must be able to transfer all the relevant track forces generated by train operations and the forces of rail expansion and contraction to the ballast. Design requirements for PSC sleepers: (A) The sleepers should satisfy the following design requirement: Design Parameters i. Rail sleeper fastening Elastic resilient type. ii. Spacing of sleepers 600mm (max) for main line and 650 mm (max) for Depots and other non-running lines, except at few locations such as near point machine locations where it may be varied to meet the design requirements. iii. Ballast cushion 300mm for mainline and 250mm for Depots and sidings. iv. Ballast profile suitable for LWR/CWR. Specifications and Drawings (with latest amendment) i. Special cement IRS T ii. HTS wire plain and strand BIS 1785 (Pt-1) 1983 and BIS iii. Polyethylene dowels Provisional 1997 Drg. No. RDSO 3002 Alt-3 iv. IRS Specification for turnout sleeper T v. IRS Bridge Code 1982 vi. Code of Practice for Pre-Stressed concrete IS-1343 (B) The design should satisfy the following additional requirements: - i. The connections of the slide chairs and bearing plates/special bearing plates/brackets shall be designed for easy installation and maintenance. All the fittings shall be suitably designed to ensure full compatibility and also to ensure interchangeability of slide chairs between ballasted and ballastless turnouts. ii. For attaining suitable cant of the rail, as provided on mainline, (excluding crossing and switch portion), suitably designed pads of appropriate material shall be provided between rail pad & PSC sleeper. Also fastening system should be designed to get the desired Toe Load. iii. The detailed design of Monoblock PSC sleepers for the turnouts along with structural drawings shall be checked and approved by Metro Railways. Bangalore Metro Phase II A DPR KR Puram to Silk board October 2016 Page 5-13
94 CHAPTER 5 PLANNING AND DESIGN PARAMETER 5.17 SWITCH EXPANSION JOINT 1. The SEJ for ballasted track shall be laid on PSC sleepers whereas the SEJs for ballastless track, if required, shall be laid on reinforced concrete slab. 2. The rail section for all SEJs shall be UIC 60, 1080 HH grade as per IRS-T The SEJ for ballasted track shall be designed for a maximum gap of 80mm. 4. The SEJ for ballastless track should be designed for the maximum gap required as per design. 5. The ballasted SEJ shall be as per RDSO drawing T-6902 & T The ballasted SEJ for BG shall be laid with PSC sleepers as per RDSO drawing T For Standard Gauge, PSC sleeper shall be designed such that SEJ to RDSo drawing along with its bearing plates / chairs may be accommodated for installation of SEJ. 7. Sleepers used for SEJs shall be flat and cant will be provided through CI chair. 8. The SEJ shall be suitable for two way directional traffic NOISE AND VIBRATION Metro system shall be designed to ensure that noise emitted is well within the prescribed limits for the particular area. Each Metro system shall specify the prescribed limits of permissible Noise and vibration parameters as per legal and statutory requirement of India GRADIENTS The maximum grade (compensated) shall be 4%. Note: i. There will be no change of gradient in transition portion of curves. ii. The gradient will be compensated for curvature at the rate of 0.04% per degree of curve. Maximum permissible gradient on turnouts i. On Ballasted Track 0.25% ii. On Ballastless Track 2.5% Note: i. There shall be no change of grade on and within 15m of any turnout on ballastless track. Similarly, there shall be no change of grade on and within 30 meters of any turnout on ballasted track. ii. In case of turnouts on gradient, there shall be no horizontal curve on and within 15 meters of any turnout on ballastless track and 30 meters of any turnout on ballasted track. Track Gradient in Platform a) Maximum 1 in 400 b) Desirable level Note: There shall be no change of gradient in platform track. Bangalore Metro Phase II A DPR KR Puram to Silk board October 2016 Page 5-14
95 CHAPTER 6 GEOTECHNICAL INVESTIGATION 6 GEOTECHNICAL INVESTIGATIONS 6.1 REFERENCE POINT The main purpose of the Geotechnical Investigations undertaken is to have an in-sight into the geological conditions along the proposed corridors of extension of Bengaluru Metro Phase-II, so as to arrive at the type of foundations to be adopted for elevated corridors. The geotechnical investigations were carried out by M/s. Geo Quest Limited, Bengaluru, In addition, soil investigation reports for various flyovers and underpasses already conducted on the route were also studied. The detailed Geotechnical report is enclosed as separate volume. Bengaluru is situated at an elevation of 900 m above Mean Sea Level on a gently sloping rolling topography, sloping gently from North to South. Terrain wise, the western portion of the district is covered by a chain of small-disconnected hillocks. Northern, Eastern and Central parts of the district is having undulating topography. Geology wise, Bengaluru district shows dominant presence of Archean crystalline formation comprising Peninsular Gneissic complex with small patch of hornblende schist in the northern part and intrusive closepet granites all along the western part of the district. These Gneissic complexes are in the age of 2.6 to 3.0 billion Years. They are essentially Granodioritic and Granitic formed due to several thermal-tectonic movements with large influx of Sialic materials representing remobilized parts of an older crust with abundant additions of granitic materials. These Gneissic complexes act as basement for belt of Schists, largely basaltic and characterized by Gold mineralization which is noticed in nearby Kolar. Small stretch comprising unconsolidated sediments are also noticed in Channapatna and Devanahalli. The soil overburden generally is dominated by Silty sand /residual silt and shows presence of clay as a nominal interstitial binder. Overburden in upper layers is generally in loose /medium compact condition especially in areas with high water table. The overburden thickness is variable and is reflective of typical differential weathering that has occurred over a prolonged period. This is followed by completely weathered and highly weathered rock. Bangalore falls under Zone II of Seismic Zoning Map as per IS: 1893 (Part I) FIELD INVESTIGATION Field investigation has been carried out along the Outer Ring Road at 50 locations of borehole exploration up to a maximum depth of 23.0 m. If rock was encountered with in 10.5 m, drilling was carried up to a depth of 3 m in intact hard rock. Boreholes were generally located at about 500 m intervals in elevated portion along the alignment. Borehole exploration was carried out by rotary drilling method using heavy duty rotary drilling rigs. Drilling in soil was carried out by MS soil cutters having suitable cutting edges. In soft/weathered rock, Bangalore Metro Phase II A DPR KR Puram to Silk board October 2016 Page 6-1
96 CHAPTER 6 GEOTECHNICAL INVESTIGATION where strata are very dense, advancement of borehole was done by Tungsten Carbide (TC) bits of Nx size. In moderately weathered and hard rock, core drilling was progressed using Nx size Diamond bits with double tube core barrel. Standard Penetration Tests (SPT) were carried out in the boreholes as per IS 2131 at regular intervals of generally at 1.5 m depth. Undisturbed soil samples were collected by using thin walled steel tubes of 150 mm diameter, 450 mm long as per IS 2132, in cohesive soil strata. Both DS and UDS samples were sealed and labelled properly and brought to the laboratory for further testing. Rock cores were collected from core barrel after the completion of each drill run and marked with borehole numbers and sequential core piece numbers. Rock Core Recovery (CR) and Rock Quality Designation (RQD) have been recorded for each drill run. The rock core samples were stored in wooden core boxes and brought to laboratory for further testing. For determining field permeability in rock, pumping in tests were carried out as per IS 5529 (Part 2) in selected boreholes in the underground portion. Single packer method was used to seal the top of the test section. The permeability value of hard rock varies from 0.3 to 0.59 Lugeons indicating Water tight condition of bed rock. The depth of ground water table in the boreholes was monitored after 24 hours of completion of drilling operation and depth of water level was recorded after it was stabilised. The details of stratification, SPT values, Ground Water Table etc., are indicated in the Sub-Soil Profiles enclosed in Figure 6.1 to LABORATORY TESTING The following laboratory tests were conducted on soil, water and rock samples collected from the boreholes. Tests on soil samples: Grain size analysis - Sieve and Hydrometer Analysis Atterberg s Limits - Liquid & Plastic Limit Natural Moisture Content Bulk and Dry Density Consolidation Test Shear Strength - Triaxial/Direct Shear test Lab Permeability Test Specific Gravity Tests on Rock samples: Specific Gravity, Density, Water Absorption and Porosity of rock Hardness Uni-axial compressive strength Point Load Index strength Bangalore Metro Phase II A DPR KR Puram to Silk board October 2016 Page 6-2
97 CHAPTER 6 GEOTECHNICAL INVESTIGATION Modulus of Elasticity Abrasion test Shear strength Chemical Tests on Soil and Water Samples: ph Chloride Sulphates Organic matter 6.4 GENERAL STRATIFICATION General stratification as obtained from the field and laboratory investigation shows typical residual formation, which is characteristic feature in this region. The top layer generally consists of fine to medium sand, reddish / greyish sandy silt with clay or clayey sand/silt. This layer is in medium dense and is underlain by medium dense to dense reddish/greyish completely weathered formations. This layer represents the transition layer from soil to highly weathered rock. This is followed by highly weathered rock made up of very dense sandy silt/silty sand layer. Weathered rock with degree of weathering varying from moderate to high underlain by more compact hard rock. The rock stratum was encountered in most of the boreholes except a few boreholes, where soft rock in the form of dense silty sand was encountered, up to the investigated depth. 6.5 ANALYSIS OF RESULTS The stratification encountered along the proposed routes mainly consists of medium dense to dense sandy silt/clayey sand at shallow depths. This layer is followed by medium dense to dense completely weathered rock of sandy silt/clayey sand layer, which is non-plastic to moderately plastic. This layer is followed by highly weathered rock consisting of very dense sandy silt/silty sand. Hard rock underlay the highly weathered rock layer. The formation of successive layers is varying along the route. In general, the stratification follow regular pattern as described above. Standard Penetration Test (SPT) in weathered rock indicate very high N value of 50 or more and 100 or more virtually no penetration of SPT tube in this layer. The colour and structure of the soil samples collected in split spoon closely resembles underlying mineralogical constituents of weathered rock / hard rock. Index properties such as grain size distribution and liquid limit and plastic limit indicate that, plasticity characteristics of the soil are Low to Medium. Hydrometer tests conducted on selected soil samples show that fine particles predominantly consists of silt and is non-expansive in nature. Consolidated Undrained shear test and Direct Shear Test indicates in general, the average values of cohesive strength of soil is ranging from 0.04 to 0.14 kg/cm2 and angle of internal friction is ranging from 26 to 34 degrees. Bangalore Metro Phase II A DPR KR Puram to Silk board October 2016 Page 6-3
98 CHAPTER 6 GEOTECHNICAL INVESTIGATION Chemical analysis of soil and water samples show that ph, Chloride and Sulphates are well within the permissible limits and no special precautions are necessary for concreting job. Rock cores extracted from the boreholes show the presence of grey granites with pockets of amphibolites, granodiorite and mylorite rock. The rock is intruded with pegmatite veins at some places. The granite rock shows coarse grain structure due to metamorphic activity. In general, core recovery obtained in moderately weathered rock is ranging from Nil to 95% with Rock Quality Designation (RQD) values of Nil to 95%. In the hard rock, the percentage core recovery is ranging from 62 to 100% and RQD is varying from 52 to 100%. It is seen from the index properties that specific gravity of rock varies from 2.55 to 2.94, water absorption ranges from 0.15 to 2.04%. Uniaxial compressive strength results indicate that strength of hard rock varies from 17.3 MPa to MPa. Point load strength index values in the range of 0.35 to MPa. Modulus of Elasticity (E) values of rock varies from x105 MPa to 0.78 x 10⁵ MPa. 6.6 RECOMMENDATIONS The type of foundation depends on stratification, type of structure, loading, allowable settlement, etc. In the present case, the structure is elevated Metro railway system. The various structures envisaged in the system include Elevated tracks supported on piers, Elevated Stations. The load coming on to the foundation system will be considerably high from the structures Shallow Foundations Shallow foundations are recommended wherever hard strata (soft rock/weathered rock/hard rock) are encountered within 4.5 to 5.0 m depth below the existing ground level. Based on field and laboratory test results, an allowable bearing pressure of 45 T/sq.m is recommended. The hard stratum is underlain by a medium dense layer. Hence, adequate shoring and strutting will be necessary while carrying out foundation excavation. Necessary dewatering arrangements will also be required where water table is encountered at shallow depths. Moderately loaded structures on-ground stations can be supported on shallow foundations at depths varying from 1.5 to 3.0 m. The net allowable bearing pressure for such footings at various borehole locations has been indicated Deep Foundations Deep foundation, in the form of bored cast in-situ piles are recommended wherever the hard stratum is encountered at considerable depths. The columns supporting the elevated rail track and elevated stations are recommended to be supported on pile foundations. In particular, bored cast in-situ piles are recommended keeping in view of the site location, which are within the city and vicinity to the structures around them. Bangalore Metro Phase II A DPR KR Puram to Silk board October 2016 Page 6-4
99 CHAPTER 6 GEOTECHNICAL INVESTIGATION The piles are essentially end bearing piles, socketed into the hard strata. In this case, the hard strata encountered consist of soft/weathered rock and hard rock. It is recommended to anchor the pile in weathered rock layer itself, wherever the thickness of weathered rock layer is considerable. The weathered rock layer encountered in the pile bore can be verified through SPT tests in the pile bore. Further, while chiselling for socketing the uniformity of strata can be ensured by measuring the number of drops Vs penetration. Depending on the hard strata encountered at pile termination, the following depth of socketing is recommended: Stratum at Socket Level Depth of socketing (D=pile diameter), Highly weathered rock/fractured rock 4 D, Moderately weathered rock 2 D, Hard rock 1 D. The lengths of piles considering the strata at pile termination at various borehole locations have been indicated. The safe load carrying capacity of end bearing pile depends on the characteristics of strata at pile termination, anchoring depth and structural capacity of pile section. The piles of diameter 900 mm, 1000 mm, 1200 mm and 1500 mm are considered for evaluation. The safe load capacity of piles in this case is generally governed by structural capacity of pile. The recommended safe load on piles considering piles with M25 concrete are as follows: Table 6.1 Recommended safe Axial Load for piles with diameter Pile Diameter (mm) Recommended safe Axial Load for piles socketed in Highly weathered rock Moderately weathered rock Hard rock The increase in grade of concrete increases the structural capacity. However it is recommended to limit the safe loads as above, in view of the uncertainties involved in quality of in-situ concrete in the pile bore. Further, in highly weathered rock, the capacities are also governed by the properties of soft rock at termination level. Hence, it is preferable to limit the safe loads as recommended above. The pile bore, after achieving the required depth shall be washed thoroughly to remove all the slush to ensure good bearing strata. The uplift capacity of piles can be taken as 10% of safe vertical load and the safe horizontal load can be taken as 5% of safe vertical load. The safe loads in piles shall be confirmed through pile load tests as per relevant Indian Standards. Bangalore Metro Phase II A DPR KR Puram to Silk board October 2016 Page 6-5
100 Figure 6.1 Bore Log Details HSR 14th Main BH = 01 BH = 02 BH = 03 BH = 04 BH = 05 BH = 06 Water Table: 3.00 m Water Table: 2.0 m Water Table: 3.1 m Water Table: 4.60 m Water Table: 3.0 m Water Table: Surface level may be seepage water 0.0 m 0.0 m 0.0 m 0.0 m 0.0 m Filled up soil Filled up soil 0.5 m 0.5 m 0.5 m 0.5 m 0.5 m 0.5 m N = -- N = -- N = -- N = -- N = -- N = m 1.5 m 1.5 m 1.5 m 1.5 m 1.5 m N = 09 N = 07 N = 07 N = 09 N = 07 N = m 3.0 m 3.0 m 3.0 m 3.0 m 3.0 m N = 08 N = 12 N = 15 N = 11 N = 09 N = m 4.5 m 4.5 m 4.5 m 4.5 m 4.5 m N = 14 N = 28 N = 23 N = 18 N = 18 N = m 6.0 m 6.0 m 6.0 m 6.0 m 6.0 m N = 36 N = 39 N = 30 N = 23 N = 35 N = m 7.5 m 7.5 m 7.5 m 7.5 m 7.5 m N > 50 N = 36 N = 36 N = 32 N = 45 N = m 9.0 m 9.0 m 9.0 m 9.0 m 9.0 m N = 40 N > 50 N = 45 N = 41 N > 50 N = m 10.5 m 10.5 m 10.5 m 10.5 m 10.5 m N = 45 N > 50 N > 50 N > 50 N > 50 N > m 12.0 m 12.0 m 12.0 m 12.0 m N > 50 N > 50 N > 50 N > 50 N > m N > m N > m N > 50 Filled up soil Weathered Rock N > 50 Medium to fine Sand (also with or without Gravel) Weathered Rock N > 100 Fine to Medium Sandy Clay Soft Rock Fine to Medium Sandy Silt with Clay binders/gravel/mica Hard Rock Agara Jn. BH = 01 BH = 02 BH = 03 Water Table: 6.0 m Water Table: 6.0 m Water Table: 6.5 m Filled up soil Filled up soil Filled up soil 0.5 m 0.5 m 0.5 m N = 0.0 N = 0.0 N = m 1.5 m 1.5 m N = 08 N = 06 N = m 3.0 m 3.0 m N = 11 N = 15 N = m 4.5 m 4.5 m N = 14 N = 22 N = m 6.0 m 6.0 m N = 17 N = 22 N > m 7.5 m 7.5 m N = 34 N = 28 N > m 9.0 m 9.0 m N = 36 N = 31 N > m 10.5 m 10.5 m N > 50 N = 37 N > m 12.0 m 12.0 m N = m 13.0 m 13.0 m N > Core m Recovery 15.0 m 15.0 m N > Core m Recovery 17.0 m 17.0 m 18.0 Core m Recovery 18.0 m 18.0 m 19.0 Core m Recovery 19.0 m 19.0 m 20.0 Core m Recovery 20.0 m 20.0 m 21.0 m 21.0 m 22.0 m 22.0 m 22.5 m 23.0 m Ibbalur Jn. BH = 01 BH = 02 BH = 03 Water Table: 7.00 m Water Table: 4.0 m Water Table: 3.0 m Filled up soil 0.5 m 0.5 m 0.5 m N = -- N = -- N = -- Filled up soil 1.5 m 1.5 m 1.5 m N = 29 N = 07 N = m 3.0 m 3.0 m N = 46 N = 13 N = m 4.5 m 4.5 m N = 26 N = 12 N = m 6.0 m 6.0 m N = 26 N = 19 N = m 7.5 m 7.5 m N = 28 N = 18 N > m 9.0 m 9.0 m N > 50 N = 20 N > m 10.5 m 10.5 m N > 50 N > 50 N > m 12.0 m 12.0 m N = -- N > 50 N > m 13.5 m 13.5 m N = -- N = m 15.0 m 15.0 Core m Recovery N = -- N = m 16.5 m 16.5 Core m Recovery N = -- N = m 18.0 m 18.0 Core m Recovery N = -- N = m 19.5 m N = -- N = m 21.0 m N = -- N = m N = m N = --
101 Figure 6.2 Bore Log Details Bellandur BH = 01, Bellandur BH = 02, Bellandur BH = 03, Bellandur BH = 04, Bellandur BH = 05, Bellandur BH = 06, Bellandur Water Table: Nil Water Table: Nil Water Table: 2.90m Water Table: 3.70m Water Table: Nil Water Table: Nil 0.0 m 0.0 m 0.0 m 0.0 m 0.0 m Filled up soil Filled up soil 0.5 m 0.5 m 0.5 m 0.5 m 0.5 m 0.5 m N = 0.0 N = 0.0 N = 0.0 N = 0.0 N = 0.0 N = m 1.5 m 1.5 m 1.5 m 1.5 m 1.5 m N = 15 N = 35 N = 13 N = 18 N = 22 N = m 3.0 m 3.0 m 3.0 m 3.0 m 3.0 m N = 21 N = 27 N = 10 N = 13 N = 09 N = m 4.5 m 4.5 m 4.5 m 4.5 m 4.5 m N = 39 N = 34 N = 11 N = 13 N = 11 N = m 6.0 m 6.0 m 6.0 m 6.0 m 6.0 m N > 50 N > 38 N = 20 N = 18 N = 20 N = m 7.5 m 7.5 m 7.5 m 7.5 m 7.5 m N > 50 N > 50 N = 18 N = 21 N = 23 N = m 9.0 m 9.0 m 9.0 m 9.0 m 9.0 m N > 100 N > 50 N = 41 N = 33 N = 25 N > m 10.5 m 10.5 m 10.5 m 10.5 m 10.5 m N > 100 N > 50 N > 100 N > 100 N = 27 N > m 12.0 m 12.0 m 12.0 m N > 100 N > 100 N > 100 N > m N > m N > m N > 100 Filled up soil Medium to fine Sand (also with or without Gravel) Fine to Medium Sandy Clay Fine to Medium Sandy Silt with Clay binders/gravel/mica Devarabeesanahalli BH = 01 BH = 02 BH = 03 BH = 04 BH = 05 BH = 06 Water Table: 3.80m Water Table: Nil Water Table: 4.0 m Water Table: 4.60 m Water Table: 3.50 m Water Table: 4.0 m 0.0 m 0.0 m 0.0 m 0.0 m 0.0 m Filled up soil Filled up soil 0.5 m 0.5 m 0.5 m 0.5 m 0.5 m 0.5 m N = 0.0 N = -- N = 0.0 N = 0.0 N = 0.0 N = m 1.5 m 1.5 m 1.5 m 1.5 m 1.5 m N = 16 N = 23 N = 12 N = 11 N = 07 N = m 3.0 m 3.0 m 3.0 m 3.0 m 3.0 m N = 17 N = 28 N = 18 N = 24 N = 21 N = m 4.5 m 4.5 m 4.5 m 4.5 m 4.5 m N = 24 N = 31 N = 22 N = 25 N = 26 N = m 6.0 m 6.0 m 6.0 m 6.0 m 6.0 m N = 31 N = 29 N = 34 N = 26 N = 24 N = m 7.5 m 7.5 m 7.5 m 7.5 m 7.5 m N = 38 N = 33 N = 35 N = 33 N = 27 N = m 9.0 m 9.0 m 9.0 m 9.0 m 9.0 m N = 43 N = 14 N = 49 N = 41 N = 25 N = m 10.5 m 10.5 m 10.5 m 10.5 m 10.5 m N > 50 N = 34 N > 50 N > 50 N > 50 N > m 12.0 m 12.0 m 12.0 m 12.0 m N > 50 N > 50 N > 50 N > 50 N > m N > m N > m N > m N > m N > 50 Weathered Rock N > 50 Weathered Rock N > 100 Soft Rock Hard Rock F
102 Figure 6.3 Bore Log Details Kadubeesanahalli BH = 01 BH = 02 BH = 03 BH = 1A BH = 2A BH = 3A Water Table: Nil Water Table: Nil Water Table: 4.0 m Water Table: Nil Water Table: Nil Water Table: Nil 0.0 m 0.0 m 0.0 m 0.0 m 0.0 m Filled up soil Filled up soil 0.5 m 0.5 m 0.5 m 0.5 m 0.5 m 0.5 m N = 0.0 N = -- N = -- N = 0.0 N = 0.0 N = m 1.5 m 1.5 m 1.5 m 1.5 m 1.5 m N = 18 N = 18 N > 50 N = 10 N = 45 N = m 3.0 m 3.0 m 3.0 m 3.0 m 3.0 m N = 34 N = 34 N = -- N = 22 N = 14 N = m 4.5 m 4.5 m 4.5 m 4.5 m 4.5 m N = 42 N = 42 N = 22 N > 50 N = 32 N = m 6.0 m 6.0 m 6.0 m 6.0 m 6.0 m N > 50 N > 50 N = 38 N > 50 N = 24 N > m 7.5 m 7.5 m 7.5 m 7.5 m 7.5 m N > 50 N > 50 N = 34 N > 50 N > 50 N = m 9.0 m 9.0 m 9.0 m 9.0 m 9.0 m N > 50 N > 50 N > 50 N > 50 N > 50 N > m N > m 10.5 m 10.5 m 10.5 m 10.5 m N > 50 N > 50 N > 50 N > 50 N > m N > 50 Filled up soil Weathered Rock N > 50 Medium to fine Sand (also with or without Gravel) Weathered Rock N > 100 Fine to Medium Sandy Clay Soft Rock Fine to Medium Sandy Silt with Clay binders/gravel/mica Hard Rock Doddanekundi ISRO Junction BH = 01 BH = 02 BH = 03 BH = 04 BH = 05 BH = 06 BH = 07 Filled up soil Filled up soil Filled up soil Filled up soil Filled up soil Filled up soil Filled up soil N = m N > m N = m N = m 2.0 m 1.0 m N = -- N = m 2.0 m 1.0 m N = -- N = m 2.0 m N = m N = m N > m N = m N = m 1.0 m N = m N = m N > 100 N = m 3.0 m 3.0 m 3.0 m 3.0 m 3.0 m 3.0 m N = 35 N = 41 N > 100 N > 100 N > 100 N > m 4.0 m 4.0 m 4.0 m 4.0 m 4.0 m 4.0 m N > m N = m 5.0 m N = m 5.0 m 4.5 m 5.0 m N > m N > m 4.5 m N > m 4.5 m N > m N > m 6.0 m 6.0 m 6.0 m 6.0 m 6.0 m 6.0 m N > 100 N = 58 N > 100 N > 100 N > 100 N > m 7.0 m 7.0 m 7.0 m 7.0 m 7.0 m 7.0 m N > 100 N > m 8.0 m N > 100 N = m 8.0 m 7.5 m N > m 7.5 m N > m 7.5 m 7.5 m N > 100 N > m 8.0 m N > m 9.0 m 9.0 m 9.0 m 9.0 m 9.0 m 9.0 m N > 100 N > 100 N > 100 N > 100 N > 100 N > m N = m 10.0 m 10.0 m 10.0 m 10.0 m 10.0 m N > 100 N > 100 N > m 11.0 m N = m 11.0 m 11.0 m 11.0 m 11.0 m 11.0 m N > 100 N > m N = m 12.0 m 12.0 m 12.0 m 12.0 m 12.0 m N > 100 N > 100 N > m N = m 13.0 m 13.0 m 13.0 m 13.0 m 13.0 m N > 100 N > m 14.0 m N = m 14.0 m 14.0 m 14.0 m 14.0 m N > 100 N > m 15.0 m 15.0 m 15.0 m 15.0 m N > 100 N > m 16.0 m 16.0 m 16.0 m 16.0 m N > 100 N > m N > m 17.0 m 17.0 m 17.0 m N > 100 N > m 18.0 m 18.0 m N > 100 N > m 19.0 m 19.0 m N > m 20.0 m 20.0 m 20.0 m 21.0 m 21.0 m 21.0 m 21.5 m 21.5 m
103 Figure 6.4 Bore Log Details Mahadevpura BH = 01 BH = 02 BH = 03 BH = 04 BH = 05 BH = 06 Water Table: 1.0 m Water Table: 1.0 Water Table: 1.0 m Water Table: 3.0 m Water Table: 2.0 m Water Table: 1.0 m 0.0 m 0.0 m 0.0 m 0.0 m 0.0 m Filled up soil Filled up soil Filled up soil 0.5 m 0.5 m 0.5 m 0.5 m 0.5 m 0.5 m N = -- N = -- N = -- N = 0.0 N = m 1.0 m Filled up soil N > m 1.5 m 1.5 m 1.5 m N = 02 N = 09 N = 12 N > 100 Filled up soil 2.0 mn 2.0 m = 13 N = m 3.0 m 3.0 m 3.0 m 3.0 m N = 04 N = 14 N = 06 N = 26 Core Recovery 3.5 m Core Recovery 4.0 m N > m 4.5 m 4.5 m N = 14 N = 22 N = mn = -- Core Recovery 5.5 m Soft Rock Core Recovery 6.0 m N = m N = 29 Soft Rock Hard Rock 6.0 m N = -- Core Recovery 7.0 mn = -- Core Recovery 8.0 m N = -- Core Recovery 6.0 m N = m N > m Core Recovery 9.0 m N = m N > 50 Filled up soil Weathered Rock N > 50 Medium to fine Sand (also with or without Gravel) Weathered Rock N > 100 Fine to Medium Sandy Clay Soft Rock Fine to Medium Sandy Silt with Clay binders/gravel/mica Hard Rock KR Puram Jyothipura Byappanahalli
104 CHAPTER 7 TRAIN MAINTENANCE DEPOT 7 TRAIN MAINTENANCE DEPOT 7.1 INTRODUCTION It is proposed to create a full-fledged separate maintenance Depot at Kadugodi to cater operational and maintenance requirements for East-West corridor in lieu of Baiyappanahalli Depot for which cost provision has been considered in the project cost of Silk Board to K R Puram line. It is also proposed to designate the Baiyappanahalli Depot for maintenance and repair of the Rolling Stock for Silk Board - K. R. Puram line. It is seen that with present PHPDT and head way of this line, the stabling, repair and maintenance facility presently available at Baiyappanahalli Depot is adequate to cater the requirement for the year However, in future if this line extended beyond K R Puram towards Hebbal, the requirement of additional stabling lines would be provided at Hebbal or at terminal stations. For the maintenance of CBTC equipped trains, the Baiyappanahalli Depot shall be planned with fullfledged facilities with an overlapping period during which some lines will exclusively cater for CBTC equipped trains and balance will be for DTG system and finally Baiyappanahalli Depot shall be converted to serve the CBTC equipped train of Silk Board to k R Puram only. The existing test track in Baiyappanahalli Depot will be modified for testing of CBTC train sets Rolling Stock Maintenance Schedule The following maintenance schedule has been envisaged for conceptual design of Depots assuming 495 km running per train per day, and taking in to consideration of the passenger load with average 3 min headway of 2021, 2031 and Table 7.1 Rolling Stock maintenance needs Maintenance Schedule Type of Schedule Daily 72 hours Check A Service Check B1 Service Check B2 Service Check B4 Service Check Daily 3days Interval Work Content Locations 6,000 km (15days) 18,000 km (45days) 36,000 km (90days) 72,000 km (180days) Interval cleaning/mopping of floor and walls with vacuum cleaner. Safety checks, CCD, microphone, brake and checks on the train condition. Safety checks, inspection of lights, CCD, traction motor, bogie suspension, brake, window, micro phone and checks on the train condition. Detailed Inspection of A type tasks plus items at multiples of 18,000 Km ( B1 type tasks) Detailed Inspection of B1 type tasks plus items at multiples of 36,000 Km ( B2 type tasks) Detailed Inspection of B2 type tasks plus items at multiples of 72,000 Km ( B4 type tasks) Stabling lines Stabling lines/ Inspection bays Inspection bays Inspection bays Inspection bays Inspection bays Bangalore Metro Phase-IIA DPR : K.R.Puram Silk Board October 2016 Page 7-1
105 CHAPTER 7 TRAIN MAINTENANCE DEPOT Table 7.1 Rolling Stock maintenance needs Maintenance Schedule Type of Schedule B8 Service Check B16 Service Check C1 Overhaul C2 Overhaul C3 Overhaul C4 Overhaul Interval Work Content Locations 150,000 km (360days) 300,000 km (2years) 520,000 km (3.5years) 1,040,000 km (7years) 1,560,000 km (10.5years) 2,250,000 km (15years) Detailed Inspection of B4 type tasks plus items at multiples of 1,50,000 Km ( B8 type tasks) Detailed Inspection of B8 type tasks plus items at multiples of 3,00,000 Km ( B16 type tasks) Check and testing of all sub-assemblies, overhaul of pneumatic valves, Compressor. Condition based maintenance of sub-systems to bring them to original condition. Replacement of parts and rectification, trial run. Check and testing of all sub-assemblies, Overhaul of pneumatic valves, Compressor. Condition based maintenance of sub-systems to bring them to original condition. Replacement of parts and rectification, trial run. Dismantling of all sub-assemblies, bogies suspension system, traction motor, gear, control equipment, airconditioning units etc. Overhauling to bring them to original condition. Checking repair and replacement as necessary. Inspection and trial. Changing of heavy item such as bogies, traction motor, axles, gear cases & axle boxes etc. Inspection bays Inspection bays Workshop Workshop Workshop Workshop Year-wise planning of maintenance facility setup at Baiyappanahalli Depot-cumworkshop is as under: The existing 16 stabling lines at Baiyappanahalli Depot will be connected to Silk Board to K R Puram line by merging into two lines and further connected to the K R Puram Station through via-duct. Thus stabling lines at Baiyappanahalli Depot will have entry from both East-West and new line from either side. The transition of Baiyappanahalli Depot from DTG signaling system to complete CBTC system is planned in phased manner. i) Rake requirement: Table 7.2 Rake Requirement Year Silk Board to K R Puram Corridor Head way in minutes No. of trains No. of Coaches X 6-Cars X 6-Cars X 6-Cars 186 Bangalore Metro Phase-IIA DPR : K.R.Puram Silk Board October 2016 Page 7-2
106 CHAPTER 7 TRAIN MAINTENANCE DEPOT ii) Bare Requirement of stabling, inspection and work shop lines: Table 7.3 Bare Requirement of stabling, inspection and work shop lines Year Silk Board to K R Puram Corridor Baiyappanahalli Depot Hebbal Depot (proposed) SBLs IBLs WSLs SBLs IBLs lines X 6-Car 3 lines X 6- Cars 4 lines X 6-Car lines X 6-Car 3 lines X 6- Cars 4 lines X 6-Car 13 lines X 6-Car 2 lines lines X 6-Car 3 lines X 6- Cars 4 lines X 6-Car 13 lines X 6-Car 2 lines Note:- Presently, Baiyappanahalli Depot can cater for 21 rakes which meet the stabling and inspection requirement of Silk Board - K. R. Puram line for the year However, the proposed upcoming Depot at Hebbal shall be planned stabling lines to meet rake requirement arises from extension of Silk Board - K. R. Puram corridor up to Hebbal by 12 km (18 km+12 km= 30 km total length) and in addition rake requirement to meet PHPDT for the year 2031 and Depot Control Centre (DCC) For the CBTC equipped trains, the existing DCC at Baiyappanahalli Depot shall be converted in phased manner from DTG system to CBTC system to control operation of train movement in coordination with OCC Operation Control Centre (OCC) To cater operation requirement for Silk Board - K. R. Puram new line, the equipment and display boards of CBTC system shall be accommodated in existing Operation Control Centre (OCC) at Baiyappanahalli Washing Needs of Rolling Stock To cater train wash requirement for Silk Board - K. R. Puram new line a separate wash plant is proposed on the entry line from K R Puram to Depot. The existing washing plant at Baiyappanahalli Depot will continue to serve washing of East-West trains. 7.2 TRAIN DEPOT CUM WORKSHOP AT KADUGODI DEPOT Full-fledged separate maintenance Depot at Kadugodi is planned to cater operational and maintenance requirements for East-West corridor in lieu of the existing Baiyappanahalli Depot, which is at present serving the East-West line. In phase-ii, under extension of phase-i, one more maintenance Depot at Challagatta has been proposed to cater East-West corridor requirements. With this the Challagatta Depot and Kadugodi Bangalore Metro Phase-IIA DPR : K.R.Puram Silk Board October 2016 Page 7-3
107 CHAPTER 7 TRAIN MAINTENANCE DEPOT will be most ideal for operational and maintenance requirements for East-West corridor being at the both ends. (i) Year-wise planning of maintenance facility setup at Challagatta and at Kadugodi Depot-cumworkshop is tabulated below: Year Head way in minutes Table 7.4 Year-wise planning of maintenance East- West Corridor Challagatta Depot No. of trains 27 (6-Car) No. of Coaches Head way in minutes East- West Corridor Kadugodi Depot No. of trains 19 (6-Car) No. of Coaches (6-Car) (6-Car) (6-Car) (6-Car) 114 (ii) Bare Requirement of inspection lines: Table 7.5 Bare Requirement of inspection lines East- West Corridor Challagatta Depot East- West Corridor Kadugodi Depot Year IBL Year IBL lines X 6-Car lines X 6-Car lines X 6-Car do do do- (iii) Distribution of stabling lines at Depot: Table 7.6 Distribution of stabling lines at Depot Year Challagatta Depot East- West Corridor Requirement Kadugodi Depot lines X 6-Car 4 lines X 6-Car 16 lines X 6-Car 3 lines X 6- Car lines X 6-Car -do- -do- -do do- -do- -do- -do- Initially, Challagatta Depot shall be planned for 23 stabling lines and the expansion shall be executed in staged manner for accommodating 37 rakes required in Bangalore Metro Phase-IIA DPR : K.R.Puram Silk Board October 2016 Page 7-4
108 CHAPTER 7 TRAIN MAINTENANCE DEPOT (iv) Distribution of SBLs, IBLs and WSLs in Depot-cum-Workshops: Table 7.7 Distribution of SBLs, IBLs and WSLs in Depot-cum-Workshops Year Depot-cum-Workshop / Challagatta) East- West Corridor Depot-cum-Workshop / Kadugodi SBLs IBLs WSLs SBLs IBLs WSLs 23 lines X 6- Car + 1 line for Exigency 33 lines X 6- Car + 1 line for Exigency 33 lines X 6- Car + 1 line for Exigency 4 lines X 6- Cars -do- -do- 4 lines X 6- Cars -do- -do- 16 lines X 6-Car + 1 line for Exigency 16 lines X 6-Car + 1 line for Exigency 16 lines X 6-Car + 1 line for Exigency 3 lines X 6- Cars -do- -do- 4 lines X 6- Cars -do- -do- 7.3 PROVISION OF INFRASTRUCTURE FACILITIES AT KADUGODI DEPOT -CUM- WORKSHOPS: I. Inspection Sheds The length of Inspection lines, Workshop lines shall be 159 mtrs. (Say 160m) and Inspection / Maintenance / minor repair shall be done. The A & B inspections shall be carried out at a frequency of 15 days and 45 days respectively keeping in view the average Km Earning /Train. Apart from this 72 hrs checks will have to be carried out in inspection bay. II. Stabling Lines in Depot a) The length of stabling lines shall be of the order of 160 mtrs. b) The requirement of lines shall be in accordance with the table indicated above; the stabling siding in the Depot shall be covered with a roof in order to facilitate testing of air-conditioning of trains and their pre-cooling under controlled condition of temperature. c) Separate toilets adjacent to stabling lines shall be provided with small room for keeping cleaning aids and for utilization by the contractor s staff. III. Workshop lines d) All the Workshop lines shall be interconnected through turn tables. e) Each bay shall be spanned with two 15T / 3T overhead Cranes. f) One embedded line shall be provided with Pit-jacks for lifting of 3-Car unit simultaneously. g) The unscheduled line shall be provided with Pits of complete Coach length for facilitating under-carriage inspection and roof platform with suitable HVAC unit approach facility for repair and maintenance. h) Workshop will have an array of service rooms which cater for servicing & overhauling of Equipments. Bangalore Metro Phase-IIA DPR : K.R.Puram Silk Board October 2016 Page 7-5
109 CHAPTER 7 TRAIN MAINTENANCE DEPOT i) Assembling / disassembling overhauling testing facilities shall be facilitated and suitably placed. j) There shall be washing & cleaning equipment available on shop floor. Air circulators, Power supply points, compressed air lines shall be provided on every column. k) Repair & stacking of heavy equipments such as HVAC, Convertors and Motors shall be so located that it does not affect movement inside the workshop. l) Interconnectivity with mechanical repair section shall be so available that Wheels / Bogies / brake equipments are carried in and out of the repair section without causing inconvenience to any other activity. m) The unscheduled heavy lifting bay lines shall be extended up to half of the workshop bay length beyond which space shall be kept overhauling, repairs, cleaning disassembling / assembling of Bogies. IV. Train Operators Booking Office Suitable office facility adjacent to the stabling lines shall be provided so that train operators reporting On duty or going Off duty can obtain updates regarding Special Notices, Safety Circulars and other technical information in vogue. These offices shall have an attached a cycle/scooter/car stand facility for convenience of the train operating staff. V. Test Track A test track of 1000 m in length fenced is provided beside workshop in the Depot. It shall be equipped with signaling equipments (ATP/ATO). It shall be used for the commissioning of the new trains, their trials and testing of the trains after the IOH and POH. Entry into the test track shall be planned for a 6 Car train directly from repair and inspection bay. In compliance to safety norms, the boundary of the track shall be completely fenced to prevent unauthorized tress passing across or along the track with red flashing lights all along the fencing line to indicate live on rail. VI. Heavy Cleaning Shed Monthly heavy cleaning of interior walls, floors, seats, windows glasses done by manually in the interior cleaning plant shall be designed for cleaning of one six car train at a time. A line adjacent to inspection shed to be provided that placement of rakes is possible from workshop or inspection lines & vice versa conveniently & with ease. VII. Power Supply Auxiliary substations are planned for catering power supply requirement of the whole Depot. Details of connected load feeder shall be worked out. Taking diversity factor of 0.5 the maximum demands shall be computed. One Auxiliary substation is proposed, as the demand by machines in Repair-shop area would not be large. The standby power supply is proposed through DG set with AMF panel. The capacity of DG set will be adequate to supply all essential loads without over loading. The details of power supply is as under, Bangalore Metro Phase-IIA DPR : K.R.Puram Silk Board October 2016 Page 7-6
110 CHAPTER 7 TRAIN MAINTENANCE DEPOT Table 7.8 Power Supply Details VIII. Sl.No. Details of supply Installed capacity 1. Normal supply Transformer 2.5 MW 2000 KVA 2. D.G supply 380 KVA 3. Solar PV system Compressed Air Supply 1.45 MWp at peak hour (to be installed in future) An independent compressor unit shall be provided at designated/required locations for the supply of compressed air in workshop and Inspection bay. IX. Water Supply, Sewerage and Drainage Works In house facilities shall be developed for the water supply of the Depot. Sewerage, storm water drainage shall be given due care while designing the Depots for efficient system functioning. Past records of Municipal Corporation shall be used to design the drainage system. Rainwater harvesting would be given due emphases to charge the underground reserves. X. Ancillary Workshop This Repair-shop will have a line at floor level with provision of pits. Arrangement for repairs of shunters, Rail Road Vehicles and other ancillary vehicles will be provided. These vehicles will also be housed here itself. Heavy lifting works can be carried out in main repair shop. Ancillary workshop will be used for storing traction supply system equipments. XI. Watch Towers There shall be provision of adequate number of watchtowers for the vigilance of Depot boundary. XII. Administrative Building An administrative building close to the main entrance is planned. It can be suitably sized and architecturally designed at the detailed design stage. A time and security office is also provided close to main entrance. It shall be equipped with suitable Access control system for all the staff working in the complex. XIII. Parking Facilities a) Ample parking space shall be provided for the two wheelers and four wheelers at the following points. Close to the Depot entry. Close to the stabling lines. Close to repair bay. b) Space for parking of road vehicles and re-railing equipments. Bangalore Metro Phase-IIA DPR : K.R.Puram Silk Board October 2016 Page 7-7
111 CHAPTER 7 TRAIN MAINTENANCE DEPOT Since IOH/POH of equipments of Extension line has to be done at Challagatta and Kadugodi Depot cum-workshop, a lot of road transport will have to be utilized. Both the Depots need to have enough space for parking of Road vehicles. Enough space will also have to be earmarked adjacent to workshop and repair bay. Similarly provision of space for parking of re-railing equipments shall have to be made close to the main exit gate of the Depots. XIV. Shed and Buildings The shed and buildings normally provided in the Depot with their sizes and brief functions are indicated in Annexure-I. Some of these buildings are not depicted on the layout drawing. At the detailed design stage depending upon the land availability, the decision to locate these buildings can be taken. These can then be architecturally and functionally grouped. Moreover, the shed and buildings shall be suitable for installation of solar system in future. XV. Plant and Machinery A separate building is planned for housing Pit-Wheel lathe (PWL), approachable from repair-shop, inspection bay and stabling lines through rail and road for placement of cars for re-profiling of wheels within the Depot along with space for depositing of scrap. XVI. Requirement of buildings, major plants and machinery, is given in Annexure I and II for Kadugodi Depot: Following Safety features shall be incorporated in the design of all the Maintenance Depots a) Access to the under-carriages to be interlocked with 3rd rail supply system so that inspection of under carriage is possible only when Supply is isolated and grounded. b) Installation of red flashers lights along the inspection lines at conspicuous location to indicate the 3rd rail supply is Live. c) In heavy repair bay inbuilt arrangement for multi level wheel stacking and TM stacking. d) Power sockets shall be provided on pillars in the inspection bay & workshop. e) At cleaning area power supply and its isolation shall be interlinked for safety reasons. f) The roof inspection platform shall have at least two doors to facilitate staff to go up the roof for cleaning of roof. Suitable safety interlock shall be provided to power supply. g) Control Centre, PPIO & store Depot must be located close to Workshop. h) The door width of repair section shall be 2 meters to enable free passage of equipment through them. i) Provision of water hydrants shall be available in workshops and stabling yards. j) Water supply shall be provided in all the buildings for cleaning. k) Provision of natural ventilation shall be made for both inspection and workshop shed. Bangalore Metro Phase-IIA DPR : K.R.Puram Silk Board October 2016 Page 7-8
112 CHAPTER 7 TRAIN MAINTENANCE DEPOT Sl. No. Table 7.9 List of Buildings at upcoming Depot at Kadugodi to be planned. Name of Building Size Brief Function Inspection Shed 160 x 40 m Servicing of Cars for 15 days & 45 days inspection Workshop Associated sections Pit Wheel lathe building Stores Depot & offices including goods platform with ramp Elect. Sub-station DG set room Traction repair Depot and E&M repair shop Cycle / Scooter / Car Parking (i) Auto coach washing plant (ii) Space for AWP control room Interior cleaning and washing. P. way office, store & Workshop including Welding plant 160 X 63 m Repair of overhauling of Rolling Stock 160 x 8m Rooms for carrying out the inspection & workshop activity. 40 x 20m For installation of PWL 40 x 40m 25 x 22 m 80 x 30m 60 x 6 m x 6 m 40 x 10 m 40 x 10m 20 x x 6.5m 80 x 20m Stocking of spares for regular & emergency requirement including consumable items. This store caters for the requirement of Depot for rolling stock & other disciplines. To be provided with computerized inventory control. Loading/unloading of material received by road. To cater for normal and emergency power supply for Depot, workshop, service and all other ancillary buildings, essential power supply essential loads and security light. Stabling and routine maintenance of shunting engine etc. & traction maintenance Depot. For maintenance of lifts/escalators and other General service works. Close to the Depot entry. Close to the stabling lines. Close to the repair bay. For automatic washing of coaches and its proper drainage. Heavy wet washing of rakes from inside, under frame, roof at 30 days interval. For track maintenance of section and Depot. To weld rails for construction period only. To stable track Tamping machine. 9. Security office & time office garages (4 Nos.) 15 x 8m For security personnel. For time punching. For parking vehicle jeep, truck etc. 10. Check post (2 Nos.) 5 x 3m For security check of incoming/outgoing staff, material and coaches. 11. Watch tower (3 Nos.) 3.5 x 2.5m For security of the Depot especially during night time. 12. Depot control centre& Crew booking centre 13. O.H raw water Tank 25x20m (double storey) 1,00,000 Ltrs. To control movement of trains in and out of the Depot & out of the Depot & for crew booking. Storage of water, capacity 1, 00,000 Ltrs each. Bangalore Metro Phase-IIA DPR : K.R.Puram Silk Board October 2016 Page 7-9
113 CHAPTER 7 TRAIN MAINTENANCE DEPOT Sl. No. Table 7.9 List of Buildings at upcoming Depot at Kadugodi to be planned. Name of Building Size Brief Function Capacity 14. Pump house Bore well Dangerous goods Store 33 KV/750 VDC Traction 33kV sub station 7.3 x mm Submersible type pump planned with 200 mm diameter bore well. 15m x 10m For Storage of paints, inflammables & Lubricants 15m x 10m Traction Power Supply 17. Waste Collection Bin 10m x 10m Garbage dumping 18. Work shop Manager Office 30 x 20m Office of Depot in charge 19. ATP & ATO Room 10 x 8m To keep equipments of ATP/ATO 20. Waste Water Treatment Plant 12 x 6m 21. Canteen 400 Sqm. 22. Toilets (Gents & Ladies) 10 x 7m 10 x 7m For treating the discharge waters from Depot and remove the oil, acids etc. before discharging into the river, with U/G tank. Canteen to cater staff of Depot and workshop staff shall be in a separate building with modern kitchen ware and facilities. Obligatory as per statuary requirements These toilets shall be approachable both from workshop as well as from inspection bay and ladies toilet shall be completely insulated from gent s toilet. Table 7.10 List of Plants &Equipment at upcoming Depot at Kadugodi Sl. No. Equipment 1 Under floor Pit wheel lathe, Chip crusher and conveyor Electric tractor. 2 Mobile jacks 15T for lifting cars 3 Pit jacks (complete set on one line) 4 Run through type Automatic Washing plant for Metro cars. 5 Bogie Test Stand 6 Bogie wash Plant 7 Wheel mounting and demounting press 8 CNC vertical Turret Lathe 9 CNC Axle Journal Turning and burnishing lathe Bangalore Metro Phase-IIA DPR : K.R.Puram Silk Board October 2016 Page 7-10
114 CHAPTER 7 TRAIN MAINTENANCE DEPOT Table 7.10 List of Plants &Equipment at upcoming Depot at Kadugodi Sl. No. Equipment 10 Road cum Rail vehicle with re-railing equipment 11 Battery powered locomotive 12 Synchronized double acting high tonnage hydraulic jack of 200 ton capacity with power pack. 13 Truck mounted hydraulic platform for inspection of viaduct. 14 Savage and cleaning machine 15 Work lift platform 16 Electric bogie tractor for pulling cars and bogies inside workshop 17 Compressor for Inspection shed & shop air supply 18 Travelling O/H crane repair-shop 15 T:- 2 Nos; 3 T :- 2 Nos 19 Mobile jib crane 20 Mobile lifting table 21 Bogie turn tables 22 Under frame & Bogie blowing plant 23 AC filter cleaning machine 24 High-pressure washing pump for front and rear end cleaning of car 25 Industrial furniture 26 Minor equipment and collective tools 27 EMU battery charger 28 Welding equipments (Mobile welding, oxyacetylene, fixed arc welding) 29 Electric and pneumatic tools 30 Measuring and testing equipment 31 Tool kits 32 Mobile safety steps 33 Fork lift tractor Bangalore Metro Phase-IIA DPR : K.R.Puram Silk Board October 2016 Page 7-11
115 CHAPTER 7 TRAIN MAINTENANCE DEPOT Table 7.10 List of Plants &Equipment at upcoming Depot at Kadugodi Sl. No. Equipment 34 Pallet trucks 35 Road vehicles (pickup van/ truck) 36 Miscellaneous office equipments 37 Special jigs and fixtures and test benches for Rolling Stock 38 Aerial work lift platform Bangalore Metro Phase-IIA DPR : K.R.Puram Silk Board October 2016 Page 7-12
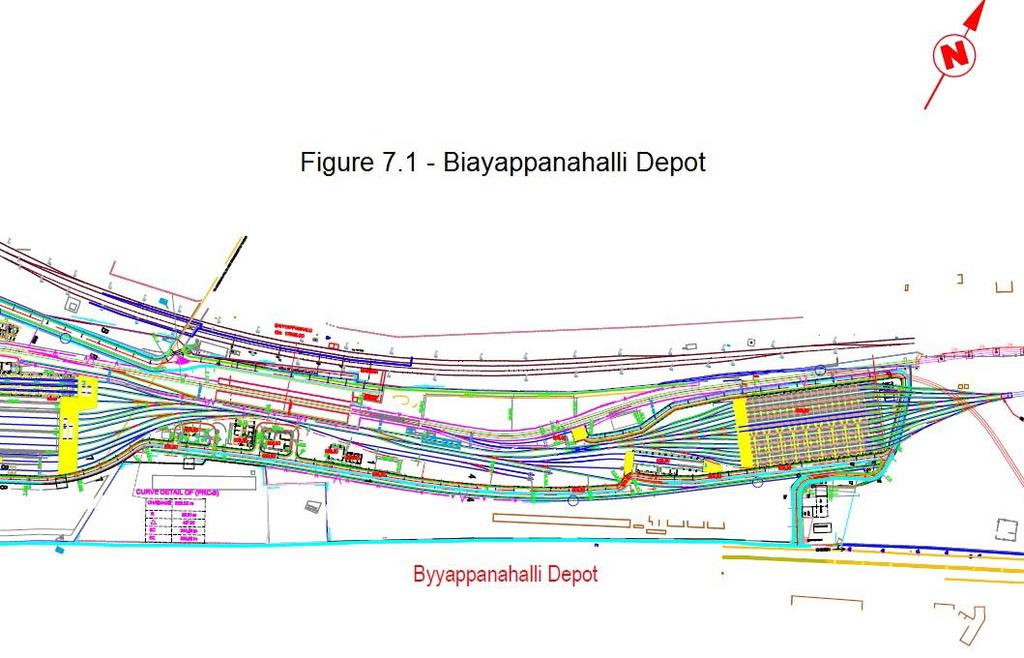
116
117

118
119 CHAPTER 8 POWER SUPPLY, SYSTEM OF TRACTION AND POWER TARIFF 8 POWER SUPPLY, SYSTEM OF TRACTION AND POWER TARIFF 8.1 BACKGROUND The traction system for Bangalore Metro is already selected as 750 V DC third rail bottom current collection system. This line is a spread out of R V Road to Bommasandra and Baiyappanahalli to Whitefield line therefore the same traction system i.e. 750 V DC third rail bottom current collection system is proposed. Accordingly power supply arrangement and approach philosophy for traction and auxiliary is detailed in the following paras:- 8.2 POWER SUPPLY ARRANGEMENTS Electricity is the only source of energy for operation of Metro system. The electric power supply is required by Metro system for the following purposes:- For running trains For station services e.g. lighting, ventilation, lifts, escalators, signaling & telecom, fire fighting and pumping etc. For workshops, depots and other maintenance infrastructure within premises of metro system. The major component of power supply is the traction requirement for elevated section Power Demand Estimation The power requirement of a metro system is determined by peak-hour demands of power for traction and auxiliary applications. Broad estimation of auxiliary and traction power demand is made based on the following requirements:- i. Specific energy consumption of rolling stock 75KWh/1000 GTKM ii. Regeneration by rolling stock for 750V DC traction 20% iii. Elevated station load initially (2021) 200 kw, which will increase to 500 kw in the year 2041 iv. Depot auxiliary load initially 1000 kw in the year 2021, which will increase to 1350 kw in the year Keeping in view of the Train Operation Plan and demand of auxiliary and traction power, power requirement for Silk Board Junction to K R Puram has been worked out for the year 2021, 2031 and 2041 which is summarized in Table 8.1: Bangalore Metro Phase-IIA DPR : K.R.Puram Silk Board October 2016 Page 8-1
120 CHAPTER 8 POWER SUPPLY, SYSTEM OF TRACTION AND POWER TARIFF Silk Board Junction to K R Puram Table 8.1 Power Demand Estimation (MVA) Corridor Traction Auxiliary Total Year The detailed calculations of Power Requirements are given at Table Need for High Reliability of Power Supply The proposed line from Silk Board Junction to K R Puram of Bangalore metro system is being designed to handle about 36,226 passengers per direction during peak hours when trains are expected to run at about 2.5 minutes intervals. The tolerance level of any power interruption during this period is extremely low, as such incidences, apart from affecting train running, will cause congestion at stations. Accordingly, Metro system requires a very high level of reliable and good quality of power supply. To ensure reliability of power supply, it is essential that both the sources of supply and connected transmission & distribution networks are reliable and have adequate redundancies built in. Therefore, it is desirable to obtain power supply at high grid voltage of 220 kv or 66 kv from stable grid substations and further transmission & distribution is done by the Metro Authority itself Source of power Supply The high voltage power supply network of Bangalore city was studied in brief. The city has got 220 kv and 66 kv network to cater to the various types of demand. 220 kv sub-stations are generally located at outskirts of the city. 66 kv sub-stations are located near to the alignment. It is proposed to avail power supply for traction as well as auxiliary services at 66 kv voltage levels through single circuit cable feeder. Electric Power requirement for this line is likely to be MVA approximately in year 2021 and which is likely to increase to MVA by the year Under normal conditions, this power will be supplied by the RSS at Silk Board Junction. The capacity of transformers may be reviewed considering the load requirement/distribution of the corridor at the time of detailed design and for the purpose of ease of replacability and for reducing the requirement of spares, similar capacity of transformers (as being provided at other RSS) may be preferred. While in case of failure of power supply from this Silk Board Junction RSS, power requirement will be provided by RSS at K R Puram/Baiyappanahalli. The transformers capacity of 25 MVA may be reviewed accordingly or space for adding one transformer of 33 kv may be carved out in the RSS layout) for future requirement. Bangalore Metro Phase-IIA DPR : K.R.Puram Silk Board October 2016 Page 8-2
121 CHAPTER 8 POWER SUPPLY, SYSTEM OF TRACTION AND POWER TARIFF Corridor/Line Silk Board Junction to K R Puram Table 8.2 Sources of Power Supply KPTCL Grid sub-station (GSS) (Input source) HSR Layout (220/66 kv) NIMHANS (220/66 kv) Jayadeva (66 kv) St. Johns (66 kv) Adugodi (66 kv) Koramangala(66 kv) Hoody (220/66 kv) HAL (220/66 kv) ITI (66 kv) Bagmane WTC (66 kv) Location of RSS of Metro Authority Silk Board Junction K R Puram/ Baiyappanahalli At the stage of detailed design and engineering, the 66 kv input sources from KPTCL GSS may be suitably chosen in consultation and agreement with KPTCL. RSS layout and power supply arrangement proposed is similar to Phase I RSSs. The summary of expected power demand from receiving sub-stations is given in Table 8.3: Table 8.3 Power Demand Corridor RSS Peak demand Normal (MVA) Peak demand Emergency (MVA) Year (2021) Year (2031) Year (2041) Year (2021) Year (2031) Year (2041) Silk Board Junction to K R Puram RSS at Silk Board Junction RSS at K R Puram Normal (MVA) Both the RSS are sharing the loads Emergency (MVA) Only one RSS in service The 66 kv power supply will be stepped down to 33 kv level at the above RSSs of metro authority. The 33 kv power supply drawn from the RSS will be distributed along the alignment through 33 kv Ring main cable network for feeding to traction as well as auxiliary loads. These cables will be laid in dedicated ducts/hangers/brackets along the viaduct. Interconnection of 33 kv power supply between the corridors i.e, Reach 5 & Reach 1 Extension has been planned at Silk Board Junction and K R Puram Station respectively, which can be used for transfer of power from one corridor to other in emergency situation. However, in case of total grid failure, trains will come to stop but station lighting, ventilation & other essential services can be catered to by stand-by DG sets. Therefore, the proposed scheme is expected to ensure adequate reliability and cater to emergency situations as well. Bangalore Metro Phase-IIA DPR : K.R.Puram Silk Board October 2016 Page 8-3
122 CHAPTER 8 POWER SUPPLY, SYSTEM OF TRACTION AND POWER TARIFF The 66 kv cables will be single core XLPE insulated with 630 sq.mm copper conductor. The cables shall be laid through public pathways to RSSs of Metro Authority. Both the RSS shall be provided with 2 nos. (1 as standby) 66/33 kv, 3 phase main receiving transformers for feeding to traction as well as auxiliary loads. In the normal condition both the RSS shall be sharing the loads i.e., feeding half of the section. In case of failure/interruption of power supply to any one of the RSS, the other RSS shall feed the entire line. Conventional outdoor type 66 kv switchgear is proposed for RSS to be located in approx. 60m x 80m (4800 sqm) land plot. Gas Insulated Switchgear (GIS), though requires less space (approximately half) & less maintenance, is not proposed because of high capital cost. However, requirement and feasibility of GIS can be assessed at detailed design and engineering stage. The typical RSS layout as being used in Phase-1may be followed. 8.3 DESIGN CRITERIA FOR POWER SUPPLY AND TRACTION SYSTEM: Train Operation Plan envisages running of trains is 6 cars with 4 mins headway for year 2021, 3 mins in 2031 and 2.5 mins to year Initially equipment will be installed to cater the expected power requirements during initial years of operations. As and when the traffic builds up in year 2031 & 2041, the power supply system will need slight augmentation by way of adding traction transformer-rectifier sets Train Operation Plan Train operation plan considered: Year Peak Headway in mins Table 8.4 Train Operation Plan Train No. of trains in configuration# service during peak No. of train trips per direction per day hours car car car # DMC - TC - MC + MC TC DMC Traction Sub-stations (33 kv/750 V DC) Traction sub-stations (33 kv/750 V DC) are required to be set up for feeding 750 V DC power supply to the third rail. In order to cater to traction load as per design criteria, it is envisaged to provide traction sub-stations (TSS) at alternate stations and also at terminal station which is to be determined by simulation studies as well. The requirement comes to 10 TSSs for proposed line as shown in the power supply schematic drawing attached as Figure 8.1. The TSS along with Auxiliary Sub-Stations (ASS) will be located at station building itself at concourse level inside a room. Self-cooled, cast resin dry type rectifier-transformer is proposed, which is suitable for indoor application. From the traction sub-stations, 750 V DC cables will be laid upto third rail and return current cables will be connected to running rails. Bangalore Metro Phase-IIA DPR : K.R.Puram Silk Board October 2016 Page 8-4
123 CHAPTER 8 POWER SUPPLY, SYSTEM OF TRACTION AND POWER TARIFF Rating of Major Equipment Based on emergency demand expected at each RSS as shown in Table 8.3, 2 nos. 66/33 kv main receiving transformers of 2 x 25 MVA capacity at Silk Board Junction, one to be in service and second one to serve as standby. The RSS to be located at K R Puram/Baiyappanahalli end will be provided 2 x 25 MVA with a provision for future with 1 x 25 MVA to cater further extension. The 66 kv cable shall be 3-phase single core XLPE insulated with 630 mm2 Copper conductor to meet the normal & emergency loading requirements and fault level of the 66 kv supply. Traction transformer-rectifier set (33 kv/750 V DC) shall be of 2.8 MW rated continuous capacity with overload requirement of 150% for 3 hours and 300% for 1 minute. The traction transformer - rectifier set shall produce 750 V DC nominal output voltage with 12-pulse rectification so as to minimize the ripple content in the output dc voltage. During detailed design and engineering stage, feasibility of using 24 pulse rectifier/reversible TSS can also be explored. All the connected equipment of traction i.e., 33 kv switchgear, rectifier transformer, bus duct, rectifier, HSCB, negative return panel, DC cables, third rail etc., shall comply with the overload duty cycle 100% continuous, 150% for 3 hours and 300% for 1 minute all in sequential. The IEC 60850: (Railway applications Supply voltages of traction systems) envisages the maximum and minimum voltages for 750 V DC system with regenerative braking is as under: Table 8.5 Lowest, Nominal and Permanent Voltage Lowest permanent voltage Nominal voltage Highest permanent voltage Highest nonpermanent voltage Umin1 Un Umax1 Umax2 V V V V DC equipment shall be capable of giving desired performance in above mentioned voltage range. 33 kv cable network shall be adequately rated to transfer requisite power during normal as well as emergency situations and to meet the fault current requirement of the system. Accordingly, proposed 33kV cables sizes are as under:- 3 core x 400 mm2 copper from RSS to 33 kv cable network (nearest ASS/TSS) 3 core x 300/240 mm2 copper for 33 kv ring main cable network. Entire 33 kv cables shall be 3 phase, XLPE insulated with copper conductors. Cables shall be of FRLS (Fire Retardant Low Smoke)/ FRLSOH (Fire Retardant Low Smoke Zero Halogen) as section envisaged is elevated. Adequate number of cables are required for transfer of power from TSS to third rail. Single phase XLPE insulated cables with 300 mm2 copper conductor are proposed for 750 V DC as well as return current circuit. Positive cables shall be of 3.3 kv insulation class and negative/return cables of Bangalore Metro Phase-IIA DPR : K.R.Puram Silk Board October 2016 Page 8-5
124 CHAPTER 8 POWER SUPPLY, SYSTEM OF TRACTION AND POWER TARIFF minimum 1.1 kv insulation class. Based on current requirements, 4 x 1C x 300 mm2 cables are required for each of the four runs to feed power to third rail and accordingly 6 x 1C x 300 mm2 cables for each track for return circuit. The above capacities of transformers, cables etc. have been worked out based on the conceptual design and therefore, these capacities may be required to be fine tuned during design stage of project implementation Third RAIL AND STINGER SYSTEM Third rail with bottom collection system with shroud on top and sides is proposed considering the safety, which is also the prevailing arrangement in Phase A rating conductor rail is proposed and the manufacturing process can be co-extrusion, mechanically embossed, mechanically welded etc., which complies with the required contact resistance between aluminum & stainless steel and with proven record. In order to avoid third rail in the maintenance areas from safety point of view, stinger is proposed in inspection bay lines similar to Bangalore Metro Phase I. 8.4 AUXILIARY SUPPLY ARRANGEMENTS FOR STATIONS & DEPOT Auxiliary sub-stations (ASS) are envisaged to be provided at each station. A separate ASS is required at Whitefield depot. The ASS will be located at mezzanine/concourse level inside a room. Wherever TSS is required, ASS & TSS will be housed together inside a room. The auxiliary load requirements have been assessed to be about 500 kva for elevated, accordingly two dry type cast resin transformers (33/0.415 kv) of 500 kva for elevated stations (with one transformer as standby) are proposed to be installed. The Depot ASSs will also be provided with 2 x 1500 kva auxiliary transformers. 8.5 STANDBY DIESEL GENERATOR (DG) SETS In the unlikely event of simultaneous tripping of two RSSs or grid failure, the power supply to stations as well as to trains will be interrupted. It is, therefore, proposed to provide standby DG set of 180 kva capacity at elevated stations to cater the following essential services: I. Lift operation II. Essential lighting at Stations and on viaduct on account of emergency evacuation III. Ventilation requirements of stations IV. Signaling & telecommunications V. Fire fighting system VI. (vi) Platform screen gates (PSG) Bangalore Metro Phase-IIA DPR : K.R.Puram Silk Board October 2016 Page 8-6
125 CHAPTER 8 POWER SUPPLY, SYSTEM OF TRACTION AND POWER TARIFF Silent type of DG sets are proposed which have low noise levels and do not require separate room for installation. 8.6 SUPERVISORY CONTROL AND DATA ACQUISITION (SCADA) SYSTEM The entire system of power supply (receiving, traction & auxiliary supply) shall be monitored and controlled from a centralized Operation Control Centre (OCC) through SCADA system. Modern SCADA system with intelligent remote terminal units (RTUs) shall be provided. Optical fibre provided for telecommunications will be used as communication carrier for SCADA system. Digital Protection Control System (DPCS) is proposed for providing data acquisition, data processing, overall protection control, interlocking, inter-tripping and monitoring of the entire power supply system consisting of 66/33 kv ac switchgear, transformers, 750 V DC switchgear and associated electrical equipment. DPCS will utilize microprocessor-based fast-acting numerical relays & Programmable Logic Controllers (PLCs) with suitable interface with SCADA system. 8.7 EMERGENCY TRIP SYSTEM (ETS) Emergency Trip System (ETS) shall be provided at platform ends, station control room TSS in accordance with the requirements of NFPA-130. ETS can be operated by passengers and metro staff in case of emergency situations to disconnect the power supply to the train(s). Operation of ETS push button will result in tripping of relevant section of third rail in order to stop the trains in that section. An interlock to be incorporated with the signaling system to block the train(s) entering the station/section of the ETS pressed. ETS cable shall be fire rated for one hour at 5000 C. ETS cabinet housing shall be constructed of steel, painted with international orange, with the Blue light on the facia and red mushroom-shaped heavy duty push button capable of being padlocked in a locked position when pressed, can only be reset by a master key. The tripping logics are to be hardwired and locally functional i.e., not through SCADA. 8.8 STRAY CURRENT CORROSION PROTECTION MEASURES Concept of dc Stray Current Corrosion In dc traction systems, bulk of return current finds its path back to the traction sub-station via the return circuit i.e. running rails. The running rails are normally insulated to minimize leakage of currents to the track bed. However, due to leaky conditions, some current leakage takes place, which is known as stray current. The current follows the path of least resistance. Return current deviates from its intended path if the resistance of the unintended path is lower than that of intended path. The stray current may flow through the unintended path of metallic reinforcements, civil structures, public utilities etc., of the structure back to the substation. It is also possible that part of the stray current may also flow into soil, where it may be picked up by metallic utilities and discharged back to soil and then to near the sub-station. Bangalore Metro Phase-IIA DPR : K.R.Puram Silk Board October 2016 Page 8-7
126 CHAPTER 8 POWER SUPPLY, SYSTEM OF TRACTION AND POWER TARIFF The dc stray currents cause metal detraction in watery (aqueous) electrolytes as per the following chemical reactions:- Stray current enters in the metal 2H2O + 2e- H2 + 2OH- (development of Hydrogen gas) Stray current exits from metal Fe Fe2+ + 2e- (Fe2+ ions migrate away from the metal) That is how, dc stray currents cause corrosion of metallic structure where it leaves the metal. Pitting and general form of corrosion are most often encountered on DC electrified railways Effect of Corrosion Detraction rate of metals can be calculated by Faraday s First Law: m = c.i.t Where m = mass (kg) c = Coefficient of detraction (kg/amp.year) i = Current (Amp) t = time (year) c = 2.90 for Aluminium = for Lead = 9.13 for Iron = 10.4 for Copper That means dc stray current of 1 Ampere flowing continuously can eat away approx. 9 kg of steel in a year. If 5000 amperes of current flows for one year to power the trains on a transit system, and that 2 percent of this current (100 amperes) leaks as stray current, the amount of steel metal loss is 0.9 ton per year. Therefore, the safety implications are considerable for structural reinforcements. In addition, corrosion may also affect neighboring infrastructure components such as buried pipelines and cables Measures for Protection against Stray Current Corrosion Earthing & bonding and protection against stray current corrosion are interrelated and conflicting issues. Therefore, suitable measures are required to suppress the stray currents as well as the presence of high rail potentials. Safety of personnel is given preference even at a cost of slightly increased stray currents. Following measures are required to restrict the stay current:- I. Decreasing the resistance of rail-return circuit by usage of low resistance rails, long welded rails, suitably cross-bonding between rails and tracks, running insulated parallel conductors etc., Bangalore Metro Phase-IIA DPR : K.R.Puram Silk Board October 2016 Page 8-8
127 CHAPTER 8 POWER SUPPLY, SYSTEM OF TRACTION AND POWER TARIFF II. Increasing the resistance of rail to ground insulation by providing suitable fastening system for DC railway Whenever buried pipes and cables are in the vicinity of DC railway, efforts shall be made to ensure that metal parts are kept away as far as practicable to restrict stray current by means of isolation and insulation. Generally, 3 types of earthing arrangements (viz. Earthed System, Floating System & Hybrid Earthing System) are prevalent on metros Worldover for protection against stray current corrosion. Traditionally, Earthed system was used by old metros. Hybrid earthing system is being tried on experimental basis on few new metros. Floating system has been extensively used by recent metros. As per the trends World over, floating system (i.e. traction system with floating negative) is proposed which reduces the dc stray current to considerable level. The arrangement shall comply with following latest CENELEC standards:- EN : Railway applications - Fixed installations - Electrical safety, earthing and the return circuit - Part 1: Protective provisions against electric shock EN :- Railway applications - Fixed installations - Electrical safety, earthing and the return circuit - Part 2: Provisions against the effects of stray currents caused by d.c. traction systems The conceptual scheme of proposed floating system is described below:- I. The running rails shall be adequately insulated as per EN The worst conductance per unit length for single track sections are as under:- Elevated section: 0.5 Siemens/km II. Stray Current Collector Cables {commonly known as structural earth (SE) cable} of suitable size (calculated in accordance with EN ) shall be provided along the viaduct and all the metallic parts of equipment, cable sheath, viaduct reinforcement, signal post etc. shall be connected to SE cable. III. The longitudinal continuity of the reinforcement bars of the viaduct as well as track slabs has to be ensured along with a tapping point for connection with SE cable in order to drain back the stray current. IV. A provision shall be made to earth the running rail (i.e. negative bus) in case of rail potential being higher than limits prescribed in relevant standard (EN ) in order to ensure safety of personnel. This will be achieved by providing track earthing panel (TEP)/over voltage protection device (OVPD) in all stations irrespective of ASS or ASS/TSS. V. Provisions shall be made on the structures for measurement of average potential shift +200 mv for steel in concrete structures. VI. In addition, stray current assessment by continuous monitoring rail insulation assessment using rail potential in accordance with EN to be installed in OCC for monitoring of the rail potential supports the supervision of the continuity of the return circuit, detects connections between the return circuit and earth and degradation of insulation in rail fastenings. Bangalore Metro Phase-IIA DPR : K.R.Puram Silk Board October 2016 Page 8-9
128 CHAPTER 8 POWER SUPPLY, SYSTEM OF TRACTION AND POWER TARIFF I. Measurements recommended in EN to be practiced to ensure the stray currents are not deteriorating the metro railway structures and public structures/utilities as well Special Arrangements in Depot A separate traction sub-station (TSS) shall be provided for depot so as to facilitate isolation of depot traction supply from mainlines in order to prevent the leakage of return currents to depot area. Tracks of Depot area shall also be isolated from mainline through insulated rail joints (IRJ). Remote operated disconnection/sectionalizing switches shall be provided to feed power from depot to mainline and vice-versa in case of failure of depot TSS and nearest mainline TSS. The prescribed limit of highest touch potential in depot is 60V as per EN and therefore Track Earthing Panels (TEP)/Over Voltage Protection Device (OVPD) shall be provided at suitable locations to earth the rail in case the rail potential exceeds this limit. 8.9 ELECTROMAGNETIC INTERFERENCE (EMI) AND ELECTROMAGNETIC COMPATIBILITY (EMC) The rectifier-transformer used in DC traction system produces harmonic voltages, which may cause interference to telecommunications and train control/protection systems. The rectifier-transformer shall be designed with the recommended limits of harmonic voltages, particularly the third and fifth harmonics. The proposed 12-pulse rectifier-transformer reduces the harmonics level considerably. Detailed specification of equipment e.g. power cables, rectifiers, transformer, E&M equipment etc shall be framed to reduce conducted or radiated emissions as per appropriate international standards. The Metro system as a whole (trains, signaling & telecomm, traction power supply, E&M system etc) shall comply with the EMC requirements of international standards viz. EN50121, EN50123, IEC61000 series etc. A detailed EMC plan will require to be developed during project implementation stage ENERGY SAVING MEASURES Energy charges of any metro system constitute a substantial portion of operation & maintenance (O & M) costs. Therefore, it becomes imperative to incorporate energy saving measures in the system design itself. The proposed system of Bangalore Metro includes the following energy saving features: I. Modern rolling stock with 3-phase VVVF drive and light-weight stainless steel coaches has been proposed, which has the benefits of low specific energy consumption and almost unity power factor. Therefore, suitable system for recuperation of braking energy to be considered during detailed design and engineering stage. II. Rolling stock has regeneration features and it is expected that 20% of total traction energy will be regenerated and fed back to 750 V DC third rail to be consumed by nearby trains. III. Use of energy efficient LED lights and fittings is proposed. The lighting system of the stations will be provided with different circuits (33%, 66% & 100%) and the relevant circuits can be switched on based on the requirements (day or night, operation or maintenance hours etc). Bangalore Metro Phase-IIA DPR : K.R.Puram Silk Board October 2016 Page 8-10
129 CHAPTER 8 POWER SUPPLY, SYSTEM OF TRACTION AND POWER TARIFF IV. Machine-roomless type lifts with gearless drive have been proposed with 3-phase VVVF drive. These lifts are highly energy efficient. V. The proposed heavy-duty public service escalators will be provided with 3-phase VVVF drive which gives energy efficiency & improved power factor. Further, the escalators will be provided with infra-red sensors to automatically reduce the speed (to idling speed) when not being used by passengers. VI. The latest state of art and energy efficient electrical equipment (e.g. transformers, motors, light fittings etc) have been incorporated in the system design. VII. Efficient energy management is possible with proposed modern SCADA system by way of maximum demand (MD) and power factor control. VIII. Solar panels to harvest the solar energy available on the station roofs, depot, parking and top of the buildings 8.11 ELECTRIC POWER TARIFF The cost of electricity is a significant part of Operation & Maintenance (O&M) charges of a metro system and it is expected to constitute about 20-30% of total annual operating cost. Therefore, it is the key element for the financial viability of the Project. The annual energy consumption is assessed to be about 67.7 million units in initial years (2021), which will reach million units by horizon year The detailed calculations of Power Requirements are given at Table 8.2. In addition to keep the energy consumption to optimum, it is also necessary that the electric power tariff be kept at minimum in order to contain the O& M costs. Therefore, the power tariff for Bangalore Metro should be at effective rate of purchase price (at 66kV voltage level) plus nominal administrative charges i.e. no profit no loss basis. It is proposed that Government of Karnataka take necessary steps to fix power tariff for Bangalore Metro at No Profit No Loss basis. Financial analysis has been carried out based on this tariff for the purpose of finalizing the DPR. Similar approach is being adopted in other Metros in India. Bangalore Metro Phase-IIA DPR : K.R.Puram Silk Board October 2016 Page 8-11
130 CHAPTER 8 POWER SUPPLY, SYSTEM OF TRACTION AND POWER TARIFF Table 8.6 POWER REQUIREMENTS Traction power requirements Year 2021 Year 2031 Year 2041 No of cars 6 (2DMC+2TC +2MC) 6 (2DMC+2TC+ 2MC) 6 (2DMC+2TC +2MC) Tare weight of train 222 T 222 T 222 T Passenger weight 130 T 130 T 130 T Total Train weight 352 T 352 T 352 T Length (Route km) 17 km 17 km 17 km Headway (during peak hours) 4 mts 3 mts 2.5 mts Specific Energy Consumption (SEC) 75 KWhr/1000 GTkm 75 KWhr/1000 GTkm 75 KWhr/1000 GTkm Power demand from one train set 0.79 MW 0.79 MW 0.79 MW No. of train sets in opeartion 17 Train sets 22 Train sets 27 Train sets during peak hour Total traction demand MW MW MW Less 2.69 MW 3.48 MW 4.27 MW Depot traction power requirement 1.0 MW 1.25 MW 1.25 MW Net traction power requirement MW MW MW Total traction power requirement (MVA) assuming 5% energy losses and.95 pf for traction MVA MVA MVA loads. Station auxiliary power requirement Elevated station load 0.20 MW 0.30 MW 0.40 MW No. of elevated stations Total auxiliary power requirement 2.6 MW 3.9 MW 5.2 MW Depot auxiliary power requirement 0.0 MW 0.0 MW 0.00 MW Total auxiliary power requirement 2.6 MW 3.9 MW 5.2 MW Total auxiliary power requirement (MVA) assuming 5% energy losses and.85 pf for auxiliary loads MVA 4.82 MVA 6.42 MVA Total traction & aux power requirement (MW) MW MW MW Total power requirement (MVA) assuming 5% energy losses and.95 &.85 pf for traction & aux MVA MVA MVA loads respectively Note:- Property Development (PD) requirement not considering in estimation of power calculation. Depot auxiliary load has been considered 0 MW, as already Depot ASS exists in Baiyappanahalli Depot TSS has been considered for feeding the section from Baiyappanahalli Depot to K R Puram Bangalore Metro Phase-IIA DPR : K.R.Puram Silk Board October 2016 Page 8-12
131 CHAPTER 8 POWER SUPPLY, SYSTEM OF TRACTION AND POWER TARIFF Table 8.7 ENERGY CONSUMPTION Year Year 2021 Year 2031 Year 2041 No of cars 6 (2DMC+2T C+2MC) 6 (2DMC+2TC +2MC) 6 (2DMC+2TC +2MC) Length (Route km) 17 KM 17 KM 17 KM No. of trains per direction in a day* Weight of train and passenger 352 T 352 T 352 T SEC (net) with 20% regen 60 Yearly traction energy consumption with 365 days working with 20% regen Station aux power requirement KWH/1000 GTKM 60 KWH/1000 GTKM 60 KWH/1000 GTKM million units million units million units Elevated 0.20 MW 0.30 MW 0.40 MW No. of elevated stations Depot auxiliary power requirement 0 MW 0 MW 0 MW Total auxiliary power requirement 2.6 MW 3.9 MW 5.2 MW Total auxiliary power requirement (MVA) assuming 5% energy losses and.85 pf for aux loads 3.2 MVA 4.8 MVA 6.4 MVA Diversity factor of auxiliary loads Yearly auxiliary energy consumption 20 hrs/day and 365 days working (million units) 9.96 million units million units million units Net Annual Energy Consumption (Traction & Auxiliary) 67.7 million units 98.9 million units million units Note:- PD energy not considering in estimation of energy calculation. Bangalore Metro Phase-IIA DPR : K.R.Puram Silk Board October 2016 Page 8-13
132 CHAPTER 8 POWER SUPPLY, SYSTEM OF TRACTION AND POWER TARIFF Figure 8.1 Power Supply Arrangements Bangalore Metro Phase-IIA DPR : K.R.Puram Silk Board October 2016 Page 8-14
133 CHAPTER 9 ROLLING STOCK 9 ROLLING STOCK 9.1 BACKGROUND KR Puram to Silk board section (Line no.7) is to be operated with CBTC signaling system and with the existing Schedule of Dimension (SOD) so that with changes in onboard signaling, coaches can be interchanged in other reaches/sections with 750 V DC systems as per the requirements. However, the governing factor for deciding the requirements of coaches, forecasted Peak Hour Peak Direction Traffic (PHPDT) of this line was taken into consideration. To facilitate the ease in operation, the present Baiyappanahalli depot is planned to cater the maintenance requirement of the new line 7 and in place of Baiyappanahalli depot a new depot is planned to be constructed at Whitefield for East-West Corridor. In addition, a major depot at Challagatta in west end of East-west corridor is under construction and new depot at Kadugodi in Phase-II which can cater for maintenance of Rakes together for the year Salient features of Coach Dimension & performance parameters have been described in the following para:- 9.2 SIZE OF COACH Since the maintenance of the rake of line 7 will be done at baiyappanahalli depot which has already been constructed in compliance to the schedule of dimensions, it is proposed to adopt the schedule of dimension of line 7 is same as schedule of dimension of line 1. As such the dimensions of the coach of line 7 shall be same as dimensions of the coach of phase 1 Rolling Stock. Accordingly optimum size of the coach, as opted for Line 7 has been chosen for this corridor as mentioned in Table 9.1. Table Size of the coach Length* Width Height Driving Motor Car (DMC) m 2.88 m 3.8 m Trailer car (TC)/Motor Car (MC) 20.8 m 2.88 m 3.8 m * Over the body excluding coupler length. 9.3 PASSENGER CARRYING CAPACITY In order to maximize the passenger carrying capacity, longitudinal seating arrangement shall be adopted. The whole train shall be vestibule to distribute the passenger evenly in all the coaches. Criteria for the calculation of standing passengers are 4 persons per square meter of standing floor area in normal state (AW2) and crush load 6 persons standee per sq meter (AW3) and exceptional dense crush load of 8 persons/sq meter (AW4). Bangalore Metro Phase-IIA DPR : K.R.Puram Silk Board October 2016 Page 9-1
134 CHAPTER 9 ROLLING STOCK Therefore, for the Rail Vehicles with 2.88 m maximum width and longitudinal seat arrangement, conceptually the exceptional dense crush capacity (AW4) of 43 seated, 273 standing thus a total of 316 passengers for a Driving Motor Car, and 50 seated, 293 standing thus a total of 343 for a trailer and motor car is envisaged. Following train composition is recommended: 6-car Train: *DMC TC MC+MC TC DMC* This train composition has been adopted in Phase II for 6-Car train composition. Also this composition is used in DMRC RS10 project. Thus for line 7, it is recommended to adopt the above composition only. Table 9.2 and 9.3 shows the carrying capacity of the individual cars and 6-Car train set with standing 4 passenger per sq meter of standee area, with standing 6 passenger per sq meter of standee area 8 passenger per sq meter of standee area respectively. The seating and Standee capacity of DMC, MC and TC in the unit of *DMC TC MC+MC TC DMC* with external sliding door are given as under Table 9.2:- Table 9.2 Carrying Capacity of Mass Rail Vehicles (Crush@6 P/sqm of standee area) Driving Motor car Trailer car / Motor car 6 Car Train Normal Crush Normal Crush Normal Crush Seated Standing Total NORMAL ( AW2) -4 P/sqm of standee area CRUSH ( AW3) -6 P/sqm of standee area Table 9.3 Carrying Capacity of Mass Rail Vehicles (Exceptional dense P/sqm of standee area) Driving Motor car Trailer car / Motor car 6 Car Train Normal Crush Normal Crush Normal Crush Seated Standing Total NORMAL (AW2) - 4 P/sqm of standee area EXCEPTIONAL DENSE CRUSH (AW4) - 8 P/sqm of standee area Bangalore Metro Phase-IIA DPR : K.R.Puram Silk Board October 2016 Page 9-2
135 CHAPTER 9 ROLLING STOCK Based on the experience of Phase I after commissioning of East-West Corridor, it is recommended to adopt AW3 Passenger loading (1574 passengers in 6 car) for calculation of the passenger carrying capacity to meet the projected maximum PHPDT. Whereas, in emergency it shall be possible to carry the passenger under AW4 loading condition. However, axle load is to be calculated under AW4 loading condition. 9.4 WEIGHT The weights of driving motor car, motor car and trailer car have been estimated as in Table 9.4, referring to the experiences in BMRCL Phase I Project. The average passenger weight has been taken as 65 kg. Table Weight of Mass Rail Vehicles (TONNES) DMC TC MC 6 Car train TARE (maximum) Passenger (Normal) (Exceptional Dense Gross (Normal) (Exceptional Dense Crush Axle p/sqm Axle p/sqm The axle 6p/sqm (AW3) of standing area works out in the range of T to T. Heavy rush of passenger, having 8 standees per sq. meter (AW4) can be experienced occasionally. It is advisable to design the coach with sufficient strength so that even with this overload, the design will not result in over stresses in the coach. Coach and bogie should, therefore, be designed for 15 T axle load. Hence it is recommended to procure Rolling Stock for new Line 7 with maximum axle load of 15 T only. 9.5 PERRFORMANCE PARAMETERS The recommended performance parameters are: I. Maximum Design Speed : 90 Kmph II. Maximum Operating Speed : 80 Kmph Traction Performance I. Average acceleration rate from 0 to 30 km/h : 1 m/s² ± 5% II. Jerk : 0.7 m/s3 ± 0.05 Bangalore Metro Phase-IIA DPR : K.R.Puram Silk Board October 2016 Page 9-3
136 CHAPTER 9 ROLLING STOCK Brake Performances I. Average service deceleration from 80 to 0 km/h : 0.95 m/s² ± 5% II. Instantaneous full service deceleration : 1.1 m/s² III. Maximum jerk (d /dt) : 0.7 m/s3 ± 0.05 IV. Minimum average emergency deceleration : 1.3 m/s² Speed vs. Time curve Torque vs. Speed characteristics. Constant torque zone in powering is recommended up to a speed of 30 Kmph. Constant torque zone in braking is recommended up to a speed of 60 Kmph to maximize the regenerated energy. 9.6 COACH DESIGN AND BASIC PARAMETERS The important criteria for selection of rolling stock are as under: I. Proven equipment with high reliability II. Passenger safety feature III. Energy efficiency IV. Light weight equipment and coach body V. Optimized scheduled speed VI. Aesthetically pleasing Interior and Exterior VII. Low Life cycle cost VIII. Flexibility to meet increase in traffic demand IX. Anti-telescopic The controlling criteria are reliability, low energy consumption, lightweight and high efficiency leading to lower annualized cost of service. The coach should have high rate of acceleration and deceleration. 9.7 SELECTION OF TECHNOLOGY Low life cycle cost is achieved by the way of reduced scheduled and unscheduled maintenance and high reliability of the sub-systems. It is possible to achieve these objectives by adopting suitable proven technologies. Selection of technologies has been recommended to ensure low life cycle cost Car body It is now a standard practice to adopt stainless steel or aluminum for car body. However, the car bodies with aluminum require long and complex extruded sections which are still not manufactured in India. Therefore aluminum car body has not been considered for use. With the improvement in Steel manufacturing technology, now it is possible to manufacture austenitic steel with carbon percentage of 0.03% and this increases the mechanical strength and hence it is possible to manufacture light weight stainless steel car body with higher mechanical strength and therefore, high tensile austenitic stainless steel with carbon content not more than 0.03% car bodies have been specified. No corrosion repair is necessary on stainless steel cars during their service life. Bangalore Metro Phase-IIA DPR : K.R.Puram Silk Board October 2016 Page 9-4
137 CHAPTER 9 ROLLING STOCK It also results in cost saving due to easy maintenance and reduction of repair cost from excellent anti corrosive properties as well as on improvement of riding comfort and safety in case of a crash or fire Bogies Bolster less lightweight fabricated bogies with conical rubber springs are now universally adopted in metro cars. These bogies require less maintenance and overhaul interval is also of the order of 520,000 km. Use of air spring at secondary stage is considered with a view to keep the floor levels of the cars constant irrespective of passenger loading unlike those with coil spring. Perturbation from the track is also dampened inside the car body on account of the secondary air spring along with suitable Vertical Hydraulic Damper. The primary suspension system improves the curve running performance by reducing lateral forces through application of conical rubber spring. A smooth curving performance with better ride index is being ensured by provision of above type of bogies Brake System The brake system shall consist of:- Compressed air supply by an oil free piston type air compressor and air dryer unit. An electro-pneumatic, microprocessor controlled direct service brake which performs the blending function depending on the brake demand signal and the dynamic brake performance. I. A fail safe, pneumatic friction emergency brake. II. A pneumatic indirect BP backup brake which is applied during rescue operation or in case of failure of direct service brake. III. A spring applied air-release parking brake. IV. Air applied holding brake. V. An electric regenerative service brake. VI. Provision of smooth and continuous blending of EP and regenerative braking Direct service brake is blending of Electro-Pneumatic brake (EP) and Electro-Dynamic brake (ED). The electro-dynamic (ED) brake shall take priority over the electro-pneumatic friction brake (EP) and full use of its capability shall be made in attaining any rate of service braking. The objective is to use the regenerative brake to the maximum degree possible in order to reduce wear on the friction brakes. The ED (regenerative braking) brake will be the main brake power of the train and will regenerate energy during braking and part of the regenerated energy is used by the auxiliary circuit of the train and the balanced is pumped back in to third rail system. The Electro-dynamic braking is possible because of the adoption of 3-Phase technology. To maximize the regenerated energy, it is recommended to extend the constant torque zone in braking up to 60 Kmph. Further it is recommended to improve the logic of ED brake so that in case of failure of any driving motor car/ motor car, ED brake by the other driving motor /motor car is increased automatically by the propulsion system. Bangalore Metro Phase-IIA DPR : K.R.Puram Silk Board October 2016 Page 9-5
138 CHAPTER 9 ROLLING STOCK During the stopping of the train when ED brake starts fading out, the propulsion system detects the fading out of ED brake and correspondingly holding brake (EP) is applied by the brake system to ensure safety of the train in case of ED becoming zero. In addition, speed sensors mounted on each axle, control the braking force of the axles with anti skid valves, prompting re-adhesion in case of a skid.the brake actuator shall operate either a tread brake or a wheel mounted disc brake, and preferably a wheel mounted disc brake. In Phase I Rolling Stock, oil free piston type compressor was used to avoid the frequent need to toping of oil in the compressor. These oil free compressors have been in service in Reach-1 for more than 4 years and so far no failure case was reported. As such it is recommended to use oil free piston type compressor only. To improve the overall reliability of brake system, it is recommended to adopt brake system with Ethernet backbone where it shall be possible to feed MR pressure in the failed train from the healthy train and also braking can be controlled from the healthy train in the failed train Propulsion System Technology The brush less 3 phase induction motors which is lighter in weight and ideally suited for rail based Mass Rapid Transit applications is proposed to be used for this corridor. The motor tractive effort and speed is regulated by Variable Voltage and Variable frequency control and can be programmed to suit the track profile and operating requirements. Another advantage of 3 phase a.c. drive and VVVF control is that regenerative braking can be introduced by lowering the frequency and the voltage to reverse the power flow and to allow braking to very low speed. Also, it is self-ventilated, highly reliable, robust construction and back up by slip/slide control, hence same have been recommended for adoption. The DC voltage from the 3rd Rail is stepped up through a STEP up Chopper to DC link voltage, which feeds Inverter operated with Pulse Width Modulation (PWM) control technology and using insulated Gate Bipolar Transistors (IGBT). Thus three-phase variable voltage variable frequency output drives the traction motors for propulsion. Recently advanced IGBT has been developed for inverter units. The advanced IGBT incorporates its own over current protection, short circuit protection; over temperature protection and low power supply detection. The inverter unit uses optical fiber cable to connect the control unit to the gate interface. This optical fiber cable transmits the gate signals to drive the advanced IGBT via the gate interface. The optical fiber cable provides electrical isolation between the advanced IGBT and the control unit and is impervious to electrical interference. These are recommended for adoption in trains of this corridor Interior and Gangways Passenger capacity of a car is maximized in a Metro System by providing longitudinal seats for seating and utilizing the remaining space for standing passenger. Therefore all the equipments are mounted on the under frame for maximum space utilization. The gangways are designed to give a Bangalore Metro Phase-IIA DPR : K.R.Puram Silk Board October 2016 Page 9-6


139 CHAPTER 9 ROLLING STOCK wider comfortable standing space during peak hours along with easy and faster passenger movement especially in case of emergency. However, detailed design to be finalized at Mock-up stage. Figure 9.1 Interior View of Metro Train Passenger Doors For swift evacuation of the passenger in short dwell period, four doors of minimum 1400mm width, on each side of the coach have been considered. These doors shall be of such dimensions and location that all the passenger inside thee train is able to evacuate within least possible timee without conflicting movement. As the alignment passes through elevated section above ground, automatic door closing mechanism is envisaged from consideration of passenger safety. Passenger doors are controlled electrically by a switch or Pushbutton in Driver cab. Electrically controlled door operating mechanism has been preferred over pneumatically operated door to avoid cases of air leakage and sluggish operation of doors. The door shall be of Bi-parting Sliding Type as in the existing coaches of BMRCL. In the present design of door leaf, top aluminium skin is bonded over aluminiumm honeycomb and bonding between these two materials is frequently failing and as such door swelling problems are being observed in several Rolling Stock Projects. Thus it is recommended to adopt a new door design with single material without any bonding. Bangalore Metro Phase-IIA DPR : K.R.Puram Silk Board October 2016 Page 9-7

140 CHAPTER 9 ROLLING STOCK Figure 9.2 Passenger Doors Air conditioning With heavy passenger loading of 6 p/sqm for standee area and doors being closed from consideration of safety and with windows being sealed type to avoid transmission of noise, air conditioning of coaches has been considered essential. Each coach shall be provided with two air conditioning units capable of cooling, heating and dehumidifying and thus automatically controlling interior temperature throughout the passenger area at up to 25 C and relative humidity of 60%RH respectively all the times under varying ambient conditions up to full load. For emergency situations such as power failure or both AC failures etc, ventilation provision supplied from battery will be made. Provision shall be made to shut off the fresh air intake and re-circulate the internal air of the coach, during an emergency condition, such as fire outside the train causing excessive heat and smoke to be drawn in to the coach Cab Layout and Emergency Detrainment Doors. The modern stylish driver panel shall be FRP moulded which give maximum comfort and easy accessibility of different monitoring equipments to the driver along with clear visibility. The driver seat is recommended to be provided either in the middle or in the side of the cab. Bangalore Metro Phase-IIA DPR : K.R.Puram Silk Board October 2016 Page 9-8


141 CHAPTER 9 ROLLING STOCK Figure 9.3 Driving Cab Emergency evacuation is recommended only through the side doors Communication The driving cab of the cars are provided with continuous communication with base Operational Control Center and station control for easy monitoring of the individual train in all sections at all the time. Public Address and Passenger Information Display System is provided in the car so that passengers are continuously advised of thee next stoppage station, final destination station, interchange station, emergency situations if any, and other messages. Station announcement is recommended to be based on the bits provided by ATC. In case of failure of ATC announcement can be made manually. The rolling stock is recommended to be provided with Talk Back Units inside the cars, which permit conversation between passengers and the drivers in case of any emergency. With the improvement in display technology, it is recommended to use Digital interior coving panel for advertisement as well as for station announcement. Display board on Noise and Vibration The trains will pass through heavily populated urban area.the noise and vibration for a metro railway becomes an important criterion from public acceptance view point. The source of noise are (i) rail- conditioner, wheel interaction (ii) noise generated from equipment like Blower, Compressor, airr door, Bangalore Metro Phase-IIA DPR : K.R.Puram Silk Board October 2016 Page 9-9
142 CHAPTER 9 ROLLING STOCK Inverter etc. (iii) traction motor in running train. For elimination and reduction of noise following feature are incorporated: - Provision of anti drumming floor and noise absorption material. Sound absorbent panels to under-frame. Insertion of sound absorbent infill in key-ways of load key place. Low speed compressor, blower and air conditioner. Mounting of under frame equipments on anti-vibration pad. Smooth and gradual control of door. Provision of GRP baffle on the via-duct for elimination of noise transmission. Provision of sound absorbing material in the supply duct and return grill of air conditioner. Sealing design to reduce the aspiration of noise through the gap in the sliding doors and piping holes. The lower vibration level has been achieved by provision of bolster less type bogies having secondary air spring Passenger Safety Features I. ATP/ATO The rolling stock is provided with Continuous Automatic Train Protection to ensure absolute safety in the train operation. It is an accepted fact that 60-70% of the accidents take place on account of human error. Adoption of this system reduces the possibility of human error. The on-board computerized ATC system compares and verifies the continuous actual driving speed of the train with the target speed displayed on Driver Machine Interface (DMI) and in case speed of the train increases beyond the specified limit, Full Service Brake (FSB) and Emergency Brake (EB) are applied by the signaling system (ATC). In ATO mode, the manual function of the driver with respect to driving such as powering, coasting and braking is made automatic through Automatic Train Control (ATC). The Signaling system is recommended to be Communication Based Train Control (CBTC) system as the current Distance To Go (DTG) signaling system implemented in Phase I project has become obsolete. II. Fire The rolling stock is provided with flame-retarded materials having low fire load, low heat release rate, low smoke and toxicity inside the cars. Flammability, Smoke Emission and Toxicity requirements of the material used in the car is recommended to be based on EN standard EN 45545, HL3, Flammable materials shall not be used or contained. Material emitting poisonous gas during combustion will not be used. Bangalore Metro Phase-IIA DPR : K.R.Puram Silk Board October 2016 Page 9-10


143 CHAPTER 9 ROLLING STOCK The insulation of all wires and cables including those used within equipment / subsystem is provided with halogen-free flame-retardant and formulated to minimise generation of smoke, noxious emissions and corrosive fumes. III. Emergency door Each passenger saloon doors is provided with Emergency Egress device to ensure well directed evacuation of passengers in case of any emergency including fire in the train. IV. Crash worthiness features The driving motor car and other cars of the train shall be designed to ensure safety of the train operator in case of collision as specified in EN under the collision scenario in clause-5 of EN15227 for Load Category C-II. The rolling stock is provided with inter car couplers with energy absorption device in the front automatic/ semi-automatic coupler. The car ends is designed to prevent over-riding and telescoping of the car in to anyy passenger area in the event of the collision. The anti-telescoping structure includes elements such as corner post, collision post and anti-climbers. V. Gangways Broad gangways with interior paneling of minimum clear height of 1900mm are provided in between the cars to ensure free passenger movement between cars in case of any emergency. Figure 9.4 Gangway Bangalore Metro Phase-IIA DPR : K.R.Puram Silk Board October 2016 Page 9-11
144 CHAPTER 9 ROLLING STOCK Figure 9.5 Gangway Isometric View The salient features of the proposed Rolling Stock is furnished in Table 9.5 Table 9.5 Salient Features of Rolling Stock for Mass Rapid Transit System S.No. Parameter Details 1 Gauge (Nominal) 1435mm 2 Traction system 2.1 Voltage 750 V dc 2.2 Method of current collection Third Rail Bottom Current Collection System 3 Train composition car train *DMC-TC-MC+MC-TC-DMC* 4 Coach Body Stainless Steel 5 Coach Dimensions 5.1 Height 3.88 m 5.2 Width 2.88 m 5.3 Length over body (approx) - Driving Motor Car (DMC) m - Trailer Car (TC) 20.8 m - Motor Car (MC) 20.8 m Bangalore Metro Phase-IIA DPR : K.R.Puram Silk Board October 2016 Page 9-12
145 CHAPTER 9 ROLLING STOCK Table 9.5 Salient Features of Rolling Stock for Mass Rapid Transit System S.No. Parameter Details 5.4 Floor height 6 Designed - Passenger Loading 6.1 Design of Propulsion equipment 8 Passenger/ m2 6.2 Design of Mechanical systems 10 Passenger/ m2 7 Carrying 8 standees/sqm 7.1 Coach carrying capacity 1130mm (Maximum) for unloaded vehicle, 1100mm (Minimum) for loaded vehicle. DMC 316 (seating - 43 ; standing - 273) TC 343 (seating - 50 ; standing - 293) MC 343 (seating - 50 ; standing - 293) 7.2 Maximum Train Carrying capacity 6 car train 2004 (seating ; standing ) 8 Weight (Tonnes) 8.1 Tare weight (maximum) 8.2 DMC 38 TC 36 MC 37 Passenger Weight in tons(@ 8 person per T per passenger DMC TC MC Gross weight in tons DMC TC MC Axle load(t)(@ 8 persons per sqm of standee area) 10 Speed 10.1 Maximum Design Speed 90 Kmph 10.2 Maximum Operating Speed 80 Kmph Not more than 15T System should be designed for 15T axleload 11 Wheel Profile UIC 510-2, Appendix B 12 Traction Motors Ventilation Self 13 Average acceleration rate from 0-30 Kmph 1.0 m/sec2 ± 5% 14 Average deceleration from 80 Kmph to 0 Kmph 0.95 m/sec2 ± 5% 15 Instantaneous full service deceleration 1.1 m/sec2 (>1.3 m/sec2 during emergency) 16 Type of Bogie Fabricated 17 Secondary Suspension springs Air Bangalore Metro Phase-IIA DPR : K.R.Puram Silk Board October 2016 Page 9-13
146 CHAPTER 9 ROLLING STOCK Table 9.5 Salient Features of Rolling Stock for Mass Rapid Transit System S.No. Parameter Details (i) Compressed air supply by an oil free piston type air compressor and air dryer unit. (ii) An electro-pneumatic, microprocessor controlled 18 Brake system direct service brake which performs the blending function depending on the brake demand signal and the dynamic brake performance. (iii) A fail safe, pneumatic friction emergency brake. (iv) A pneumatic indirect BP backup brake which is applied during rescue operation or in case of failure of direct service brake. (v) A spring applied air-release parking brake. (vi) Air applied holding brake. (vii) An electric regenerative service brake. (viii) Provision of smooth and continuous blending of EP and regenerative braking 19 Coupler Auto Coupler in front and middle and remaining 19.1 For 6 car Train between two MC car Automatic coupler with mechanical, electrical & pneumatic coupling 19.2 Front cab end of DMC car Automatic coupler with mechanical & pneumatic coupling but without electrical coupling head 19.3 Between cars of same Unit Semi-permanent couplers 20 Detrainment Door Side doors 21 Type of Doors External sliding 22 Passenger Seats Stainless Steel 23 Cooling 23.1 VVVF & APS Self/Forced 23.2 TM Self ventilated 24 Control System 25 Traction Motors 3 phase VVVF controlled 26 Temperature Rise Limits 26.1 Traction Motor 26.2 VVVF & APS 27 HVAC Train line control by 110V dc signals for vital safety equipments/items and Train Management System for other control equipment monitoring The temperature rise limit for the stator winding shall be the maximum temperature index of the insulation minus 70 C. The current rating of the semiconductor shall be such that the junction temperature has the minimum thermal margin of 10 C in the worst loading conditions taking into account the extreme ambient conditions in Bangalore and surrounding. - Cooling, Heating & Humidifier (As required) - Automatic controlling of interior temperature throughout the passenger area at 25 C with 60% RH all the times under varying ambient conditions up to full load. - Cab cooling for DMC car shall be provided by saloon HVAC only. 28 PA/PIS (CCTV) ATC based station announcement. 29 Passenger Surveillance CCTV system CCTV with automatic IP selection. Bangalore Metro Phase-IIA DPR : K.R.Puram Silk Board October 2016 Page 9-14
147 CHAPTER 9 ROLLING STOCK Table 9.5 Salient Features of Rolling Stock for Mass Rapid Transit System S.No. Parameter Details 30 Battery System 31 Type of Headlight, Flasher & Taillight 32 Saloon Illumination Nickel Cadmium batteries with closed water loop system. LED based 33 Cubical lighting LED based Energy efficient, power LED based lights, in luminaries for saloon & gangway 34 Coasting Minimum 8% coasting to achieve specified commercial speed. Bangalore Metro Phase-IIA DPR : K.R.Puram Silk Board October 2016 Page 9-15
148 CHAPTER 10 TRAIN OPERATION PLAN 10 TRAIN OPERATION PLAN 10.1 OPERATION PHILOSOPHY The underlying operation philosophy is to make the MRT System more attractive and economical, the main features being: Selecting the most optimum frequency of Train services to meet sectional capacity requirement during peak hours on most of the sections. Economical & optimum train service frequency not only during peak period, but also during offpeak period. Multi-tasking of train operation and maintenance staff STATIONS Table 10.1 List of stations for the K.R. Puram to Silk Board S. No Name of Stations Chainage (in m) Inter - Station Distance (in m) Remarks Dead End 1 K.R Puram Elevated 2 Mahadevapura Elevated 3 DRDO Sports Complex Elevated 4 Doddanekundi Elevated 5 ISRO Elevated 6 Marathahalli Elevated 7 Kodibisanahalli Elevated 8 Kadubeesanahalli Elevated 9 Bellandur Elevated 10 Ibbalur Elevated 11 Agara Lake Elevated 12 HSR Layout Elevated 13 Silk Board Elevated Dead End Bangalore Metro Phase-IIA DPR : K.R.Puram Silk Board October 2016 Page 10-1
149 CHAPTER 10 TRAIN OPERATION PLAN 10.3 PHPDT DEMAND Peak hour peak direction traffic (PHPDT) demand for the K R Puram to Silk Board Line for the year 2021, 2031 and 2041 for the purpose train operation planning is as under: :- Table 10.2 : PHPDT Demand for the Year 2021,2031 & 2041 From To Dir 1 Dir 2 PHPDT 2021 Dir 1 Dir 2 PHPDT 2031 Dir 1 Dir 2 PHPDT 2041 K R Puram Mahadevapura Mahadevapura DRDO Sports Complex DRDO Sports Complex Doddanekundi Doddanekundi ISRO ISRO Marathahalli Marathahalli Kodibisanahalli Kodibisanahalli Kadubeesanahalli Kadubeesanahalli Bellandur Bellandur Ibbalur Ibbalur Agara Lake Agara Lake HSR Layout HSR Layout Silk Board Bangalore Metro Phase-IIA DPR : K.R.Puram Silk Board October 2016 Page 10-2
150 CHAPTER 10 TRAIN OPERATION PLAN 10.4 TRAIN OPERATION PLAN Salient Features Running of services for 19 hours of the day (5 AM to Midnight) with a station dwell time of 30 seconds. Make up time of 5-10% with 8-10% coasting. Scheduled speed has been assumed as 34 KMPH Train Formation To meet the above projected traffic demand, the possibility of running trains with composition of 6 Car trains with different headway has been examined. Composition DMC : Driving Motor Car MC : Motor Car TC : Trailer Car 6 Car Train Composition : *DMC - TC -MC + MC - TC DMC* Passenger Capacity standees per square meter standee area (AW3)) DMC : 247 Passengers (Sitting-43, Crush Standing-204) TC/MC : 270 Passengers (Sitting-50, Crush Standing-220) 6 Car Train Passenger capacity : 1574 Passengers (Sitting-286, Crush Standing-1288) Passenger Capacity standees per square meter standee area (AW4)) DMC : 316 Passengers (Sitting-43, Crush Standing-273) TC/MC : 343 Passengers (Sitting-50, Crush Standing-293) 6 Car Train Passenger capacity : 2004 Passengers (Sitting-286, Crush Standing-1718) Based on the experience of Phase-I and commissioning of East-West Corridor, it is recommended to adopt AW3 Passenger loading for calculation of the passenger carrying capacity to meet the projected maximum PHPDT whereas, in emergency, it shall be possible to carry the passenger under AW4 loading condition. Table 10.3 : Carrying Capacity of Mass Rail Vehicles (Crush@6 P/sq.m of standee area) Driving Motor car Trailer car /Motor car 6 Car Train Normal Crush Normal Crush Normal Crush Seated Standing Total NORMAL (AW2) - 4 P/sqm of standee area CRUSH (AW3) - 6 P/sqm of standee area Bangalore Metro Phase-IIA DPR : K.R.Puram Silk Board October 2016 Page 10-3
151 CHAPTER 10 TRAIN OPERATION PLAN Table 10.4 : Carrying Capacity of Mass Rail Vehicles (Exceptional dense Crush@8P/sqm of standee area) Driving Motor car Trailer car / Motor car 6 Car Train Normal Crush Normal Crush Normal Crush Seated Standing Total NORMAL (AW2) - 4 P/sqm of standee area EXCEPTIONAL DENSE CRUSH (AW4) - 8 P/sqm of standee area Train Operation Plan Train operation plan with train carrying persons per square meter of standee area on K R Puram to Silk Board Junction for the year 2021, 2031 & 2041 given below: Planning for Year 2021: 6 car Train Composition : *DMC - TC - MC + MC TC - DMC* Capacity of train : 1574 in AW3 condition Schedule Speed : 34 Kmph Headway with 6- car train : 4 minutes During peak hour, No.of trains per hour : 15 Available Peak Hour Peak Direction Capacity of 23610@6 passengers per square meter of standee area(aw3). Available Peak Hour Peak Direction Capacity of 30060@8 passengers per square meter of standee area(aw4). Traffic reserve is taken as one/two train per train operation loop to cater to failure of train on line and to make up for operational time lost. Repair and maintenance reserve has been estimated as 8% of total requirement (Bare + Traffic Reserve). The calculated number of rakes in fraction is rounded off to next higher number. Traffic demand and train capacity for this corridor in the year 2021 is tabulated and represented on a chart as follows: Sl. No 1 Table 10.5: Peak Hour Demand and Train Requirement Peak Traffic Headway R PHPDT No. of Trains Section Demand as during Km provided requirement per DPR peak K R Puram to Rakes minute Silk board. (15 x 1574) (120 Cars) Bangalore Metro Phase-IIA DPR : K.R.Puram Silk Board October 2016 Page 10-4
152 CHAPTER 10 TRAIN OPERATION PLAN S No. From TABLE 10.6: YEAR PHPDT AND CAPACITY CHART To o 1 K R Puram Mahadevapura Mahadevapura 3 DRDO Sports Complex DRDO Sports Complex Traffic Demand in PHPDT Train carrying of standee area Doddanekundi Doddanekundi ISRO ISRO Marathahalli Marathahalli Kodibisanahalli Kodibisanahalli Kadubeesanahalli Kadubeesanahalli Bellandur Bellandur Ibbalur Ibbalur Agara Lake Agara Lake HSR Layout HSR Layout Silk Board Figure 10.1 YEAR PHPDT AND CAPACITY CHART Train carrying of standee area Planning for Year 2031: 6 car Train Composition Capacity of train Schedule Speed Headway with 6- car train : *DMC - TC - MC + MC TC - DMC* : 1574 in AW3 condition : 34 Kmph : 3 minutes Bangalore Metro Phase-IIA DPR : K.R.Puramm Silk Board October 2016 Page 10-5
153 CHAPTER 10 TRAIN OPERATION PLAN During peak hours, No.of trains per hour : 20 Available Peak Hour Peak Direction Capacity of passengers per square meter of standee area(aw3). Available Peak Hour Peak Direction Capacity of passengers per square meter of standee area (AW4). Traffic reserve is taken as one/two train per train operation loop to cater to failure of train on line and to make up for operational time lost. Repair and maintenance reserve has been estimated as 8% of total requirement (Bare + Traffic Reserve). The calculated number of rakes in fraction is rounded off to next higher number. Traffic demand and train capacity for this corridor in the year 2031 is tabulated and represented on a chart as follows: Sl. No 1 Section K R Puram to Silk board Table 10.7 Peak Hour Demand and Train Requirement R Km Peak Traffic Demand as per DPR PHPDT provided (20x1574) Headway during peak 3 minute No. of Trains requirement 25 Rakes (150 Cars) S No. TABLE 10.8 : YEAR PHPDT AND CAPACITY CHART From To Traffic Demand in PHPDT Train carrying of standee area Train carrying of standee area 1 K R Puram Mahadevapura Mahadevapura DRDO Sports Complex DRDO Sports Complex Doddanekundi Doddanekundi ISRO ISRO Marathahalli Marathahalli Kodibisanahalli Kodibisanahalli Kadubeesanahalli Kadubeesanahalli Bellandur Bellandur Ibbalur Ibbalur Agara Lake Agara Lake HSR Layout HSR Layout Silk Board Bangalore Metro Phase-IIA DPR : K.R.Puram Silk Board October 2016 Page 10-6
154 CHAPTER 10 TRAIN OPERATION PLAN PHPDT Figure 10.2 YEAR PHPDT AND CAPACITY CHART Stations Planning for Year 2041: 6 car Train Composition : *DMC - TC - MC + MC TC - DMC* Capacity of train : 1574 in AW3 condition Schedule Speed : 34 Kmph Headway with 6- car train : 2.5 minutes During peak hours, No.of trains per hour : 24 Available Peak Hour Peak Direction Capacity of passenger per square meter of standee area (AW3). Available Peak Hour Peak Direction Capacity of passenger per square meter of standee area (AW4). Traffic reserve is taken as one/two train per train operation loop to cater to failure of train on line and to make up for operational time lost. Repair and maintenance reserve has been estimated as 8% of total requirement (Bare + Traffic Reserve). The calculated number of rakes in fraction is rounded off to next higher number. Traffic demand and train capacity for this corridor in the year 2041 is tabulated and represented on a chart as follows: Table 10.9 Peak Hour Demand and Train Requirement Sl. No Section R Km Peak Traffic Demand as per DPR PHPDT provided Headway during peak No. of Trains requirement 1 K R Puram to Silk board (24x1574) 2.5 minute 31 Rakes (186 Cars) Bangalore Metro Phase-IIA DPR : K.R.Puram Silk Board October 2016 Page 10-7
155 CHAPTER 10 TRAIN OPERATION PLAN TABLE 10.10: YEAR PHPDT AND CAPACITY CHART S No. From To Traffic Demand in PHPDT Train carrying of standee area Train carrying of standee area 1 K R Puram Mahadevapura Mahadevapura DRDO Sports Complex 3 DRDO Sports Doddanekundi Complex 4 Doddanekundi ISRO ISRO Marathahalli Marathahalli Kodibisanahalli Kodibisanahalli Kadubeesanahalli Kadubeesanahalli Bellandur Bellandur Ibbalur Ibbalur Agara Lake Agara Lake HSR Layout HSR Layout Silk Board Figure 10.3 YEAR PHPDT AND CAPACITY CHART PHPDT Stations The above Train Operation Plan is based on available traffic data. In case of any mismatch in the capacity provided and the actual traffic, the capacity can be moderated suitably by adjusting the Headway during operation phase Bangalore Metro Phase-IIA DPR : K.R.Puram Silk Board October 2016 Page 10-8
156 CHAPTER 10 TRAIN OPERATION PLAN Summarizing above, the PHPDT Capacity on the rake requirement for different headway in different years of operation is tabulated below:- Corridor K R Puram to Silk Board Table 10.11: Capacity Provided for K R Puram to Silk Board Year Headway (min) No. of Rakes Rake Consist No. of Coaches Max. PHPDT Demand car car car passengers per square meter of standee area (AW4) PHPDT Capacity Available (30060*) (40080*) (48096*) Train Frequency The train operation for K R Puram to Silk Board provides the following train frequency:- Table : Train Frequency Corridor K R Puram To Silk Board Peak Hour h/w Lean Hour h/w Peak Hour h/w Lean Hour h/w Peak Hour h/w Lean Hour h/w 4 min 6 min 3 min 4 min 2.5 min 3 min No services are proposed between hrs to 5.00 hrs, which are reserved for maintenance activities of infrastructure and rolling stock Hourly Train Operation plan* The hourly distribution of daily transport capacity is presented in Table 10.17, 10.18, and for K R Puram to Silk Board and enclosed. Number of train trips per direction per day for above corridors are worked out as 220 in the year 2021, 315 in the year 2031 and 404 in the year 2041 respectively Vehicle Kilometer Based on above planning, after considering maintenance period and assuming 340 days in service in a year, Vehicle Kilometer is tabulated below. Table : Vehicle Kilometer Year Section Length No. of cars Per train No.of working days in a year Number of trains per day each way Daily Train-KM Annual Train-KM (10 5 ) Annual Vehicle- KM ( 10 5 ) Bangalore Metro Phase-IIA DPR : K.R.Puram Silk Board October 2016 Page 10-9
157 CHAPTER 10 TRAIN OPERATION PLAN 10.5 YEAR WISE RAKE REQUIREMENT Based on Train formation operation plan as detailed above, to meet Peak Hour Peak Direction Traffic Demand, year wise Rake requirement are tabulated below: Table : Rake Requirement for the Year 2021 Section Distance (kms) Schedule Speed in kmph Headway (min) Rake Requirement Bare Traffic Reserve R&M Total No. of rakes No. of cars per rake No. of cars K.R. Puram to Silk board * Total Turn Around Time (min) = 6 min Table : Rake Requirement for the Year 2031 Section Distance (kms) Schedule Speed in kmph Headway (min) Rake Requirement Bare Traffic Reserve R&M Total No. of rakes No. of cars per rake No. of cars K.R. Puram to Silk board * Total Turn Around Time (min) = 6 min Table Rake Requirement for the Year 2041 Section Distance (kms) Schedule Speed in kmph Headway (min) Rake Requirement Bare Traffic Reserve R&M Total No. of rakes No.of cars per rake No.of cars K.R. Puram to Silk board * Total Turn Around Time (min) = 6 min Bangalore Metro Phase-IIA DPR : K.R.Puram Silk Board October 2016 Page 10-10
158 CHAPTER 10 TRAIN OPERATION PLAN 10.6 COST ESTIMATE The estimated cost per car inclusive of all taxes, duties etc., is considered as Rs.9.50 Crores. The hourly distribution of daily transport capacity is shown in Table 10.17, 10.18, and *Table Hourly Train Operation Plan for K.R.PURAM TO SILK BOARD YEAR : 2021 Configuration : 6 car Headway in Minutes : 4 TIME OF DAY IN HOURS HEADWAY IMINUTES IN NO. OF TRAINS PER DAY UP DOWN TOTAL NO. OF TRAINS TRIPS PER DIRECTION PER DAY Bangalore Metro Phase-IIA DPR : K.R.Puram Silk Board October 2016 Page 10-11
159 CHAPTER 10 TRAIN OPERATION PLAN TABLE Hourly Train Operation Plan for K.R.PURAM TO SILK BOARD YEAR : 2031 Configuration : 6 car Headway in Minutes : 3 TIME OF DAY IN HOURS HEADWAY IMINUTES IN NO. OF TRAINS PER DAY UP DOWN TOTAL NO. OF TRAINS TRIPS PER DIRECTION PER DAY Bangalore Metro Phase-IIA DPR : K.R.Puram Silk Board October 2016 Page 10-12
160 CHAPTER 10 TRAIN OPERATION PLAN TABLE : Hourly Train Operation Plan for K.R.PURAM TO SILK BOARD YEAR : 2041 Configuration : 6 car Headway in Minutes : 2.5 TIME OF DAY IN HOURS HEADWAY IN IMINUTES NO. OF TRAINS PER DAY UP DOWN TOTAL NO. OF TRAINS TRIPS PER DIRECTION PER DAY Bangalore Metro Phase-IIA DPR : K.R.Puram Silk Board October 2016 Page 10-13
161 CHAPTER 11 - SIGNALLING SYSTEM AND TELECOMMUNICATION 11 SIGNALLING SYSTEM AND TELECOMMUNICATION 11.1 SIGNALLING AND TRAIN CONTROL INTRODUCTION Metro carries a large number of passengers at a very close headway requiring a very high level of safety enforcement and reliability as well as availability. At the same time heavy investment in infrastructure and rolling stock necessitates optimization of its capacity to provide the best services to the public. The Signalling & Train Control system in Metro Railway plays a major role to provide frequent, fast and safe journeys in the urban areas. The telecommunication system acts as the communication backbone for signaling system and provides telecommunication services to meet operational and administrative requirements of rail / metro network. Presently, BMRCL s operational Purple and Green lines are having Distance to Go (DTG) system for its Train control. This system has several track circuits detecting the presence/absence of a train in the zone and a failure of any one track circuit leads to operational delay as in such cases, the train position gets non-determined. When the trains are running in tight headway, normalization process gets prolonged due to the need for Power Block etc. The DTG system has also become obsolete and the latest Signalling / Train Control technology available is the Communication based Trail control (CBTC). Most of the vendors are switching their design expertise and manufacturing line from DTG to CBTC system as the new metros globally are going with CBTC signalling only. Same has been the trend in India too as recently taken up lines on Delhi Metro, Hyderabad Metro and Kochi Metro too are being equipped with this technology only and the same is to be adopted for the proposed New Line ADOPTION OF CBTC BASED SIGNALLING SYSTEM: Train control requirements of the metro are planned to be achieved by adopting Continuous Automatic Train Control (CATC) based on Communication Based Train Control (CBTC) System. The train location is determined by continuous communication with Central control. The track circuits/ Axle counters are installed as a fall back option and to manage non-equipped vehicle movements. This system includes Automatic Train Protection (ATP) and Automatic Train Operation (ATO) sub-systems using continuous bi-directional radio communication between track side and train and Automatic Train Supervision (ATS) sub systems. The CBTC system offers following advantages: a) High reliability, better availability and less prone to failures. b) Easier to maintain. c) Provides higher traffic capacity. d) They are reported to be more energy efficient systems compared to DTG signalling. e) Adaptable to any Grade of Automation and Scalable too. Bangalore Metro Phase-IIA DPR : K.R.Puram Silk Board October 2016 Page 11-1
162 CHAPTER 11 - SIGNALLING SYSTEM AND TELECOMMUNICATION This will: a) Provide high level of safety with trains running at close headway, ensuring continuous safe train separation and for bidirectional working. b) Eliminate accidents due to driver passing Signal at Danger by continuous speed monitoring and automatic application of brake in case of disregard of signal / warning by the driver. c) Provides safety and enforces speed limit on section having permanent and temporary speed restrictions. d) Improves capacity with safer and smoother operations. Driver will have continuous display of Target Speed and other information in his cab enabling him to optimize the speed potential of the track section. It provides signal / speed status in the cab even in bad weather. e) Improve maintenance of signaling and telecommunication equipments by providing new ways of monitoring system status of track side and train borne equipments and undertaking preventive maintenance. A Signaling and Train Control system shall be designed to meet the required headway during peak hours. The signalling system shall also have secondary detection of trains through Axle counters/track circuits. Radio for CBTC shall work in license free ISM band. The control of train operation will be done from a centralized Operation Control Center (OCC) and will be supervised by Traffic Controller. The OCC shall have required facilities for setting of the route and clearing of the signals and other supervisory and control facilities. The Backup Control Centre shall also be provided at a suitable location geographically separated from the OCC SYSTEM DESCRIPTION AND SPECIFICATIONS The Signaling and Train Control system shall be as explained below: a) Continuous Automatic Train Control: Continuous Automatic Train Control based on CBTC will consist of Automatic Train Protection (ATP), Automatic Train Operation (ATO) and Automatic Train Supervision (ATS) sub-systems. The train borne Automatic Train Control system will consist of Automatic Train Operation (ATO) & Automatic Train Protection (ATP). This will work on moving block principle. i. Automatic Train Protection (ATP) Automatic Train Protection (ATP) is the primary function of the train control system. This sub-system will be inherently capable of achieving the following objectives in a fail safe manner. Cab Signaling Moving block Generation of track related speed profile based on continuous data from track to train Continuous monitoring of braking curve Monitoring maximum permitted speed on the line and speed restrictions Bangalore Metro Phase-IIA DPR : K.R.Puram Silk Board October 2016 Page 11-2
163 CHAPTER 11 - SIGNALLING SYSTEM AND TELECOMMUNICATION Detection of overspeed and generation of audio visual warning and application of brake if necessary Maintaining safe distance between trains Monitoring of stopping points Monitoring of direction of travel and roll back Issuing command for correct side door opening in trains and PSG if provided The train borne equipment will be of modular sub assemblies for each function for easy maintenance and replacement. ii. Automatic Train Operation (ATO) This system will operate the trains automatically from station to station within the safety envelope of ATP and open the train doors on the correct side. In conjunction with ATP/ATS, ATO can control the dwell time at stations and manage the train running in accordance with headway / time table. iii. Automatic Train Supervision (ATS) A train supervision system will be installed to facilitate the monitoring of the train operation and also remote control of the station. The train supervision will log each train movement and display it on work stations with traffic controller at OCC and in a work station for the station controller. The centralized system will be installed in Operation Control Centre (OCC). The OCC will have a projection display panel showing the panoramic view indicating the dynamic position of train movement on a particular track / points. This will aggregate the train movements in various sections and display in a common video wall. ATS will provide the following main functionalities: Automatic Route Setting Automatic Train Regulation Continuous tracking of train position Display panel and work station Link to passenger information display system for online information Computation of train schedule and time table Issue special commands to train such as train hold, skip station etc. b) Interlocking system i. Computer Based Interlocking (CBI) The entire line including turnback, transfer track, pocket track and stabling depot will be equipped with CBI system for operation of points and crossings and setting of routes. The route setting and clearance of signals will be done from a workstation, which can be either locally (at station) operated or operated remotely from the OCC/BCC. Bangalore Metro Phase-IIA DPR : K.R.Puram Silk Board October 2016 Page 11-3
164 CHAPTER 11 - SIGNALLING SYSTEM AND TELECOMMUNICATION This system is used for controlling vehicle movements into or out of stations automatically from a workstation. All stations having points and crossings will be provided with workstations for local control. Track occupancy, point position, signal aspect etc will be clearly indicated on the workstation. It will be possible to operate the workstation locally if the central control hands over such control. The interlocking system design shall be of fail-safe design principle. The signals operate for every train movement, points operate for every train turn back, short-loop and for induction/withdrawal and therefore the equipment will withstand tough environmental conditions encountered in a Metro system. Suitable IRS, IS standards or equivalent international standards will be followed in case wiring, installation, earthing, cabling, power supply and for material used in track circuits, axle counters, relays, point machine etc. ii. Track vacancy detection Primary mode for track vacancy detection system on main line may be through radio and for secondary detection it can be through track circuit/axle counters. iii. Signals on main line including pocket track, Stabling depot a) Line side signals Line side signals will be provided at diverging routes (i.e at point and crossing) as well as at other required locations, which shall serve as backup arrangements in case of failure of the ATP system. This consists of multi aspects colour light LED type signals installed on the main line and for depot entry/exit. All stations with points and crossing shall have the signalling arrangement to provide for bidirectional train operation. b) Point machines Non trailable electrical point machines capable of operating on 3 phase 380v AC will be used on main line, pocket track and stabling depot. The depot point machine will be trailable/non-trailable type electrical point machine capable of operating with either 3 phase 380v AC or 110v DC. The depot test track point machines and point machines on the route leading from main line to stabling lines shall be non-trailable type electrical point machine capable of operating with 3 phase 380v AC having availability performance. c) Platform Screen Door (PSD) or Platform Screen Gates (PSG) All Stations shall be equipped with PSD/PSG that are necessary for achieving automatic turn back of trains and also ensuring passenger safety. The PSD/PSG shall be interlocked such that their opening and closing is controlled automatically by the signalling system. Adequate provisions shall be provided to meet the emergency requirements for passenger detrainment. d) Train Depot cum workshop signalling The existing depot at Baiyappanahalli is equipped for repairs and maintenance of rolling stock running on Purple line. The signalling system already commissioned on the Purple Line is of Distance To Go (DTG) type whereas the new line from K R Puram to Silk Board will be of Communication Based Train Bangalore Metro Phase-IIA DPR : K.R.Puram Silk Board October 2016 Page 11-4
165 CHAPTER 11 - SIGNALLING SYSTEM AND TELECOMMUNICATION Control (CBTC) type. Full-fledged facilities for maintenance of CBTC equipped trains shall be planned at Baiyappanahalli in a phased manner such that it will not affect either the train operations on purple line or the rolling stock maintenance. The transition of the Baiyapanahalli depot from DTG signalling to complete CBTC system involves an overlapping period during which some depot line will cater exclusively to CBTC equipped trains and balance meeting the requirements of DTG system. Once alternative arrangements for DTG equipped trains is established, Baiyappanahalli depot will be converted to service CBTC equipped trains only. The existing test track in Baiyappanahalli depot will also be equipped with CBTC signalling with ATP to facilitate testing of the trains before induction to revenue service. All depot lines except the one which is used for shunting and in the work shop shall be interlocked as far as possible subject to track constrains if any. The work station shall be provided in the depot control centre for electric operation of points, signals and routes of the depot yard. Audio frequency track circuits/axle counters shall be used in the depot as well. The signals in the depot will be of position light shunt signal or main line signals. e) Signalling for Stabling Depot The main line is planned to be connected to a set of stabling lines at Hebbal to form a stabling depot once the section is extended beyond KR Puram in future on ORR corridor. These stabling lines shall also be interlocked and provided with main line signals controlled from OCC. These stabling lines shall be equipped with CATC, ATS, ATO and interlocking systems and all points within the stabling depot shall be controlled by point machines that are similar to those of main line. Direct induction of trains from stabling lines will be possible as per timetable SIGNALLING SCHEME PLAN Conceptual Signalling Plan based on engineering layout of the P-way for KR Puram- Silk Board corridor is enclosed. Bangalore Metro Phase-IIA DPR : K.R.Puram Silk Board October 2016 Page 11-5
166 CHAPTER 11 - SIGNALLING SYSTEM AND TELECOMMUNICATION STANDARDS Table 11.1 shows the standards that will be adopted with regard to the Signaling system. Table 11.1 Standards Adopted With Regards To Signalling System Description Standards Interlocking Computer Based Interlocking, adopted for station having switches and crossing. All related equipment as far as possible will be centralized in the equipment room at the station. All Depot lines shall be interlocked subject to track layout constraints. Block working Operation of Points Track Vacancy Detection systems Moving block principle With Direct current 110V D.C. point machines or 380 volts 3 phase, 50 Hz. AC point machines. Primary mode for track vacancy detection system on main line, stabling lines and test track in depot may be through radio and for depot/secondary detection it can be through track circuit/axle counters. Signals at Stations with points and crossings Line Side signals to protect the points (switches). LED type signals for reduced maintenance. UPS (uninterrupted power at stations as well as for OCC) Train protection systems Train Describer System Cables Fail Safe Principles For Signaling, Telecommunications, AFC and PSG and at stations to cover all equipments in Station Control Room. Train protection system shall be based on Communication Based Train Control (CBTC) system. The system architecture shall provide for redundancy. The system will conform to IEEE 1474 standards. Automatic train supervision system. Movement of all trains to be logged on to a central computer and displayed on workstations in the OCC/BCC and at the SCR. Remote control of stations from the OCC/BCC. The system architecture shall provide for redundancy. Outdoor Cables will be steel armoured, as far as possible. SIL-4 safety levels as per CENELEC standard for Signalling and Train Control system Immunity to External Interface. All data transmission on telecom cables/ OFC/Radio. All signaling and telecom cables will be separated from power cables as per standards. CENELEC standards to be implemented for EMC. Train Working Under Emergency Running on site with line side signal with speed automatically restricted to 25kmph. Environmental Conditions All equipment rooms shall be Air conditioned Maintenance Philosophy Philosophy of continuous monitoring of system status and preventive & corrective maintenance of signaling equipments shall be followed. Card / module / sub-system level replacement shall be done in the field and repairs under taken in the central laboratory/ manufacturer s premises. Annual Maintenance contract for obsolescence and evolution management of relevant hardware and software with the vendor/oem. Bangalore Metro Phase-IIA DPR : K.R.Puram Silk Board October 2016 Page 11-6
167 CHAPTER 11 - SIGNALLING SYSTEM AND TELECOMMUNICATION SPACE REQUIREMENT FOR SIGNALING INSTALLATIONS Adequate space for proper installations of all Signalling equipment at each of the stations has to be provided keeping in view the case of maintenance and use of instrumentation set up for regular testing and line up of the equipment/system. The areas required at each of the stations for Signalling equipment shall be generally 50 sqm for UPS room (common for signalling, telecom, AFC and PSG) and for signalling equipment room 55 sqm at all the stations with points and crossing & 25 sqm at stations without points and crossings and 80 sqm for depot (depends on layout). These areas shall also cater to local storage and space for maintenance personnel to work. The Station Control Room including storage space shall be of 55 sqm and Maintainer Room shall be of 25 sqm located at stations with points and crossings. At the OCC/BCC and the Depot, the areas required shall be as per the final configuration of the equipments and network configuration keeping space for further expansion MAINTENANCE PHILOSOPHY FOR SIGNALLING SYSTEMS The philosophy of continuous monitoring of systems status and preventive & corrective maintenance of Signaling and Telecommunication equipments shall be followed. Card/module/sub-system level replacement shall be done in the field. Maintenance personnel shall be suitably placed at intervals and they shall be trained in multidisciplinary skills. Sub-system wise expert team of shall be built-up for sustenance of the signaling system. Since the signaling system is mostly software based, the maintenance team shall have proficiency in IT/computer background. Each team shall be equipped with a fully equipped transport vehicle for effectively carrying out the maintenance from station to station. The defective card/module/sub-system taken out from the section shall be sent for diagnostic and repair to a centralized S&T repair lab suitably located in the section/depot. Cards/modules/equipments requiring major repairs shall be sent to manufacturer s workshop. Most of the computer systems undergo changes to their hardware and software on account of obsolescence, evolution and software patches within the specified life span. Annual Maintenance contract for such system with the vendor/oem may be considered for sustainability and maintainability of the installed systems which are safety critical in nature TELECOMMUNICATION SYSTEM INTRODUCTION The telecommunication system acts as communication backbone for Signaling, Power SCADA, BMS and AFC systems and provides telecommunication services to meet operational and administrative requirements of metro network. Telecommunication system consists of following sub-systems viz: i. Fiber Optic Transmission System (FOTS) - Main Telecommunication Bearer Bangalore Metro Phase-IIA DPR : K.R.Puram Silk Board October 2016 Page 11-7
168 CHAPTER 11 - SIGNALLING SYSTEM AND TELECOMMUNICATION The main bearer of the bulk of the telecommunication network is proposed with optical fibre cable system. Considering the channel requirement and keeping in view the future expansion requirements a 96 Fibre optical fiber cable is proposed to be laid in ring configuration with path diversity. Minimum SDH STM-4 based system shall be adopted with SDH nodes at every station, depot and OCC. Access 2MB multiplexing system will be adopted for the lower level at each node, equipped for channel cards depending on the requirement of channels in the network. Alternately, a fully IP based, high capacity (Minimum 1 Gbps), highly reliable and fault tolerant Ethernet Network (MAN/ LAN) can be provided. Further small routers and switches shall be provided for LAN network at stations. ii. Telephone Exchange The System shall be IP Based. The telephone extensions can be combination of IP, digital and Analog. For an optimized cost effective solution small exchanges of 30 port each shall be planned at each station and a 60 Port Exchange at the Terminal Stations and Depots shall be provided. The station exchanges will be connected to the OCC main exchange. The Exchanges will serve the subscribers at all the stations and Central Control. The exchanges will be interconnected at the channel level on optical backbone. The exchanges shall be software partitioned for EPABX and Direct Line Communication from which the phones shall be extended to the stations. For the critical control communication, the Availability and Reliability should be high. iii. Mobile Radio Communication Mobile Radio communication system having 8 channels is proposed for on-line emergency communication between Train operator (Front end and Rear end) of moving train and the Central Control. The system shall be based on Digital Trunk Radio Technology to TETRA International standard. All the stations, depots and the OCC will be provided with fixed radio sets. Mobile communication facility for maintenance parties and Security Personnel will be provided with handheld sets. These persons will be able to communicate with each other as well as with central control. The frequency band for operation of the system will be that for TETRA in 400/800 MHz band, depending on frequency availability. The system shall provide Instant mobile radio communication between the Train Operator of the moving cars from any place and the Central Control.The Train Operator can also contact any station in the network through the central control, besides intimating the approaching trains about any emergency like accident, fire, line blocked etc., thus improving safety performance. To provide adequate coverage, based on the RF site survey to be carried out during Detailed Design stage, base stations for the system will be located at sites conveniently selected after detailed survey. Tentatively, 3 Base Stations with a 40m tower shall be required along the route. During design stage, further Radio survey will need to be carried out, in case coverage is to be further improved. The increased passenger footfalls at stations may call for improvement of signal strength of mobile telephone system. Enhancement of Mobile communication will be made available to the public by Bangalore Metro Phase-IIA DPR : K.R.Puram Silk Board October 2016 Page 11-8
169 CHAPTER 11 - SIGNALLING SYSTEM AND TELECOMMUNICATION providing equipment on roof top of stations for which adequate Electrical power shall be made available. iv. Passenger Announcement System The system shall be capable of announcements from the local station as well as from OCC. Announcements from OCC will have over-riding priority in all announcements. The system shall be linked to Signalling System for automatic train actuated announcements. v. Centralized Clock System This will ensure an accurate display of time through a synchronization system of slave clocks driven from a Master Clock at the operation control center. The Master Clock signal shall also be required for synchronization of FOTS, Exchanges, Radio, Signalling etc.. The System will ensure identical display of time at all locations. Clocks are to be provided at platforms, concourse, Station Master's Room, Depots and other service establishments etc. vi. Passenger Information Display System These shall be located at convenient locations at all stations to provide bilingual visual indication of the status of the running trains and will typically indicate information such as destination, arrival/departure time, and also special messages in emergencies. The boards shall be provided at all platforms and concourses of all stations. The System shall be integrated with the PA system and available from same MMI. vii. Closed Circuit Television (CCTV) System The CCTV system shall provide surveillance and recording function for the operations to monitor each station. All areas in stations where security, safety and crowd control purpose is necessary like Entry, concourse, Entry to lift, escalators, Platforms, Passages to operation rooms, entry to PFs from emergency stair case, External station area for about 20 metres in front of entry gates shall be covered by CCTV coverage. CCTV shall consist of a mix of High definition Fixed camera and PTZ cameras The monitoring shall be possible both locally at each station and remotely from the OCC on the Video Wall. Voice communication between OCC and station Controller will also have video coverage functionality. The Surveillance of Trains shall be possible at a central location/occ through a Broad Band Radio System (BBRS) system, which may make use of the track side infrastructure like poles provided for the Signalling/Train control system. Start to end surveillance of passengers will be possible through the BBRS facility to monitor the on-board images in OCC/BCC. viii. Network Monitoring and Management For efficient and cost effective maintenance of the entire communication network, it is proposed to provide a network management system (NMS), which will help in diagnosing faults immediately from a central location and attending the same with least possible delay, thus increasing the operational efficiency and reduction in manpower requirement for maintenance. The proposed NMS system will Bangalore Metro Phase-IIA DPR : K.R.Puram Silk Board October 2016 Page 11-9
170 CHAPTER 11 - SIGNALLING SYSTEM AND TELECOMMUNICATION be covering radio communication, Optical Fiber Transmission system, Telephone Exchange and summary alarms of PA/PIDS, CCTV and Clock and UPS systems. The NMS will collect and monitor status from the individual NMS of the respective sub-systems and display on a common Work Station STANDARDS Table 11.2 shows the standards proposed to be adopted for telecommunication systems are shown in Table below: Table 11.2 Standards to be adopted for telecommunication systems System Transmission System Transmission Media Telephone Exchange Train Radio System Train Destination Indicator System Centralized clock system Passenger Announcement System Video Surveillance Redundancy (Major System) Environmental Conditions Maintenance Philosophy SDH or Ethernet based MAN/LAN Standards Optical Fibre system as the main bearer for bulk of the telecommunication network. IP EPABX of minimum 30 ports is to be provided at all Stations, an Exchange of 60 Ports to be provided at Terminal Stations and Depot. Digital Train radio (TETRA) communication between Train Operator of moving cars, stations, maintenance personnel,depots and central control. LED/LCD based boards with adequate visibility to be provided at convenient location at all stations to provide bilingual visual indication of the status of the running trains, and also special messages in emergencies. Accurate display of time through a synchronization system of slave clocks driven from a master clock at the OCC and sub master clock in station/depots.. This shall also be used for synchronization of other systems. Passenger Announcement System covering all platform and concourse areas with local as well as Central Announcement. IP based High definition CCTV cameras with Network video Recorders at stations, Centralized management, Video Analytic features and Video wall display. Redundancy on Radio base station equipment. Path Redundancy for Optical Fibre Cable by provisioning in ring configuration. All equipment rooms to be air-conditioned. System to have, as far as possible, automatic Switching facility to alternate routes/circuits in the event of failure. Philosophy of preventive checks of maintenance to be followed. System networked with NMS for diagnosing faults and co-ordination. Card/module level replacement shall be done in the field and repairs undertaken in the central laboratory/manufacture's premises. Maintenance contract for hardware / software as necessary to manage the technology advancement. Bangalore Metro Phase-IIA DPR : K.R.Puram Silk Board October 2016 Page 11-10
171 CHAPTER 11 - SIGNALLING SYSTEM AND TELECOMMUNICATION SPACE REQUIREMENT FOR TELECOM INSTALLATIONS Adequate space for proper installations of all Telecommunication equipment at each of the stations has to be provided keeping in view the case of maintenance and use of instrumentation set up for regular testing and line up of the equipment/system. The areas required at each of the stations for Telecom equipment shall be generally 40 sq.m each for Telecom Room and 50 sq.m. for UPS Room (common for signal, telecom,afc and PSG). At the OCC and BCC, the areas required shall be as per the final configuration of the equipments and network configuration keeping space for further expansion MAINTENANCE PHILOSOPHY FOR TELECOM SYSTEMS The philosophy of continuous monitoring of system status and preventive & corrective maintenance of Signaling and telecommunication equipments shall be followed. Card / module / subsystem level replacement shall be done in the field. Maintenance personnel shall be suitably placed at intervals and they shall be trained in multidisciplinary skills. Each team shall be equipped with a fully equipped transport vehicle for effectively carrying out the maintenance from station to station. The defective card/ module / sub-system taken out from the section shall be sent for diagnostic and repair to a centralized S&T repair lab suitably located on the section. This lab will be equipped with appropriate diagnostic and test equipments to rectify the faults and undertake minor repairs. Cards / modules / equipments requiring major repairs as specified in suppliers documents shall be sent to manufacturer's workshop. Maintenance contract for hardware / software as necessary to manage the technology advancement/obsolescence will be undertaken AUTOMATIC FARE COLLECTION INTRODUCTION Metro Rail Systems handle large number of passengers. Ticket issue and fare collection play a vital role in the efficient and proper operation of the system. To achieve this objective, ticketing system shall be simple, easy to use/operate and maintain, easy on accounting facilities, capable of issuing single/multiple journey tickets, amenable for quick fare changes and require overall lesser manpower. In view of above, computer based automatic fare collection system is proposed. AFC system proves to be cheaper than semi-automatic (manual system) in long run due to reduced manpower cost for ticketing staff, reduced maintenance in comparison to paper ticket machines, overall less cost of recyclable tickets (Smart Card/Token) in comparison to paper tickets and prevention of leakage of revenue. Relative advantages of automatic fare collection system over manual system are as follows: Bangalore Metro Phase-IIA DPR : K.R.Puram Silk Board October 2016 Page 11-11
172 CHAPTER 11 - SIGNALLING SYSTEM AND TELECOMMUNICATION A. Manual fare collection systems have the following inherent disadvantages: i. Large number of staff is required for issue and checking of tickets. ii. Change of fare structure is time consuming as has to be done at each station. iii. Manipulation possible by jamming of mechanical parts. iv. Staff and passenger interaction leading to more chances of confrontation. v. 100% ticket checking at entry / exit impossible. B. Automatic fare collection systems have the following advantages: i. Less number of staff required. ii. Less possibility of leakage of revenue due to 100% ticket check by control gates. iii. Recycling of ticket fraudulently by staff avoided. iv. Efficient and easy to operate, faster evacuation both in normal and emergency. v. System is amenable for quick fare changes. vi. Management information reports generation easy. vii. System has multi-operator capabilities. Same Smart Card can be used for other applications also. viii. AFC systems are the worldwide accepted systems for Metro environment. The proposed ticketing system shall be same as that to be provided on the other lines of Phase-1 and Phase-2 i.e. of Contactless Smart Token/ Card type. The equipment for the same shall be provided at each station Counter/Booking office and at convenient locations and will be connected to a local area network with a computer in the Station Control room. The AFC system shall support simultaneously ISO based type A cards compatible with MiFare and EMV based (National Common Mobility Cards, RuPay etc.). The system shall also be capable of processing and accepting NFC based fare media. C. Choice of Control Gates Retractable flap or Paddle swing type Control Gates are proposed which offer high throughput, require less maintenance and are latest in modern metros internationally. Tripod turnstile type gates offer less through put and require more maintenance and hence not proposed. The traffic on this line will reach peaks in one direction in morning and in the other direction during evening hours. Therefore, a set of Entry, Exit and Bi-directional gates in between shall be provided as far as possible to better manage the traffic. D. Passenger Operated Ticket Vending Machines (TVMs) Bangalore Metro Phase-IIA DPR : K.R.Puram Silk Board October 2016 Page 11-12
173 CHAPTER 11 - SIGNALLING SYSTEM AND TELECOMMUNICATION Space for provision of Passenger Operated Machines (Automatic Ticket Dispensing Machines) for future shall be provided at stations. E. Ticket Readers: These machines will be used to analyze card and last few transactions. Card/ Token and display card/ Token balance, validity of F. Add Value Machines: These machines will be used to recharge the card using Credit/ Debit card and/ or bank note module. These machines will also be used as add value device in case payment for card recharge is made through Internet based channels such as net banking, Credit/ Debit card ( Payment Gateway) etc. G. NFC based mobile ticketing As NFC technology is advancing fast, mobile based ticketing is likely to be widely used in near future by Metro Rail operators. Hence a NFC based mobile ticketing solution is proposed to be included AFC EQUIPMENT REQUIREMENT AFC equipment requirement for Silk Board Junction to K.R. Puram section are given in Table 11.3 as under. Bangalore Metro Phase-IIA DPR : K.R.Puram Silk Board October 2016 Page 11-13
174 CHAPTER 11 - SIGNALLING SYSTEM AND TELECOMMUNICATION S.N Station Daily Boarding (2031) Table 11.3 AFC Equipments for Bangalore Metro New line from KR Puram to Silk Board Daily Alighting (2031) Hourly Boarding Hourly Alighting Peak Min Boarding Peak Min Alighting Entry Gate Exit Gate Bi directional gate Wide Gate TOM Customer Care TR AVM 1 K R Puram 35,237 34, Mahadevpura 15,479 15, DRDO Sports Complex 41,895 41, Doddanekundi 12,981 13, ISRO 32,180 32, Marathahalli 13,753 14, Kodibisanahalli 40,403 40, Kadubeesanah alli 36,374 36, Bellandur 66,483 66, Ibbalur 3,563 3, Agara Lake 2,797 2, HSR Layout 73,178 72, Silk Board (Interchange) 84,245 83, Total 458, , Minimum AFC equipment at a station with "2 access- 2 for entry, 2 for exit": 4 entry gates, 4 exit gates, 2 Customer Care, 4 TOM, 2 TR, 2 AVM. Two Wide gates for Disabled at each station. Throughput of gate 28 passengers per minute, TOM 10 transactions per minute Peak hour traffic = 20% of day traffic. Peak Minute traffic = 2% of peak hour traffic. For Calculation purpose, It is assumed that 60 % passenger will use Smart Card. Bangalore Metro Phase-IIA DPR : K.R.Puram Silk Board October 2016 Page 11-14
175 CHAPTER 11 - SIGNALLING SYSTEM AND TELECOMMUNICATION STANDARDS The standard proposed for AFC systems are as under: Table 11.4 The standard proposed for AFC systems Fare Media Standards Description a) Contact less smart token For single journey. They shall have stored value amount for a particular journey. Tokens are captured at the exit gate. b) Contact less smart card For multiple journeys. Gates Station computer, Central computer and AFC Net work Ticket office machine (TOM/Customer Care) Ticket Reader and Portable Ticket Decoder. UPS (uninterrupted power at stations as well as for OCC). Add Value Machines Computer controlled retractable flap or paddle type automatic gates at entry and exit. There will be following types of gates: Entry / Exit Bidirectional can be set to entry or exit Wide Bidirectional -gate for disabled people. All the fare collection equipments shall be connected in a local area network with a station server controlling the activities of all the machines. These station servers will be linked to the central computer situated in the operational control center through the optic fibre communication channels. The centralized control of the system shall provide real time data of earnings, passenger flow analysis, blacklisting of specified cards etc. Manned Ticket office machine shall be installed in the stations for selling cards/ tokens to the passengers. Ticket reader shall be installed near Customer Care for passengers to check information stored in the token / cards. Common UPS of S&T system will be utilized. These machines will be used for analysis of fare media and recharge of smart cards using credit/ debit cards and/ or bank note module INTEGRATION OF AFC WITH EXISTING AFC SYSTEMS OF BMRCL AND AFC SYSTEMS OF SUBURBAN/BUS SYSTEM A provision for Common Smart Card (NCMC) based ticketing having multi-operator capability for integration with for both Suburban and Bus systems and other agencies shall be included in the design. The system shall also be integrated with existing AFC systems of BMRCL for seamless travel TICKET OFFICES Ticket offices of 3 m width to accommodate required Ticket issue machines with future provision to add additional counters shall be constructed. The Customer care shall be constructed at suitable location. Bangalore Metro Phase-IIA DPR : K.R.Puram Silk Board October 2016 Page 11-15
176 CHAPTER 11 - SIGNALLING SYSTEM AND TELECOMMUNICATION Bangalore Metro Phase-IIA DPR : K.R.Puram Silk Board October 2016 Page 11-16
177 CHAPTER 12 LAND ACQUISITION 12 LAND ACQUISITION 12.1 LAND PLAN As the Metro alignment has to be planned on set standards and parameters, apart from alignment, various structures like stations, parking facilities, traction sub stations, communication towers, etc. require large plots of land. The land being scarce, costly and acquisition being complex process, the alignment is so planned that barest minimum land acquisition is involved. Land is mainly required for; Metro Structure (including Route Alignment), station Building, Platforms, Entry/Exit Structures, Traffic Integration Facilities etc. Receiving/Traction Sub-stations 12.2 BREAK-UP OF LAND REQUIREMENT Out of the total land requirement of Sqm, the Private Land is Sqm and the Government Land is Sqm. This Government land does not however include the land required for depot at Kadugodi Plantation. Section-wise land requirement for elevated section and ownership of the land is given at table Table 12.1 LAND REQUIREMENT AND OWNERSHIP Sl. No. Plot No. Area (Sq. mtrs) Ownership H.S.R. Layout 1 H.S.R Government (BDA Park) 2 H.S.R Government (Drain) AGARA LAKE 3 AGARA Government (Park) 4 AGARA Government (BMTC Depot Area) IBBALUR 5 PLOT No BBMP Park BELLANDUR 6 PLOT No Government (Abandoned quarry) 7 PLOT No Private (RMZ Ecospace Property) KAADUBEESANAHALLI 8 PLOT No Private ( Salarpuria Tech Park) 9 PLOT No Private KODIBISANAHALLI 10 PLOT No Government 11 PLOT No Private MARATHAHALLI 12 PLOT No Private 13 PLOT No Private 14 PLOT No Private 15 PLOT No Private 16 PLOT No Private 17 PLOT No Private Bangalore Metro Phase-IIA DPR : K.R.Puram Silk Board October 2016 Page 12-1
178 CHAPTER 12 LAND ACQUISITION Table 12.1 LAND REQUIREMENT AND OWNERSHIP Sl. No. Plot No. Area (Sq. mtrs) Ownership 18 PLOT No Private ISRO 19 PLOT No Government (ISRO) 20 PLOT No Private 21 PLOT No Private 22 PLOT No Private 23 PLOT No Private 24 PLOT No Private 25 PLOT No Private DOODANEKUNDI 26 PLOT No Private 27 PLOT No Private DRDO SPORTS COMPLEX 28 PLOT No Private 29 PLOT No Private MAHADEVAPURA 30 PLOT No Private 31 PLOT No Private Grant Total VIADUCT BETWEEN K.R.PURAM AND JYOTHIPURA STATION This line is proposed to be further extended to Hebbal along the Outer Ring Road. Furthermore this line is proposed to be connected to Baiyappanahalli Depot also through a parallel line from K.R.Puram Station to Jyothipura Station is planned. For this, additional land of sq mtrs is proposed to be acquired. This involves shifting of 15 commercial properties and there will be no shifting of any residential premises. However, there is one Mosque which gets partially affected. For this, BMRCL will be paying adequate compensation to relocate the Mosque in the remaining portion of their land apart from paying compensation for the land acquired. No land is required for viaduct between Central Silk Board and K.R.Puram Stations as the viaduct is proposed to be constructed on the median of the Ring Road. The land required for Central Silk Board and K.R.Puram Stations has already been acquired in Phase-2 of Metro Rail Project RELOCATION / RESETTLEMENT There will be no relocation of any residential buildings along the alignment. However, few shops and establishments need to be relocated. Compensation for relocation of these affected structures shall be paid and it has been considered in the project cost estimate. The alignment and the location of the stations have been so chosen that it remains mostly within the government land and the road median. Bangalore Metro Phase-IIA DPR : K.R.Puram Silk Board October 2016 Page 12-2
179 CHAPTER 12 LAND ACQUISITION 12.5 MAINTENANCE DEPOT A train maintenance depot to provide train maintenance facilities for the trains of the above section is planned at Kadugodi Plantation where about acres of government land is available. Bangalore Metro Phase-IIA DPR : K.R.Puram Silk Board October 2016 Page 12-3
180 CHAPTER 13 ENVIRONMENTAL & SOCIAL IMPACT ASSESTMENT 13 ENVIRONMENTAL & SOCIAL IMPACT ASSESSMENT 13.1 BACKGROUND Environmental impact assessment has not been done for this project. Ministry of Environment and Forests (MoEF), Government of India, has issued various notifications on Environmental Impact Assessment since 1994 and the latest being in According to the notification, 32 types of projects under Schedule-I require environmental clearance from MoEF while Rail projects are exempted from this schedule. This clearly indicates that the proposed project does not require Environmental Clearance and don t create any major environmental problems. (The Notification of 14th September 2006, MOEF, Government of India, has been given in Annexure 13.1). However, this chapter tries to identify environmental and social impacts and their mitigation measures PROJECT DESCRIPTION The present study consists of one new alignment which is an addition of Phase II corridors. It will start from K. R. Puram and terminate at Silk Board on Outer Ring Road (ORR) covering an area of 17 km consisting having entire elevated stretch. There are 13 stations in this alignment. The proposed alignment will also mean that stations of K. R. Puram and Silk Board will act as interchanges as they are part of other extensions planned in Phase-2. K. R. Puram is a part of the 15.5 km line between Byappanahalli and Whitefield whereas Silk Board is part of the km stretch planned between R. V. Road and Bommasandra. The salient features of the proposed corridor are given in Table Table 13.1: Salient Features 1 Guage Standard Gauge (1435mm) 2 Alignment KR Puram to Silkboard 2.1 Route Length 17km 2.2 No. of Stations 13 (including terminal station) 3 Traffic Forecast (estimated Ridership) year 3.52 Lacs year 4.59 Lacs year 5.75 Lacs 4 Train Operation Plan year year Peak headway-4min Train configuration-6car No. of trains in service during peak hour-17 No. of trains trips per direction per day-220 Peak headway-3min Train configuration-6car Bangalore Metro Phase-IIA DPR : K.R.Puram Silk Board October 2016 Page 13-1
181 CHAPTER 13 ENVIRONMENTAL & SOCIAL IMPACT ASSESTMENT year 5 Speed No. of trains in service during peak hour-22 No. of trains trips per direction per day-320 Peak headway-2.5min Train configuration-6car No. of trains in service during peak hour-27 No. of trains trips per direction per day Design Speed 80kmph 5.2 Average Speed 34kmph 6 Traction Power Supply 6.1 Traction system voltage 750V DC 6.2 Current collection Third rail bottom collection 6.3 Power supply source 66kV/220kV 6.4 No. of Receiving Sub Stations No. of Traction Sub Stations SCADA provided 7 Rolling Stock 7.1 Type 7.2 Axle load 15t 7.3 Seating arrangement Longitudinal 7.4 Capacity of 6 coach unit 2068 Passengers 7.5 Class of accommodation One 8 Maintenance Facility Baiyappanahalli Depot 9 Signaling, Telecommunication Train Control & 2.88m wide modern rolling stock with stainless steel body, Standard guage 9.1 Signaling and Train Control Communication Based Train Control 9.2 Telecommunication 10 Construction Methodology Integrated system with fiber optic cable, SCADA, Train radio, PA system, etc... Train information system, control telephones and centralized clock system Elevated viaduct consisting of pre-stressed concrete box/ U shaped girders on single pier/portal with pile/open foundation. 11 Total Estimated Cost 4202 Crores (at July,2016 Prices, w/o taxes) 12 Financial Indices 12.1 FIRR 13.90% 12.2 EIRR 52.63% Bangalore Metro Phase-IIA DPR : K.R.Puram Silk Board October 2016 Page 13-2
182 CHAPTER 13 ENVIRONMENTAL & SOCIAL IMPACT ASSESTMENT The list of stations is given in Table S. No Name of Stations Table 13.2 List of stations Chainage (in m) Inter - Station Distance (in m) Remarks Dead End 1 K.R Puram Elevated 2 Mahadevapura Elevated 3 DRDO Sports Complex Elevated 4 Doddanekundi Elevated 5 ISRO Elevated 6 Marathahalli Elevated 7 Kodibisanahalli Elevated 8 Kadubeesanahalli Elevated 9 Bellandur Elevated 10 Ibbalur Elevated 11 Agara Lake Elevated 12 HSR Layout Elevated 13 Silk Board Elevated Dead End 13.3 ENVIRONMENTAL IMPACT Loss of Trees/Forests There is no forest area existing along the proposed alignment. The green cover on either side of the alignment and median of the road has been assessed and trees to be affected are identified and recorded. The details of affected tree population are given in Table 13.3 Table 13.3: Overall affected trees SN Locations No. of trees to be affected 1 Stations Road median (length of a tree: 8-10 feet) 1200 Total 1412 The trees along the median are small trees 8-10 feet height and with small girth. Only trees required for constructing pier will be cut and remaining will be allowed to grow underneath the viaduct. Bangalore Metro Phase-IIA DPR : K.R.Puram Silk Board October 2016 Page 13-3
183 CHAPTER 13 ENVIRONMENTAL & SOCIAL IMPACT ASSESTMENT Utility/Drainage Problems The proposed alignment runs on existing road and elevated all along the stretch. The utility services viz., lamp post, bus stop, manhole, drain, power line and telephone cables will be affecting partially Air Pollution The major source of air pollution during the construction is dust emission. This is due to the movement of vehicles carrying construction materials and workers moving in and around the project site. The emission from these vehicles depends on the type and capacity of the vehicles. As the vehicle movement is of temporary nature and restricted only to the construction period, these impacts relatively would be insignificant Noise Pollution Noise levels during construction will be from crushing plants, asphalt-mixing plants, movement of heavy vehicles, loading, transportation and unloading of construction materials etc. In addition to the noise mentioned above, there will also be background noise of the usual traffic resulting due to traffic congestion and confusion arising due to traffic diversion measures Traffic Diversion The existing road network is extensively used by pedestrians, cyclists, motorists, buses and trucks etc, this has caused traffic congestion. According to the survey carried out on the proposed alignment, the vehicle movement of two wheelers ranges from 3898 to 17171, three wheelers ranges from 490 to 1064, four wheelers ranges from 2684 to 6624 and buses ranges from 528 to 766 during peak hours. Temporary traffic diversion is essential for smooth flow during construction hence this will result in temporary impact on commuters using the existing roads BENEFITS OF THE PROJECT The proposed metro will yield tangible and non-tangible savings due to equivalent reduction in road traffic and certain socio-economic benefits. Introduction of metro will result in reduction in number of buses, usage of private vehicles, air pollution and increase the speed of road-based vehicles. This, in turn, will result in significant social benefits due to reduction in fuel consumption, vehicle operating cost and travel time of passengers. Reduction in accidents, pollution and road maintenance costs are the other benefits to the society in general Time saving One of the major advantages of having a metro system would be saving in the time for people using this corridor. It is estimated that everyday there would be 3.1 lakhs passenger trips on this corridor though the passengers would be coming on the metro would be arriving from far away distance and for the purpose of present analysis, we have confined the benefit accruing out of this stretch. On an average passengers would be travelling a length of about 18 kms in this corridor resulting in saving of 15 minutes per day per person per trip. This estimation is on the conservative side. Furthermore, the factors like value of comfort, value of certainty of travel and value of safety would be a further add on. Bangalore Metro Phase-IIA DPR : K.R.Puram Silk Board October 2016 Page 13-4
184 CHAPTER 13 ENVIRONMENTAL & SOCIAL IMPACT ASSESTMENT However, for the purpose of present analysis, the benefit which has been quantified is only the money value of the travel time saved. The total travel time saved per day for all the passengers put together would be 77,500 hours. Assuming a salary of Rs.200 per hour (which is again on the conservative side), the total money value for time saved would be Rs.1.55 crores (77,500 x 200) per day. For the entire year, this saving would translate into Rs.527 crores Saving in Cost of Emissions It is estimated that in the year 2020, there would be 3.1 lakh passenger trip per day on this corridor. In effect, emissions with these many trips by other modes would come down as passengers would shift from other modes and adopt the metro. The daily passenger trips of 3.1 lakhs would be a switch over from 2 wheelers, 4 wheelers and buses in the following ratio. a) Buses 40% b) 2 Wheelers 30% c) 4 wheelers 30% Applying the above modal shift shown in the figure above, the vehicle kms (VKM) saved in different modes is estimated as follows: a) Buses 31,886 vkm b) 2 Wheelers 5,97,857 vkm c) 4 wheelers 3,34,800 vkm The marginal external cost for each one of these modes has been taken from a study Estimating marginal external cost of transport in Delhi (Akshaya Kumar Sen, GeetamT iwari, Vrajaindra Upadhyay ) Applying the above marginal cost, the saving on account of switch over from other modes of transport to Metro for this corridor is estimated as follows: Table 13.4: Savings on Account per Day Mode Savings (Rs. In Lakhs) Buses Wheelers wheelers Total (This has been calculated based on paper Estimating marginal external cost of transport in Delhi, Aksaya Kumar Sen, Geetam Tiwari, Vrajaindraa Upadhayay 2009, Transport Policy, 17 Page: ) 13.5 MITGATION MEASURES As discussed in the earlier sections, the proposed alignment has positive as well as negative impacts on environment. The project provides quick and safe transportation, reduce traffic congestion and Bangalore Metro Phase-IIA DPR : K.R.Puram Silk Board October 2016 Page 13-5
185 CHAPTER 13 ENVIRONMENTAL & SOCIAL IMPACT ASSESTMENT time saving. On the contrary some of the adverse affects have also been identified viz. cutting trees, air/noise pollution, traffic diversion, utility dislocation etc. These adverse impacts can be minimized by proper mitigation measures Compensation for Loss of Trees On the ORR all along the median, trees have been planted by the BDA in the recent years and these trees are growing. The number of trees coming on the median is about A survey has been done for all these trees and it is noted that all these trees are small in size with girth less than 12". BMRCL will have to ensure that not all trees are uprooted but only those trees are removed where foundations are coming. Other trees can be allowed to grow under the viaduct. In addition, efforts have to be made to transplant some of these trees as these trees are not very big and it can be possible to transplant such trees Noise Pollution Control For elevated corridors, ballast less track structure is supported on two layers of rubber pads to reduce noise and vibrations. In addition, baffle wall as parapets will be constructed upto the rail level so as reduce sound levels. Noise at source will be controlled or reduced by incorporating suitable feature in the design of structures and layout of machines and by use of resilient mounting and dampers etc. To reduce the harmful effects, personnel working at high noise levels would be provided with noise protective gears such as ear mufflers, sound barriers etc. Vehicles used for transportation of construction materials would be equipped with proper silencers. Careful planning has been made to operate the construction equipments to have minimal disturbances. Establishment of tree cover all along the corridor will further reduce the noise levels during operation phase. However during construction, the noise levels will be controlled below 80 DB which will be almost equal ambient noise level due to vehicular traffic Air Pollution Control The main source of air pollution in the proposed project occurs only during construction. Transportation of construction materials, excavation and filling of land are the major sources of dust. This can be reduced to a greater extent by optimized use of soil material within the vicinity. Water should be sprayed at the construction site / vehicle movement areas regularly to reduce dust emissions. Adequate dust suppression measures particularly near habitation, such as water sprinkling, covering / area concealing etc should be practiced to control fugitive dust during construction. All vehicles, equipment and machinery used for construction shall be regularly maintained to ensure that the pollution emission levels to meet the prescribed norms of CPCB. Vehicles carrying earth, cement and other construction material shall be suitably covered during transportation in order to reduce spreading of material all along the road. There will not be any built up pollutants in the long run. Operational phase will not have any impact and management plan may not be required as the Metro rail does not pollute environment. Bangalore Metro Phase-IIA DPR : K.R.Puram Silk Board October 2016 Page 13-6
186 CHAPTER 13 ENVIRONMENTAL & SOCIAL IMPACT ASSESTMENT Utility Restoration There are many utilities such as water supply and sewer pipe lines, storm water drains, telephone cables, over head transmission lines, electric poles, sub ways, traffic signals etc. are essential and have to be maintained in working conditions during different stage of construction. These assets will be maintained without affecting any damages by shifting temporary/ permanently where it is necessary LAND ACQUISITION There would be no land acquisition involved for the construction of viaduct from Silk Board to KR Puram. For station construction and entry structures, land acquisition is involved. In addition, the land acquisition would also be required for running the viaduct as four lines for depot extension line from KR Puram to Baiyyappanahalli depot along with reach-2 viaduct line Baiyyappanahalli to White filed. As far as the land for viaduct between KR Puram and Jyothipuram is concerned, this viaduct would run alongside the Reach-1 viaduct of Phase-2 for which the land is already being acquired. Therefore, what is required is acquisition of additional strip of about 7 to 8 meters to accommodate one more viaduct on this stretch and total area of land acquired about 0.50 hectares. As far as the land for depot at Whitefield is concerned, there is about 400 acres of Govt. land available at Whitefield and it should be possible for the Government to grant 30 acres of land for construction of Depot. As far as the land at Silk Board is concerned, the design and construction of the Silk Board Metro Station as well as the roads at the intersections are a part of the Phase-2 and it is expected that the Central Silk Board would be in a position to spare the requisite land SOCIAL IMPACT Social impact assessment and rehabilitation plan is required when the project results in either physical or economic displacement of the people. The proposed alignment will be on the median of the road, there will be no relocation of any residential buildings along the alignment. So, resettlement issue doesn t arise in this project However, few shops and establishments need to be relocated along the proposed corridor. Compensation for relocation of these affected structures shall be paid. BMRCL has its own rehabilitation policy which was adopted for Phase-I of the metro project. It is comprehensive and covers most of the aspects of National Rehabilitation and Resettlement Policy. BMRCL rehabilitation policy is enclosed in Annexure This line is proposed to be further extended to Hebbal along the Outer Ring Road. Furthermore this line is proposed to be connected to Baiyappanahalli Depot also through a parallel line from K.R.Puram Station to Jyothipura Station is planned. For this, additional land of sq mtrs is proposed to be acquired. This involves shifting of 15 commercial properties and there will be no shifting of any residential premises. However, there is one Mosque which gets partially affected. For this, BMRCL will be paying adequate compensation to relocate the Mosque in the remaining portion of their land apart from paying compensation for the land acquired. Bangalore Metro Phase-IIA DPR : K.R.Puram Silk Board October 2016 Page 13-7
187 CHAPTER 13 ENVIRONMENTAL & SOCIAL IMPACT ASSESTMENT Annexure 13.1 NOTIFICATION OF 14TH SEPTEMBER 2006, MOEF, GOVERNMENT OF INDIA Bangalore Metro Phase-IIA DPR : K.R.Puram Silk Board October 2016 Page 13-8
188 CHAPTER 13 ENVIRONMENTAL & SOCIAL IMPACT ASSESTMENT Bangalore Metro Phase-IIA DPR : K.R.Puram Silk Board October 2016 Page 13-9
189 CHAPTER 13 ENVIRONMENTAL & SOCIAL IMPACT ASSESTMENT Bangalore Metro Phase-IIA DPR : K.R.Puram Silk Board October 2016 Page 13-10
190 CHAPTER 13 ENVIRONMENTAL & SOCIAL IMPACT ASSESTMENT Bangalore Metro Phase-IIA DPR : K.R.Puram Silk Board October 2016 Page 13-11
191 CHAPTER 13 ENVIRONMENTAL & SOCIAL IMPACT ASSESTMENT Bangalore Metro Phase-IIA DPR : K.R.Puram Silk Board October 2016 Page 13-12
192 CHAPTER 13 ENVIRONMENTAL & SOCIAL IMPACT ASSESTMENT Bangalore Metro Phase-IIA DPR : K.R.Puram Silk Board October 2016 Page 13-13
193 CHAPTER 13 ENVIRONMENTAL & SOCIAL IMPACT ASSESTMENT Bangalore Metro Phase-IIA DPR : K.R.Puram Silk Board October 2016 Page 13-14
194 CHAPTER 13 ENVIRONMENTAL & SOCIAL IMPACT ASSESTMENT Bangalore Metro Phase-IIA DPR : K.R.Puram Silk Board October 2016 Page 13-15
 Bangalore Metro Phase-IIA DPR : K.R.Puram Silk Board October 2016 Page 13-16")
195 CHAPTER 13 ENVIRONMENTAL & SOCIAL IMPACT ASSESTMENT (In the schedule to this notification, Railways or Metro Railways are not included) Bangalore Metro Phase-IIA DPR : K.R.Puram Silk Board October 2016 Page 13-16
196 CHAPTER 13 ENVIRONMENTAL & SOCIAL IMPACT ASSESTMENT Annexure 13.2 REHABILITATION PACKAGE - BANGALORE METRO RAIL CORPORATION LTD. Bangalore Metro Phase-IIA DPR : K.R.Puram Silk Board October 2016 Page 13-17
197 CHAPTER 13 ENVIRONMENTAL & SOCIAL IMPACT ASSESTMENT Bangalore Metro Phase-IIA DPR : K.R.Puram Silk Board October 2016 Page 13-18
198 CHAPTER 13 ENVIRONMENTAL & SOCIAL IMPACT ASSESTMENT Bangalore Metro Phase-IIA DPR : K.R.Puram Silk Board October 2016 Page 13-19
199 CHAPTER 13 ENVIRONMENTAL & SOCIAL IMPACT ASSESTMENT Bangalore Metro Phase-IIA DPR : K.R.Puram Silk Board October 2016 Page 13-20
200 CHAPTER 13 ENVIRONMENTAL & SOCIAL IMPACT ASSESTMENT Bangalore Metro Phase-IIA DPR : K.R.Puram Silk Board October 2016 Page 13-21
201 CHAPTER 13 ENVIRONMENTAL & SOCIAL IMPACT ASSESTMENT Bangalore Metro Phase-IIA DPR : K.R.Puram Silk Board October 2016 Page 13-22
202 CHAPTER 13 ENVIRONMENTAL & SOCIAL IMPACT ASSESTMENT Bangalore Metro Phase-IIA DPR : K.R.Puram Silk Board October 2016 Page 13-23
203 CHAPTER 13 ENVIRONMENTAL & SOCIAL IMPACT ASSESTMENT Bangalore Metro Phase-IIA DPR : K.R.Puram Silk Board October 2016 Page 13-24
204 CHAPTER 13 ENVIRONMENTAL & SOCIAL IMPACT ASSESTMENT Bangalore Metro Phase-IIA DPR : K.R.Puram Silk Board October 2016 Page 13-25
205 CHAPTER 13 ENVIRONMENTAL & SOCIAL IMPACT ASSESTMENT Bangalore Metro Phase-IIA DPR : K.R.Puram Silk Board October 2016 Page 13-26
206 CHAPTER 13 ENVIRONMENTAL & SOCIAL IMPACT ASSESTMENT Bangalore Metro Phase-IIA DPR : K.R.Puram Silk Board October 2016 Page 13-27
207 CHAPTER 13 ENVIRONMENTAL & SOCIAL IMPACT ASSESTMENT Bangalore Metro Phase-IIA DPR : K.R.Puram Silk Board October 2016 Page 13-28
208 CHAPTER 13 ENVIRONMENTAL & SOCIAL IMPACT ASSESTMENT Bangalore Metro Phase-IIA DPR : K.R.Puram Silk Board October 2016 Page 13-29
209 CHAPTER 13 ENVIRONMENTAL & SOCIAL IMPACT ASSESTMENT Bangalore Metro Phase-IIA DPR : K.R.Puram Silk Board October 2016 Page 13-30
210 CHAPTER 13 ENVIRONMENTAL & SOCIAL IMPACT ASSESTMENT Bangalore Metro Phase-IIA DPR : K.R.Puram Silk Board October 2016 Page 13-31
211 CHAPTER 13 ENVIRONMENTAL & SOCIAL IMPACT ASSESTMENT Bangalore Metro Phase-IIA DPR : K.R.Puram Silk Board October 2016 Page 13-32
212 CHAPTER 14 ESTIMATING CAPITAL COST 14 ESTIMATING CAPITAL COST 14.1 INTRODUCTION Detailed cost estimates for Bangalore Metro Phase-II extension KR Puram to Silk Board have been prepared covering Civil, Electrical, Signaling and Telecommunication Works, Rolling Stock etc., considering 750v DC Traction at July 2016 Price level. While preparing the capital cost estimates, various items have generally been grouped under three major heads on the basis of (i) Route km length of alignment, (ii) Number of units of that items and (iii) Items being an independent entity. All items related with elevated alignment, permanent way, third rail, signaling & telecommunications, whether in main line or in maintenance depot, have been estimated at rate per route km/km basis. Cost of station structures, other electrical services at these stations and automatic fare collection (AFC) installations at all Rolling Stock, Lifts, and Escalators etc. costs have been estimated in terms of number of units required for each item. In remaining items, viz. land, utility diversions, rehabilitations, etc., the costs have been assessed on the basis of each item, taken as an independent entity. In order to arrive at realistic costs of various items, costs have been assessed on basis of accepted rates in various contracts recently awarded by BMRCL for their ongoing works. A suitable escalation factor has been applied to bring these costs to July price level. In some of these tenders, there is an element of Customs Duty (CD) on the equipment / components to be imported for the work, VAT, etc., built in the quoted rates. The element of customs duty and works tax has been excluded for working out the project cost. However, the details of taxes are worked out separately. The overall capital cost of Bangalore Metro Phase II, at July 2016 price level, works out to be Rs Crores for the KR Puram to Silk Board extension. However, for estimation, a last accepted rate in another Metro Project recently awarded is adopted (the last tendered rate of Bangalore Metro Phase-2). These are figures including taxes and duties. The cost of consultancy contingencies and overheads has been included in the individual components. The capital cost estimates are shown at Table CIVIL ENGINEERING WORKS Land The alignment is passing through the centre of the carriage way from Silk board to KR Puram. Thus there is no land acquisition required for the viaduct on this section. The stations are located above the carriage way and only the Entry / Exit structure at each stations requires 10m x 80m land on either side is proposed to be acquired. The land for terminal station namely Silk board and KR Puram is already in possession with BMRCL. Thus in each station, 1600 sq.mt is required. Out of 11 new stations, 4 stations are on Government lands. Thus land acquisition Bangalore Metro Phase-IIA DPR : K.R.Puram Silk Board October 2016 Page 14-1
213 CHAPTER 14 ESTIMATING CAPITAL COST for balance 7 stations is sq.mt (Refer Table 12.1). The land acquisition rate is Rs. 10,000 per sq.ft. of which the total land cost works out to Rs Cr. Summary of the land cost is placed at Table Alignment / Viaduct The cost of the viaduct per kilometer in the latest accepted tender estimated is Rs. 43 Cr of Bangalore Metro Phase - 2. In the alignment proposed for the silk board KR Puram line, rail levels at stations are kept 1.50 m below the normal stations designed in the phase 2. Thus there will be some savings in the cost, which is Rs. 0.8 Lakhs per km. Hence for the estimate purpose, Rs Cr per km is considered. Thus the total cost for 19.5km of viaduct works out to be Rs Cr Station Buildings The cost of the station building is based on the cost of the station buildings of phase 2 for which the contracts have already been awarded. In phase 2 the cost of each station building is coming to Rs Cr. The track height on the ORR line will be about 2.0m lower than in the phase 2. Also, the stations on the ORR line will not a full deck of concourse. Thus, there would be a reduction in cost of station building. Therefore, the cost of each building has been taken as Rs Cr. There are 13 stations on this new line, therefore the total cost of station is Rs Cr. In addition, a provision of Rs. 5 Cr has been kept for Architectural works has been kept in each station. Thus the total cost for station building including architectural finishes works out to be Rs Cr Permanent Way The cost for laying the track for ballasted and ballast less is based on actual cost incurred in phase 1. The cost of laying ballast less track (Twin tracks both up and down lines) is taken as Rs 9.0 Cr per running km. And the cost of Ballasted track is taken as Rs. 2.5 Cr. per km. the total length of running viaduct is 20.5 km and therefore the total cost of ballasted track is Cr. The length of ballasted is 9.5 km and the cost of Rs Cr. Thus the total cost of track is Rs Cr Depot: Since there is no land along this corridor this line will have to be serviced from the existing Biayappanahalli Depot. The Biayappanahalli Depot was supposed to cater the East West line. Now a new depot has to be constructed on the east west line of Whitefield. The cost of construction of the new depot as well as cost of modification of the Biayapanahalli depot is included in the DPR. Based on the experience of phase 1 a total provision of 232 Cr. has been made for this depot at Whitefield. This includes Rs Cr for Civil works and Rs. 55 Cr for E&M works and Rs. 32 Cr for plant and Machinery. Also, for remodeling of Biayappanahalli depot a provision of Rs. 5.0 Cr has been kept Utility Diversions The viaduct is passing through centre of carriageway, the station columns are placed in median and acquired land. No major utility shifting is envisaged. Bangalore Metro Phase-IIA DPR : K.R.Puram Silk Board October 2016 Page 14-2
214 CHAPTER 14 ESTIMATING CAPITAL COST However, the following utilities are to be shifted: i. Raising of 66 kv tower ii. Shifting of street lights along median The costs of utility diversions involved in elevated stretches have been considered under head utility diversions i.e. civil utilities and electrical utilities. Provision under electrical utilities compensates for diversion of HT line crossings, street lights, BSNL utilities, traffic signal posts, high masts etc. Cost estimation is based on the actual route survey estimation. Cost considered for shifting/diversions of Electrical utilities: INR 80.5 Cr. (Lumpsum) Since the columns are at the centre of the road, no major civil utilities is envisaged, however, for any unchartered utility that might infringe with the construction a lump sum provision of Rs. 10. Cr. is considered. Estimated cost is inclusive of duties, taxes etc Traction & Power Supply Provisions have been made to cover following subheads: Receiving Substations including incoming cables from KPTCL Grid Substation 33 kv MV distribution network along the corridor Auxiliary substations Traction substations Third rail system 1 depot traction electrification (including stinger at inspection lines) SCADA System Earthing, Bonding and Stray Current Monitoring System Spares tools, plant, manuals etc. The rates adopted for various items are based on the last accepted rates of Bangalore Metro Phase I. Cost considered are INR 14.0 Cr per km of traction electrification. Estimation cost inclusive of duties, taxes etc. The breakup of this cost is given in Table 14.1 Thus the average cost per running km comes to Rs Cr. The total running km is estimated to be Rs Therefore the total cost of traction and power supply would be Rs Cr. Bangalore Metro Phase-IIA DPR : K.R.Puram Silk Board October 2016 Page 14-3
215 CHAPTER 14 ESTIMATING CAPITAL COST Table14.1 Breakup cost of Traction and Power supply Electrical and Mechanical Works Electrical and Mechanical Works (E&M): The Electrical and Mechanical works comprise of various lighting, building Management system (BMS), fire fighting systems, and lifts and escalators. These costs have been estimated based on the actual cost for the phase 1 station. Further a price escalation of 5% per annum has been provided. The E&M cost per station comes to Rs Cr and the cost for lifts and escalators as Rs Cr. Thus for all the 13 stations on this line the total E&M cost for this line comes to Rs Cr. Bangalore Metro Phase-IIA DPR : K.R.Puram Silk Board October 2016 Page 14-4


216 CHAPTER 14 ESTIMATING CAPITAL COST Table 14.2 Total E&M Cost of all stations Rate considered for lifts and escalators per station INR 4.34 Cr. Per station (2 lifts & 4 escalators). The breakup of this cost is given in Table Table 14.3 Cost Breakup of Escalators and Lifts The rates adopted for various items are based on the last accepted rates of Bangalore Metro Phase I. Estimation cost inclusive of duties, taxes etc. Bangalore Metro Phase-IIA DPR : K.R.Puram Silk Board October 2016 Page 14-5
217 CHAPTER 14 ESTIMATING CAPITAL COST ROLLING STOCK The cost has been estimated in the chapter on Train operation plan. This is estimated to be 120 coaches. Assuming the cost of each coach is Rs. 9.5 Cr and the total cost is coming to be Rs Cr. Estimation cost inclusive of duties, taxes etc Signaling, Telecommunication, AFC, PSG Works Since the Bangalore Metro Phase I project, there has been technology change in Signaling/Train Control System. Unlike Distance To Go (DTG), for the proposed new lone between K R Puram to Silk Board, CBTC Signalling is proposed. Considering the proposal for CBTC signaling system for this line, the cost of signaling system determined from the recently awarded works for similar project of CBTC systems of Kochi Metro (year 2014) is estimated in the DPR. As far as Telecom and AFC Systems are concerned, the technology will be more or less same and therefore, the updated cost of Phase I BMRCL project adopting current exchange rate of Euro and USD is estimated in the DPR. a) Rate of INR 7.21 Cr. Per km has been considered for Signaling & Train Control System with CBTC technology. b) Rate of INR 6.83 Cr. Per km has been considered for Telecom System. c) Rate of INR 3.3 Cr. Per station has been considered for providing AFC System. d) Rate of INR 6.6 Cr. Per stations has been considered for PSG Estimated cost inclusive of duties, taxes etc. crores to Rs. 403 Cr Road Restorations On this alignment it is expected that there would no major shifting of utilities involved. However, a provision of Rs 30.0 Cr has been kept Contingency, Consultancy and Miscellaneous expenses In addition to the above capital cost there would be expenditure on Consultancies, contingencies, over heads and project offices. It is estimated that these expenses would be about 6% of the capital cost (Excluding Land cost). Since in accounting these expenses also are captialised therefore the provision for these expenses amounting to Rs Cr is made and added back to the each item of capital cost and indicated in Table Bangalore Metro Phase-IIA DPR : K.R.Puram Silk Board October 2016 Page 14-6
218 CHAPTER 14 ESTIMATING CAPITAL COST Table 14.4 Cost Estimate Bangalore Metro Phase-IIA DPR : K.R.Puram Silk Board October 2016 Page 14-7
219 CHAPTER 15 OPERATION AND MAINTENANCE COST 15 OPERATION AND MAINTENANCE COST 15.1 INTRODUCTION The cost of operations includes the cost of running as well as maintaining the metro trains. These costs can be classified into fixed and variable costs Fixed cost These costs are those which do not increase with the increase words with the increase in train Kilometers in volume of operations or in other Variable cost These are costs vary according to the quantum of operations or in other words according to the number of Train Kms. These costs can be further sub classified into the following: 15.2 FIXED COSTS: These include the cost of manpower for operation, maintenance and also the expenditure on outsourced staff. Basically all this can be clubbed into staff cost Staff Cost The staff costs are basically the cost of human resources which are engaged to run the trains as well as to provide the different services for running the trains. This cost is a fixed cost and it will not vary with the quantum of operations. This includes, basically, the salary paid to the operations as well as maintenance staff and also the supervisory staff. It may be noted that the cost of maintenance staff is a fixed cost and therefore it is included as a part of the staff cost Staff cost Permanent Employees The staff costs for this line between Silk Board and KR Puram has been derived by making out the number of staff who would be engaged to run these train services. The staff cost has been estimated for the year 2020 as it is presumed that the line will be operational in the year The number of trains running on this 18 Kms stretch has been taken to be 20 trains for achieving three minutes headway. It is also estimated that the commercial speed of the trains on this stretch would be about 34 Kms. per hour. The number of staff of different categories required to be employed as well as the expenditure on their salaries is computed in Table No Thus the staff cost for the required number of people as indicated in Table-5.1 for one year at prices of is estimated at Rs Crores. Taking into consideration a yearly increment of 3% in basic and the increase in the DA component for the whole year at 12%, the gross increase year on year comes to about 9%. Hence, the staff cost for the year 2020 has been taken as Crores X (Rs Crores). Bangalore Metro Phase-IIA DPR : K.R.Puram Silk Board October 2016 Page 15-1
220 CHAPTER 15 OPERATION AND MAINTENANCE COST Table 15.1 Estimation of Salary and Cost to Company - O & M for KR Puram to Silk Board Junction line Staff for 21 trains of 3 car set & 17 stns Director 1 G.M 5 Staff for 27 trains of 6 car set & 13 stns Basic DA 114.8% Super Anu. Total ( in Rs) Per Annum (in Rs) Dy.GM Manager AM Total Section Eng Jr.Eng Maintainer Stn.Cont Train Op Asst.F/HR Total Grand Total Conveyance p.a Staff costs - Outsourced & Deployed personnel The staff cost also includes the cost of Housekeeping, cost of Ticket Operating Machine personnel (TOM), and the security personnel costs. The House keeping staff will not be permanently employed by BMRCL but would be taken through a private outsourcing agency. Similarly the TOM Operators would also be outsourced through a private outsourcing agency Cost of Security Deployed Personnel The security services would have two components the first component would include the policemen provided by the State Government and the Homeguards whose expenditure would have to be borne by BMRCL, and the private security staff who would be used for crowd control and watch & ward duty who would again be taken from a private agency. The staff cost on account of security, operators and policemen has been estimated based on the actual expenditure which is incurred on these services in the East-West Corridor which is fully operational from May Currently for 5 stations in the East- West Corridor, the BMRCL is utilizing the services of 100 policemen (Karnataka State Industrial Security Force KSISF). With these police personnel, the security cover for frisking and baggage scanning is provided to 5 metro stations. The approximate expenditure per year for the year for 100 KSISF personnel comes to Rs Crores per annum. As the line between KR Puram and CSB would have 13 stations, the cost of KSISF personnel for these stations has been arrived at Rs Crores per annum in the base year of For the year 2020 this cost will be estimated at Rs Crores X which comes to Rs Crores. Bangalore Metro Phase-IIA DPR : K.R.Puram Silk Board October 2016 Page 15-2
221 CHAPTER 15 OPERATION AND MAINTENANCE COST Cost of Outsourced Security Personnel The cost of outsourced Security personnel in the East-West corridor for 17 stations is Rs lakhs per month in the year which comes to Rs Crores per annum for the year which includes the cost of rentals for security equipments. In order to arrive at the man power cost, 8% rental cost have been reduced because BMRCL will provide the equipments. The man power cost works out to Crores for the year For the year 2020, the cost of security staff only would be Rs Crores. This has been further adjusted as the number of stations in the reach between KR Puram and CS Board is only 13 stations. Therefore, the cost of outsourcing housekeeping for the year 2020 for the new line would be Rs Crores Cost of outsourced Housekeeping personnel The cost of Housekeeping in the East-West corridor for 17 stations is Rs lakhs per month in the year which comes to Rs Crores per annum for the year For the year 2020, the cost of Housekeeping staff would be Rs.9.60 Crores. This has been further adjusted as the number of stations in the reach between KR Puram and CS Board is only 13 stations. Therefore, the cost of Housekeeping for the year 2020 for the new line would be Rs 7.34 Crores per annum Cost of outsourced TOM Operators The security cost and TOM Operators cost has been derived from the cost of TOM Operators in the East-West corridor. The cost of TOM Operators of 17 Stations of East-West Corridor is Rs lakhs per month or Rs Crores per annum for the base year For 13 stations this cost would be Rs 4.50 Crores in the year Thus the total staff cost is Rs = crore for the period of next 30 years the staff cost has been escalated at the rate of 10% per annum year on year on year basis MAINTENANCE COST The maintenance cost basically includes the cost of spares, cost of repairs and consumables, cost of Insurance, civil and structural works, licensing fees for wireless etc. and administrative & contingency expenses (overheads). The maintenance cost has components of both fixed cost as well as variable cost. However, for the purpose of financial analysis, the maintenance cost has been worked out based on the actual expenditure of maintenance for the East-West Corridor. The maintenance cost for the year has been taken as Rs Crores per annum for the East West Corridor. For the year 2020, the maintenance cost has been adjusted by an annual increase of 5% year on year, after adjustments for 6 car train set in the proposed new line, thereby making the maintenance cost for 2020 to Rs Crores. This cost also includes the maintenance cost for civil work ENERGY COST The system consumes energy for the movement of trains as well as for auxiliary services at stations. While the energy cost for the trains is a variable factor, the energy cost of auxiliary power stations is Bangalore Metro Phase-IIA DPR : K.R.Puram Silk Board October 2016 Page 15-3
222 CHAPTER 15 OPERATION AND MAINTENANCE COST generally fixed. The energy cost for the new line is based on the actual energy consumption for the East-West corridor. On the East-West corridor which is having 116 round trips on a daily basis, but with a train which has only 3 cars, the energy consumption per train Km for movement of train is 8.17 Kwhr. For the new line, the energy consumption per train Km (6 car train set) would be Kwhr, with a frequency of 3 minutes during peak hours (for 6 hours) and a frequency of 10 minutes for 12 hours. For 220 trips, the total train Kms would be 6912 Kms per day. The Energy consumed by trains is 1,12,942 Kwhr per day. The monthly consumption is 35,01,202 Kwhr. For the next 30 years the escalation of energy cost is taken at 5% per annum YoY basis. For consumption of power at the stations, it is estimated that each station on an average would consume 1000 Kwhr per day. Thus, the total energy for 13 stations per month would be 4,03,000 Kwhr. In addition, the power consumption in the Depot control room and the electrical losses have been estimated at 3, 56,032 units per month. Thus the total energy cost per month for the new line would be Rs Crs in the base year of Energy usage Table 15.2 Energy cost calculations No of Trips/day Train Kms / Month KWHr / TKM Kwhr / month Cost per Kwhr In Rs Cost per Month In Rs Cost per annum In Rs Train Energy Consumption Auxillary Energy for 13 stations- (1000 units / day/ station) Depot, OCC & Electrcial loss Total The energy cost increase as notified by the Government on a year on year basis has been 4.5%, 4.34% 8.33% and 2.88% over the period to Thus the average year on year increase in the energy cost is around 5%. Therefore, the energy cost for the year 2020 for the new line would be Rs Crores CONCLUSION The total Operations and Maintenance cost for the year 2020 is Rs Crore for the new line of 17 Kms with 13 stations and one depot, for running 6 coach train sets at a frequency of 4 minutes for 6 hours during peak hours and a frequency of 10 minutes during non-peak hours (12 hours). Thus the total Operation and Maintenance cost over the succeeding 30 years period is as given in the Table Bangalore Metro Phase-IIA DPR : K.R.Puram Silk Board October 2016 Page 15-4
223 CHAPTER 15 OPERATION AND MAINTENANCE COST Table 15.3 Operation & Maintenance cost in Rs Crs Year Staff Maintenance Energy Total Bangalore Metro Phase-IIA DPR : K.R.Puram Silk Board October 2016 Page 15-5
224 CHAPTER 16 DEPRECIATION COST AND INTREST RATE 16 DEPRECIATION COST AND INTEREST RATE The Capital cost for the project has been arrived at in Chapter- 14. The break-up of these costs, into various components, is indicated in Table Like any other asset, these assets also would depreciate over a period of time. Thus, depreciation cost is an important input in estimating both the FIRR and EIRR. The productive life of these assets like Civil Structures may be more than 100 years but in order to make the FIRR more realistic, we have not gone by the actual life of the asset but we have followed the norms which are followed for the purpose of accounting. Based on these norms, the following principles have been adopted: i. Land: As per the accounting norms, no depreciation is factored for the land. ii. Civil Structures: Civil structures have been depreciated presuming a productive life of only 30 years. The straight line method of depreciation has been adopted and therefore each year, the depreciation comes to 3.17%. The salvage value is taken as 5% of the current value of the asset. iii. E&M Works: These include escalators, lifts and other electrical equipments. Though the life of these products ranges from 20 to 30 years, the accounting norms have been followed for these also. The Escalators and lifts have been presumed to have a life of 30 years and therefore the depreciation factor at 3.17% is applied per annum. The residual value is taken as 5% of the current value of the asset. In so far as the other electrical equipments are concerned, as prescribed by the Company Law, the life of the equipments is taken as 8 years and the salvage value at 5%. Therefore, the annual depreciation for these assets would be 11.88%. iv. Plant & Machinery: The life of Plant & machinery at Depot, as per Company s Law, has been taken as 15 years. Therefore, the depreciation rate works out to 6.33% and the residual value is 5% of the current value. v. Permanent Way: The track and its fixtures are presumed to have a life of 30 years and therefore the annual depreciation rate of 3.17% is applied and the residual value is 5% of the current value of the asset. vi. Traction Power supply: The traction and power supply are considered to have a life of 8 years and therefore the annual depreciation rate of 11.88% is considered and the residual value at 5% of the asset value. vii. Signaling and Telecommunication: The signaling and telecommunications are considered to have a life of 8 years and therefore the annual depreciation rate of 11.88% is considered and the residual value at 5% of the asset value. viii. Miscellaneous: Comprising mainly shifting of electrical & telecommunication utilities and other civil works which are annually depreciated at 3.17% after considering the residual value of 5%. ix. Rolling Stock: Rolling stock is presumed to have a life of 30 years and annually depreciated at 3.17% after considering the residual value of 5%. Bangalore Metro Phase-IIA DPR : K.R.Puram Silk Board October 2016 Page 16-1
225 CHAPTER 16 DEPRECIATION COST AND INTREST RATE x. Applying the above norms, the cost of depreciation over a period of 30 years is worked out to Rs Crore as appended in Table No 14.1 & COMPUTATION OF INTEREST COST & REPAYMENT OF PRINCIPAL: The total project cost is estimated to be Rs Crore. It is expected that the State share of taxes would be reimbursed. The State share of taxes on this amount excluding expenditure on land, consultancy & administration would be approximately 8% on an average and thereby the reimbursement expected by way of state taxes will be Rs. 336 Crore. Thus, the project cost excluding the state taxes is Rs Crore. The drawl of the loan and repayment is assumed to be in the middle of the respective years. The interest during construction has been assumed to be zero and it is expected that the interest earned on the various cash inflows would offset the interest during construction. In order to fund a total of Rs Crore, it is expected that 50% of this will come through contribution and innovative financing and the balance would be from borrowings. It is also presumed that the expenditure during the three years of construction would be Rs.600 Crore, Rs.1800 Crore and Rs Crore in the year 2017, 2018 and 2019 respectively. It is also presumed that each year the contribution from borrowings as well as from innovative financing and state funding would in equal proportions. Though, efforts will be made to borrow the funds on a long term basis say 20 years or more from Financing Institutions, for the purpose of computation of IRR, it is presumed that the borrowings would be made with a repayment period of 10 years and the rate of interest would be 9% per annum. The principal amount would be repaid in a period of ten years after the project commences i.e. the repayment would start from the year Based on these presumptions, the cash inflow and outflow on account of loans, repayment of loans and interest cost are tabulated below: Table 16.1 Principal Drawal, Principal Repayment and Interest Repayment Year Principal Drawal Principal Repayment Interest Repayment Total 2, , , Bangalore Metro Phase-IIA DPR : K.R.Puram Silk Board October 2016 Page 16-2
226 CHAPTER 16 DEPRECIATION COST AND INTREST RATE SL No Particulars Amount in Rs Consultancy and contingency (inc. Admin) Cost Rs Table 16.2 Cost Summary Total Incl. Contingency cost Rs 1 Land Rate of Depreciation Residual Value 5% Rs Annual Depreciation Rs Total Depreciation 95% Rs 2 Alignment And Formation- Vaiduct % Station Buildings % E&M works % i Civil Works % ii E&M works % iii Machinery & Plant % Permanent Way Track Work % Traction & Power Supply % Signalling & Telecom % Road restoration etc., % Miscellaneous % Rolling Stock (SG) % Total Bangalore Metro Phase-IIA DPR : K.R.Puram Silk Board October 2016 Page 16-3
227 CHAPTER 16 DEPRECIATION COST AND INTREST RATE Table 16.3 Calculation of Depreciation & Residual Value Year of Depreciati on Land Alignment And Formation - Vaiduct Station Buildings E&M works Civil Works E&M works Machiner y & Plant Permanen t Way Track Work Tractio n & Power Supply Signallin g & Telecom Road restoratio n etc., Misc. Rolling Stock (SG) Total Bangalore Metro Phase-IIA DPR : K.R.Puram Silk Board October 2016 Page 16-4
228 CHAPTER 16 DEPRECIATION COST AND INTREST RATE Table 16.3 Calculation of Depreciation & Residual Value Year of Depreciati on Land Alignment And Formation - Vaiduct Station Buildings E&M works Civil Works E&M works Machiner y & Plant Permanen t Way Track Work Tractio n & Power Supply Signallin g & Telecom Road restoratio n etc., Misc. Rolling Stock (SG) Total Total % residual Value Grand Total Bangalore Metro Phase-IIA DPR : K.R.Puram Silk Board October 2016 Page 16-5
229 CHAPTER 17 FARE BOX AND NON FARE BOX REVENUE 17 FARE BOX AND NON FARE BOX REVENUE 17.1 INTRODUCTION The revenue earnings can be classified as Fare Box Revenue (FBR) and Non Fare Box Revenue (NFBR) FARE BOX REVENUE The main source of revenue for this line would be the fare box revenue. The fare box revenue is a function of the ridership (ridership is the number of passenger trip) as well as the notified fare. The traffic ridership figures for this line have been estimated in Chapter 3.0 and the total ridership as well as its station wise ridership is shown in Table 17.1 is reproduced below: Station Name Table 17.1 Corridor - K R Puram to Silk Board along ORR Daily Board Daily Board Peak Board Peak Board Peak Board 2021 Daily Board Board Alight Board Alight Board Alight Board Alight Board Alight Board Alight K R Puram 31,016 30,916 8,317 8,256 35,237 34,834 9,189 9,405 40,973 40,481 10,789 10,648 Mahadevapur a DRDO Sports Complex 13,068 13,199 3,625 3,573 15,479 15,808 4,903 4,837 17,352 17,930 5,422 5,417 33,379 33,370 8,793 7,413 41,895 41,867 11,188 9,489 47,116 47,102 12,381 10,450 Doddanekundi 9,974 10,011 2,609 2,608 12,981 13,011 3,228 3,222 15,578 15,615 3,845 3,819 ISRO 24,259 24,366 4,831 6,039 32,180 32,298 6,886 8,452 38,155 38,287 8,598 10,402 Marathahalli 12,357 12,833 4,688 4,473 13,753 14,328 5,376 4,868 15,405 15,967 5,831 5,624 Kodibisanhalli 38,871 38,815 13,347 13,777 40,403 40,345 14,049 14,245 45,761 45,703 16,231 16,323 Kadubeesana halli 21,261 21,261 3,872 4,405 36,374 36,374 6,421 7,083 51,577 51,577 8,802 9,603 Bellandur 42,024 42,010 13,526 13,799 66,483 66,464 20,123 20,538 94,108 94,083 27,918 28,450 Ibbalur 3,242 3, ,563 3, ,040 4, Agara Lake 2,250 2, ,797 2,957 1, ,299 3,438 1,140 1,131 HRS Layout 56,951 57,026 18,391 16,398 73,178 72,783 22,892 20,224 90,842 90,069 26,335 24,807 Slik Board 63,161 62,363 20,417 22,054 84,245 83,947 26,872 29, , ,490 35,311 36,226 The daily ridership (no of passengers per day for 2020) is taken as 3.10 Lakhs. The fares for this line have been extrapolated based on the existing fares of BMRCL. The existing fare table of BMRCL for the year is in Table17.2. Bangalore Metro Phase-IIA DPR : K.R.Puram Silk Board October 2016 Page 17-1
230 CHAPTER 17 FARE BOX AND NON FARE BOX REVENUE Table 17.2 BMRCL Fare Structure in Distance in kms. Metro Fare (Rs.) Distance in kms. Metro Fare (Rs.) These are promotional fares which would be subject to revision once the entire network gets operational ( a 20% increase would be reasonable) and thereafter these fares would be revised at periodical intervals as provided under law. It is estimated that the fares would go up by 10% over a block period of 2 years. Therefore, the fare table for the new line for the year 2020 has been derived and is shown in Figure Figure 17.1 Fares in Rs for Year 2020 to 2021 Fare in Rs for Fare KMS Continuing with the same presumption that the fares would increase by 10% over a block period of 2 years, the fares for the succeeding 30 years are shown the Table 17.3 Bangalore Metro Phase-IIA DPR : K.R.Puram Silk Board October 2016 Page 17-2
231 CHAPTER 17 FARE BOX AND NON FARE BOX REVENUE Table 17.3: Fare for the Succeeding 30 Years (Amount in Rs.) KMs The traffic ridership figures have been estimated in Chapter 3. This line on ORR would be a line connecting two trunk lines. It is assumed that people using this ORR line would travel on other lines and then reach and use this line. The average trip length in such case is presumed as 22 m with 50% being accounted on this line and the remaining 50% on the other part of Metro Network. The fare would be about Rs and half of this line is Rs can be credited to this line. Indeed, the opening of this Metro line would increase the ridership and viability of other lines but that has not been factored as we want the revenue figures to be conservative. The annual fare base revenue is shared in Table 17.4 Bangalore Metro Phase-IIA DPR : K.R.Puram Silk Board October 2016 Page 17-3
232 CHAPTER 17 FARE BOX AND NON FARE BOX REVENUE Year Avg. Ridership p/day ( no's) Table 17.4 Details of Revenue and Ridership Avg. Fare ( amt. In rs) Total ridership ( no's) Total fare box revenue per year Amount (rs. In cr) ,10, ,23, ,37, ,50, ,64, ,77, ,91, ,04, ,18, ,31, ,45, ,58, ,70, ,81, ,93, ,05, ,16, ,28, ,39, ,51, ,63, ,74, ,91, ,09, ,28, ,46, ,66, ,86, ,06, ,28, NON-FARE BOX REVENUE In addition to fare box revenue, Metro system generates substantial amount of non-fare box revenue. This non-fare box revenue includes rentals from spaces at Metro stations, advertising income, income from property development, income from parking charges, and other sources like leasing of spare capacity of optical fiber etc. The non-fare box revenue for the year for the existing network of Bangalore Metro Phase-IIA DPR : K.R.Puram Silk Board October 2016 Page 17-4
233 CHAPTER 17 FARE BOX AND NON FARE BOX REVENUE about 33 kms is estimated to be about Rs.35 crores. At present, the network of 33 kms is not connected to each other thereby the true potential of the non-fare box revenue has not been captured so far. The new line passing through the IT hub of the city would have a better potential for non-fare box revenue as compared to the East-West line. Therefore, a conservative estimate of Rs.50 crores per annum has been taken for the year This revenue is expected to increase at a rate of 6% year on year. Thus, the non-fare box revenue for a 30 year cycle succeeding 2020 is tabulated in the table Table 17.5: Non Fare Box Revenue for 30 years (Rs. In Cr.) Years Non Fare Box Revenue Years Non Fare Box Revenue The total revenue to be earned from fare box & the non fare box revenue for new line of 17 kms with 13 stations is as shown in the table Bangalore Metro Phase-IIA DPR : K.R.Puram Silk Board October 2016 Page 17-5
234 CHAPTER 17 FARE BOX AND NON FARE BOX REVENUE Table 17.6 Details of Revenue (Rs. In Cr.) Year Fare Box Non Fare Box Total Bangalore Metro Phase-IIA DPR : K.R.Puram Silk Board October 2016 Page 17-6
235 CHAPTER 18 FINANCING OPTIONS INNOVATIVE FANANCING 18 FINANCING OPTIONS INNOVATIVE FINANCING 18.1 INTRODUCTION In the Budget speech for the year , the Hon ble Chief Minister has emphasized the urgent need for decongesting traffic in Bangalore City and has stated that measures would be taken for providing Mass Rapid Transit System using Innovative Financing techniques. The Phase-1 of Bangalore Metro costing Rs Crores as well as the Phase-2 of Bangalore Metro costing Rs. 26,405 Crores have been funded jointly by the State Government and the Government of India. The contribution of the two Governments in Phase-2 of Namma Metro is given in the table below: Table 18.1 Government Contribution in Phase 2 Funding Source & Type Share in Project Cost (%) Amount (INR IN CRORE) Equity 14.65% GOI GOK Sub-ordinate Debt 5.35% Total GOI share 20.00% Equity 14.65% Subordinate Debt 12.97% Grant Contribution- GOK 6.40% Total GOK share 34.02% From the table, it is evident that the Bangalore Metro has been funded primarily by the contributions from the State Government and the Central Government apart from borrowings from various domestic and foreign financial institutions. Funding of such large infrastructure projects puts a heavy pressure on the budgetary resources of the State Government as well as the Government of India. As a result, the pace at which the Metro network should expand, does not match the pace at which the demands for Metro network is growing and therefore, there is a need to explore other avenues for mobilization of funds for Metro systems INNOVATIVE FINANCING Innovative Financing Instruments A major advantage of the important transport infrastructure project is that apart from giving the impetus to economic activities it also leads to appreciation of the value of lands and buildings which lie in this vicinity. The experience of Bangalore Metro Rail Project Phase-1 has thrown up a very good lesson for innovative financing. It has been observed through anecdotal evidence that there has been a substantial increase in the values of properties abutting the Metro alignment. This observation would also hold true for several other transportation projects like Arterial Roads and Peripheral Ring Roads. The Peripheral Ring Road around Bengaluru, which is now proposed by BDA, would act as a Bangalore Metro Phase-IIA DPR : K.R.Puram Silk Board October 2016 Page 18-1
236 CHAPTER 18 FINANCING OPTIONS INNOVATIVE FANANCING counter magnet to the Central Business District (CBD) and it would attract the economic activities near it. As a result, the part of activities of CBD would get relocated to the areas around the Peripheral Ring Road thus decongesting the heart of Bengaluru. The issue of innovative financing has been examined in detail and it is found that the following mechanisms could be used as innovative financing instruments to fund the major transport infrastructure projects in Karnataka: Premium FSI / FAR (Floor Space index / Floor Area Ratio) Cess on approval of new layouts Construction and exploitation of commercial spaces near important infrastructure projects Generation of revenue through other sources like premium for roads developments etc. Betterment Tax Premium FSI: It is well established that wherever rail based mass transit system or an efficient transport system goes, the area falling in the vicinity of the line witness a tremendous appreciation in the value. Added to this is the concept of transit oriented development wherein cities need to be planned in such a manner where the density of population is increased along the corridors of mass transit systems. Combining the impact of above two principles, the concept of premium FSI has been evolved. As per this concept, the lands falling within the fixed distance of the mass transit corridor or transportation hubs, would be offered additional FSI over and above the existing FSI. This increased FSI is called the premium FSI for which the owners of the land would have to pay and buy the additional FSI. The proceeds would go to a Transport Development Fund or the Infrastructure Development Fund from which the construction of mass transit system could be funded. BDA or other Development Authorities should make suitable amendment to their Zoning Regulations Cess on approval of new layouts: While the premium FSI as well as the Betterment Levy would be confined to the impact zone i.e. in the areas in the vicinity mass transit corridor, the levy of cess has no such restriction. The cess would be levied within entire area of the jurisdiction of BDA. The levy of cess and surcharge is governed by Section 18A of the Karnataka Town and Country Planning Act, The Section reads as follows:- Section 18-A. Levy and collection of cess and surcharge: 1. Notwithstanding anything contained in this Act, the Planning Authority may while granting permission for development of land or building levy and collect from the owner of such land or building: A cess for the purpose of carrying out any water supply scheme; A surcharge for the purpose of formation or ring roads; A cess for the purpose of improving slums; and A surcharge for the purpose of establishing Mass Rapid Transport system. Bangalore Metro Phase-IIA DPR : K.R.Puram Silk Board October 2016 Page 18-2
237 CHAPTER 18 FINANCING OPTIONS INNOVATIVE FANANCING 2. At such rates but all the above levies together not exceeding one-tenth of the market value of the land or building as may be prescribed. 3. The cess and surcharge levied under Sub-Section (1) shall be assessed and collected in such manner as may be prescribed. 4. Any person aggrieved by the levy, assessment and collection of cess or surcharge under this section may within thirty days from the date of the order appeal to the prescribed authority whose decision shall be final. 5. The prescribed authority may after giving a reasonable opportunity of being heard to the appellant and the planning Authority pass such order as it deems fit. 6. The State Government may exempt any Board Authority or Body constituted by or under any law and owned or controlled by the State Government or the Central Government or an infrastructure Project promoted or implemented by any company or person and approved by the State Government or Central Government from the payment of cess or surcharge leviable under Sub-section (1). The Cess is levied at the time of granting approval for development of land or buildings Construction And Exploitation Of Commercial Spaces Near Important Infrastructure Projects The appreciation in land value immediately next to the transport infrastructure project is substantially high. Therefore, it would make economic sense to acquire lands and then later on these could be exploited for generation of commercial revenue either by leasing of lands or through Public Private Partnerships. Some of the infrastructure projects also lend themselves for exploitation of air space above the infrastructure projects. For example, the air space over the Metro Station or above the major transportation hub can be commercially exploited for mobilization of resources Generation Of Revenue Through Other Sources The major transport infrastructure projects have a tendency to attract the commercial activities around it. This holds true for major roads, Metro Rail projects, transportation and logistics hubs etc. It is possible to mobilize resources through various commercial activities like advertising, providing access, business development, naming rights for stations, etc Generation of Revenue Through Levying Of Fees For Change Of Land Use In The Vicinity Of Infrastructure Projects The nature of activities in the areas around the major new Infrastructure projects such as Ring Road etc. are likely to undergo significant change from Agriculture or Residential to Commercial. It would be prudent to facilitate easy change of land use under Section 18 of KTCP Act as it will yield a better income to the owner by levying a fee as provided in Section 18 of KTCP Act. The new Infrastructure project will be able to sustain the additional burden of the enhanced activities and the land owners will not have the time consuming process for change of land use individually. It could provide an important additional source of revenue to finance the Infrastructure projects. Bangalore Metro Phase-IIA DPR : K.R.Puram Silk Board October 2016 Page 18-3
238 CHAPTER 18 FINANCING OPTIONS INNOVATIVE FANANCING Betterment Levy As stated earlier, the land values in the vicinity of mass transit system would go uip once the mass transit system becomes operational. In order to capture the appreciation in the value of land, there is a concept of betterment levy. The concept of betterment levy differs from the premium FSI concept because while the premium FSI concept is voluntary, the betterment levy is mandatory. The concept of betterment tax find the place in the Bangalore Development Act, Section 20 of the Act reads as follows:- Levy of betterment tax: (1) Where as a consequence of execution of any development scheme, the market value of any land in the area comprised in the scheme which is not required for the execution thereof has in the opinion of the Authority, increased or will increase, the authority shall be entitled to levey on the owner of the land or any person having an interest therein, a betterment tax in respect of the increase in value of the land resulting from the execution of such scheme. (2) Such increase in value shall be the amount by which the value of the land, on the completion of the execution of the scheme, estimated as if the land were clear of buildings exceeds the value of the land prior to the execution of the scheme estimated in like manner, and the betterment tax shall be one-third of such increase in value. It is proposed that this tax may be levied only on a case to case basis on certain categories of properties and on the land holdings, the size of which exceeds a minimum threshold. It may also be stipulated that the betterment levy should be imposed in impact areas only and the impact areas should be defined as the areas, which fall within a fixed distance, say one Km. of the Urban transport corridor. The concept of Betterment levy also finds a mention under the Karnataka Municipalities Act. However, this provision for levy of betterment tax need to be recast in view of the recent important developments in the major infrastructure projects. It is, therefore, proposed to bring a comprehensive self contained amendment to the Karnataka Town and Country Planning Act so that a mechanism of betterment tax could be levied all over the State by the concerned Planning Authority. A conservative estimate of revenue on above innovative financing instruments is tabulated below: Table: 18.2 Estimate Of Revenue On Innovative Financing Instruments Source Estimated upfront yield Premium floor area ratio (far) INR 600 CR Additional cess on approval of new projects / developments INR 50 CR Construction and Exploitation of Commercial space near Infra project INR 100 CR Other Sources - Naming rights / advertising INR 250 CR Premium access ways / ramps / naming rights INR 300 CR Change of land use fees INR 25 CR Betterment levy INR 50 CR Total INR 1375 CR Bangalore Metro Phase-IIA DPR : K.R.Puram Silk Board October 2016 Page 18-4
239 CHAPTER 18 FINANCING OPTIONS INNOVATIVE FANANCING 18.3 FINANCING OPTIONS Although the efforts will be made to mobilize funds through innovative financing to start the project and also to indicate a firm commitment of the State Government, the project would require some contribution from the State budget / Central budget. In addition, the BMRCL has in possession some land parcels which were acquired for Phase-1 and Phase-2, which could be offered for commercial development. The BMRCL would also be in a position to mobilize revenues through long term lease of these land parcels. It is estimated that the BMRCL would be able to mobilize a sum of Rs.500 Crores through long term lease of the lands which has in its possession. In addition, it is also porposed that the State Government can give a contribution of Rs. 500 Crores over three years of project execution period Different scenarios for innovative financing Since the innovative financing is being tried for the first time, it will be difficult to accurately forecast the actual amount which could be mobilized through this technique. Therefore, for the purpose of financing analysis, three different scenarios have been used (a) Pessimistic, (b) Optimistic and (c) Most likely. In the Pessimistic scenario, it is being presumed that there would be no mobilization through innovative financing and such being the case, the project would be funded by the contribution from the State Government / Government of India / BMRCL and from borrowings. Since the contribution of the State Government and the BMRCL has been pegged at Rs Crores, the balance amount of Rs. 3,200 Crores would be mobilized through borrowings. In the Optimistic scenario, it is estimated that the BMRCL would be able to mobilize a sum of Rs Crores by way of innovative financing. If this happens, the borrowings would reduce to Rs Crores and the contribution of the State Government and the BMRCL would be Rs Crores. In the Most Likely scenario, it is estimated that the fund mobilization through Innovative financing would be about Rs Crores thus restricting the borrowing to about Rs.2100 Crores. The primary contribution would continue to be Rs Crores. The three scenarios have been described in details in the table below: S. no. 1 2 Table: 18.3 Scenario analysis for funding options (RUPEES IN CRORE) Funding Source Central Govt / State Govt contribution (equity / sub debt) Internal generation by BMRCL through leasing of surplus land Scenario 1 Pessimistic Scenario 2 Most likely Scenario 3 Optimistic Innovative financing % P A Grand total Bangalore Metro Phase-IIA DPR : K.R.Puram Silk Board October 2016 Page 18-5
240 CHAPTER 18 FINANCING OPTIONS INNOVATIVE FANANCING 18.4 TAX REIMBURSEMENT Both during Phase-1 and Phase-2, all the taxes which accrued to the State Government because of various levies on the project, were reimbursed to BMRCL. The same arrangement should be continued for this ORR line also. The total amount on tax reimbursement would be Rs. 336 Crores at an average rate of 8% of the project cost. Bangalore Metro Phase-IIA DPR : K.R.Puram Silk Board October 2016 Page 18-6
241 CHAPTER 19 FINANCIAL ANALYSES - FIRR 19.1 INTRODUCTION 19 FINANCIAL ANALYSIS FIRR Financial analysis is done based on revenue and cost figures as estimated in the projected cash inflow and outflow for each year as tabulated in Table 19.1 Table 19.1 Capital Cost of Project Sl.No Particulars Amount in Crores 1 Land Alignment and Formation Sation Buildings Permanent-Way Depot at Whitefield Miscellaneous 96 7 Traction & Power Supply E&M Works Rolling Stock (SG) Signalling and Telecom Road restoration etc., 32 Total FACTORING IN INNOVATIVE FINANCING: In the above analysis the component of innovative financing has been taken as zero. But as mentioned in Chapter 18 on innovative financing substantial amount would be contributed through innovative financing. Therefore, 3 different scenarios for innovative financing have been considered as under: 1. Pessimistic 2. Optimistic 3. Most likely 19.3 ASSUMPTIONS: The primary assumptions are: 1. Promoters contribution would be Rs.1000 crore a) Central Government/State Government would contribute Rs.500 Crore. b) Internal generation by BMRC through leasing of surplus land Rs.500 crore 2. Borrowing & innovative financing would be interchanged based on the estimate for each of the scenarios. 3. State Government would reimburse taxes of Rs.336 crore approximately. BMRCLwould not be liable to pay Income Tax due to accumulated depreciation & losses from Phase I & Phase II operations. Bangalore Metro Phase-IIA DPR : K.R.Puram Silk Board October 2016 Page19-1
242 CHAPTER 19 FINANCIAL ANALYSES - FIRR Scenario-1: Pessimistic In the pessimistic scenario, it is assumed that nothing would be mobilised through innovative financing. With this presumption, the FIRR is worked out as in Table 19.2 Table 19.2: PESSIMISTIC SCENARIO - FIRR (INR IN CRORE) SNAP SHOT - INFLOW OWNERS FUNDS INNOVATIVE FIN - 0 BORROWINGS TAX REIMB TOTAL INFLOW OUTFLOW CAPEX 4200 IDC 287 TOAL 4487 CASH FLOW PROJECTIONS FROM OPERATIONS Year OWNE RS FUND S CAPITAL REVENUE FIRR INFLOW OUTFLOW INFLOW OUTFLOW INNO VATIV E FINA NCIN G TAX REIM B BORR OWIN G CAPE X INT DURIN G CONS T LOAN REPAY MENT Fare Box Revenu e Non FareBox Revenue Staff Costs Mainten ance Costs Refer to Table No Energy Consumpt ion Costs Intere st Depreci ation (288) Net cash flow FIRR 11.35% Bangalore Metro Phase-IIA DPR : K.R.Puram Silk Board October 2016 Page19-2
243 CHAPTER 19 FINANCIAL ANALYSES - FIRR Scenario-2: Optimistic In the optimistic scenario, it is assumed that a sum of Rs.1,968 crores only would be mobilised through innovative financing in the first 3 years (spread equally). With this presumption, the FIRR is worked out as in Table below: Table 19.3 : OPTIIMISTIC SCENARIO - FIRR (INR IN CRORE) SNAP SHOT - INR IN CR INFLOW OWNERS FUNDS INNOVATIVE FIN BORROWINGS TAX REIMB TOTAL OUTFLOW CAPEX 4200 IDC 104 TOTAL 4304 CASH FLOW PROJECTIONS FROM OPERATIONS Year OWN ERS FUND S INNOV ATIVE FINAN CING CAPITAL REVENUE FIRR INFLOW OUTFLOW INFLOW OUTFLOW TAX REI MB BORROWI NG CAP EX INT DURING CONST LOAN REPAY MENT Fare Box Reven ue Non FareB ox Reven ue Staff Costs Mainten ance Costs Refer to Table No Energy Consump tion Costs Intere st Depre ciation (104.00) Net cash flow FIRR 20.27% Bangalore Metro Phase-IIA DPR : K.R.Puram Silk Board October 2016 Page19-3
244 CHAPTER 19 FINANCIAL ANALYSES - FIRR Scenario-3: Most likely In the most likely scenario, it is assumed that a sum of Rs.1,067 crores only would be mobilised through innovative financing in the first 3 years (spread equally). With this presumption, the FIRR is worked out as in Table below: Year SNAP SHOT - INR IN CR INFLOW OWNERS FUNDS INNOVATIVE FIN BORROWINGS TAX REIMB TOTAL OWN ERS FUN DS INNO VATIV E FINA NCIN G TAX REI MB Table 19.4 : MOST LIKELY SCENARIO - FIRR (INR IN CRORE) OUTFLOW CAPEX 4200 IDC 189 TOTAL 4389 CASH FLOW PROJECTIONS FROM OPERATIONS CAPITAL REVENUE FIRR INFLOW OUTFLOW INFLOW OUTFLOW BOR CAP Fare Box Staff Mainten Inter Net cash ROWI EX Revenue Costs ance est flow NG Costs INT DU RIN G CO NST LOAN REPA YMEN T Non Fare Box Reve nue Refer to Table No Energy Consum ption Costs De pre cia tio n ,18-3, ,028 30, ,032-1,134-2, ,577 FIRR 15.27% Bangalore Metro Phase-IIA DPR : K.R.Puram Silk Board October 2016 Page19-4
245 CHAPTER 19 FINANCIAL ANALYSES - FIRR 19.4 CONCLUSION As seen from the above, the project is financially viable even in pessimistic scenario as FIRR (11.35%) is more than the hurdle rate (9%) and that too without any contribution from innovative financing. This is predominantly due to the following reasons: 1. Cost of construction on this line will be less as compared to other corridors because there is no tunnel and even the height of the viaduct is being optimized. Added to this, there is no significant land acquisition cost for the viaduct. 2. The ridership is expected to be more than other lines because of high concentration of IT companies along this corridor and rapid transport facility is the need of the hour. Thus there is enough justification to take up this project. Bangalore Metro Phase-IIA DPR : K.R.Puram Silk Board October 2016 Page19-5
246 CHAPTER 20 ECONOMIC ANALYSIS 20 ECONOMIC ANALYSIS 20.1 INTRODUCTION The objective of the cost- benefit analysis is to identify and quantify the economic benefits and costs associated with the project (implementation of 17 kms of metro corridor: K. R. Puram Silk Board Corridor in Bangalore), in order to select the optimum solution along with the economic viability in terms of its likely investment return potential. The cost benefit analysis is carried out by using the Discounted Cash Flow (DCF) technique to obtain the Economic Internal Rate of Return (EIRR %) for the proposed investments linked with the project ECONOMIC ANALYSIS APPROACH The economic appraisal of the metro system has been carried out within the broad framework of Social Cost Benefit Analysis Technique. It is based on the incremental costs and benefits and involves comparison of project costs and benefits in economic terms under the with and without project scenario. In the analysis, the cost and benefit streams arising under the above project scenarios have been estimated in terms of market prices and economic values have been computed by converting the former using appropriate factors. The annual streams of project costs and benefit have been compared over the entire analysis period to estimate the net cost/ benefit and to calculate the economic viability of the project in terms of EIRR ANALYSIS PERIOD The analysis period of the project is taken as 30 years from the base year 2017 as follows: Base Year Construction period 2017 to 2019 (3 years) Project opening for traffic 2020 End of the analysis period 2046 No. of operating years, considered for economic analysis 30 years 20.4 ESTIMATION OF COSTS The project cost stream comprises capital cost, operation and maintenance cost. Cost components considered for the purpose of this exercise include: Capital cost of infrastructure Operation and Maintenance cost of the system The capital cost for economic analysis is taken as Rs Crores. The Operation & Maintenance Cost (O & M cost) is as worked out in the respective Chapter. Bangalore Metro Phase-IIA DPR : K.R.Puram Silk Board October 2016 Page 20-1
247 CHAPTER 20 ECONOMIC ANALYSIS 20.5 ESTIMATION OF BENEFITS The proposed metro will yield tangible and non-tangible savings due to equivalent reduction in road traffic and certain socio-economic benefits. Introduction of metro will result in reduction in number of buses, usage of private vehicles, air pollution and increase the speed of road-based vehicles. This, in turn, will result in significant social benefits due to reduction in fuel consumption, vehicle operating cost and travel time of passengers. Reduction in accidents, pollution and road maintenance costs are the other benefits to the society in general. The benefit stream that could be evaluated and quantified includes: Capital and operating cost (on present congestion norms) of carrying the total volume of passenger traffic by existing bus system and private vehicles in case the metro project is not taken up. Savings in operating costs of all buses and other vehicles due to de-congestion including those that would continue to use the existing transport network even after the metro is introduced. 1. Savings in time of commuters using the metro over the existing transport modes because of faster speed of metro. 2. Savings in cost of externalities due to reduction in emissions. 3. Savings in time of those passengers continuing on existing modes, because of reduced congestion on roads 4. Savings in fuel consumption on account of less number of vehicles on road and decongestion effect with introduction of metro are included in those of vehicle operating cost ESTIMATION OF MONEY VALUE OF TIME SAVED One of the major advantages of having a metro system would be saving in the time for people using this corridor. It is estimated that everyday there would be 3.1 lakhs passenger trips on this corridor though the passengers would be coming on the metro would be arriving from far away distance and for the purpose of present analysis, we have confined the benefit accruing out of this stretch. On an average passengers would be travelling a length of about 17 kms in this corridor resulting in saving of 15 minutes per day per person per trip. This estimation is on the conservative side. Furthermore, the factors like value of comfort, value of certainty of travel and value of safety would be a further add on. However, for the purpose of present analysis, the benefit which has been quantified is only the money value of the travel time saved. The total travel time saved per day for all the passengers put together would be 77,500 hours. Assuming a salary of Rs.200 per hour (which is again on the conservative side), the total money value for time saved would be Rs.1.55 crores (77,500 x 200) per day. For the entire year, this saving would translate into Rs.388 crores. For every subsequent year, this figures has been escalated by 10% year on year. Bangalore Metro Phase-IIA DPR : K.R.Puram Silk Board October 2016 Page 20-2
248 CHAPTER 20 ECONOMIC ANALYSIS 20.7 ESTIMATING THE SAVING IN COST OF EMISSIONS It is estimated that in the year 2020, there would be 3.1 lakh passenger trip per day on this corridor. In effect, emissions with these many trips by other modes would come down as passengers would shift from other modes and adopt the metro. The daily passenger trips of 3.1 lakhs would be a switch over from 2 wheelers, 4 wheelers and buses in the following ratio. a. Buses 40% b. 2 Wheelers 30% c. 4 wheelers 30% Figure 20.1 Mode-wise Share of Traffic 30% 40% Bus Two Wheelers Four Wheelers 30% Applying the above modal shift shown in the figure above, the vehicle kms (VKM) saved in different modes is estimated as follows: a) Buses 31,886 vkm b) 2 Wheelers 5,97,857 vkm c) 4 wheelers 3,34,800 vkm The marginal external cost for each one of these modes has been taken from a study Estimating marginal external cost of transport in Delhi (Akshaya Kumar Sen, GeetamT iwari, Vrajaindra Upadhyay ) This study had arrived at the following marginal external cost of urban transport as shown in Table below. Bangalore Metro Phase-IIA DPR : K.R.Puram Silk Board October 2016 Page 20-3
249 CHAPTER 20 ECONOMIC ANALYSIS Table20.1 : Total Marginal Cost of Urban Transport (Rs/VKM)* Vehicle Type Congestion Air pollution Accidents Noise Total Total(USD/VKM) Petrol Car Peak small Peak big Off-peak small Off-peak big Diesel Car Peak small Peak big Off-peak small Off-peak big Bus Peak Off-peak * Aksaya Kumar Sen, Geetam Tiwari, Vrajaindraa Upadhayay 2009, Estimating marginal external cost of transport in Delhi, Transport Policy, 17 Page: Based on above Table, the marginal external cost for the year 2016 has been estimated as follows: a. Buses : Rs.52 per km b. 2 Wheelers : Rs.13 per km c. 4 wheelers : Rs.3.6 per km Applying the above marginal cost, the saving on account of switch over from other modes of transport to Metro for this corridor is estimated as follows: Table 20.2: Savings on Account on Emission (Rs. Lakhs per Day) Buses Wheelers wheelers Total These costs are for the year We have not escalated this cost for 2016 even for However, after 2020, these costs would escalated at 5%. The annual escalation has been kept on Bangalore Metro Phase-IIA DPR : K.R.Puram Silk Board October 2016 Page 20-4
250 CHAPTER 20 ECONOMIC ANALYSIS the lower side presuming that vehicular technology would improve and would mitigate the emission costs to some extent. Scenario analysis by factoring in innovative financing for project funding: As discussed in the chapter on Financing Options and Financial Analysis, there are three scenarios and analysis thereof are as under: : 1. Pessimistic 2. Optimistic 3. Most likely Table 20.3: Scenario analysis for funding options (RUPEES IN CRORE) S no 1 2 Funding Source Central Govt / State Govt contribution (equity / sub debt) Internal generation by BMRCL through leasing of surplus land Scenario 1 Pessimistic Scenario 2 Most likely Scenario 3 Optimistic Innovative financing % P A Grand total EIRR under above scenarios is worked out as discussed below Scenario-1: Pessimistic In the pessimistic scenario, it is assumed that minimum promoters contribution would be Rs.1,000 crores and nothing would be mobilised through innovative financing. Hence the balance amount of Rs 3200 crore would need to be borrowed.. With this presumption, the EIRR is worked out as in Table Scenario-2: Most Likely In the most likely scenario, it is assumed that a sum of Rs. 1,000 crore would be contributed by promoters (as in scenario 1) and Rs 1,100 crores would be mobilised through innovative financing in the first 3 years (spread equally), while borrowing would be to the tune of Rs 2100 crore. With this presumption, the EIRR is worked out as in Table Scenario-3: Optimistic In the optimistic scenario, it is assumed that a sum of Rs 1000 crore would be contributed by the promoters, Rs.2,100 Crore would be mobilized through innovative financing in the first 3 years (spread equally) whereas balance Rs 1100 crore would be through borrowing. With this presumption, the EIRR is worked out as in Table 20.6 Bangalore Metro Phase-IIA DPR : K.R.Puram Silk Board October 2016 Page 20-5
251 CHAPTER 20 ECONOMIC ANALYSIS Year OWNERS FUNDS SNAP SHOT - INR IN CR INFLOW OWNERS FUNDS INNOVATIVE FIN - 0 BORROWINGS TAX REIMB TOTAL INFLOW INNOVATIVE FINANCING OUTFLOW CAPEX 4200 IDC 287 TOAL 4487 Table 20.4: Case 1: PESSIMISTIC SCENARIO (INR IN CRORE) CASH FLOW PROJECTIONS FROM OPERATIONS CAPITAL REVENUE FIRR ECONOMIC EIRR INFLOW OUTFLOW INFLOW OUTFLOW TAX REIMB BORROWING CAPEX INT DURING CONST LOAN REPAYMENT Fare Box Revenue Non FareBox Revenue Staff Costs Maintenance Costs Refer to Table No Energy Consumption Costs Interest Depreciation Net cash flow Time Saving Costs Emmission Saving Costs Net ECONOMIC BENEFIT (287.86) Note: Income tax is considered as zero for all these years due to depreciatio and carry forward lossess of BMRCL as a whole % 47.80% EIRR in this case comes to 47.08%. Bangalore Metro Phase-IIA DPR : K.R.Puram Silk Board October 2016 Page 20-6
252 CHAPTER 20 ECONOMIC ANALYSIS Year OWNERS FUNDS SNAP SHOT - INR IN CR INFLOW OWNERS FUNDS INNOVATIVE FIN BORROWINGS TAX REIMB TOTAL INNOVATIVE FINANCING Table 20.5 Scenario 2: MOST LIKELY SCENARIO - EIRR (INR IN CRORE) OUTFLOW CAPEX 4200 IDC 189 TOTAL 4389 CASH FLOW PROJECTIONS FROM OPERATIONS CAPITAL REVENUE FIRR EIRR INFLOW OUTFLOW INFLOW OUTFLOW TAX REIMB BORROWING CAPEX INT DURING CONST LOAN REPAYMENT Fare Box Revenue Non FareBox Revenue Staff Costs Maintenance Costs Refer to Table No Energy Consumption Costs Interest Depreciation Net cash flow Time Saving Costs Emmission Saving Costs Net ECONOMIC BENEFIT (189.00) Note: Income tax is considered as zero for all these years due to depreciatio and carry forward lossess of BMRCL as a whole % 55.69% EIRR in this case comes to 55.69%. Bangalore Metro Phase-IIA DPR : K.R.Puram Silk Board October 2016 Page 20-7
253 CHAPTER 20 ECONOMIC ANALYSIS Year SNAP SHOT - INR IN CR INFLOW OWNERS FUNDS INNOVATIVE FIN BORROWINGS TAX REIMB TOTAL OWNER S FUNDS INNOVATIV E FINANCING OUTFLOW CAPEX 4200 IDC 104 TOTAL 4304 Table 20.6 Scenario 3: OPTIMISTIC - EIRR (INR IN CRORE) CASH FLOW PROJECTIONS FROM OPERATIONS CAPITAL REVENUE FIRR EIRR INFLOW OUTFLOW INFLOW OUTFLOW Time Interes Depreciatio Savin TAX REIM B BORROWIN G CAPE X INT DURING CONST LOAN REPAYMEN T Fare Box Revenu e Non FareBox Revenu e Staff Costs Maintenanc e Costs Refer to Table No Energy Consumptio n Costs n Net cash flow g Costs Emmissio n Saving Costs Net ECONOMI C BENEFIT (104.00) Note: Income tax is considered as zero for all these years due to depreciatio and carry forward lossess of BMRCL as a whole. FIRR % EIRR 62.78% EIRR in this case comes to 62.78% Bangalore Metro Phase-IIA DPR : K.R.Puram Silk Board October 2016 Page 20-8 t
254 CHAPTER 20 ECONOMIC ANALYSIS 20.8 CONCLUSION From the above analysis, it is clear that the project gives very large quantum of Economic benefits. In the most pessimistic scenario, i.e. where there is no innovative financing contribution, in that case also, the EIRR, works out to 47.80% Even this EIRR, is conservative estimate. As from out of the several benefits which accrue to travelers as well as citizens, only two factors value of travel time saved, and saving in external cost due to emissions, have been reckoned. The other savings have not been factored in. Had they also been factored in, the EIRR would have been much greater. Bangalore Metro Phase-IIA DPR : K.R.Puram Silk Board October 2016 Page 20-9
255 CHAPTER 21 IMPLEMENTATION PLAN 21 IMPLEMENTATION PLAN 21.1 BACKGROUND As mentioned earlier in the DPR, the area around this corridor is a fast growing area with very heavy vehicular traffic on the existing roads. The construction of Metro on this line would involve blocking of about 9 meters in the middle of the road which would in effect mean that the availability of the road for the traffic would be reduced from 3 lanes to 2 lanes each way. Although there are service roads on both sides throughout the alignment and these service roads would be merged with the main carriage way at several locations. In spite of these modifications to the road, the vehicular traffic would be adversely affected during the construction phase. Therefore, efforts have been made to ensure that the project completion time is brought down to minimum. There are several factors which favor quick construction of metro line over this alignment. Firstly, no major land acquisition is involved specially in the viaduct portion. The grade separators could have posed a major problem, but all the grade separators have been so designed such that there are split flyovers and even for underpasses there is enough space between the two main Carriageways on either side, where the viaduct could be accommodated without any major problem. Another factor in favor of this alignment is that there would be no sharp horizontal or vertical curves as the construction of the ORR has ensured that sharp curves on the roads are totally eliminated. Moreover, there is no underground portion or tunneling which needs to be done in this stretch. The actual construction work can commence immediately after award of tender as no land acquisition is involved for viaduct portion. Even for the station portions, the work can be commenced and the land requirement is only for the entry structure on either side, which will not affect the construction of the station structures. Because of the above factors, it is targeted to complete the entire project within a period of 36 months IMPLEMENTATION PLAN It is envisaged to complete the entire project within duration of 36 months. Activities with their completion time is given in table 21.1 below Bangalore Metro Phase-IIA DPR : K.R.Puram Silk Board October 2016 Page 21-1
256 CHAPTER 21 IMPLEMENTATION PLAN Table 21.1 Implementation Plan Sl. No. Activities Start End Duration 1 Mobilization of equipment rigs casting yard etc Land acquisition in station duration Mobilization and commissioning of launching girders Completion of pile and pile cap works Completion of pier and pier cap work Erection of segments Completion of station work Completion of parapet Erection of tracks and fittings Architectural finishing Traction, E&M and Signaling works The Bar Chart showing the same is shown in the Figure Many of the activities may be over lapping the entire work will be completed in 36 months from the date of award of the work. Bangalore Metro Phase-IIA DPR : K.R.Puram Silk Board October 2016 Page 21-2
257 CHAPTER 22 FUTURE EXTENSION 22 FUTURE EXTENSION Preamble 22.1 BACKGROUND The present DPR has proposed the construction of metro line from Central Silk Board to K.R.Puram, which is about 18 km in length. This line has to be serviced by a depot. Non-availability of land on this corridor necessitates that from K.R.Puram the line is extended to existing Baiyappanahalli depot which is about 2½ km away. Thus the Baiyappanahalli depot would be servicing this line. Since the Baiyappanahalli depot was constructed in Phase-1 primarily to service the East-West line, a new depot at Whitefield would have to be constructed to service the East-West line. The construction of depot at Whitefield has therefore been included as a part of this DPR FUTURE EXTENSION As per the Feasibility Report prepared by M/s.RITES, it has been recommended that the entire corridor from Central Silk Board via K.R.Puram upto Hebbal and even beyond gets covered by a metro line. Thus, ultimately this line from K.R.Puram would have to be extended all along the ORR at least till Hebbal. The alignment showing stations of this line beyond K.R.Puram and upto Hebbal is given in Figure The distance between K.R.Puram to Hebbal is about 12 km and about 11 stations can b e planned to be constructed in this alignment. The proposed location of the stations is as follows: List of Stations is as under: i. TIN Factory Bus Stand ii. Kasturi Nagar Bus Stand iii. Vijaya Bank Colony iv. Babusa Palya v. Kalyan Nagar vi. HBR Layout vii. Nagawara viii. Manyata Tech Park ix. Jogappa Layout x. Kariyana Layout xi. Hebbal The current DPR deals with Metro line from Silk Board to K.R. Puram, which is about 18 kms in length from K.R.Puram this line is connected to Byappanahalli Depot which is about 2½ km from K.R. Puram. Thus there will be four lines running between K.R. Puram to Byappanahalli as the part of East-West corridor line from Byappanahalli to White Field in Figure 22.2 Bangalore Metro Phase-IIA DPR : K.R.Puram Silk Board October 2016 Page 22-1
258 CHAPTER 22 FUTURE EXTENSION 22.3 STABLING LINES Ideally speaking, a depot at both the ends on this line from Central Silk Board to Hebbal would have been desirable. But, the non-availability of big chunk of open space along this alignment makes locating this depot at the two extremities extremely difficult. Therefore, the capacity at Baiyappanahalli depot can be increased to hold another 10 trains and at the Hebbal end there is open land available and also there is air space over the BMTC depot which can be used for stabling 8 to 10 trains INTERCHANGE STATION Near Hennur road the alignment will swing towards the right side of the carriage way to form an interchange station with Nagawara underground phase-2 Metro station and the alignment will continue on right hand service road to reach the stabling lines. In future this will provide connection to the Airport. Bangalore Metro Phase-IIA DPR : K.R.Puram Silk Board October 2016 Page 22-2

259
CHAPTER 1 INTRODUCTION
 1.1 BANGALORE - A PROFILE CHAPTER 1 INTRODUCTION Founded by the feudal Chief KEMPE GOWDA under the great Vijay Nagar Kingdom in 1537 A.D., Bangalore the Capital of Karnataka State in the South Western
Ex-Ante Evaluation (for Japanese ODA Loan)
") Japanese ODA Loan Ex-Ante Evaluation (for Japanese ODA Loan) 1. Name of the Project Country: India Project: Delhi Mass Rapid Transport System Project Phase 2 (V) Loan Agreement: March 31, 2010 Loan Amount:
Japanese ODA Loan Ex-Ante Evaluation (for Japanese ODA Loan) 1. Name of the Project Country: India Project: Delhi Mass Rapid Transport System Project Phase 2 (V) Loan Agreement: March 31, 2010 Loan Amount:
Submission to Greater Cambridge City Deal
 What Transport for Cambridge? 2 1 Submission to Greater Cambridge City Deal By Professor Marcial Echenique OBE ScD RIBA RTPI and Jonathan Barker Introduction Cambridge Futures was founded in 1997 as a
Viable City bus in Small Cities
 Hearty Welcome to a presentation on Viable City bus in Small Cities N. Manjunatha Prasad, IAS Managing Director KARNATAKA STATE ROAD TRANSPORT CORPORATION In this presentation Mobility in Urban Areas.
Mobility of Gurugram & NCR-
 Mobility of Gurugram & NCR- Vision for Efficient Transport Systems By Sujata Savant Additional General Manger Urbanization and Mobility Urbanization & Mobility Magnitude 31% Indians live in urban areas
Three ULTra Case Studies examples of the performance of the system in three different environments
 Three ULTra Case Studies examples of the performance of the system in three different environments airport application: London Heathrow : linking business and staff car parks through the access tunnel
Road Map for Sustainable Transport Strategy for Colombo Metropolitan Region with Cleaner Air, through Experience
 Workshop on Air Quality and Environmentally Sustainable Transport April 28 th 2011 Don S. Jayaweera Road Map for Sustainable Transport Strategy for Colombo Metropolitan Region with Cleaner Air, through
Mysuru PBS Presentation on Prepared by: Directorate of Urban Land Transport
 Mysuru PBS Presentation on 04.11.2017 Prepared by: Directorate of Urban Land Transport Introduction to Mysuru Public Bicycle Sharing System Mysuru Public Bicycle Sharing System Bicycle based transportation
How to manage large scale infrastructures? Infrastructure planning within Toulouse s SUMP. Alexandre Blaquière. 1st December 2016
 How to manage large scale infrastructures? Infrastructure planning within Toulouse s SUMP Alexandre Blaquière 1st December 2016 The challenges for development and attractiveness of the Greater Toulouse
TRAVEL DEMAND FORECASTS
 Jiangxi Ji an Sustainable Urban Transport Project (RRP PRC 45022) TRAVEL DEMAND FORECASTS A. Introduction 1. The purpose of the travel demand forecasts is to assess the impact of the project components
Initiatives on BMTC. BMTC - Bringing Bangalore to your Door Steps. By MUKKANNA.B Chief Mechanical Engineer BMTC, Bangalore 18/12/2015
 Initiatives on Air Quality and Transportation Challenge in BMTC By MUKKANNA.B Chief Mechanical Engineer BMTC, Bangalore 18/12/2015 BMTC - Bringing Bangalore to your Door Steps Presentation Structure Context:
Back ground Founded in 1887, and has expanded rapidly Altitude about 2500 meters above MSL Now among the ten largest cities in Sub Saharan Africa
 Back ground Founded in 1887, and has expanded rapidly Altitude about 2500 meters above MSL Now among the ten largest cities in Sub Saharan Africa Annual growth rate is 3.8% By 2020 population growth would
Dr. K. Gunasekaran Associate Professor Division of Transportation Engineering Anna University Chennai
 Dr. K. Gunasekaran Associate Professor Division of Transportation Engineering Anna University Chennai INTRODUCTION Bus Transport is the most preferred Public Transport System in many Indian cities Recent
STUDY ON IMPLEMENTING THE EFFICIENT TRANSPORTATION SYSTEM
 STUDY ON IMPLEMENTING THE EFFICIENT TRANSPORTATION SYSTEM INTRODUCTION India is poised for rapid economic growth India growth largely come from secondary& tertiary sectors (industrial& service sectors)
Public Transportation Problems and Solutions in the Historical Center of Quito
 TRANSPORTATION RESEARCH RECORD 1266 205 Public Transportation Problems and Solutions in the Historical Center of Quito JACOB GREENSTEIN, Lours BERGER, AND AMIRAM STRULOV Quito, the capital of Ecuador,
CHAPTER 20 MOTOR VEHICLES
 CHAPTER 20 MOTOR VEHICLES 20.1 In India the first car ran on roads in 1897. Prior to independence in the 1940s India had no automobile industry to speak of. Cars were brought into the country in a knocked
Sustainable Urban Transport Index (SUTI)
") Sustainable Urban Transport Index (SUTI) City Comparisons & Way Forward PROF. H.M SHIVANAND SWAMY, CEPT UNIVERSITY DHAKA SEPTEMBER 12, 2018 Purpose Discussion of Results from 5 Cities Reflections on the
Sustainable Urban Transport Index (SUTI) City Comparisons & Way Forward PROF. H.M SHIVANAND SWAMY, CEPT UNIVERSITY DHAKA SEPTEMBER 12, 2018 Purpose Discussion of Results from 5 Cities Reflections on the
US 81 Bypass of Chickasha Environmental Assessment Public Meeting
 US 81 Bypass of Chickasha Environmental Assessment Public Meeting March 14, 2013 Introductions ODOT FHWA SAIC Meeting Purpose Present need for bypass Provide responses to 10/04/11 public meeting comments
Japanese ODA Loan. Ex-ante Evaluation
 Japanese ODA Loan Ex-ante Evaluation 1.Name of the Project Country:Republic of the Philippines Project:Capacity Enhancement of Mass Transit Systems in Metro Manila Project Loan Agreement:27 March 2013
Travel Time Savings Memorandum
 04-05-2018 TABLE OF CONTENTS 1 Background 3 Methodology 3 Inputs and Calculation 3 Assumptions 4 Light Rail Transit (LRT) Travel Times 5 Auto Travel Times 5 Bus Travel Times 6 Findings 7 Generalized Cost
Car Sharing at a. with great results.
 Car Sharing at a Denver tweaks its parking system with great results. By Robert Ferrin L aunched earlier this year, Denver s car sharing program is a fee-based service that provides a shared vehicle fleet
Transit Fares for Multi-modal Transportation Systems
 Transit Fares for Multi-modal Transportation Systems Dr. Jeffrey M. Casello Associate Professor School of Planning Department of Civil and Environmental Engineering University of Waterloo Transport Futures
PUBLIC TRANSPORT IMPROVEMENT, PLANNING AND OPERATIONS.
 PUBLIC TRANSPORT IMPROVEMENT, PLANNING AND OPERATIONS. Email: mohamed.kuganda@udagroup.co.tz Mobile: +255754 810570 Presentation by: Eng. Mohamed Kuganda Chief Operations Officer UDART Plc - TANZANIA PRESENTATION
Planning for Sustainable Urban Transport Systems in India - Strengths and Weaknesses
 Planning for Sustainable Urban Transport Systems in India - Strengths and Weaknesses O.P. Agarwal Presented on 22 nd September at Kathmandu United Nations ESCAP KOTI Expert Group Meeting on Planning and
Executive Summary. Draft Environmental Impact Statement/Environmental Impact Report ES-1
 Executive Summary Introduction The Eastside Transit Corridor Phase 2 Project is a vital public transit infrastructure investment that would provide a transit connection to the existing Metro Gold Line
Transport Sector Performance Indicators: Sri Lanka Existing Situation
 Transport Sector Performance Indicators: Sri Lanka Existing Situation Amal S. Kumarage Professor, Department of Civil Engineering, University of Moratuwa Chairman, National Transport Commission kumarage@sltnet.lk
The Engineering Department recommends Council receive this report for information.
 CORPORATE REPORT NO: R161 COUNCIL DATE: July 23, 2018 REGULAR COUNCIL TO: Mayor & Council DATE: July 19, 2018 FROM: General Manager, Engineering FILE: 8740-01 SUBJECT: Surrey Long-Range Rapid Transit Vision
The project faces a number of challenges:
 On-Track Light Rail Project The Ministry of Transport of the city of Gotham is proposing to construct an elevated 20- kilometer light rail transit (LRT) with 5 passenger stations, connecting several nearby
World Bank Support to Urban Transport in India
 World Bank Support to Urban Transport in India A Proposed Framework for Bank Engagement in UT New Delhi, November 25 2006 Outline Key UT issues Government of India s leading efforts Objectives of Bank
Urban Transport systems in major cities in China. Sun Kechao Senior Engineer China Academy of Transportation Sciences, Beijing, China
 Urban Transport systems in major cities in China Sun Kechao Senior Engineer China Academy of Transportation Sciences, Beijing, China Part 1 Part 2 Part 3 Part 4 Introduction Urban transport policies Urban
FREQUENTLY ASKED QUESTIONS
 FREQUENTLY ASKED QUESTIONS 2018 What is the More MARTA Atlanta program? The More MARTA Atlanta program is a collaborative partnership between MARTA and the City of Atlanta to develop and implement a program
CLEAN VEHICLES AND SUSTAINABLE MOBILITY ROADMAP INITIATIVES IN SENEGAL
 REPUBLIQUE DU SENEGAL MINISTRY OF INFRASTRUCTURE, LAND TRANSPORT AND THE OPENING UP EXECUTIF COUNCIL OF DAKAR URBAN TRANSPORT (CETUD) CLEAN VEHICLES AND SUSTAINABLE MOBILITY ROADMAP INITIATIVES IN SENEGAL
4 COSTS AND OPERATIONS
 4 COSTS AND OPERATIONS 4.1 INTRODUCTION This chapter summarizes the estimated capital and operations and maintenance (O&M) costs for the Modal and High-Speed Train (HST) Alternatives evaluated in this
Green Line Long-Term Investments
 Enhancements Short-term improvements to keep Austin moving. Investments Long-term projects to support our future. Mobility Hubs MetroRapid MetroRail MetroExpress Connectors Circulators Project Connect
Capital Needs Assessment Riders Advisory Council July2, 2008
 Capital Needs Assessment 2011-2020 Riders Advisory Council July2, 2008 1 Outline I. Capital Improvement Plan History II. Capital Improvement Plan Update III. Capital Needs Assessment State of Good Repair
New Business Models for the gmentation of Public Transport Capa. Amit Bhatt, Director - Integrated Transport, WRI India
 New Business Models for the gmentation of Public Transport Capa Amit Bhatt, Director - Integrated Transport, WRI India INDIA Population: 1.2 Billion (2011 Census) 2.5 2 1.5 1 0.5 0 The second-most populated
Madhya Pradesh Road Development Corporation: A Case Study of ADB Assistance for Institutional Development in the Transport Sector in India
 Madhya Pradesh Road Development Corporation: A Case Study of ADB Assistance for Institutional Development in the Transport Sector in India South Asia Transport Team Presented by Prodyut Dutt Asian Development
Policy Note. Vanpools in the Puget Sound Region The case for expanding vanpool programs to move the most people for the least cost.
 Policy Note Vanpools in the Puget Sound Region The case for expanding vanpool programs to move the most people for the least cost Recommendations 1. Saturate vanpool market before expanding other intercity
Amman Green Policies Projects and Challenges. Prepared by: Eng. Sajeda Alnsour Project coordinator Sept. 20, 2017
 Amman Green Policies Projects and Challenges Prepared by: Eng. Sajeda Alnsour Project coordinator Sept. 20, 2017 Amman: Demographics Greater AMMAN Municipality GAM Amman is the capital of Jordan with a
Strategic Plan
 2005-2015 Strategic Plan SUMMARY OF THE REVISED PLAN IN 2011 A decade focused on developing mass transit in the Outaouais A updated vision of mass transit in the region The STO is embracing the future
Executive Summary. Treasure Valley High Capacity Transit Study Priority Corridor Phase 1 Alternatives Analysis October 13, 2009.
 Treasure Valley High Capacity Transit Study Priority Corridor Phase 1 Alternatives Analysis October 13, 2009 Background As the Treasure Valley continues to grow, high-quality transportation connections
LIFE CYCLE COST ANALYSIS OF ALTERNATIVE PUBLIC TRANSPORT MODES. BY B. I. Singal, Ex Director General, Institute of Urban Transport
 LIFE CYCLE COST ANALYSIS OF ALTERNATIVE PUBLIC TRANSPORT MODES BY B. I. Singal, Ex Director General, Institute of Urban Transport WHY LIFE CYCLE COST ANALYSIS The choice of the PT mode is a key decision
Executive Summary. Phase 2 Evaluation Report. Introduction
 , Executive Summary Executive Summary Introduction TransLink and the Province of British Columbia sponsored a multi-phase study to evaluate alternatives for rapid transit service in the Broadway corridor
PROJECT INFORMATION DOCUMENT (PID) APPRAISAL STAGE
 APPRAISAL STAGE") Project Name PROJECT INFORMATION DOCUMENT (PID) APPRAISAL STAGE INDIA - Adoption of 3 Phase IGBT Technology in Indian Railways (IR) for EMUs (Electric Multiple Units) in Mumbai Suburban Area Leading to
Project Name PROJECT INFORMATION DOCUMENT (PID) APPRAISAL STAGE INDIA - Adoption of 3 Phase IGBT Technology in Indian Railways (IR) for EMUs (Electric Multiple Units) in Mumbai Suburban Area Leading to
Presentation 22 February 2019
 Presentation 22 February 2019 1 2 INTRODUCTION A policy simulation tool to identify cost-efficient urban mobility pathways for mitigating CO 2 emissions in Indian cities. Excel-based tool Policies that
Transportation Demand Management Element
 Transportation Demand Management Element Over the years, our reliance on the private automobile as our primary mode of transportation has grown substantially. Our dependence on the automobile is evidenced
The Indian Infrastructure Industry
 n The Indian Infrastructure Industry DIBD OMII Own Man In India October 2010 Introduction to the Indian Infrastructure Industry Macro level Key drivers Government initiatives Future projects Danish infrastructural
STUDY OF MOBILITY PLAN IN LIGHT OF UPCOMING METRO RAILWAY IN MEERUT CITY REROUTINGOF CITYBUSROUTES ALLOCATIONOFDEPOTSOFUPSRTCANDMCTSL
 Leaders-5 Mid Term Review STUDY OF MOBILITY PLAN IN LIGHT OF UPCOMING METRO RAILWAY IN MEERUT CITY REROUTINGOF CITYBUSROUTES ALLOCATIONOFDEPOTSOFUPSRTCANDMCTSL Authors: SANDEEP LAHA & PARVEZ BASHIR Introduction
ECONOMIC AND FINANCIAL ANALYSIS: PROJECT 1
 Integrated Road Investment Program (RRP SRI 47273) A. Introduction ECONOMIC AND FINANCIAL ANALYSIS: PROJECT 1 1. Sri Lanka s road network is dense and well laid out, providing basic access to the country
Parking Policy as a counter measure to promote public transport Case Study of Nehru Place, Delhi
 Parking Policy as a counter measure to promote public transport Case Study of Nehru Place, Delhi d Ravi Gadepalli Shakti Sustainable Energy Foundation Anusha Vaid itrans Pvt. Ltd. New Delhi, India India
Valley Metro Overview. ITE/IMSA Spring Conference March 6, 2014
 Valley Metro Overview ITE/IMSA Spring Conference March 6, 2014 Valley Metro Who Are We? Operate Regional Transit Services Valley Metro and Phoenix are region s primary service providers Light Rail and
The Case for. Business. investment. in Public Transportation
 The Case for Business investment in Public Transportation Introduction Public transportation is an enterprise with expenditure of $55 billion in the United States. There has been a steady growth trend
UCLA Lake Arrowhead Conference. October 18, 2010
 BART Click to Capacity edit Master Overview title style for UCLA Lake Arrowhead Conference October 18, 2010 0 BART Basics 360,000 daily riders 104 miles 43 stations 1.3 billion annual passenger miles 1
Metropolitan Council Budget Overview SFY
 Metropolitan Council Budget Overview SFY 2016-2017 H T t ti C itt House Transportation Committee February 4, 2015 Transit connects us to the places that matter Transportation Needs Grow as the Region Grows
Image from:
 Mercer County 1. Background Information Mercer County was carved out of surrounding counties in 1838 and has a history dating back to the Revolutionary War. It has 13 municipalities covering 226 square
TORONTO TRANSIT COMMISSION REPORT NO.
 Form Revised: February 2005 TORONTO TRANSIT COMMISSION REPORT NO. MEETING DATE: October 24, 2012 SUBJECT: DOWNTOWN RAPID TRANSIT EXPANSION STUDY (DRTES) PHASE 1 STRATEGIC PLAN ACTION ITEM RECOMMENDATIONS
ACCIDENT STATISTICS. petrol/diesel have further lured the people for owning private cars. Road Accidents in Delhi 2015
 2 VEHICLE REGISTRATION AND ACCIDENT STATISTICS The city of Delhi is quite old and big; it also attracts a lot of people from different parts of the country being the capital and center of numerous activities,
CLRP. Performance Analysis of The Draft 2014 CLRP. Long-Range Transportation Plan For the National Capital Region
 NATIONAL CAPITAL REGION TRANSPORTATION PLANNING BOARD Item 12 CLRP Financially Constrained Long-Range Transportation Plan For the National Capital Region 2014 Performance Analysis of The Draft 2014 CLRP
MEDIA RELEASE. June 16, 2008 For Immediate Release
 MEDIA RELEASE June 16, 2008 For Immediate Release Recommendations to Keep Trolleys Released Alternative Proposal for Trolleys Ensures City s Sustainability The Edmonton Trolley Coalition, a non-profit
BRTS IN DHAKA: DESIGNING UNDER CONSTRAINTS
 BRTS IN DHAKA: DESIGNING UNDER CONSTRAINTS Noor E Alam, Ministry of Road Transport and Bridges, Bangladesh 2 nd ASIA BRTS, Ahmedabad, India Today s Overview 1 Dhaka and Mobility Pattern 2 Strategic Transport
CHAPTER 6 POWER SUPPLY ARRANGEMENTS
 6.1 Power Requirements CHAPTER 6 Power supply is the lifeline of Metro System POWER SUPPLY ARRANGEMENTS Electricity is required for operation of Metro system for running of trains, station services (e.g.
Study on Economic Partnership Projects. in Developing Countries in FY2010. Study on the Kiev Metro Line 4 in Kiev City, Ukraine SUMMARY.
 Study on Economic Partnership Projects in Developing Countries in FY2010 Study on the Kiev Metro Line 4 in Kiev City, Ukraine SUMMARY March 2011 第 1 章 第 2 章 The Ministry of Economy, Trade and Industry
CITY OF LONDON STRATEGIC MULTI-YEAR BUDGET ADDITIONAL INVESTMENTS BUSINESS CASE # 6
 2016 2019 CITY OF LONDON STRATEGIC MULTI-YEAR BUDGET ADDITIONAL INVESTMENTS BUSINESS CASE # 6 STRATEGIC AREA OF FOCUS: SUB-PRIORITY: STRATEGY: INITIATIVE: INITIATIVE LEAD(S): BUILDING A SUSTAINABLE CITY
Vehicle Miles Traveled in Massachusetts: Who is driving and where are they going?
 Vehicle Miles Traveled in Massachusetts: Who is driving and where are they going? A presentation to the House Committee on Global Warming and Climate Change Representative Frank Smizik, Chair April 13,
EUGENE-SPRINGFIELD, OREGON EAST WEST PILOT BRT LANE TRANSIT DISTRICT
 EUGENE-SPRINGFIELD, OREGON EAST WEST PILOT BRT LANE TRANSIT DISTRICT (BRIEF) Table of Contents EUGENE-SPRINGFIELD, OREGON (USA)... 1 COUNTY CONTEXT AND SYSTEM DESCRIPTION... 1 SYSTEM OVERVIEW... 1 PLANNING
CHAPTER 20 MOTOR VEHICLES
 CHAPTER 20 MOTOR VEHICLES 20.1 In India the first car ran on roads in 1897. Prior to independence in the 1940s India had no automobile industry to speak of. Cars were brought into the country in a knocked
Service and Operations Planning for Ottawa s New Light Rail Line Pat Scrimgeour
 Service and Operations Planning for Ottawa s New Light Rail Line Pat Scrimgeour Manager, Transit Service Planning and Reporting OC Transpo Ottawa, Ontario Ottawa Light Rail Project 12.5 km, 13 stations
Ministry of Environment and Forests. Ministry of Communication
 Developments in EST in Bangladesh Ministry of Environment and Forests & Ministry of Communication Thailand, 23 25 August 2010 Modes of Transport in Bangladesh Roads -60% Waterways -14% Railways -12% Airways
building liveable cities
 N 3-2016 building liveable cities + Combatting climate change North american mobility renaissance Holger Mette / El Panecillo hill and bus station, Quito Ecuador Deposit at 1080 Brussels - Price per copy
V03. APTA Multimodal Operations Planning Workshop August Green Line LRT
 V03 APTA Multimodal Operations Planning Workshop August 2016 Green Line LRT 2 Presentation Outline Past Present Future 3 16/03/2016 RouteAhead Update 4 4 16/03/2016 RouteAhead Update 5 5 16/03/2016 6 6
STRATEGIC PRIORITIES AND POLICY COMMITTEE MAY 5, 2016
 STRATEGIC PRIORITIES AND POLICY COMMITTEE MAY 5, 2016 Shift Rapid Transit Initiative Largest infrastructure project in the city s history. Rapid Transit initiative will transform London s public transit
TRANSIT FEASIBILITY STUDY Town of Bradford West Gwillimbury
 TRANSIT FEASIBILITY STUDY Town of Bradford West Gwillimbury Open House Presentation January 19, 2012 Study Objectives Quantify the need for transit service in BWG Determine transit service priorities based
IKORODU- CMS BRT EXTENSION PROJECT
 IKORODU- CMS BRT EXTENSION PROJECT A Presentation by SENIOR Environmental Specialist, Lagos Metropolitan Area Transport Authority Mr Omoniyi Isaac, at The Regional consultation on Air Quality, Clean Vehicles
UCLA Lake Arrowhead Conference. October 18, 2010
 BART Click to Capacity edit Master Overview title style for UCLA Lake Arrowhead Conference October 18, 2010 0 BART Basics 360,000 daily riders 104 miles 43 stations 1.3 billion annual passenger miles 1
UCLA Lake Arrowhead Conference. October 18, 2010
 BART Click to Capacity edit Master Overview title style for UCLA Lake Arrowhead Conference October 18, 2010 0 BART Basics 360,000 daily riders 104 miles 43 stations 1.3 billion annual passenger miles 1
London 2050 Infrastructure Plan
 London 2050 Infrastructure Plan RTPI London Future City Summit Michèle Dix 23 rd October 2014 The background to the 2050 London Infrastructure Plan is the city s expected strong population growth.. By
Indian engineering TRANSFORMING TRANSMISSION
 Indian engineering TRANSFORMING TRANSMISSION A 2016 NASA photo of India s electrification. India to become the world s first country to use LEDs for all its lighting needs by 2019 (photograph courtesy
The role of rail in a transport system to limit the impact of global warming
 The role of rail in a transport system to limit the impact of global warming 26 November 213 Gerard Drew, Beyond Zero Emissions Tilo Schumann, German Aerospace Centre (DLR) Overview CONTEXT Character of
Bringing Bus Rapid Transit to Tanzania
 DEVELOPMENT OF SUSTAINABLE PUBLIC TRANSPORT SYSTEM IN DAR ES SALAAM CITY PRESENTED AT URBAN ENVIRONMENT AFRICAN CARBON FORUM 2017 COTONOU, BENIN 28-30 JUNE 2017 Ir Fanuel O.S. Kalugendo Transport Planning
Converting BRT to LRT in the Nation s Capital Ottawa, Canada. John Manconi City of Ottawa Ottawa, Canada
 Converting BRT to LRT in the Nation s Capital Ottawa, Canada John Manconi City of Ottawa Ottawa, Canada 1 The Challenge *Mackenzie King Bridge Ottawa, AM peak period 2 The Challenge Ottawa s population
The City of Toronto s Transportation Strategy July 2007
 The City of Toronto s Transportation Strategy July 2007 Presentation Outline Transportation Statistics Transportation Building Blocks Toronto s Official Plan Transportation and City Building Vision Projects
Needs and Community Characteristics
 Needs and Community Characteristics Anticipate Population and Job Growth in the City Strongest density of population and jobs in Ann Arbor are within the Study Area Population expected to grow 8.4% by
ECONOMIC AND FINANCIAL ANALYSIS
 Second Jharkhand State Road Project (RRP IND 49125) ECONOMIC AND FINANCIAL ANALYSIS A. Introduction 1. The project involves capacity augmentation and rehabilitation of four state highway sections in the
Findings from the Limassol SUMP study
 5 th European Conference on Sustainable Urban Mobility Plans 14-15 May 2018 Nicosia, Cyprus Findings from the Limassol SUMP study Apostolos Bizakis Deputy PM General Information The largest city in the
Building on our strong position in China
 KONE CMD 2018 Building on our strong position in China WILLIAM B. JOHNSON, EXECUTIVE VICE PRESIDENT, GREATER CHINA SEPTEMBER 25, 2018 NAVIGATING IN A CHANGING MARKET ENVIRONMENT CAPTURING THE OPPORTUNITIES
Seoul. (Area=605, 10mill. 23.5%) Capital Region (Area=11,730, 25mill. 49.4%)
 Capital Region (Area=11,730, 25mill. 49.4%)") Seoul (Area=605, 10mill. 23.5%) Capital Region (Area=11,730, 25mill. 49.4%) . Major changes of recent decades in Korea Korea s Pathways at a glance 1950s 1960s 1970s 1980s 1990s 2000s Economic Development
Seoul (Area=605, 10mill. 23.5%) Capital Region (Area=11,730, 25mill. 49.4%) . Major changes of recent decades in Korea Korea s Pathways at a glance 1950s 1960s 1970s 1980s 1990s 2000s Economic Development
Aging of the light vehicle fleet May 2011
 Aging of the light vehicle fleet May 211 1 The Scope At an average age of 12.7 years in 21, New Zealand has one of the oldest light vehicle fleets in the developed world. This report looks at some of the
Embracing Smart Parking The Gurugram Story By Dr. Gaurav Antil, Joint Commissioner, MCG
 Embracing Smart Parking The Gurugram Story By Dr. Gaurav Antil, Joint Commissioner, MCG Gurugram: A Journey 1966 State of Haryana Formed, Gurgaon designated district 1990s Second wave of growth with real
More persons in the cars? Status and potential for change in car occupancy rates in Norway
 Author(s): Liva Vågane Oslo 2009, 57 pages Norwegian language Summary: More persons in the cars? Status and potential for change in car occupancy rates in Norway Results from national travel surveys in
All these significant changes indicate that there will be an all round quality consciousness in the country in future.
 PRACTICAL PROJECT EXECUTION KNOW-HOW REPORT ON ALLOY WHEELS MANUFACTURING PLANT (PRESENT and FUTURE Prospects, Market Size, Statistics, Trends, SWOT Analysis and Forecasts Upto 2020) Aluminum alloy wheels
The Motorcycle Industry in Europe. Powered Two-Wheelers the SMART Choice for Urban Mobility
 The Motorcycle Industry in Europe Powered Two-Wheelers the SMART Choice for Urban Mobility PTWs: the SMART Choice For Urban Mobility Europe s cities are main engines of economic growth, but today s urbanisation
Regional Integration of Public Transit - From the Perspective of a Transit Company. April 2019 Thomas Werner MVG Munich
 Regional Integration of Public Transit - From the Perspective of a Transit Company April 2019 Thomas Werner MVG Munich Facts about Munich Capital of the State of Bavaria Population: City ca. 1.5 million
CA PACITY TRA MWAY. November CODATU XVII High capacity tramway November
 CODA TU XVII HIGH CA PACITY TRA MWAY November 2017 CODATU XVII High capacity tramway November 2017 1 EGIS, A GLOBAL OFFER CODATU XVII High capacity tramway November 2017 2 EGIS & LIGHT RAIL TRANSIT European
Page 1 TRANSFORMING CITY BUS SERVICE - NOIDA
 Page 1 TRANSFORMING CITY BUS SERVICE - NOIDA PUBLIC TRANSPORT Urban travel in Indian cities predominantly happens through walking, cycling and public transport, including intermediate public transport
Transport systems integration into urban development planning processes
 Transport systems integration into urban development planning processes Phd. Vytautas Palevičius 2014-03-28 Klaipėda Šiauliai Panevėžys Kaunas Vilnius At the beginning of year 2013, Lithuania was populated
SYSTEM INTEGRATION. Railway and urban transport electrification Energy-efficient and reliable solutions
 SYSTEM INTEGRATION Railway and urban transport electrification Energy-efficient and reliable solutions 2 R A I LWAY & U R B A N T R A N S P O R T E L E C T R I F I C AT I O N S O L U T I O N S ABB s substation
UTA Transportation Equity Study and Staff Analysis. Board Workshop January 6, 2018
 UTA Transportation Equity Study and Staff Analysis Board Workshop January 6, 2018 1 Executive Summary UTA ranks DART 6 th out of top 20 Transit Agencies in the country for ridership. UTA Study confirms
Structure. Transport and Sustainability. Lessons from Past. The Way Forward
 1 Structure Transport and Sustainability Lessons from Past The Way Forward 2 Transport and Sustainability Consequences for fuel demand By 2025 more than half of the population in SSA will be living in
Yonge-Eglinton. Mobility Hub Profile. September 19, 2012 YONGE- EGLINTON
 September 19, 2012 PEEL YORK HALTON DURHAM HAMILTON TORONTO YONGE- EGLINTON MOBILITY HUBS: places of connectivity between regional and rapid transit services, where different modes of transportation come
SA TAXI IMPACT DELIVERING A SOCIAL & COMMERCIAL BENEFIT R18.6 BILLION LOANS ORIGINATED CREATING R2.9 BILLION LOANS ORIGINATED CREATING
 SA TAXI IMPACT DELIVERING A SOCIAL & COMMERCIAL BENEFIT SME EMPOWERMENT & ECONOMIC TRANSFORMATION SA Taxi facilitates asset ownership by black owned SMEs BLACK OWNED SMEs 100% R2.9 BILLION LOANS ORIGINATED