Table I.1. The energy use and its relationship to GDP of some selected countries Share of world total (%) 2007 GDP
|
|
|
- Roger Adams
- 6 years ago
- Views:
Transcription
1 Appendix I Energy Versus GDP for Various Countries Table I.1. The energy use and its relationship to GDP of some selected countries. Primary energy consumption Mtoe Share of world total (%) 2007 GDP 2007 Share of world total GDP per capita ($US) USA 23, ,811, , China 1, ,280, , Russian Federation ,291, , Japan ,376, , India ,170, , Canada ,326, , Germany ,297, , France ,562, , South Korea , , Brazil ,314, , United Kingdom ,727, , Iran , , Italy ,107, , Saudi Arabia , , Mexico , , Spain ,429, , Ukraine , , South Africa , , Australia , , Taiwan ,800 0 Indonesia , , Turkey , ,400 0 Poland , , The Netherlands , ,600 0 Energy use per capita (toe) Thailand , , Argentina , , Belgium & Luxembourg , ,
2 678 Appendix I Mtoe 2007 Venezuela , ,800 0 Egypt , , United Arab Emirates , ,200 0 Kazakhstan , , Pakistan , , Malaysia , , Singapore , , Sweden , , Uzbekistan , , Norway , , Czech Republic , , Romania , , Algeria , , Greece , , Austria , , Colombia , , Switzerland , , Chile , , Finland , , China Hong Kong SAR 2007 Share of world total (%) 2007 GDP 2007 Share of world total GDP per capita ($US) Energy use per capita (toe) , , Kuwait , , Philippines , , Belarus , , Hungary , , Turkmenistan , Portugal , Qatar , , Bulgaria , , Bangladesh , Denmark , Slovakia , , New Zealand , Republic of Ireland Primary energy consumption , Peru ,
3 Appendix I 679 Primary energy consumption Mtoe 2007 Azerbaijan , , Ecuador , , Lithuania , , Other Africa Other Middle East Other S. & Cent. America Other Asia Pacific Other Europe & Eurasia 2007 Share of world total (%) 2007 GDP 2007 Share of world total GDP per capita ($US) Energy use per capita (toe) Total Asia Pacific 3, Total Europe & Eurasia 2, Total North America 2, Total Middle East Total S. & Cent. America Total Africa Total World 11, In this review, primary energy comprises commercially traded fuels only. Excluded, therefore, are fuels such as wood, peat and animal waste which, though important in many countries, are unreliably documented in terms of consumption statistics. Also excluded are winds, geothermal and solar power generation. Mtoe (million tonnes of oil equivalent); toe: tones of oil equivalent.

4 680 Appendix I Fig. I.1. Energy flow diagram of the USA in Energy Information Administration USA

5 Appendix I 681 Fig. I.2. Electricity flow in the USA in Energy Information Administration USA.
6 682 Appendix I Table I.2. Electricity generation by countries (Terawatt-hours) Countries Change over 2006 Share (%) of total (%) US 4, , Canada Mexico Total North America 5, , Argentina Brazil Chile Colombia Venezuela Other S. & Cent. America Total S. & Cent. America , Austria Azerbaijan Belarus Belgium & Luxembourg Bulgaria Czech Republic Denmark Finland France Germany w 3.2 Greece Hungary Iceland Republic of Ireland Italy Kazakhstan Lithuania The Netherlands Norway Poland Portugal Romania Russian Federation ,
7 Appendix I 683 Countries Change 2007 over 2006 (%) Slovakia Spain Sweden Switzerland Turkey Turkmenistan Ukraine United Kingdom Uzbekistan Other Europe & Eurasia Share of total (%) Total Europe & Eurasia 5, , Iran Kuwait Qatar Saudi Arabia United Arab Emirates Other Middle East Total Middle East Algeria Egypt South Africa Other Africa Total Africa Australia Bangladesh China 2, , China Hong Kong SAR India Indonesia Japan 1, , Malaysia New Zealand Pakistan Philippines
8 684 Appendix I Countries Change 2007 over 2006 (%) Singapore South Korea Taiwan Thailand Other Asia Pacific Share of total (%) Total Asia Pacific 6, , TOTAL WORLD % 100.0% Of which: European Union a 3, , OECD 10, , Former Soviet Union 1, , Other EMEs 6, , a Based on gross output.
9 Appendix II Property Classes Table IRS asset classes Asset description Table II.1. MACRS property classes table. ADS class life Office furniture, fixtures, and equipment Information systems: computers/peripherals Automobiles, taxis Light general-purpose trucks Railroad cars and locomotives Industrial steam and electric distribution Cotton gin assets Cattle, breeding or dairy Offshore drilling assets Petroleum refining assets Construction assets Manufacture of grain and grain mill products Manufacture of yarn, thread, and woven fabric Cutting of timber Manufacture of cement Manufacture of motor vehicles Telephone distribution plant Radio and television broadcasting equipment Electric utility nuclear production plant Electric utility steam production plant Natural gas production plant Municipal wastewater treatment plant Theme and amusement park assets GDS class life The deprecation deduction for automobiles is limited to $7,660 (maximum) the first tax year, $4,900 the second, $2,950 the third year, and $1,775 per year in subsequent years. 685
10 686 Appendix II Table II.2. Property class. Class of property 3-year property 5-year property 7-year property 10-year property 15-year property 20-year property 27.5-year property 39-year property Items included Tractor units, racehorses over 2 years old, and horses over 12 years old when placed in service, Special handling devices for food and beverage manufacture. Special tools for the manufacture of finished plastic products, fabricated metal products, and motor vehicles Property with ADR class life of 4 years or less Automobiles, taxis, buses, trucks, computers and peripheral equipment, office machinery (faxes, copiers, calculators, etc.), and any property used in research and experimentation. Also includes breeding and dairy cattle. Information Systems; Computers/Peripherals Aircraft (of non-air-transport companies) Computers Petroleum drilling equipment Property with ADR class life of more than 4 years and less than 10 years Office furniture and fixtures, and any property that has not been designated as belonging to another class. All other property not assigned to another class Office furniture, fixtures, and equipment Property with ADR class life of more than 10 years and less than 16 years Vessels, barges, tugs, similar water transportation equipment, single-purpose agricultural or horticultural structures, and trees or vines bearing fruit or nuts. Assets used in petroleum refining and certain food products Vessels and water transportation equipment Property with ADR class life of 16 years or more and less than 20 years Depreciable improvements to land such as shrubbery, fences, roads, and bridges. Telephone distribution plants Municipal sewage treatment plants Property with ADR class life of 20 years or more and less than 25 years Farm buildings that are not agricultural or horticultural structures. Municipal sewers Property with ADR class life of 25 years or more Residential rental property Nonresidential real estate, including home offices. (Note that the value of land may not be depreciated)
11 Appendix II 687 Recovery year Table II.3. MACRS applicable percentage for property class. 3-Year property 5-Year property 7-Year property 10-Year property 15-Year property 20-Year property * * * * 5.90* * The 3-, 5-, 7-, and 10-year classes use 200% and the 15- and 20-year classes use 150% declining balance depreciation. All classes convert to straight-line depreciation in the optimal year, shown with an asterisk (*). A half-year depreciation is allowed in the first and last recovery years. If more than 40% of the year s MACRS property is placed in service in the last 3 months, then a mid-quarter convention must be used with depreciation tables that are not shown here. Source: U.S. Department of the Treasury, Internal Revenue Service Publication 946, How to Depreciate Property. Washington, DC: U.S. Government Printing Office.
12 Appendix III Unit Conversion Table Table III.1. Unit conversions. Unit To Convert Multiply By Acceleration of free fall, standard (g n) m /s Acre (based on U.S. survey foot) m Acre foot (based on U.S. survey foot) m Ampere hour (A h) Coulomb (C) Angström (Å) m Angström (Å) nm Atmosphere, standard (atm) Pascal (Pa) Atmosphere, technical (at) Pascal (Pa) Bar (bar) Pascal (Pa) Barn (b) m Barrel (bbl) [for petroleum, 42 gallons (U.S.)] m Barrel (bbl) [for petroleum, 42 gallons (U.S.)] Liter (L) British thermal unit IT (Btu IT) Joule (J) British thermal unit th (Btu th) Joule (J) British thermal unit (mean) (Btu) Joule (J) Btu IT ft/(h ft 2 F) W/(m K) Btu th ft/(h ft 2 F) W/(m K) Btu IT/ft 3 J/m Btu th/ft 3 J/m Btu IT/h Watt (W) Btu th/h Watt (W) Btu IT/(h ft 2 F) W/(m 2 K) Btu th/(h ft 2 F) W/(m 2 K) Btu th/min Watt (W) Btu IT/lb J/kg Btu th/lb J/kg Btu IT/s Watt (W) Btu th/s Watt (W) Btu IT/ft 2 J/m Btu th/ft 2 J/m Btu IT/(ft 2 s) W/m Btu th/(ft 2 s) W/m Bushel (U.S.) (bu) m Bushel (U.S.) (bu) L Calorie IT (cal IT) Joule (J) Calorie th (cal th) Joule (J) Calorie (cal) (mean) Joule (J)
13 690 Appendix III Unit To Convert Multiply By cal th/(cm s C) W/(m K) cal IT/g J/kg cal th/g J/kg cal IT/(g C) J/(kg K) cal th/(g C) J/(kg K) cal IT/(g K) J/(kg K) cal th/(g K) J/(kg K) calorie th per second (cal th/s) Watt (W) cal th/cm 2 J/m cal th/(cm 2 s) W/m Carat, metric Gram (g) Centimeter of mercury (0 C) Pascal (Pa) Centimeter of water (4 C) Pascal (Pa) Centipoise (cp) Pascal second (Pa s) Centistokes (cst) m 2 /s Chain (based on U.S. survey foot) (ch) m Cord (128 ft 3 ) m Cubic feet (ft 3 ) m Cubic feet/sec (ft 3 /s) m 3 /s Cup (U.S.) m Cup (U.S.) Liter (L) Curie (Ci) Becquerel (Bq) Darcy m Debye (D) Coulomb meter (C m) Temperature, ( C) Kelvin (K) T (K) = t ( C ) Temperature, ( F) ( C) T ( C) = [t ( F) - 32)]/1.8 Temperature ( F) Kelvin (K) T (K) = [t ( F) )]/1.8 Temperature ( R) Kelvin (K) T (K) = [T ( R)]/1.8 Dyne (dyn) Newton (N) Dyne centimeter (dyn cm) Newton meter (N m) Dyne per square centimeter (dyn/cm 2 ) Pascal (Pa) Electronvolt (ev) Joule (J) erg (erg) Joule (J) erg per second (erg/s) W Faraday (based on carbon 12) Coulomb (C) Fathom (based on U.S. survey foot) 7 Meter (m) Fermi Meter (m) Fermi Femtometer (fm) 1.0 Fluid ounce (U.S.) (fl oz) (m 3 ) Fluid ounce (U.S.) (fl oz) Milliliter (ml) Foot (ft) Meter (m) Foot (U.S. survey) (ft) 7 Meter (m) Foot per second (ft/s) m/s Foot poundal Joule (J) Foot pound-force (ft lbf) Joule (J)
14 Appendix III 691 Unit To Convert Multiply By ft lbf/s Watt (W) gal (Gal) m/s Gallon (gal) m [Canadian and U.K. (Imperial)] Gallon (gal) Liter (L) [Canadian and U.K. (Imperial)] Gallon (U.S.) (gal) m Gallon (U.S.) (gal) Liter (L) Gallon (U.S.) per minute (gpm) m 3 /s (gal/min) Gallon (U.S.) per minute (gpm) L/s (gal/min) Gamma (γ) Tesla (T) Gauss (Gs, G) Tesla (T) Grain (gr) Milligram (mg) g/cm 3 kg/m Hectare (ha) m Horsepower (550 ft lbf/s) (hp) Watt (W) Horsepower (boiler) W Horsepower (electric) W Horsepower (metric) W Horsepower (U.K.) W Horsepower (water) W Inch (in) cm 2.54 Inch of mercury (32 F) Pascal (Pa) Kelvin (K) ( C) T ( C) = T (K) Kilogram-force (kgf) Newton (N) km/h m/s Kilowatt hour (kw h) Joule (J) Knot (nautical mile per hour) m/s Light year (l.y.) m Liter (L) m Micron (μ) m Micron (μ) Micrometer (μm) 1.0 Mile (mi) m Mile (mi) km Mile (mi) m (based on U.S. survey foot) Mile, nautical m Mile per gallon (U.S.) (mpg) (mi/gal) km/l Mile per hour (mi/h) km/h Millibar (mbar) Pascal (Pa) Ohm centimeter (Ω cm) Ohm meter (Ω m)
15 692 Appendix III Unit To Convert Multiply By Ounce (fl oz) [Canadian and U.K. fluid (Imperial)] m Ounce (fl oz) [Canadian and U.K. fluid (Imperial)] Milliliter (ml) Ounce (fl oz) (U.S. fluid) m Pint (U.S. dry) (dry pt) m Pint (U.S. dry) (dry pt) Liter (L) Pint (U.S. liquid) (liq pt) m Pint (U.S. liquid) (liq pt) Liter (L) Poise (P) Pascal second (Pa s) Pound (avoirdupois) (lb) kg Pound-force (lbf) Newton (N) lbf/ft 2 Pascal (Pa) psi (pound-force per square inch) (lbf/in 2 ) Pascal (Pa) Quad (10 15 Btu IT) Joule (J) Quart (U.S. dry) (dry qt) m Quart (U.S. dry) (dry qt) Liter (L) Quart (U.S. liquid) (liq qt) m Quart (U.S. liquid) (liq qt) Liter (L) rad (absorbed dose) (rad) Gray (Gy) rem (rem) Sievert (Sv) Revolution (r) Radian (rad) Revolution per minute (rpm) (r/min) Radian per second (rad/s) Roentgen (R) Coulomb per kilogram (C/kg) rpm (revolution per minute) (r/min) Radian per second (rad/s) Square foot (ft 2 ) m Square mile (mi 2 ) (based on U.S. survey foot) m Square mile (mi 2 ) (based on U.S. survey foot) km Square yard (yd 2 ) m Stokes (St) m 2 /s Therm (EC) Joule (J) Therm (U.S.) Joule (J) Ton, assay (AT) kg Ton, assay (AT) g Ton, metric (t) kg Tonne (called metric ton in U.S.) (t) kg Ton of refrigeration (12,000 Btu IT/h) Watt (W) Ton of TNT (energy equivalent) Joule (J) Ton, short (2,000 lb) Kilogram (kg) torr (Torr) Pascal (Pa)
16 Appendix III 693 Unit To Convert Multiply By W/cm 2 W/m W/in 2 W/m W s Joule (J) 1.0 Yard (yd) Meter (m)
17 Appendix IV Steam Properties Table IV.1. Saturated water pressure table. Pressure P (kpa) Saturation Temperature T ( o C) Specific volume (m 3 /kg) Internal energy (kj/kg) Sat. liquid Sat. vapor Sat. liquid Sat. vapor Sat. liquid Enthalpy (kj/kg) Entropy (kj/kg K) Sat. vapor Sat. liquid Sat. vapor vf ve uf ue hf he sf se
18 696 Appendix IV Pressure P (kpa) Saturation Temperature T ( o C) Specific volume (m 3 /kg) Internal energy (kj/kg) Sat. liquid Sat. vapor Sat. liquid Sat. vapor Sat. liquid Enthalpy (kj/kg) Entropy (kj/kg K) Sat. vapor Sat. liquid Sat. vapor vf ve uf ue hf he sf se
19 Appendix IV 697 Pressure P (kpa) Saturation Temperature T ( o C) Specific volume (m 3 /kg) Internal energy (kj/kg) Sat. liquid Sat. vapor Sat. liquid Sat. vapor Sat. liquid Enthalpy (kj/kg) Entropy (kj/kg K) Sat. vapor Sat. liquid Sat. vapor vf ve uf ue hf he sf se
20 698 Appendix IV Pressure P (kpa) Saturation Temperature T ( o C) Specific volume (m 3 /kg) Internal energy (kj/kg) Sat. liquid Sat. vapor Sat. liquid Sat. vapor Sat. liquid Enthalpy (kj/kg) Entropy (kj/kg K) Sat. vapor Sat. liquid Sat. vapor vf ve uf ue hf he sf se
21 Appendix IV 699 Table IV.2. Saturated water temperature table. Temperature T ( o C) Saturation Pressure (kpa) Specific volume (m 3 /kg) Internal energy (kj/kg) Sat. liquid Sat. vapor Sat. liquid Sat. vapor Sat. liquid Enthalpy (kj/kg) Entropy (kj/kg K) Sat. vapor Sat. liquid Sat. vapor vf ve uf ue hf he sf se
22 700 Appendix IV Temperature T ( o C) Saturation Pressure (kpa) Specific volume (m 3 /kg) Internal energy (kj/kg) Sat. liquid Sat. vapor Sat. liquid Sat. vapor Sat. liquid Enthalpy (kj/kg) Entropy (kj/kg K) Sat. vapor Sat. liquid Sat. vapor vf ve uf ue hf he sf se
23 Appendix IV 701 Temperature T ( o C) Saturation Pressure (kpa) Specific volume (m 3 /kg) Internal energy (kj/kg) Sat. liquid Sat. vapor Sat. liquid Sat. vapor Sat. liquid Enthalpy (kj/kg) Entropy (kj/kg K) Sat. vapor Sat. liquid Sat. vapor vf ve uf ue hf he sf se
24 702 Appendix IV Temperature T ( o C) Saturation Pressure (kpa) Specific volume (m 3 /kg) Internal energy (kj/kg) Sat. liquid Sat. vapor Sat. liquid Sat. vapor Sat. liquid Enthalpy (kj/kg) Entropy (kj/kg K) Sat. vapor Sat. liquid Sat. vapor vf ve uf ue hf he sf se
25 Appendix IV 703 Temperature T ( o C) Saturation Pressure (kpa) Specific volume (m 3 /kg) Internal energy (kj/kg) Sat. liquid Sat. vapor Sat. liquid Sat. vapor Sat. liquid Enthalpy (kj/kg) Entropy (kj/kg K) Sat. vapor Sat. liquid Sat. vapor vf ve uf ue hf he sf se Table IV.3. Properties of superheated steam. Temp 0.01 MPa (Sat. temp o C) 0.05 MPa (Sat. temp o C) 0.1 MPa (Sat. temp o C) o ( o C) v u h s v u h s v u h s Sat
26 704 Appendix IV Temp 0.01 MPa (Sat. temp o C) 0.05 MPa (Sat. temp o C) 0.1 MPa (Sat. temp o C) o ( o C) v u h s v u h s v u h s , , , , MPa 0.3 MPa 0.4 MPa Sat , , , ,
27 Appendix IV 705 Temp 0.01 MPa (Sat. temp o C) 0.05 MPa (Sat. temp o C) 0.1 MPa (Sat. temp o C) o ( o C) v u h s v u h s v u h s 0.5 MPa 0.6 MPa 0.8 MPa Sat , , , , MPa 1.2 MPa 1.4 MPa Sat
28 706 Appendix IV Temp 0.01 MPa (Sat. temp o C) 0.05 MPa (Sat. temp o C) 0.1 MPa (Sat. temp o C) o ( o C) v u h s v u h s v u h s , , , , MPa 1.8 MPa 2.0 MPa Sat , , , ,
29 Appendix IV 707 Temp 0.01 MPa (Sat. temp o C) 0.05 MPa (Sat. temp o C) 0.1 MPa (Sat. temp o C) o ( o C) v u h s v u h s v u h s 2.5 MPa 3.0 MPa 3.5 MPa Sat , , , , MPa 4.5 MPa 5.0 MPa Sat
30 708 Appendix IV Temp 0.01 MPa (Sat. temp o C) 0.05 MPa (Sat. temp o C) 0.1 MPa (Sat. temp o C) o ( o C) v u h s v u h s v u h s , , , , MPa 7.0 MPa 8.0 MPa Sat , , ,
31 Appendix IV 709 Temp 0.01 MPa (Sat. temp o C) 0.05 MPa (Sat. temp o C) 0.1 MPa (Sat. temp o C) o ( o C) v u h s v u h s v u h s MPa 10.0 MPa 12.5 MPa Sat , , , , MPa 17.5 MPa 20 MPa Sat
32 710 Appendix IV Temp 0.01 MPa (Sat. temp o C) 0.05 MPa (Sat. temp o C) 0.1 MPa (Sat. temp o C) o ( o C) v u h s v u h s v u h s , , , , MPa 30 MPa 35 MPa
33 Appendix IV 711 Temp 0.01 MPa (Sat. temp o C) 0.05 MPa (Sat. temp o C) 0.1 MPa (Sat. temp o C) o ( o C) v u h s v u h s v u h s 1, , , , MPa 50 MPa 60 MPa , , , , v: Specific volume (m /kg); u: Internal energy (kj/kg); h: Enthalpy (kj/kg); s: Entropy (kj/kg K)
34 712 Appendix IV Table IV.4. Properties of compressed liquid. Temp ( o C) v u h s v u h s v u h s 5 MPa 10 MPa 15 MPa sat v: Specific volume (m /kg); u: Internal energy (kj/kg); h: Enthalpy (kj/kg); s: Entropy (kj/kg)
35 Appendix IV 713 Temp ( o C) v u h s v u h s v u h s 20 MPa 30 MPa 50 MPa sat
36 Appendix V Thermal Conductivity of Building Materials Table V.1. Thermal conductivity of building materials. Material Bulk density kg m -3 Thickness mm Mean temperature C Delta T K Thermal conductivity W m -1 K -1 Material source Acoustic Spray Insulation National Gypsum Co. Acrylic Plastic Rohm & Haas Co. Alumina Powder NBS Aluminum Foil Anti-Sweat Compound NBS, Chemistry Division Asbestos Cement Asbestos Products Company Asbestos Insulation Union Asbestos & Rubber Co. (Pittsburgh Corning Corp.) Asbestos Paper Ruberoid Co. Asphalt American Gilsonite Co. Bone Char Brick N.A Cannon Brick Co. Carpet Cellular Alykyd-Isocyanate NOPCO Chemical Co. Cellular Cellulose Acetate N.A Cellular Glass Pittsburgh Corning Corp. Cellular Ionomer Gilman Brothers Co. Cellular Plastic U.S. Rubber Co. Cellular Polyethylene Dow Chemical Co. Cellular Polystyrene Cellular Polystyrene, Expanded Dow Chemical Co. Cellular Polystyrene, Expanded Western Insulfoam Co. Cellular Polystyrene, Expanded U.S. Army Engineer R&D Laboratory Cellular Polystyrene, Extruded N.A Dow Chemical Co. Cellular Polystyrene, Extruded Philips Research Laboratory GmbH Cellular Polyurethane Union Carbide Chemicals Co. Cellular Polyvinyl Chloride B.F. Goodrich 715
37 716 Appendix V Material Bulk density kg m -3 Thickness mm Mean temperature C Delta T K Thermal conductivity W m -1 K -1 Material source Cellulose National Cellulose Corp. Cellulose U.S. Insulation Sales Corp. Cellulose Acetate E.I. du Pont de Nemours & Co. Ceramic Fiber Owens-Illinois Glass Company, Kaylo Division Concrete NBS Concrete U.S. Maritime Commission Concrete U.S. Maritime Commission Concrete U.S. Maritime Commission Corkboard N.A N.A Brazil Corkboard Armstrong Cork Co. Corkboard Armstrong Cork Co. Cotton Insulation Industries, Inc. Cotton Janesville Cotton Mill Cotton Sears Roebuck Cotton 216 N.A N.A U.S. Department of Agriculture Cotton N.A U.S. Department of Agriculture Cotton N.A U.S. Department of Agriculture Cotton Burr Cotton Gauze Cotton Linter Diatomaceous Earth Johns Manville Diatomaceous Earth N.A Silicair Co. Diphenylamine Epoxy Resin Sandia Corporation Epsom Salt Fabric Feathers Felt N.A Felt (Dynatech Corporation)
38 Appendix V 717 Material Bulk density kg m -3 Thickness mm Mean temperature C Delta T K Thermal conductivity W m -1 K -1 Material source Fiberboard Fiberboard 416 N.A N.A Agasote Millboard Co. Fiberboard United Refrig. Mfg. Co. Fiberboard Baltimore Lumber Company Fiberboard, Cane Flintkote Co. Fiberboard, Cane National Gypsum Co. Fiberboard, Coconut Grasas Vegetales Cubanas Fiberboard, Straw Strawick Corporation Fiberboard, Vegetable N.A Plastergon Wallboard Co. Fiberboard, Wood Fir-Tex Insulating Board Co. Fiberboard, Wood U.S. Gypsum Co. Fiberboard, Wood N.A Masonite Corp. Fiberboard, Wood N.A National Gypsum Co. Fumed Silica Johns Manville Glass Corning Glass Works Glass Fiber Blanket Owens Corning Fiberglas Corp. Glass Fiber Blanket Owens Corning Fiberglas Corp. Glass Fiber Board Owens Corning Fiberglas Corp. Glass Pellet N.A N.A Greenstone Hardboard, Wood Masonite Corp. Honeycomb Panel Hulls Planter Peanut Co. Infusorial Earth N.A N.A Insulating Cement N.A Crossfield Products Insulating Cement Industrials, Inc. Insulation Panel Frosted Foods Insulation Leather Linoleum Cork N.A Marble
39 718 Appendix V Material Bulk density kg m -3 Thickness mm Mean temperature C Delta T K Thermal conductivity W m -1 K -1 Material source Mica Mineral Wool Baldwin Hill Co. NBS Fibrous Glass Owens Corning Fiberglas Corp. NBS Gum Rubber NBS, Leather Section Paper Gaylord Container Corp. Paper N.A Waldort Paper Prod. Co. Particle Board Perlite Silbrico Corporation Perlite Silbrico Corporation Perlite Atlantic Perlite Co. Petroleum Coke Phenol Formaldehyde Westinghouse Electric Corp. Plaster National Gypsum Co. Plaster Great Lakes Carbon Corp. Plaster Great Lakes Carbon Corp. Plastic E.I. du Pont de Nemours & Co. Plastic Southern Research Institute Plastic Goodyear Tire & Rubber Co. Plastic Formica Insulation Co. Plastic, Reinforced Fiber Continental-Diamond Fiber Corp. Plywood Weyerhaeuser Co. Poly(methyl) Methacrylate E.I. du Pont de Nemours & Co. Polyester Monsanto Chemical Co. Polyester NBS Polyethylene U.S. Industrial Chemical Co. Polytetrafluoroethylene E.I. du Pont de Nemours & Co. Polyvinyl Chloride U.S. Naval Ordnance Laboratory Potting Material Westinghouse Electric Corp. Protexulate Powder Rock Wool Rock Wool Mfg. Co.
40 Appendix V 719 Material Bulk density kg m -3 Thickness mm Mean temperature C Delta T K Thermal conductivity W m -1 K -1 Material source Rockboard U.S. Rockboard Corp. Rubber Goodyear Tire & Rubber Co. Rubber U.S. Rubber Co. Rubber Goodyear Tire & Rubber Co. Rubber Tile Armstrong Cork Co. Rubber, Buna S Great American Industries, Inc., Rubatex Division Rubber, Neoprene (Potomac Rubber Co.) Rubber, Pure Gum (National Gypsum Co.) Rubber, Pure Gum Arthur D. Little, Inc. Rubber, Pure Gum (Dynatech Corporation) Rubber, Silicone Dow Corning Corp. Rubber, Silicone (Potomac Rubber Co.) Rubber, Silicone General Electric Company Rubber, Silicone John G. Shelby Co., Inc. Rubber, Silicone Dow Corning Corp. (Green Rubber Co.) Rubber, Silicone National Beryllia Corporation Rubber, Silicone N.A Rohm & Haas Co. Rubber, Silicone NASA Rubber, Silicone Dow Corning Corp. Rubber, Silicone Dow Corning Corp. Rubber, Silicone McDonnell-Douglas Corporation Rubber, Sponge Great American Industries, Inc. Rubber-Cement Insulation Waterproof Insulation Corp. Sand, Ottawa Silica Ottawa-Silica Co. Silica Aerogel Monsanto Chemical Co. Slag Wool N.A Rock Fleece Corp. Soap Powder Soil N.A. 1.54
41 720 Appendix V Material Bulk density kg m -3 Thickness mm Mean temperature C Delta T K Thermal conductivity W m -1 K -1 Material source Straw N.A North Dakota Research Foundation Vermiculite N.A Zonolite Co. Vermiculite Board N.A Armco Int'l Corp. Viscose Sponge N.A. N.A E.I. du Pont de Nemours & Co. (DuPont Rayon Co.) Wax Halowax Corp. Wood Wood Fiber Blanket Masonite Corp. Wood-Cement N.A Celotex Co. Wool Philip Carey Mfg. Co. (Association of American Railroads) Zirconia Source: NIST Heat Transmission Properties of Insulating and Building Materials Database
42 Appendix VI Exports and Imports of Coal by Countries Coal to Liquid Plants Planned Fig. VI.1. Flow of coal in the USA (Energy Information Administration, Annual energy review 2007). 721
43 722 Appendix VI Table VI.1. Imports and exports of coal by various countries. Country Production in trillion BTU Imports in trillion BTU Exports in trillion BTU Apparent consumption in trillion BTU Total recoverable coal in million short tons Canada 1, , ,251 20, Mexico ,335 17, United States 23, , , , ,718 20, Argentina , Brazil ,148 11, Chile ,302 25, Colombia 1, , ,287 24, Peru ,168 26, Puerto Rico Venezuela , Albania , Austria Belgium , Bosnia and Herzegovina , Bulgaria ,411 6, Croatia Cyprus Czech Republic ,120 11, Denmark BTU value of coal in thousands BTU per short ton Total Recoverable coal in trillion BTU Years of coal remained at the current rate of consumption
44 Appendix VI 723 Country Production in trillion BTU Imports in trillion BTU Exports in trillion BTU Apparent consumption in trillion BTU Total recoverable coal in million short tons BTU value of coal in thousands BTU per short ton Total Recoverable coal in trillion BTU Finland Former Serbia and Montenegro ,288 8, France Germany 2, , , ,428 9, Greece ,299 4, Hungary ,700 7, Iceland Ireland Italy , Luxembourg Macedonia , Netherlands Norway , Poland 2, , ,432 15, Portugal Romania , Slovakia , Slovenia , Spain , Sweden Years of coal remained at the current rate of consumption
45 724 Appendix VI Country Production in trillion BTU Imports in trillion BTU Exports in trillion BTU Apparent consumption in trillion BTU Total recoverable coal in million short tons Switzerland Turkey ,614 8, United Kingdom , , , Estonia , Georgia , Kazakhstan 1, , ,479 16, Kyrgyzstan , Latvia Lithuania Moldova Russia 6, , , ,074 19, Tajikistan , Ukraine 1, , ,647 19, Uzbekistan ,409 13, Iran , Israel Lebanon Algeria BTU value of coal in thousands BTU per short ton Total Recoverable coal in trillion BTU Botswana , Congo (Kinshasa) , Years of coal remained at the current rate of consumption
46 Appendix VI 725 Country Production in trillion BTU Imports in trillion BTU Exports in trillion BTU Apparent consumption in trillion BTU Total recoverable coal in million short tons Egypt , Mozambique , Niger , Nigeria , South Africa 5, , , ,738 21, Swaziland , Tanzania , Zambia , Zimbabwe , Australia 8, , , ,531 20, Bangladesh Bhutan , Burma (Myanmar) , China 52, , , ,215 20, Hong Kong India 8, , , ,903 16, Indonesia 4, , ,476 23, Japan 0 4, , BTU value of coal in thousands BTU per short ton Total Recoverable coal in trillion BTU Korea, North , Korea, South , , , Years of coal remained at the current rate of consumption
47 726 Appendix VI Country Production in trillion BTU Imports in trillion BTU Exports in trillion BTU Apparent consumption in trillion BTU Total recoverable coal in million short tons Laos , Malaysia , Mongolia , Nepal , New Zealand , Pakistan ,362 16, Philippines , Taiwan 0 1, , Thailand ,493 10, Vietnam BTU value of coal in thousands BTU per short ton Total Recoverable coal in trillion BTU Years of coal remained at the current rate of consumption World Total 128, , , , ,000,912
48 Appendix VI 727 Table VI.2. Coal to Liquid plants under consideration or planned in the USA Project Lead Project Partners Location Feedstock Status Capacity Cost American Clean Coal Fuels None cited Oakland, IL Bituminous Feasibility 25,000 N/A Synfuels Inc. GE, Haldor-Topsoe, NACC, ExxonMobil Ascension Parish, LA Lignite Feasibility N/A $5 billion DKRW Advanced Fuels Rentech, GE Medicine Bow, WY Bituminous Design (2011) 13,000 bpd $1.4 billion DKRW Advanced Fuels Rentech, GE, Bull Mountain Land Company Roundup, MT Sub-bituminous/ Lignite Feasibility 22,000 bpd $1 1.5 billion AIDEA ANRTL, CPC Cook Inlet, AK Sub-bituminous Feasibility 80,000 bpd $5 8 billion Mingo County Rentech WV Bituminous Feasibility 20,000 bpd $2 billion WMPI Sasol, Shell, DOE Gilberton, PA Anthracite Design 5,000 bpd $612 million Rentech/Peabody N/A MT Sub-bituminous/ lignite Rentech/Peabody N/A Southern IL, Southwest IN, Western KY Rentech* Kiewit Energy Company, WorleyParsons Feasibility 10,000 30,000 bpd Bituminous Feasibility 10,000 30,000 bpd East Dubuque, IL Bituminous Construction (2010) N/A N/A 1,800 bpd* $800 million Rentech Adams County Natchez, MS Coal/Petcoke Feasibility 10,000 bpd $ million Rentech Baard Energy Wellsville, OH Sub-bituminous Feasibility 35,000 bpd $4 billion Headwaters Hopi Tribe AZ Bituminous Feasibility 10,000 50,000 bpd Headwaters NACC, GRE, Falkirk ND Lignite Feasibility 40,000 bpd $3.6 billion N/A
49 728 Appendix VI Table VI.2. Coal to Liquid plants under consideration or planned worldwide Country Owner/Developer Capacity (bpd) Status South Africa Sasol 150,000 Operational China Shenhua 20,000 (initially) Construction Operational in China Lu an Group ~3,000 4,000 Construction China Yankuang 40,000 (initially) 180,000 planned Construction China Sasol JV (2 studies) 80,000 (each plant) Planning China Shell/Shenhua 70,000 80,000 Planning China Headwaters/UK Race Investment Two 700-bpd demo plants Planning Indonesia Pertamina/Accelon ~76,000 Construction Australia Anglo American/Shell 60,000 Planning Australia Altona Resources plc, Jacobs Consultancy, MineConsult 45,000 Planning Philippines Headwaters 50,000 Planning New Zealand L&M Group 50,000 Planning
50 Appendix VII Exports and Imports of Dry Natural Gas in the World Table VII.1. World Dry Natural Gas Supply and Disposition, Most Recent Annual Estimates, Dry gas Apparent Country production Imports Exports consumption Canada 6, ,606 3,307 Mexico 1, ,200 United States 18,476 4, ,653 North America 26,765 4,879 4,342 27,160 Argentina 1, ,475 Bolivia Brazil Chile Colombia Cuba Dominican Republic Ecuador Peru Puerto Rico Trinidad and Tobago 1, Uruguay Venezuela Central & South America 5, ,172 4,513 Albania Austria Belgium Bosnia and Herzegovina Bulgaria Croatia Czech Republic Denmark Finland Former Serbia and Montenegro France 43 1, ,
51 730 Appendix VII Dry gas Apparent Country production Imports Exports consumption Germany 692 3, ,524 Greece Hungary Ireland Italy 388 2, ,984 Luxembourg Macedonia Netherlands 2, ,930 1,690 Norway 3, , Poland Portugal Romania Slovakia Slovenia Spain 2 1, ,161 Sweden Switzerland Turkey 32 1, ,101 United Kingdom 2, ,202 Europe 11,195 15,454 6,026 20,284 Armenia Azerbaijan Belarus Estonia Georgia Kazakhstan ,097 Kyrgyzstan Latvia Lithuania Moldova Russia 23,167 1,847 8,416 16,598 Tajikistan Turkmenistan 2, , Ukraine 689 1, ,560 Uzbekistan 2, ,769 Eurasia 29,460 5,561 10,723 24,298 Bahrain Iran 3, ,839 Iraq Israel
52 Appendix VII 731 Dry gas Apparent Country production Imports Exports consumption Jordan Kuwait Oman Qatar 1, , Saudi Arabia 2, ,594 Syria United Arab Emirates 1, ,522 Yemen Middle East 11, ,006 10,268 Algeria 3, , Angola Cameroon Congo (Brazzaville) Congo (Kinshasa) Cote d'ivoire (Ivory- Coast) Egypt 1, Equatorial Guinea Gabon Libya Morocco Mozambique Nigeria 1, Senegal South Africa Tanzania Togo Tunisia Africa 6, ,697 2,947 Afghanistan Australia 1, ,012 Bangladesh Brunei Burma (Myanmar) China 2, ,993 Hong Kong India 1, ,380 Indonesia 2, , Japan 174 3, ,247 Korea, South 18 1, ,137
53 732 Appendix VII Dry gas Apparent Country production Imports Exports consumption Malaysia 2, ,053 1,136 New Zealand Niue Pakistan 1, ,112 Papua New Guinea Philippines Samoa Singapore Taiwan Thailand ,176 Vietnam Asia & Oceania 12,962 5,676 3,616 14,956 World Total 103,977 32,578 31, ,425 Source: Energy Information Administration, Office of Energy Markets and End Use, International Energy Statistics Team.

54 Appendix VII 733 Fig. VII.1. Flow of natural gas in the USA (Energy Information Administration, Annual Energy Review 2007).
55 Appendix VIII Selected Giant Oil Fields and Their Size Table VIII.1. Selected giant and supergiant oil fields. Oil Field Country Year discovered Estimated Reserves (billions of barrel) Carioca Brazil Sugar Loaf Brazil Tupi Santos Basin, Brazil Bohai China Azadegan Iran Ferdows/Mound/Zagheh Iran Kashagan Kazakhstan White Tiger Viet nam Priobskoye West Siberia, Russia Tengiz Kazakhstan Cantarell Mexico Fyodorovskoye West Siberia, Russia Prudhoe Bay Alaska, United States Lyantorskoye West Siberia, Russia Zakum Abu Dhabi, UAE Samotlor West Siberia, Russia Serir Libya Ahwaz Iran Rumaila Iraq Safaniya-Khafji Saudi Arabia/Neutral Zone Romashkino Volga-Ural, Russia Ghawar Saudi Arabia Burgan Kuwait Agha Jari Iran Kirkuk Iraq Chicontepec Mexico Bolivar Coastal Venezuela Aghajari Iran Ahvaz Iran 17 Azadegan Iran 3 6 Gachsaran Iran Marun Iran Mesopotamian Foredeep Basin Kuwait Minagish Kuwait 2 Raudhatain Kuwait 11 Sarir Libya Kashagan Kazakhstan Daqing China

56 736 Appendix VIII Giant Field: a giant oil or gas field is considered to be one for which the estimate of ultimately recoverable oil is 500 million bbl of oil or gas equivalent. Gas is converted to oil at a ratio of 6,000 cu ft/bbl. Some fields are, therefore, giants only because their combined amounts of oiland gas-equivalent total at least 500 million bbl, and not because either resource is that great by itself. Supergiant: 5,000 to 50,000 MMBOE ( Megagiant: 50,000+ MMBOE ( Fig. VIII.1. World oil and condensate field ranking (Printed with permission from Berman A (November 2008) What s new in exploration. WorldOil.com (The oilfield information sources) 229(2)).


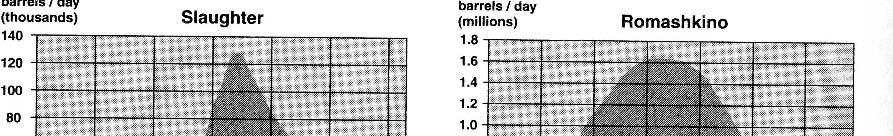
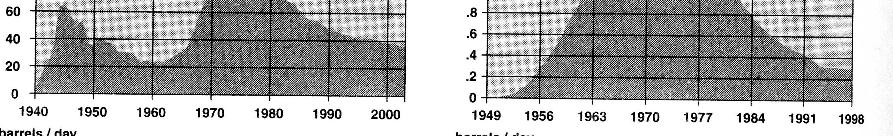
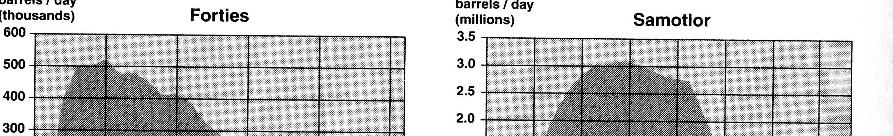
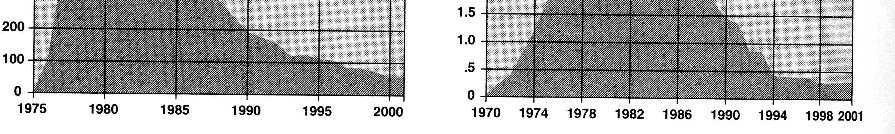
57 Appendix VIII 737 Abqaiq Field, Saudi Arabia Berri Field, Saudi Arabia Bibi Hakimeh Field, Iran Karanj Field, Iran Marun Field, Iran Povkhovskoye Field, Russia Fig. VIII.2. Oil and gas production profiles of six giant/super giant oil fields (Adapted from Simmons MR, The worlds giant oil fields. Simmons and Company International).


58 738 Appendix VIII Fig. VIII.3. Production profiles of eight giant/supergiant oil fields (Printed with permission from Simmons MR (2005) Twilight in the Desert. Wiley).
BP Statistical Review of World Energy June 2017
 BP Statistical Review of World Energy June 217 Primary energy 8 Consumption 8 Consumption by fuel 9 66 th edition Primary energy Consumption* Growth rate per annum Million tonnes oil equivalent 26 27 28
Primary energy. 8 Consumption 9 Consumption by fuel. 67 th edition
 Primary energy 8 Consumption 9 Consumption by fuel 67 th edition Primary energy Consumption* Growth rate per annum Million tonnes oil equivalent 27 28 29 2 211 212 213 214 215 216 217 217 26-16 Share 217
67 th edition. Renewable energy. Appendices. 44 Other renewables consumption 45 Biofuels production
 Renewable energy 44 Other renewables consumption 45 Biofuels production Appendices A1 Solar Generation A2 Wind Generation A3 Geothermal, biomass and other Generation A4 Geothermal Cumulative installed
Coal. 36 Reserves and prices 38 Production and consumption. 67 th edition
 Coal 36 Reserves and prices 38 Production and consumption 67 th edition Total proved reserves at end 217 Million tonnes Anthracite and bituminous Subbituminous and lignite US 228 3116 25916 24.2% 357 Canada
Natural gas. 26 Reserves 28 Production and consumption 33 Prices 34 Trade movements. 67 th edition
 Natural gas 26 Reserves 28 Production and consumption 33 Prices 34 Trade movements 67 th edition Natural gas Total proved reserves At end 1997 At end 2007 At end 2016 At end Trillion Trillion Trillion
I. World trade in Overview
 I. World trade in - Overview Table I.1 Growth in the volume of world merchandise exports and production, 2-5 (Annual percentage change) 2-5 23 24 World merchandise exports 4.5 5. 9.5 6. Agricultural products
Table 23 Production of minor oil products from refineries - by type Thousand metric tons
 Table 23 Production of minor oil from refineries - by type Table Notes Data refer to production from refineries of refinery, ethane, naphtha, lubricants, bitumen, paraffin, petroleum, white spirit, and
Production of minor oil products from refineries - by type Thousand metric tons
 Production of minor oil from refineries - by type Table 23 Table Notes Data refer to production from refineries of refinery, ethane, naphtha, lubricants, bitumen, paraffin, petroleum, white spirit, and
Table 13 Production, trade and supply of conventional crude oil Thousand metric tons; kilograms per capita; reserves production ratio (R/P) in years
 in years") , trade and supply of conventional crude oil Thousand metric tons; kilograms per capita; reserves production ratio (R/P) in years Table Notes The Reserves / ratio refers to crude oil and natural gas liquids.
, trade and supply of conventional crude oil Thousand metric tons; kilograms per capita; reserves production ratio (R/P) in years Table Notes The Reserves / ratio refers to crude oil and natural gas liquids.
WORLD MOTOR VEHICLE PRODUCTION BY COUNTRY AND TYPE QUARTERS June 14, 2018
 QUARTERS 2017-2018 June 14, 2018 CONTENTS BASEPROTOTAL BASEPROCARS BASEPROLCV BASEPROHCV BASEPROBC Summation of cars, LCVs, HCVs, heavy buses Cars LCVs HCVs Heavy buses Note: The production of cars and
Table 13 Production, trade and supply of conventional crude oil Thousand metric tons; kilograms per capita; reserves production ratio (R/P) in years
 in years") Million metric tons Million metric tons Table 13, trade and supply of conventional crude oil Thousand metric tons; kilograms per capita; reserves production ratio (R/P) in years Table Notes The Reserves
Million metric tons Million metric tons Table 13, trade and supply of conventional crude oil Thousand metric tons; kilograms per capita; reserves production ratio (R/P) in years Table Notes The Reserves
Table 13 Production, trade and supply of conventional crude oil Thousand metric tons; kilograms per capita; reserves production ratio (R/P) in years
 in years") Table 13, trade and supply of conventional crude oil Thousand metric tons; kilograms per capita; reserves production ratio (R/P) in years Table Notes The Reserves / ratio refers to crude oil and natural
Table 13, trade and supply of conventional crude oil Thousand metric tons; kilograms per capita; reserves production ratio (R/P) in years Table Notes The Reserves / ratio refers to crude oil and natural
AUSTRIA. Table 1. FDI flows in the host economy, by geographical origin. (Millions of US dollars)
") Table 1. FDI flows in the host economy, by geographical origin World 5 690 138 6 195 3 184 10 784 7 933 31 154 6 858 9 303 840 10 618 5 760 Developed economies 5 740 13 5 341 2 689 10 137 6 291 29 721
Table 1. FDI flows in the host economy, by geographical origin World 5 690 138 6 195 3 184 10 784 7 933 31 154 6 858 9 303 840 10 618 5 760 Developed economies 5 740 13 5 341 2 689 10 137 6 291 29 721
Global Dialysis - Cost per Dialysis Session
 Cost per session for dialysis where a cost has been entered for a dialysis centre. All costs have been converted to US Dollars as at 19 May 2006. Note that the costs do not state what is covered by a dialysis
Imports of seed for sowing by country Calendar year 2011 Source: ISF compilation based on official statistics and international seed trade reports
 USA 157,432 15,562 464 173,458 523 318 67 908 Germany 195,159 5,913 520 201,592 595 97 22 714 France 125,701 4,389 277 130,367 522 150 11 683 Netherlands 140,899 12,253 796 153,948 250 330 48 628 Italy
World real merchandise trade grows faster than output
 I. I. world trade developments 8 Merchandise trade and GDP World real merchandise trade grows faster than output In 2006, the volume of world merchandise trade grew by 8 per cent while world gross domestic
FEDERAL RESERVE statistical release
 FEDERAL RESERVE statistical release FOR IMMEDIATE RELEASE MARCH 16, 1992 E.U C1Z1, GEOGRAPHICAL r DISTRIBUTION n OF e ASSETS AND^LIABILITIES (IN MILLIONS OF DOLLARS) ASSETS COUNTRY OF CUSTOMER 12/31/90
19,000 38,500. Mean Crop. 5, ,827 Max , ,869 Last Year 6, ,
 YTD Inventory / Shipment Report In Shell Basis Crop: 2017 Monthly Market Prices FCA Hamburg Iranian Dried In Shell 28/30 Fandoghi Pistachios 10th Marketing Month YTD Carry in from previous year 3,000 Total
35,000 52,000 87,000 1,600 8, ,400 76,600. Mean Crop. Monthly YTD Min ,671 8,211 Max. 2017
 YTD Inventory / Shipment Report In Shell Basis Crop: 2018 Monthly Market Prices FCA Hamburg Iranian Dried In Shell 28/30 Fandoghi Pistachios Total Consumption Ending Inventory 2nd Marketing Month YTD Carry
KINGDOM OF CAMBODIA NATION RELIGION KING 3
 KINGDOM OF CAMBODIA NATION RELIGION KING 3 TOURISM STATISTICS REPORT March 2015 MINISTRY OF TOURISM Statistics and Tourism Information Department No. A3, Street 169, Sangkat Veal Vong, Khan 7 Makara, Phnom
Table 5 Production, trade and supply of hard coal Thousand metric tons and kilograms per capita
 Table Notes Production includes production from other sources as defined in the previous table. Data for China include brown coal. Please refer to the Definitions Section on pages ix to xv for the appropriate
KINGDOM OF CAMBODIA NATION RELIGION KING 3
 KINGDOM OF CAMBODIA NATION RELIGION KING 3 TOURISM STATISTICS REPORT March 2018 MINISTRY OF TOURISM Statistics and Tourism Information Department No. A3, Street 169, Sangkat Veal Vong, Khan 7 Makara, Phnom
KINGDOM OF CAMBODIA NATION RELIGION KING 3
 KINGDOM OF CAMBODIA NATION RELIGION KING 3 TOURISM STATISTICS REPORT December 2015 MINISTRY OF TOURISM Statistics and Tourism Information Department No. A3, Street 169, Sangkat Veal Vong, Khan 7 Makara,
Oil. 12 Reserves 14 Production and consumption 20 Prices 22 Refining 24 Trade movements. 67 th edition
 Oil 12 Reserves 14 Production and consumption 20 Prices 22 Refining 24 Trade movements 67 th edition Oil Total proved reserves At end 1997 At end 2007 At end 2016 At end Thousand million barrels Thousand
Table 16 Refinery distillation capacity, throughput and output Thousand metric tons
 Table 16 Refinery distillation capacity, throughput and output Table Notes Output is equal to the sum of production from refineries for aviation gasoline, bitumen, gas/diesel oil, ethane, feedstocks, gasoline-type
KINGDOM OF CAMBODIA NATION RELIGION KING 3
 KINGDOM OF CAMBODIA NATION RELIGION KING 3 TOURISM STATISTICS REPORT February 2017 MINISTRY OF TOURISM Statistics and Tourism Information Department No. A3, Street 169, Sangkat Veal Vong, Khan 7 Makara,
Table 16 Refinery distillation capacity, throughput and output Thousand metric tons
 Million metric tons Table 16 Refinery distillation capacity, throughput and output Table Notes Output is equal to the sum of production from refineries for aviation gasoline, bitumen, gas/diesel oil, ethane,
KINGDOM OF CAMBODIA NATION RELIGION KING 3
 KINGDOM OF CAMBODIA NATION RELIGION KING 3 TOURISM STATISTICS REPORT May 2017 MINISTRY OF TOURISM Statistics and Tourism Information Department No. A3, Street 169, Sangkat Veal Vong, Khan 7 Makara, Phnom
KINGDOM OF CAMBODIA NATION RELIGION KING 3
 KINGDOM OF CAMBODIA NATION RELIGION KING 3 TOURISM STATISTICS REPORT October 2017 MINISTRY OF TOURISM Statistics and Tourism Information Department No. A3, Street 169, Sangkat Veal Vong, Khan 7 Makara,
Production (bbl/day)
") 1 of 5 14/09/2011 22:15 From Wikipedia, the free encyclopedia This is a list of countries by oil production mostly based on CIA World Factbook data. [1] Note that oil production refers to the sum of barrels
1 of 5 14/09/2011 22:15 From Wikipedia, the free encyclopedia This is a list of countries by oil production mostly based on CIA World Factbook data. [1] Note that oil production refers to the sum of barrels
KINGDOM OF CAMBODIA NATION RELIGION KING 3
 KINGDOM OF CAMBODIA NATION RELIGION KING 3 TOURISM STATISTICS REPORT October 2018 MINISTRY OF TOURISM Statistics and Tourism Information Department No. A3, Street 169, Sangkat Veal Vong, Khan 7 Makara,
KINGDOM OF CAMBODIA NATION RELIGION KING 3
 KINGDOM OF CAMBODIA NATION RELIGION KING 3 TOURISM STATISTICS REPORT September 2017 MINISTRY OF TOURISM Statistics and Tourism Information Department No. A3, Street 169, Sangkat Veal Vong, Khan 7 Makara,
KINGDOM OF CAMBODIA NATION RELIGION KING 3
 KINGDOM OF CAMBODIA NATION RELIGION KING 3 TOURISM STATISTICS REPORT September 2018 MINISTRY OF TOURISM Statistics and Tourism Information Department No. A3, Street 169, Sangkat Veal Vong, Khan 7 Makara,
Summary of debt securities outstanding
 Summary of debt securities outstanding All countries........................ 22,695 15,852 6,665 3,427 1,762 Developed countries........................ 16,504 13,087 5,869 2,716 701 Austria 510 173 44
Infographics on Electromobility (January 2019)
") Infographics on Electromobility (January 2019) Publisher: BMW Group Corporate Communications Electromobility Last Update: 04.01.2019 Contact: presse@bmw.de ELECTROMOBILITY IN GERMANY. SHARE IN NEW REGISTRATIONS
Infographics on Electromobility (January 2019) Publisher: BMW Group Corporate Communications Electromobility Last Update: 04.01.2019 Contact: presse@bmw.de ELECTROMOBILITY IN GERMANY. SHARE IN NEW REGISTRATIONS
Cotton This Month. Major Changes in Supply and Demand Estimates and Projections
 1629 K Street NW, Suite 702 Washington, DC 20006, USA Cotton This Month February 1, 2018 Major Changes in Supply and Demand Estimates and Projections India Mexico Pakistan United States 2017/18 production
Corn & Bean Producers-1
 Largest Corn Producing Countries - 2016 est. Largest Corn Importing Countries - 2016 est. (Marketing year - thousands of hectares, tons per hectare, and thousands of metric tons) (Marketing year - thousands
Information Technology and Economic Development: An Introduction to the Research Issues
 November 1998 Working Papers No. 153 Information Technology and Economic Development: An Introduction to the Research Issues TABLE 1 WORLD-WIDE INFORMATION TECHNOLOGY MARKET BREAKDOWN, 1995
Cotton This Month. Major Changes in Supply and Demand Estimates and Projections
 1629 K Street NW, Suite 702 Washington, DC 20006, USA Cotton This Month March 1, 2018 Major Changes in Supply and Demand Estimates and Projections Brazil China Turkey United States 2017/18: production
World Air Conditioner Demand by Region
 World Air Conditioner Demand by Region April 2015 The Japan Refrigeration and Air Conditioning Industry Association 1 World Air Conditioner Demand by Region April 2015 The Japan Refrigeration and Air Conditioning
Total credit to the non-financial sector (core debt), % of GDP Table F1.1
, % of GDP Table F1.1") Total credit to the non-financial sector (core debt), % of GDP Table F1.1 2012 2013 2014 2015 2016 Q2 16 Q3 16 Q4 16 Q1 17 Q2 17 Argentina 62.6 66.4 64.6 75.5 75.3 81.7 80.1 75.3 71.6 72.7 Australia 208.0
Total credit to the non-financial sector (core debt), % of GDP Table F1.1 2012 2013 2014 2015 2016 Q2 16 Q3 16 Q4 16 Q1 17 Q2 17 Argentina 62.6 66.4 64.6 75.5 75.3 81.7 80.1 75.3 71.6 72.7 Australia 208.0
Lifting Instructions for 1336 PLUS and FORCE D Frame Drives
 Installation Instructions Lifting Instructions for 1336 PLUS and FORCE D Frame Drives This publication will guide you through the steps needed to properly lift and mount the following drives: 1336 PLUS
9.01 ICT use for business-to-business transactions
 9.01 ICT use for business-to-business transactions To what extent do businesses in your country use ICTs for communicating and carrying out transactions with other businesses? [1 = not at all; 7 = extensively]
Production of heat by type Terajoules
 Production of heat by type Table Notes geo represents heat used directly for district heating, agriculture etc. without a commercial transaction taking place. Please refer to the Definitions Section on
1. INTERNATIONAL OVERVIEW. 1.0 Area and population. population (1,000) area
 area") 1.0 Area and population area population (1,000) km 2 2000 2010 2018 1 inhabitants per km 2 Belgium 30,530 10,251 10,920 11,443 375 Germany 357,380 82,212 81,777 82,952 232 Estonia 45,230 1,397 1,331 1,315
1.0 Area and population area population (1,000) km 2 2000 2010 2018 1 inhabitants per km 2 Belgium 30,530 10,251 10,920 11,443 375 Germany 357,380 82,212 81,777 82,952 232 Estonia 45,230 1,397 1,331 1,315
Fiche 1 Quelques données de la Banque Mondiale
 Fiche 1 Quelques données de la Banque Mondiale 274 WORLD DEVELOPMENT REPORT 2000 2001 Table 1. Size of the economy Surface Population area density Gross national product (GNP) GNP per capita GNP measured
Global Competitiveness Index Rankings
 APPENDIX B Global Competitiveness Index 2017 2018 Rankings The following pages report the GCI 2017 2018 rankings for the three subindexes (Table 1) and their corresponding pillars (Tables 2 4). Detailed
LPI ranking and scores, 2014
 ing and scores, 2014 Germany 1 4.12 100.0 Netherlands 2 4.05 97.6 Belgium 3 4.04 97.5 United Kingdom 4 4.01 96.6 Singapore 5 4.00 96.2 Sweden 6 3.96 94.9 Norway 7 3.96 94.8 Luxembourg 8 3.95 94.4 United
Major Changes in Supply and Demand Estimates and Projections
 INTERNATIONAL COTTON ADVISORY COMMITTEE 1629 K Street NW, Suite 702, Washington, DC 20006 USA Telephone (202) 463-6660 Fax (202) 463-6950 email secretariat@icac.org COTTON THIS MONTH April 1, 2016 Major
Energy Management :: 2007/2008
 :: 2007/2008 Class # 1P Course organization and Energy statistics Energy Prices Dr. João Parente joao.parente@dem.ist.utl.pt pt Primary Energy Supply Source: http://www.snowman-jim.org/science/images Class
Major Changes in Supply and Demand Estimates and Projections
 INTERNATIONAL COTTON ADVISORY COMMITTEE 1629 K Street NW, Suite 702, Washington, DC 20006 USA Telephone (202) 463-6660 Fax (202) 463-6950 email secretariat@icac.org COTTON THIS MONTH February 1, 2016 Major
STATISTICAL ANNEX NOTE ON QUARTERLY PROJECTIONS
 OECD Economic Outlook, Volume 2017 Issue 1 OECD 2017 This annex contains data on key economic series which provide a background to the recent economic developments in the OECD area described in the main
Annex. List of tables
 Statistical annex Annex List of tables A. 1 Developed economies: rates of growth of real GDP, 2000-2010... 145 A. 2 Economies in transition: rates of growth of real GDP, 2000-2010... 146 A. 3 Developing
Section III Macroeconomic environment
 Data Tables Section III Macroeconomic environment 2.2: Data Tables Section III: Macroeconomic environment 422 3.01 Government budget balance General government budget balance as a percentage of GDP 2010
 Urchin 7 cflag.ifas.ufl.edu Page 1 of 2 Standard View Export All Visits Permalink Geo Location Jul 1, 2015 - Jul 31, 2015 First Date 2015 Compare to Past Jan Feb Mar Apr May Jun Jul Aug Sep Oct Nov Dec
Production of heat by type Terajoules
 Production of heat by type Table Notes geo represents heat used directly for district heating, agriculture etc. without a commercial transaction taking place. represents heat used for the production of
CHARTS AND PRICE PROJECTIONS
 CHARTS AND PRICE PROJECTIONS 18 / Charts and Price Projections: FAPRI 28 Agricultural Outlook Average Annual GDP Growth, 27-217 Percent Change 1 8 8.4 7.92 6 4 4.44 3.67 4.6 4.34 2 2.37 2.17 1.38 2.44
Thermal Coal Market Presentation to UNECE Ad Hoc Group of Experts on Coal in Sustainable Development December 7, 2004
 Thermal Coal Market Presentation to UNECE Ad Hoc Group of Experts on Coal in Sustainable Development December 7, 2004 Barlow Jonker Pty Ltd Commercial in Confidence 1 Presentation Outline 1. Barlow Jonker
If center column value is F, the C equivalent is to the left. If center column value is C, the F equivalent is to the right.
 -40.00-40 -40.0-39.44-39 -38.2-38.89-38 -36.4-38.33-37 -34.6-37.78-36 -32.8-37.22-35 -31.0-36.67-34 -29.2-36.11-33 -27.4-35.56-32 -25.6-35.00-31 -23.8-34.44-30 -22.0-33.89-29 -20.2-33.33-28 -18.4-32.78-27
2.01 Availability of latest technologies
 2.01 Availability of latest technologies To what extent are the latest technologies available in your country? [1 = not available; 7 = widely available] 2010 2011 weighted average RANK COUNTRY/ECONOMY
Rectangular photoelectric proximity switches
 Rectangular photoelectric proximity switches Features Diffuse sensors with operating distance of 300 mm or 800 mm Through-beam sensors with operating distance of 15 or 50 m Reflex sensors with operating
CSM-K. high capacity clean steam generator
 CSM-K high capacity clean steam generator High capacity clean steam generator Spirax Sarco, the world s leading steam system specialist, has combined modern technology with package design expertise to
Spain s exports by oil product group and country of destination
 Corporación de Reservas Estratégicas de Productos Petrolíferos Castellana, 79 28046 Madrid T. +34 91 360 09 10 Updated F. +34 91 420 on39 45 www.cores.es February 13 th 2017 Spain s exports by oil product
2014/ /2015 Ghana / /2015 Syrian Arab Republic / /2015
 Exhibit C: international cotton trade data Source: International Cotton Advisory Committee, ICAC World Cotton Database, available at www.icac.org, last checked 1 April 2016. International Cotton Advisory
JURISDICTIONS PARTICIPATING IN THE CONVENTION ON MUTUAL ADMINISTRATIVE ASSISTANCE IN TAX MATTERS
 JURISDICTIONS PARTICIPATING IN THE CONVENTION ON MUTUAL ADMINISTRATIVE ASSISTANCE IN TAX MATTERS STATUS 27 JULY 2018 ORIGINAL CONVENTION 27-05-2010) OR OR 1. ALBANIA 01-03-2013 (AC) 08-08-2013 01-12-2013
(annual average compound growth rate)
") Table 3-1. 3KDVHVRI*URZWKE\0DMRU5HJLRQ (annual average compound growth rate) 1820-70 1870-1913 1913-50 1950-73 1973-92 1820-1992 GDP Western Europe 1.7 2.1 1.4 4.7 2.2 2.2 Western Offshoots 4.3 3.9 2.8
Table 3-1. 3KDVHVRI*URZWKE\0DMRU5HJLRQ (annual average compound growth rate) 1820-70 1870-1913 1913-50 1950-73 1973-92 1820-1992 GDP Western Europe 1.7 2.1 1.4 4.7 2.2 2.2 Western Offshoots 4.3 3.9 2.8
UXC.COM A PUBLICATION OF. NPO Overview 1501 MACY DRIVE ROSWELL, GA PH FX
 2019 A PUBLICATION OF UXC.COM NPO Overview 1501 MACY DRIVE ROSWELL, GA 30076 PH +1 770 642-7745 FX +1 770 643-2954 NOTICE UxC, LLC ( UxC ) shall have title to, ownership of, and all proprietary rights
5.01 Secondary education enrollment rate
 5.01 Secondary education enrollment rate Gross secondary education enrollment rate 2011 or most recent year available RANK COUNTRY/ECONOMY Value 1 Australia 8...131.3 2 Spain...128.5 3 Seychelles...123.9
Packing Data Installation Instructions
 Packing Data PK Installation Instructions This document describes how to install a Dataliner DL10 display in a panel or enclosure and connect power. European Union Directive Compliance wiring and safety
UAE draft regulation for Electric Vehicle
 UAE draft regulation for Electric Vehicle Emirates Authority for Standardization and Metrology Eng. Khaled Ali Abdullmajeed Contents - Introduction of ESMA. - Introduction of EV Regulation in UAE - The
CROP PLUS CARRY FORWARD STOCKS (SULTANA & THOMPSONS) GOLDEN SEEDLESS
 GOLDEN SEEDLESS") WORLD DRIED GRAPE PRODUCTION AND AVAILABILITY, 2017 (TONS) SULTANA & THOMPSONS CROP PLUS CARRY FORWARD STOCKS (SULTANA & THOMPSONS) GOLDEN SEEDLESS CROP PLUS CARRY FORWARD STOCKS (GOLDEN SEEDLESS) CURRANTS
WORLD DRIED GRAPE PRODUCTION AND AVAILABILITY, 2017 (TONS) SULTANA & THOMPSONS CROP PLUS CARRY FORWARD STOCKS (SULTANA & THOMPSONS) GOLDEN SEEDLESS CROP PLUS CARRY FORWARD STOCKS (GOLDEN SEEDLESS) CURRANTS
Selected Energy Indicators for 2004
 E E G Y D C A T O S Selected Energy ndicators for 2004 egion/ Popu- GDP GDP Energy et TPES Elec. CO 2 Country lation (PPP) Prod. mports Cons. (a) Emissions (b) (million) (billion (billion (Mtoe) (Mtoe)
Global Medium & Heavy Commercial Vehicle Model Level Production Forecast Report. From 2001 to 2021
 Global Medium & Heavy Commercial Vehicle Model Level Production Forecast Report From 2001 to 2021 Global CV Markets Covered Industry Production Data Truck & Bus Model Production Forecast Engine Production
JURISDICTIONS PARTICIPATING IN THE CONVENTION ON MUTUAL ADMINISTRATIVE ASSISTANCE IN TAX MATTERS
 JURISDICTIONS PARTICIPATING IN THE CONVENTION ON MUTUAL ADMINISTRATIVE ASSISTANCE IN TAX MATTERS COUNTRY/JURISDICTION * STATUS 10 NOVEMBER 2017 1. ALBANIA 01-03-2013 (AC) 08-08-2013 01-12-2013 2. ANDORRA
Schedule of Accreditation issued by United Kingdom Accreditation Service 2 Pine Trees, Chertsey Lane, Staines-upon-Thames, TW18 3HR, UK
 2 Pine Trees, Chertsey Lane, Staines-upon-Thames, TW18 3HR, UK Accredited to ISO/IEC 17021-1:2015 to provide environmental 4th Floor Vivo Building 30 Stamford Street SE1 9LQ United Kingdom Contact: Mr
I. Global wine markets,
 I. Global wine markets, 2007-09 Table 1: Summary of the world's wine markets, 2007-09 (annual average) Vine % of cropland Wine Wine Wine Wine Wine Per adult wine Pop- GDP GDP Area under vines produced
Consumption per capita 43 Appendices Conversion factors 44 Definitions 44 Further information 45
 Quantifying energy BP Statistical Review of World Energy June 2006 Introduction Group chief executive s introduction 1 2005 in review 2 Oil Reserves 6 Production 8 Consumption 11 Regional consumption by
JURISDICTIONS PARTICIPATING IN THE CONVENTION ON MUTUAL ADMINISTRATIVE ASSISTANCE IN TAX MATTERS
 JURISDICTIONS PARTICIPATING IN THE CONVENTION ON MUTUAL ADMINISTRATIVE ASSISTANCE IN TAX MATTERS COUNTRY/JURISDICTION * STATUS 15 DECEMBER 2017 1. ALBANIA 01-03-2013 (AC) 08-08-2013 01-12-2013 2. ANDORRA
BP Statistical Review of World Energy June 2013
 BP Statistical Review of World Energy June 2013 bp.com/statisticalreview 1 Introduction 6 Oil 1 Group chief executive s introduction 2 2012 in review 6 Reserves 8 Production and consumption 15 Prices 16
Microsoft Social Engagement Translation Guide Last Updated: October 2017
 Microsoft Social Engagement Translation Guide Last Updated: October 2017 Microsoft Social Engagement is translated and supported by Microsoft and made generally available in the countries/regions and languages
Fork through-beam sensors
 Fork throughbeam sensors Features Wide range of sizes: fork widths from 2 to 220 mm Metal housings Integrated evaluation unit Connection by means of S8 connector Degree of protection Adjustable sensitivity
CHARTS AND PRICE PROJECTIONS
 CHARTS AND PRICE PROJECTIONS 18 / Charts and Price Projections: FAPRI 27 Agricultural Outlook Average Annual GDP Growth Percent Change 9 8 7 6 4 3 2 1 26-216 Canada China EU NMS EU- India Japan Latin America
Made UNDER high pressure
 Made UNDER high pressure Made FOR high pressure THE CONTRINEX HIGH-PRESSURE-RESISTANT INDUCTIVE SENSOR SERIES Contrinex is a leading international high-tech sensor company with headquarters in Switzerland.
Market Briefing: Global Markets
 Market Briefing: Global Markets September 26, 217 Dr. Edward Yardeni 516-972-7683 eyardeni@ Mali Quintana 48-664-1333 aquintana@ Please visit our sites at blog. thinking outside the box Table Of Contents
AlixPartners Automotive Electrification Index. Second Quarter 2017
 AlixPartners Automotive Electrification Index Second Quarter 217 AlixPartners Automotive Electrification Index e-range E-RANGE = Sum of electric range of all electric vehicles (EV) sold By automaker, segment,
Appendix 2 Global Economic Indicators
 Appendix 2 Global Economic Indicators 151 G L O B A L E C O N O M I C P R O S P E C T S Table A2.1 Growth of real GDP, 1966 28 (GDP in 1987 prices and exchange rates average annual percentage growth) 1998
Fork through-beam sensors
 Fork throughbeam sensors Features Wide range of sizes: fork widths from 2 to 220 mm Metal housings Integrated evaluation unit Connection by means of S8 connector Degree of protection Adjustable sensitivity
CrimpTest-1 kn. Calibration Bracket
 CrimpTest-1 kn Calibration Bracket 431-471-02 May 2017 CrimpTest-1 kn Calibration Bracket Manual This manual describes the operation of the calibration test rig part no. 432-671, for the purpose of checking
THE WITTUR ANSWER TO THE MACHINE ROOMLESS MARKET REQUIREMENTS. MRL W Line. EMOTION IN MOTION
 THE WITTUR ANSWER TO THE MACHINE ROOMLESS MARKET REQUIREMENTS EMOTION IN MOTION ADVANCED FEATURES THE WITTUR ANSWER TO THE CURRENT MRL MARKET REQUIREMENTS The, Wittur s new generation of machine roomless
D6.. Butterfly valves. For controlled operation.
 D6.. Butterfly valves. For controlled operation. Water is our element. www.belimo.eu Total solutions for medium and large volumetric flows. Butterfly valves from Belimo are available as classical D6..N
1204 Terminator. Instructions 1204 T F B2. (Catalog Number 1204-TFA1, 1204-TFB2) Where this Option is Used. What this Option Contains
 Where this Option is Used. What this Option Contains") Instructions 1204 Terminator (Catalog Number 1204-TFA1, 1204-TFB2) Where this Option is Used The 1204 Terminator Option can be installed in most adjustable frequency AC drive applications to increase protection
Instructions 1204 Terminator (Catalog Number 1204-TFA1, 1204-TFB2) Where this Option is Used The 1204 Terminator Option can be installed in most adjustable frequency AC drive applications to increase protection
Annex IV. True nationality of the 20 largest fleets by flag of registration, as at 1 January 2011 a
 194 Annex IV. True nationality of the 20 largest fleets by flag of registration, as at 1 January 2011 a Antigua and Barbuda Bahamas China Belgium 0 0-9 122 0.2 1 59 0.1 Bermuda 0 0-17 1 907 2.8 0 0 - Brazil
Summary of Contributions to UN Peacekeeping by Country and Post.
 Summary of Contributions to UN Peacekeeping by Country and Post. Police,UN Military, s and Troops 31/07/2018 1 Country Name POST MALE FEMALE TOTAL Algeria 2 3 4 5 6 7 Argentina Armenia Australia Austria
Citrus Fruit - Fresh and Processed Statistical Bulletin 2016
 CITRUS FRUIT FRESH AND PROCESSED STATISTICAL BULLETIN 2016 Citrus Fruit - Fresh and Processed Statistical Bulletin 2016 Market and Policy Analysis of Raw Materials, Horticulture and Tropical (RAMHOT)
YOUR CLEAR CHOICE FOR PREMIUM PACKAGING SOLUTIONS
 YOUR CLEAR CHOICE FOR PREMIUM PACKAGING SOLUTIONS Unit of Length Milli (mm) to Inches MM Decimal of inch Approx. Inch MM Decimal of inch Approx. inch 1 0.0394 3/64 14 0.5512 9/16 2 0.0787 5/64 15 0.5906
PLASTIC WELDING. New! TRIAC AT. Intelligent and robust.
 PLASTIC WELDING TRIAC AT New! Intelligent and robust. Hot air tool TRIAC AT The new TRIAC AT is an intelligent yet robust hot air tool for welding and shrinking plastic. It is designed for the needs of
STATISTISCHER ANHANG VORLÄUFIGE AUSGABE
 OECD-Wirtschaftsausblick Ausgabe 2013/1 OECD 2013 STATISTISCHER ANHANG VORLÄUFIGE AUSGABE Die statistischen Daten für Israel wurden von den zuständigen israelischen Stellen bereitgestellt, die für sie
Spain s exports by oil product group and country of destination. Year Corporación de Reservas Estratégicas de Productos Petrolíferos
 Corporación de Reservas Estratégicas de Productos Petrolíferos Castellana, 79 28046 Madrid T. +34 91 360 09 10 Updated F. +34 91 420 on39 45 www.cores.es July 13 th 2015 Spain s exports by oil product
Spain s imports by oil product group and country of origin
 Corporación de Reservas Estratégicas de Productos Petrolíferos Castellana, 79 28046 Madrid T. +34 91 360 09 10 Updated F. +34 91 420 on39 45 www.cores.es September 12 th 2018 Spain s imports by oil product