Creating a Lean and Productive Processing Facility
|
|
|
- Eileen Burns
- 5 years ago
- Views:
Transcription
1 Creating a Lean and Productive Processing Facility Amsterdam 31st May 2013

2 Nick Tandy EBA Flying Squad Operational Improvement Lead, Filton, until May 2011 Sarah Raymond Head of Operations Filton, NHS Blood and Transplant

3 The Filton Experience Sarah Raymond Head of Operations - Filton
4 Objectives Background NHSBT Filton Summary of progress Key successes Update on current lean activities Plans for the future
5 Collection into Filton Birmingham Collections received from up to 48 teams Filton Oxford Tooting Southampton Plymouth
6 Distribution to and from Filton Filton Distributes to Brentwood Birmingham Bristol Oxford Plymouth Southampton Tooting Birmingham Oxford Filton Southampton Tooting Brentwood Plymouth

7 Filton Manufacturing Today 4, ,000 Key Red Blood Cells 150,000 Platelet Doses 90, ,000 Fresh Frozen Plasma and Cryo Special Products Extended Phenotypes


8 Evolution of a new Filton Centre October 2006 Building of the Filton Centre commenced November 2008 All Southmed services were transferred to the new Filton centre December 2004 Outline Business Case Approved May 2006 Full Business Case Produced and agreed June 2008 Practical Completion of the Filton Centre
9 Consolidation and Evolution Nov 2008 All services from Southmead moved into Filton May 2009 All services in the region consolidated into Filton September 2009 Operational Improvement Programme implemented at Filton. Implementation of pod manufacturing. February st Tranche of activity from London consolidated into Filton Jan 2011 Launch of new staffing structure to support pod operations. Model linked to OIP proven outputs March 2011 Further additional activity from London consolidated into Filton: + 200, ,000 donations 495,000 donations 615,000 donations 830,000 donations 43 WTE staff 85 WTE staff 98 WTE staff 100 WTE staff Productivity circa 5,500 Productivity circa 6,200 Productivity circa 7,500 Productivity circa 9,800
10 Manufacturing Productivity in the South West OIP launched 1 st tranche from London Filton opens 2 nd tranche from London Sep-07 Nov-07 Jan-08 Mar-08 May-08 Jul-08 Sep-08 Nov-08 Jan-09 Mar-09 May-09 Jul-09 Sep-09 Nov-09 Jan-10 Mar-10 May-10 Jul-10 Sep-10 Nov-10 Jan-11 Mar-11 May-11 Jul-11 Sep-11 Nov-11 Jan-12 Mar-12 SW Consolidation Month Oct - Dec 09 Pods created New Staffing Structure Jan 2011 Mar-07 May-07 Jul-07 Number of units processed
11 So what have been the key successes along the way...


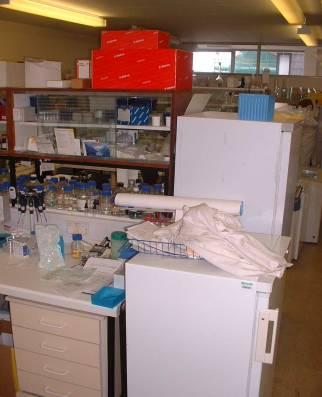


12 We went from this in 2007 Southmead Site 240,000 red cell collections per year


13 To this in New Filton centre 495,000 donations manufactured and tested

14 Original Manufacturing Lines Tended to Encourage batch Processing Centrifuge all Press all Label all Communication poor
15 Launch of OIP national programme in summer 2009 First RIE- revelation! Lean Manufacturing POD Smaller batches Less Work in progress Units back in fridge quicker Greater visibility Removal of excess walking Flexibility to change product

16 Pod world created

17 Despite good progress...the Burning Platform Closure of Brentwood site meant an additional 200,000 red cell donations per year for Filton but... Productivity not optimised Staff not in the right place at the right time Lack of formal production scheduling Need to drive out further waste from pods
18 So what did we do...?
19 We revisited the pod design and standard work Removal of waste allowed 2 people to run a Pod 33% improvement in Pod Productivity Operator 1 PCS74, Load centrifuge, Press Operator 2 SO7 & Cut down
20 Scheduled all activities by hour per pod 8am 9am 9am 10am 10am 11am 11am 12am 12am 1pm CRY O CRY O CRY O CRY O CRY O FFP FFP FFP 1pm 2pm 2pm 3pm 3pm 4pm 4pm 5pm 5pm 6pm
21 Revised staffing structure Using standard work With workflow modelling Built a staffing structure to support the operation Consultation New staffing structure launched Jan 2011


22 Concept - Use of Collection forecast to manage the Lab in a more efficient way Use the Forecast to plan the number of holiday slots available each day. Use the forecast to plan training on low bleed days. Use of Forecast Date Day 94% PD 01 April 2012 Sa/Su April 2012 Mo April 2012 Tu April 2012 We April 2012 Th April 2012 Fr April 2012 Sa April 2012 Sa/Su April 2012 Mo April 2012 Tu April 2012 We April 2012 Th April 2012 Fr April 2012 Sa April 2012 Sa/Su 522 Use the Forecast to Plan Machine Maintenance in advance Use the Forecast to plan the number of machines we are going to run each day of the following week.
23 Adapting Manufacturing schedule on daily basis Days between units (Max FFP) FFP & Cryo Average units Target for day FFP 600 Cryo 200 BAT 36 BAT 360 IP 1725 Days between units (Normal Day) FFP & Cryo BAT Average units Target for day FFP 500 Cryo 200 BAT 360 IP 2100 Days between units (Busy Day) FFP & Cryo BAT Average units Target for day FFP 330 Cryo 200 BAT 360 IP 2700

24 Progress tracking in each pod every hour Staff took ownership of progress Confirmation of throughput each hour at pod level Problems identified and noted

25 As a result in February 2011 Increased production by 200,000 donations With a Staffing increase of only 2 whole time equivalents
26 Units produced/wte/year 2011 to now...sustainment and continuous improvement Manufacturing Productivity Jan-11 Mar-11 May-11 Jul-11 Sep-11 Nov-11 Jan-12 Mar-12 May-12 Jul-12 Sep-12 Nov-12 Jan-13 Mar-13 Month A B Productivity has remained relatively stable EBA upper quartile 2 blips: Flood in Sept 2012 (A) Snow in Dec 2012 (B)
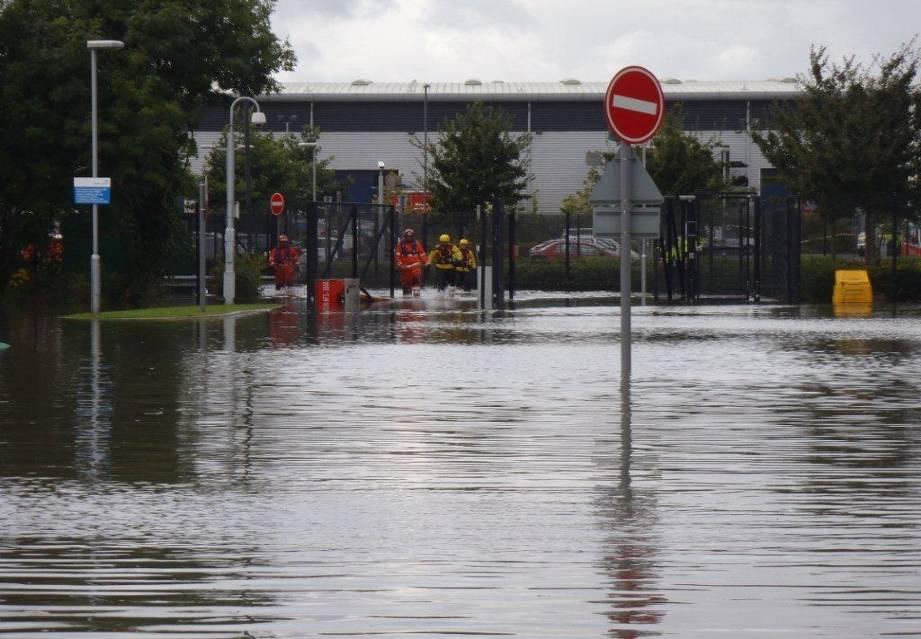
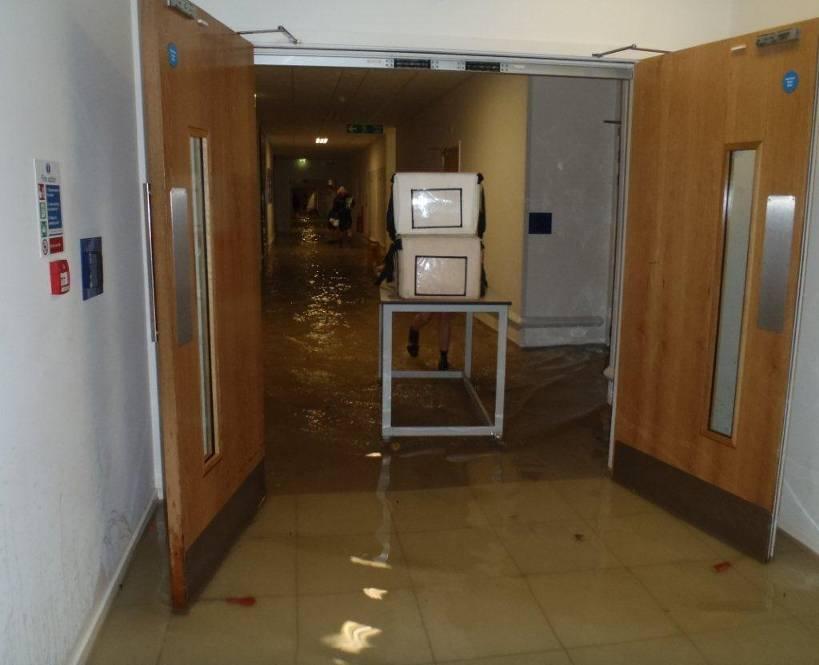

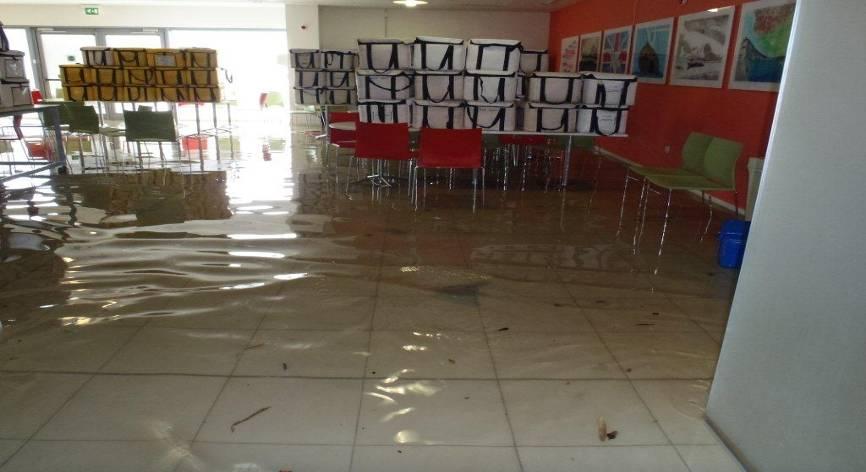
27 Disaster!

28 One week later


29 Filton OIP Run regular RIEs so far have involved over 500 staff With much success to celebrate...
 Filton Lancaster 19,984 saving on discard packaging (Following")
30 RIE - Filton Improvement examples Graph to Show the Number of Reconciliation Failures Nationally Number of Reconciliation Failures Jan Feb March April May June July August September October November December Month 70% Reduction in the number of reconciliation failures (Following Filton Reconciliation RIE) Filton Lancaster 19,984 saving on discard packaging (Following Filton Discard RIE) 6,000,000 less scans per year (Following Auto discard RIE) 2 WTE staffing removed from 2013/14 budget as direct result


31 T3 T2 T4 T1 Secondary Cell RIE Previous Walking New layout 26 KM per week less walking 20% more space available Extra Pod for new product
32 Future Need to consider Falling demand for RBC Increase productivity Reduce cost
33 Filton VSA in November 2012 Audit of lean processes and pods Analysis of current state Set targets for future state Future State map Produce 12 month plan of activity
34 Filton Targets Productivity Staff turnover Attendance Wastage OTIF (On time in full) Lean training
35 Key Operational Improvement themes for 2013 Measurement of standard work to improve resource requirements A structured programme of 6 s improvements Improved visual management Reduction in product waiting time Further targeted RIE s to remove waste from the process Staff flexibility between departments
36 Support project sustainment through audit OIP training (Bronze, Silver, Gold, Platinum) OIP training at Induction Target 100% staff green (basic) trained by 2013 year end Greater Staff involvement - create a bottom up approach Continuous Improvement - Business as Usual National Standardisation

37 Thank you...and to All our colleagues in Filton and NHSBT All the blood services who helped us!
Date Event or Holiday :Sun, 2:Mon North Orchard Delong Preschool North Orchard Delong Preschool
 2018 6 1 1:Sun, 2:Mon 2018-2019 Date Event or Holiday Aug 16 Board Meeting 6pm Aug 23 Open House June 2018 July 2018 August 2018 Sep 06 Board Meeting 6pm Su M Tu W Th F Sa Su M Tu W Th F Sa Su M Tu W Th
2012/13. Claire Chang. NHSBT Customer Services
 2012/13 Claire Chang Total red cells issued (since 1999) Average age of red cells at dispatch Number of red cells issued with
CEO PROGRAM September 2018
 CEO PROGRAM September 2018 1 Sept 17th: ALL! CEO High Orientation (Kiva 6pm 7:30pm) 2 3 4 5 6 7 8 Sept 18th: ALL! CEO Orientation (Kiva 6pm 7:30pm) 9 10 11 12 13 14 15 *Parents please drop off/pick up
up the formulas. You can copy/paste the formulas for the days within the same October 2017 Jan 1, 2 & 5 Student Christmas Break April 2018
 School Year Calendar Template 2013-2014 Vertex42 LLC INSTRUCTIONS Year: 2017 Beginning Month: 8 Start day: 1 1:Sunday, 2:Monday «Choose the year and beginning month Note: If you choose Monday as the start
Units of Instruction MISD Pacing Guide Days Date Range Test Date
 MISD Pacing Guide Date Range Test Date Introduction: Processes of Investigations (1 day) Aug. 21 Unit 01: Matter (12 days) Aug. 22-Sept. 7 Sep. 10 Unit 02: Atomic Structure and the Periodic Table (15 days)
Design Criteria Data
 BIRMINGHAM AL Latitude = 33.57 N WMO No. 72228 Longitude = 86.75 W Elevation = 63 feet Period of Record = 1973 to 1996 Average Pressure = 29.36 inches Hg Design Criteria Data Mean Coincident (Average)
VEHICLE / PEDESTRIAN COLLISIONS
 Info item No. 1 Crosswalk Safety Advisory Committee March 31, 2016 VEHICLE / PEDESTRIAN COLLISIONS HRM: January December 20 DISCLAIMER: All figures presented in this report reflect the information held
Action Requested From AMWG
 Action Requested From AMWG NONE, These Two Presentations Are For Information Transfer Only The information is derived from a multi-year synthesis research effort related to existing data on flow, sediment-transport
Design Criteria Data
 SPRINGFLD MO Latitude = 37.23 N WMO No. 7244 Longitude = 93.38 W Elevation = 127 feet Period of Record = 1973 to 1996 Average Pressure = 28.66 inches Hg Design Criteria Data Mean Coincident (Average) Values
Total Production by Month (Acre Feet)
") Production by Month (acre-feet) 2008 2009 2010 2011 2012 2013 2014 2015 2016 January 25 339.10 228.90 249.50 297.99 243.06 327.14 247.66 212.37 February 234.00 218.80 212.10 241.52 245.82 279.08 234.16
Production by Month (acre-feet) 2008 2009 2010 2011 2012 2013 2014 2015 2016 January 25 339.10 228.90 249.50 297.99 243.06 327.14 247.66 212.37 February 234.00 218.80 212.10 241.52 245.82 279.08 234.16
D G A G R I D A S H B O A R D : A P P L E S
 75 79 60 56 49 74 65 59 54 42 76 63 58 53 78 55 42 43 79 44 81 63 47 83 64 59 53 48 Sources: Eurostat, MSs notifications, DG Agri, Comext, Comtrade, GTA, ITC, AMI, Expert groups, Freshfel, Wapa. 89 68
WIM #37 was operational for the entire month of September Volume was computed using all monthly data.
 SEPTEMBER 2016 WIM Site Location WIM #37 is located on I-94 near Otsego in Wright county. The WIM is located only on the westbound (WB) side of I-94, meaning that all data mentioned in this report pertains
Commercial-in-Confidence Ashton Old Baths Financial Model - Detailed Cashflow
 Year 0 1 2 3 4 5 6 7 8 9 10 11 12 13 Oct-16 Nov-16 Dec-16 Jan-17 Feb-17 Mar-17 Apr-17 May-17 Jun-17 Jul-17 Aug-17 Sep-17 Oct-17 2,038 2,922 4,089 4,349 6,256 7,124 8,885 8,885 8,885 8,885 8,885 8,885 9,107
Design Criteria Data
 MINOT AFB ND Latitude = 48.42 N WMO No. 727675 Longitude =11.3 W Elevation = 1667 feet Period of Record = 1967 to 1996 Average Pressure = 28.16 inches Hg Design Criteria Data Mean Coincident (Average)
ENVIRONMENTAL & ENGINEERING SERVICES DEPARTMENT
 CITY OF LONDON ENVIRONMENTAL & ENGINEERING SERVICES DEPARTMENT WASTEWATER TREATMENT OPERATIONS VAUXHALL WASTEWATER TREATMENT PLANT 2013 ANNUAL REPORT FEBRUARY 2014 Vauxhall Wastewater Treatment Plant 2013
Design Criteria Data
 PHILADELPHIA PA Latitude = 39.88 N WMO No. 7248 Longitude = 75.25 W Elevation = 3 feet Period of Record = 1973 to 1996 Average Pressure = 29.98 inches Hg Design Criteria Data Mean Coincident (Average)
Design Criteria Data
 COLUMBIA SC Latitude = 33.95 N WMO No. 7231 Longitude = 81.12 W Elevation = 226 feet Period of Record = 1973 to 1996 Average Pressure = 29.8 inches Hg Design Criteria Data Mean Coincident (Average) Values
Design Criteria Data
 RAPID CITY SD Latitude = 44.5 N WMO No. 72662 Longitude =3. W Elevation = 3169 feet Period of Record = 1973 to 1996 Average Pressure = 26.67 inches Hg Design Criteria Data Mean Coincident (Average) Values
Design Criteria Data
 MACON/LEWIS WILSON GA Latitude = 32.7 N WMO No. 72217 Longitude = 83.65 W Elevation = 361 feet Period of Record = 1973 to 1996 Average Pressure = 29.66 inches Hg Design Criteria Data Mean Coincident (Average)
Design Criteria Data
 PIERRE SD Latitude = 44.38 N WMO No. 726686 Longitude =1.2 W Elevation = 1742 feet Period of Record = 1973 to 1996 Average Pressure = 28.1 inches Hg Design Criteria Data Mean Coincident (Average) Values
Design Criteria Data
 ANCHORAGE AK Latitude = 61.17 N WMO No. 7273 Longitude =15. W Elevation = 131 feet Period of Record = 1973 to 1996 Average Pressure = 29.6 inches Hg Design Criteria Data Mean Coincident (Average) Values
Price Category Breakdown - February 2010
 SINGLE FAMILY RESIDENTIAL BREAKDOWN ruary 21 ruary Sales and Average Price Increase Annually TORONTO - Wednesday, March 3, 21 7.3 % 24.6 % 1.8 % 7.3%.2%.1 % Greater Toronto REALTORS reported 7,291 sales
Algebra II Pacing Guide
 Unit 13: Exploring a Business Venture (10 days) 8 May 13 - May 24 n/a MISD Pacing Guide Date Range Unit 01: Introduction to Functions in 15 Aug. 21 - Sept. 11 Sept. 12 Unit 02: Absolute Value Functions,,
Design Criteria Data
 JACKSONVILLE FL Latitude = 3.5 N WMO No. 7226 Longitude = 81.7 W Elevation = 3 feet Period of Record = 1973 to 1996 Average Pressure = 3.1 inches Hg Design Criteria Data Mean Coincident (Average) Values
Design Criteria Data
 SPOKANE WA Latitude = 47.63 N WMO No. 72785 Longitude =117.5 W Elevation = 2366 feet Period of Record = 1973 to 1996 Average Pressure = 27.5 inches Hg Design Criteria Data Mean Coincident (Average) Values
Design Criteria Data
 DAYTON/JAMES M COX OH Latitude = 39.9 N WMO No. 72429 Longitude = 84.2 W Elevation = 14 feet Period of Record = 1973 to 1996 Average Pressure = 28.95 inches Hg Design Criteria Data Mean Coincident (Average)
Design Criteria Data
 LOUISVILLE/STANDIFORD KY Latitude = 38.18 N WMO No. 72423 Longitude = 85.73 W Elevation = 489 feet Period of Record = 1973 to 1996 Average Pressure = 29.49 inches Hg Design Criteria Data Mean Coincident
Sound Transit Operations July 2016 Service Performance Report. Ridership
 Ridership Total Boardings by Mode Mode Jul-15 Jul-16 % YTD-15 YTD-16 % ST Express 1,618,779 1,545,852-4.5% 10,803,486 10,774,063-0.3% Sounder 333,000 323,233-2.9% 2,176,914 2,423,058 11.3% Tacoma Link
Design Criteria Data
 MINNEAPOLIS-ST PAUL MN Latitude = 44.88 N WMO No. 72658 Longitude = 93.22 W Elevation = 837 feet Period of Record = 1973 to 1996 Average Pressure = 29.7 inches Hg Design Criteria Data Mean Coincident (Average)
Design Criteria Data
 DULUTH MN Latitude = 46.83 N WMO No. 72745 Longitude = 92.18 W Elevation = 1417 feet Period of Record = 1973 to 1996 Average Pressure = 28.43 inches Hg Design Criteria Data Mean Coincident (Average) Values
GAZIFÈRE INC. Prime Rate Forecasting Process 2017 Rate Case
 Overview A consensus forecast is used to estimate the prime rate charged by commercial banks. As the prime rate is subject to competitive pressures faced by individual lenders and is set on an individual
Design Criteria Data
 CHARLESTON/KANAWHA WV Latitude = 38.37 N WMO No. 72414 Longitude = 81.6 W Elevation = 981 feet Period of Record = 1973 to 1996 Average Pressure = 29. inches Hg Design Criteria Data Mean Coincident (Average)
May '18 June '18 July '18 August '18 S M T W T F S S M T W T F S S M T W T F S S M T W T F S
 2018 Calendar Sanitation Holidays and Recycling Collection Days **** SUBJECT TO CHANGE *** January '18 February '18 March '18 April '18 1 2 3 4 5 6 1 2 3 1 2 3 1 2 3 4 5 6 7 7 8 9 10 11 12 13 4 5 6 7 8
TECHNICAL SERVICE BULLETIN
 TECHNICAL SERVICE BULLETIN To: Minuteman Dealers and Customers From: Minuteman Technical Support Date: 1/12/2011 Subject: TSB for the KIT # K-FRSPEEDSWT. For the FR17115, FR17220, FR20115 and FR20220 models.
2017 Adjusted Count Report February 12, 2018
 A statewide multi-use trail user study and volunteer data collection program 2017 Adjusted Count Report February 12, 2018 The following report includes the final adjusted infrared (IR) counter data at
COMPILED BY GLASS S. Auction Report - LCV November 2013
 GLASS S Auction Report - LCV November 2013 Contents Market Commentary Page 3 Whole Market Summary Page 8 Average Sales Price Year on Year Page 9 Sales Price Compared to Number of Entries (all ages) Page
Water side Economizer WC chiller
 Appendices Water side Economizer WC chiller Power Loading Lighting Load W/ft^2 Area (ft^2) W kw 3.5 48152 168532 Water Cooled Chiller kw/ton 0.7 UA Supply Fan BHP kw wall 1069 58 43 window 3642 roof 295
Design Criteria Data
 CHICAGO/O HARE IL Latitude = 41.98 N WMO No. 7253 Longitude = 87.9 W Elevation = 673 feet Period of Record = 1967 to 1996 Average Pressure = 29.27 inches Hg Design Criteria Data Mean Coincident (Average)
Design Criteria Data
 BURLINGTON VT Latitude = 44.47 N WMO No. 72617 Longitude = 73.15 W Elevation = 341 feet Period of Record = 1973 to 1996 Average Pressure = 29.61 inches Hg Design Criteria Data Mean Coincident (Average)
FOR IMMEDIATE RELEASE
 Article No. 7433 Available on www.roymorgan.com Roy Morgan Unemployment Profile Friday, 12 January 2018 2.6m Australians unemployed or under-employed in December The latest data for the Roy Morgan employment
Design Criteria Data
 INDIANAPOLIS IN Latitude = 39.73 N WMO No. 72438 Longitude = 86.27 W Elevation = 87 feet Period of Record = 1973 to 1996 Average Pressure = 29.15 inches Hg Design Criteria Data Mean Coincident (Average)
Design Criteria Data
 HONOLULU/OAHU HI Latitude = 21.35 N WMO No. 91182 Longitude =157.9 W Elevation = 16 feet Period of Record = 1967 to 1996 Average Pressure = 29.96 inches Hg Design Criteria Data Mean Coincident (Average)
STAFF REPORT INFORMATION ONLY
 Insert TTC logo here STAFF REPORT INFORMATION ONLY Presentation: Subway Closures - 2016 Year In Review and 2017 Forecast Date: January 18, 2017 To: From: TTC Board Chief Executive Officer Summary The purpose
Design Criteria Data
 RENO/CANNON INTL NV Latitude = 39.5 N WMO No. 72488 Longitude =119.7 W Elevation = 44 feet Period of Record = 1973 to 1996 Average Pressure = 25.57 inches Hg Design Criteria Data Mean Coincident (Average)
Design Criteria Data
 DENVER/STAPLETON CO Latitude = 39.75 N WMO No. 72469 Longitude =14.8 W Elevation = 5332 feet Period of Record = 1973 to 1995 Average Pressure = 24.66 inches Hg Design Criteria Data Mean Coincident (Average)
Design Criteria Data
 OKLAHOMA CITY OK Latitude = 35.4 N WMO No. 72353 Longitude = 97.6 W Elevation = 133 feet Period of Record = 1973 to 1996 Average Pressure = 28.62 inches Hg Design Criteria Data Mean Coincident (Average)
Year to Date Summary. Average and Median Sale Prices
 A Publication of RMLS, The Source for Real Estate Statistics in Your Community Residential Review: Southwest Washington September 2018 Reporting Period September Residential Highlights Southwest Washington
Design Criteria Data
 BOSTON/LOGAN MA Latitude = 42.37 N WMO No. 7259 Longitude = 71.3 W Elevation = 3 feet Period of Record = 1967 to 1996 Average Pressure = 29.95 inches Hg Design Criteria Data Mean Coincident (Average) Values
Design Criteria Data
 MIDLAND TX Latitude = 31.95 N WMO No. 72265 Longitude =2. W Elevation = 2861 feet Period of Record = 1973 to 1996 Average Pressure = 27.3 inches Hg Design Criteria Data Mean Coincident (Average) Values
Design Criteria Data
 MEDFORD/JACKSON CO. OR Latitude = 42.37 N WMO No. 72597 Longitude =122.8 W Elevation = 1329 feet Period of Record = 1973 to 1996 Average Pressure = 28.61 inches Hg Design Criteria Data Mean Coincident
Design Criteria Data
 WASHINGTON/DULLES VA Latitude = 38.95 N WMO No. 7243 Longitude = 77.45 W Elevation = 322 feet Period of Record = 1973 to 1996 Average Pressure = 29.68 inches Hg Design Criteria Data Mean Coincident (Average)
Design Criteria Data
 NEW YORK/JOHN F KENNEDY NY Latitude = 4.65 N WMO No. 74486 Longitude = 73.78 W Elevation = 23 feet Period of Record = 1973 to 1996 Average Pressure = 29.98 inches Hg Design Criteria Data Mean Coincident
Monthly Hog Market Update United States Hog Production
 This information is provided as a resource by Saskatchewan Agriculture staff All prices are in Canadian dollars unless otherwise noted. Please use this information at your own risk. Monthly Hog Market
Design Criteria Data
 LANDER/HUNT WY Latitude = 42.82 N WMO No. 72576 Longitude =18.7 W Elevation = 5558 feet Period of Record = 1973 to 1996 Average Pressure = 24.44 inches Hg Design Criteria Data Mean Coincident (Average)
Design Criteria Data
 ALBUQUERQUE NM Latitude = 35.5 N WMO No. 72365 Longitude =16.6 W Elevation = 5315 feet Period of Record = 1967 to 1996 Average Pressure = 24.72 inches Hg Design Criteria Data Mean Coincident (Average)
Design Criteria Data
 DES MOINES IA Latitude = 41.53 N WMO No. 72546 Longitude = 93.65 W Elevation = 965 feet Period of Record = 1973 to 1996 Average Pressure = 28.96 inches Hg Design Criteria Data Mean Coincident (Average)
Bulk Storage Containers
 UCSB AST SPCC SELF-INSPECTION CHECKLIST Year: Responsible Department: Tank Location: Tank ID: Bulk Storage Containers Total tank capacity: Petroleum type and amount: Secondary containment type: (diesel,
Automotive Gas Oil (Diesel) Price Watch
 Price Watch") Automotive Gas Oil (Diesel) Price Watch (JANUARY 2018) Report Date: February 2018 Data Source: National Bureau of Statistics (NBS) Contents Executive Summary 1 PMS Prices Across States 2 PMS Prices Across
Automotive Gas Oil (Diesel) Price Watch (JANUARY 2018) Report Date: February 2018 Data Source: National Bureau of Statistics (NBS) Contents Executive Summary 1 PMS Prices Across States 2 PMS Prices Across
Design Criteria Data
 LAS VEGAS/MCCARRAN NV Latitude = 36.8 N WMO No. 72386 Longitude =115.1 W Elevation = 2179 feet Period of Record = 1973 to 1996 Average Pressure = 27.67 inches Hg Design Criteria Data Mean Coincident (Average)
Presented by Eric Englert Puget Sound Energy September 11, 2002
 Results from PSE s First Year of Time of Use Program Presented by Eric Englert Puget Sound Energy September 11, 2002 Puget Sound Energy Overview 973,489 Total Electric Customers 908,949 are AMR Capable
Design Criteria Data
 PHOENIX/SKY HARBOR AZ Latitude = 33.43 N WMO No. 72278 Longitude =112. W Elevation = 116 feet Period of Record = 1973 to 1996 Average Pressure = 28.72 inches Hg Design Criteria Data Mean Coincident (Average)
Design Criteria Data
 MADISON/DANE CO. RGNL WI Latitude = 43.13 N WMO No. 72641 Longitude = 89.33 W Elevation = 866 feet Period of Record = 1973 to 1996 Average Pressure = 29.5 inches Hg Design Criteria Data Mean Coincident
D G A G R I D A S H B O A R D : A P P L E S
 Sources: Eurostat, MSs notifications, DG Agri, Comext, Comtrade, GTA, ITC, AMI, Expert groups, Freshfel, Wapa. 000 tonnes 39 41 31 22 29 22 32 27 17 18 9 27 15 12 6 6 6 4 5 6 5 4 11 25 15 9 9 93 62 51
Global Threat Reduction Initiative Foreign Research Reactor Spent Nuclear Fuel Shipments
 FY1996 1. Sept. 22, 1996 280 assemblies in 8 casks to SRS [First East Coast Shipment] FY 1997 Sweden 64 Switzerland 42 Germany 125 Chile 28 Columbia 21 2. Dec. 15, 1996 41 spent fuel assemblies in one
2014 Meteorological and Oceanographic Summary for the Bocas del Toro Research Station. Prepared by: Steven Paton
 0 2014 Meteorological and Oceanographic Summary for the Bocas del Toro Research Station Prepared by: Steven Paton 1 Introduction This is the second of a series of yearly reports summarising the past year
7th Grade Social Studies Pacing Guide Units of Instruction MISD Pacing Guide Days Date Range Test Date
 7th Grade Social Studies MISD Pacing Guide Date Range Test Date Unit 01: Thinking Like a Historian (5 days for the entire unit) 5 Aug 27-31 Unit 02: Natural Texas and Its People 1200s-1800s (5 days for
Hospitality & Tourism Management January 2015 Calendar Sunday Monday Tuesday Wednesday Thursday Friday Saturday 1 2 3
 Jan-14 Week 1 Week 2 January 2015 Calendar 1 2 3 New Year's Day - 4 5 6 7 8 9 10 New Intake-L4 (EFTH) Assign-Presentation L4 Assign-Presentation L5 Last Exam Reg- CTH Assign Marking Assign Marking Module-
Docket No. DE Dated: 05/04/2015 Attachment CJG-1 Page 1
 Docket No. DE - Dated: 0/0/0 Attachment CJG- Page 8 9 Summary of Forecasted Energy Service 0 Cost For January 0 Through December 0 TOTAL COST Cents per KWH Reference Fossil energy costs $ 9,9 $. Attachment
increase of over four per cent compared to the average of $409,058 reported in January 2010.
 SINGLE FAMILY RESIDENTIAL BREAKDOWN uary 211 26.8 % 1.7 % 7.%.4%.1 % Good Start to 211 TORONTO - February 4, 211 Greater Toronto REALTORS reported 4,337 transactions through the TorontoMLS system in uary
Inventory Levels - All Prices. Inventory Levels - By Price Range
 Inventory Levels - All Prices Idaho Falls Bonneville Total 3-Mar-17 152 108 260 2-Mar-18 109 78 187-28% Inventory Levels - By Price Range 3-Mar-17 2-Mar-18 0-100,000 41 6 100,001-125,000 19 8 125,001-150,000
Sprinkler System Waiver Application Packet
 Sprinkler System Waiver Application Packet According to the City s municipal code, use of sprinklers is conditional upon use of a water budget and the City continues to discourage customers from irrigating
PET(S) FIRST & LAST NAME: January 2019
 FIRST & LAST NAME: January 2019") January 2019 1 2 3 4 5 New Year's Day 6 7 8 9 10 11 12 13 14 15 16 17 18 19 20 21 22 23 24 25 26 27 28 29 30 31 SPECIAL TE We will not have Doggie available during these dates: *3/29-4/7, 4/19-4/21, 5/24-5/27,
January 2019 1 2 3 4 5 New Year's Day 6 7 8 9 10 11 12 13 14 15 16 17 18 19 20 21 22 23 24 25 26 27 28 29 30 31 SPECIAL TE We will not have Doggie available during these dates: *3/29-4/7, 4/19-4/21, 5/24-5/27,
Meter Insights for Downtown Store
 Meter Insights for Downtown Store Commodity: Analysis Period: Prepared for: Report Date: Electricity 1 December 2013-31 December 2014 Arlington Mills 12 February 2015 Electricity use over the analysis
Grain LNG: A Collaborative Approach To LNG Terminal Business Performance Improvement
 Grain LNG: A Collaborative Approach To LNG Terminal Business Performance Improvement Nick Blair, Grain LNG, Commercial Operations Marco Fahl, Honeywell, Senior Consultant 2012 Business Optimization Conference
VC ACADEMIC CALENDAR. Sun Mon Tue Wed Thu Fri Sat. Sum 10 Wk. & Sum II Final Exams. Cancel Fall 16 wk. & Fall I Non-Pays
 August 2017 1 SLC Registration Fall 2017 2 3 4 5 Sum 10 Wk. & Sum II Final Exams Commencement (No Ceremony) 6 7 Grades Due Sum 10wk & Sum II 9:00 am 8 Final Fall CC 5:00 pm Pay Day 6:00 pm 9 10 11 Cancel
2017 Meteorological and Oceanographic Summary for the Bocas del Toro Research Station. Prepared by: Steven Paton
 0 2017 Meteorological and Oceanographic Summary for the Bocas del Toro Research Station Prepared by: Steven Paton 1 Introduction This is the 5 th of a series of yearly reports summarising the past year
SUBJECT: Russell Hill Subway Train Accident Of August 11, 1995 Due Diligence Checklist Update
 MEETING DATE: August 31, 2005 SUBJECT: Russell Hill Subway Train Accident Of August 11, 1995 Due Diligence Checklist Update RECOMMENDATION It is recommended that the Commission: i) Receive for information
November 2018 Customer Switching Report for the Electricity and Gas Retail Markets
 An Coimisiún um Rialáil Fóntas Commission for Regulation of Utilities November 2018 Customer Switching Report for the Electricity and Gas Retail Markets Information Paper Reference: CRU18266 Date Published:
FOR IMMEDIATE RELEASE
 Article No. 5842 Available on www.roymorgan.com Roy Morgan Unemployment Profile Thursday, 2 October 2014 Unemployment climbs to 9.9% in September as full-time work lowest since October 2011; 2.2 million
2016 Meteorological and Oceanographic Summary for the Bocas del Toro Research Station. Prepared by: Steven Paton
 0 2016 Meteorological and Oceanographic Summary for the Bocas del Toro Research Station Prepared by: Steven Paton 1 Introduction This is the forth of a series of yearly reports summarising the past year
MARKET NEWS for pig meat
 MARKET NEWS for pig meat Market analysis 4 July 2016 Week 27 MARKET SITUATION Europe: Trade in pork legs took place at slightly rising prices this week. Loins and collars as well as other cuts were traded
Commuter Rail Performance. October
 Commuter Rail Performance October 31 2016 1 Background - overall performance Year To Date: 89.67% YTD 125,629 trains North: 90.79% YTD 48,426 trains South: 89.07% YTD 77,203 trains 2 Background - overall
Making Electricity since December Melody Collis Facilities Engineering Assistant Manager Toyota Motor Manufacturing Canada
 Making Electricity since December 2015 Melody Collis Facilities Engineering Assistant Manager Toyota Motor Manufacturing Canada Cambridge 1 Company Culture Vision Woodstock TMMC's goal is to maintain a
Predict Future Failures From Your Maintenance Records
 Predict Future Failures From Your Maintenance Records Presented by: Paul Barringer, P.E. Barringer & Associates, Inc. Reliability, Engineering, and Manufacturing Consultants Humble, Texas 77347, USA Phone:
3. Atmospheric Supply of Nitrogen to the Baltic Sea in 2009
 3. Atmospheric Supply of Nitrogen to the Baltic Sea in 2009 Nitrogen emission data, as well as the model results presented here have been approved by the 35 th Session of the Steering Body of EMEP in Geneva
Digitized for FRASER Federal Reserve Bank of St. Louis. Per cent. P Total reported (000) ^D-)>oCL
 ^D-)>oCL") statistical FEDERAL release RESERVE ^D-)>oCL For immedia < t4 6 relea I s February 13, 1968 AUTOM3BILE LOANS BY MAJOR SALES FINANCE COMPANIES IN THE FOURTH QlJARTP^HE PROPORTION OF 3 YEAR NEW CAR CONTRACTS
statistical FEDERAL release RESERVE ^D-)>oCL For immedia < t4 6 relea I s February 13, 1968 AUTOM3BILE LOANS BY MAJOR SALES FINANCE COMPANIES IN THE FOURTH QlJARTP^HE PROPORTION OF 3 YEAR NEW CAR CONTRACTS
NEWS Release. U.S. Manufacturing Technology Orders. Year-to-date U.S. manufacturing technology orders up 4.1% over 2011
 U.S. Manufacturing Technology Orders A statistical program of AMT NEWS Release FOR RELEASE: October 8, 2012 Contact: Pat McGibbon, AMT, 703-827-5255 Year-to-date U.S. manufacturing technology orders up
Commuter Rail Update. October 25, 2018
 Commuter Rail Update October 25, 2018 2 page page 3 State of Commuter Rail Network, July 2014 The 2014 Commuter Rail network had multiple issues and a history of neglect & under-investment FIRST UP? UPGRADES
Inventory Levels - All Prices. Inventory Levels - By Price Range
 Inventory Levels - All Prices Idaho Falls Bonneville Total 3-Nov-17 198 128 326 2-Nov-18 155 134 289-11% Inventory Levels - By Price Range 3-Nov-17 2-Nov-18 0-100,000 17 11 100,001-125,000 15 9 125,001-150,000
September 2016 Water Production & Consumption Data
 September 2016 Water Production & Consumption Data September 2016 monthly water production (288.48 AF) was lowest in at least 17 years. Monthly water production has increased slightly each month since
7 Habits of Highly Effec3ve Product Development
 7 Habits of Highly Effec3ve Product Development September 5, 2014 ASTR 2014, Sep 10-12, St. Paul, MN 1 John Lenss John has over 18 years of experience in performing HALT. He has produced excellent results
Wacoal Corp. Total Sales
 Monthly Data(FY2018) Main Sales of Wacoal (Domestic) Store sales by channel Apr. May Jun. 1Q Jul. Aug. Sep. 1H Oct. Nov. Dec. Wholesale Business Department Stores 103 101 95 100 100 102 100 100 98 100
TRANSPACIFIC CUSTOMER ADVISORY Implementation of New BAF Formula Effective January 01, 2019
 December 7, 2018 TRANSPACIFIC CUSTOMER ADVISORY Implementation of New BAF Formula Effective January 01, 2019 Dear Valued Customer, Bunker is one of the important cost components for a container shipping
IOWA MOLD TOOLING CO., INC. BOX 189, GARNER, IA TEL: IMT PART NUMBER
 CRANE LOG CALENDAR YEAR CRANE MODEL Daily Inspections Weekly Inspections Monthly Inspections Lubrication Record Maintenance Record Damage & Repair Record Modification Record Reference Specifications CRANE
City of Biddeford Solid Waste Management Commission January 10, :00 PM Public Works
 City of Biddeford Solid Waste Management Commission January 10, 2017 7:00 PM Public Works 1. Call to Order 2. Approval of Minutes - December 13, 3. Discussion / Approval 3.1. Food Waste curbside collection
Automated Occupancy Detection October 2015 (Phase I) Demonstration Results Presented by Kathy McCune
 Demonstration Results Presented by Kathy McCune") Automated Occupancy Detection October 2015 (Phase I) Demonstration Results Presented by Kathy McCune 2016 TRB Managed Lanes Conference May 5th, Session 6 Presentation Background Outline Metro ExpressLanes
Automated Occupancy Detection October 2015 (Phase I) Demonstration Results Presented by Kathy McCune 2016 TRB Managed Lanes Conference May 5th, Session 6 Presentation Background Outline Metro ExpressLanes
January 2014 SUNDAY MONDAY TUESDAY WEDNESDAY THURSDAY FRIDAY SATURDAY
 January 2014 1 2 3 4 5 6 7 8 9 10 11 12 13 14 15 16 17 18 19 20 21 22 23 24 25 26 27 28 29 30 31 February 2014 1 2 3 4 5 6 7 8 9 10 11 12 13 14 15 Creating Reports with SQL Reporting Services in GP Bismarck
Hinkley Point C our approach to Health and Safety Iain Graham Head of Health & Safety
 Hinkley Point C our approach to Health and Safety Iain Graham Head of Health & Safety 1 Where are we? Hinkley Point 2 EDF Energy s Nuclear New Build Projects February 2018 EDF Energy plc. All rights Reserved
City Of London Environmental & Engineering Services Department Wastewater Treatment Operations
 City Of London Environmental & Engineering Services Department Wastewater Treatment Operations Greenway Wastewater Treatment Centre 2016 Annual Report February 2017 Page 1 of 96 SUMMARY This annual report
LAX Specific Plan Amendment Study. CONCEPT DEVELOPMENT Public Meeting Series #5 August 23 & 26, 2006
 LAX Specific Plan Amendment Study CONCEPT DEVELOPMENT Public Meeting Series #5 August 23 & 26, 2006 Agenda Background on public planning process Regional planning update LAWA progress on settlement commitments