Weight Reduction Finite Element Study of Selected Power Train Components for Heavy Duty Vehicles
|
|
|
- Derek Garrett
- 5 years ago
- Views:
Transcription
1 Phase II Progress Report No. F/MAE/NG/ Weight Reduction Finite Element Study of Selected Power Train Components for Heavy Duty Vehicles Submitted to FIERF and AISI By James Lowrie, Research Assistant Gracious Ngaile, Associate Professor North Carolina State University Department of Mechanical and Aerospace Engineering Advanced Metal Forming and Tribology Laboratory (AMTL) April 4, 2016 For Restricted Distribution Only (Approval must be requested from the AMTL authority prior to distribution to other organizations or individuals) i
2 FOREWORD This document has been prepared by the Advanced Metal Forming and Tribology Laboratory in the Department of Mechanical and Aerospace Engineering at North Carolina State University. The research focus of this Lab includes manufacturing process modeling and optimization, triboscience and tribotechnology, tool design, and computational tools. In addition to conducting industry relevant engineering research, the Lab has the objectives a) establish close cooperation between industry and the university, b) train students, and c) transfer the research results to interested companies. This report, entitled Weight Reduction Finite Element Study of Selected Power Train Components for Heavy Duty Vehicles, examines the potential for the reduction in the weight of several heavy duty truck components through the finite element method. The loading conditions on the parts are first established via a combination of surveys of individual parts and larger systems and mathematical analysis. The several lightweight designs of some selected components are then compared to the conventional part design to determine the potential weight savings that are possible if the lightweight techniques were adopted. For further information, contact Dr. Gracious Ngaile, located at North Carolina State University, Department of Mechanical & Aerospace Engineering, 911 Oval Drive 3160 Engineering Building III, BOX 7910, Raleigh, NC, , phone: , gracious_ngaile@ncsu.edu, webpage: ii
3 Table of Contents Chapter 1 Introduction, Motivation, and Objectives... 1 Chapter 2 Load Map and Free Body Diagrams Engine Load Map Gearbox Load Map Rear Axle Load Map Summary Chapter 3 Axle Shaft: Finite Element Study on Lightweight Shafts Introduction Solid Axle Shaft (Baseline) Hollow Axle Shaft Bimetallic Axle Shaft Conclusion Chapter 4 Input Shaft: Finite Element Study on Lightweight Shafts Introduction Solid Input Shaft (Baseline) Hollow Input Shaft Bimetallic Input Shaft Conclusion Chapter 5 Output Shaft: Finite Element Study on Lightweight Shafts Introduction Solid Output Shaft (Baseline) Hollow Output Shaft Bimetallic Output Shaft Conclusion iii
4 Chapter 6 Countershaft: Finite Element Study Light Weight Shafts Introduction Solid Countershaft (Baseline) Hollow Countershaft Bimetallic Countershaft Conclusions Chapter 7 Conclusions and Future Work References iv
5 Table of Figures Figure 2-1: Loads acting on a Typical Tractor Trailer Configuration... 3 Figure 2-2: Loads on the Chassis and Drive Train Assembly [2]... 4 Figure 2-3: Engine Load Map and Loading of Individual Engine Components... 7 Figure 2-4: In Cylinder Pressure as a Function of the Crank Angle... 7 Figure 2-5: Slider Crank Mechanism... 8 Figure 2-6: Gearbox Load Map and Loading of Individual Gearbox Components Figure 2-7: Rear Axle Load Map and Loading of Individual Gearbox Components Figure 3-1: Geometry and Loads on the Fully Floating Axle Shaft Figure 3-2: Geometry, Boundary Conditions, and Mesh used in the Baseline Simulations Figure 3-3: Stress [MPa] in the Solid Axle Shaft Figure 3-4: Cross Sectional View of the Stress Distribution in the Axle Shaft Figure 3-5: Stress Distribution in a Hollow Shaft with an Outer Diameter of 47.6 mm [1.875 in] and an Inner Diameter of 6.35 mm [0.25 in] Figure 3-6: Stress Distribution in a Hollow Shaft with an Outer Diameter of 47.6 mm [1.875] in and an Inner Diameter of [1.25 in] Figure 3-7: Stress Distribution in a Hollow Shaft with an Outer Diameter of 50.8 mm [2 in] and an Inner Diameter of 6.78 mm [0.267 in] Figure 3-8: Stress Distribution in a Hollow Shaft with an Outer Diameter of 50.8 mm [2 in] and an Inner Diameter of 33.8 mm [1.33 in] Figure 3-9: Maximum Stress in the Hollow Axle Shaft as a Function of Hole Aspect Ratio for Various Diameter Shafts Figure 3-10: Mass of the Hollow Axle Shaft as a Function of Hole Aspect Ratio for Various Diameter Shafts Figure 3-11: Stress Distribution in a Bimetallic Shaft with an Outer Diameter of 47.6 mm [1.875 in] and an Inner Diameter of 6.35 mm [0.25 in] Figure 3-12: Stress Distribution in a Bimetallic Shaft with an Outer Diameter of 47.6 mm [1.875 in] and an Inner Diameter of 31.75mm [1.25 in] Figure 3-13: Stress Distribution in a Bimetallic Shaft with an Outer Diameter of 50.8 mm [2 in] and an Inner Diameter of 6.78 mm [0.267 in] v
6 Figure 3-14: Stress Distribution in a Bimetallic Shaft with an Outer Diameter of 50.8 mm [2 in] and an Inner Diameter of 33.8 mm [1.33 in] Figure 3-15: Maximum Stress in the Bimetallic Axle Shaft as a Function of Hole Aspect Ratio for Various Diameter Shafts Figure 3-16: Mass of the Bimetallic Axle Shaft as a Function of Hole Aspect Ratio for Various Diameter Shafts Figure 4-1: Input Shaft in the Truck Gearbox Figure 4-2: Input Shaft Free Body Diagram Figure 4-3: Geometry, Boundary Conditions, and Mesh used in the Baseline Simulations Figure 4-4: Stress [MPa] in the Solid Input Shaft Figure 4-5: Cross Sectional View of the Stress Distribution in the Input Shaft Figure 4-6: Geometry, Boundary Conditions, and Mesh used in the Hollow Simulations Figure 4-7: Stress Distribution in a Hollow Shaft with an Outer Diameter of 38.1 mm [1.5 in] and an Inner Diameter of 6.35mm [0.25 in] Figure 4-8: Stress Distribution in a Hollow Shaft with an Outer Diameter of 38.1 mm [1.5 in] and an Inner Diameter of 18.3 mm [0.75 in] Figure 4-9: Stress Distribution in a Hollow Shaft with an Outer Diameter of 43.9 mm [1.73 in] and an Inner Diameter of 7.37 mm [0.29 in] Figure 4-10: Stress Distribution in a Hollow Shaft with an Outer Diameter of 43.9 mm [1.73 in] and an Inner Diameter of 22.1 mm [0.871 in] Figure 4-11: Maximum Stress in the Input Shaft as a Function of Hole Aspect Ratio for Various Diameter Shafts Figure 4-12: Mass of the Input Shaft as a Function of Hole Aspect Ratio for Various Diameter Shafts Figure 4-13: Geometry, Boundary Conditions, and Mesh used in the Bimetallic Simulations Figure 4-14: Stress Distribution in a Bimetallic Shaft with an Outer Diameter of 38.1 mm [1.5 in] and an Inner Diameter of 6.35mm [0.25 in] Figure 4-15: Stress Distribution in a Bimetallic Shaft with an Outer Diameter of 38.1 mm [1.5 in] and an Inner Diameter of 18.3 mm [0.75 in] Figure 4-16: Stress Distribution in a Bimetallic Shaft with an Outer Diameter of 43.9 mm [1.73 in] and an Inner Diameter of 7.37 mm [0.29 in] vi
7 Figure 4-17: Stress Distribution in a Bimetallic Shaft with an Outer Diameter of 43.9 mm [1.73 in] and an Inner Diameter of 22.1 mm [0.871 in] Figure 4-18: Maximum Stress in the Input Shaft as a Function of Hole Aspect Ratio for Various Diameter Shafts Figure 4-19: Mass of the Input Shaft as a Function of Hole Aspect Ratio for Various Diameter Shafts Figure 5-1: The output shaft in the truck engine Figure 5-2: Output shaft FBD Figure 5-3: Geometry, Boundary Conditions, and Mesh used in the Baseline Simulations of the Output Shaft Figure 5-4: Stress [MPa] in the Solid Output Shaft Figure 5-5: Geometry, Boundary Conditions, and Mesh used in the Simulations of the Hollow Output Shaft Figure 5-6: Stress Distribution in a Hollow Output Shaft with an Outer Diameter of 49.78mm [1.96 in] and an Inner Diameter of 6.35mm [0.25 in] Figure 5-7: Stress Distribution in a Hollow Output Shaft with an Outer Diameter of 49.78mm [1.96 in] and an Inner Diameter of 25.4mm [1 in] Figure 5-8: Stress Distribution in a Hollow Output Shaft with an Outer Diameter of 57.15mm [2.25 in] and an Inner Diameter of 7.14mm [0.281 in] Figure 5-9: Stress Distribution in a Hollow Output Shaft with an Outer Diameter of 57.15mm [2.25 in] and an Inner Diameter of 28.58mm [1.125 in] Figure 5-10: Maximum Stress in the Hollow Output Shaft as a Function of Hole Aspect Ratio for Various Diameter Shafts Figure 5-11: Mass of the Hollow Output Shaft as a Function of Hole Aspect Ratio for Various Diameter Shafts Figure 5-12: Geometry, Boundary Conditions, and Mesh used in the Simulations of the Bimetallic Output Shaft Figure 5-13: Stress Distribution in a Bimetallic Output Shaft with an Outer Diameter of 49.78mm [1.96 in] and an Inner Diameter of 6.35mm [0.25 in] Figure 5-14: Stress Distribution in a Bimetallic Output Shaft with an Outer Diameter of 49.78mm [1.96 in] and an Inner Diameter of 25.4mm [1 in] vii
8 Figure 5-15: Stress Distribution in a Bimetallic Output Shaft with an Outer Diameter of 57.15mm [2.25 in] and an Inner Diameter of 7.14mm [0.281 in] Figure 5-16: Stress Distribution in a Bimetallic Output Shaft with an Outer Diameter of 57.15mm [2.25 in] and an Inner Diameter of 28.58mm [1.125 in] Figure 5-17: Maximum Stress in the Bimetallic Output Shaft as a Function of Hole Aspect Ratio for Various Diameter Shafts Figure 5-18: Mass of the Bimetallic Output Shaft as a Function of Hole Aspect Ratio for Various Diameter Shafts Figure 6-1: Mack 10 Speed Maxitorque ES T310 Gearbox with Simplified Boundary Conditions used in Finite Element Analysis Figure 6-2: Geometry and Loading on the Countershaft Figure 6-3: (left) Countershaft with Gears, Spacers, and Key Simulated in the Baseline Finite Element Analysis (right) Boundary Conditions applied to the Countershaft Assembly Figure 6-4: Mesh used in the Finite Element Simulation of the Solid Countershaft Figure 6-5: Stress Distribution on the Solid Countershaft (baseline) Figure 6-6: Representative Mesh used in the Finite Element Study of the Hollow Countershaft 75 Figure 6-7: Stress Distribution in a Hollow Countershaft with and Outer Diameter of 44.1mm [1.735 in] and an internal Diameter of 6.35 mm [0.25 in] Figure 6-8: Stress Distribution in a Hollow Countershaft with and Outer Diameter of 44.1mm [1.735 in] and an internal Diameter of 25.4 mm [1 in] Figure 6-9: Stress Distribution in a Hollow Countershaft with and Outer Diameter of 50.8 mm [2 in] and an internal Diameter of 7.32 mm [0.288 in] Figure 6-10: Stress Distribution in a Hollow Countershaft with and Outer Diameter of 50.8 mm [2 in] and an internal Diameter of 29.3 mm [1.153 in] Figure 6-11: Maximum Stress in the Countershaft as a Function of the Wall Thickness to Outer Diameter Ratio Figure 6-12: Stress on Opposite Side of Keyway in the Hollow Countershaft as a Function of the Wall Thickness to Outer Diameter Ratio Figure 6-13: Mass of the Countershaft as Function of Wall Thickness to Outer Diameter Ratio80 Figure 6-14: Mesh used in the Finite Element Simulation of the Bimetallic Countershaft viii
9 Figure 6-15: Stress Distribution in a Bimetallic Countershaft with and Outer Diameter of 44.1mm [1.735 in] and an internal Diameter of 6.35 mm [0.25 in] Figure 6-16: Stress Distribution in a Bimetallic Countershaft with and Outer Diameter of 44.1mm [1.735 in] and an internal Diameter of 25.4 mm [1 in] Figure 6-17: Stress Distribution in a Bimetallic Countershaft with and Outer Diameter of 50.8 mm [2 in] and an internal Diameter of 7.32 mm [0.288 in] Figure 6-18: Stress Distribution in a Bimetallic Countershaft with and Outer Diameter of 50.8 mm [2 in] and an internal Diameter of 29.3 mm [1.153 in] Figure 6-19: Maximum Stress in the Bimetallic Countershaft as a Function of the Wall Thickness to Outer Diameter Ratio Figure 6-20: Stress on Opposite Side of Keyway in the Bimetallic Countershaft as a Function of the Wall Thickness to Outer Diameter Ratio Figure 6-21: Mass of the Bimetallic Countershaft as Function of Wall Thickness to Outer Diameter Ratio ix
10 Chapter 1 Introduction, Motivation, and Objectives The main focus of the project is to reduce the weight of the components which make up class 7 and 8 trucks using innovative forging techniques, improved heat treatment techniques, material substitution, and geometric changes. In order to determine which parts have the highest potential for weight savings and to determine the potential lightweight techniques which should be employed to achieve these weight reductions one must have a clear understanding of the geometry of and loading on various truck parts. Therefore this report is focused on the numerical modeling of several heavy duty truck components and the results of weight reduction studies carried out using these models. The study will focus on various shafts used to transmit torque in heavy duty trucks. Namely, the input and output shafts, the countershaft, and the fully floating axle shaft. In the future, the study will be extended to the other components, such as the connecting rod, crank shaft, and cam shaft. The loads on these shafts will be determined through a combination of surveys of similar parts and mathematical analysis of the load transfer from part to part. The numerical analysis will be carried out using the commercial finite element software ANSYS Workbench and will disregard dynamic loads and fatigue analysis in favor of static analysis of the maximum loading condition. The light weight techniques which will be examined include making the shafts hollow or using a bimetallic billet which utilizes as low density core. The main objectives of the study will be to i) create a load map of the truck which can be used to determine the loads on the various components for future simulation, ii) carry out a series of baseline simulations on the selected parts to determine the stress level in a conventional part, iii) perform a series of simulations on the selected parts which are modified to reduce their weight, and iv) determine the potential weight savings that can be achieved by innovative lightweight fabrication techniques. In order to accomplish these goals, the study is divided into two major parts. The first part is dedicated to understanding the distribution and magnitude of the loads on the major heavy duty truck systems and the components that make up these systems. In this part, the way that the loads are transferred though the power train of the truck are mapped out and free body diagrams of the individual components are created. The second part covers weight reduction finite element studies 1
11 of selected power train components. This part is divided into several chapters, each investigating individual power train parts. Chapter 3 covers the study of the axle shaft, chapter 4 covers the study of the gearbox input shaft, Chapter 5 covers the study of the gearbox output shaft, and Chapter 6 covers the study of the gearbox countershaft. Finally, the content of the report is summarized in a short conclusion chapter. 2
12 Chapter 2 Load Map and Free Body Diagrams The loading of each of the class 7 and 8 truck components is critical for the evaluation lightweight alternatives to the conventional parts. This will allow the performance of light weight designs to be compared to the conventional components. The loading conditions on each of the components can be determined by systematically determining the loads which are transferred from the larger assemblies to the smaller assemblies and finally to the individual parts. In this way, loads on individual engine components, gearbox parts, etc. can be determined from information about the loads on the truck itself. The load maps presented in this chapter are based on a five axle tractor trailer style truck with an engine capable of producing 2440 N m [1800 lb ft], a gearbox with 10 speeds and rated at 2400 N m [1800 lb ft], and a tandem rear axle rated at 3550 N m [2600 lb ft]. The loads acting on the reference truck are depicted in Figure 2-1 and a description of the loads is given in Table 2-1. There are numerous state and federal regulation concerning the dimensions and weight of heavy duty trucks operating on the highway, so in order to be consistent the weight limits of the truck will be picked according to the regulations of the state of North Carolina [1]. Figure 2-1: Loads acting on a Typical Tractor Trailer Configuration 3
![Table 2-1: Loads Acting on the Reference Vehicle Steering Axle Load Tandem Axle Load Trailer Axle Load Truck Weight Trailer Weight Drive Force Drag MAX 89,000 N [20,000 lbs] MAX 169,000 N [38,000](/docs-images/96/127562237/images/13-0.jpg "lbs] MAX 169,000 N [38,000 lbs] Variable, Gross Vehicle Weight = 356 kn [80,000lbs] Variable, Gross Vehicle Weight = 356 kn [80,000lbs] 38,000 15,000 N [3,370 8,540 lbs] Dependent of Velocity and")
13 Table 2-1: Loads Acting on the Reference Vehicle Steering Axle Load Tandem Axle Load Trailer Axle Load Truck Weight Trailer Weight Drive Force Drag MAX 89,000 N [20,000 lbs] MAX 169,000 N [38,000 lbs] MAX 169,000 N [38,000 lbs] Variable, Gross Vehicle Weight = 356 kn [80,000lbs] Variable, Gross Vehicle Weight = 356 kn [80,000lbs] 38,000 15,000 N [3,370 8,540 lbs] Dependent of Velocity and Wind Conditions The focus of this investigation is to reduce the weight of the components in the heavy duty truck, but this will not necessarily reduce the gross weight of the vehicle because as the weight of the truck increases the weight of the cargo will be increased to maximize profits, in accordance to state and federal weight regulations. Therefore, this study will mainly focus on components which contribute to the weight of the unloaded truck with a special focus on the parts which can be lightened using forging practices. By detaching the trailer and the cab to focus on these components, a simplified free body diagram is created as shown in Figure 2-2. Figure 2-2: Loads on the Chassis and Drive Train Assembly [2] 4
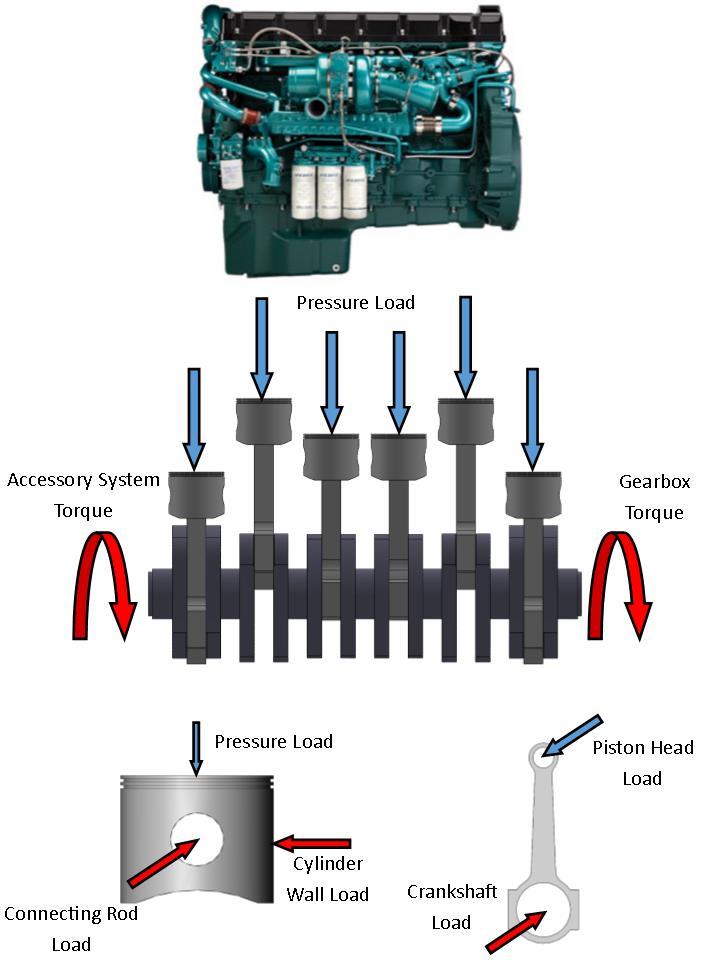
14 2.1 Engine Load Map The engine is a complicated system with a high number of parts moving rapidly and with precise timing. Based on a survey of major engine suppliers, the engines typically used in class 7 and 8 trucks are in an inline 6 configuration and have displacements of 11 to 16 L [670 to 980 in 3 ]. They can produce a maximum torque of anywhere from N m [ lb ft] and a maximum power output of between 240 and 450 kw [325 and 600 HP] [3]- [5]. The parts associated with power generation in the engine are the piston head, connecting rod, and the crankshaft. The piston head creates a moving seal on the cylinder walls and transfers the force of the expanding gasses from the combustion chamber to the connecting rod, which, in turn, transfers the load onto the eccentric lobes of the crankshaft creating a torque. The majority of the torque is then transferred to the gearbox, with the remaining torque being diverted to running the cam shafts or auxiliary systems (e.g. air conditioning). The load transfer between the various engine components is depicted in Figure 2-3 and information about the individual loads is given in Table 2-2. The pressure load on the piston head depends on several parameters including the types of fuel being used, compression ratio, type of aspiration, etc. and varies as a function of the angle of the crank shaft. Large diesel engines are typically in a 4 stroke configuration meaning that loading on the engine repeats itself every 720. A typical pressure vs. crank angle plot is shown in Figure 2-4 [6]. Each of the cylinders is offset by a certain number of degrees on the crank angle to establish the most even loading possible on the crankshaft, meaning that, in general, the pressures in the various cylinders are not equal. Because the system is reciprocating rapidly, there are dynamic loads which must be accounted for when determining the loads on the crank journals and piston pins. A simplified way of accounting for the dynamics of the system is to consider the engine to behave like a simple slider crank mechanism which is operated a constant angular velocity, as shown in Figure
15 6

16 Figure 2-3: Engine Load Map and Loading of Individual Engine Components Table 2-2: Summary of Forces Acting on the Major Engine Components Pressure Load Gearbox Torque Accessory System Torque Cylinder Wall Load Connecting Rod Load Piston Head Load Crankshaft Load Crankshaft Journal Loads MAX~15 MPa [2,175 psi] Function of Crank Angle 2440 N m [1800 ft lbf] Depends on Valve Actuating System + Other Loads from Engine Function of Crank Angle and Engine Dynamics Function of Crank Angle and Engine Dynamics Equal and opposite to Connecting Rod Load Function of Crank Angle and Engine Dynamics Equal and Opposite to Individual Crankshaft Loads Figure 2-4: In Cylinder Pressure as a Function of the Crank Angle 7
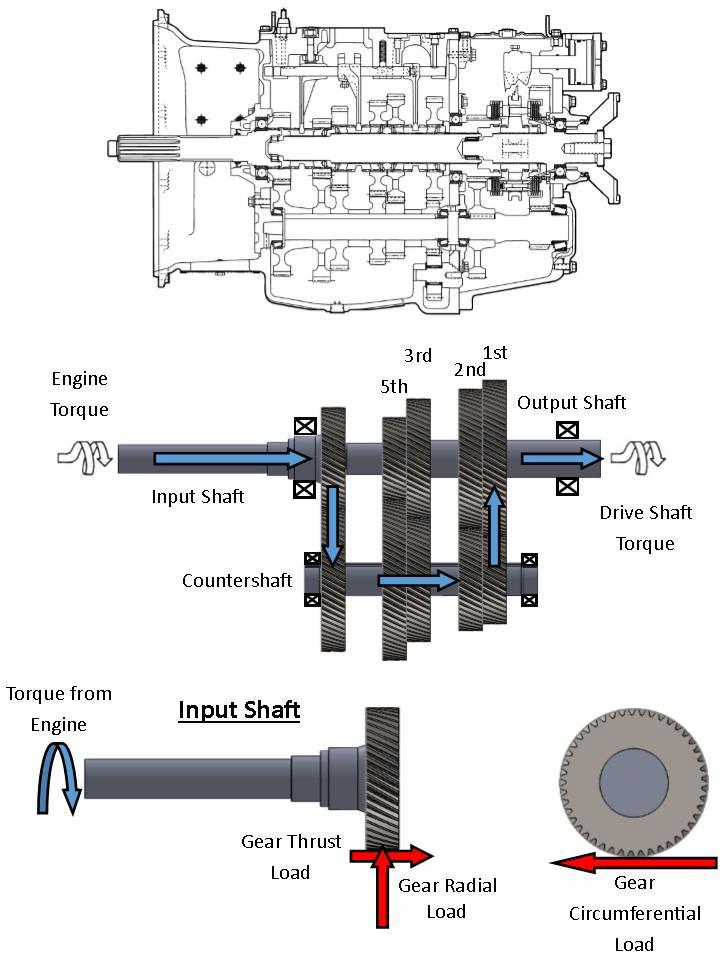
17 Figure 2-5: Slider Crank Mechanism 2.2 Gearbox Load Map The gearbox is an intricate system designed to transmit an appropriate torque to the drive shaft while keeping the engine speed in the optimal range. The gearboxes of modern day heavy duty trucks can have as many as 15 forward speeds and 3 reverse speeds. This large number of gear ratios is accomplished by combining 5 individual gear ratios with 3 range selectors. A simpler example of a gearbox with a range selection is shown in Figure 2-6 [7]. The gearbox depicted is a 10 speed Mack T310 gearbox [8]. The torque from the engine is transmitted to the input shaft through the splines and then transferred to the countershaft through the gear on the opposite side of the shaft. The counter shaft receives the torque from its input gear which rotates the shaft and all the gears on the shaft at the same speed, according to the gear ratio between the input gear and the input shaft. The output gears of the countershaft are always engaged with the corresponding gears on the output shaft, but only one gear transmits torque from the countershaft to the output shaft at a time. The gear which is engaged is selected by meshing a sliding clutch on the output shaft with the desired gear which forces the gear to rotate with the shaft, the rest of the gears on the output shaft are free to rotate at a different speed than the shaft. The output shaft will either be directly engaged with the drive shaft, or it will be engaged with another gear set with two to 3 speeds which allows the operator to select a gear range. In order to transfer torque from gear to gear the meshing teeth apply forces to each other. The magnitude of these forces is dependent on the diameter of the gear and the geometry of the teeth. Modern day gearboxes typically have helical gears, though some gearboxes still utilize spur gears, and most gears have a pressure angle of 20. Table 2-3 summarizes the forces which might be found on gears with the proportions shown in Figure 2-6. It should be noted that these loads are determined based on the assumption that there is only one countershaft in order to properly demonstrate the forces that are created from the meshing teeth. However, the real Mack T310 8
18 gearbox has 3 countershaft and many other gearboxes have 2 countershafts which allows them to reduce the loads on the gear teeth by 1 # of countershafts and eliminate the bending loads on the input and output shafts through proper balancing of the radial and circumferential loads. 9
19 10
![Figure 2-6: Gearbox Load Map and Loading of Individual Gearbox Components Table 2-3: Summary of Forces Acting on the Major Gearbox Components General Engine Torque 2,440 N m [1,800 ft lbf] Drive](/docs-images/96/127562237/images/20-0.jpg "Shaft Torque (6 th Gear) 6,520 N m [4,810 ft lbs] Input Shaft Gear Radial Load 18,200 N [4,090 lbs] Gear Circumferential Load 41,700 N [9,730 lbs] Gear Thrust Load 25,000 N [5,620 lbs] Countershaft")
20 Figure 2-6: Gearbox Load Map and Loading of Individual Gearbox Components Table 2-3: Summary of Forces Acting on the Major Gearbox Components General Engine Torque 2,440 N m [1,800 ft lbf] Drive Shaft Torque (6 th Gear) 6,520 N m [4,810 ft lbs] Input Shaft Gear Radial Load 18,200 N [4,090 lbs] Gear Circumferential Load 41,700 N [9,730 lbs] Gear Thrust Load 25,000 N [5,620 lbs] Countershaft 11
21 Input Gear Radial Load 18,200 N [4,090 lbs] Input Gear Circumferential Load 41,700 N [9,730 lbs] Input Gear Thrust Load 25,000 N [5,620 lbs] Output Gear Radial Load 41,400 N [9,300 lbs] Output Gear Circumferential Load 98,800 N [22,200 lbs] Output Gear Thrust Load 56,900N [12,800 lbs] Output Shaft Drive shaft Torque 6,520 N m [4,810 ft lbs] Gear Radial Load 9,320 N [6,870 lbs] Gear Circumferential Load 22,200 N [16,300 lbs] Gear Thrust Load 12,800 N [9,440 lbs] 2.3 Rear Axle Load Map The rear axles are the final step in the power train as they deliver the torque to the wheels which ultimately creates the driving force for the truck. The rear axle assembly consists of a differential assembly, a pair of axle housings, the axle shafts, and the various braking and mounting components. The differential assembly splits the load between the two sides of the axle and, in the case of both of the tandem axles being powered, between the front and rear tandem axles. It is also the source of another gear reduction. Figure 2-7 shows how the torque is transmitted from the drive shaft to the individual axles shafts and finally to the wheels themselves. Note that, the axle shafts depicted in this figure are full floating axles, which means that they only carry torque and that all of the bending loads are carried by the axle housing. Under cruising conditions, the torque would be divided evenly between the axle shafts (4 ways for a 6X4 configuration and 2 ways for a 6X2 configuration). Likewise the total load on the tandem axle will be divided evenly between the 4 halves of the tandem axle pair. A summary of the loads applied to the rear axle assembly is shown in Table 2-4. These numbers were arrived at by carrying out a survey of typical rear axles to determine the torque rating and gear ratios commonly used in modern day for the rear axle assemblies [9]. 12
22 Figure 2-7: Rear Axle Load Map and Loading of Individual Gearbox Components 13
23 Table 2-4: Summary of the Loads Acting on the Rear Axle Assembly Drive Shaft Torque Axle Shaft Torque Tire Torque Suspension Load Tire Load 3,550 N m [2,620 lb ft] 8630 to 21,900 N m [6,370 to 16,200 lb ft] Equal and Opposite to Axle Shaft Torque 42,300 N [9,500 lbs] 42,300 N [9,500 lbs] 2.4 Summary The loads on the truck are used to determine the loads on the major systems which make up the truck powertrain. The loads are determined through a combination surveys of engines, gearboxes, and rear axles and calculations based on gear ratios, geometry, and dynamic analysis. Using the loads mapped out in this chapter detailed finite element models of the components outlined in this report were created and employed in the study of lightweight designs of selected power train components. 14
24 Chapter 3 Axle Shaft: Finite Element Study on Lightweight Shafts 3.1 Introduction Using the loads determined in chapter 2, it is possible to create a finite element model of the axle shaft. This finite element model is first used to examine the distribution of stresses in the conventional, solid axle shaft. These stresses are then used as a baseline to define the required performance of a light weight design. Two methods for reducing the weight of the shaft are then investigated and evaluated in regards to the baseline study. Finally, the chapter is concluded with an outlook on the possible weight savings that could be achieved by adopting the lightweight techniques investigated. The axle shaft examined in this section is a fully floating axle shaft, meaning that it serves to transmit only torque to the wheels and does not help to support the weight of the truck in any way. The axle shaft consists of a splined side which mates with the differential and a flanged side which is attached to the wheels. The axle shaft receives torque from the differential in accordance to the gearing ratios of the gearbox and the differential and transmits it to the tires. Based on a quick survey of commercial axle shafts the torque rating for tandem axle shafts is 3550 N-m (2618 ftlbf) and rear axle ratios can get as high as 6.17:1. Assuming that the truck is in a 6X4 configuration (i.e. both the front and rear tandem axle are driven) and the torque is divided evenly between the axle shafts, the torque on each shaft can be determined by multiplying the torque by the axle ratio and then dividing by the number of axles (4). Using this method the toque on each shaft can be determined to be about 5476 N-m (4039 ft-lbf). Additionally, because the shaft is rotating there will be an additional inertial load on the shaft, though the effects of this load are expected to be small. Assuming that the truck s top speed is 105 km/h (65 mph) and the tire diameter is 1.15m (45.4 in) the rotational velocity of the shaft is 50.4 rad/s. These loads are summarized in Figure
25 Figure 3-1: Geometry and Loads on the Fully Floating Axle Shaft 3.2 Solid Axle Shaft (Baseline) The baseline simulations of the axle shaft serve to establish the nominal stresses in a conventional axle shaft under its maximum loading conditions. These stresses can then be compared to the stresses observed in later simulations which utilize lightweight concepts. This allows for the evaluations of individual light weight designs and provides some idea of the necessary performance of the light weight component. The geometry of the simulated axle shaft was taken from drawings of a full floating axle shaft and the diameter of the smallest cross-section of the shaft was 47.6 mm [1.875 in]. However, features like splines were ignored in order to simplify the simulation. It was meshed with tetrahedral elements and the mesh was refined in areas where stress concentration were expected (i.e. the radii) as shown in Figure 3-2. The material was approximated by ANSYS s structural steel model which has a Young s Modulus of 200 GPa [29,000 ksi] and a Poisson s ratio of 0.3. Only the material s elastic behaviors were simulated, as plastic deformation of the part would be considered failure. The torque load was applied as a moment boundary condition on the area of the shaft into which splines would be cut, and the shaft was held in place via fixed displacement boundary conditions in the holes to which the tires are mounted on the flange. A rotational velocity was applied to the entire shaft to simulate the inertial loads on the shaft. 16

26 Figure 3-2: Geometry, Boundary Conditions, and Mesh used in the Baseline Simulations After the completion of the simulation the stress contours were plotted as shown in Figure 3-3. The maximum stress fell into the MPa [ ksi] range and occurred in the thinnest section of the axle shaft. Due to stress concentrations caused by the changes in diameter on the shaft the stress was slightly higher around the transitions from the small diameter section of the shaft to the flange and the splines. It is interesting to note that the stresses in the shaft are concentrated on the outer diameter of the shaft and that the stress in the middle of the shaft is almost zero, as shown in Figure 3-4. Thus the material in the middle of the shaft increases the weight of the part without contributing significantly to its strength. The weight of the shaft could be significantly reduced by removing this parasitic material from the inside of the shaft or by replacing it with a lower density material. 17
![Figure 3-3: Stress [MPa] in the Solid Axle Shaft Figure 3-4: Cross Sectional View of the Stress Distribution in the Axle Shaft 3.](/docs-images/96/127562237/images/27-0.jpg "3 Hollow Axle Shaft The following simulations demonstrate how the performance of the shaft can be maintained while significantly reducing the weight of the part by removing the")

27 Figure 3-3: Stress [MPa] in the Solid Axle Shaft Figure 3-4: Cross Sectional View of the Stress Distribution in the Axle Shaft 3.3 Hollow Axle Shaft The following simulations demonstrate how the performance of the shaft can be maintained while significantly reducing the weight of the part by removing the parasitic material from the center of the shaft. For the purposes of these simulations, the shaft was hollowed by removing a cylindrical section of material from the center of the axle shaft. In practice this would be difficult to fabricate as a single part, as it would require the forged blank to be have a hole drill through its entire length (about 1.2 m [4 ft]) which would be time consuming and difficult. Another way to 18

28 fabricate this shaft would be to start with a thick tube and weld a flange onto its end although this too would come at the cost of additional required equipment manufacturing steps. Perhaps the most attractive way to fabricate this shaft would be to come up with an innovative way to forge a flange onto a tubular blank, eliminating the need for time consuming joining and machining steps. The first simulation which was carried out had the same outside dimensions as the baseline axle shaft, but had a 6.35 mm [0.25 in] hole through the center of the part. The stress distribution in this part is given in Figure 3-5. The change in the maximum stress in the part is nearly unnoticeable with the maximum stress again falling into the 480 to 420 MPa [69.6 to 60.9 ksi] range. However, there was also not a significant weight savings from the removal of this small amount of material (the weight of the part was only reduced by 0.18 kg [0.4 lbs]). Clearly more material must be removed to see significant weight savings. Figure 3-5: Stress Distribution in a Hollow Shaft with an Outer Diameter of 47.6 mm [1.875 in] and an Inner Diameter of 6.35 mm [0.25 in] The effects of removing a significant amount of material were investigated in the next simulation. Once again the outside geometry of the shaft was kept the same as the baseline 19
29 simulation, but this time a mm [1.25 in] diameter cylinder of material was removed from the center of the shaft. This resulted in a weight savings of 4.4 kg [9.7 lbs], but came at the cost of increasing the stress in the shaft to nearly 580 MPa [84.1 ksi]. This rise in stress will have to be mitigated by either changing materials to one which is stronger, or by increasing the diameter of the shaft. Fortunately, the stress in the shaft is proportional to 1 r3 while the weight in the shaft is only proportional to r 2, meaning that the stress in the shaft will decrease faster than the weight will rise as a result of the added material. As can be seen from the distribution of the stresses in the shaft (Figure 3-6), there is very little parasitic material in this axle shaft. The material in the center of the shaft is carrying a stress of about 360 MPa [52.5 ksi] which is nearly 2/3 of the maximum load in the shaft. Figure 3-6: Stress Distribution in a Hollow Shaft with an Outer Diameter of 47.6 mm [1.875] in and an Inner Diameter of [1.25 in] The next simulations show how the stresses in the shaft change as a result of a slight increase in the diameter of the shaft. The aspect ratio between the inner and outer diameter were kept the same as in the previous simulations, but the diameter was increased to 50.8 mm [2 in] (an increase 20
![of 3.175 mm [0.125 in]). The stress distribution in the thick and thin walled shafts is given in Figure 3-7 and Figure 3-8.](/docs-images/96/127562237/images/30-0.jpg "The increase in the diameter resulted in a decrease in the stress of about 17% in both cases and resulted in a weight increase of a little less than 10%.")
30 of mm [0.125 in]). The stress distribution in the thick and thin walled shafts is given in Figure 3-7 and Figure 3-8. The increase in the diameter resulted in a decrease in the stress of about 17% in both cases and resulted in a weight increase of a little less than 10%. Clearly this strategy of increasing the diameter of the shaft to compensate for the increasing stress that results from removing parasitic material can provide a significant weight savings, but in order to fully determine its potential a larger sample of the design space must be analyzed. Figure 3-7: Stress Distribution in a Hollow Shaft with an Outer Diameter of 50.8 mm [2 in] and an Inner Diameter of 6.78 mm [0.267 in] 21
![Figure 3-8: Stress Distribution in a Hollow Shaft with an Outer Diameter of 50.8 mm [2 in] and an Inner Diameter of 33.8 mm [1.](/docs-images/96/127562237/images/31-0.jpg "33 in] To determine the potential weight savings of a hollow shaft a parametric study was run which examined the effects of varying the outer diameter and wall thickness to outer diameter ratio of")
31 Figure 3-8: Stress Distribution in a Hollow Shaft with an Outer Diameter of 50.8 mm [2 in] and an Inner Diameter of 33.8 mm [1.33 in] To determine the potential weight savings of a hollow shaft a parametric study was run which examined the effects of varying the outer diameter and wall thickness to outer diameter ratio of the axle shaft on the maximum stress in the shaft and the weight of the shaft. Figure 3-9 demonstrates how the stress in the shaft changes with respect to the stress in the baseline study as the wall thickness ratio and shaft diameter change. The point where the stress curves for the various diameters are equal to the baseline stress represents the wall thickness ratio that will create a shaft with equal performance to the conventional, solid shaft for the shaft diameter corresponding to the particular curve. These wall thickness ratios can then be used in conjunction with Figure 3-10 to determine the weight savings of each of the equal performance designs. The stress in the shaft is clearly not sensitive to small holes in the shaft, but as the hole increases in diameter it removes material that is responsible for carrying an ever increasing amount of the load, resulting in rapidly rising stresses as the wall thickness ratio approaches zero. Additionally, increases in the outer diameter of the shaft serve only to shift the stress curve down, without significantly affecting the shape of the curve. The weight of the equally performing shaft tends to decrease as the outer diameter of the shaft is allowed to increase, so the designer will have to weigh 22
32 Mass [kg] Stress [MPa] the cost of reduced weight against the drawback of a less compact shaft. Based on the study performed, the weight of the axle shaft could be reduced by 25-35% by switching to a hollow shaft, depending on the outer diameter of the replacement shaft. This is a shavings of 5.6 to 7.3 kg [12.3 to 16.1 lbs] per shaft for a total savings of 22.5 to 29.4 kg [49.6 to 64.8 lbs] on the entire vehicle in [47.6 mm] 2 in [50.8 mm] 2.25 in [57.15] Baseline Stress [MPa] Wall Thickness/Diameter Figure 3-9: Maximum Stress in the Hollow Axle Shaft as a Function of Hole Aspect Ratio for Various Diameter Shafts in [47.6 mm] 2 in [50.8 mm] 2.25 in [57.15] Baseline Mass [kg] Wall Thickness/Diameter Figure 3-10: Mass of the Hollow Axle Shaft as a Function of Hole Aspect Ratio for Various Diameter Shafts 23
33 3.4 Bimetallic Axle Shaft The next weight-reduction technique to be investigated is the bimetallic axle shaft. These simulations used the same geometry as the hollow axle shaft simulations above, except the hollow region has been filled with a lighter material, in this case Aluminum, while the outer material remains steel. The aluminum was assumed to have a Young s Modulus of 71 GPa [10,300 ksi] and a Poisson s ratio of 0.33, while the steel had a Young s Modulus of 200 GPa [29,000 ksi] and a Poisson s ratio of 0.3. These simulations were carried out in the same manner as the hollow shaft simulations discussed in section 3.3. Figure 3-11 shows the stress distribution for the bimetallic shaft with an outer diameter of 47.6 mm [1.875 in] and an inner diameter of 6.35 mm [0.25 in]. The maximum stress in this simulation is in the MPa [69.6 to 60.9 ksi] range, similar to the stress in the hollow shaft with these dimensions. Figure 3-12 shows the results for the simulation for the bimetallic shaft with an outer diameter of 47.6 mm [1.875 in] and an inner diameter of mm [1.25 in]. The maximum stress in this simulation is in the MPa [78.3 to 69.6 ksi] range, higher than the previous simulation, but lower than the hollow simulation with these dimensions. The results of the simulation for the shaft with an outer diameter of 50.8 mm [2 in] and an inner diameter of 6.78 mm [0.267 in] is shown in Figure The maximum stress in this simulation is in the MPa [60.9 to 52.2 ksi] range, an improvement upon the previous simulation and, again, less than the hollow simulations with the same dimensions. Finally, Figure 3-14 shows the results of the shaft with an outer diameter of 50.8 mm [2 in] and an inner diameter of 33.8 mm [1.33 in]. The maximum stress in this simulation is also in the MPa [69.6 to 60.9 ksi] range. 24

34 Figure 3-11: Stress Distribution in a Bimetallic Shaft with an Outer Diameter of 47.6 mm [1.875 in] and an Inner Diameter of 6.35 mm [0.25 in] 25

35 Figure 3-12: Stress Distribution in a Bimetallic Shaft with an Outer Diameter of 47.6 mm [1.875 in] and an Inner Diameter of 31.75mm [1.25 in] 26

36 Figure 3-13: Stress Distribution in a Bimetallic Shaft with an Outer Diameter of 50.8 mm [2 in] and an Inner Diameter of 6.78 mm [0.267 in] 27
37 Figure 3-14: Stress Distribution in a Bimetallic Shaft with an Outer Diameter of 50.8 mm [2 in] and an Inner Diameter of 33.8 mm [1.33 in] Another parametric study was performed on the bimetallic axle shafts in a similar manner as the study performed on the hollow shafts. Figure 3-15 below shows the maximum stress in the bimetallic axle shaft as a function of the aspect ratio of the hole (wall thickness to diameter) for three different outer diameter shafts. It can be seen that for each aspect ratio, the larger outer diameter has a lower maximum stress. It can also be seen that for each outer diameter, the stress decreases as the hole aspect ratio increases (wall thickness increases). Figure 3-16 shows the mass of the bimetallic axle shaft as a function of the hole aspect ratio. At each aspect ratio, it can be seen that the shaft with the larger outer diameter will have the highest mass. For each outer diameter, as the aspect ratio increases, the mass will also increase. By using Figure 3-15 one can determine what the internal dimensions of the shaft are that will create a shaft that performs equally 28
38 Mass [kg] Stress [MPa] with a solid steel shaft, for a given outer diameter. This information can be used in conjunction with Figure 3-16 to determine the potential weight savings that can be achieved by switching from a solid steel axle shaft to a slightly larger bimetallic axle shaft. In this case it appears that the weight of the axle shaft can be reduced by 4 to 4.8 kg [8.8 to lbs], for a total vehicle shavings of 16 to 19.2 kg [35.2 to 42.2 lbs] in [47.6 mm] 2 in [50.8 mm] 2.25 in [57.15] Baseline Stress [MPa] Wall Thickness/ Diameter Figure 3-15: Maximum Stress in the Bimetallic Axle Shaft as a Function of Hole Aspect Ratio for Various Diameter Shafts in [47.6 mm] 2 in [50.8 mm] 2.25 in [57.15] Baseline Mass [kg] Wall Thickness/ Diameter Figure 3-16: Mass of the Bimetallic Axle Shaft as a Function of Hole Aspect Ratio for Various Diameter Shafts 29
39 3.5 Conclusion The total weight of the four axle shafts used in tandem rear axles is 86kg [189 lbs], meaning there is a possibility for significant weight savings in the heavy duty axle shafts. Because the weight of the vehicle is supported by the axle housing in the fully floating axle design the only load on the axle shaft is the torsional load. This means that the stress is concentrated on the outside surface of the part, leading to a high amount of material that carries almost no load. The removal of this parasitic material has the potential to remove 22.5 to 29.4 kg [49.6 to 64.8 lbs] of unnecessary weight from the vehicle, depending on the degree to which the diameter of the shaft is allowed to expand. Making the axle shaft out of a bimetallic billet also has the potential to reduce the weight of the vehicle by 16 to 19.2 kg [35.2 to 42.2 lbs], depending on the acceptable level of diameter increase for the shaft. Clearly the hollow shaft would be the ideal choice, but the decision on what modifications to make to the axle shaft cannot be made until the methods (and costs) of manufacturing these shaft variants have been determined. 30
40 Chapter 4 Input Shaft: Finite Element Study on Lightweight Shafts 4.1 Introduction The loads on the gearbox input shaft determined in chapter 2 are used as the starting point for the finite element study of the shaft. However, because the gearbox transmission system investigated has a triple countershaft configuration the bending loads can be ignored on the input shaft, as explained in section 2.2. The finite element model will first be employed to study the stress distribution in the conventional, solid shaft. This stress distribution will then be used as a baseline for which the performance of lightweight input shafts can be compared. Two lightweight techniques will be investigated, hollow shaft geometry and a bimetallic shaft configuration in which the center of the shaft is composed of a low density material. The chapter will be concluded with some remarks about the potential weight savings brought about by these lightweight designs and a summary of the study itself. The input shaft takes the torque from the engine and sends it to the gearbox. The engine torque is transferred to the input shaft via the splines on the small diameter side of the shaft. The torques is then given to the counter shaft(s) in the gearbox via a gear which is either mounted on to the large end of the shaft or machined into a flange created during the forging of the shaft. Additionally, there is an inertial load on the shaft created by the rotational velocity of the shaft, which is equal to the rotational speed of the engine. The shaft is supported by a tapered roller bearing where it meets the gearbox casing. In order to model the input shaft these loads and supports were transferred to a finite element model of the shaft operating under its maximum loading condition (i.e. maximum torque rating for the gearbox). The geometry used in the finite element model is shown in Figure 4-3 along with the boundary conditions applied to the model. The torque from the engine was simulated as a moment about the splined area of the shaft and the reaction from the counter shaft(s) is simulated by a displacement boundary condition that prevents the shaft from rotating, but leaves it free to move radially and axially. The rigid body motion on the shaft is prevented by applying a 31


41 frictionless support to the areas of the shaft in contact with the bearing. A rotational velocity was applied to the entire shaft to simulate the centripetal forces on the shaft. Figure 4-1: Input Shaft in the Truck Gearbox Figure 4-2: Input Shaft Free Body Diagram 32

42 4.2 Solid Input Shaft (Baseline) In order, to gain an understanding of the maximum stresses present in the conventional part, a finite element simulation will be run on the solid steel input shaft. This simulation result will be used as a baseline to evaluate the performance of the lightweight input shafts simulated later in this chapter. The geometry was approximated from a picture of a gearbox (Figure 4-1 above) and was modeled (splines were omitted for simplification), meshed with tetrahedral elements, and was refined in areas with an expected high stress concentration. Figure 4-3 shows the mesh that was applied to the geometry and the area where the mesh was refined. The material used in the simulation was ANSYS s structural steel which has a Young s Modulus of 200 GPa [29,000 ksi] and a Poisson s ratio of 0.3. A moment of 2,440.5 N m [1800 lb ft] was applied to the section of the shaft where the splines would be located, a frictionless support was added to the section where the bearing is located, and a fixed rotation of rad/s was applied to the shaft to simulate the centripetal forces on the part. The rotational displacement of the shaft was fixed on the gearbox side of the shaft to simulate the counter torque from the gear on the end of the shaft. Figure 4-3: Geometry, Boundary Conditions, and Mesh used in the Baseline Simulations 33
![Figure 4-4 and Figure 4-5 below show the results of the simulation of the baseline input shaft. The maximum stress from the simulation is 645 MPa [93.5 ksi].](/docs-images/96/127562237/images/43-0.jpg "This stress concentration occurs at the radius of the flange due to the diameter change.")
43 Figure 4-4 and Figure 4-5 below show the results of the simulation of the baseline input shaft. The maximum stress from the simulation is 645 MPa [93.5 ksi]. This stress concentration occurs at the radius of the flange due to the diameter change. Most of the stress on the shaft is concentrated along the outer diameter, with very little stress being located in the center, implying that material in the shaft s center increases the weight of the shaft without adding significant strength to the part. The weight of the input shaft could be reduced by applying weight reduction techniques such as hollowing out the center, or filling the center with a lighter metal material. Figure 4-4: Stress [MPa] in the Solid Input Shaft 34

44 Figure 4-5: Cross Sectional View of the Stress Distribution in the Input Shaft 4.3 Hollow Input Shaft The following simulations aim to reduce the weight of the input shaft, while still maintaining performance by simply removing the dead weight from the center of the shaft. The input shaft was modeled in the same way as the baseline simulation, except now a cylindrical section was removed from the center. The geometry and the mesh of the hollow shaft are shown in Figure 4-6. Figure 4-6: Geometry, Boundary Conditions, and Mesh used in the Hollow Simulations 35
![Figure 4-7 shows the results for the hollow shaft with an outer diameter of 38.1 mm [1.5 in] and an inner diameter of 6.35mm [0.25 in]. The maximum stress for this hollow shaft is 645 MPa [93.](/docs-images/96/127562237/images/45-0.jpg "5 ksi], identical to the stress in the baseline shaft. The results for the hollow shaft with an outer diameter of 38.1 mm [1.5 in] and an inner diameter of 18.3 mm [0.75 in] is shown in Figure 4-8.")
45 Figure 4-7 shows the results for the hollow shaft with an outer diameter of 38.1 mm [1.5 in] and an inner diameter of 6.35mm [0.25 in]. The maximum stress for this hollow shaft is 645 MPa [93.5 ksi], identical to the stress in the baseline shaft. The results for the hollow shaft with an outer diameter of 38.1 mm [1.5 in] and an inner diameter of 18.3 mm [0.75 in] is shown in Figure 4-8. The maximum stress in this simulation is 674 MPa [97.8 ksi] which is higher than the baseline stress but still in the same MPa [ ksi] range. Figure 4-9 shows the simulation results for the hollow shaft with an outer diameter of 43.9 mm [1.73 in] and an inner diameter of 7.37 mm [0.29 in]. The maximum stress in this simulation is 421 MPa [61.1 ksi], which is much lower than the stress in the baseline shaft. Finally, Figure 4-10 shows the results of the simulation for the input shaft with an outer diameter of 43.9 mm [1.73 in] and an inner diameter of 22.1 mm [0.871 in]. The maximum stress in this simulation is 441 MPa [64.0 ksi], also lower than the baseline, but slightly higher than the previous simulation. Figure 4-7: Stress Distribution in a Hollow Shaft with an Outer Diameter of 38.1 mm [1.5 in] and an Inner Diameter of 6.35mm [0.25 in] 36
46 Figure 4-8: Stress Distribution in a Hollow Shaft with an Outer Diameter of 38.1 mm [1.5 in] and an Inner Diameter of 18.3 mm [0.75 in] 37
47 Figure 4-9: Stress Distribution in a Hollow Shaft with an Outer Diameter of 43.9 mm [1.73 in] and an Inner Diameter of 7.37 mm [0.29 in] 38
48 Figure 4-10: Stress Distribution in a Hollow Shaft with an Outer Diameter of 43.9 mm [1.73 in] and an Inner Diameter of 22.1 mm [0.871 in] A parametric study was run to determine the potential weight savings of a hollow input shaft. The study varied the outer diameter and wall thickness of the shaft to see how the stress and weight were affected. Figure 4-11 shows the maximum stress in the hollow input shaft as a function of the aspect ratio of the hole, (wall thickness to outer diameter) for three different values of the shaft s outer diameter. It can be seen that at any given aspect ratio, the smaller outer diameter shafts experience a higher maximum stress, while the larger outer diameter shafts experience a lower maximum stress. It can also be seen that for each outer diameter, the maximum stress experienced decreases 39
49 exponentially as the wall thickness to outer diameter ratio increases (as the inner diameter hole becomes smaller). Figure 4-12 shows the mass of the input shaft as a function of that same aspect ratio. It can be seen that the larger outer diameter shafts have more mass than the smaller outer diameter shafts at any given aspect ratio. It is also shown that for each outer diameter, as the aspect ratio increases (the hole gets smaller), the mass also increases. By using both graphs together the potential weight savings for the hollow input shaft can be determined. First the dimensions of the hollow shaft with equal performance to the solid steel shaft must be determined, and then the weight of this geometry must be determined. Based on these results, a potential weight savings of 1.75 kg (3.85 lbs) or more can be achieved, which is a savings of 48%. 40
50 Mass [kg] Stress [MPa] OD 1.5 in [38.1 mm] OD 1.73 in [ mm] OD 1.96 in [ mm] Baseline Stress [MPa] Wall Thickness/Diameter Figure 4-11: Maximum Stress in the Input Shaft as a Function of Hole Aspect Ratio for Various Diameter Shafts OD 1.5 in [38.1 mm] OD 1.73 in [ mm] OD 1.96 in [ mm] Baseline Mass [kg] Wall Thickness/Diameter Figure 4-12: Mass of the Input Shaft as a Function of Hole Aspect Ratio for Various Diameter Shafts 41

51 4.4 Bimetallic Input Shaft For the bimetallic simulations, the two materials used were steel for the outer shaft material and aluminum for the inner shaft material. The same steel used for the baseline and hollow simulation was used here. The aluminum material had a Young s Modulus of 71 GPa [10,300 ksi] and a Poisson s ratio of These shafts were modeled in the same way as the hollow shafts, but instead of leaving the cylindrical section in the center empty, it was filled in with the aluminum material, while the outer geometry of the shaft had the steel properties applied. The geometry and the mesh can be seen in Figure 4-13 below. Figure 4-13: Geometry, Boundary Conditions, and Mesh used in the Bimetallic Simulations Figure 4-14 shows the stress distribution for the bimetallic shaft with an outer diameter of 38.1 mm [1.5 in] and an inner diameter of 6.35mm [0.25 in]. The maximum stress in this simulation is 42
52 645 MPa [93.5 ksi], similar results to the hollow shaft with the same dimensions. Figure 4-15 shows the results for the simulation for the bimetallic shaft with an outer diameter of 38.1 mm [1.5 in] and an inner diameter of 18.3 mm [0.75 in]. The maximum stress in this simulation is 663 MPa [96.2 ksi], which is lower than the stress in the hollow shaft with the same dimensions. The results of the simulation for the shaft with an outer diameter of 43.9 mm [1.73 in] and an inner diameter of 7.37 mm [0.29 in] is shown in Figure The maximum stress in this simulation is 418 MPa [60.6 ksi], which is only 2 MPa lower than the stress in the hollow shaft with these dimensions. Finally, Figure 4-17 shows the results of the shaft with an outer diameter of 43.9 mm [1.73 in] and an inner diameter of 22.1 mm [0.871 in]. The maximum stress in this simulation is 433 MPa [62.8 ksi], also slightly lower (8 MPa) than the hollow shaft with these dimensions. Based on the results of these simulations it is possible to replace a substantial amount of steel in the input shaft with aluminum and significantly reduce the weight of the bimetallic shaft. 43
53 Figure 4-14: Stress Distribution in a Bimetallic Shaft with an Outer Diameter of 38.1 mm [1.5 in] and an Inner Diameter of 6.35mm [0.25 in] 44
54 Figure 4-15: Stress Distribution in a Bimetallic Shaft with an Outer Diameter of 38.1 mm [1.5 in] and an Inner Diameter of 18.3 mm [0.75 in] 45

55 Figure 4-16: Stress Distribution in a Bimetallic Shaft with an Outer Diameter of 43.9 mm [1.73 in] and an Inner Diameter of 7.37 mm [0.29 in] 46
56 Figure 4-17: Stress Distribution in a Bimetallic Shaft with an Outer Diameter of 43.9 mm [1.73 in] and an Inner Diameter of 22.1 mm [0.871 in] 47
57 Mass [kg] Stress [MPa] OD 1.5 in [38.1 mm] OD 1.73 in [ mm] OD 1.96 in [ mm] Baseline Stress [MPa] Wall Thickness/Diameter Figure 4-18: Maximum Stress in the Input Shaft as a Function of Hole Aspect Ratio for Various Diameter Shafts Wall Thickness/Diameter OD 1.5 in [38.1 mm] OD 1.73 in [ mm] OD 1.96 in [ mm] Baseline Mass [kg] Figure 4-19: Mass of the Input Shaft as a Function of Hole Aspect Ratio for Various Diameter Shafts 48
58 Another parametric study was performed on the bimetallic shafts, investigating the same parameters as the study done on the hollow shafts. Figure 4-18 shows the maximum stress in the bimetallic input shaft as a function of the aspect ratio of the hole for the three different outer diameter shafts. It can be seen that for each aspect ratio, the smaller outer diameter shafts experience a higher maximum stress, while the larger outer diameter shafts experience a lower maximum stress, similar to the results of the hollow shafts. It can also be seen that for each outer diameter, the maximum stress experienced decreases exponentially as the wall thickness to outer diameter ratio increases, also similar to the hollow shaft results. Figure 4-19 shows the mass of the input shaft as a function of the hole aspect ratio. It can be seen that the larger outer diameter shafts have more mass than the smaller outer diameter shafts at any given aspect ratio and that for each outer diameter, as the aspect ratio increases, the mass also increases. These results follow the same trends observed in the parametric study done on the hollow shafts. Based on the amount of weight which can be saved by switching from the solid steel shafts to the bimetallic shafts is about 0.9 kg [2 lbs] or 25%. 4.5 Conclusion The mass of a single input shaft is small (only about 3.7 kg or 8.14 lbs), so the total weight which can be saved by switching to a light weight design is also small. However, the reduction in the shaft s weight is an important part of a larger total weight reduction which can be achieved when considering all of the small savings in the gearbox. The finite element studies carried out revealed that the weight of the shaft could be reduced by 1.75 kg [3.85 lbs] if hollow geometry was employed and 0.9 kg [2 lbs] if the bimetallic variant of the shaft was used. These savings would require the diameter of the shaft to be increased by a mere 15%. Greater savings could be expected for shafts with larger outer diameters. The small weight savings achievable on the input shaft must be weighed against the cost of updating the manufacturing process to create the light weight components. 49
59 Chapter 5 Output Shaft: Finite Element Study on Lightweight Shafts 5.1 Introduction Finite element studies are carried out on the gearbox output shaft based on the loading conditions determined in chapter 2. The first simulation to be carried out is a study of the stress distribution in the conventional, solid, shaft. Hollow geometry was then investigated as a possible means of lowering the weight of the shaft, followed by an investigation of a bimetallic construction of the output shaft. The performance of these two light weight designs was measured against the performance of the conventional shaft and conclusions were drawn about the possible weight savings that could be achieved by adopting one of two lightweight designs. The output shaft takes the torque from the counter shafts and sends it to the output axles. The output shaft in the gearbox is shown in Figure 5-1. And the free body diagram of the shaft is shown in Figure 5-2. The engine torque is transferred to the input shaft, and then given to the countershafts. The countershafts transfer the torque to the output shafts through the gears that are mounted on the countershafts and meshed to the output gears on the output shaft. There are three sliding clutches on the output shaft which are able to slide on the shaft along axial direction but are forced to rotate with the output shaft. The sliding clutch is shifted to engage with the desired output gear causing the shaft to rotate at the same speed as the gear. Each of the sliding clutches has a neutral position, in which it is not engaged with any gear, and two positions that engage it with a particular gear, resulting in 5 forward speeds and one reverse speed. The maximum torque that can be applied to the output shaft is achieved when the engine is applying the maximum rated torque to the input shaft and the first gear is engaged with the sliding clutch. In order to simulate the maximum torsion loading condition on the output shaft, a moment load will be applied to the area where the sliding clutch would be when it is engaged with the first gear. The shaft is supported by roller bearings in the gearbox. Frictionless support will be applied on the bearing contact area around the shaft tip on the left. In order to simulate the torque which resists the acceleration of the shaft, the rotational degree of freedom is removed from the end of the shaft where it would mate with its output gear. Additionally, there is an inertial load on the shaft created by the rotational velocity of the shaft, which is equal to the rotational speed of the input shaft multiplied by the 50


60 specific gear ratio. Since there are three balanced countershafts, the bending loads that result from the meshing of the gears of the countershafts with the gear on the output shaft cancel out and only a net torsional load is applied to the output shaft. Figure 5-1: The output shaft in the truck engine Figure 5-2: Output shaft FBD 51
61 5.2 Solid Output Shaft (Baseline) The baseline simulations of the output shaft serve to establish the nominal stresses in a conventional output shaft under its maximum loading conditions. These stresses can then be compared to the stresses observed in later simulations which utilize lightweight concepts. This allows for the evaluations of individual light weight designs and provides some idea of the necessary performance of the light weight component. The geometry of the simulated output shaft was taken from drawings of an actual output shaft and the diameter of the cross-section on the shaft where the first ratio gear was located was 49.78mm [1.96 in]. As shown in Figure 5-3, the output shaft with solid center was modeled in Static Structural of ANSYS Workbench as Baseline Simulation. The geometry of shaft s outside surface was simplified by removing features like splines and snap ring seats to ease the simulation process. The corners on the step surfaces were filleted with a 1.27mm [0.05in] radius. The material was approximated by ANSYS s structural steel model which has a Young s Modulus of 200 GPa [29,000 ksi] and a Poisson s ratio of 0.3. Only the material s elastic behaviors were simulated, as plastic deformation of the part would be considered failure. As illustrated in Figure 5-3, the shaft was meshed with tetrahedral elements and the mesh was refined in areas where the stress concentration was expected to be high, i.e. the fillets at the steps on the shaft. The left side of the shaft, where the shaft is mated with its output gear, has its rotational degree of freedom removed via a displacement boundary condition and a moment boundary condition of 6,520 N m [4,810 lb ft] was applied to the area where the sliding clutch meshes with the first gear and output shaft. Additionally, a rotational velocity of (76.1 rad/s) is applied to the shaft to simulate the centripetal forces on the part and the area where the rest of the rigid body modes of motion are removed by applying a frictionless boundary condition to area of the shaft which is in contact with the roller bearing. 52

62 Figure 5-3: Geometry, Boundary Conditions, and Mesh used in the Baseline Simulations of the Output Shaft After the completion of the simulation the stress contours were plotted as shown in Figure 5-4. Due to numerical error cause by the simplification of the real loading conditions to the boundary conditions used in the finite element simulations, specifically the fixed rotation condition, the stress was higher around the transitions from the free surface to the fixed surface on the shaft. Ignoring the numerical error around the fixed boundary condition, the maximum stress on the output shaft was about 466 MPa [67.6 ksi]. The shaft only sees stress in a relatively localized area because only the first gear is engaged. If, for instance, the fourth gear were engaged, instead of the first, the entire shaft would be subjected to stress. As was the case in the previous chapters, the stresses in the output shaft are concentrated on the outer diameter of the shaft and that the stress in the middle of the shaft is almost zero, as shown in Figure 5-4. Thus the material in the middle of the shaft increases the weight of the part without contributing significantly to its strength. The weight of the shaft could be significantly reduced by removing this parasitic material from the inside of the shaft or by replacing it with a lower density material. 53
![Figure 5-4: Stress [MPa] in the Solid Output Shaft 5.](/docs-images/96/127562237/images/63-0.jpg "3 Hollow Output Shaft The following simulations demonstrate how the performance of the shaft can be maintained while significantly reducing the weight of the part by removing the parasitic material")
63 Figure 5-4: Stress [MPa] in the Solid Output Shaft 5.3 Hollow Output Shaft The following simulations demonstrate how the performance of the shaft can be maintained while significantly reducing the weight of the part by removing the parasitic material from the center of the shaft. As shown in Figure 5-5, for the purposes of these simulations, the shaft was hollowed by removing a section of material from the center of the output shaft which was similar to the outer diameter of the shaft. The ratios between the outside diameters and inside diameters for each main cross section are kept the same (D o D i = Constant). In practice this would be difficult to fabricate as a single part, as it would require the forged blank to have a drilled hole with multiple diameters which would be time consuming and difficult for machining. A possible and attractive way to fabricate this shaft would be to start with a thick tube and forge the tube into shafts with the correct inner to outer diameter ratios. The first hollow shaft simulation which was carried out had the same outside dimensions as the baseline output shaft, but had a 6.35mm [0.25 in] hole on the large diameter section of the part where the first ratio gear was connected. The stress distribution in this part is given in Figure
64 The change in the maximum stress in the part is nearly unnoticeable with the maximum stress again was around 466 MPa [67.6 ksi]. However, there was also not a significant weight savings from the removal of this small amount of material (the weight of the part was only reduced kg [0.174 lbs]). Clearly more material must be removed to see significant weight savings. Figure 5-5: Geometry, Boundary Conditions, and Mesh used in the Simulations of the Hollow Output Shaft 55
65 Figure 5-6: Stress Distribution in a Hollow Output Shaft with an Outer Diameter of 49.78mm [1.96 in] and an Inner Diameter of 6.35mm [0.25 in] The effects of removing a more significant amount of material were investigated in the next simulation. Once again the outside geometry of the shaft was kept the same as the baseline simulation, but this time a 25.4 mm [1.0 in] diameter cylinder of material was removed from the large diameter section the shaft. This resulted in a weight savings of 1.24 kg [2.73 lbs], but came at the cost of increasing the stress in the shaft to nearly 500 MPa [72.5 ksi]. This rise in stress will have to be mitigated by either changing materials to one which is stronger, or by increasing the diameter of the shaft. As discussed in chapter 3, the stress in the shaft will decrease faster than the weight will rise as a result of the increased diameter. The distribution of the stresses in the shaft (Figure 5-7) also shows, there is very little parasitic material in this output shaft. The material in the center of this section of the shaft is carrying a stress of about 254 MPa [36.8 ksi] which is nearly 1/2 of the maximum load in the shaft. 56
![Figure 5-7: Stress Distribution in a Hollow Output Shaft with an Outer Diameter of 49.78mm [1.96 in] and an Inner Diameter of 25.](/docs-images/96/127562237/images/66-0.jpg "4mm [1 in] The next simulations show how the stresses in the shaft change as a result of a slight increase in the diameter of the shaft.")
66 Figure 5-7: Stress Distribution in a Hollow Output Shaft with an Outer Diameter of 49.78mm [1.96 in] and an Inner Diameter of 25.4mm [1 in] The next simulations show how the stresses in the shaft change as a result of a slight increase in the diameter of the shaft. The aspect ratio between the inner and outer diameter were kept the same as in the previous simulation, but the main shaft diameter was increased to 57.15mm [2.25 in] (an increase of 6.35mm [0.25 in]). The stress distribution in the thick and thin walled shafts is given in Figure 5-8 and Figure 5-9. The increase in the diameter resulted in a decrease in the stress of about 21.5% and resulted in a weight increase of about 17.5% in both cases. Clearly this strategy of increasing the diameter of the shaft to compensate for the increasing stress that results from removing parasitic material can provide a significant weight savings, but in order to fully determine its potential a larger sample of the design space must be analyzed. 57
67 Figure 5-8: Stress Distribution in a Hollow Output Shaft with an Outer Diameter of 57.15mm [2.25 in] and an Inner Diameter of 7.14mm [0.281 in] Figure 5-9: Stress Distribution in a Hollow Output Shaft with an Outer Diameter of 57.15mm [2.25 in] and an Inner Diameter of 28.58mm [1.125 in] 58
68 To determine the potential weight savings of a hollow output shaft, a parametric study was run which examined the effects of varying the outer diameter and wall thickness to outer diameter ratio of the output shaft on the maximum stress in the shaft and the weight of the shaft. Figure 3-9 demonstrates how the stress in the shaft changes with respect to the stress in the baseline study as the wall thickness ratio and shaft diameter change. The point where the stress curves for the various diameters are equal to the baseline stress represents the wall thickness ratio that will create a shaft with equal performance to the conventional, solid shaft for the shaft diameter corresponding to the particular curve. These wall thickness ratios can then be used in conjunction with Figure 3-10 to determine the weight savings of each of the equal performance designs. The stress in the shaft is clearly not sensitive to small holes in the shaft, but as the hole increases in diameter it removes material that is responsible for carrying an ever increasing amount of the load, resulting in rapidly rising stresses as the wall thickness ratio approaches zero. Additionally, increases in the outer diameter of the shaft serve only to shift the stress curve down, without significantly affecting the shape of the curve. The weight of the equally performing shaft tends to decrease as the outer diameter of the shaft is allowed to increase, so the designer will have to weigh the cost of reduced weight against the drawback of a less compact shaft. Based on the study performed the weight of the axle shaft could be reduced by 35-44% by switching to a hollow shaft, depending on the outer diameter of the replacement shaft. This is a savings of 1.7 to 2.2 kg [3.74 to 4.84 lbs] for the output shaft. 59
69 Mass [kg] Stress [MPa] OD 2in [50.8mm] OD 2.125in [54.0mm] OD 2.25in [57.2mm] Baseline [MPa] Wall Thickness/Diameter Figure 5-10: Maximum Stress in the Hollow Output Shaft as a Function of Hole Aspect Ratio for Various Diameter Shafts Wall Thickness/Diameter OD 2in [50.8mm] OD 2.125in [54.0mm] OD 2.25in [57.2mm] Baseline [kg] Figure 5-11: Mass of the Hollow Output Shaft as a Function of Hole Aspect Ratio for Various Diameter Shafts 5.4 Bimetallic Output Shaft The following simulations demonstrate how the performance of the shaft can be maintained while significantly reducing the weight of the part by replacing the parasitic material in the center with light metals like aluminum. As shown in Figure 5-12, the geometry of the bimetallic output 60
70 shaft is nearly identical to the hollow shaft geometry, except for the empty portion of the shaft is replaced with an aluminum material, which was assumed to have a Young s Modulus of 71 GPa [10,300 ksi] and a Poisson s ratio of This would be a challenging part to fabricate as the two parts must be well bonded so that the core can assist in carrying the torsional load applied to the shaft. It is possible that a high quality bond could be established by forging the shaft out of a bimetallic billet, which could make the bond as strong as the shear strength of the weaker material. The first bimetallic simulation which was carried out had the same outside dimensions as the baseline output shaft, but had a 6.35mm [0.25 in] aluminum core in large diameter portion of the shaft. As a reminder, the geometry of the aluminum core is identical to the geometry of the hole in the hollow shaft simulations. The stress distribution in this part is given in Figure The change in the maximum stress in the part is nearly unnoticeable with the maximum stress again was around 466 MPa [67.6 ksi] range. However there was also not a significant weight savings from replacing this small amount of parasitic steel material with aluminum (the weight of the part was only reduced 0.05 kg [0.11 lbs]). Clearly more material can be replaced to see significant weight savings. 61

71 Figure 5-12: Geometry, Boundary Conditions, and Mesh used in the Simulations of the Bimetallic Output Shaft. Figure 5-13: Stress Distribution in a Bimetallic Output Shaft with an Outer Diameter of 49.78mm [1.96 in] and an Inner Diameter of 6.35mm [0.25 in] 62
72 The effects of replacing a significant amount of steel material were investigated in the next simulation. Once again the outside geometry of the shaft was kept the same as the baseline simulation, but this time an aluminum core with a maximum diameter of 25.4mm [1.0 in] was used. This resulted in a weight savings of 0.8 kg [1.76 lbs], but came at the cost of increasing the stress in the shaft to nearly 487 MPa [70.6 ksi]. This rise in stress will have to be mitigated by either changing outer shaft material to one which is stronger, or by increasing the diameter of the shaft. As can be seen from the distribution of the stresses in the shaft (Figure 5-14), there is very little parasitic material in this output shaft. The material in the center of the shaft is carrying a stress of about 248 MPa [36.0 ksi] which is nearly 1/2 of the maximum load in the shaft. Figure 5-14: Stress Distribution in a Bimetallic Output Shaft with an Outer Diameter of 49.78mm [1.96 in] and an Inner Diameter of 25.4mm [1 in] The next simulations show how the stresses in the shaft change as a result of a slight increase in the diameter of the shaft. The aspect ratio between the inner and outer diameter were kept the same as in the previous simulation, but the main shaft diameter was increased to mm [2.25 in] (an increase of 6.35 mm [0.25 in]). The stress distribution in the thick and thin shell shafts is given in Figure 5-15 and Figure The increase in the diameter resulted in a decrease in the 63
73 stress of about 21.5% and a weight increase of a little less than 18% in both cases. Clearly this strategy of increasing the diameter of the shaft to compensate for the increasing stress that results from replacing high density parasitic material with light metal can provide a significant weight savings, but in order to fully determine its potential a larger sample of the design space must be analyzed. Figure 5-15: Stress Distribution in a Bimetallic Output Shaft with an Outer Diameter of 57.15mm [2.25 in] and an Inner Diameter of 7.14mm [0.281 in] 64
74 Figure 5-16: Stress Distribution in a Bimetallic Output Shaft with an Outer Diameter of 57.15mm [2.25 in] and an Inner Diameter of 28.58mm [1.125 in] To determine the potential weight savings of a hollow shaft with light aluminum core a parametric study was run which examined the effects of varying the outer diameter and wall thickness to outer diameter ratio of the output shaft on the maximum stress in the shaft and the weight of the shaft. Figure 5-17 demonstrates how the stress in the shaft changes with respect to the stress in the baseline study as the wall thickness ratio and shaft diameter change. The point where the stress curves for the various diameters are equal to the baseline stress represents the wall thickness ratio that will create a shaft with equal performance to the conventional, solid shaft for the shaft diameter corresponding to the particular curve. These wall thickness ratios can then be used in conjunction with Figure 5-18 to determine the weight savings of each of the equal performance designs. The stress in the shaft is clearly not sensitive to changes in the diameter of the aluminum core when the diameter of the core is small, but as the core increases in diameter it removes steel material that is carrying an increasing amount of the torsional load. Additionally, because the stiffness of the aluminum is much less than the stiffness of steel, a majority of this load is redistributed to the steel material. This results in the stress increasing rapidly as the wall thickness 65
75 Stress [MPa] ratio approaches zero, but the stress does not approach infinity as it did with the hollow shaft. Rather, it approaches the stress that a steel would reach as it approached the strain in a 100% aluminum shaft under the same loading. It is also noted that increases in the outer diameter of the shaft serve only to shift the stress curve down, without significantly affecting the shape of the curve. The weight of the equally performing shaft tends to decrease as the outer diameter of the shaft is allowed to increase, so the designer will have to weigh the cost of reduced weight against the drawback of a less compact shaft. Based on the study performed the weight of the axle shaft could be reduced by 26% by switching to a hollow shaft, depending on the outer diameter of the replacement shaft. This is a savings of 1.29 kg [2.84 lbs] for the output shaft OD 2in [50.8mm] OD 2.125in [54.0mm] OD 2.25in [57.2mm] Baseline [MPa] Wall Thickness/Diameter Figure 5-17: Maximum Stress in the Bimetallic Output Shaft as a Function of Hole Aspect Ratio for Various Diameter Shafts 66
76 Mass [kg] OD 2in [50.8mm] OD 2.125in [54.0mm] OD 2.25in [57.2mm] Baseline [kg] Wall Thickness/Diameter Figure 5-18: Mass of the Bimetallic Output Shaft as a Function of Hole Aspect Ratio for Various Diameter Shafts 5.5 Conclusion The weight of the conventional output shaft is about 4.9 kg or 10.8 lbs. The finite element study carried out in this chapter demonstrates how two lightweight designs of the shaft can reduce the weight of the part. If the shaft was made hollow, a great deal of dead weight could be removed from the center of the shaft with only a small increase in the outer diameter of the shaft. This could reduce the weight of the shaft by 1.7 to 2.2 kg [3.74 to 4.84 lbs]. Similarly the material contributing to the dead weight in the shaft could be replaced by a lower density material, which could produce weight saving of around 1.29 kg [2.84 lbs]. The decision to employ one of these light weight techniques will need to be carefully weighed against the costs of implementing design, which have yet to be determined. Although the potential savings are relatively small, one must look at them as a piece of the larger scale total reduction of the heavy duty truck mass. 67
77 Chapter 6 Countershaft: Finite Element Study Light Weight Shafts 6.1 Introduction This chapter describes the finite element study carried out on both the conventional countershaft and two lightweight designs of the countershaft. The loads on the countershaft are detailed in chapter 2, although due to the triple countershaft layout of the reference gearbox the loads are lower than those described previously. The first part of the finite element study was to determine the stress distribution in the conventional, solid countershaft. This information was then used as a baseline to compare the results of the finite element analysis of the lightweight designs. The two lightweight designs investigated were a hollow shaft geometry and a bimetallic shaft, which utilized a low density core material. The countershaft is a gearbox component which transmits torque from the input shaft to the output shaft. Gears are fixed to the shaft either through a press fit or machined into the shaft itself, so that they always rotate at the same speed as the countershaft. Additionally, the gears are always engaged with their corresponding gears on the input and output shafts. Typically, the input and output shaft are coaxial and the countershaft rotates next to the shafts on a parallel axis. Heavy duty vehicle gearboxes come with a large variety of countershaft configurations having as few as one and as many as three counter shafts. Having multiple countershafts serves two main purposes. First, because the load being transmitted from the input shaft to the output shaft is divided into multiple paths, the load on the gear teeth and the counter shaft itself is reduced by a factor of the number of counter shafts engaged. Second, having multiple countershafts allows the bending forces from the meshing gears to be balanced in such a way that there is not bending moment on the input or output shafts. However, bending moments on the countershaft cannot be avoided. The countershaft in a Mack 10 speed Maxitorque is highlighted in Figure 6-1. This particular gearbox has three countershafts, a torque rating of 2,440 N m [1,800 lb ft], and the first/sixth gear ratio (not including the high/low range adjustment) is Based on measurements taken of the shaft the gear ratio between the input shaft and the countershaft is about 1.43 meaning that the total torque carried by the countershafts is 3,490 N m [2,580 lb ft], or 1,163 N m [858 lb ft] per shaft. As stated previously there will be bending loads on the counter shaft. These loads can be 68
78 calculated based on the torque carried by the shaft and the size of the input and output gears. In this case the input gear and output gear corresponding to first/sixth gear have pitch circle diameters of about 163 mm [6.43 in] and 96.8 mm [3.81 in], respectively. The circumferential forces on the gears can be calculated by dividing the torque produced by the gear by the radius of the gear and the radial forces can be calculated by multiplying the circumferential force by the tangent of the pressure angle of the gears. Assuming a pressure angle of 20, the circumferential and radial loads on the input gear are 14,230 N [3,200 lbf] and 5178 N [1,164 lbf], respectively. The corresponding loads on the output shaft are 24,060 N [5410 lbf] and 8760 N [1969 lbf], respectively. It is important to remember that the circumferential loads from the gears must balance the torque on the shaft, so they will be applied in opposite directions. Additionally, if the gears are helical, instead of spur gears, the radial load will be slightly different and there will be an axial load on the shaft as well, due to the additional helix angle on the gear teeth. For the purposes of this investigation the loading conditions for spur gears will be used because the reference gearbox uses spur gears. Finally, the shaft has inertial loads corresponding to rotational at speeds of 1400 RPM and is supported on either end by tapered roller bearings. 69
 The geometry of and loads applied to the countershaft in the Mack ES T310 gearbox shown in Figure 6-1 are summarized in Figure 6-2.")
79 Figure 6-1: Mack 10 Speed Maxitorque ES T310 Gearbox with Simplified Boundary Conditions used in Finite Element Analysis 6.2 Solid Countershaft (Baseline) The geometry of and loads applied to the countershaft in the Mack ES T310 gearbox shown in Figure 6-1 are summarized in Figure 6-2. In order to establish a baseline from which studies of light weight countershafts can be compared, a solid shaft with the dimensions shown in Figure 6-2 will be simulated via the finite element method. In addition to the shaft itself, the gears, spacers and key must simulated. This is because the gears and spacers have no space to slide on the shaft and will, therefore, serve to help the shaft resist the bending load created by the meshing gears. The key and keyway on the shaft are simulated because they transmit the load to the shaft unevenly and may have a significant effect on the stresses in the shaft. Contact conditions between the various simulated parts are as follows: i) the gears have frictionless contact with each other and the countershaft, ii) the key is bonded to the gears and the key way in the countershaft. The 70
80 circumferential and radial loads are applied as force boundary conditions to the outside surfaces of the input and output gears (this is acceptable because the analysis is focused on the countershaft and not the gears). The torque on the shaft is applied as a moment on the surface of the input gear and is countered by a using a displacement boundary condition to prevent the output gear from turning. The shaft is held in place by two frictionless supports on the ends of the shaft where the bearing would be placed on the real shaft. The simulated geometry and boundary conditions are illustrated in Figure 6-3. The mesh used to discretize the shaft, gears, and key is given in Figure 6-4. Figure 6-2: Geometry and Loading on the Countershaft 71
 and examined.")

81 Figure 6-3: (left) Countershaft with Gears, Spacers, and Key Simulated in the Baseline Finite Element Analysis (right) Boundary Conditions applied to the Countershaft Assembly Figure 6-4: Mesh used in the Finite Element Simulation of the Solid Countershaft After the simulation was run, the stress distribution on the shaft was plotted (Figure 6-5) and examined. The maximum stress on the shaft was 565 MPa [81.8 ksi] and this stress occurred on the outer radius of the keyway around the area where the output gear counters the torque produced by the input gear. The maximum stress elsewhere on the shaft is relatively low (about 110 MPa [16 ksi]). This is interesting as this stress is much lower than the stresses observed in the 72
82 simulations of the other parts examined. It is likely that the stresses in the shaft could achieve a more appreciable fraction of the yield strengths of typical automotive grades of steel if the key way was removed in favor of a coupling method which produced a smaller stress concentration. Unlike the studies of the other investigated parts, a cross sectional view of the countershaft shows a high amount of parasitic material on not just in the middle of the shaft, but also in the areas which are far from the keyway. It is very likely that the shaft s weight can be reduced without significantly affecting its strength by removing this material, or replacing it with a lower density material. Additionally, more efficient use of the strength of the material could be made by changing the joining method of the gears and shaft. 73

83 Figure 6-5: Stress Distribution on the Solid Countershaft (baseline) 6.3 Hollow Countershaft The following simulations demonstrate the behavior of the countershaft as material is removed from its center. The diameter of the cylindrical section of material removed from the center of the shaft and the outer diameter of the shaft were varied to determine how the weight of the shaft can be reduced without affecting the performance of the shaft. These simulations used the same boundary conditions and meshing parameters as the baseline study, so that the only difference between the two studies is the geometry. A representative mesh is given in Figure 6-6. Due to the complexity of the simulation the amount of time required for each simulation was quite high and 74

84 so the number of individual designs studied was lower than in some of the other studies. Still, some interesting conclusions can be drawn from the simulations. Figure 6-6: Representative Mesh used in the Finite Element Study of the Hollow Countershaft The first studies were carried out on a shaft with the same outside dimensions as the original shaft, but with different internal diameters. These stress distributions in the countershaft predicted by these finite element simulations are given in Figure 6-7 and Figure 6-8. The maximum stress in both simulations occurs at the outer radius of the keyway underneath the output gear. The magnitude of this stress is very close to the stress from the baseline simulation in this area for both simulations, while on the other side of the shaft the stresses vary with the internal diameter of the shaft. This occurs because the high stress in the keyway is due to the contact between the key and the shaft and the total force carried by the key is directly proportional to the outer diameter of the shaft. In contrast, the stress on the side of the shaft opposite to the key is under a torsional load instead of a contact load, so the stress in this area depends on the countershaft s polar moment of inertia and outer diameter. It is important to point out that the effects of bending on the shaft are significantly reduced by the presence of the gears and spacers. Essentially, the gears create an additional resistance to bending deformation on the shaft because pitching of the individual gears would cause them to come into contact with the other gears. 75
85 Figure 6-7: Stress Distribution in a Hollow Countershaft with and Outer Diameter of 44.1mm [1.735 in] and an internal Diameter of 6.35 mm [0.25 in] 76
86 Figure 6-8: Stress Distribution in a Hollow Countershaft with and Outer Diameter of 44.1mm [1.735 in] and an internal Diameter of 25.4 mm [1 in] The second set of hollow shaft studies demonstrated the effects of increasing the outer diameter of the hollow shaft on the stress distribution in the shaft. There were two simulations carried out one with a small hole and another with a large hole (the material removed from each shaft was in proportion to the material removed from the smaller diameter shafts). The results of these simulations are recorded in Figure 6-9 and Figure The maximum stress on the shaft occurs at the outside radius of the keyway underneath the output gear, just as it did in the baseline study and the previous hollow simulations. However, in this set of studies the stress were slightly lower than the stress in smaller diameter shaft. This is likely due to the decrease in the contact force required to produce the torque on the shaft due to the increase in the average diameter of the keyway. The stress on the side of the shaft opposite to the keyway, decreased as a result of the increased diameter and was lower in both cases than the corresponding stress on the lower diameter shafts. The change in stress in this area was about 33%, but because the stresses are already so low in this area the total change in the stress was only 40 MPa [5.8 ksi]. 77
![Figure 6-9: Stress Distribution in a Hollow Countershaft with and Outer Diameter of 50.8 mm [2 in] and an internal Diameter of 7.32 mm [0.](/docs-images/96/127562237/images/87-0.jpg "288 in] Figure 6-10: Stress Distribution in a Hollow Countershaft with and Outer Diameter of 50.8 mm [2 in] and an internal Diameter of 29.3 mm [1.")
87 Figure 6-9: Stress Distribution in a Hollow Countershaft with and Outer Diameter of 50.8 mm [2 in] and an internal Diameter of 7.32 mm [0.288 in] Figure 6-10: Stress Distribution in a Hollow Countershaft with and Outer Diameter of 50.8 mm [2 in] and an internal Diameter of 29.3 mm [1.153 in] 78
88 Stress [MPa] A few more simulations were carried out on the hollow countershaft with even more material removed from the shaft so that trends in the changes in the stresses could be better examined. The numerical results of these simulations are plotted in addition to the results of the four simulations examined previously in this section in Figure 6-11 through Figure One can see a very tight grouping between the maximum stress in the baseline and the 44.1 mm [1.735 in] and 50.8 mm [2 in] diameter hollow shafts. The stress on the opposite side of the keyway, however, demonstrates a much larger spacing (percentage wise). The amount of weight which could be removed from the shaft depends on whether one makes the decision based on the stresses on the keyway or based on the stresses elsewhere in the shaft. If the maximum stress is the deciding factor, the weight can only be reduced by about 0.5 kg [1.1 lbs] per shaft or 1.5 kg [3.3 lbs] total. However, if the stress in the keyway is ignored, the weight saved could be upwards of 2 kg [4.4 lbs] per shaft or 6 kg [13.2 lbs] total. The major source of stress on the countershaft in this particular gearbox is the keyway. Using a lower stress alternative to the keyway, like a splined shaft or directly machining the gears onto flanges in the shaft, would allow the designer to take full advantage of the material s strength to greatly reduce the shaft s weight OD in [ mm] OD 2 in [50.8 mm] Baseline [MPa] Wall Thickness/Diameter Figure 6-11: Maximum Stress in the Countershaft as a Function of the Wall Thickness to Outer Diameter Ratio 79
89 Mass [kg] Stress on Opposite Side of Keyway [MPa] OD in [ mm] OD 2 in [50.8 mm] Baseline [MPa] Wall Thickness/Diameter Figure 6-12: Stress on Opposite Side of Keyway in the Hollow Countershaft as a Function of the Wall Thickness to Outer Diameter Ratio OD in [ mm] OD 2 in [50.8 mm] Baseline [kg] Wall Thickness/Diameter Figure 6-13: Mass of the Countershaft as Function of Wall Thickness to Outer Diameter Ratio 6.4 Bimetallic Countershaft In this section the simulations are focused on bimetallic counter shafts. Instead of removing the material from the inside it will be replaced with material which has a much lower density. This may allow for the weight reduction of complicated parts that are difficult to forge in a hollow configuration. The geometry used in these simulations is identical to the geometry used in the 80

90 hollow shaft simulations, except the void in the middle of the steel shell is replaced by an aluminum core which is bonded to the steel shell. An example of the mesh used to discretize the bimetallic geometry is given in Figure Figure 6-14: Mesh used in the Finite Element Simulation of the Bimetallic Countershaft The results of the simulations of the bimetallic shaft are summarized in the stress contours shown in Figure 6-15 through Figure The first two figures depict the stress distribution in the shaft with outer geometry identical to the baseline simulation and the last two figures show the stress distribution in shafts with larger outer diameters. The same trends that were seen in the simulation of the hollow shafts are observed in the bimetallic shaft simulations. Namely, i) the overall stress in the body decreases as the outer diameter is allowed in increase, ii) the overall stress in the body increases as the wall thickness of the steel shell decreases, iii) the maximum stress in the shaft occurs at the outside of the key way just under the output gear, and iv) the maximum stress does not vary significantly as the wall thickness decreases. If the keyway is ignored the stress in the bimetallic shaft is lower than its corresponding hollow shaft, due to the extra support added by the light core material. However, this comes at the cost of increased weight for a given geometry of the steel shell. 81
91 Figure 6-15: Stress Distribution in a Bimetallic Countershaft with and Outer Diameter of 44.1mm [1.735 in] and an internal Diameter of 6.35 mm [0.25 in] Figure 6-16: Stress Distribution in a Bimetallic Countershaft with and Outer Diameter of 44.1mm [1.735 in] and an internal Diameter of 25.4 mm [1 in] 82
![Figure 6-17: Stress Distribution in a Bimetallic Countershaft with and Outer Diameter of 50.8 mm [2 in] and an internal Diameter of 7.32 mm [0.](/docs-images/96/127562237/images/92-2.jpg "288 in] Figure 6-18: Stress Distribution in a Bimetallic Countershaft with and Outer Diameter of 50.8 mm [2 in] and an internal Diameter of 29.3 mm [1.")
92 Figure 6-17: Stress Distribution in a Bimetallic Countershaft with and Outer Diameter of 50.8 mm [2 in] and an internal Diameter of 7.32 mm [0.288 in] Figure 6-18: Stress Distribution in a Bimetallic Countershaft with and Outer Diameter of 50.8 mm [2 in] and an internal Diameter of 29.3 mm [1.153 in] 83
Static and Dynamic Strength Analysis on Rear Axle of Small Payload Off-highway Dump Trucks
 Static and Dynamic Strength Analysis on Rear Axle of Small Payload Off-highway Dump Trucks Ji-xin Wang, Guo-qiang Wang, Shi-kui Luo, Dec-heng Zhou College of Mechanical Science and Engineering, Jilin University,
Load Analysis and Multi Body Dynamics Analysis of Connecting Rod in Single Cylinder 4 Stroke Engine
 IJSRD - International Journal for Scientific Research & Development Vol. 3, Issue 08, 2015 ISSN (online): 2321-0613 Load Analysis and Multi Body Dynamics Analysis of Connecting Rod in Single Cylinder 4
Finite Element Analysis of Clutch Piston Seal
 Finite Element Analysis of Clutch Piston Seal T. OYA * F. KASAHARA * *Research & Development Center Tribology Research Department Three-dimensional finite element analysis was used to simulate deformation
FEM Analysis of Combined Paired Effect on Piston & Connecting Rod using ANSYS
 FEM Analysis of Combined Paired Effect on Piston & Connecting Rod using ANSYS Kunal Saurabh Assistant Professor, Mechanical Department IEC Group of Institutions, Greater Noida - India kunalsaurabh.me@ieccollege.com
Design of Helical Gear and Analysis on Gear Tooth
 Design of Helical Gear and Analysis on Gear Tooth Indrale Ratnadeep Ramesh Rao M.Tech Student ABSTRACT Gears are mainly used to transmit the power in mechanical power transmission systems. These gears
Static And Modal Analysis of Tractor Power Take Off (PTO) Gearbox Housing
 Gearbox Housing") Static And Modal Analysis of Tractor Power Take Off (PTO) Gearbox Housing Gopali S Lamani 1, Prof: S.R.Basavaraddi 2, Assistant Professor, Department of Mechanical Engineering, JSPM NTC RSSOER,India1 Professor,
Static And Modal Analysis of Tractor Power Take Off (PTO) Gearbox Housing Gopali S Lamani 1, Prof: S.R.Basavaraddi 2, Assistant Professor, Department of Mechanical Engineering, JSPM NTC RSSOER,India1 Professor,
Structural Analysis of Differential Gearbox
 Structural Analysis of Differential Gearbox Daniel Das.A Seenivasan.S Assistant Professor Karthick.S Assistant Professor Abstract- The main aim of this paper is to focus on the mechanical design and analysis
Static Stress Analysis of Piston
 Static Stress Analysis of Piston Kevin Agrawal B. E. Student, Mechanical Engineering, BITS Pilani K. K. Birla Goa Campus. AH7-352, BITS Pilani, K. K. Birla Goa Campus, NH 17B, Zuarinagar 403726. Parva
Simulating Rotary Draw Bending and Tube Hydroforming
 Abstract: Simulating Rotary Draw Bending and Tube Hydroforming Dilip K Mahanty, Narendran M. Balan Engineering Services Group, Tata Consultancy Services Tube hydroforming is currently an active area of
B.TECH III Year I Semester (R09) Regular & Supplementary Examinations November 2012 DYNAMICS OF MACHINERY
 Regular & Supplementary Examinations November 2012 DYNAMICS OF MACHINERY") 1 B.TECH III Year I Semester (R09) Regular & Supplementary Examinations November 2012 DYNAMICS OF MACHINERY (Mechanical Engineering) Time: 3 hours Max. Marks: 70 Answer any FIVE questions All questions
1 B.TECH III Year I Semester (R09) Regular & Supplementary Examinations November 2012 DYNAMICS OF MACHINERY (Mechanical Engineering) Time: 3 hours Max. Marks: 70 Answer any FIVE questions All questions
Transmission Error in Screw Compressor Rotors
 Purdue University Purdue e-pubs International Compressor Engineering Conference School of Mechanical Engineering 2008 Transmission Error in Screw Compressor Rotors Jack Sauls Trane Follow this and additional
Safety factor and fatigue life effective design measures
 Safety factor and fatigue life effective design measures Many catastrophic failures have resulted from underestimation of design safety and/or fatigue of structures. Failure examples of engineered structures
Paper Number: DETC
 Proceedings of the th ASME International Power Transmission and Gearing Conference DETC20 August 28-3, 20, Washington, DC, USA Paper Number: DETC20-48494 THE DYNAMIC SIMULATION AND ANALYSIS OF A CYCLOIDAL
III B.Tech I Semester Supplementary Examinations, May/June
 Set No. 1 III B.Tech I Semester Supplementary Examinations, May/June - 2015 1 a) Derive the expression for Gyroscopic Couple? b) A disc with radius of gyration of 60mm and a mass of 4kg is mounted centrally
Static Structural and Thermal Analysis of Aluminum Alloy Piston For Design Optimization Using FEA Kashyap Vyas 1 Milan Pandya 2
 IJSRD - International Journal for Scientific Research & Development Vol. 2, Issue 03, 2014 ISSN (online): 2321-0613 Static Structural and Thermal Analysis of Aluminum Alloy Piston For Design Optimization
Address for Correspondence
 Research Article DESIGN AND STRUCTURAL ANALYSIS OF DIFFERENTIAL GEAR BOX AT DIFFERENT LOADS C.Veeranjaneyulu 1, U. Hari Babu 2 Address for Correspondence 1 PG Student, 2 Professor Department of Mechanical
Design of a Gearbox for an electric FSAE vehicle
 Final Project Master of Engineering in Mechanical and Aerospace Engineering Design of a Gearbox for an electric FSAE vehicle Author: Tutor: Oriol Sanfeliu Tort Roberto Cammino Semester: Summer 2016 CWID:
Sheet 1 Variable loading
 Sheet 1 Variable loading 1. Estimate S e for the following materials: a. AISI 1020 CD steel. b. AISI 1080 HR steel. c. 2024 T3 aluminum. d. AISI 4340 steel heat-treated to a tensile strength of 1700 MPa.
Modeling and Analysis of Two Wheeler Connecting Rod by Using Ansys
 IOSR Journal of Mechanical and Civil Engineering (IOSR-JMCE) e-issn: 2278-1684,p-ISSN: 2320-334X, Volume 6, Issue 5 (May. - Jun. 2013), PP 83-87 Modeling and Analysis of Two Wheeler Connecting Rod by Using
Chapter 11. Keys, Couplings and Seals. Keys. Parallel Keys
 Chapter 11 Keys, Couplings and Seals Material taken for Keys A key is a machinery component that provides a torque transmitting link between two power-transmitting elements. The most common types of keys
Application Notes. Calculating Mechanical Power Requirements. P rot = T x W
 Application Notes Motor Calculations Calculating Mechanical Power Requirements Torque - Speed Curves Numerical Calculation Sample Calculation Thermal Calculations Motor Data Sheet Analysis Search Site
Chapter 11 Rolling Contact Bearings
 Chapter 11 Rolling Contact Bearings 1 2 Chapter Outline Bearing Types Bearing Life Bearing Load Life at Rated Reliability Bearing Survival: Reliability versus Life Relating Load, Life, and Reliability
Electromagnetic Fully Flexible Valve Actuator
 Electromagnetic Fully Flexible Valve Actuator A traditional cam drive train, shown in Figure 1, acts on the valve stems to open and close the valves. As the crankshaft drives the camshaft through gears
Static Analysis of Crankcase and Crankshaft of Single Cylinder Four Stroke Diesel Engine
 Static Analysis of Crankcase and Crankshaft of Single Cylinder Four Stroke Diesel Engine Kakade Pratik 1 Post Graduate Student kakadepratik@gmail.com Pasarkar M. D. 2 Assistant Professor mdpasarkar@gmail.com
Simple Gears and Transmission
 Simple Gears and Transmission Simple Gears and Transmission page: of 4 How can transmissions be designed so that they provide the force, speed and direction required and how efficient will the design be?
ISSN: [Patil et al., 5(10): October, 2016] Impact Factor: 4.116
![ISSN: [Patil et al., 5(10): October, 2016] Impact Factor: 4.116](/thumbs/83/88212336.jpg "ISSN: [Patil et al., 5(10): October, 2016] Impact Factor: 4.116") IJESRT INTERNATIONAL JOURNAL OF ENGINEERING SCIENCES & RESEARCH TECHNOLOGY DESIGN AND ANALYSIS OF TELESCOPIC HALFSHAFT FOR AN ALL-TERRAIN VEHICLE (ATV) Chirag Patil *, Sandeep Imale, Kiran Hiware, Sumeet
IJESRT INTERNATIONAL JOURNAL OF ENGINEERING SCIENCES & RESEARCH TECHNOLOGY DESIGN AND ANALYSIS OF TELESCOPIC HALFSHAFT FOR AN ALL-TERRAIN VEHICLE (ATV) Chirag Patil *, Sandeep Imale, Kiran Hiware, Sumeet
CONTENT. 1. Syllabus 2. Introduction 3. Shaft 4. Coupling. Rigid coupling. Flange coupling. Sleeve (or) muff coupling Split muff coupling
 muff coupling Split muff coupling") UNIT II 1. Syllabus 2. Introduction 3. Shaft 4. Coupling Rigid coupling CONTENT Flange coupling Protected flange coupling Unprotected flange coupling Marine type flange coupling Sleeve (or) muff coupling
UNIT II 1. Syllabus 2. Introduction 3. Shaft 4. Coupling Rigid coupling CONTENT Flange coupling Protected flange coupling Unprotected flange coupling Marine type flange coupling Sleeve (or) muff coupling
NEW CONCEPT OF A ROCKER ENGINE KINEMATIC ANALYSIS
 Journal of KONES Powertrain and Transport, Vol. 19, No. 3 2012 NEW CONCEPT OF A ROCKER ENGINE KINEMATIC ANALYSIS Miros aw Szymkowiak Kochanowskiego Street 13, 64-100 Leszno, Poland e-mail: szymkowiak@op.pl
Stress Analysis of Piston at Different Pressure Load
 Stress Analysis of Piston at Different Pressure Load 1 PG Student, Department of Mechanical Engineering, SKNSITS, Lonavala, India 2 Professor, Department of Mechanical Engineering, SKNSITS, Lonavala, India
SAE Mini BAJA: Suspension and Steering
 SAE Mini BAJA: Suspension and Steering By Zane Cross, Kyle Egan, Nick Garry, Trevor Hochhaus Team 11 Progress Report Submitted towards partial fulfillment of the requirements for Mechanical Engineering
Modal analysis of Truck Chassis Frame IJSER
 Modal analysis of Truck Chassis Frame 158 Shubham Bhise 1, Vaibhav Dabhade 1, Sujit Pagi 1, Apurvi Veldandi 1. 1 B.E. Student, Dept. of Automobile Engineering, Saraswati College of Engineering, Navi Mumbai,
Design and Analysis of Pressure Die Casting Die for Side Differential Cover of Mini truck
 Design and Analysis of Pressure Die Casting Die for Side Differential Cover of Mini truck 1 A Chakravarthi P.G student, Department of Mechanical Engineering,KSRM CE, kadapa-516003 2. R Rama Krishna Reddy,
Design and Stress Analysis of Crankshaft for Single Cylinder 4-Stroke Diesel Engine
 Design and Stress Analysis of Crankshaft for Single Cylinder 4-Stroke Diesel Engine Amit Solanki #1, Jaydeepsinh Dodiya #2, # Mechanical Engg.Deptt, C.U.Shah University, Wadhwan city, Gujarat, INDIA Abstract
PRECISION BELLOWS COUPLINGS
 PRECISION BELLOWS COUPLINGS Bellows couplings are used where precise rotation, high speeds, and dynamic motion must be transmitted. They exhibit zero backlash and a high level of torsional stiffness, offering
Comparison Chart. extremely difficult. Finally, separated components can rarely be re-used.
 JAN 2014 Traditional Connections Why Go Keyless Keyed Bushing Systems Both QD and Taper-Lock bushing and weld-on hub systems are popular component mounting technologies. Yet both are ultimately keyed connections
Friction Management Solutions for Industrial Gear Drives
 Friction Management Solutions for Industrial Gear Drives A complete range of bearings and complementary services help the gear drive industry to meet ever-increasing requirements in product reliability
CHAPTER 5 PREVENTION OF TOOTH DAMAGE IN HELICAL GEAR BY PROFILE MODIFICATION
 90 CHAPTER 5 PREVENTION OF TOOTH DAMAGE IN HELICAL GEAR BY PROFILE MODIFICATION 5.1 INTRODUCTION In any gear drive the absolute and the relative transmission error variations normally increases with an
Chapter 7. Shafts and Shaft Components
 Chapter 7 Shafts and Shaft Components 2 Chapter Outline Introduction Shaft Materials Shaft Layout Shaft Design for Stress Deflection Considerations Critical Speeds for Shafts Miscellaneous Shaft Components
VEHICLE ANTI-ROLL BAR ANALYZED USING FEA TOOL ANSYS
 VEHICLE ANTI-ROLL BAR ANALYZED USING FEA TOOL ANSYS P. M. Bora 1, Dr. P. K. Sharma 2 1 M. Tech. Student,NIIST, Bhopal(India) 2 Professor & HOD,NIIST, Bhopal(India) ABSTRACT The aim of this paper is to
Research on Optimization for the Piston Pin and the Piston Pin Boss
 186 The Open Mechanical Engineering Journal, 2011, 5, 186-193 Research on Optimization for the Piston Pin and the Piston Pin Boss Yanxia Wang * and Hui Gao Open Access School of Traffic and Vehicle Engineering,
A STUDY OF THE CENTRIFUGAL COMPRESSOR DISCHARGE PIPELINE CONSTRAINED OSCILLATION. KIRILL SOLODYANKIN*, JIŘÍ BĚHAL ČKD KOMPRESORY, a.s.
 A STUDY OF THE CENTRIFUGAL COMPRESSOR DISCHARGE PIPELINE CONSTRAINED OSCILLATION KIRILL SOLODYANKIN*, JIŘÍ BĚHAL ČKD KOMPRESORY, a.s. Abstract: The paper presents a solution of a pipeline constrained oscillation
EXAMPLES INTRODUCTION
 AMEM 316 (AUTO308): Machine Elements I EXAMPLES INTRODUCTION EXAMPLES INTRODUCTION Example 1 (Hamrock p.53) As shown in figure 2.12(a), a 3m long bar is supported at the left end (B) by a 6 ram diameter
AT 2303 AUTOMOTIVE POLLUTION AND CONTROL Automobile Engineering Question Bank
 AT 2303 AUTOMOTIVE POLLUTION AND CONTROL Automobile Engineering Question Bank UNIT I INTRODUCTION 1. What are the design considerations of a vehicle?(jun 2013) 2..Classify the various types of vehicles.
HERCULES-2 Project. Deliverable: D8.8
 HERCULES-2 Project Fuel Flexible, Near Zero Emissions, Adaptive Performance Marine Engine Deliverable: D8.8 Study an alternative urea decomposition and mixer / SCR configuration and / or study in extended
Research on Lubricant Leakage in Spiral Groove Bearing
 TECHNICAL REPORT Research on Lubricant Leakage in Spiral Groove Bearing T. OGIMOTO T. TAKAHASHI In recent years, bearings for spindle motors have been required for high-speed rotation with high accuracy
Topology Optimization of Gears from Two Wheeler Gear Set Using Parametric Study
 IOSR Journal of Mechanical and Civil Engineering (IOSR-JMCE) e-issn: 2278-1684,p-ISSN: 2320-334X, Volume 14, Issue 1 Ver. II (Jan. - Feb. 2017), PP 22-31 www.iosrjournals.org Topology Optimization of Gears
COMPRESSIBLE FLOW ANALYSIS IN A CLUTCH PISTON CHAMBER
 COMPRESSIBLE FLOW ANALYSIS IN A CLUTCH PISTON CHAMBER Masaru SHIMADA*, Hideharu YAMAMOTO* * Hardware System Development Department, R&D Division JATCO Ltd 7-1, Imaizumi, Fuji City, Shizuoka, 417-8585 Japan
Bearings. Rolling-contact Bearings
 Bearings A bearing is a mechanical element that limits relative motion to only the desired motion and at the same time it reduces the frictional resistance to the desired motion. Depending on the design
Development of Seamless Shift for Formula One Car
 Development of Seamless Shift for Formula One Car Takashi YOSHIOKA* Katsumi KUBO* Takeshi UCHIYAMA* Ryo MATSUI* ABSTRACT Honda focused on gearbox development during its third Formula One era. The reduction
Simple Gears and Transmission
 Simple Gears and Transmission Contents How can transmissions be designed so that they provide the force, speed and direction required and how efficient will the design be? Initial Problem Statement 2 Narrative
Vehicle Dynamic Simulation Using A Non-Linear Finite Element Simulation Program (LS-DYNA)
") Vehicle Dynamic Simulation Using A Non-Linear Finite Element Simulation Program (LS-DYNA) G. S. Choi and H. K. Min Kia Motors Technical Center 3-61 INTRODUCTION The reason manufacturers invest their time
Vehicle Dynamic Simulation Using A Non-Linear Finite Element Simulation Program (LS-DYNA) G. S. Choi and H. K. Min Kia Motors Technical Center 3-61 INTRODUCTION The reason manufacturers invest their time
6340(Print), ISSN (Online) Volume 3, Issue 3, Sep- Dec (2012) IAEME AND TECHNOLOGY (IJMET)
, ISSN (Online) Volume 3, Issue 3, Sep- Dec (2012) IAEME AND TECHNOLOGY (IJMET)") INTERNATIONAL International Journal of Mechanical JOURNAL Engineering OF MECHANICAL and Technology (IJMET), ENGINEERING ISSN 0976 AND TECHNOLOGY (IJMET) ISSN 0976 6340 (Print) ISSN 0976 6359 (Online) Volume
INTERNATIONAL International Journal of Mechanical JOURNAL Engineering OF MECHANICAL and Technology (IJMET), ENGINEERING ISSN 0976 AND TECHNOLOGY (IJMET) ISSN 0976 6340 (Print) ISSN 0976 6359 (Online) Volume
PREDICTION OF PISTON SLAP OF IC ENGINE USING FEA BY VARYING GAS PRESSURE
 PREDICTION OF PISTON SLAP OF IC ENGINE USING FEA BY VARYING GAS PRESSURE V. S. Konnur Department of Mechanical Engineering, BLDEA s Engineering College, Bijapur, Karnataka, (India) ABSTRACT The automotive
Application of ABAQUS to Analyzing Shrink Fitting Process of Semi Built-up Type Marine Engine Crankshaft
 Application of ABAQUS to Analyzing Shrink Fitting Process of Semi Built-up Type Marine Engine Crankshaft Jae-Cheol Kim, Dong-Kwon Kim, Young-Duk Kim, and Dong-Young Kim System Technology Research Team,
DESIGN AND ANALYSIS OF PRE- INSERTION RESISTOR MECHANISM
 DESIGN AND ANALYSIS OF PRE- INSERTION RESISTOR MECHANISM Bhavik Bhesaniya 1, Nilesh J Parekh 2, Sanket Khatri 3 1 Student, Mechanical Engineering, Nirma University, Ahmedabad 2 Assistant Professor, Mechanical
Test Which component has the highest Energy Density? A. Accumulator. B. Battery. C. Capacitor. D. Spring.
 Test 1 1. Which statement is True? A. Pneumatic systems are more suitable than hydraulic systems to drive powerful machines. B. Mechanical systems transfer energy for longer distances than hydraulic systems.
Design, Analysis& Optimization of Truck chassis- Rail & Cross member
 Design, Analysis& Optimization of Truck chassis- Rail & Cross member Mr. Jinto Joju Thaikkattil 1, Gayatri Patil 2 1 PGScholar, Department of Mechanical Engg., KJCOEMR, Pune, jjt7171@gmail.com 2 Assistant
ANALYSIS OF SURFACE CONTACT STRESS FOR A SPUR GEAR OF MATERIAL STEEL 15NI2CR1MO28
 ANALYSIS OF SURFACE CONTACT STRESS FOR A SPUR GEAR OF MATERIAL STEEL 15NI2CR1MO28 D. S. Balaji, S. Prabhakaran and J. Harish Kumar Department of Mechanical Engineering, Chennai, India E-Mail: balajimailer@gmail.com
MODELING SUSPENSION DAMPER MODULES USING LS-DYNA
 MODELING SUSPENSION DAMPER MODULES USING LS-DYNA Jason J. Tao Delphi Automotive Systems Energy & Chassis Systems Division 435 Cincinnati Street Dayton, OH 4548 Telephone: (937) 455-6298 E-mail: Jason.J.Tao@Delphiauto.com
Design, Analysis &Optimization of Crankshaft Using CAE
 Design, Analysis &Optimization of Crankshaft Using CAE Dhekale Harshada 1, Jagtap Ashwini 2, Lomte Madhura 3, Yadav Priyanka 4 1,2,3,4 Government College of Engineering and Research Awasari, Department
Gearheads H-51. Gearheads for AC Motors H-51
 Technical Reference H-51 for AC Since AC motor gearheads are used continuously, primarily for transmitting power, they are designed with priority on ensuring high permissible torque, long life, noise reduction
Design and Analysis of Go-kart Chassis
 Design and Analysis of Go-kart Chassis Sannake Aniket S. 1, Shaikh Sameer R. 2, Khandare Shubham A. 3 Prof. S.A.Nehatrao 4 1,2,3 BE Student, mechanical Department, N.B.Navale Sinhagad College Of Engineering,
MARINE FOUR-STROKE DIESEL ENGINE CRANKSHAFT MAIN BEARING OIL FILM LUBRICATION CHARACTERISTIC ANALYSIS
 POLISH MARITIME RESEARCH Special Issue 2018 S2 (98) 2018 Vol. 25; pp. 30-34 10.2478/pomr-2018-0070 MARINE FOUR-STROKE DIESEL ENGINE CRANKSHAFT MAIN BEARING OIL FILM LUBRICATION CHARACTERISTIC ANALYSIS
Technical Math 2 Lab 3: Garage Door Spring 2018
 Name: Name: Name: Name: As you may have determined the problem is a broken spring (clearly shown on the left in the picture below) which needs to be replaced. I. Garage Door Basics: Common residential
bearing to conform to the same elliptical shape as the wave generator plug.
 32 Gear Product News April 2006 t h e b a s i c s o f H a r m o n i c D r i v e G e a r i n g Anthony Lauletta H armonic drives were invented in the late 1950s and have been a major part of the motion
Special edition paper
 Efforts for Greater Ride Comfort Koji Asano* Yasushi Kajitani* Aiming to improve of ride comfort, we have worked to overcome issues increasing Shinkansen speed including control of vertical and lateral
LESSON Transmission of Power Introduction
 LESSON 3 3.0 Transmission of Power 3.0.1 Introduction Earlier in our previous course units in Agricultural and Biosystems Engineering, we introduced ourselves to the concept of support and process systems
INTERNATIONAL JOURNAL OF PURE AND APPLIED RESEARCH IN ENGINEERING AND TECHNOLOGY
 INTERNATIONAL JOURNAL OF PURE AND APPLIED RESEARCH IN ENGINEERING AND TECHNOLOGY A PATH FOR HORIZING YOUR INNOVATIVE WORK DESIGN, ANALYSIS AND OPTIMIZATION OF PISTON OF 180CC ENGINE USING CAE TOOLS NIKHIL
STUDY AND ANALYSIS OF CONNECTING ROD PARAMETERS USING ANSYS
 International Journal of Mechanical Engineering and Technology (IJMET) Volume 7, Issue 4, July Aug 2016, pp.212 220, Article ID: IJMET_07_04_022 Available online at http://www.iaeme.com/ijmet/issues.asp?jtype=ijmet&vtype=7&itype=4
THE CVT TRUTH VS. MYTH. NOTE: PLEASE REFER TO BULLETIN F01-02 on OneAGCO FOR THE EX- PLANATION OF HOW THE CVT WORKS.
 PRODUCT MARKETING BULLETIN THE CVT ALL DEALERS BULLETIN APRIL 19, 2006 TRUTH VS. MYTH NOTE: PLEASE REFER TO BULLETIN F01-02 on OneAGCO FOR THE EX- PLANATION OF HOW THE CVT WORKS. INTRODUCTION:: Throughout
The sphere roller Less is more!
 The sphere roller Less is more! Heinrich Hofmann Rainer Eidloth Dr. Robert Plank Gottfried Ruoff 109 8 The sphere roller Introduction Wheel supported by balls It started with the point, then along came
SAE Baja - Drivetrain
 SAE Baja - Drivetrain By Ricardo Inzunza, Brandon Janca, Ryan Worden Team 11A Concept Generation and Selection Document Submitted towards partial fulfillment of the requirements for Mechanical Engineering
Riverhawk Company 215 Clinton Road New Hartford NY (315) Free-Flex Flexural Pivot Engineering Data
 Free-Flex Flexural Pivot Engineering Data") Riverhawk Company 215 Clinton Road New Hartford NY (315)768-4937 Free-Flex Flexural Pivot Engineering Data PREFACE Patented Flexural Pivot A unique bearing concept for applications with limited angular
Riverhawk Company 215 Clinton Road New Hartford NY (315)768-4937 Free-Flex Flexural Pivot Engineering Data PREFACE Patented Flexural Pivot A unique bearing concept for applications with limited angular
High Capacity Tapered Roller Bearings
 NTN TECHNICAL REVIEW No.73 New Product High Capacity Tapered Roller Bearings - Super Low Torque High Rigidity Tapered Roller Bearings - Takashi TSUJIMOTO Jiro MOCHIZUKI Tapered roller bearing have greater
ENHANCED ROTORDYNAMICS FOR HIGH POWER CRYOGENIC TURBINE GENERATORS
 The 9th International Symposium on Transport Phenomena and Dynamics of Rotating Machinery Honolulu, Hawaii, February -1, ENHANCED ROTORDYNAMICS FOR HIGH POWER CRYOGENIC TURBINE GENERATORS Joel V. Madison
Heat treatment Elimination in Forged steel Crankshaft of Two-stage. compressor.
 Research Journal of Engineering Sciences ISSN 2278 9472 Heat treatment Elimination in Forged steel Crankshaft of Two-stage Compressor Abstract Lakshmanan N. 1, Ramachandran G.M. 1 and Saravanan K. 2 1
126 Ridge Road Tel: (607) PO Box 187 Fax: (607)
 PO Box 187 Fax: (607)") 1. Summary Finite element modeling has been used to determine deflections and stress levels within the SRC planar undulator. Of principal concern is the shift in the magnetic centerline and the rotation
1. Summary Finite element modeling has been used to determine deflections and stress levels within the SRC planar undulator. Of principal concern is the shift in the magnetic centerline and the rotation
A STUDY ON THE PROPELLER SHAFT OF CAR USING CARBON COMPOSITE FIBER FOR LIGHT WEIGHT
 International Journal of Mechanical Engineering and Technology (IJMET) Volume 9, Issue 5, May 2018, pp. 603 611, Article ID: IJMET_09_05_066 Available online at http://www.iaeme.com/ijmet/issues.asp?jtype=ijmet&vtype=9&itype=5
Kolbenschmidt Pierburg Group
 Kolbenschmidt Pierburg Group KS Aluminum Pistons for Truck Applications Requirements The development of on- and off-highway diesel engines for a wide spectrum of applications is affected by global emission
Waste Heat Recovery from an Internal Combustion Engine
 Waste Heat Recovery from an Internal Combustion Engine Design Team Josh Freeman, Matt McGroarty, Rob McGroarty Greg Pellegrini, Ming Wood Design Advisor Professor Mohammed Taslim Abstract A substantial
Mathematical modeling of the electric drive train of the sports car
 1 Portál pre odborné publikovanie ISSN 1338-0087 Mathematical modeling of the electric drive train of the sports car Madarás Juraj Elektrotechnika 17.09.2012 The present electric vehicles are using for
Increase Factor of Safety of Go-Kart Chassis during Front Impact Analysis
 IJIRST International Journal for Innovative Research in Science & Technology Volume 3 Issue 04 September 2016 ISSN (online): 2349-6010 Increase Factor of Safety of Go-Kart Chassis during Front Impact Analysis
Gearless Power Transmission-Offset Parallel Shaft Coupling
 Gearless Power Transmission-Offset Parallel Shaft Coupling Mahantesh Tanodi 1, S. B. Yapalaparvi 2, Anand. C. Mattikalli 3, D. N. Inamdar 2, G. V. Chiniwalar 2 1 PG Scholar, Department of Mechanical Engineering,
Design, Analysis & Balancing of 5 Cylinder Engine Crankshaft
 International OPEN ACCESS Journal Of Modern Engineering Research (IJMER) Design, Analysis & Balancing of 5 Cylinder Engine Crankshaft Yogesh S. Khaladkar 1, Lalit H. Dorik 2, Gaurav M. Mahajan 3, Anil
Introduction to Manual Transmissions & Transaxles
 Introduction to Manual Transmissions & Transaxles Learning Objectives: 1. Identify the purpose and operation of transmissions. 2. Describe torque and torque multiplication. 3. Determine gear ratios. 4.
Gauge Face Wear Caused with Vehicle/Track Interaction
 Gauge Face Wear Caused with Vehicle/Track Interaction Makoto ISHIDA*, Mitsunobu TAKIKAWA, Ying JIN Railway Technical Research Institute 2-8-38 Hikari-cho, Kokubunji-shi, Tokyo 185-8540, Japan Tel: +81-42-573-7291,
Reduction of Self Induced Vibration in Rotary Stirling Cycle Coolers
 Reduction of Self Induced Vibration in Rotary Stirling Cycle Coolers U. Bin-Nun FLIR Systems Inc. Boston, MA 01862 ABSTRACT Cryocooler self induced vibration is a major consideration in the design of IR
COMPARISON OF ANALYTICAL & FEA OF CONTACT ANALYSIS OF SPUR GEAR DRIVE
 COMPARISON OF ANALYTICAL & FEA OF CONTACT ANALYSIS OF SPUR GEAR DRIVE Sachin Almelkar 1, Prof I.G.Bhavi 2 1M.Tech (Machine Design). B L D E A s Dr.P.G. Halakatti College Of Engineering and Technology,Vijayapur,
Steel Intensive Engine Executive Summary
 a business unit of AISI www.smdisteel.org Steel Intensive Engine Executive Summary 2013 Contributors MAHLE Long Products Market Development Group members: Gerdau Nucor Corporation The Timkin Company Presentation
Technical Trend of Bearings for Automotive Drive Train
 SURVEY Technical Trend of Bearings for Automotive Drive Train M. KITAMURA Circumstances surrounding the automobile industry require improvement in fuel efficiency and reduction of CO 2 gas emission in
DESIGN OF MACHINE MEMBERS - I
 R10 Set No: 1 III B.Tech. I Semester Regular and Supplementary Examinations, December - 2013 DESIGN OF MACHINE MEMBERS - I (Mechanical Engineering) Time: 3 Hours Max Marks: 75 Answer any FIVE Questions
MULTI-PARAMETER OPTIMIZATION OF BRAKE OF PISTON
 3 2 1 MULTI-PARAMETER OPTIMIZATION OF BRAKE OF PISTON Á. Horváth 1, I. Oldal 2, G. Kalácska 1, M. Andó 3 Institute for Mechanical Engineering Technology, Szent István University, 2100 Gödöllő, Páter Károly
Design And Analysis Of Two Wheeler Front Wheel Under Critical Load Conditions
 Design And Analysis Of Two Wheeler Front Wheel Under Critical Load Conditions Tejas Mulay 1, Harish Sonawane 1, Prof. P. Baskar 2 1 M. Tech. (Automotive Engineering) students, SMBS, VIT University, Vellore,
lea) shows a compression type. These couplings are used for
 shows a compression type. These couplings are used for") Mechanical Equipment - Course 230.1 SHAFT COUPLINGS Couplings Couplings are used to join two shafts provide some means of transmitting power source to a driven member. There are two tiona of couplings,
Mechanical Equipment - Course 230.1 SHAFT COUPLINGS Couplings Couplings are used to join two shafts provide some means of transmitting power source to a driven member. There are two tiona of couplings,
Continuously Variable Transmission
 Continuously Variable Transmission TECHNICAL FIELD The present invention relates to a transmission, and more particularly, a continuously variable transmission capable of a continuous and constant variation
Chapter 7: Thermal Study of Transmission Gearbox
 Chapter 7: Thermal Study of Transmission Gearbox 7.1 Introduction The main objective of this chapter is to investigate the performance of automobile transmission gearbox under the influence of load, rotational
Stress Analysis of Engine Camshaft and Choosing Best Manufacturing Material
 Stress Analysis of Engine Camshaft and Choosing Best Manufacturing Material Samta Jain, Mr. Vikas Bansal Rajasthan Technical University, Kota (Rajasathan), India Abstract This paper presents the modeling
FEA of the Forged Steel Crankshaft by Hypermesh
 Global Journal of Researches in Engineering Mechanical and Mechanics Engineering Volume 13 Issue 4 Version 1.0 Year 2013 Type: Double Blind Peer Reviewed International Research Journal Publisher: Global
Static Analysis of Crankcase for Single Cylinder High Speed Diesel Engine
 Static Analysis of Crankcase for Single Cylinder High Speed Diesel Engine G.A.Bhosale Department of Mechanical Engineering Dean Academic, Yashwantrao Bhonsale polytechnic, sawantwadi Dr. V.V. Kulkarni
Chapter 4. Vehicle Testing
 Chapter 4 Vehicle Testing The purpose of this chapter is to describe the field testing of the controllable dampers on a Volvo VN heavy truck. The first part of this chapter describes the test vehicle used