Port Disruption Drayage Impacts
|
|
|
- Kerrie Melton
- 6 years ago
- Views:
Transcription

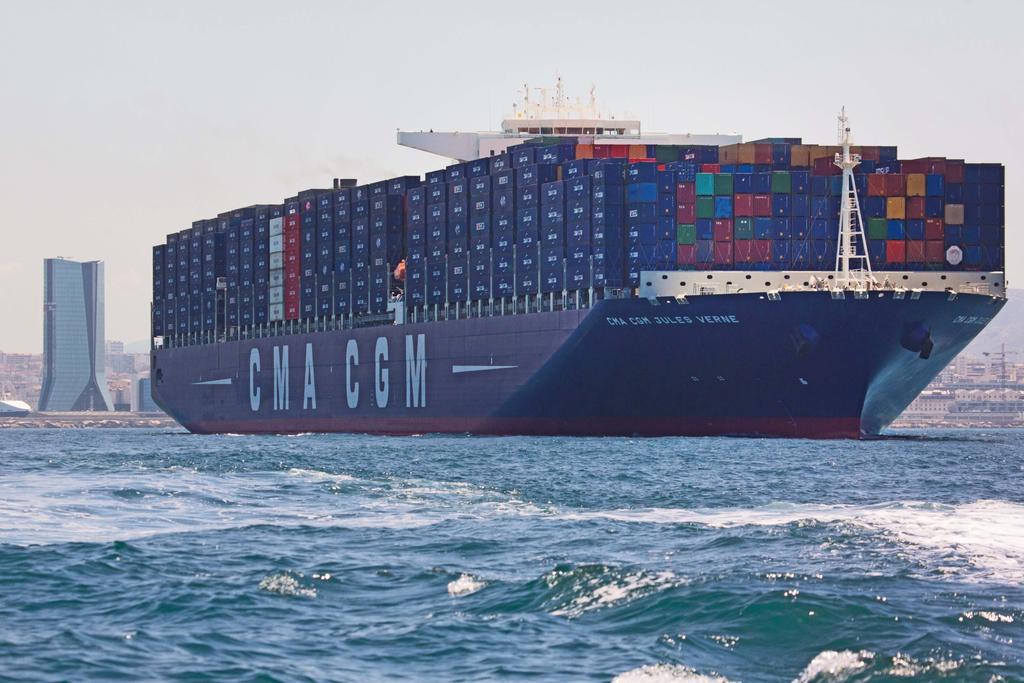
1 Tioga Port Disruption Drayage Impacts Dan Smith The Tioga Group, Inc. TRB Summer Meeting June 2015
2 Congestion and Disruption Background North American congestion trend Post-recession trade recovery and growth Ocean carrier self help actions create more work for terminals and draymen Nov 2014-Feb 2015 West Coast labor disruption ILWU slowdown and manning shortfalls Spot truck and chassis inspection delays Diversion to East Coast, Gulf Coast, and Canada Feb 2015 Present Background congestion trend continues Uncertainty over new labor contract East Coast ports coping with diversions 2
3 West Coast Trade Recovery and Growth US West Coast (ILWU) ports have nearly recovered their 2006 peak volumes Diversion to East, Gulf, and Canada, but how much? 3% Growth 3

4 East Coast Trade Recovery and Growth US East Coast ports benefitted from both growth and coastal diversion Intra-coastal diversion from congested major ports 7% Growth 4
5 Background Congestion Trend Ocean carrier cost-cutting is driving up landside costs and congestion Larger vessels cause terminal peaking Late vessels cause congestion and worse peaking VSAs create more terminal work and trucker trips Chassis supply exit increases trucker & MTO time, trips, and cost Terminal stacking adds workload, delay, and cost Bottom line: additional trips, longer turn times, more driver hours, and higher costs to handle equivalent cargo volumes 5
6 Fiction 6


7 Fact 7


8 Unreliable Vessels Vessel schedules were already unreliable on the eve of the labor slowdown Larger ships are less reliable 8


 MSC Francesca (7H8-526S) Santa Roberta (SRB-09E25) o Mon 2 nd shift: Frisia Rotterdam (S34-1515) Reliance (959-386S) Seaspan Dalian (SPDN-09E24) HS Colon (HSCO-08W19) CSCL East")
9 Real World Complexity West Coast Dear Valued Customers, Please be advised of Global Gateway South s empty receiving for: Tuesday, June 16th, second shift and Wednesday, June 17th, first shift and second shifts ***GGS EMPTY RECEIVING*** LINE 20 40ST 40HC 45 REEFERS SPECIAL EQUIPMENT MOL ***SHUT OUT*** HMM *** SHUT OUT*** NYK YES YES YES YES NO NO OCL ***SHUT OUT*** MAE YES YES YES YES NO NO ***SHUT OUT*** Bare Chassis Preferred Return Locations: For Wednesday 6/17/2015-2nd Shift 20 TraPac 40 TraPac / YTI / BNSF 45 YTI / BNSF / APMT All HDMZ chassis are to go to RCC Please contact SSL for return locations on chassis with Gensets Do NOT pick-up 20 /40 /45 bare chassis from ICTF unless authorized by Pool of Pools. Penalties will apply. DCLP Logistics Support Line: (657) APM Terminals, Pier 400 Los Angeles RESTRICTIONS: Dual transactions: o All Single transactions being processed EMPTY IN Restrictions: APMT will NOT receive: o APL, CSAV CNI,COS, HamburgSud, Matson, Safmarine, NYK, OOCL Chassis Restrictions: o APMT will NOT receive WCCP chassis o APMT will NOT receive EVERGREEN chassis Export Receiving Restrictions: receiving ONLY for following vessels: o Mon 1 st shift: Frisia Rotterdam (S ) Reliance ( S) Seaspan Dalian (SPDN-09E24) HS Colon (HSCO-08W19) CSCL East China Sea (ECS-1523W) Ever Useful (EUS-109W) MSC Francesca (7H8-526S) Santa Roberta (SRB-09E25) o Mon 2 nd shift: Frisia Rotterdam (S ) Reliance ( S) Seaspan Dalian (SPDN-09E24) HS Colon (HSCO-08W19) CSCL East China Sea (ECS-1523W) Ever Useful (EUS-109W) MSC Francesca (7H8-526S) Santa Roberta (SRB-09E25) Dear Valued Customers, ATTENTION: Due to high volume of traffic, please be advised that all import pick-ups will stop at 1430 today for both single and dual transactions. YTI will resume normal operations beginning at 0700 on 6/15/15. Thank You for your Business, YTI Management Team 9

10 Real World Complexity East Coast Port of Virginia Daily Empty Return Matrix for June 18 10


11 Oakland Outer Harbor June, 2007 Wheeled CY: two longshore moves, one trucker move 11


12 Oakland Outer Harbor June, 2014 Stacked CY: four longshore moves, two trucker moves 12
13 Drayage Impacts More Trips Complex and changing container supply and return rules Chassis supply and chassis relocation trips Dry runs due to cutoffs and trouble tickets Longer Queues Additional gate moves due to more trips Megaship-induced peaking Terminal congestion and cumulative delays Longer terminal turn times Chassis lot searches Stacking and digging VSA complexity CY congestion Labor slowdowns Labor shortfalls and terminal closures 13
14 Drayage Outcomes Reduced capacity Near-term tractor, driver, and HOS supply is fixed or declining Additional trips and longer turn times have dramatically cut overall drayage capacity Reduced capacity leads to longer terminal container dwells, CY congestion, and service failures Loss of drivers Awful working conditions and reduced earnings leading to driver exit LMCs have been unsuccessful in restoring driver pool despite congestion payments and signing bonuses Overall drayage capacity has been further reduced, and pressures for unionization are rising Increased cost and emissions Increased labor, fuel, and capital cost of drayage More miles and engine time increases emissions per TEU Additional trips, surcharges, wait time payments add customer cost Delays are leading to massive demurrage and per diem charges 14
15 Southern California Drayage Impacts Southern California draymen currently handle about 4.5 million containers annually Every minute of average turn time anywhere Uses 80,000 hours of driver time Generates 3 tons of NOx Uses 200,000 gallons of diesel fuel Releases 2,000 tons of CO 2 Costs customers $4.5 million Every mile of average trip length anywhere Uses 197,000 hours of driver time Generates 48 tons of NOx Uses 1.4 million gallons of diesel fuel Releases 14,000 tons of CO 2 Costs customers $12.8 million 15
16 National Congestion Impacts In 2014 about 20 million containers were drayed to and from major U.S. ports 30 minutes of added turn time in queues or terminals Used 10 million hours of driver time Generated 485 tons of NOx Used 26 million gallons of diesel fuel Released 266,000 tons of CO 2 Cost customers $452 million 5 miles of added trip length Used 4.3 million hours of driver time Generated 1,543 tons of NOx Used 30 million gallons of diesel fuel Release 312,000 tons of CO 2 Cost customers $280 million 16
17 National Disruption Impacts LALB, Oakland, NYNJ, and Virginia were the congestion hotspots in November 2014-March 2015 About 4 million containers were drayed to and from those ports in 4Q14-1Q15 One extra hour of idling in terminal queues or on the terminal Used 4 million hours of driver time Generated 194 tons of NOx Used 10 million gallons of diesel fuel Released 106,000 tons of CO 2 Cost customers $181 million 17
18 Summary Background trends traceable to ocean carrier strategies have increased terminal and drayage time, cost, and emissions per TEU. Port-recession trade recovery and growth have stressed port and drayage capacity, leading to congestion, delay, and cost. West Coast labor disruption exacerbated port congestion and drayage impacts. Post-disruption congestion trends remain unfavorable, drayage costs are rising, and drayage capacity is falling. 18
Truck Drayage Metrics
 Truck Drayage Metrics Frank Harder The Group, Inc. AAPA/EDF Environmental Performance Metrics Workshop October 10, 2012 www.tiogagroup.com/215-557-2142 Key Questions and Answers Key questions Where are
Georgia Ports Authority
 Georgia Ports Authority September 3, 2014 1 Columbus Bainbridge Savannah Brunswick PORTS ACROSS GEORGIA Savannah Garden City Terminal Ocean Terminal Brunswick Mayor s Point Terminal Colonel s Island Terminal
Jason Hilsenbeck LoadMatch & Drayage.com President Founder
 Jason Hilsenbeck LoadMatch & Drayage.com President Founder Phonebook of Draymen 2000+ unique draymen profiles listed (last year at this time was 1900 draymen) Search draymen in USA & Canada for chassis,
Current Trends in the Development of Green Ports. APP 102 nd Annual Conference August 16-19, 2015 Kaohsiung, Taiwan
 Current Trends in the Development of Green Ports APP 102 nd Annual Conference August 16-19, 2015 Kaohsiung, Taiwan Agenda Introduction to M&N Services Current Trends in the Development of Green Ports Development
THE PORT OF LOS ANGELES OCCUPIES 4,300 ACRES OF LAND ALONG 43 MILES OF WATERFRONT. THE PORT OF LOS ANGELES IS THE LARGEST PORT IN THE
 THE PORT OF LOS ANGELES OCCUPIES 4,300 ACRES OF LAND ALONG 43 MILES OF WATERFRONT. THE PORT OF LOS ANGELES IS THE LARGEST PORT IN THE U.S. AND 13TH LARGEST WORLDWIDE. THE PORT OF LONG BEACH IS THE SECOND
LEADING GATEWAY FOR U.S.-ASIA TRADE
 PORT OF LONG BEACH LEADING GATEWAY FOR U.S.-ASIA TRADE 4 STATE TIDELANDS TRUST PROMOTE TRADE, BUILD PORT 6 PORT OF LOS ANGELES PORT OF LONG BEACH WORLD S 9 TH BUSIEST PORT COMPLEX *BASED ON 2017 CONTAINER
ALAMEDA CORRIDOR. A A Project of National Significance. TRB Summer Conference MTS as a Component of the Nation s Transportation System June 25, 2002
 ALAMEDA CORRIDOR A A Project of National Significance TRB Summer Conference MTS as a Component of the Nation s Transportation System June 25, 2002 Top U.S. Container Ports (2001) LOS ANGELES 5.18 LONG
Goods Movement Plans. Summary of Needs Assessments. January 21, 2015 GOODS MOVEMENT COLLABORATIVE AND GOODS MOVEMENT PLAN 6
 Goods Movement Plans Summary of Needs Assessments January 21, 2015 GOODS MOVEMENT COLLABORATIVE AND GOODS MOVEMENT PLAN 6 Goods Movement Vision and Goals GOODS MOVEMENT COLLABORATIVE AND GOODS MOVEMENT
Port of Seattle: Where a Sustainable World is Headed Sarah Flagg Seaport Air Quality Program Manager Port of Seattle
 Port of Seattle: Where a Sustainable World is Headed Sarah Flagg Seaport Air Quality Program Manager Port of Seattle AAPA Port Operations, Safety & Information Technology Seminar Seminar 1 June 11, 2009
SmartWay DrayFLEET TRUCK DRAYAGE ENVIRONMENT AND ENERGY MODEL
 SmartWay DrayFLEET TRUCK DRAYAGE ENVIRONMENT AND ENERGY MODEL Version 1.0User s Guide June 10, 2008 The Group, Inc. Dowling Associates, Inc. Prepared for: U.S. Environmental Protection Agency June 2008
Comprehensive Regional Goods Movement Plan and Implementation Strategy Goods Movement in the 2012 RTP/SCS
 Comprehensive Regional Goods Movement Plan and Implementation Strategy Goods Movement in the 2012 RTP/SCS Annie Nam Southern California Association of Governments September 24, 2012 The Goods Movement
RELATIONSHIP BETWEEN STEEL IMPORTS AND U.S. STEEL INDUSTRY CAPACITY UTILIZATION
 RELATIONSHIP BETWEEN STEEL IMPORTS AND U.S. STEEL INDUSTRY CAPACITY UTILIZATION Prepared by: Martin Associates www.martinassoc.net 941 Wheatland Ave., Suite 203 Lancaster, PA 17603 April 18, 2018 Justification
World Wheat Supply and Demand Situation December 2018
 World Wheat Supply and Demand Situation December 218 Major data source: USDA World Agricultural Supply and Demand Estimates released December 11, 218. Projections will change over the course of the year
World Wheat Supply and Demand Situation
 World Wheat Supply and Demand Situation November 218 Major data source: USDA World Agricultural Supply and Demand Estimates released November, 218. Projections will change over the course of the year depending
2017 U.S. Ethanol Exports and Imports. Statistical Summary Renewable Fuels Association. All Rights Reserved.
 2017 U.S. Ethanol Exports and Imports Statistical Summary 2018 Renewable Fuels Association. All Rights Reserved. 2017 U.S. ETHANOL EXPORTS Annual U.S. Ethanol Exports 1, 1, 1,000 800 600-1,367 1,193 1,169
2014 STATE OF THE PORT State of the Port Address
 2014 STATE OF THE PORT 2014 State of the Port Address 2014 STATE OF THE PORT Curtis J. Foltz Georgia Ports Authority 2014 STATE OF THE PORT Record Year Environmental Sustainability New Infrastructure Last-Mile
International Economic Outlook Impact on Global Shipping. International Propeller Club Convention Tampa, FL
 International Economic Outlook Impact on Global Shipping International Propeller Club Convention Tampa, FL Captain John W. Murray October 7, 2010 Hapag-Lloyd The Company Headquarters in Hamburg, Germany
Middle Harbor Project: Draft EIS/EIR LA Chamber of Commerce June 26, 2008, APM Maersk HQ Pier 400
 Middle Harbor Project: Draft EIS/EIR LA Chamber of Commerce June 26, 2008, APM Maersk HQ Pier 400 Richard D. Cameron Director of Environmental Planning, Port of Long Beach CEQA/NEPA Process Summary The
Landside Access Modernization Program (LAMP)
") Landside Access Modernization Program (LAMP) LAX Los Angeles International Airport is the 2 nd busiest airport in the United States and is the largest airport in California. Since the start of the economic
Landside Access Modernization Program (LAMP) LAX Los Angeles International Airport is the 2 nd busiest airport in the United States and is the largest airport in California. Since the start of the economic
AAPA Shifting International Trade Routes Program Highway Perspectives
 AAPA Shifting International Trade Routes Program Highway Perspectives Joe Morrissey President & CEO CTL Transportation, LLC (a subsidiary of Comcar Industries, Inc.) Comcar Industries, Inc. Founded in
California s Emission Reduction Plan for Ports and International Goods Movement
 California s Emission Reduction Plan for Ports and International Goods Movement Alternative Maritime Power Conference Los Angeles Harbor Hotel April 24, 2006 California Environmental Protection Agency
WE CARRY THE FUTURE SM
 Date: October 12, 2011 Subject: Change in US Chassis Dynamics and Operations with Q & A HMM has made the decision to stop supplying chassis in below mentioned locations. This new policy will improve safety
August 11, Bob Costello Senior Vice President & Chief Economist American Trucking Associations
 Economic & Industry Update for U.S. Bank Are You Prepared For An Industry Acceleration? August 11, 2015 Bob Costello Senior Vice President & Chief Economist American Trucking Associations Twitter: @ATAEconBob
World Wheat Supply and Demand Situation October 2018
 World Wheat Supply and Demand Situation October 218 Major data source: USDA World Agricultural Supply and Demand Estimates released October 12, 218. Projections will change over the course of the year
Autonomous taxicabs in Berlin a spatiotemporal analysis of service performance. Joschka Bischoff, M.Sc. Dr.-Ing. Michal Maciejewski
 Autonomous taxicabs in Berlin a spatiotemporal analysis of service performance Joschka Bischoff, M.Sc. Dr.-Ing. Michal Maciejewski Mobil.TUM 2016, 7 June 2016 Contents Motivation Methodology Results Conclusion
RAILYARDS SUPPORT A VARIETY OF OPERATIONS INCLUDING: LOCOMOTIVES, ON-ROAD AND OFF-ROAD TRUCKS, CARGO-HANDLING EQUIPMENT, TRANSPORTATION
 RAILYARDS SUPPORT A VARIETY OF OPERATIONS INCLUDING: LOCOMOTIVES, ON-ROAD AND OFF-ROAD TRUCKS, CARGO-HANDLING EQUIPMENT, TRANSPORTATION REFRIGERATION UNITS AND MAINTENANCE SHOPS. CHAPTER FIVE railyards
Jet Fuel Purchases Airline Perspective. February 12, 2009
 Jet Fuel Purchases Airline Perspective February 12, 2009 DECISION CRITERIA The jet fuel supply chain is very complex because it requires coordination among suppliers, airlines, pipelines, storage facilities
REALIZING THE AIR QUALITY BENEFITS OF PORT INFRASTRUCTURE PROJECTS. A Case Study of the Alameda Corridor
 REALIZING THE AIR QUALITY BENEFITS OF PORT INFRASTRUCTURE PROJECTS A Case Study of the Alameda Corridor April 29, 25 Dr. Margaret Lobnitz, Weston Solutions, Inc. 1 BACKGROUND In mid-198 s, growing concern
A.P. Møller-Mærsk A/S Q report
 A.P. Møller-Mærsk A/S Q3 2017 report Date 7 November 2017 Conference call Webcast 11:00 am CET www.investor.maersk.com Interim report Q3 2017 Page 2 Forward-looking Statements This presentation contains
2020 SULPHUR CAP INTRODUCING MSC S BUNKER CHARGE MECHANISM FOR December 2018
 2020 SULPHUR CAP INTRODUCING MSC S BUNKER CHARGE MECHANISM FOR 2019 1 December 2018 LOW SULPHUR 2020 SCENARIO The UN International Maritime Organization requires that from 1 January 2020, Sulphur content
AAPA Shifting Trade Patterns An Ocean (Container) Carrier s Perspective
 Carrier s Perspective") AAPA Shifting Trade Patterns An Ocean (Container) Carrier s Perspective January 2015 Today s Agenda Review the present Take a look back at proved to be a pretty good year by.. container shipping standards
AAPA Shifting Trade Patterns An Ocean (Container) Carrier s Perspective January 2015 Today s Agenda Review the present Take a look back at proved to be a pretty good year by.. container shipping standards
Emission Reduction Credit Availability/Cost/Efforts Taken in South Coast
 Emission Reduction Credit Availability/Cost/Efforts Taken in South Coast Los Angeles Area Chamber of Commerce Environment Committee Meeting November 28, 27, Wednesday L.A. Area Chamber of Commerce Headquarters
2012 Air Emissions Inventory
 SECTION 6 HEAVY-DUTY VEHICLES This section presents emissions estimates for the heavy-duty vehicles (HDV) source category, including source description (6.1), geographical delineation (6.2), data and information
Used Vehicle Supply: Future Outlook and the Impact on Used Vehicle Prices
 Used Vehicle Supply: Future Outlook and the Impact on Used Vehicle Prices AT A GLANCE When to expect an increase in used supply Recent trends in new vehicle sales Changes in used supply by vehicle segment
World Wheat Supply and Demand Situation August 2018
 World Wheat Supply and Demand Situation August 218 Major data source: USDA World Agricultural Supply and Demand Estimates released August 1, 218. Projections will change over the course of the year depending
Performance Measure Summary - Large Area Sum. Performance Measures and Definition of Terms
 Performance Measure Summary - Large Area Sum There are several inventory and performance measures listed in the pages of this Urban Area Report for the years from 1982 to 2014. There is no single performance
Performance Measure Summary - Medium Area Sum. Performance Measures and Definition of Terms
 Performance Measure Summary - Medium Area Sum There are several inventory and performance measures listed in the pages of this Urban Area Report for the years from 1982 to 2014. There is no single performance
Transportation & Logistics Council
 Transportation & Logistics Council March 2015 Jeff Mason Executive Vice President, ATA Publisher, Transport Topics Trucking Economic Update Billions of Tons Trucking s Importance to the Economy Has Surged
DUTCH HARBOR, ALASKA
 DUTCH HARBOR, ALASKA North American Emissions Control Area Lessons Learned in California By Captain Jeff Cowan The Current Situation Effective August 01, 2012-International Maritime Organization (IMO)-
Performance Measures and Definition of Terms
 Performance Measure Summary - All 471 Areas Sum There are several inventory and performance measures listed in the pages of this Urban Area Report for the years from 1982 to 2014. There is no single performance
Performance Measure Summary - Austin TX. Performance Measures and Definition of Terms
 Performance Measure Summary - Austin TX There are several inventory and performance measures listed in the pages of this Urban Area Report for the years from 1982 to 2014. There is no single performance
Performance Measure Summary - Pittsburgh PA. Performance Measures and Definition of Terms
 Performance Measure Summary - Pittsburgh PA There are several inventory and performance measures listed in the pages of this Urban Area Report for the years from 1982 to 2014. There is no single performance
Performance Measure Summary - New Orleans LA. Performance Measures and Definition of Terms
 Performance Measure Summary - New Orleans LA There are several inventory and performance measures listed in the pages of this Urban Area Report for the years from 1982 to 2014. There is no single performance
Performance Measure Summary - Portland OR-WA. Performance Measures and Definition of Terms
 Performance Measure Summary - Portland OR-WA There are several inventory and performance measures listed in the pages of this Urban Area Report for the years from 1982 to 2014. There is no single performance
Performance Measure Summary - Oklahoma City OK. Performance Measures and Definition of Terms
 Performance Measure Summary - Oklahoma City OK There are several inventory and performance measures listed in the pages of this Urban Area Report for the years from 1982 to 2014. There is no single performance
Performance Measure Summary - Buffalo NY. Performance Measures and Definition of Terms
 Performance Measure Summary - Buffalo NY There are several inventory and performance measures listed in the pages of this Urban Area Report for the years from 1982 to 2014. There is no single performance
Performance Measure Summary - Seattle WA. Performance Measures and Definition of Terms
 Performance Measure Summary - Seattle WA There are several inventory and performance measures listed in the pages of this Urban Area Report for the years from 1982 to 2014. There is no single performance
Performance Measure Summary - Fresno CA. Performance Measures and Definition of Terms
 Performance Measure Summary - Fresno CA There are several inventory and performance measures listed in the pages of this Urban Area Report for the years from 1982 to 2014. There is no single performance
Performance Measure Summary - Hartford CT. Performance Measures and Definition of Terms
 Performance Measure Summary - Hartford CT There are several inventory and performance measures listed in the pages of this Urban Area Report for the years from 1982 to 2014. There is no single performance
Performance Measure Summary - Boise ID. Performance Measures and Definition of Terms
 Performance Measure Summary - Boise ID There are several inventory and performance measures listed in the pages of this Urban Area Report for the years from 1982 to 2014. There is no single performance
Performance Measure Summary - Tucson AZ. Performance Measures and Definition of Terms
 Performance Measure Summary - Tucson AZ There are several inventory and performance measures listed in the pages of this Urban Area Report for the years from 1982 to 2014. There is no single performance
Performance Measure Summary - Wichita KS. Performance Measures and Definition of Terms
 Performance Measure Summary - Wichita KS There are several inventory and performance measures listed in the pages of this Urban Area Report for the years from 1982 to 2014. There is no single performance
Performance Measure Summary - Spokane WA. Performance Measures and Definition of Terms
 Performance Measure Summary - Spokane WA There are several inventory and performance measures listed in the pages of this Urban Area Report for the years from 1982 to 2014. There is no single performance
Performance Measure Summary - Grand Rapids MI. Performance Measures and Definition of Terms
 Performance Measure Summary - Grand Rapids MI There are several inventory and performance measures listed in the pages of this Urban Area Report for the years from 1982 to 2014. There is no single performance
Performance Measure Summary - Washington DC-VA-MD. Performance Measures and Definition of Terms
 Performance Measure Summary - Washington DC-VA-MD There are several inventory and performance measures listed in the pages of this Urban Area Report for the years from 1982 to 2014. There is no single
Performance Measure Summary - Charlotte NC-SC. Performance Measures and Definition of Terms
 Performance Measure Summary - Charlotte NC-SC There are several inventory and performance measures listed in the pages of this Urban Area Report for the years from 1982 to 2014. There is no single performance
Performance Measure Summary - Toledo OH-MI. Performance Measures and Definition of Terms
 Performance Measure Summary - Toledo OH-MI There are several inventory and performance measures listed in the pages of this Urban Area Report for the years from 1982 to 2014. There is no single performance
Performance Measure Summary - Pensacola FL-AL. Performance Measures and Definition of Terms
 Performance Measure Summary - Pensacola FL-AL There are several inventory and performance measures listed in the pages of this Urban Area Report for the years from 1982 to 2014. There is no single performance
Performance Measure Summary - Omaha NE-IA. Performance Measures and Definition of Terms
 Performance Measure Summary - Omaha NE-IA There are several inventory and performance measures listed in the pages of this Urban Area Report for the years from 1982 to 2014. There is no single performance
Jeffrey D. Wassmer Chairman Rodney W. Oliver Interim Executive Director Virginia Port Authority
 House Appropriations Committee FY2014-FY2016 Capital Outlay Plan January 22, 2014 Jeffrey D. Wassmer Chairman Rodney W. Oliver Interim Executive Director Virginia Port Authority Terminals Serve All of
Performance Measure Summary - Allentown PA-NJ. Performance Measures and Definition of Terms
 Performance Measure Summary - Allentown PA-NJ There are several inventory and performance measures listed in the pages of this Urban Area Report for the years from 1982 to 2014. There is no single performance
2016 U.S. ETHANOL EXPORTS AND IMPORTS
 2016 U.S. ETHANOL EXPORTS AND IMPORTS STATISTICAL SUMMARY Copyright 2017 Renewable Fuels Association. All Rights Reserved 2016 U.S. ETHANOL EXPORTS U.S. Ethanol Exports, 2006-2016 1,200 1,000 800 600 396
Performance Measure Summary - Nashville-Davidson TN. Performance Measures and Definition of Terms
 Performance Measure Summary - Nashville-Davidson TN There are several inventory and performance measures listed in the pages of this Urban Area Report for the years from 1982 to 2014. There is no single
Performance Measure Summary - Corpus Christi TX. Performance Measures and Definition of Terms
 Performance Measure Summary - Corpus Christi TX There are several inventory and performance measures listed in the pages of this Urban Area Report for the years from 1982 to 2014. There is no single performance
TRANSPACIFIC CUSTOMER ADVISORY Implementation of New BAF Formula Effective January 01, 2019
 December 7, 2018 TRANSPACIFIC CUSTOMER ADVISORY Implementation of New BAF Formula Effective January 01, 2019 Dear Valued Customer, Bunker is one of the important cost components for a container shipping
Performance Measure Summary - Boston MA-NH-RI. Performance Measures and Definition of Terms
 Performance Measure Summary - Boston MA-NH-RI There are several inventory and performance measures listed in the pages of this Urban Area Report for the years from 1982 to 2014. There is no single performance
Performance Measure Summary - El Paso TX-NM. Performance Measures and Definition of Terms
 Performance Measure Summary - El Paso TX-NM There are several inventory and performance measures listed in the pages of this Urban Area Report for the years from 1982 to 2014. There is no single performance
Performance Measure Summary - Minneapolis-St. Paul MN-WI. Performance Measures and Definition of Terms
 Performance Measure Summary - Minneapolis-St. Paul MN-WI There are several inventory and performance measures listed in the pages of this Urban Area Report for the years from 1982 to 2014. There is no
Performance Measure Summary - Louisville-Jefferson County KY-IN. Performance Measures and Definition of Terms
 Performance Measure Summary - Louisville-Jefferson County KY-IN There are several inventory and performance measures listed in the pages of this Urban Area Report for the years from 1982 to 2014. There
Logistics Costs: Trends and Implications. Joseph Bryan Managing Director, Global Trade and Transportation Global Insight
 Logistics Costs: Trends and Implications Joseph Bryan Managing Director, Global Trade and Transportation Global Insight Overview Points on trade U.S. freight projections Capacity strains Trends for surface
Pacific Ports Conference on Clean Air Policies and Strategies
 Pacific Ports Conference on Clean Air Policies and Strategies 2006. 12. 13 Overview of Busan Port 2 nd Largest City in Korea World s 5 th Largest Container Port Global Production Base City of Tourism &
Performance Measure Summary - New York-Newark NY-NJ-CT. Performance Measures and Definition of Terms
 Performance Measure Summary - New York-Newark NY-NJ-CT There are several inventory and performance measures listed in the pages of this Urban Area Report for the years from 1982 to 2014. There is no single
CleanAir Logix Environmentally Responsible Logistics Solutions Green Tech Town Hall
 CleanAir Logix Environmentally Responsible Logistics Solutions Green Tech Town Hall June 19, 2008 The Problem Air Quality & Pollution Harmful air pollutants must be dramatically eliminated &/or reduced
World Wheat Supply and Demand Situation
 World Wheat Supply and Demand Situation September 218 Major data source: USDA World Agricultural Supply and Demand Estimates released September 12, 218. Projections will change over the course of the year
World Wheat Supply and Demand Situation March 2018
 World Wheat Supply and Demand Situation March 218 Major data source: USDA World Agricultural Supply and Demand Estimates released March 8, 218. Projections will change over the course of the year depending
GEORGIA PORTS AUTHORITY. The Southeast Gateway for the U.S.
 GEORGIA PORTS AUTHORITY The Southeast Gateway for the U.S. CREATING OPPORTUNITIES THROUGHOUT GEORGIA MISSION STATEMENT Develop, maintain and operate ocean and inland river ports within Georgia; foster
02/02/2011
 www.fundamentalpetroleumtrends.com 2/2/211 WEEKLY GASOLINE FUNDAMENTAL-PRICE-BASIS OUTLOOK A Fundamental Petroleum Trends Weekly Report Lehi German Tel: 816..98 www.fundamentalpetroleumtrends.com Wednesday,
Fuel Focus. Understanding Gasoline Markets in Canada and Economic Drivers Influencing Prices. Issue 24, Volume 8
 Fuel Focus Understanding Gasoline Markets in Canada and Economic Drivers Influencing Prices Issue 24, Volume 8 December, Copies of this publication may be obtained free of charge from: Natural Resources
Supplementary Report. -3rd Quarter of F February 2007 Kawasaki Kisen Kaisha, Ltd.
 Supplementary Report -3rd Quarter of F26 - February 27 Kawasaki Kisen Kaisha, Ltd. 1. Shipping Markets 2. Financial Data 3. Historical Data - For 5 years - Supplemental Information-1 - Shipping Markets
UCLA Lake Arrowhead Conference. October 18, 2010
 BART Click to Capacity edit Master Overview title style for UCLA Lake Arrowhead Conference October 18, 2010 0 BART Basics 360,000 daily riders 104 miles 43 stations 1.3 billion annual passenger miles 1
UCLA Lake Arrowhead Conference. October 18, 2010
 BART Click to Capacity edit Master Overview title style for UCLA Lake Arrowhead Conference October 18, 2010 0 BART Basics 360,000 daily riders 104 miles 43 stations 1.3 billion annual passenger miles 1
NATIONAL CLEAN DIESEL CAMPAIGN & FUNDING DERA, VW, AND SMARTWAY
 NATIONAL CLEAN DIESEL CAMPAIGN & FUNDING DERA, VW, AND SMARTWAY Alison Riley, U.S. EPA, Region 3 Healthy Ports, Vibrant Ports Workshop October 24, 2017 DIESEL AND HEALTH Pollutants: Particulate Matter
UCLA Lake Arrowhead Conference. October 18, 2010
 BART Click to Capacity edit Master Overview title style for UCLA Lake Arrowhead Conference October 18, 2010 0 BART Basics 360,000 daily riders 104 miles 43 stations 1.3 billion annual passenger miles 1
U.S. Rail Crude Oil Traffic
 U.S. Rail Crude Oil Traffic Association of American Railroads November 215 Summary U.S. crude oil production has risen sharply in recent years, with much of the increased output moving by rail. In 28,
Crude Export and the New Dynamics
 27 April 2016 Crude Export and the New Dynamics Mel Larson, Principal Consultant SUPERIOR RESULTS. SUSTAINED. Topics of Interest Crude Export Impact The Great Divide Export to everywhere The US Advantage
THE PARTNERSHIP OF RAIL & COAL MOVING AHEAD 2014 RMCMI ANNUAL MEETING SEPTEMBER 19, 2014
 THE PARTNERSHIP OF RAIL & COAL MOVING AHEAD 2014 RMCMI ANNUAL MEETING SEPTEMBER 19, 2014 1 BNSF is a Leading U.S. Railroad A Berkshire Hathaway company 32,500 route miles in 28 states and two Canadian
GPA s ertg Demonstration Project
 GPA s ertg Demonstration Project Richard Cox General Manager, Equipment & Facilities Engineering, Georgia Ports Authority 2012 Summer Seminar August 5-7, 2012 Garden City Terminal: Today 9 Container Berths
Diesel prices finally ease Winter weather and international events could determine your fuel bill for 2018 By Bryce Knorr, senior grain market analyst
 Diesel prices finally ease Winter weather and international events could determine your fuel bill for 2018 By Bryce Knorr, senior grain market analyst After rallying to their highest level in nearly three
Citrus: World Markets and Trade
 United States Department of Agriculture Foreign Agricultural Service uary 2015 Citrus: World Markets and Trade Oranges Global orange production for is forecast to decline 4 percent from the previous year
Emerging Trends in Petroleum Markets
 Emerging Trends in Petroleum Markets For Defense Logistics Agency, Worldwide Energy Conference Washington, D.C. By T. Mason Hamilton, Petroleum Markets Analyst U.S. Energy Information Administration Independent
Pier B On-Dock Rail Support Facility Project Rail Grade Crossings Analysis
 Pier B On-Dock Rail Support Facility Project Rail Grade Crossings Analysis Prepared for Port of Long Beach Prepared by Cambridge Systematics, Inc. July 2016 www.camsys.com Pier B On-Dock Rail Support Facility
Port of Salalah YOUR LOGISTICS ADVANTAGE
 Port of Salalah YOUR LOGISTICS ADVANTAGE INTRODUCTION Port of Salalah began operations in Nov 1998 and has become one of the most important container and cargo terminals in the region Over 39,153,000 TEU
Rig XSI PUBLIC INDICES. OCEAN FREIGHT November Xeneta Shipping Index (XSI )
") Rig XSI PUBLIC INDICES OCEAN FREIGHT November 2018 Xeneta Shipping Index (XSI ) XSI - Global Index XSI Long-Term Contracts Public Indices - November 2018 The global XSI increased 0.7% in Nov-18 to 109.86
Rig XSI PUBLIC INDICES OCEAN FREIGHT November 2018 Xeneta Shipping Index (XSI ) XSI - Global Index XSI Long-Term Contracts Public Indices - November 2018 The global XSI increased 0.7% in Nov-18 to 109.86
US 81 Bypass of Chickasha Environmental Assessment Public Meeting
 US 81 Bypass of Chickasha Environmental Assessment Public Meeting March 14, 2013 Introductions ODOT FHWA SAIC Meeting Purpose Present need for bypass Provide responses to 10/04/11 public meeting comments
ODOT FUEL USAGE BENEFITS OF IDLE REDUCTION
 ODOT FUEL USAGE BENEFITS OF IDLE REDUCTION Rudolf Diesel Rudolf Diesel constructed the first diesel engine in 1897 This led to an 1898 patent #608,845 for the internal combustion engine. Rudolf proved
Clearing the Air in West Oakland: Port Impacts, Freight Transport & Environmental Justice
 Clearing the Air in West Oakland: Port Impacts, Freight Transport & Environmental Justice Swati Prakash, Pacific Institute (Community Strategies for Sustainability & Justice) & Ditching Dirty Diesel Collaborative
APPENDIX B (FEE SCHEDULE) CENTRALIZED EXAMINATION STATION RATE SCHEDULE. CONSOLIDATED PORT OF DELAWARE RIVER and BAY-PHILADELPHIA, PA
 CENTRALIZED EXAMINATION STATION RATE SCHEDULE. CONSOLIDATED PORT OF DELAWARE RIVER and BAY-PHILADELPHIA, PA") APPENDI B (FEE SCHEDULE) CENTRALIZED EAMINATION STATION RATE SCHEDULE CONSOLIDATED PORT OF DELAWARE RIVER and BAY-PHILADELPHIA, PA Applicants must complete this fee schedule in full. Proposed fees may
APPENDI B (FEE SCHEDULE) CENTRALIZED EAMINATION STATION RATE SCHEDULE CONSOLIDATED PORT OF DELAWARE RIVER and BAY-PHILADELPHIA, PA Applicants must complete this fee schedule in full. Proposed fees may
Into (and Out of?) the Valley
 the Valley") Into (and Out of?) the Valley Rail Traffic Trends in the 2010s Michael W. Blaszak Overall Trends U.S. Overall Trends U.S. Gross Domestic Product U.S. Source: https://fred.stlouisfed.org/series/gdp#0 Overall
Into (and Out of?) the Valley Rail Traffic Trends in the 2010s Michael W. Blaszak Overall Trends U.S. Overall Trends U.S. Gross Domestic Product U.S. Source: https://fred.stlouisfed.org/series/gdp#0 Overall
CMAA Southern California Chapter Dinner Los Angeles World Airports Capital Program
 CMAA Southern California Chapter Dinner Los Angeles World Airports Capital Program Presented by Cynthia Guidry LAWA Capital Programming, Planning and Engineering Group July 23, 2015 2 World s busiest Origin
Inland Truck Shortage in North America. February 2018
 Inland Truck Shortage in North America February 2018 1 Inland Truck Shortage in North America Continues Industry is experiencing severe truck shortages in certain locations in North America Challenges