Quality Assurance Procedures for Chip Seal Operations Using Macrotexture Metrics
|
|
|
- Benjamin Harrison
- 5 years ago
- Views:
Transcription


1 JOINT TRANSPORTATION RESEARCH PROGRAM INDIANA DEPARTMENT OF TRANSPORTATION AND PURDUE UNIVERSITY Quality Assurance Procedures for Chip Seal Operations Using Macrotexture Metrics Guangyuan Zhao, Shuo Li, Yi Jiang, Jusang Lee SPR-4157 Report Number: FHWA/IN/JTRP-2018/12 DOI: /
2 RECOMMENDED CITATION Zhao, G., Li, S., Jiang, Y., & Lee, J. (2018). Quality assurance procedures for chip seal operations using macrotexture metrics (Joint Transportation Research Program Publication No. FHWA/IN/JTRP-2018/12). West Lafayette, IN: Purdue University. AUTHORS Guangyuan Zhao, PhD Yi Jiang, PhD, PE Postdoctoral Research Assistant Professor School of Construction Management School of Construction Management Purdue University Purdue University (765) Shuo Li, PhD, PE Research Engineer Corresponding Author Division of Research and Development Indiana Department of Transportation Jusang Lee, PhD, PE (765) x247 Research Engineer Division of Research and Development Corresponding Author Indiana Department of Transportation (765) x349 Corresponding Author ACKNOWLEDGMENTS This research project was sponsored by the Indiana Department of Transportation (INDOT) in cooperation with the Federal Highway Administration (FHWA) through the Joint Transportation Research Program (JTRP). The authors would like to thank the study advisory committee members, Todd Shields, Tim Wells, Dwayne Harris, Clinton Bryant, Gary Wampler, Tom Dull, Brian Wathen, and Tom Duncan. Sincere thanks are extended to Tony Johnson, Maurice Hendryx, Hobert Deaton, Brandon Patterson, Gilbert Truax, and Chris Weinard of INDOT for their help and support in field testing. The authors recognize the assistance provided by Hashim Burki and Steve Dicks of the former employees of INDOT. JOINT TRANSPORTATION RESEARCH PROGRAM The Joint Transportation Research Program serves as a vehicle for INDOT collaboration with higher education institutions and industry in Indiana to facilitate innovation that results in continuous improvement in the planning, design, construction, operation, management and economic efficiency of the Indiana transportation infrastructure. Published reports of the Joint Transportation Research Program are available at NOTICE The contents of this report reflect the views of the authors, who are responsible for the facts and the accuracy of the data presented herein. The contents do not necessarily reflect the official views and policies of the Indiana Department of Transportation or the Federal Highway Administration. The report does not constitute a standard, specification or regulation. COPYRIGHT Copyright 2018 by Purdue University. All rights reserved. Print ISBN:
3 TECHNICAL REPORT DOCUMENTATION PAGE 1. Report No. FHWA/IN/JTRP-2018/12 4. Title and Subtitle Quality Assurance Procedures for Chip Seal Operations Using Macrotexture Metrics 7. Author(s) Guangyuan Zhao, Shuo Li, Yi Jiang, and Jusang Lee 9. Performing Organization Name and Address Joint Transportation Research Program Hall for Discovery and Learning Research (DLR), Suite S. Martin Jischke Drive West Lafayette, IN Sponsoring Agency Name and Address Indiana Department of Transportation (SPR) State Office Building 100 North Senate Avenue Indianapolis, IN Government Accession No. 3. Recipient s Catalog No. 15. Supplementary Notes Conducted in cooperation with the U.S. Department of Transportation, Federal Highway Administration. 5. Report Date June Performing Organization Code 8. Performing Organization Report No. FHWA/IN/JTRP-2018/ Work Unit No. 11. Contract or Grant No. SPR Type of Report and Period Covered Final Report 14. Sponsoring Agency Code 16. Abstract It is anticipated that in FYs , the Indiana Department of Transportation (INDOT) will perform 1500 lane miles of chip seal work each year. To ensure successful chip seals, INDOT has implemented visual inspection quality assurance (QA) procedures. However, concerns, such as reliability and validity of visual inspection, time and labor, and safety, have been raised on the current QA procedures. In response, this study aimed at developing novel concepts and providing innovative solutions to enhance the current QA practices over chip seal jobs. The mean profile depth (MPD) was selected as the macrotexture metric to measure the quality of chip seal by considering the performance measures for pavement construction. Extensive testing was conducted to validate the use of this macrotexture metric to provide a cost-effective solution to assuring the quality of chip seal construction. The setup of texture testing system was evaluated and verified on both test tracks and actual chip seal projects. A field test protocol was developed to implement QA for chip seal. It was found that use of at least two point lasers, one for each wheel path, is needed and anticipated to acquire the necessary information for evaluating the characteristics of texture profiles and capturing the spots of bleeding or tracking in both wheel paths. Texture measurements in one direction can provide sufficient information for the quality assurance of chip seal. Chip seal in the driving lane may experience higher variability than that in the passing lane. Therefore, the texture depths in the driving lane may yield more strict standards for quality assurance of chip seal. The current two QA inspections performed after one month and 12 months of service, respectively, can be combined into a single, one-time QA inspection that should be conducted after the first snow season and can ensure both road safety and chip seal quality. 17. Key Words chip seal, seal coat, quality assurance, quality rating, surface friction, surface texture, macro-texture metrics, mean profile depth (MPD), point texture laser 19. Security Classif. (of this report) Unclassified Form DOT F (8-72) 18. Distribution Statement No restrictions. This document is available through the National Technical Information Service, Springfield, VA No. of Pages 22. Price 32 Reproduction of completed page authorized 20. Security Classif. (of this page) Unclassified
4 EXECUTIVE SUMMARY QUALITY ASSURANCE PROCEDURES FOR CHIP SEAL OPERATIONS USING MACROTEXTURE METRICS Introduction The Indiana Department of Transportation (INDOT) has implemented a comprehensive and proactive pavement preservation program to formalize preventive maintenance activities such as thin surface treatments, crack seal, and chip seal (seal coat) and to determine the optimum balance between preventive maintenance expenditures and capital expenditures. It is anticipated that in FYs , INDOT s six districts will altogether perform approximately 1,500 lane miles of chip seal work each year. It has been recognized that the quality of chip seal relies to a great extent on the qualities of binder and aggregate, proper application rate, construction, and existing pavement condition. To ensure successful chip seals, INDOT has implemented special quality assurance (QA) procedures, i.e., Activity 2050 Mainline Seal Coat Quality Assurance Evaluation (MSQA) that allows INDOT maintenance engineers to assess the quality of a new chip seal based on visual inspection of two 1,000-foot sections selected from a chip seal project (INDOT, 2014). However, concerns associated with the MSQA procedures have been identified by INDOT maintenance engineers. First, the quality of visual inspection by human eye relies on the vision, experience, and level of training of the inspector. Issues may arise over the reliability and validity of visual inspection. Two randomly selected 1,000-foot-long sections may not fully represent the overall quality of the chip seal project. Second, each district usually performs approximately 250 lane miles of chip seal work every year, which may encompass ten to twenty different roads. INDOT is currently able to inspect three to five roads per district per year. Third, visual inspection may become labor intensive, inefficient, and prone to errors as the current MSQA requires two visual inspections performed, respectively, one month and twelve months after construction. In addition, traveling vehicles may pose a threat to the inspector s safety during visual inspection. In response to the growing concerns about chip seal quality and consequence and the need to enhance the efficiency of QA inspection, this study aimed to develop novel concepts and provide innovative solutions to enhance the current QA practices over chip seal jobs. Extensive testing was conducted to validate the concept of using macrotexture measurements to provide a costeffective solution to assuring the quality of chip seal construction. The setup of a texture testing system was evaluated and verified on both test tracks and actual chip seal projects. Macrotexture metrics were determined by taking into account the performance measures for pavement construction. A field test protocol was developed to implement the QA for chip seal. There is no doubt that this study will not only ensure alignment between specifications, performance, and quality of end product, but also improve customer satisfaction, reduce life-cycle cost, and enhance operational efficiency. Findings Ride quality and safety are two critical performance measures that have been widely used to evaluate the quality of new pavement. The former is defined in light of pavement smoothness; the latter is defined in light of pavement friction. Pavement smoothness does not change much before and after placing chip seal, in particular single chip seal. However, chip seal premature or early failure is commonly accompanied by excessive aggregate loss or bleeding, or both, which will undoubtedly affect the surface frictional characteristics of chip seal. The surface of a failed chip seal tends to become slippery, leading to very low surface friction. Therefore, surface friction can be utilized as a performance-focused measure for assessing the quality of new chip seal. INDOT conducts pavement friction testing in accordance with ASTM E274 (2015). This test requires intermittent acceleration or braking to adjust the speed of the test vehicle, which may impose significant impacts on traffic flow conditions and safety. In addition, this test cannot provide a seamless coverage of the road. Nevertheless, pavement friction varies with surface texture, test tire, presence of water, and test speed. When conducting friction testing at standard test conditions, surface texture becomes the dominant factor affecting pavement friction. Technologies are currently available to provide continuous texture measurements. It is advisable to use surface texture instead of friction for quality assessment or assurance. Texture depth, spacing, and shape may be used to fully characterize the geometrical properties of a texture profile. To predict wet pavement friction, however, the mean profile depth (MPD) of macrotexture was found to be the best depth parameter. Field test results indicate a strong exponential relationship between MPD and friction exists, and MPD and friction variations follow a similar trend. It is evident that MPD is the best macrotexture metric to assess the surface friction, and therefore the quality of chip seal. Field visual inspection revealed that bleeding and tracking are commonly found in the wheel paths, either in one wheel path or two wheel paths. Nevertheless, there are evident differences between the texture characteristics in the right and left wheel paths, due to the spatial variability of texture or the nature of pavement surface. Cumulative frequency distribution (CFD) provides an easy way to visualize large texture data sets and detect the small differences in the distribution of texture measurements. Implementation The following recommendations are made for future implementation: N Use of two point lasers, one for each wheel path, is needed and anticipated to acquire the necessary information for evaluating the characteristics of texture profiles and capturing the spots of bleeding or tracking in both wheel paths. N It is rational to perform texture testing in both directions for the quality assurance of chip seal. However, texture measurements made in one direction can provide sufficient information for the quality assurance of chip seal, which may be justified if resources are limited. N Chip seal in the driving lane may experience higher variability than that in the passing lane. Therefore, the texture depths in the driving lane may yield more strict standards for the quality assurance of chip seal. N The current two QA inspections performed after one month and twelve months of service can be combined into a single, one-time QA inspection that should be conducted after the first snow season and can ensure both safety and quality.
5 However, visual inspection is still necessary to identify problems earlier when corrective actions can still be taken and to avoid the consequence due to immediate and dramatic loss of surface friction. It is recommended that visual inspection should be conducted before applying fog seal. N Chip seal QA can be measured in terms of the macrotexture metrics such as MPD and attribute percentile values. Although three equations have been developed to accomplish this, the equation below may yield the best estimation. MSQA~78:023z13:602 MPD{0:011 Truck{0:1716 Length
6 CONTENTS 1.INTRODUCTION Background Research Approach and Scope CHIP SEAL QUALITY ASSURANCE AND TEXTURE METRICS CurrentPracticeforChipSealQualityAssurance Selection of Texture Metrics TESTING SYSTEM SETUP AND VERIFICATION SetupofTestingSystem TrackandFieldVerifications EXPERIMENTALFIELDSTUDIES SpatialVariationsofChipSealSurfaceTexture Temporal Variations of Chip Seal Surface Texture Establishment of Macrotexture Metrics FINDINGS AND RECOMMENDATIONS Main Findings Major Recommendations REFERENCES... 23
7 LIST OF TABLES Table Page Table 3.1 MPD Values Measured Using Different Laser Sensors 6 Table 3.2 Summaries of Texture Measurements before and after Switching Lasers 9 Table 3.3 Normality Test for Two Laser Test Samples 11 Table 3.4 Test Statistics for the Laser Difference 11 Table 4.1 Typical Materials and Application Rates for Chip Seal by District 12 Table 4.2 Statistical Summaries of Chip Seal Texture Measurements by District 12 Table 4.3 Statistical Summaries of Texture Measurements by Lane 15 Table 4.4 Statistical Summary of 2017 Chip Seal Projects 18 Table 4.5 Statistical Summary of Texture Depth Grouped by MSQA Rating 18 Table 4.6 Results of Principal Component Analysis 19 Table 4.7 Summary of Variables for Modeling 21 Table 4.8 Model Parameter Estimation 21
8 LIST OF FIGURES Figure Page Figure 2.1 Photo of chip seal experiencing aggregate loss 2 Figure 2.2 Close-up of chip seal with fog seal 2 Figure 2.3 Activity 2050 excel worksheets 3 Figure 2.4 Illustration of procedures for computing mean segment depth 4 Figure 2.5 Correlation between FN and MPD made on different pavements 4 Figure 2.6 Variations of FN and MPD on new chip seal 5 Figure 3.1 Point laser texture measuring instrument 5 Figure 3.2 Close-ups of three different surfaces 5 Figure 3.3 Photo of laser setup for acquiring texture data 6 Figure 3.4 Possible positions of bleeding and tracking in chip seal 6 Figure 3.5 CFDs for texture measurements on INDOT friction test track 7 Figure 3.6 CFDs for texture measurements before and after switching lasers 8 Figure 3.7 Q-Q plots for texture measurements before and after switching lasers 10 Figure 4.1 MPD and standard deviations by road 12 Figure 4.2 Texture depth variations on SR-14 eastbound 13 Figure 4.3 CFDs for texture measurements on SR-14 eastbound 13 Figure 4.4 CFDs for texture measurements on six different roads 14 Figure 4.5 CFDs for texture measurements in different lanes 15 Figure 4.6 Variations of MPD and COV over time by district 16 Figure 4.7 Friction variations of single chip seal over time 16 Figure 4.8 Friction variations of single chip seal with fog seal over time 17 Figure 4.9 Correlation matrix for MPD, standard deviation, and percentiles 19 Figure 4.10 Scatter plots among PC1, PC2, MPD, IQR, and standard deviation 20
9 1. INTRODUCTION 1.1 Background Problem Statement The Indiana Department of Transportation (INDOT) has implemented a comprehensive and proactive pavement preservation program to formalize preventive maintenance activities such as thin surface treatments, crack seal, and chip seal (also known as seal coat), and determine the optimum balance between preventive maintenance expenditures and capital expenditures. To date, most INDOT pavement preventive work has been performed by INDOT maintenance crews. In fiscal year (FY) 2016, the pavement preservation projects by contractors, typically involving heavier treatments on higher traffic volume roadways, totaled approximately 262 lane miles. By contrast, INDOT maintenance crews completed more than 1,400 lane miles of chip seal. In particular, INDOT maintenance crews chip sealed more than 7,400 lane miles of pavement in the past five fiscal years (FYs ), more than 80% of the total lane miles of preservation work (excluding crack seal). Successful chip seal relies to a great extent on the qualities of binder and aggregate, proper application rate, construction, and existing pavement condition. Special attention has also been directed toward identifying laboratory and field tests that can be correlated with successful chip sealing practice (Gransberg & James, 2005). To ensure a successful chip seal job, INDOT Maintenance Management and District Support has also developed special procedures, i.e., Activity 2050 Mainline Seal Coat Quality Assurance Evaluation (INDOT, 2014), to assist districts maintenance crews in assessing the quality of chip seal. Poor quality control tends to affect chip seal performance due mainly to aggregate loss or bleeding, or both. Excessive aggregate loss or bleeding may cause a catastrophic failure of chip seal, which requires prompt repairs or remedial actions. It is anticipated that in FYs , INDOT s six districts will altogether perform approximately 1500 lane miles of chip seal work each year. A rapid and practical field test will facilitate INDOT maintenance crews to ensure the success of chip sealing more efficiently. In response to the growing concern about chip seal quality and consequence, this study aimed at developing novel concepts and innovative solutions that could allow INDOT to enhance the current QA practices over chip seal jobs. In addition, there is no doubt that this study will not only ensure alignment between specifications, performance and quality of end product, but also improve customer satisfaction, reduce life-cycle cost, and enhance operational efficiency Research Objectives The primary objective of this study is to validate the concept of using macrotexture measurements to provide a cost-effective solution to assuring the quality of chip seal construction. The secondary objectives are: (1) to develop performance-driven metrics and criteria for accomplishing the primary objective; and (2) to identify the best practices to assist INDOT maintenance crews in further improving the current chip seal operations and quality control (QC) procedures. 1.2 Research Approach and Scope To fulfill the objectives of this study, the research approach used in this study was a combination of physical measurements (data-driven) and subjective assessment (customer-focused). In addition to final report, the research scope included six main tasks as follows: 1. Review of the state of the practice. This task presented a synthesis of the state of the practice regarding QA or assessment of chip seal, in particular state DOTs current practices such as procedures, field testing, and parameters used to assure chip seal quality and performance. 2. Characterization of surface properties. This task examined the effects of many factors on the quality and performance of chip seal and explored the potential relations between chip seal quality and surface properties. Focus was on the attributes of surface friction as friction number (or friction coefficient) and texture mean profile depth (MPD). 3. Selection of testing system. The test system was selected by taking into consideration the historical records and capabilities of the test system, verification test results, and initial cost. Preference was given to systems capable of providing both texture and roughness measurements at multiple positions such as right wheel path and left wheel path simultaneously. Verification testing was conducted on both the INDOT friction test track and actual chip seals. 4. Field testing and inspection. Extensive field testing was carried out to provide macrotexture and friction measurements in the selected chip seal sections. Visual inspection was also performed to provide assessment of chip seal quality. The selection of chip seal sections was carefully made in consultation with SAC members and districts maintenance managers. The factors considered when selecting the test sections include, but were not limited to aggregate type and size, application rate, traffic level, service time, and perceived quality. 5. Data processing and analysis. This task included three subtasks. The first subtask was data processing, in particular macrotexture test data processing. Default, proven procedures were employed to remove extreme values such as spikes in the measurements due to inherent system errors. The second subtask focused on the establishment of texture profiles that may represent the true surface texture profiles. The third subtask was to perform statistical analysis to examine the variability of chip seal surface texture and determine the statistical summaries of surface texture, such as mean, standard deviation and boundaries, from chip seal projects statewide. Cumulative frequency analysis and hypothesis test were also performed to detect the possible differences between texture attributes and validate system setup and test protocol. 6. Macrotexture metrics and test protocol for chip seal QA. This task was to establish and verify macrotexture metrics for implementing QA over chip seal. The macrotexture metrics were determined according to the test and analysis Joint Transportation Research Program Technical Report FHWA/IN/JTRP-2018/12 1


10 results obtained in the previous tasks and can be readily verified. The field test protocol should be compatible or consistent with the test device proposed for checking the smoothness of a new pavement and be readily implemented. 2. CHIP SEAL QUALITY ASSURANCE AND TEXTURE METRICS 2.1 Current Practice for Chip Seal Quality Assurance Potential Chip Seal Failure and Indicators Many factors, such as asphalt binder, aggregate, existing pavement condition, weather, and construction operation, have been considered in the design and construction of chip seal. While INDOT has developed guidelines to implement quality control over the selection of materials, determination of application rate, equipment calibration, and construction operation (Lee & Shields, 2010), chip seal design, in particular application rate, may vary from road to road and project to project due to the variations associated with the factors that affect the success of a chip seal job. In addition, personnel experience and judgment has to some extent played an important role in achieving chip seal success. Therefore, the risk of chip seal failure may still exist as demonstrated by the chip seal project on SR-10 shown in Figure 2.1. The failure, in particular premature failure of chip seal, is usually accompanied by excessive aggregate loss or bleeding, or both that tend to result in dramatic reduction in surface friction and vehicle damage (Li, Shields, Noureldin, & Jiang, 2012). To enhance the retention of aggregate, INDOT Maintenance Management and District Support has accepted a standard practice to apply a fog seal on a new chip seal after the final sweeping, commonly a couple of days after the road seal is opened to traffic. However, it was demonstrated that in Figure 2.2, there is nothing to guarantee that the application a fog seal on a new chip seal can always improve aggregate retention, in particular over the long term Current INDOT Practice Mainline Seal Coat Quality Assurance Evaluation, hereafter referred to as MSQA, is currently utilized by INDOT maintenance crews to assess the quality of a new chip seal. MSQA consists of eight elements, of which four, including Observations 1, 4, 5 and 7, are related to either aggregate loss or bleeding as shown in Figure 2.3. MSQA allows INDOT to assess the quality of a new chips seal based on visual inspection of the chip seal surface. When performing visual inspection, two 1000-foot-long sections, designated as S1 and S2 (see Figure 2.3), are randomly selected from a chip seal project, and inspected independently. The inspection scores for each observation on the two sections are averaged and rounded to one decimal place. The sum of the average scores for all eight observations is used to rate the quality of the chip seal project. The perfect score for each observation item varies from 5 to 20 points and the total score ranges from 0 to 90 for the chip seal project. So far, MSQA has played a critical role in improving the qualities of material and workmanship incorporated in chip seal work and assuring that the performance of a new chip seal is in close conformity with the requirement. However, there are three concerns associated with the above procedures. Firstly, the quality of visual inspection by human eye relies on the vision, experience (or knowledge), and level of training of the inspector. Issues may arise over the reliability and validity of visual inspection, particularly on a small scale. Travelling vehicles may pose a threat to the inspector s safety during visual inspection. Secondly, two randomly selected 1000-footlong sections may not fully represent the overall quality of the chip seal project, particularly when it is several miles in length. Lastly, each district usually performs approximately 250 lane miles of chip seal work every year, which can encompass ten totwentydifferentroads. Currently we are only able to MSQA three to five roads per district per year. Visual inspection may become labor intensive, inefficient, and prone to errors as the current MSQA requires two visual inspections performed, respectively, one month and twelve months after construction. Figure 2.1 Photo of chip seal experiencing aggregate loss. Figure 2.2 Close-up of chip seal with fog seal. 2 Joint Transportation Research Program Technical Report FHWA/IN/JTRP-2018/12

11 Figure 2.3 Activity 2050 excel worksheets (INDOT, 2014). 2.2 Selection of Texture Metrics Measures of Chip Seal Quality Ride quality and safety are two critical pavement performance measures that have been widely used to evaluate the quality of new pavement. The former is commonly defined in light of pavement smoothness; the latter is often defined in light of pavement friction. Currently, INDOT quantifies pavement smoothness as International Roughness Index (IRI) and pavement friction as friction number (FN). It was found elsewhere that pavement smoothness does not change much before and after chip seal due to that chip seal, in particular single chip seal, is not thick enough to affect the profile of road surface (Lee, Ahn, Shields, Harris, & Li, 2013). This may imply that pavement smoothness may not be related to the quality of new chip seal. As pointed out earlier, chip seal premature or early failure is accompanied by excessive aggregate loss or bleeding, or both, which will undoubtedly affect the surface frictional characteristics of chip seal treatment. On the one hand, the surface of a failed chip seal tends to become slippery, leading to very low surface friction. On the other hand, chip seal is also a pavement preservation treatment commonly used to restore surface friction that is one of the critical pavement performance measures. Therefore, surface friction can be utilized as one of the measures for assessing the quality of new chip seal. INDOT conducts pavement friction testing in accordance with ASTM E274 (ASTM, 2015). However, safety concerns may arise during field testing on highway facilities (Li, Noureldin, & Zhu, 2010). This is because when conducting friction testing on roadways, it requires intermittent acceleration or braking to adjust the speed of test vehicle, which may impose significant impact on the traffic flow conditions. In addition, the ASTM E274 test method cannot provide a seamless coverage of the road. Each friction test yields a friction number that is the average of friction resistance over a segment of approximately 60,90 feet long. Pavement friction varies with pavement texture, test tire, presence of water, and test speed. When conducting friction testing at standard test conditions, pavement texture becomes the dominant factor affecting pavement friction. Pavement texture is a physical aspect of the visual appearance of pavement surface and is independent of test conditions, such as tire and speed. Moreover, technologies are commercially available right now to provide continuous texture measurements. It is advisable to use pavement texture measurements, instead of surface friction measurements, for quality assessment or assurance Characterization of Pavement Texture Pavement surface texture is generally divided into three groups in the Permanent International Joint Transportation Research Program Technical Report FHWA/IN/JTRP-2018/12 3
 3. Megatexture: Wavelength 5 50,500 mm (peak to peak amplitudes: 0.1,50mm) 4. Unevenness: Wavelength.")
12 Association of Road Congress (PIARC, 1987) international experiment below: 1. Microtexture: Wavelength, 0.5 mm (peak to peak amplitudes: 0.001,0.5mm) 2. Macrotexture: Wavelength 5 0.5,50 mm (peak to peak amplitudes: 0.01,20mm) 3. Megatexture: Wavelength 5 50,500 mm (peak to peak amplitudes: 0.1,50mm) 4. Unevenness: Wavelength. 500 mm It has been recognized that microtexture and macrotexture are the two texture components that ultimately determine wet-pavement friction. Macrotexture varies with the mix properties, in particularly voids, aggregate (size, shape and gradation), and surface finishing, and can be readily measured at highway speeds. Microtexture, however, relies mainly on the surface feature of aggregate particle, and is measured using a surrogate. It was reported in the PIARC experiment that microtexture mainly affects wet pavement friction at low speeds and macrotexture becomes the dominant factor above 60 km/h. The above can be extended to conclude that it is reasonable to use macrotexture measurements to assess pavement friction. Currently, the macrotexture of pavement surface is characterized by a single parameter, i.e., the so-called mean profile depth (MPD) as follows (ASTM E , 2015): MPD~ 1 N P N i~1 MSD i ð2:1þ in which, N is the total number of 100-mm long segments in the test section, and MSD is the mean segment depth of a 100-mm texture profile as illustrated in Figure 2.4, and is computed as the mean depth of the two peaks. Fundamentally, surface texture is the composite of certain deviations that are typical of the real surface Figure 2.4 Illustration of procedures for computing mean segment depth (ASTM E , 2015). Figure 2.5 Correlation between FN and MPD made on different pavements. 4 Joint Transportation Research Program Technical Report FHWA/IN/JTRP-2018/12


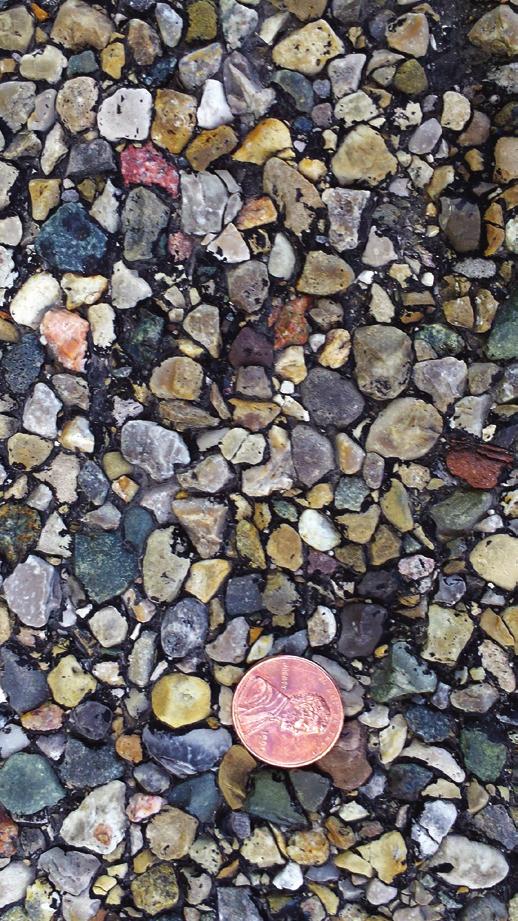
13 Figure 2.6 Variations of FN and MPD on new chip seal. consisting of both peaks and valleys (ASME B , 2009). To fully measure the characteristics of a texture profile for surface friction, three geometrical parameters, including texture depth, spacing, and shape, are commonly used to characterize the geometrical properties of texture profile. To predict wet pavement friction, however, the mean profile depth (MPD) of macrotexture was found to be the best depth parameter (Henry, 2000; PIARC, 1987). In reality, the authors have made both friction and texture measurements on various types of pavements as shown in Figure 2.5. It is shown that there exists a strong exponential relationship between MPD and FN at 40 mph using a smooth tire. The authors also measured both friction and MPD on a new chip seal (see Figure 2.6). Overall, MPD and FN variations followed a similar trend. Evidently, MPD is the best macrotexture metric to assess the surface friction, and therefore the quality of chip seal. Figure 3.1 Point laser texture measuring instrument. 3. TESTING SYSTEM SETUP AND VERIFICATION 3.1 Setup of Testing System Texture Measuring Instrument Many noncontact profiling technologies, such as optical focus sensing and laser triangulation, are readily available for measuring surface texture profiles. To develop and validate the concept of using the MPD of macrotexture profile in assessing surface friction, and therefore assuring the quality of chip seal construction, the selection of texture measuring instrument was made by taking into consideration the many factors such as test speed, continuous measurement, accuracy, cost, and proven track record. Eventually, a laser-based instrument, as shown in Figure 3.1, was selected for field experimental studies. This instrument consists of a high-speed texture 100 khz point laser that utilizes the triangulation methods and is capable of measuring Figure 3.2 Close-ups of three different surfaces. macrotexture profiles at highway speeds. The detailed information about the specifications for the laser sensor can be found elsewhere (Ames Engineering, n.d.). To verify the accuracy of the selected high-speed texture point laser, texture measurements were made using both the point laser and a portable 1 khz laser texture scanner on three different pavements in the INDOT friction test track that is not open to traffic as shown in Figure 3.2. The three pavements, i.e., PCC1, Joint Transportation Research Program Technical Report FHWA/IN/JTRP-2018/12 5


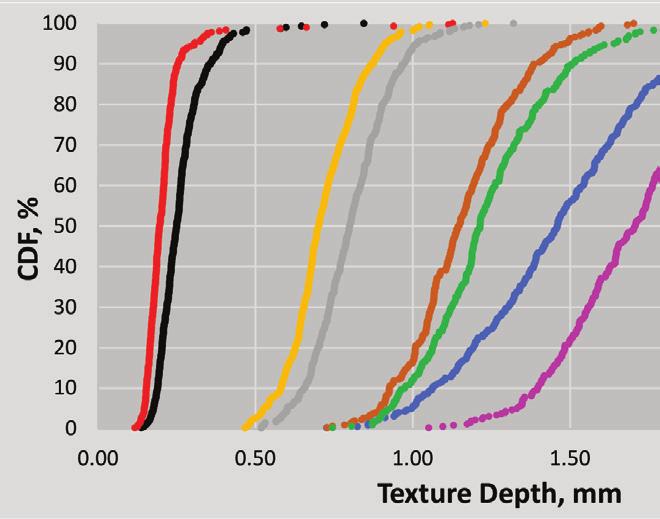
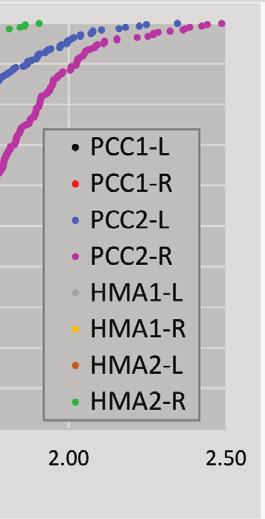
14 HMA1, and HMA2, are transversely tined concrete pavement, 9.5-mm HMA pavement constructed in 2013, and 9.5-mm HMA pavement constructed in 2002, respectively. Notice that during testing, the 100 khz point laser yields a single continuous texture profile that defined the MPD for each pavement surface. The 1 khz laser texture laser that has been validated elsewhere (Li et al., 2010), however, scans a surface area of approximately that is used to calculate the MPD. Presented in Table 3.1 are the average MPD values for these four different surfaces. It is shown that the MPD values measured using the two laser instruments, although there are some differences, are very close to each other System Setup It has been recognized that the point laser can only produce a single texture profile that may not fully TABLE 3.1 MPD Values Measured Using Different Laser Sensors Texture Instrument PCC2 HMA1 HMA2 100 khz Point Laser 1 khz Laser Scanner Figure Photo of laser setup for acquiring texture data. represent the true texture characteristics of a surface. Because of this, a number of point lasers may be required to yield more representative results. However, determination of the number of point lasers is not a pure science. In addition, the high-speed texture laser is currently expensive. As practical field trials, two point lasers were considered to simultaneously acquire texture profile data in the left and right wheel paths, respectively. The setup for the test system consisting of two point lasers is illustrated in Figure 3.3. In reality, it can be seen that in Chapter 2, the current chip seal field QA procedures, i.e., MSQA, include inspection of both longitudinal bleeding and tracking in the wheel paths. Field visual inspection also revealed that bleeding and tracking are commonly found in the wheel paths, in either one wheel path or two wheel paths as shown in Figure 3.4. Therefore, the use of two point lasers, one for each wheel path, is anticipated to acquire the necessary information for evaluating the characteristics of texture profiles and capturing the spots of bleeding or tracking in both wheel paths. 3.2 Track and Field Verifications Verifications on INDOT Friction Test Track Test trials were made to validate the system setup for acquiring texture profiles in the four pavement sections in the INDOT friction test track (see Figure 3.2). PCC2 is a concrete pavement with very smooth surface. Cumulative frequency distribution (CFD) was utilized to provide insight into the differences between the MPD measurements in the right and left wheel paths due to two main reasons. CFD provides an easy way to visualize large data sets and detect the small differences in the distribution of texture measurements. Second, peculiarities in the distribution can be easily perceived from the shape of cumulative frequency curve. Generally, a steep curve corresponds to close texture measurements, which may indicate a uniform surface. A flat curve, however, corresponds to texture values with high variability, which may suggest a non-uniform surface. As a result, the texture attribute values corresponding to a specific percentile such as the 25th, Figure 3.4 Possible positions of bleeding and tracking in chip seal. 6 Joint Transportation Research Program Technical Report FHWA/IN/JTRP-2018/12
15 Figure 3.5 CFDs for texture measurements on INDOT friction test track. 50th, or 75th percentile can be identified and examined to possibly yield meaningful insights into the quality of a chip seal. Figure 3.5 presents the CFD curves of the texture values measured over a 100-foot-long segment in the four pavement sections, respectively. In viewing the CFD curves, attention should be given to the shift and shape. A shift to the right indicates increase in texture depth. The CFDs for PCC1 show the steepest slope and much steeper than the CFDs for PCC2. The CFD curves for HMA1 are also steeper than the CFD curves for HMA2. One possible explanation is that HMA1 was constructed in 2013 and HMA2 was constructed in The former has not experienced raveling and the latter has experienced medium to severe raveling that has resulted in greater variability in surface texture. This implies that the CFD attributes may be utilized to evaluate the variability of surface texture. Second, there are evident differences between the CFD curves for the right and left wheel paths, regardless of the type of pavement. Again, this confirms that two point lasers, one for each wheel path, is needed to acquire the necessary information for determining the characteristics of surface texture Verifications on Actual Chip Seals An original thought was that the differences between the texture measurements in the two wheel paths could be due to the spatial variability of texture or the nature of pavement surface, rather than the inherent errors of the testing system. To validate this thought, field testing was conducted to make texture measurements in the two wheel paths, over actual chip seals on SR-47, US-41, and US-136, respectively, by switching the two lasers. Figure 3.6 shows the CFDs for the texture measurements before and after switching the two lasers. Table 3.2 presents the statistical summaries of the texture measurements, including mean (MPD), standard deviation (Std Dev), and relative error, made before and after switching the two lasers. In all cases except for the left wheel path, US-136 eastbound and the right wheel path, US-41 southbound between RP 171 and 174, the before and after CFDs not only exhibit the same shape, but also are located approximately at the same position. The relative errors are 2.0% or less. Statistical hypothesis tests were conducted to further verify whether there is any significant difference between the MPD values before and after switching lasers. The two assumptions first checked are whether the two samples are independent and whether the two samples follow the normal distribution. Since two lasers were always testing the same wheel path, the two samples should be inherently dependent. The Q-Q plot, which compares observed quantiles of MPD with quantiles of the normal distribution, is an intuitive graphical technique to detect the normality of a sample dataset. As shown in Figure 3.7, the x-axis of both Q-Q plots represents the normal quantile and the y-axis stands for quantiles of the sample data. The data points fall approximately along the straight reference line. It is likely that the sample follows the normal distribution. Table 3.3 shows the results two normality tests, including Shapiro-Wilk and Kolmogorov-Smirnov tests. The null hypothesis of a normality test is that the sample does not significantly vary from the normal distribution. If the p-value is less than 0.05, the null hypothesis is rejected and the sample is not normally distributed. If the p-value is larger than 0.05, it fails to reject the null hypothesis and the assumption is valid. The Kolmogorov-Smirnov test is more accurate when the sample size is large, while the Shapiro-Wilk test is commonly used when the sample size is small. Based on the Shapiro-Wilk test, the sample before switching lasers follows a normal distribution because the p-value is After switching the lasers, the p-value is that is slightly less than 0.05, the sample barely follows a normal distribution. Joint Transportation Research Program Technical Report FHWA/IN/JTRP-2018/12 7
16 Figure 3.6 CFDs for texture measurements before and after switching lasers. There are four methods, such as two sample t-test, Wilcoxon-Mann-Whitney test, paired t-test, and Wilcoxon Signed Rank test, available to test two sample means. Because the two samples are dependent and the samples follow a normal distribution before switching lasers and barely follow a normal distribution after switching lasers, both the paired t-test and Wilcoxon signed rank test can be used to test the differences 8 Joint Transportation Research Program Technical Report FHWA/IN/JTRP-2018/12
17 TABLE 3.2 Summaries of Texture Measurements before and after Switching Lasers Road Direction Wheel Path Laser Position MPD (mm) Std Dev (mm) Relative Error (%) SR-47 West Left Right Before Switching After Switching Before Switching After Switching US-41a (RP 163-RP 170) North South Left Right Left Right Before Switching After Switching Before Switching After Switching Before Switching After Switching Before Switching After Switching US-41b (RP 171-RP 174) North South Left Right Left Right Before Switching After Switching Before Switching After Switching Before Switching After Switching Before Switching After Switching US-136 East West Left Right Left Right Before Switching After Switching Before Switching After Switching Before Switching After Switching Before Switching After Switching between MPD samples before and after switching lasers. The null hypothesis H 0 states that there is no significant difference of MPD by two lasers, while the alternative hypothesis H a states that the difference of MPD is significant. Table 3.4 shows the basic and test statistics for the difference of MPD. The p-value is from paired t-test and from Wilcoxon signed rank test. Since the p-values for both tests are greater than 0.05, it fails to reject the null hypothesis, the difference of two sample means is insignificant. Therefore, there is no significant difference about test results if two lasers are switched. Joint Transportation Research Program Technical Report FHWA/IN/JTRP-2018/12 9
18 Figure 3.7 Q-Q plots for texture measurements before and after switching lasers. 10 Joint Transportation Research Program Technical Report FHWA/IN/JTRP-2018/12
19 TABLE 3.3 Normality Test for Two Laser Test Samples Laser Position Test Method Statistic p-value Before Switching Shapiro-Wilk W Pr, W Kolmogorov-Smirnov D Pr. D After Switching Shapiro-Wilk W Pr, W Kolmogorov-Smirnov D Pr. D TABLE 3.4 Test Statistics for the Laser Difference Number of Observations 14 Mean Standard Deviation Variance Skewness Kurtosis Coefficient of Variation (%) Student s t Statistic, t Student s t Test p Value Signed Rank Statistic, S -5.5 Signed Rank p Value EXPERIMENTAL FIELD STUDIES 4.1 Spatial Variations of Chip Seal Surface Texture Variations with Locality INDOT is divided into six geographical districts for the purpose of organizing and managing highway planning, construction, maintenance, traffic, development and testing. In addition to differences in weather conditions, differences also exist between the construction practices for chip seal by the districts. Table 4.1 shows six chip seal projects that demonstrate different aggregates and asphalt emulsion binders used by the six districts. The detailed information on the aggregate and asphalt emulsion properties can be found elsewhere (INDOT, 2017). In addition, different roads may have different geometric features, undergo different traffic applications, and experience different pavement conditions. In the same section of a certain road, both pavement and traffic conditions may vary from direction to direction and lane to lane. Therefore, spatial variations associated with chip seal surface texture are natural and inevitable. The texture attributes of chip seal may vary from district to district, road to road, direction to direction, lane to lane, and location to location. Field experimental tests were conducted on a total of 64 chip seal projects completed by five districts, including Crawfordsville, Fort Wayne, Greenfield, LaPorte, and Seymour, in 2017, and the results, including MPD and standard deviation (Std Dev), are presented in Figure 4.1. The MPD values for LaPorte District varied most significantly from road to road, and the MPD values for Seymour District varied least significantly from road to road. However, the standard deviations of texture measurements for Greenfield District varied most significantly from road to road, and the standard deviations of texture measurements for LaPorte District varied least significantly from road to road. Summarized in Table 4.2 are the average values of MPD, standard deviation, and coefficient of variation (COV) for all chip seal projects by district, as shown in Figure 4.2. Overall, the chip seals in LaPorte District demonstrate the largest texture depth but the lowest variability, and the chip seals in Seymour District demonstrate the medium texture depth but the highest variability Variations with Longitudinal Position To illustrate the variations of chip seal surface texture in longitudinal position, Figure 4.2 shows the texture measurements made in a 1-mile segment from an 8.0-mile long chip seal project on SR-14. As illustrated in Equation 2.1, the MSD is calculated in terms of 100-mm long segment. There are approximately MSD values in each wheel path over a 1-mile segment. Clearly, Figure 4.2 shows the variations and spikes of MSD values over the entire 1-mile segment. However, it does not provide detailed and accurate information to detect the trend of variation and compare the two MSD datasets from the right wheel path (RWP) and left wheel path (LWP), respectively. For a several-mile long chip seal project, in particular, the test dataset will be very large. It may become more difficult to use traditional charts to produce conclusive insights. Instead, this study frequently utilized CFD analysis as shown in Chapter 3. CFD provides an easy way to visualize large data sets and detect the small differences in the distribution of texture measurements. Peculiarities in the distribution can be easily perceived from the shape of CFD curve. Generally, a steep curve corresponds to close texture measurements, which may indicate a uniform surface. A flat curve, however, corresponds to texture values with high variability, which may suggest a non-uniform surface. Plotted in Figure 4.3 are the CFDs for the same texture measurements as presented in Figure 4.2. It is demonstrated that the two texture datasets in the right and left wheel paths are evidently different. The texture depth ranges approximately between 0.1 mm and 2.2 mm in the left wheel path (LWP), and between 0.1 mm and 2.6 mm in the right wheel path (RWP). More than 95% of the texture depths are approximately 1.25 mm or less. Most importantly, the differences Joint Transportation Research Program Technical Report FHWA/IN/JTRP-2018/12 11
20 TABLE 4.1 Typical Materials and Application Rates for Chip Seal by District Aggregate Asphalt Emulsion District Road Size Type Rate (lb/yd 2 ) Type Rate (gal/yd 2 ) Crawfordsville SR-42 SC 16 Gravel 20.0,25.0 AE-90S Fort Wayne US-24 SC 16 Dolomite 19.0 CRS-2P Greenfield SR-38 SC 11 Limestone 21.3 AE-90S LaPorte US-231 SC 16 Gravel 22.3 AE-90S Seymour SR-45 SC 11 Dolomite 24.0 CRS-2P Vincennes SR-257 SC 11 Dolomite 24.0 AE-90S Figure 4.1 MPD and standard deviations by road. TABLE 4.2 Statistical Summaries of Chip Seal Texture Measurements by District Road Crawfordsville Fort Wayne Greenfield LaPorte Seymour MPD (mm) Std Dev (mm) COV (%) Joint Transportation Research Program Technical Report FHWA/IN/JTRP-2018/12

21 Figure 4.2 Texture depth variations on SR-14 eastbound. Figure 4.3 CFDs for texture measurements on SR-14 eastbound. may be quantified with respect to the differences between the texture attribute values corresponding to a specific percentile such as the 25th, 50th, or 75th percentile Variations with Lateral Position To examine the texture variations with lateral position from lane to lane and direction to direction, texture testing was conducted on six actual chip seals, including two constructed in 2015 on SR-75 and SR-10, one constructed in 2016 on US-12, and three constructed in 2017 on US-41 and SR-136. Plotted in Figure 4.4 are the CFDs for the texture measurements from these six chip seals. Again, it is demonstrated that there are evident differences between the texture measurements in the right and left wheel paths. Careful inspection of these CFD curves further reveals that for all chip seals except for the one on SR-136, the two texture datasets for the two right (or left) wheel paths in both directions exhibit approximately the same distribution, regardless of service time. Hypothesis test was also conducted on the texture measurements. At a confidence level of 95%, the texture dataset from the right (or left) wheel path in one direction is identical to the texture dataset from the right (or left) wheel path in the other direction. The above can be extended to conclude that the texture measurements in one direction can provide sufficient information for the quality assurance of chip seal. Plotted in Figure 4.5 are the CFDs for the texture measurements made in all lanes over chip seal on a 4-lane, SR-9. In both directions, the CFDs for both the passing (left) and driving (right) lanes exhibit a similar trend and shape. However, the CDFs for the driving lanes shift to the right. This indicates that the texture depth in the driving lane is generally less than that in the passing lane, particularly in the right wheel path. One possible reason is the unequal traffic distribution Joint Transportation Research Program Technical Report FHWA/IN/JTRP-2018/12 13
22 Figure 4.4 CFDs for texture measurements on six different roads. between the driving and passing lanes. Traffic lane distribution varies with vehicle type and the driving lane may carry up to 94% of total five-axle semi-trucks on a four-lane road (Jiang, Li, Nantung, & Chen, 2008). Table 4.3 presents the statistical summaries of the texture measurements for each lane. On average, the MPD in the driving lane is 9.0% less than that in the passing lane. This implies that chip seal in the driving lane may 14 Joint Transportation Research Program Technical Report FHWA/IN/JTRP-2018/12
23 Figure 4.5 CFDs for texture measurements in different lanes. TABLE 4.3 Statistical Summaries of Texture Measurements by Lane Texture Depth (mm) Direction Lane Wheel Path Min. Max. MPD Std Dev COV (%) North Left Right Left Right Left Right South Left Right Left Right Left Right experience higher variability than that in the passing lane. Texture depths in the driving lane may yield more strict standards for quality assurance of chip seal. 4.2 Temporal Variations of Chip Seal Surface Texture Year-to-Year Texture Variations It is hard to overstate the importance of the timing for quality assurance inspection for chip seal construction. The current QA procedures by INDOT consists of two inspections, including an initial inspection performed one month after construction and a follow-up inspection performed 12 months after construction. To verify the current practice, this study examined the texture variations of chip seal projects over time. Due to lack of historical texture test data, texture measurements were simultaneously made on chip seals constructed by different districts in 2015, 2016, and 2017, which allows the authors to evaluate the year-to-year texture variations approximately. In reality, year-to-year texture variations may eliminate seasonal effects and provide an effective way to perceive the trends of longterm texture variations for chip seals. Plotted in Figure 4.6 are the MPD values for chip seals over time by district. Because texture tests were simultaneously conducted in 2017, the MPD measurements on chip seals constructed in 2015 were used as surrogate MPDs for chip seals after two years of service, and the MPDs measured on chip seals constructed in 2016 were used as surrogate MPDs for chip seals after one year of service. It is shown that in Figure 4.6, the MPD values are mm, mm, and mm in 2015, 2016, and 2017, respectively, over these five districts. On average, the MPD decreased approximately by 31% from 2017 to 2016, i.e., in the first year, and 20% from 2016 to 2015, i.e., in the second year. In addition, the MPD in 2016 and 2017 varied more significantly than in This indicates that the MPD for a chip seal tends to decrease over time and the decreasing rate decreases over time. Therefore, it can be concluded that if surface texture metrics are utilized for QA of chip seal construction, the inspection should be performed no later than 12 months after construction Monthly Friction Variations To provide more precise information on the variation of chip seal surface texture over time, this study re-examined the friction test results reported elsewhere Joint Transportation Research Program Technical Report FHWA/IN/JTRP-2018/12 15
24 Figure 4.6 Variations of MPD and COV over time by district. Figure 4.7 Friction variations of single chip seal over time. (Li, Noureldin, Jiang, & Sun, 2012; Li et al., 2017). Presented in Figure 4.7 and Figure 4.8 are the surface friction numbers on two types of chip seals such as single chip seal and single chip seal with fog seal. The single chip seal with fog seal is a variation of the single chip seal and involves applying fog seal to the single chip seal approximately two days later. Field visual inspections revealed that three chip seals, including two single chip seals on SR-10 and US-421, and one single chip seal with fog seal on US-36, had experienced either excessive aggregate loss, bleeding, or both. Accordingly, dramatic decreases in friction occurred in these three chip seals during the first year of service. After around 12 months of service, the friction numbers on these three chip seals fluctuated around 20 over time. The friction of chip seal surface experienced greater variability during the first 12 months. Particularly during the period of first six to eight months, the trend of friction variation varied over time and from project to project. Notice that chip seals are commonly placed from June to September in Indiana. There are two advantages associated with the current QA practice by INDOT. First, the initial QA inspection conducted after one month of service can detect any pre-mature failure timely and result in immediate actions. Second, the follow-up QA inspection conducted after 12 months of service can detect the potential effect of snow plow and ensure long-term performance. As shown in Figures 4.7 and 4.8, catastrophic failure that may cause significant reduction in friction typically occurs after 12 months of 16 Joint Transportation Research Program Technical Report FHWA/IN/JTRP-2018/12
25 Figure 4.8 Friction variations of single chip seal with fog seal over time. service. In addition, new chip seals will have been in service for about six to eight months when the first snow season ends. Consequently, the current two QA inspections performed after one month and 12 months of service can be combined into a single, one-time QA inspection that should be conducted after the first snow season and can ensure both road safety and chip seal quality. 4.3 Establishment of Macrotexture Metrics Chip Seal Projects To explore and develop the relationships between objective texture measurements and subjective MSQA scores, a total of 30 new chip seal projects completed in 2017 were selected, of which 6 projects were from Crawfordsville District, 7 projects from Fort Wayne District, 4 projects from Greenfield District, 3 projects from LaPorte District, 9 projects from Seymour District, and one project from Vincennes District. Tabulated in Table 4.4 are the descriptive statistics of texture measurements, including sample size, mean (MPD), standard deviation (Std), minimum value (Min), maximum value (Max), and various percentiles denoted by letter P. For example, P75 stands for the 75th percentile, that is, 75% of texture data falls below the value of P75. Because the percentiles may provide insight into chip seal quality, they were included in the analysis in addition to MPD and standard deviation. It should be pointed out that because 15 out of 30 chip seal projects were rated 100% in terms of MSQA, bias and complexity could arise associated when correlating texture measurements to MSQA rating. Table 4.5 presents the calculated MPD, standard deviation (Std), confidence interval, and percentiles by MSQA rating that is divided into five levels at 5-point interval or three levels at 10-point interval. When the MSQA rating is divided into 3 levels, the MPDs are 1.412, 1.379, and for 100%, 90%,100%, and 80%,90%, respectively. When the MSQA rating is divided into five levels, the MPD fluctuates within a small range, but overall decreases as MSQA score decreases. The confidence intervals are very narrow due to the large sampling size during texture testing, resulting in limited information on MSQA rating. It can be concluded that overall, there exists correlation between MSQA rating and summary statistics such as MPD and percentile texture attributes Analysis of Texture Depth Percentiles by Principal Component Analysis The MPD, texture Standard Deviation, texture P10, P25, P50, P75, and P90 in Table 4.4 are all summary statistics from texture measurements and correlations may exist among these variables. Pearson correlation coefficients were calculated to measure the relationships between these variable as shown in Figure 4.9. All texture percentile variables (P10 to P90) in the correlation matrix are positively correlated. Strong correlations (jrjw0:8) and moderate correlations (0:4vjrjv0:8) are found for most pairs of variables. However, the standard deviation (Std) has weaker relationships with some percentiles (r,0.4). Due to the collinearity among MPD, P10, P25, P50, P75, and P90, interpretation can be difficult if all of them are included in the regression model, but more predictor variables usually contain more information. Principal component analysis (PCA) was used to deal with the above dilemma. PCA is a widely used dimensionality reduction technique to reduce a larger set of correlated variables to a smaller set that contains most of the information in the larger set (Jolliffe, 2002). In short, PCA is performed on the correlation matrix or covariance matrix of the existing p variables (i.e., P10 to Joint Transportation Research Program Technical Report FHWA/IN/JTRP-2018/12 17
26 TABLE 4.4 Statistical Summary of 2017 Chip Seal Projects District * Road QA IRI N MPD Std Min. Max. P10 P25 P50 P75 P90 CF SR157a CF SR157b CF SR CF SR CF SR CF US FW SR FW SR FW SR FW SR FW SR FW SR FW SR GF SR GF SR GF SR GF SR LP SR LP SR LP US SM SR SM SR SM SR250a SM SR250b SM SR SM SR45a SM SR45b SM SR SM US VC SR *CF, Crawfordsville; FW, Fort Wayne; GF, Greenfield; LP, LaPorte; SM, Seymour; VC, Vincennes. TABLE 4.5 Statistical Summary of Texture Depth Grouped by MSQA Rating MSQA Level MSQA Range N MPD Std Lower Bound Upper Bound P10 P25 P50 P75 P90 5 Levels #MSQA,100 90#MSQA,95 85#MSQA,90 80#MSQA, Levels #MSQA,100 80#MSQA, P90 here), represented by. X ~½X 1,X 2,:::,X p Š The calculated eigenvalue-eigenvector pairs from can be expressed as, (l 1,e 1 ),(l 2,e 2 ),:::,(l p,e p ), where. l 1 l 2 ::: l p 0. Thus, the ith principal component (PC) can be denoted as Y i ~ e i X~e i1 X 1 ze i2 X 2 z::: ze ip X p with properties, Var(Y i )~e i X ei ~l i and Cov(Y i,y k )~ e i P ek ~0, where i51,2,,p and i?k. Therefore, PCs are uncorrelated linear combinations of existing p variables with variances equal to the eigenvalues of S. Larger eigenvalue means more information is explained by the PC, so it is reasonable to keep only a few PCs because most of information has been explained by them. As shown in Tables 4.6, PCA was performed on scaled variables, P10, P25, P50, P75, and P90. The standard deviation is the square roots of the eigenvalues (l i ) and the Total Variance5Sl i 55. The first PC explains 94.81% of the total variance and the second PC explains 4.96% of total variance. Since the first two PCs already account for 99.77% of total variance, the rest of PCs can be dropped in the later analysis. By carefully examining the coefficients of existing 18 Joint Transportation Research Program Technical Report FHWA/IN/JTRP-2018/12
 94.81 4.96 0.21 0.02 0.00 Cumulative Proportion (%) 94.81 99.77 99.98 100.00 100.00 P10 Coefficient -0.4296 0.7019 0.5200 0.2167 0.0735 P25 Coefficient -0.")
27 Figure 4.9 Correlation matrix for MPD, standard deviation, and percentiles. TABLE 4.6 Results of Principal Component Analysis Variable PC1 PC2 PC3 PC4 PC5 Standard Deviation Proportion of Variance (%) Cumulative Proportion (%) P10 Coefficient P25 Coefficient P50 Coefficient P75 Coefficient P90 Coefficient variables for each PC in Table 4.6, the first two principal components can be expressed as follows: PC 1 ~{0:4296 P10{0:4540 P25{0:4584 P50{0:4523 P75{0:4411 P90 PC 2 ~{0:7019 P10z0:2873 P25{0:0744 P50{0:3453 P75{0:5478 P90 Since it is still difficult to interpret PC1 and PC2, other variables are considered to replace PC1 and PC2 into the final regression model. However, examining the coefficients in PC1 and PC2 calculations revealed that PC1 is essentially a sum of P10 to P90. The coefficients in PC1 are quite close, and in fact, none of variables contributes significantly more than the others. If the distribution of measured texture depth is symmetric and unimodal, PC1 can be expressed as a function of P50, which is the sample mean (MPD) in essence. PC2 is a weighted difference from P10 to P90, in which the weight of P50 is significantly smaller than the others. After carefully examining the form of PC2, the initial speculation is that Interquartile Range (IQR) may be used to represent PC2. IQR, used as a measure of sample variability, is the difference between P75 and P25 representing the range of middle 50% of sample. To further demonstrate relationship between PC1 and MPD and between PC2 and IQR, scatter plots are made as shown in Figure It is shown that in Figure 4.10, strong linear relationships exist between PC1 and MPD and between PC2 and IQR. The coefficient of determination, R 2 is for PC1 and MPD, and for PC2 and IQR. Joint Transportation Research Program Technical Report FHWA/IN/JTRP-2018/12 19
The INDOT Friction Testing Program: Calibration, Testing, Data Management, and Application
 The INDOT Friction Testing Program: Calibration, Testing, Data Management, and Application Shuo Li, Ph.D., P.E. Transportation Research Engineer Phone: 765.463.1521 Email: sli@indot.in.gov Office of Research
Network Bridge Deck Surface Friction Testing: Issues and Performance Evaluation
 1 2 3 4 5 6 7 8 9 10 11 12 13 14 15 16 17 18 19 20 21 22 23 24 25 26 27 28 29 30 31 32 33 34 35 36 37 38 39 40 41 42 43 44 Network Bridge Deck Surface Friction Testing: Issues and Performance Evaluation
FHWA/IN/JTRP-2000/23. Final Report. Sedat Gulen John Nagle John Weaver Victor Gallivan
 FHWA/IN/JTRP-2000/23 Final Report DETERMINATION OF PRACTICAL ESALS PER TRUCK VALUES ON INDIANA ROADS Sedat Gulen John Nagle John Weaver Victor Gallivan December 2000 Final Report FHWA/IN/JTRP-2000/23 DETERMINATION
Striping Truck Utilization at Crawfordsville and Greenfield
 JOINT TRANSPORTATION RESEARCH PROGRAM INDIANA DEPARTMENT OF TRANSPORTATION AND PURDUE UNIVERSITY Striping Truck Utilization at Crawfordsville and Greenfield Jon Padfield Jim Handy Ted Boehm SPR-3722 Report
NCAT Report EFFECT OF FRICTION AGGREGATE ON HOT MIX ASPHALT SURFACE FRICTION. By Pamela Turner Michael Heitzman
 NCAT Report 13-09 EFFECT OF FRICTION AGGREGATE ON HOT MIX ASPHALT SURFACE FRICTION By Pamela Turner Michael Heitzman July 2013 EFFECT OF FRICTION AGGREGATE ON HOT MIX ASPHALT SURFACE FRICTION By Pamela
Non-Destructive Pavement Testing at IDOT. LaDonna R. Rowden, P.E. Pavement Technology Engineer
 Non-Destructive Pavement Testing at IDOT LaDonna R. Rowden, P.E. Pavement Technology Engineer Bureau of Materials and Physical Research Physical Research Section Bridge Investigations Unit Pavement Technology
Influence of Hot Mix Asphalt Macrotexture on Skid Resistance
 Influence of Hot Mix Asphalt Macrotexture on Skid Resistance Prepared by: Mary Stroup-Gardiner Brandy Studdard Christopher Wagner Auburn University Civil Engineering Department 238 Harbert Auburn, Alabama
Rehabilitated PCC Surface Characteristics
 Rehabilitated PCC Surface Characteristics Dr. W. James Wilde, P.E. Professor, Minnesota State University Director, Center for Transportation Research and Implementation Mankato, Minnesota Mr. Elliott Dick
DRIVER SPEED COMPLIANCE WITHIN SCHOOL ZONES AND EFFECTS OF 40 PAINTED SPEED LIMIT ON DRIVER SPEED BEHAVIOURS Tony Radalj Main Roads Western Australia
 DRIVER SPEED COMPLIANCE WITHIN SCHOOL ZONES AND EFFECTS OF 4 PAINTED SPEED LIMIT ON DRIVER SPEED BEHAVIOURS Tony Radalj Main Roads Western Australia ABSTRACT Two speed surveys were conducted on nineteen
PN 420-7/18/ SURFACE SMOOTHNESS REQUIREMENTS FOR PAVEMENTS
 PN 420-7/18/2014 - SURFACE SMOOTHNESS REQUIREMENTS FOR PAVEMENTS DESCRIPTION: The surface tolerance specification requirements are modified as follows for all mainline lanes and collector-distributor road
KENTUCKY TRANSPORTATION CENTER
 Research Report KTC-08-10/UI56-07-1F KENTUCKY TRANSPORTATION CENTER EVALUATION OF 70 MPH SPEED LIMIT IN KENTUCKY OUR MISSION We provide services to the transportation community through research, technology
Measurement of Tire/Pavement Noise
 Measurement of Tire/Pavement Noise 34 Hot Mix Asphalt Technology JANUARY/FEBRUARY 2005 Sound caused by transportation systems is the number one noise complaint. Figure 1 Wayside measurements Research in
DESCRIPTION This work consists of measuring the smoothness of the final concrete or bituminous surface.
 2399 PAVEMENT SURFACE SMOOTHNESS 2399.1 DESCRIPTION This work consists of measuring the smoothness of the final concrete or bituminous surface. A Definitions The Department defines Smoothness as the Mean
EFFECT OF PAVEMENT CONDITIONS ON FUEL CONSUMPTION, TIRE WEAR AND REPAIR AND MAINTENANCE COSTS
 EFFECT OF PAVEMENT CONDITIONS ON FUEL CONSUMPTION, TIRE WEAR AND REPAIR AND MAINTENANCE COSTS Graduate of Polytechnic School of Tunisia, 200. Completed a master degree in 200 in applied math to computer
Development of Turning Templates for Various Design Vehicles
 Transportation Kentucky Transportation Center Research Report University of Kentucky Year 1991 Development of Turning Templates for Various Design Vehicles Kenneth R. Agent Jerry G. Pigman University of
Control of Pavement Smoothness in Kansas
 Report No. FHWA-KS-8-5 Final REPORT Control of Pavement Smoothness in Kansas William H. Parcells, Jr., P.E. Kansas Department of Transportation Topeka, Kansas May 29 KANSAS DEPARTMENT OF TRANSPORTATION
MICHIGAN DEPARTMENT OF TRANSPORTATION SPECIAL PROVISION FOR PAVEMENT RIDE QUALITY (MEAN ROUGHNESS INDEX ACCEPTANCE CRITERIA)
") MICHIGAN DEPARTMENT OF TRANSPORTATION SPECIAL PROVISION FOR PAVEMENT RIDE QUALITY (MEAN ROUGHNESS INDEX ACCEPTANCE CRITERIA) CFS:TEH 1 of 10 APPR:KPK:JFS:07-07-16 FHWA:APPR:07-15-16 a. Description. This
MICHIGAN DEPARTMENT OF TRANSPORTATION SPECIAL PROVISION FOR PAVEMENT RIDE QUALITY (MEAN ROUGHNESS INDEX ACCEPTANCE CRITERIA) CFS:TEH 1 of 10 APPR:KPK:JFS:07-07-16 FHWA:APPR:07-15-16 a. Description. This
Linking the Virginia SOL Assessments to NWEA MAP Growth Tests *
 Linking the Virginia SOL Assessments to NWEA MAP Growth Tests * *As of June 2017 Measures of Academic Progress (MAP ) is known as MAP Growth. March 2016 Introduction Northwest Evaluation Association (NWEA
PN /21/ SURFACE SMOOTHNESS REQUIREMENTS FOR PAVEMENTS
 PN 420-10/21/2016 - SURFACE SMOOTHNESS REQUIREMENTS FOR PAVEMENTS DESCRIPTION: The surface tolerance specification requirements are modified as follows for all pavements of constant width with at least
Linking the Alaska AMP Assessments to NWEA MAP Tests
 Linking the Alaska AMP Assessments to NWEA MAP Tests February 2016 Introduction Northwest Evaluation Association (NWEA ) is committed to providing partners with useful tools to help make inferences from
DESIGN METHODS FOR SAFETY ENHANCEMENT MEASURES ON LONG STEEP DOWNGRADES
 DESIGN METHODS FOR SAFETY ENHANCEMENT MEASURES ON LONG STEEP DOWNGRADES Jun-hong Liao Research Institute of Highway, MOT, China 8 Xitucheng Rd, Beijing, China MOE Key Laboratory for Urban Transportation
Spatial and Temporal Analysis of Real-World Empirical Fuel Use and Emissions
 Spatial and Temporal Analysis of Real-World Empirical Fuel Use and Emissions Extended Abstract 27-A-285-AWMA H. Christopher Frey, Kaishan Zhang Department of Civil, Construction and Environmental Engineering,
Linking the New York State NYSTP Assessments to NWEA MAP Growth Tests *
 Linking the New York State NYSTP Assessments to NWEA MAP Growth Tests * *As of June 2017 Measures of Academic Progress (MAP ) is known as MAP Growth. March 2016 Introduction Northwest Evaluation Association
SMOOTH PAVEMENTS LAST LONGER! Diamond Grinding THE ULTIMATE QUESTION! Rigid Pavement Design Equation. Preventive Maintenance 2 Session 2 2-1
 THE ULTIMATE QUESTION! Diamond Increased Pavement Performance and Customer Satisfaction Using Diamond How do I make limited budget dollars stretch and provide a highway system that offers a high level
Table Standardized Naming Convention for ERD Files
 S-1 (2399) PAVEMENT SURFACE SMOOTHNESS (2013 version) DO NOT REMOVE THIS. IT NEEDS TO STAY IN FOR THE CONTRACTORS. Always use with SP2005-111 (CONCRETE PAVING MIX SPECIFICATIONS PAVEMENT) and SP2005-140
Oregon DOT Slow-Speed Weigh-in-Motion (SWIM) Project: Analysis of Initial Weight Data
 Project: Analysis of Initial Weight Data") Portland State University PDXScholar Center for Urban Studies Publications and Reports Center for Urban Studies 7-1997 Oregon DOT Slow-Speed Weigh-in-Motion (SWIM) Project: Analysis of Initial Weight Data
Portland State University PDXScholar Center for Urban Studies Publications and Reports Center for Urban Studies 7-1997 Oregon DOT Slow-Speed Weigh-in-Motion (SWIM) Project: Analysis of Initial Weight Data
PREDICTION OF FUEL CONSUMPTION
 PREDICTION OF FUEL CONSUMPTION OF AGRICULTURAL TRACTORS S. C. Kim, K. U. Kim, D. C. Kim ABSTRACT. A mathematical model was developed to predict fuel consumption of agricultural tractors using their official
Linking the North Carolina EOG Assessments to NWEA MAP Growth Tests *
 Linking the North Carolina EOG Assessments to NWEA MAP Growth Tests * *As of June 2017 Measures of Academic Progress (MAP ) is known as MAP Growth. March 2016 Introduction Northwest Evaluation Association
CATEGORY 500 PAVING SECTION 535 PAVEMENT SURFACE PROFILE
 CATEGORY 500 PAVING 1 of 9 SECTION 535.01 DESCRIPTION. This work shall consist of measuring the roughness of the final surface of hot mix asphalt (HMA) or portland cement concrete (PCC) pavements. The
SUCCESSFUL PERFORMANCE PAVEMENT PROJECTS 2015 TxAPA Annual Meeting September 23, 2015 Austin District Mike Arellano, P.E. Date
 SUCCESSFUL PERFORMANCE PAVEMENT PROJECTS 2015 TxAPA Annual Meeting September 23, 2015 Austin District Mike Arellano, P.E. Date AUSTIN DISTRICT SAFETY PERFORMANCE OF HIGH- FRICTION MIXTURES Mike Arellano,
Reduction of vehicle noise at lower speeds due to a porous open-graded asphalt pavement
 Reduction of vehicle noise at lower speeds due to a porous open-graded asphalt pavement Paul Donavan 1 1 Illingworth & Rodkin, Inc., USA ABSTRACT Vehicle noise measurements were made on an arterial roadway
Linking the Kansas KAP Assessments to NWEA MAP Growth Tests *
 Linking the Kansas KAP Assessments to NWEA MAP Growth Tests * *As of June 2017 Measures of Academic Progress (MAP ) is known as MAP Growth. February 2016 Introduction Northwest Evaluation Association (NWEA
WHITE PAPER. Preventing Collisions and Reducing Fleet Costs While Using the Zendrive Dashboard
 WHITE PAPER Preventing Collisions and Reducing Fleet Costs While Using the Zendrive Dashboard August 2017 Introduction The term accident, even in a collision sense, often has the connotation of being an
Act 229 Evaluation Report
 R22-1 W21-19 W21-20 Act 229 Evaluation Report Prepared for Prepared by Table of Contents 1. Documentation Page 3 2. Executive Summary 4 2.1. Purpose 4 2.2. Evaluation Results 4 3. Background 4 4. Approach
Linking the Georgia Milestones Assessments to NWEA MAP Growth Tests *
 Linking the Georgia Milestones Assessments to NWEA MAP Growth Tests * *As of June 2017 Measures of Academic Progress (MAP ) is known as MAP Growth. February 2016 Introduction Northwest Evaluation Association
Measurement methods for skid resistance of road surfaces
 Measurement methods for skid resistance of road surfaces Presented by Martin Greene (TRL) and Veronique Cerezo (IFSTTAR) 11 October 2016 Background and requirements for Common Scale 1 Background Measurement
PVP Field Calibration and Accuracy of Torque Wrenches. Proceedings of ASME PVP ASME Pressure Vessel and Piping Conference PVP2011-
 Proceedings of ASME PVP2011 2011 ASME Pressure Vessel and Piping Conference Proceedings of the ASME 2011 Pressure Vessels July 17-21, & Piping 2011, Division Baltimore, Conference Maryland PVP2011 July
THE USE OF PERFORMANCE METRICS ON THE PENNSYLVANIA TURNPIKE
 Wilke, P.W.; Hatalowich, P.A. 1 THE USE OF PERFORMANCE METRICS ON THE PENNSYLVANIA TURNPIKE Paul Wilke, P.E. Principal Engineer Corresponding Author Applied Research Associates Inc. 3605 Hartzdale Drive
Profiler Certification Process at the Virginia Smart Road
 Pavement Surface Properties Consortium Profiler Certification Process at the Virginia Smart Road Center for Sustainable Transportation Infrastructure Outline Introduction Objectives Profiler Certification
MN Roads Low Volume Road Testing to Validate the Purdue TPTA Textures and Predicted Joint Effects
 AMERICAN CONCRETE PAVEMENT ASSOCIATION MN Roads Low Volume Road Testing to Validate the Purdue TPTA Textures and Predicted Joint Effects Workplan Prepared by Larry Scofield American Concrete Pavement Association
Linking the Indiana ISTEP+ Assessments to NWEA MAP Tests
 Linking the Indiana ISTEP+ Assessments to NWEA MAP Tests February 2017 Introduction Northwest Evaluation Association (NWEA ) is committed to providing partners with useful tools to help make inferences
CHARACTERIZATION AND DEVELOPMENT OF TRUCK LOAD SPECTRA FOR CURRENT AND FUTURE PAVEMENT DESIGN PRACTICES IN LOUISIANA
 CHARACTERIZATION AND DEVELOPMENT OF TRUCK LOAD SPECTRA FOR CURRENT AND FUTURE PAVEMENT DESIGN PRACTICES IN LOUISIANA LSU Research Team Sherif Ishak Hak-Chul Shin Bharath K Sridhar OUTLINE BACKGROUND AND
Linking the Mississippi Assessment Program to NWEA MAP Tests
 Linking the Mississippi Assessment Program to NWEA MAP Tests February 2017 Introduction Northwest Evaluation Association (NWEA ) is committed to providing partners with useful tools to help make inferences
SCRIM Friction Testing in the USA. Edgar de León Izeppi, Research Scientist Virginia Tech Transportation Institute Nashville, October 13 th 2,016
 SCRIM Friction Testing in the USA Edgar de León Izeppi, Research Scientist Virginia Tech Transportation Institute Nashville, October 13 th 2,016 Outline Introduction: What is the SCRIM? Background and
A REPORT ON THE STATISTICAL CHARACTERISTICS of the Highlands Ability Battery CD
 A REPORT ON THE STATISTICAL CHARACTERISTICS of the Highlands Ability Battery CD Prepared by F. Jay Breyer Jonathan Katz Michael Duran November 21, 2002 TABLE OF CONTENTS Introduction... 1 Data Determination
The effect of grinding and grooving on the noise generation of Portland Cement Concrete pavement
 The effect of grinding and grooving on the noise generation of Portland Cement Concrete pavement T. Wulf, T. Dare and R. Bernhard Purdue Univ., 140 Martin Jischke Dr., Herrick Lab., West Lafayette, IN
Development of a Moving Automatic Flagger Assistance Device (AFAD) for Moving Work Zone Operations
 for Moving Work Zone Operations") Development of a Moving Automatic Flagger Assistance Device (AFAD) for Moving Work Zone Operations Edward F. Terhaar, Principal Investigator Wenck Associates, Inc. March 2017 Research Project Final Report
Development of a Moving Automatic Flagger Assistance Device (AFAD) for Moving Work Zone Operations Edward F. Terhaar, Principal Investigator Wenck Associates, Inc. March 2017 Research Project Final Report
MICHIGAN DEPARTMENT OF TRANSPORTATION SPECIAL PROVISION FOR PAVEMENT RIDE QUALITY (IRI ACCEPTANCE CRITERIA)
") MICHIGAN DEPARTMENT OF TRANSPORTATION 03SP502(P) SPECIAL PROVISION FOR PAVEMENT RIDE QUALITY (IRI ACCEPTANCE CRITERIA) C&T:TEH 1 of 8 C&T:APPR:JFS:MJE:01-28-08 FHWA:APPR:02-01-08 a. Description. Provide
MICHIGAN DEPARTMENT OF TRANSPORTATION 03SP502(P) SPECIAL PROVISION FOR PAVEMENT RIDE QUALITY (IRI ACCEPTANCE CRITERIA) C&T:TEH 1 of 8 C&T:APPR:JFS:MJE:01-28-08 FHWA:APPR:02-01-08 a. Description. Provide
7. Author(s) Shan Bao, Michael J. Flannagan, James R. Sayer, Mitsuhiro Uchida 9. Performing Organization Name and Address
 Shan Bao, Michael J. Flannagan, James R. Sayer, Mitsuhiro Uchida 9. Performing Organization Name and Address") 1. Report No. UMTRI-2011-48 4. Title and Subtitle The Effect of Headlamp Vertical Aim on Performance of a Lane Tracking System 7. Author(s) Shan Bao, Michael J. Flannagan, James R. Sayer, Mitsuhiro Uchida
1. Report No. UMTRI-2011-48 4. Title and Subtitle The Effect of Headlamp Vertical Aim on Performance of a Lane Tracking System 7. Author(s) Shan Bao, Michael J. Flannagan, James R. Sayer, Mitsuhiro Uchida
SPECIFICATION FOR SKID RESISTANCE INVESTIGATION AND TREATMENT SELECTION
 SPECIFICATION FOR SKID RESISTANCE 1. SCOPE This specification outlines the process for identifying sites where treatment to improve skid resistance may be justified. 2. GLOSSARY AND DEFINITIONS Bleeding:
Managing the Maintenance of the Runway at Baghdad International Airport
 Managing the Maintenance of the Runway at Baghdad International Airport Saad Issa Sarsam Professor of Transportation Engineering Head of the Department of Civil Engineering College of Engineering - University
The Deployable Gage Restraint Measurement System - Description and Operational Performance
 The Deployable Gage Restraint Measurement System - Description and Operational Performance GARY A. MARTIN ENSCO, INC 5400 PORT ROYAL ROAD SPRINGFIELD, VA 22151 703-321-4513 703-321-7619 (FAX) JEFFREY A.
Hydro Plant Risk Assessment Guide
 September 2006 Hydro Plant Risk Assessment Guide Appendix E8: Battery Condition Assessment E8.1 GENERAL Plant or station batteries are key components in hydroelectric powerplants and are appropriate for
Evaluation of Retroreflectivity Measurement Techniques for Profiled and Rumble Stripe Pavement Markings
 PAPER #11-1293 Evaluation of Retroreflectivity Measurement Techniques for Profiled and Rumble Stripe Pavement Markings by Adam M. Pike, P.E. (Corresponding Author) Assistant Research Engineer Texas Transportation
CFIRE December 2009
 i BRIDGE ANALYSIS AND EVALUATION OF EFFECTS UNDER OVERLOAD VEHICLES (PHASE 1) CFIRE 02-03 December 2009 National Center for Freight & Infrastructure Research & Education College of Engineering Department
sponsoring agencies.)
") DEPARTMENT OF HIGHWAYS AND TRANSPORTATION VIRGINIA TESTING EQUIPMENT CORRELATION RESULTS SKID 1974, 1975, and 1978 N. Runkle Stephen Analyst Research opinions, findings, and conclusions expressed in this
DEPARTMENT OF HIGHWAYS AND TRANSPORTATION VIRGINIA TESTING EQUIPMENT CORRELATION RESULTS SKID 1974, 1975, and 1978 N. Runkle Stephen Analyst Research opinions, findings, and conclusions expressed in this
Linking the Florida Standards Assessments (FSA) to NWEA MAP
 to NWEA MAP") Linking the Florida Standards Assessments (FSA) to NWEA MAP October 2016 Introduction Northwest Evaluation Association (NWEA ) is committed to providing partners with useful tools to help make inferences
Linking the Florida Standards Assessments (FSA) to NWEA MAP October 2016 Introduction Northwest Evaluation Association (NWEA ) is committed to providing partners with useful tools to help make inferences
Darwin-ME Status and Implementation Efforts_IAC09
 Darwin-ME Status and Implementation Efforts_IAC9 What s Being Used (7 survey) Asphalt Design: MEPDG Darwin-ME Status and Implementation Efforts Idaho Asphalt Conference October, 9 Does SHA Use or Plan
High Friction Surfaces and Other Innovative Pavement Surface Treatments for Reduced Highway Noise
 High Friction Surfaces and Other Innovative Pavement Surface Treatments for Reduced Highway Noise Bebe Resendez The Transtec Group, Inc. July 20-23, 2008 ADC40 Summer Meeting Key West, Florida What are
Sight Distance. A fundamental principle of good design is that
 Session 9 Jack Broz, PE, HR Green May 5-7, 2010 Sight Distance A fundamental principle of good design is that the alignment and cross section should provide adequate sight lines for drivers operating their
ASSESSMENT AND EFFECTIVE MANAGEMENT OF PAVEMENT SURFACE FRICTION. Shila Khanal, MASc.,P.Eng. Pavement Engineer
 ASSESSMENT AND EFFECTIVE MANAGEMENT OF PAVEMENT SURFACE FRICTION Shila Khanal, MASc.,P.Eng. Pavement Engineer skhanal@ara.com David K. Hein, P.Eng. Principal Engineer Vice-President, Transportation dhein@ara.com
HAS MOTORIZATION IN THE U.S. PEAKED? PART 2: USE OF LIGHT-DUTY VEHICLES
 UMTRI-2013-20 JULY 2013 HAS MOTORIZATION IN THE U.S. PEAKED? PART 2: USE OF LIGHT-DUTY VEHICLES MICHAEL SIVAK HAS MOTORIZATION IN THE U.S. PEAKED? PART 2: USE OF LIGHT-DUTY VEHICLES Michael Sivak The University
Linking the Indiana ISTEP+ Assessments to the NWEA MAP Growth Tests. February 2017 Updated November 2017
 Linking the Indiana ISTEP+ Assessments to the NWEA MAP Growth Tests February 2017 Updated November 2017 2017 NWEA. All rights reserved. No part of this document may be modified or further distributed without
PR V2. Submitted by. Professor MIDWEST Vine Street (402) Submitted to
 Submitted to") FINAL REPORT PR4893118-V2 ZONE OF INTRUSION STUDY Submitted by John D. Reid, Ph.D. Professor Dean L.. Sicking, Ph.D., P.E. Professorr and MwRSF Director MIDWEST ROADSIDE SAFETY FACILITY University of Nebraska-Lincoln
FINAL REPORT PR4893118-V2 ZONE OF INTRUSION STUDY Submitted by John D. Reid, Ph.D. Professor Dean L.. Sicking, Ph.D., P.E. Professorr and MwRSF Director MIDWEST ROADSIDE SAFETY FACILITY University of Nebraska-Lincoln
Minnesota DOT -- RDM Experience. Dr. Kyle Hoegh, MnDOT Dr. Shongtao Dai, MnDOT Dr. Lev Khazanovich, U. of Pittsburgh
 Minnesota DOT -- RDM Experience Dr. Kyle Hoegh, MnDOT Dr. Shongtao Dai, MnDOT Dr. Lev Khazanovich, U. of Pittsburgh Acknowledgements FHWA/AASHTO for providing RDM MnDOT district materials and constructions
3-D Laser Data Collection and Analysis of Road Surface Texture
 3-D Laser Data Collection and Analysis of Road Surface Texture Humaira Zahir, Mustaque Hossain, Rick Miller ROAD PROFILE USERS GROUP MEETING, 2015 RALEIGH, NC Presentation Organization - Introduction -
REMOTE SENSING DEVICE HIGH EMITTER IDENTIFICATION WITH CONFIRMATORY ROADSIDE INSPECTION
 Final Report 2001-06 August 30, 2001 REMOTE SENSING DEVICE HIGH EMITTER IDENTIFICATION WITH CONFIRMATORY ROADSIDE INSPECTION Bureau of Automotive Repair Engineering and Research Branch INTRODUCTION Several
Compliance Test Results. of Independently Manufactured. Automotive Replacement Headlamps. to FMVSS 108. Study I. March 18, 2003
 Compliance Test Results of Independently Manufactured Automotive Replacement Headlamps to FMVSS 108 Study I March 18, 2003 Prepared By Certified Automotive Parts Association 1518 K Street NW, Suite 306
ITEM 585 RIDE QUALITY FOR PAVEMENT SURFACES Description. Measure and evaluate the ride quality of pavement surfaces.
 ITEM 585 RIDE QUALITY FOR PAVEMENT SURFACES 585.1. Description. Measure and evaluate the ride quality of pavement surfaces. 585.2. Equipment. A. Surface Test Type A. Provide a 10-ft. straightedge. B. Surface
The University of Texas at Arlington The University of Texas System Texas Transportation Institute The Texas A&M University System
 1. Report No. FHWA/TX-08/5-4385-01-1 4. Title and Subtitle PILOT IMPLEMENTATION OF BUMP DETECTION PROFILER Technical Report Documentation Page 2. Government Accession No. 3. Recipient's Catalog No. 5.
What do autonomous vehicles mean to traffic congestion and crash? Network traffic flow modeling and simulation for autonomous vehicles
 What do autonomous vehicles mean to traffic congestion and crash? Network traffic flow modeling and simulation for autonomous vehicles FINAL RESEARCH REPORT Sean Qian (PI), Shuguan Yang (RA) Contract No.
Missouri Seat Belt Usage Survey for 2017
 Missouri Seat Belt Usage Survey for 2017 Conducted for the Highway Safety & Traffic Division of the Missouri Department of Transportation by The Missouri Safety Center University of Central Missouri Final
Evaluation of Major Street Speeds for Minnesota Intersection Collision Warning Systems
 Evaluation of Major Street Speeds for Minnesota Intersection Collision Warning Systems Shauna Hallmark, Principal Investigator Center for Transportation Research and Education Iowa State University June
Measuring Pavement Condition Data for a Long-term Pavement Performance Study on New Zealand Roads. D Brown
 Measuring Pavement Condition Data for a Long-term Pavement Performance Study on New Zealand Roads. D Brown Measuring Pavement Condition Data for a Long-term Pavement Performance Study Background Measurement
Unitil Energy Demand Response Demonstration Project Proposal October 12, 2016
 Unitil Energy Demand Response Demonstration Project Proposal October 12, 2016 Fitchburg Gas and Electric Light Company d/b/a Unitil ( Unitil or the Company ) indicated in the 2016-2018 Energy Efficiency
Correcting Low Asphalt Pavement Friction. Brian L. Schleppi OH DOT Office of Technical Services
 Correcting Low Asphalt Pavement Friction Brian L. Schleppi OH DOT Office of Technical Services Overview AC Pavement Surface Features which give us Friction Ideas about Friction Demand (How much friction
Additional Transit Bus Life Cycle Cost Scenarios Based on Current and Future Fuel Prices
 U.S. Department Of Transportation Federal Transit Administration FTA-WV-26-7006.2008.1 Additional Transit Bus Life Cycle Cost Scenarios Based on Current and Future Fuel Prices Final Report Sep 2, 2008
Traffic and Toll Revenue Estimates
 The results of WSA s assessment of traffic and toll revenue characteristics of the proposed LBJ (MLs) are presented in this chapter. As discussed in Chapter 1, Alternatives 2 and 6 were selected as the
Chapter 12 VEHICLE SPOT SPEED STUDY
 Chapter 12 VEHICLE SPOT SPEED STUDY 12.1 PURPOSE (1) The Vehicle Spot Speed Study is designed to measure the speed characteristics at a specified location under the traffic and environmental conditions
Heating Comparison of Radial and Bias-Ply Tires on a B-727 Aircraft
 'S Heating Comparison of Radial and Bias-Ply Tires on a B-727 Aircraft November 1997 DOT/FAA/AR-TN97/50 This document is available to the U.S. public through the National Technical Information Service
CHANGE IN DRIVERS PARKING PREFERENCE AFTER THE INTRODUCTION OF STRENGTHENED PARKING REGULATIONS
 CHANGE IN DRIVERS PARKING PREFERENCE AFTER THE INTRODUCTION OF STRENGTHENED PARKING REGULATIONS Kazuyuki TAKADA, Tokyo Denki University, takada@g.dendai.ac.jp Norio TAJIMA, Tokyo Denki University, 09rmk19@dendai.ac.jp
Analyzing Crash Risk Using Automatic Traffic Recorder Speed Data
 Analyzing Crash Risk Using Automatic Traffic Recorder Speed Data Thomas B. Stout Center for Transportation Research and Education Iowa State University 2901 S. Loop Drive Ames, IA 50010 stouttom@iastate.edu
Headlight Test and Rating Protocol (Version I)
") Headlight Test and Rating Protocol (Version I) February 2016 HEADLIGHT TEST AND RATING PROTOCOL (VERSION I) This document describes the Insurance Institute for Highway Safety (IIHS) headlight test and
Headlight Test and Rating Protocol (Version I) February 2016 HEADLIGHT TEST AND RATING PROTOCOL (VERSION I) This document describes the Insurance Institute for Highway Safety (IIHS) headlight test and
DISTRIBUTION: Electronic Recipients List TRANSMITTAL LETTER NO. (15-01) MINNESOTA DEPARTMENT OF TRANSPORTATION. MANUAL: Road Design English Manual
 MINNESOTA DEPARTMENT OF TRANSPORTATION. MANUAL: Road Design English Manual") DISTRIBUTION: Electronic Recipients List MINNESOTA DEPARTMENT OF TRANSPORTATION DEVELOPED BY: Design Standards Unit ISSUED BY: Office of Project Management and Technical Support TRANSMITTAL LETTER NO.
DISTRIBUTION: Electronic Recipients List MINNESOTA DEPARTMENT OF TRANSPORTATION DEVELOPED BY: Design Standards Unit ISSUED BY: Office of Project Management and Technical Support TRANSMITTAL LETTER NO.
Pavement Management Index Values Development of a National Standard. Mr. Douglas Frith Mr. Dennis Morian
 Pavement Management Index Values Development of a National Standard Mr. Douglas Frith Mr. Dennis Morian Pavement Evaluation Conference October 25-27, 2010 Background NCHRP 20-74A Development of Service
TRAFFIC SIMULATION IN REGIONAL MODELING: APPLICATION TO THE INTERSTATEE INFRASTRUCTURE NEAR THE TOLEDO SEA PORT
 MICHIGAN OHIO UNIVERSITY TRANSPORTATION CENTER Alternate energy and system mobility to stimulate economic development. Report No: MIOH UTC TS41p1-2 2012-Final TRAFFIC SIMULATION IN REGIONAL MODELING: APPLICATION
Pavement Surface Properties Consortium Phase II (TPF-5[345])
![Pavement Surface Properties Consortium Phase II (TPF-5[345])](/thumbs/92/109191131.jpg "Pavement Surface Properties Consortium Phase II (TPF-5[345])") Pavement Surface Properties Consortium Phase II (TPF-5[345]) OBJECTIVES A research program focused on enhancing the level of service provided by the roadway transportation system through optimized pavement
Pavement Surface Properties Consortium Phase II (TPF-5[345]) OBJECTIVES A research program focused on enhancing the level of service provided by the roadway transportation system through optimized pavement
ASTM D4169 Truck Profile Update Rationale Revision Date: September 22, 2016
 Over the past 10 to 15 years, many truck measurement studies have been performed characterizing various over the road environment(s) and much of the truck measurement data is available in the public domain.
Readily Achievable EEDI Requirements for 2020
 Readily Achievable EEDI Requirements for 2020 Readily Achievable EEDI Requirements for 2020 This report is prepared by: CE Delft Delft, CE Delft, June 2016 Publication code: 16.7J33.57 Maritime transport
Technical Papers supporting SAP 2009
 Technical Papers supporting SAP 29 A meta-analysis of boiler test efficiencies to compare independent and manufacturers results Reference no. STP9/B5 Date last amended 25 March 29 Date originated 6 October
Insert the title of your. Recent research on surface texture
 Insert the title of your presentation here Recent research on surface texture Presented Presented by by Martin Name Greene Here Senior Job Title Researcher - Date 20/10/11 Surface texture and tyre tread
NCUTCD Proposal for Changes to the Manual on Uniform Traffic Control Devices
 1 2 3 4 5 6 7 8 9 10 11 12 13 14 15 16 17 18 19 20 21 22 23 24 25 26 27 28 29 30 31 32 TECHNICAL COMMITTEE: ITEM NUMBER: TOPIC: ORIGIN OF REQUEST: AFFECTED SECTIONS OF MUTCD: NCUTCD Proposal for Changes
Performance of Batteries in Grid Connected Energy Storage Systems. June 2018
 Performance of Batteries in Grid Connected Energy Storage Systems June 2018 PERFORMANCE OF BATTERIES IN GRID CONNECTED ENERGY STORAGE SYSTEMS Authors Laurie Florence, Principal Engineer, UL LLC Northbrook,
Investigation of Relationship between Fuel Economy and Owner Satisfaction
 Investigation of Relationship between Fuel Economy and Owner Satisfaction June 2016 Malcolm Hazel, Consultant Michael S. Saccucci, Keith Newsom-Stewart, Martin Romm, Consumer Reports Introduction This
Department of Legislative Services Maryland General Assembly 2012 Session
 Department of Legislative Services Maryland General Assembly 2012 Session HB 944 FISCAL AND POLICY NOTE House Bill 944 Environmental Matters (Delegate Frush, et al.) Vehicle Laws - Speed Monitoring Systems
HAS MOTORIZATION IN THE U.S. PEAKED? PART 5: UPDATE THROUGH 2012
 UMTRI-2014-11 APRIL 2013 HAS MOTORIZATION IN THE U.S. PEAKED? PART 5: UPDATE THROUGH 2012 MICHAEL SIVAK HAS MOTORIZATION IN THE U.S. PEAKED? PART 5: UPDATE THROUGH 2012 Michael Sivak The University of
Reliability and Validity of Seat Interface Pressure to Quantify Seating Comfort in Motorcycles
 Reliability and Validity of Seat Interface Pressure to Quantify Seating Comfort in Motorcycles Sai Praveen Velagapudi a,b, Ray G. G b a Research & Development, TVS Motor Company, INDIA; b Industrial Design
MIT ICAT M I T I n t e r n a t i o n a l C e n t e r f o r A i r T r a n s p o r t a t i o n
 M I T I n t e r n a t i o n a l C e n t e r f o r A i r T r a n s p o r t a t i o n Standard Flow Abstractions as Mechanisms for Reducing ATC Complexity Jonathan Histon May 11, 2004 Introduction Research
LONG RANGE PERFORMANCE REPORT. Study Objectives: 1. To determine annually an index of statewide turkey populations and production success in Georgia.
 State: Georgia Grant Number: 08-953 Study Number: 6 LONG RANGE PERFORMANCE REPORT Grant Title: State Funded Wildlife Survey Period Covered: July 1, 2010 - June 30, 2011 Study Title: Wild Turkey Production
BROWARD BOULEVARD CORRIDOR TRANSIT STUDY
 BROWARD BOULEVARD CORRIDOR TRANSIT STUDY FM # 42802411201 EXECUTIVE SUMMARY July 2012 GOBROWARD Broward Boulevard Corridor Transit Study FM # 42802411201 Executive Summary Prepared For: Ms. Khalilah Ffrench,