SHORT PAPER PCB OBLIQUE COLLISIONS ENGINEERING EQUATIONS, INPUT DATA AND MARC 1 APPLICATIONS. Dennis F. Andrews, Franco Gamero, Rudy Limpert
|
|
|
- Norah Manning
- 5 years ago
- Views:
Transcription
1 SHORT PAPER PCB OBLIQUE COLLISIONS ENGINEERING EQUATIONS, INPUT DATA AND MARC 1 APPLICATIONS By: Dennis F. Andrews, Franco Gamero, Rudy Limpert PC-BRAKE, INC
2 PURPOSE OF PCB SHORT PAPERS To provide the accident reconstruction practitioner with a concise discussion of the engineering equations and limiting factors involved, evaluation of critical input data, and the analysis of actual cases by use of the MARC 1 computer software. Short Papers are available free of charge and can be obtained by visiting our website at We hope that our Short Papers will assist the practitioner in better understanding the limitations inherent in any derivation of engineering equations, to properly use critical input data, to more accurately and effectively formulate his or her case under consideration, to become a better prepared expert in the field of accident reconstruction, and to more effectively utilize the full potential of the MARC 1 computer program. Comments and suggestions are always invited by visiting our Discussion Forum and/or by writing to: PC-BRAKE, INC E. Tollgate Road Park City, Utah Throughout the Short Papers we will extensively reference the 5 th Edition of Motor Vehicle Accident Reconstructions and Cause Analysis by Rudolf Limpert, the Accident Reconstruction Catalog (ARC) CD, as well as the MARC 1 software. 2
3 OBLIQUE COLLISIONS Part Four Linear and Rotational Momentum Determine After-Impact Data from Known Impact Data (The Crash Test on Paper) 1. DEFINITION OF LINEAR AND ROTATIONAL MOMENTUM The basic formulation of linear and rotational momentum is discussed in Section 33-5 of the Text. The after-impact center-of-gravity velocities and angular velocities of each vehicle are calculated for known impact velocities and collision configuration by Equations through WHAT ENGINEERING PRINCIPLES APPLY The impulse components are calculated by Equations and based upon the relative velocities before as well as the center-of-gravity distances relative to the contact point (common velocity) between the vehicles. As Example 33-6 of the Text shows, the analysis presented in Section 33-5(b) calculates the center-of-gravity velocities and angular velocities of both vehicles after impact based upon known data at the moment of impact. For the discussion that follows we assume that the impact configuration is known. This means that the distances (or lever arms of the moment of momentum) are known from the collision diagram (MARC 1 Y). With the masses and mass moment of inertia for both vehicles known, a-, b- and c-values are also known. See Figure of the Text for a collision diagram example. We also assume that the approach angles are known for both vehicles. MARC 1 X8 computes all essential after-impact data based upon known impact velocity vectors V 11 and V 21. Energy balance is included in MARC 1 X8 to allow an accuracy check by use of the crush energies exhibited by the vehicles involved. Both oblique and in-line collision configurations can be analyzed. A common velocity must be achieved by the colliding vehicles. MARC 1 X8 can be used effectively to critique another expert s crash reconstruction by running a crash test on paper using the expert s input data. 3. NON-CENTRAL OBLIQUE IMPACT 3
4 We will analyze the crash test discussed in PCB5 2006, Section 4.1. The same crash test was also analyzed in PCB and PCB A stationary VW Derby was side-impacted by a VW Golf at 29 mph. The vehicle contact diagram obtained from MARC 1 Y is shown in PCB6-2006, RUN 1. All essential input data used in MARC 1 X8, RUN 1 were already used in both previous Short Papers using linear and rotational momentum. If no crush energy data, such as crush damage measurements and stiffness coefficients are available, MARC 1 X8 will calculate after-impact data without performing an energy balance calculation. Photographs of the damaged test vehicle are shown in Figures 5 and 6 of Short Paper PCB An estimated frontal crush profile of 10 and 5 in. over a width of 45 in. for the Golf, and a side crush of 4 and 4 in. for a width of 45 in. for the Derby is shown as input data in RUN 1. The stiffness coefficients were obtained from SAE Paper for a wheelbase range of 94.8 to in. Inspection of RUN 1 reveals the following 29 mph crash test data comparison obtained from the MARC 1 computer software: Crash Test on Paper Actual Crash Test MARC 1 X8 1. Impact Velocity 29 mph 29 mph 2. Departure Angle Golf: deg 97 deg Derby: deg 80 deg 3. After-Impact Distance Golf: ft 10.2 ft Derby: 9.66 ft 9.8 ft 4. After-Impact Rotation Golf: 0.12 deg 0 to 7 deg (?) Derby: deg 123 deg The energy balance error is 3.32% indicating that the crush energy is too small by 3.32%. The results indicate excellent agreement between actual and reconstructed test data. It also indicates that the vehicle contact diagram in terms of the l x and l y values developed for this case is a good representation what actually happened in the crash test. 4
5 5
6 6
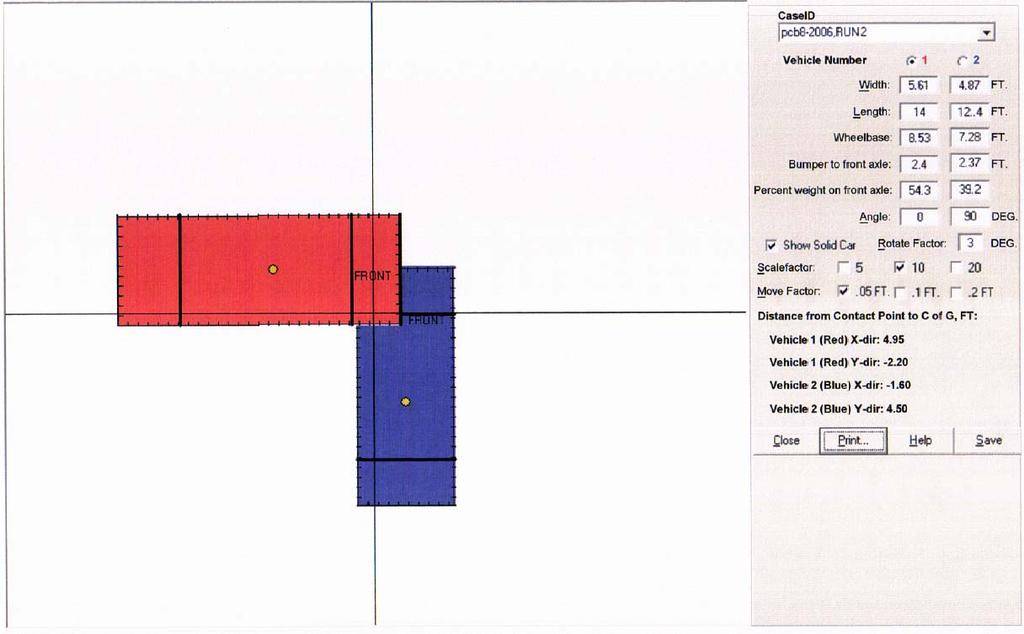
7 A comparison between the standard linear momentum reconstructed data (PCB ) and MARC 1 X8, RUN 1 indicates good agreement for the delta-v values both in terms of magnitudes and directions FORD TAUNUS SIDE-IMPACTS STATIONARY SIMCA A 1980 Ford Taunus was crashed at 40 mph into the side of a stationary 1980 Simca 1000 GLS. All essential after-impact data were electronically recorded. The MARC 1 Y vehicle contact diagram is shown in PCB8-2006, RUN2. Vehicle dimensions were obtained from published records. The after-impact runout diagram is shown in Figure 1. The Crash Test on Paper is shown in MARC 1 X8, RUN 2. No actual crush depth measurements were available. Crush depth in-put data were estimated from vehicle photographs. The Ford had its after-impact automatic brake-apply system fail, resulting in a run-out distance of 194 ft with a minor secondary tree impact. Crash Test on Paper MARC , RUN 2 Actual Crash Test 1. Impact Velocity Ford 40 mph 40 mph 2. Velocity After Impact Ford x/y: 30.68/3.36 mph 26.1/3.73 mph Simca x/y: 11.99/4.32 mph 11.8/4.9 mph 3. After-Impact Direction Ford: 6.26 deg not measured Simca: deg 339 deg 4. Angular Velocity Ford: deg/sec < 50 deg/sec Simca: deg/sec 332 deg/sec 5. Distance After Impact Ford: ft 194 ft Simca: ft 18 ft 6. Delta V Ford: 9.91 mph 11.6 mph Simca: mph 14.9 mph 7. Rotation After Impact Ford: 2.71 deg < 10 deg Simca: 249 deg 238 deg 7
8 8
9 9
10 10
11 11
12 12
13 Comparison of the paper crash-test data with the measured data shows acceptable correlation. The measured data were record in form of electronic traces, making an accurate data interpretation difficult, both in terms of resolution and averaging data points. 5.0 CHEVROLET TAHOE SIDE-IMPACTS FORD TAURUS A 1996 Chevrolet Tahoe side-impacts a 1995 Ford Taurus. The accident scene diagrams are shown in ARC Accident Reconstruction Photos of Dr. Rudolf Limpert, photographs 254 and 255. Photographs 256 through 271 show both accident scene photographs with vehicles at their rest positions, as well as crash test photographs. The white Tahoe is the test vehicle. The subject accident Tahoe was not available for inspection. The Tahoe traveled approximately 28 ft, the Taurus 79 ft after impact. Their departure angles were approximately 111 and 117 degrees, respectively. In the first reconstruction analysis standard linear momentum is used as shown in MARC 1 X5, RUN 3. The impact velocities are 31 and 26 mph for the Tahoe and Taurus, respectively. If there are no tire-skid marks before impact, the approach angles are not exactly known. For example, changing the approach angles to 93 and 177 degrees, respectively changes the impact velocities to 30 and 25 mph. The video tape of a crash test with a Tahoe traveling at 30.2 mph side-impacting a Taurus traveling at 24.3 mph is shown in ARC Section The reader should carefully study the slow-motion scenes to observe where the common velocity point is located, indicated by initial vehicle motion and not by vehicle-to-vehicle contact sheet metal deformation The vehicle contact diagram information (MARC 1 Y) shown in PCB8-2006, RUN 3 is used in the accident reconstruction MARC 1 X8, RUN 3 for impact velocities of 30.2 and 24.3 mph, respectively. Several of the recorded test data are shown in Figures 2 through 7. A comparison of both the calculated and measured data indicates acceptable agreement. The reader is encouraged to conduct a parameter sensitivity study to determine which input parameters are more critical and which accident scene and vehicle crush data have a significant influence. Inspection of the data output in MARC 1 X8, RUN 3 shows a resultant delta-v = mph for the Taurus. The standard linear momentum method of MARC 1 X5, RUN 3 shows a Taurus delta-v of mph for impact velocities of and mph, respectively. Of course, the delta-v calculation for the standard linear momentum method assumes a central impact, that is, the impulse forces go straight through the center-of-gravities of the vehicles. Using MARC 1 X8 and 13
14 14
15 15
16 31.19 and mph as impact velocities yields a Taurus delta-v of mph at the vehicle s center-of-gravity. Delta-V values at locations other than the center-of-gravity are different due to the superposition of the angular velocity. For example, the y-component of the delta- V of the Taurus at the left rear occupant location assuming a 4-foot perpendicular distance to the vehicle s center-of-gravity is computed as: delta-v(y) = (4 x /57.3)/(1.466) = 12.1 mph. The right rear interior door/window panel delta-v(y) would be mph. The delta-v calculations clearly show that vehicle crashes with rotation reconstructed with the standard momentum method does not provide accurate results. This observation can be of critical importance when the reconstructed delta-v values are near injury producing thresh-hold levels. Crash Test on Paper MARC 1 X8, RUN 3 Actual Crash Test 1. Impact Velocity Tahoe: mph mph Taurus: mph mph 2. After-Impact Velocities: Tahoe x/y: 5.32/19.88 mph 6/17 mph Taurus x/y: 15.56/16.96 mph 16/17 mph 3. Angular Velocities: Tahoe: deg/sec 150 deg/sec Taurus: deg/sec 120 deg/sec 4. Delta-V: Tahoe: mph 12 mph, left rocker pan. 17 mph, right rocker pa. Taurus: mph 18.6 mph, left rock. pa mph, right rock. pa. 5. After-Impact Distance: Tahoe: ft 34 ft at acc. scene Taurus: ft 79 ft at acc. scene 6. Departure Angles: Tahoe: deg 117 deg at acc. scene Taurus: deg 117 deg at acc. scene The energy balance output indicates a 0.54% error, indicating that the crush energy values are insignificantly too small. Changing, for example, the stiffness coefficient A = 95 to 98, yields an energy balance of 0.08%. 16
17 The departure angles are significantly different. During the accident while the vehicles were rotating a secondary collision occurred between the vehicles making the departure angles determined by vehicle rest positions as well as angles rotated after impact questionable. 17
18 18
19 19
20 20
21 21
22 22
23 23
SHORT PAPER PCB OBLIQUE COLLISIONS ENGINEERING EQUATIONS, INPUT DATA AND MARC 1 APPLICATIONS. Dennis F. Andrews, Franco Gamero, Rudy Limpert
 SHORT PAPER PCB 5-2006 OBLIQUE COLLISIONS ENGINEERING EQUATIONS, INPUT DATA AND MARC 1 APPLICATIONS By: Dennis F. Andrews, Franco Gamero, Rudy Limpert PC-BRAKE, INC. 2006 www.pcbrakeinc.com 1 PURPOSE OF
SHORT PAPER PCB IN-LINE COLLISIONS ENGINEERING EQUATIONS, INPUT DATA AND MARC 1 APPLICATIONS. Dennis F. Andrews, Franco Gamero, Rudy Limpert
 SHORT PAPER PCB 3-2006 IN-LINE COLLISIONS ENGINEERING EQUATIONS, INPUT DATA AND MARC 1 APPLICATIONS By: Dennis F. Andrews, Franco Gamero, Rudy Limpert PC-BRAKE, INC. 2006 www.pcbrakeinc.com 1 PURPOSE OF
FRONTAL OFF SET COLLISION
 FRONTAL OFF SET COLLISION MARC1 SOLUTIONS Rudy Limpert Short Paper PCB2 2014 www.pcbrakeinc.com 1 1.0. Introduction A crash-test-on- paper is an analysis using the forward method where impact conditions
Low Speed Rear End Crash Analysis
 Low Speed Rear End Crash Analysis MARC1 Use in Test Data Analysis and Crash Reconstruction Rudy Limpert, Ph.D. Short Paper PCB2 2015 www.pcbrakeinc.com e mail: prosourc@xmission.com 1 1.0. Introduction
Accident Reconstruction & Vehicle Data Recovery Systems and Uses
 Research Engineers, Inc. (919) 781-7730 7730 Collision Analysis Engineering Animation Accident Reconstruction & Vehicle Data Recovery Systems and Uses Bill Kluge Thursday, May 21, 2009 Accident Reconstruction
Using HVE to Simulate a Nine Vehicle Accident Involving a Heavy Truck
 Using HVE to Simulate a Nine Vehicle Accident Involving a Heavy Truck Eric Rossetter, Benjamin Ewers III, Bradford Coburn, Yomi Agunbiade Principia Engineering, Inc. Abstract Multi-vehicle high-speed accidents
Drag Factors in Spins and on Hills
 Drag Factors in Spins and on Hills John Daily Jackson Hole Scientific Investigations, Inc. Box 2206 Jackson, WY 83001 (307) 733-4559 jhsi@rmisp.com Drag Factor Adjustment Adjusting the drag factor for
MOTORCYCLE BRAKING DYNAMICS
 MOTORCYCLE BRAKING DYNAMICS By Rudy Limpert, Ph.D. PC-BRAKE, Inc. 2008 www.pcbrakeinc.com 1 1.0 INTRODUCTION In recent issues of Accident Investigation Quarterly motorcycle braking systems as well as braking
Evaluation of Event Data Recorder Based on Crash Tests
 Evaluation of Event Data Recorder Based on Crash Tests N Takubo*, R Oga*, K Kato*, K Hagita*, T Hiromitsu*, H Ishikawa*, M Kihira* *National Research Institute of Police Science, Department of Traffic
View Numbers and Units
 To demonstrate the usefulness of the Working Model 2-D program, sample problem 16.1was used to determine the forces and accelerations of rigid bodies in plane motion. In this problem a cargo van with a
ME 466 PERFORMANCE OF ROAD VEHICLES 2016 Spring Homework 3 Assigned on Due date:
 PROBLEM 1 For the vehicle with the attached specifications and road test results a) Draw the tractive effort [N] versus velocity [kph] for each gear on the same plot. b) Draw the variation of total resistance
EDR Case Studies Intersection Crash
 EDR Case Studies Intersection Crash Presented by Richard R. Ruth, P.E. At 2017 IPTM Special Problems rick@ruthconsulting.com 313-910-5809 Copyright Ruth 2017 - Authorized for use by IPTM and SAE 1 Case
Extracting Tire Model Parameters From Test Data
 WP# 2001-4 Extracting Tire Model Parameters From Test Data Wesley D. Grimes, P.E. Eric Hunter Collision Engineering Associates, Inc ABSTRACT Computer models used to study crashes require data describing
Page 2. The go-kart always had the same mass and used the same motor.
 Q1.(a) Some students have designed and built an electric-powered go-kart. After testing, the students decided to make changes to the design of their go-kart. The go-kart always had the same mass and used
PATRICK D. STADLER. Stadler Accident Reconstruction Graduated from Highland High School, Cowiche, Washington.
 PATRICK D. STADLER =============================================================== = 5808-A Summitview Ave, #267 Yakima, Washington 98908 Phone: (509) 678-2077 Fax: (509) 678-2066 E-Mail: pstadler@stadlerrecon.com
Accident Reconstruction Tech and Heavy Trucks
 Accident Reconstruction Tech and Heavy Trucks September 22, 2016 Ashley (Al) Dunn, Ph.D., P.E. 1 We re All Here Because.. Stuff Happens 2 Accident Reconstruction Trucks are Different 3 The Truck is 20
Single Vehicle Loss of Control
 . Single Vehicle Loss of Control the natural motion is to continue in the same direction weight shifts to outside of turn INERTIA weight shifts to outside of turn INERTIA friction a yaw occurs when the
Improvement of Vehicle Dynamics by Right-and-Left Torque Vectoring System in Various Drivetrains x
 Improvement of Vehicle Dynamics by Right-and-Left Torque Vectoring System in Various Drivetrains x Kaoru SAWASE* Yuichi USHIRODA* Abstract This paper describes the verification by calculation of vehicle
FE151 Aluminum Association Inc. Impact of Vehicle Weight Reduction on a Class 8 Truck for Fuel Economy Benefits
 FE151 Aluminum Association Inc. Impact of Vehicle Weight Reduction on a Class 8 Truck for Fuel Economy Benefits 08 February, 2010 www.ricardo.com Agenda Scope and Approach Vehicle Modeling in MSC.EASY5
TSFS02 Vehicle Dynamics and Control. Computer Exercise 2: Lateral Dynamics
 TSFS02 Vehicle Dynamics and Control Computer Exercise 2: Lateral Dynamics Division of Vehicular Systems Department of Electrical Engineering Linköping University SE-581 33 Linköping, Sweden 1 Contents
How and why does slip angle accuracy change with speed? Date: 1st August 2012 Version:
 Subtitle: How and why does slip angle accuracy change with speed? Date: 1st August 2012 Version: 120802 Author: Brendan Watts List of contents Slip Angle Accuracy 1. Introduction... 1 2. Uses of slip angle...
Road Accident Investigation. specialists in the UK who use mathematics to reconstruct the probable manoeuvres
 Road Accident Investigation The phrases the police service and using mathematics are not usually associated with each other. There are however a small number of police officers and other specialists in
PROBLEM SOLVING COACHES IN PHYSICS TUTORING PART 2: DESIGN AND IMPLEMENTATION. Qing Xu 4/24/2010 MAAPT
 PROBLEM SOLVING COACHES IN PHYSICS TUTORING PART 2: DESIGN AND IMPLEMENTATION Qing Xu 4/24/2010 MAAPT Cognitive Apprenticeship (3 types of coaching) Problem-solving Framework (Expert v.s. Novices) Minimize
Validation of the SIMON Model for Vehicle Handling and Collision Simulation Comparison of Results with Experiments and Other Models
 24-1-127 Validation of the Model for Vehicle Handling and Collision Simulation Comparison of Results with Experiments and Other Models Terry D. Day Engineering Dynamics Corporation 24 Society of Automotive
Identification of tyre lateral force characteristic from handling data and functional suspension model
 Identification of tyre lateral force characteristic from handling data and functional suspension model Marco Pesce, Isabella Camuffo Centro Ricerche Fiat Vehicle Dynamics & Fuel Economy Christian Girardin
MEASUREMENTS OF VEHICLE COMPATIBILITY IN FRONT-TO-SIDE CRASHES K.
 MEASUREMENTS OF VEHICLE COMPATIBILITY IN FRONT-TO-SIDE CRASHES K. Digges and A. Eigen The National Crash Analysis Center The George Washington University USA ABSTRACT The National Highway Traffic Safety
Question Papers on Momentum
 Question Papers on Momentum Name Due Date QUESTION 6 Collisions happen on the roads in our country daily. In one of these collisions, a car of mass 1 600 kg, travelling at a speed of 30 m s -1 to the left,
THE ACCURACY OF WINSMASH DELTA-V ESTIMATES: THE INFLUENCE OF VEHICLE TYPE, STIFFNESS, AND IMPACT MODE
 THE ACCURACY OF WINSMASH DELTA-V ESTIMATES: THE INFLUENCE OF VEHICLE TYPE, STIFFNESS, AND IMPACT MODE P. Niehoff Rowan University Department of Mechanical Engineering Glassboro, New Jersey H.C. Gabler
506E. LM Guide Actuator General Catalog
 LM Guide Actuator General Catalog A LM Guide Actuator General Catalog A Product Descriptions 506E Caged Ball LM Guide Actuator Model SKR.. A2-4 Structure and Features... A2-4 Caged Ball Technology... A2-6
Overview. A Study of Lateral Vehicle Motion. 1. Road Evidence
 A Study of Lateral Vehicle Motion Presented by: John & Jeremy Daily Jackson Hole Scientific Investigations, Inc Nate Shigemura Traffic Safety Group Overview 1. Road Evidence Spin examples Critical Speed
Physics 2048 Test 2 Dr. Jeff Saul Fall 2001
 Physics 2048 Test 2 Dr. Jeff Saul Fall 2001 Name: Group: Date: READ THESE INSTRUCTIONS BEFORE YOU BEGIN Before you start the test, WRITE YOUR NAME ON EVERY PAGE OF THE EXAM. Calculators are permitted,
Section 3: Collisions and explosions
 Section 3: Collisions and explosions 1. What is the momentum of the object in each of the following situations? (c) 2. A trolley of mass 2 0 kg is travelling with a speed of 1 5 m s 1. The trolley collides
A Comparison of Crush Stiffness Characteristics from Partial-Overlap and Full-Overlap Frontal Crash Tests
 1999-01-0105 A Comparison of Stiffness Characteristics from Partial-Overlap and Full-Overlap Frontal Crash Tests James A. Neptune Neptune ering, Inc. Copyright 1999 Society of Automotive ers, Inc. ABSTRACT
Relative ride vibration of off-road vehicles with front-, rear- and both axles torsio-elastic suspension
 Relative ride vibration of off-road vehicles with front-, rear- and both axles torsio-elastic suspension Mu Chai 1, Subhash Rakheja 2, Wen Bin Shangguan 3 1, 2, 3 School of Mechanical and Automotive Engineering,
LEAD SCREWS 101 A BASIC GUIDE TO IMPLEMENTING A LEAD SCREW ASSEMBLY FOR ANY DESIGN
 LEAD SCREWS 101 A BASIC GUIDE TO IMPLEMENTING A LEAD SCREW ASSEMBLY FOR ANY DESIGN Released by: Keith Knight Kerk Products Division Haydon Kerk Motion Solutions Lead Screws 101: A Basic Guide to Implementing
VEHICLE SPEED DETERMINATION IN CASE OF ROAD ACCIDENT BY SOFTWARE METHOD AND COMPARING OF RESULTS WITH THE MATHEMATICAL MODEL
 Journal of MECHANICAL ENGINEERING Strojnícky časopis, VOL 67 (217), NO 2, 51-6 VEHICLE SPEED DETERMINATION IN CASE OF ROAD ACCIDENT BY SOFTWARE METHOD AND COMPARING OF RESULTS WITH THE MATHEMATICAL MODEL
Angular Momentum Problems Challenge Problems
 Angular Momentum Problems Challenge Problems Problem 1: Toy Locomotive A toy locomotive of mass m L runs on a horizontal circular track of radius R and total mass m T. The track forms the rim of an otherwise
Chapter 2 Analysis on Lock Problem in Frontal Collision for Mini Vehicle
 Chapter 2 Analysis on Lock Problem in Frontal Collision for Mini Vehicle Ce Song, Hong Zang and Jingru Bao Abstract To study the lock problem in the frontal collision test on a kind of mini vehicle s sliding
Research on Skid Control of Small Electric Vehicle (Effect of Velocity Prediction by Observer System)
") Proc. Schl. Eng. Tokai Univ., Ser. E (17) 15-1 Proc. Schl. Eng. Tokai Univ., Ser. E (17) - Research on Skid Control of Small Electric Vehicle (Effect of Prediction by Observer System) by Sean RITHY *1
Proc. Schl. Eng. Tokai Univ., Ser. E (17) 15-1 Proc. Schl. Eng. Tokai Univ., Ser. E (17) - Research on Skid Control of Small Electric Vehicle (Effect of Prediction by Observer System) by Sean RITHY *1
Triple Fatal Motorcycle Crash On Wellington Road And Ferguson Line South of London, Ontario
 Triple Fatal Motorcycle Crash On Wellington Road And Ferguson Line South of London, Ontario Posting Date: Sept 4-2015 Motorcycles such as those pictured in this file photo continue to over represent the
THE IMPORTANCE OF DYNAMIC TESTING IN DETERMINING THE YAW STABILITY OF VEHICLES
 THE IMPORTANCE OF DYNAMIC TESTING IN DETERMINING THE YAW STABILITY OF VEHICLES Stephen M. Arndt Don C. Stevens Safety Engineering & Forensic Analysis, Inc. Mark W. Arndt Transportation Safety Technologies,
NHTSA_58 SUA Cases Report. ASA Preliminary Analysis
 NHTSA_58 SUA Cases Report ASA Preliminary Analysis ASA NHTSA_58SUACases_ASA-PrelimAnalysis_1f.shw 9Oct10 1 ASA 2 3 A Forensic Engineering Approach to SUA Investigations A proper forensic engineering evaluation
Post-Impact Dynamics for Vehicles with a High Yaw Velocity
 Post-Impact Dynamics for Vehicles with a High Yaw Velocity 2016-01-1470 Nathan A. Rose, Neal Carter, and Gray Beauchamp Kineticorp LLC Published 04/05/2016 CITATION: Rose, N., Carter, N., and Beauchamp,
Passenger Vehicle Steady-State Directional Stability Analysis Utilizing EDVSM and SIMON
 WP# 4-3 Passenger Vehicle Steady-State Directional Stability Analysis Utilizing and Daniel A. Fittanto, M.S.M.E., P.E. and Adam Senalik, M.S.G.E., P.E. Ruhl Forensic, Inc. Copyright 4 by Engineering Dynamics
Evaluation of the ARAS HD ICATS System in Relation to the RICSAC Staged Crash Events.
 1 AWP #2013-3 Evaluation of the ARAS HD ICATS System in Relation to the RICSAC Staged Crash Events. Mike Kennedy, ACTAR, and Paul Hetherington, BTACS ABSTRACT ARAS HD is a software application designed
Method for the estimation of the deformation frequency of passenger cars with the German In-Depth Accident Study (GIDAS)
") Method for the estimation of the deformation frequency of passenger cars with the German In-Depth Accident Study (GIDAS) S Große*, F Vogt*, L Hannawald* *Verkehrsunfallforschung an der TU Dresden GmbH,
Method for the estimation of the deformation frequency of passenger cars with the German In-Depth Accident Study (GIDAS) S Große*, F Vogt*, L Hannawald* *Verkehrsunfallforschung an der TU Dresden GmbH,
CRASH TEST REPORT FOR PERIMETER BARRIERS AND GATES TESTED TO SD-STD-02.01, REVISION A, MARCH Anti-Ram Bollards
 CRASH TEST REPORT FOR PERIMETER BARRIERS AND GATES TESTED TO SD-STD-02.01, REVISION A, MARCH 2003 Anti-Ram Bollards Prepared for: RSA Protective Technologies, LLC 1573 Mimosa Court Upland, CA 91784 Test
Ball. Ball cage. Fig.1 Structure of Caged Ball LM Guide Actuator Model SKR
 Caged all LM Guide Actuator Model Inner block all screw shaft Grease nipple Outer rail all cage all Structure and Features Fig.1 Structure of Caged all LM Guide Actuator Model Caged all LM Guide Actuator
SURFACE VEHICLE STANDARD
 400 Commonwealth Drive, Warrendale, PA 15096-0001 SURFACE VEHICLE STANDARD J1287 Issued 1980-06 Reaffirmed 1998-07 REAF. JUL1998 An American National Standard Superseding J1287 JUN93 Measurement of Exhaust
Design And Development Of Roll Cage For An All-Terrain Vehicle
 Design And Development Of Roll Cage For An All-Terrain Vehicle Khelan Chaudhari, Amogh Joshi, Ranjit Kunte, Kushal Nair E-mail : khelanchoudhary@gmail.com, amogh_4291@yahoo.co.in,ranjitkunte@gmail.com,krockon007@gmail.com
Crash Cart Barrier Project Teacher Guide
 Crash Cart Barrier Project Teacher Guide Set up We recommend setting the ramp at an angle of 15 and releasing the cart 40 cm away from the barrier. While crashing the cart into a wall works, if this is
POLICY POSITION ON THE PEDESTRIAN PROTECTION REGULATION
 POLICY POSITION ON THE PEDESTRIAN PROTECTION REGULATION SAFETY Executive Summary FIA Region I welcomes the European Commission s plan to revise Regulation 78/2009 on the typeapproval of motor vehicles,
General Vehicle Information
 Vehicle #3921 Chevrolet Equinox (2CNALBEW8A6XXXXXX) Inspection Date: 1-Feb-211 Year 21 Make Model Body Style HVE Display Name: Year Range: Sisters and Clones: Vehicle Category: Vehicle Class: VIN: Date
DIFFERENT BUSSES -COMPARISON-
 DIFFERENT BUSSES -COMPARISON- Current Work It starts from a real road accident happen to a bus on Nitsund bridge in 1998 Main Tasks: understanding of Nitsund parapet limitation (first structure built in
A. Title Page. Development of an Automated CRUSH Profile Measuring System. Dr. Patricia Buford, Department of Electrical Engineering
 A. Title Page Development of an Automated CRUSH Profile Measuring System Dr. Patricia Buford, Department of Electrical Engineering B. Restatement of problem researched, creative work, or professional enhancement
NUMERICAL ANALYSIS OF IMPACT BETWEEN SHUNTING LOCOMOTIVE AND SELECTED ROAD VEHICLE
 Journal of KONES Powertrain and Transport, Vol. 21, No. 4 2014 ISSN: 1231-4005 e-issn: 2354-0133 ICID: 1130437 DOI: 10.5604/12314005.1130437 NUMERICAL ANALYSIS OF IMPACT BETWEEN SHUNTING LOCOMOTIVE AND
Crash Reconstruction: A Complete Step-by-Step Procedure. Terry D. Day, P.E. Engineering Dynamics Corporation
 Crash Reconstruction: A Complete Step-by-Step Procedure Terry D. Day, P.E. Engineering Dynamics Corporation Intersection Crash Reconstruction from Cradle to Grave Instructor: Terry D. Day, P.E. Engineering
Case Study UAV Use on a Crash Scene Versus Total Station Sergeant Daniel Marek Nevada Highway Patrol
 Case Study UAV Use on a Crash Scene Versus Total Station Sergeant Daniel Marek Nevada Highway Patrol How comfortable is your couch?? Case selected for: First use of a UAV by Nevada law enforcement under
Technical Report Lotus Elan Rear Suspension The Effect of Halfshaft Rubber Couplings. T. L. Duell. Prepared for The Elan Factory.
 Technical Report - 9 Lotus Elan Rear Suspension The Effect of Halfshaft Rubber Couplings by T. L. Duell Prepared for The Elan Factory May 24 Terry Duell consulting 19 Rylandes Drive, Gladstone Park Victoria
Q1. The graph shows the speed of a runner during an indoor 60 metres race.
 Q1. The graph shows the speed of a runner during an indoor 60 metres race. (a) Calculate the acceleration of the runner during the first four seconds. (Show your working.) (b) How far does the runner travel
COLLISION CONSULTANTS AND INVESTIGATIONS
 Curriculum Vitae C. Dean Brewer Traffic Collision Reconstruction And Computer Animation Specialist ACTAR #1225 EDUCATION: Associate of Arts (Admin of Justice) San Bernardino Valley College Bachelor of
Study concerning the loads over driver's chests in car crashes with cars of the same or different generation
 IOP Conference Series: Materials Science and Engineering PAPER OPEN ACCESS Study concerning the loads over driver's chests in car crashes with cars of the same or different generation Related content -
MOTOR VEHICLE HANDLING AND STABILITY PREDICTION
 MOTOR VEHICLE HANDLING AND STABILITY PREDICTION Stan A. Lukowski ACKNOWLEDGEMENT This report was prepared in fulfillment of the Scholarly Activity Improvement Fund for the 2007-2008 academic year funded
Figure 1. What is the difference between distance and displacement?
 Q1.A train travels from town A to town B. Figure 1 shows the route taken by the train. Figure 1 has been drawn to scale. Figure 1 (a) The distance the train travels between A and B is not the same as the
High-force linear motion: How to convert hydraulic cylinders to electric actuators and why.
 High-force linear motion: How to convert from hydraulic cylinders to electric actuators and why. By Aaron Dietrich, Director of Marketing Tolomatic, Inc. About the Author Aaron Dietrich has an extensive
Application of 3D Visualization in Modeling Wheel Stud Contact Patterns with Rotating and Stationary Surfaces
 Application of 3D Visualization in Modeling Wheel Stud Contact Patterns with Rotating and Stationary Surfaces William Bortles, David Hessel, and William Neale Kineticorp LLC 2017-01-1414 Published 03/28/2017
Stat 301 Lecture 30. Model Selection. Explanatory Variables. A Good Model. Response: Highway MPG Explanatory: 13 explanatory variables
 Model Selection Response: Highway MPG Explanatory: 13 explanatory variables Indicator variables for types of car Sports Car, SUV, Wagon, Minivan 1 Explanatory Variables Engine size (liters) Cylinders (number)
SPMM OUTLINE SPECIFICATION - SP20016 issue 2 WHAT IS THE SPMM 5000?
 SPMM 5000 OUTLINE SPECIFICATION - SP20016 issue 2 WHAT IS THE SPMM 5000? The Suspension Parameter Measuring Machine (SPMM) is designed to measure the quasi-static suspension characteristics that are important
CRASH TEST REPORT FOR PERIMETER BARRIERS AND GATES TESTED TO SD-STD-02.01, REVISION A, MARCH Anti-Ram Bollards
 CRASH TEST REPORT FOR PERIMETER BARRIERS AND GATES TESTED TO SD-STD-02.01, REVISION A, MARCH 2003 Anti-Ram Bollards Prepared for: RSA Protective Technologies, LLC 1573 Mimosa Court Upland, CA 91784 Test
Lab Session #1 Initiation Systems and Types of Explosives
 Lab Session #1 Initiation Systems and Types of Explosives The main goal of this laboratory session is to provide a practical experience in the use of different type of explosives and initiations systems.
ALAR Series Direct Drive, Large-Aperture, Rotary Stage
 ALAR Series Direct Drive, Large-Aperture, Rotary Stage 5 different aperture sizes: 100 mm, 150 mm, 200 mm, 250 mm, 325 mm Continuous or limited travel Axial load capacity up to 595 kg Rotary Stages ALAR
EXPERIMENTAL TEST OF OCCUPANT ENTRAPMENT FORD TAURUS INTO REAR OF FORD EXPLORER 30% OFFSET, 70 MPH. Test Date: August 3, 2010
 EXPERIMENTAL TEST OF OCCUPANT ENTRAPMENT FORD TAURUS INTO REAR OF FORD EXPLORER 30% OFFSET, 70 MPH Test Date: August 3, 2010 Final Report Date: September 25, 2010 SECTION 1 PURPOSE AND SUMMARY OF TEST
A STUDY OF HUMAN KINEMATIC RESPONSE TO LOW SPEED REAR END IMPACTS INVOLVING VEHICLES OF LARGELY DIFFERING MASSES
 A STUDY OF HUMAN KINEMATIC RESPONSE TO LOW SPEED REAR END IMPACTS INVOLVING VEHICLES OF LARGELY DIFFERING MASSES Brian Henderson GBB UK Ltd, University of Central Lancashire School of Forensic & Investigative
Low cost active devices to estimate and prevent off-road vehicle from rollover
 1 Low cost active devices to estimate and prevent off-road vehicle from rollover 1st Axema/EurAgeng Confrence Parc des exposition, Paris-Nord Villepinte 25th February 2017 Roland LENAIN Benoit THUILOT
Aerodynamic Drag Assessment
 Aerodynamic Drag Assessment Computer Fluid Dynamics (CFD) analysis was used in the ULSAB-AVC Program to evaluate the aerodynamic concept from the very beginning of vehicle concepts. 11.1 BACKGROUND A vehicle
An Evaluation of Active Knee Bolsters
 8 th International LS-DYNA Users Conference Crash/Safety (1) An Evaluation of Active Knee Bolsters Zane Z. Yang Delphi Corporation Abstract In the present paper, the impact between an active knee bolster
Exampro GCSE Physics. P2 Forces and their effects Self Study Questions Higher tier. Name: Class: Author: Date: Time: 117. Marks: 117.
 Exampro GCSE Physics P2 Forces and their effects Self Study Questions Higher tier Name: Class: Author: Date: Time: 117 Marks: 117 Comments: Page 1 of 32 Q1. (a) The stopping distance of a vehicle is made
Design and Validation of Hydraulic brake system for Utility Vehicle
 ISSN 2395-1621 Design and Validation of Hydraulic brake system for Utility Vehicle #1 K.M.Pavan, #2 Dr. A.G.Thakur 1 pavan56@yahoo.com 2 ajay_raja34@yahoo.com #12 Department of Mechanical Engineering,
ROBUST PROJECT Norwegian Public Roads Administration / Force Technology Norway AS
 ROBUST PROJECT Norwegian Public Roads Administration / Force Technology Norway AS Evaluation of small car - RM_R1 - prepared by Politecnico di Milano Volume 1 of 1 January 2006 Doc. No.: ROBUST-5-002/TR-2004-0039
Manual for Assessing Safety Hardware
 American Association of State Highway and Transportation Officials Manual for Assessing Safety Hardware 2009 vii PREFACE Effective traffic barrier systems, end treatments, crash cushions, breakaway devices,
FLUID FLOW. Introduction
 FLUID FLOW Introduction Fluid flow is an important part of many processes, including transporting materials from one point to another, mixing of materials, and chemical reactions. In this experiment, you
Simulation of Influence of Crosswind Gusts on a Four Wheeler using Matlab Simulink
 Simulation of Influence of Crosswind Gusts on a Four Wheeler using Matlab Simulink Dr. V. Ganesh 1, K. Aswin Dhananjai 2, M. Raj Kumar 3 1, 2, 3 Department of Automobile Engineering 1, 2, 3 Sri Venkateswara
Design, analysis and mounting implementation of lateral leaf spring in double wishbone suspension system
 Design, analysis and mounting implementation of lateral leaf spring in double wishbone suspension system Rahul D. Sawant 1, Gaurav S. Jape 2, Pratap D. Jambhulkar 3 ABSTRACT Suspension system of an All-TerrainVehicle
Wheelchair Transportation Principles I: Biomechanics of Injury
 Wheelchair Transportation Principles I: Biomechanics of Injury Gina Bertocci, Ph.D. & Douglas Hobson, Ph.D. Department of Rehabilitation Science and Technology University of Pittsburgh This presentation
*Friedman Research Corporation, 1508-B Ferguson Lane, Austin, TX ** Center for Injury Research, Santa Barbara, CA, 93109
 Analysis of factors affecting ambulance compartment integrity test results and their relationship to real-world impact conditions. G Mattos*, K. Friedman*, J Paver**, J Hutchinson*, K Bui* & A Jafri* *Friedman
time in seconds Amy leaves diving board
 1 Amy dives from the high diving board at a swimming pool. Look at the graph of her motion. speed in m / s 15 10 Amy enters water P Q 5 0 0 0.5 1.0 1.5 2.0 2.5 time in seconds Amy leaves diving board (a)
STIFFNESS CHARACTERISTICS OF MAIN BEARINGS FOUNDATION OF MARINE ENGINE
 Journal of KONES Powertrain and Transport, Vol. 23, No. 1 2016 STIFFNESS CHARACTERISTICS OF MAIN BEARINGS FOUNDATION OF MARINE ENGINE Lech Murawski Gdynia Maritime University, Faculty of Marine Engineering
STUDENT ACTIVITY SHEET Name Period Fire Hose Friction Loss The Varying Variables for the One That Got Away Part 1
 STUDENT ACTIVITY SHEET Name Period Fire Hose Friction Loss The Varying Variables for the One That Got Away Part 1 The questions: How does Friction Loss change with the quality of the fire hose? How does
Siemens PLM Software develops advanced testing methodologies to determine force distribution and visualize body deformation during vehicle handling.
 Automotive and transportation Product LMS LMS Engineering helps uncover the complex interaction between body flexibility and vehicle handling performance Business challenges Gain insight into the relationship
Integrated. Safety Handbook. Automotive. Ulrich Seiffert and Mark Gonter. Warrendale, Pennsylvania, USA INTERNATIONAL.
 Integrated Automotive Safety Handbook Ulrich Seiffert and Mark Gonter INTERNATIONAL. Warrendale, Pennsylvania, USA Table of Contents Preface ix Chapter 1 The Need to Increase Road Safety 1 1.1 Introduction
Simulation and Analysis of Vehicle Suspension System for Different Road Profile
 Simulation and Analysis of Vehicle Suspension System for Different Road Profile P.Senthil kumar 1 K.Sivakumar 2 R.Kalidas 3 1 Assistant professor, 2 Professor & Head, 3 Student Department of Mechanical
Evaluation of Advance Compatibility Frontal Structures Using the Progressive Deformable Barrier
 Informal document No. GRSP-45-16 (45th GRSP, 25-29 May 2009 agenda item 6(a)) Evaluation of Advance Compatibility Frontal Structures Using the Progressive Deformable Barrier 45th GRSP May 2009 Susan MEYERSON,
Reduction of Self Induced Vibration in Rotary Stirling Cycle Coolers
 Reduction of Self Induced Vibration in Rotary Stirling Cycle Coolers U. Bin-Nun FLIR Systems Inc. Boston, MA 01862 ABSTRACT Cryocooler self induced vibration is a major consideration in the design of IR
FMVSS208 Simulation using Finite Element Methods
 FMVSS208 Simulation using Finite Element Methods 1 Mayank T., 2 Reetu S., 3 Dileep., 4 Rajesh M. 1,2,3 Mechanical Engineering Department SGSITS Indore 4 IICAE Indore Abstract - A number of people die every
TRANSLATION (OR LINEAR)
") 5) Load Bearing Mechanisms Load bearing mechanisms are the structural backbone of any linear / rotary motion system, and are a critical consideration. This section will introduce most of the more common
5) Load Bearing Mechanisms Load bearing mechanisms are the structural backbone of any linear / rotary motion system, and are a critical consideration. This section will introduce most of the more common
FAAC International, Inc.
 TEST REPORT FOR: FAAC International, Inc. J 355 HA M30 (K4) Bollard TESTED TO: ASTM F 2656-07 Standard Test Method for Vehicle Crash Testing of Perimeter Barriers Test M30 PREPARED FOR: FAAC International,
 CHAPTER 5 INERTIA Inertia wants to keep these parked cars at rest Inertia also wants to keep these moving cars moving INERTIA When driving through this curve inertia creates the sensation that you
Comparison of HVE simulations to NHTSA full-frontal barrier testing: an analysis of 3D and 2D stiffness coefficients in SIMON and EDSMAC4
 Comparison of HVE simulations to NHTSA full-frontal barrier testing: an analysis of 3D and 2D stiffness coefficients in SIMON and EDSMAC4 Jeffrey Suway Biomechanical Research and Testing, LLC Anthony Cornetto,
Recommendations for AASHTO Superelevation Design
 Recommendations for AASHTO Superelevation Design September, 2003 Prepared by: Design Quality Assurance Bureau NYSDOT TABLE OF CONTENTS Contents Page INTRODUCTION...1 OVERVIEW AND COMPARISON...1 Fundamentals...1
Lighter and Safer Cars by Design
 Lighter and Safer Cars by Design May 2013 DRI Compatibility Study (2008) Modern vehicle designs - generally good into fixed barriers irrespective of vehicle type or material Safety discussion is really