Overview. A Study of Lateral Vehicle Motion. 1. Road Evidence
|
|
|
- Emory Arnold
- 6 years ago
- Views:
Transcription
1 A Study of Lateral Vehicle Motion Presented by: John & Jeremy Daily Jackson Hole Scientific Investigations, Inc Nate Shigemura Traffic Safety Group Overview 1. Road Evidence Spin examples Critical Speed Yaws Turning and Braking. Definitions 3. Critical Speed Formula 4. Drag Factors and Skid Testing 5. Lane Changes Page
2 Overview 6. Testing and Instrumentation 7. Dynamic Roadway Marking System 8. Data Analysis and Reduction 9. Validation of Lane Change Equation 10. Derivation of Critical Speed Yaw Formulation 11. Summary and Questions Page 3 Road Evidence Maximum performance lateral maneuvers will saturate one or more of the tires of the vehicle. Because lateral motion happens concurrently with forward motion, any saturated tires will leave curving marks on the road. Page 4
3 Road Evidence Our ability to interpret these curving tire marks will allow us to chose a proper method for speed analysis. We will examine several different types of curving tire mark evidence in the following slides. Page 5 Road Evidence - Spins A spin is a vehicle motion characterized by relatively high angular velocities. A vehicle may spin as a result of inappropriate steering, especially on low coefficient surfaces. A vehicle may also enter a spin as the consequence of a collision. Uneven braking may also result in a spin. Page 6


4 Emergency Brake Spin If the emergency brake only is used, the vehicle will tend to spin around. A combined speed technique may be used to analyze speed. The vehicle will track straight for a distance and will then rotate. The straight portion may be calculated with a straightforward speed equation, while the spin portion may be calculated with the spin analysis. Page 7 Road Evidence - Spins This is a steering induced spin. A spin analysis, such as was presented in Special Problems 003, would be appropriate for speed analysis. Page 8
 34 94.")
5 Road Evidence - Spins These tire marks show a steering induced spin resulting from the driver s inappropriate response in coming back onto the road. A spin analysis would be appropriate for speed analysis. Page 9 Baseline (Initial Approach) ' 8 Survey by : Dennis Payne Drawn by : Jeremy Daily IPTM Special Problems Speed at Separation: 45 mph Heading Change: 06 deg Center of mass distance: 94.5 ft Scale: 1" = 15' RF wheel disabled Test #5 Page 10
6 Heading angle, degrees VC3000 Data aquired and reduced by Wade Bartlett Page 11 Pit-5, No RF brake Heading Change 16 degrees Time, Seconds Yaw angle Rate, deg/sec Road Evidence - Spins Angular velocity for spins are typically on the order of 100 degrees per second or higher. Page 1
7 Road Evidence Critical Speed Yaw - Definitions Yaw refers to the orientation of the vehicle. Specifically, the heading of the vehicle is not co-linear with the velocity vector of the vehicle. The evidence showing this are the tire scuffs on the road. The rear tires track outside the corresponding front tires. Page 13 Definitions, cont d. Critical refers to the idea that we may identify the lateral acceleration as the maximum tire friction on the road. We obtain this friction information with a test skid. We may have to correct our test skid information for grade or superelevation. The ONLY way a vehicle gets onto a critical speed yaw is through the application of an inappropriate steering input (over correction or acceleration)! Page 14

8 Road Evidence Critical Speed Yaw In order to properly analyze a critical speed yaw situation, we must recognize the tire mark evidence left behind. Note the diagonal striations and uneven edge of the tire marks left in the following photos. The rear tires begin tracking outside the front tires. Page 15 Page 16


9 Critical Speed Yaw Marks A yaw results when the velocity vector and heading of the vehicle are not co-linear. If the yaw is the result of inappropriate steering input, then the yaw may be a Critical Speed Yaw, and may be used for speed analysis in a simple, straightforward manner. This photo illustrates a critical speed yaw. Notice the rear tires track outside the corresponding front tires. Page 17 Critical Speed Yaw Marks This crash began with critical speed yaw marks on the shoulder We can use shoulder drag to get a conservative speed estimate. We may average shoulder and road drag to get an upper limit speed. Page 18


10 Critical Speed Yaw Marks This is a CSY mark left with no braking. Note the direction of the striations in the tire mark. Page 19 Braking and Turning Marks This is a CSY mark left with ABS braking. Note the direction of the striations in the tire mark. As the brake force increases, the angle of the striations approaches parallel. Page 0


11 Braking and Turning This is a CSY mark left with ABS braking. Note the direction of the striations in the tire mark change as the ABS system cycles. The average lateral acceleration is a little below the average ABS drag factor. Page 1 Braking and Turning Transition from CSY to full, non-abs braking. This evidence may be left by the panicked, untrained driver who inappropriately steers and then brakes to maximum. The yaw portion follows the CSY model. Page


12 Braking and Turning Page 3 Braking and Turning Controlled braking and turning by a trained driver. Rear ABS only. The inside mark is a skid, with longitudinal striations. The rear tires track outside the corresponding front tires. The outside tire marks show diagonal striations. May NOT use the CSY analysis with a full drag factor. Lateral acceleration is significantly lower than the full drag factor. Evidence does NOT support the CSY analysis. A skid analysis would be more appropriate. Page 4


13 Braking and Turning Page 5 Curving Acceleration Scuff This is a curving tire mark, but does not indicate a yaw. This is a curving acceleration scuff. It may not be analyzed for speed with a CSY analysis. Page 6
14 Speed Determination with CSY The equation for determining speed from CSY is based upon the concepts of Uniform Circular Motion. We make the assumption the vehicle will actually move in a decreasing spiral, because the vehicle is slowing as it progresses through the yaw. We may further assume the vehicle trajectory may be approximated as a series of circular arcs. These arcs will progressively decrease in radius. Page 7 Critical Speed Yaw of 003 Chevy Malibu (VC3000 Computer) 1. Post Yaw Braking G's Longitudinal Lateral 0. Initial value as calculated: Page 8 John Daily, Nathan Time Shigemura, Jeremy Daily
15 Speed Determination with CSY We may also assume the lateral acceleration factor may be determined through skid testing. Finally, we must show the vehicle is in equilibrium. In other words, the vehicle is in a steady state cornering condition. If this steady state condition is met, then the lateral acceleration stays at a constant level for some time. All of these concepts will be more fully explored by the presentation tomorrow Page 9 Speed Determination with CSY The same concepts we use to analyze speed from a CSY analysis have been historically used by Highway Engineers to design roads. In the 1965 Blue Book (AASHO), pg 15, we may find the following equation: Page 30
16 e + f = = 0.067V R V 15R This Reduces to: S = Rf Page 31 Critical Speed Yaw Derivation Recall the definition of Vectors: Quantity that possesses both MAGNITUDE and DIRECTION. Recall the definition of Velocity: A change in DISPLACEMENT with respect to a change in TIME. Recall the definition of Acceleration: A change in VELOCITY with respect to a change in TIME. Copyright 004 by John & Jeremy Daily & Nathan Shigemura 3
17 Critical Speed Yaw Derivation (cont.) Velocity and Acceleration are vector quantities. Thus, if the MAGNITUDE of a moving vehicle s velocity changes, there is an Acceleration. And if the DIRECTION of a moving vehicle changes, there is an Acceleration (because the velocity is changed). Copyright 004 by John & Jeremy Daily & Nathan Shigemura 33 Critical Speed Yaw Derivation (cont.) Therefore a vehicle traveling at constant velocity (magnitude) in a curve is undergoing an Acceleration (since it s continually changing directions). More specifically, it is experiencing a Lateral Acceleration. Copyright 004 by John & Jeremy Daily & Nathan Shigemura 34
18 Critical Speed Yaw Derivation (cont.) For a vehicle to move laterally left or right, it requires surface friction. More specifically, it requires a force which the surface friction will produce in the lateral direction (i.e. perpendicular to the longitudinal velocity vector). If the surface friction is greater than the lateral friction the vehicle is needing to travel in a curving path, the vehicle will be able to successfully negotiate the curving path. If the vehicle requires more lateral friction than the surface can provide, then the vehicle will begin to lose control. Copyright 004 by John & Jeremy Daily & Nathan Shigemura 35 Critical Speed Yaw Derivation (cont.) A vehicle traveling in a curving path is experiencing both lateral and longitudinal forces. Let s look at the lateral forces the vehicle is experiencing. Copyright 004 by John & Jeremy Daily & Nathan Shigemura 36
19 Critical Speed Yaw Derivation (cont.) Copyright 004 by John & Jeremy Daily & Nathan Shigemura 37 Critical Speed Yaw Derivation (cont.) Let s first look at lateral forces for a vehicle traveling in a curved path, at constant speed on a flat surface. Some of these forces will be normal (perpendicular) to the surface. The rest will be parallel to the surface. Copyright 004 by John & Jeremy Daily & Nathan Shigemura 38
20 Critical Speed Yaw Derivation (cont.) First, forces normal to the road surface: W F n Copyright 004 by John & Jeremy Daily & Nathan Shigemura 39 Critical Speed Yaw Derivation (cont.) Now, let s look at the forces parallel to the roadway. These forces will be lateral to the vehicle. Some are due to the dynamics of the vehicle in the curve and some will be due to the surface friction. Copyright 004 by John & Jeremy Daily & Nathan Shigemura 40
21 Critical Speed Yaw Derivation (cont.) Forces parallel to the road surface: Ma F f Copyright 004 by John & Jeremy Daily & Nathan Shigemura 41 Critical Speed Yaw Derivation (cont.) Displaying both normal and lateral forces on the same diagram looks like this: Ma, F f W, F n Copyright 004 by John & Jeremy Daily & Nathan Shigemura 4
22 Critical Speed Yaw Derivation (cont.) Let s examine the lateral forces on the vehicle corning on a banked road. As before, there will be forces normal to the road and parallel to the road. But we now have to take the bank, or angle of the road into account. Copyright 004 by John & Jeremy Daily & Nathan Shigemura 43 Critical Speed Yaw Derivation (cont.) Forces in the vertical direction: Ma Ma sin W F n W cos Copyright 004 by John & Jeremy Daily & Nathan Shigemura 44
23 Critical Speed Yaw Derivation (cont.) Forces in the lateral direction: Ma Ma cos F f W sin Copyright 004 by John & Jeremy Daily & Nathan Shigemura 45 Critical Speed Yaw Derivation (cont.) Displaying both normal and lateral forces on the same diagram looks like this: Ma Ma sin Ma cos, F f W W cos, F n W sin Copyright 004 by John & Jeremy Daily & Nathan Shigemura 46
24 Critical Speed Yaw Derivation (cont.) Let s look at equations which describe the previous slides. Forces normal to the road surface Since the vehicle is neither moving up off the road surface or down into the road surface, the vehicle is in equilibrium. In other words the force vectors balance. Mathematically: F n = 0 Copyright 004 by John & Jeremy Daily & Nathan Shigemura 47 Critical Speed Yaw Derivation (cont.) Substituting in the vectors: 1) F n Rearrange: w cos θ Ma sinθ = 0 w cosθ Ma sinθ = Multiply through by -1: ) w cosθ + Ma sinθ = F n F n W Ma sin Ma Ma cos, F f W cos, F n W sin Copyright 004 by John & Jeremy Daily & Nathan Shigemura 48
25 Critical Speed Yaw Derivation (cont.) Forces parallel to the road surface Since the vehicle is not sliding up or down the superelevation, the vehicle is in equilibrium. In other words the force vectors balance. Mathematically: F t = 0 Copyright 004 by John & Jeremy Daily & Nathan Shigemura 49 Critical Speed Yaw Derivation (cont.) Substituting in the vectors: 3) F f w θ Ma Rearrange: 4) + sin cosθ = 0 F f + w sinθ = Ma cosθ Recall: 5) F = µ f F n Substitute Eq. into Eq. 5: 6) F f = µ ( w cosθ + Ma sinθ ) W Ma sin Ma Ma cos, F f W cos, F n W sin Copyright 004 by John & Jeremy Daily & Nathan Shigemura 50
26 Critical Speed Yaw Derivation (cont.) Substitute Eq.. 6 into Eq.. 4: 7) 8) µ ( w cosθ + Ma sinθ ) + w sinθ = Ma cosθ Expand the left side: w µ cosθ + Maµ sinθ + w sinθ = Ma cosθ Newton s Second Law tells us that lateral acceleration is: And we know: M = w g a = v r Copyright 004 by John & Jeremy Daily & Nathan Shigemura 51 Critical Speed Yaw Derivation (cont.) Substitute for M and a into Eq.. 8: 9) w v w v w µ cosθ + µ sinθ + w sinθ = cosθ g r g r 1 Multiply both sides by and group terms: w v v 10) µ cosθ µ sinθ sinθ cosθ + gr Divide both sides by cos : 11) + v sinθ sinθ µ + µ + = gr cosθ cosθ = v gr gr Copyright 004 by John & Jeremy Daily & Nathan Shigemura 5
27 Critical Speed Yaw Derivation (cont.) Recall 1) sinθ = tanθ substitute it into Eq.. 11 cosθ v µ + µ tan θ + tanθ = gr v gr Recall that tan = slope = e. Substitute e for tan : 13) v µ + µ e + e = gr v gr Copyright 004 by John & Jeremy Daily & Nathan Shigemura 53 Critical Speed Yaw Derivation (cont.) Subtract the center term on the left side from both sides: 14) µ + e = v gr v µ e gr Group the right side terms over the common denominator gr: 15) v µ + e = v µ e gr Copyright 004 by John & Jeremy Daily & Nathan Shigemura 54
28 Critical Speed Yaw Derivation (cont.) Multiply both sides by gr : 16) gr ( µ + e) = v v µ e Factor v out of the right side elements: 17) gr ( µ + e) = v (1 µ e) Divide through by (1 :e): 18) gr( µ + e) = v 1 µ e Copyright 004 by John & Jeremy Daily & Nathan Shigemura 55 Critical Speed Yaw Derivation (cont.) Take the square root and rearrange: 19) v = Bring g out: gr( µ + e) 1 µ e 0) v = g r( µ + e) 1 µ e Copyright 004 by John & Jeremy Daily & Nathan Shigemura 56
29 Critical Speed Yaw Derivation (cont.) Substitute 3. for g and take the square root of 3.: 1) v = 5.67 r( µ + e) 1 µ e Substitute S for v : ) S = 5.67 r( µ + e) 1 µ e Copyright 004 by John & Jeremy Daily & Nathan Shigemura 57 Critical Speed Yaw Derivation (cont.) Divide through by and substitute f for ( (: + e) ) : 3) If e = 0, then: 3.86 r f Equation for Critical Speed on S = 1 µ e 4) S = r f a Curve with Positive Superelevation Equation for Critical Speed on a Level Curve Performing the same type of analysis for a negative superelevation will yield: 5) S = 3.86 r f 1+ µ e Copyright 004 by John & Jeremy Daily & Nathan Shigemura 58

30 Skid Testing In order to get the proper drag factor for a critical speed calculation, we must do test skids. Results between tests must be consistent. The following tests were conducted at the Wisconsin State Patrol Academy in August 00. Page 59 Page 60

31 Page 61 Page 6


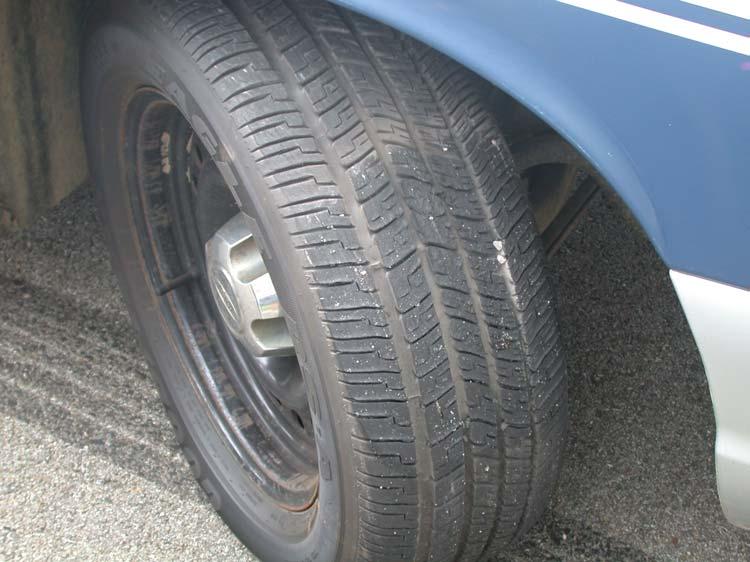
32 Close-up of Sliding Contact Patch Page 63 Spackling indicates the tire is braking at or near maximum. Page 64
33 Deceleration Factor Tests for 1997 Ford Crown Victoria with ABS Disabled G or f Crown Vic Tests Rear Brakes did not lock up w /o ABS(1) w /o ABS() Page 65 Time (sec) Deceleration Factor Tests from VC000 Accelerometer for 00 Pontiac Grand Prix 1. 1 Trial 1 Trial Trial G or f All Pontiac ABS Tests Page 66 Time (sec)
 w /o ABS() hi speed 0. 0 0 0.5 1 1.5.5 3 3.5 4 4.")
34 Acceleration Factor Tests from VC000 Accelerometer 1. 1 All Test Skids G or f Trial 1 Trial Trial 3 w/ ABS w /o ABS(1) w /o ABS() hi speed Time (sec) Page 67 Measuring Grade Page 68

35 Measuring Super-elevation Page 69 Radius Determination For the steady-state CSY, once we have chord and middle ordinate measurements, we may calculate the radius of the outside front tire mark with the following equation: To get the CM radius, subtract ½ of the track width from this calculation. c R = + 8m m Page 70
36 Lane Changes The purpose of this research is to determine the dynamic response of three types of vehicles in high performance lane change maneuvers. A lane change maneuver requires the vehicle to move laterally into a parallel path in the width of a highway lane, typically 1 feet or so. In a high performance maneuver, the steering input will be completed quickly, first one direction, then the other. Page 71 Lane Changes Because these maneuvers take place in little distance and time, they are transient in nature. As such, the vehicle does not have time to reach an equilibrium, or steady state condition, before the vehicle is asked by the driver to change direction again. These high performance lane changes may cause tire(s) to saturate and mark the road. Page 7
37 Lane Changes To a neophyte investigator, these tire marks may sometimes be mistaken for CSY marks. Because of the transient nature of the vehicle motion, we may not use a classical CSY analysis to compute speed from these marks. We will design testing to examine important aspects of vehicle motion during lane change maneuvers. We will also examine the potential error of using a CSY analysis for speed, and will examine the sources of the error. Page 73 Lane Changes Simple models exist to generally examine lane change maneuvers if the entrance speed and lateral acceleration are specified. (FTAR Chapter 7) These models were initially developed to examine lane changes with lateral accelerations encountered in normal driving. The distance equation of the analysis was essentially validated in SAE (Araszewski, et al). The average error for 15 tests was 0%. Page 74

38 Lane Changes Our testing will examine this simple model to see if we may get reasonable results for distance and angle for these high performance maneuvers. Finally, we will see if we can develop a simple method to determine speed from the characteristics of lane change tire marks. Page 75 Lane Changes Page 76


39 Lane Changes Page 77 Lane Changes Page 78
40 Test Design In order to describe the vehicle motion, we will want to measure the following data points: Lateral Acceleration, Gs Longitudinal Acceleration, Gs Yaw Rate, degrees per second Steer Angle Time based position on the road Page 79 Instrumentation The VC-3000 is a turn-key system for our research. This accelerometer system may be configured with yaw rate sensors mounted remotely. We set this system up with the unit mounted on the windshield and the yaw rate sensors mounted on the dash. We used a string potentiometer mounted on the steering rack to determine steering wheel angles. (Jacksonville Tests) Page 80

41 Instrumentation Page 81 Dynamic Roadway Marking System (DRMS) Patent Pending History Seed from using two shot markers as SP003 for spin analysis Needed distance and orientation data Solution: DERMS Modern electronic paint ball markers provide repeating fire Remote control and diagnostic Page 8

42 Page 83 Bumper guns Dynamic Roadway Marking System (DRMS) Patent Pending History Seed from using two shot markers as SP003 for spin analysis Needed distance and orientation data Solution: DERMS Modern electronic paint ball markers provide repeating fire Remote control and diagnostic box Page 84


43 DRMS Mounted to the Receiver on a Dodge Dakota Page 85 DRMS Mounted to the License Plate Bracket of the Dakota Page 86


44 DRMS Mounted on the Back of a Ford Crown Victoria Page 87 Dodge Dakota (Ohio Testing) Length Midpoint W Rear W Front Center of Mass Page 88
45 Interpreting DRMS markings Total Station Mapping of the Points Import to CAD Method #1: Draw lines connecting front the dot to rear dot Record location of midpoint and orientation Determine COM Method #: Measure the car to make a CAD symbol with the DRMS included. Place the symbol over the paintball marks Page 89 DRMS Specifications Maximum Frequency is 8-9 shots per second. Frequency is adjustable. Duration of fire is adjustable from 1 second to 30 seconds. Time lag from fire pulse to paint mark is 50 ms (height dependent). 1 V power input. Page 90
46 DRMS Features Remote firing of markers. Communicates with the VC3000. Provides a physical link between roadway evidence and instrument data Usable on any vehicle Mounts to a license plate bracket Mounts to a hitch receiver Drill new mounting points Consistent time base between shots Page 91 Information Provided by DRMS Time when markers are fired If one marker: Location of one point of car Orientation and Center of Mass location if there are tire marks If two markers: Location and orientation regardless of tire evidence Speed and acceleration can be backed out Page 9
47 Line Line Line Line Line Line Line Line 17 Application of the DRMS Vehicle Testing and Reconstruction Validation of formulas Critical Speed Yaw Lane Change Spin Analysis and Research Perception-Reaction Distance Commercial Vehicle Amplification Ratios Teaching Aides Illustrate acceleration (ticker tape) Evidence interpretation Vehicle System Identification Page 93 Real Data from Paint Marks 1 Extract X and Y coordinates of the midpoint of the line from the CAD drawing Determine the angle of the line Approach Velocity = 45 mph 7 Line Line 8 Line Line1 Line Line1 9 Line Line1 Line Line1 10 Line Line1 11 Line Line Tire Marks Page 94 18
48 Rotate Coordinate Systems Put the approach on the X axis x ' = x cosθ + y sinθ A point on the ground y ' = xsinθ y cosθ y The angle is the Approach Angle y x θ x Page 95 Adjust for Center of Mass Translate the Coordinate system to make the initial point of interest the origin Adjust for the COM based on the distance from the midpoint, r Make sure to include the angle components COM COM x y = x + r cosθ = y + r sinθ Midpoint W Rear r Center of Mass W Front Page 96
49 Typical Results of Lane Change Maneuver- Crown Victoria Lateral Displacement (ft) Lane Change Path from DRMS Longitudinal Distance (ft) Known Entrance Speed VC 3000 and ODBII 4.5 mph Radius from 30 ft Chord.59 ft Speed from CSY 5.14 mph % error Page 97 Time History of Vehicle Performance based on VC3000 Data Accel (G) Lat Accel (G) Rate Gyro (deg/sec) Acceleration Rate Gyro (degrees/sec) Time from First Shot Page 98
50 Radius from Evidence Points Tire Evidence Mark Ordinate Tire Mark Radius From Cubic Third Order Second Order Chord Radius (ft) y = E-05x x x R = y = x x R = Page 99 Why is There Error? Assume a constant lateral acceleration Lateral acceleration is present for only 54 ft based on shot marks ½ second duration Assume Constant Radius Radius actually increases Behaves like a spiral CSY analysis would yield mph and f = 0.8 Page 100
51 Relative Radii Radius Based on Actual Speed Radius from Chord & M.O. Page 101 Radius Problems Y (ft) Path of the Center of Mass for a Lane Change Uniform Circular Arc, Radius = X (ft) X COM YCOM Page 10
52 Lane Change Maneuver for a Dodge Dakota Lateral Displacement (ft) Lane Change Path from DRMS Longitudinal Distance (ft) Known Entrance Speed VC mph Radius from 30 ft Chord 3.54 ft Speed from CSY mph 19.9% error Page 103 Lane Change Example of a Pickup Time History of Vehicle Performance based on VC3000 Data Acceleration Accel (G) Lat Accel (G) Rate Gyro (deg/sec) Rate Gyro (degrees/sec) Page 104 John Daily, Time from Nathan First Shot Shigemura, Jeremy Daily
53 Lane Change Example of the Achieva Time History of Vehicle Performance based on VC3000 Data Acceleration Accel (G) 0 Lat Accel (G) Rate Gyro (deg/sec) Rate Gyro (degrees/sec) Page 105 John Daily, Time from Nathan First Shot Shigemura, Jeremy Daily -5 Validation of Lane Change Equations d Speed is measured Drag Factor is reduced by 80% From survey data we can find m and d Page 106 d = 0.366S S R = f θ = sin 1 d R θ m f m
54 Validation of Lane Change Equations Predicted angle agrees with measured angle within degrees Distance agrees within feet Computes an Effective Radius Working backward to obtain speed is too sensitive to the small angle. degrees can give 10 mph differences. Page 107 Speed From Lane Change Work in this area is preliminary, but shows promise. We wish to develop techniques that will allow the scene investigator to take evidence measurements that may be converted into a path radius that is both accurate and repeatable. We must also account for the shape of the lateral acceleration curve. Page 108
55 Speed From Lane Change Work with the Olds tests in Jacksonville have resulted in a speed calculation within one mph of the integrated entry speed. More analysis and more tests need to be done, but the method shows promise and will be published when finished. Page 109 Summary and Conclusions CSY Analysis is inappropriate for determining speed from a transient lane change maneuver. Interpretation of the evidence is paramount to recognizing the lane change. Testing was conducted using the VC3000DAQ Accelerometer and the Dynamic Roadway Marking System Test show errors for lane changes Lane Change equations presented in FTAR are validated. Page 110
Drag Factors in Spins and on Hills
 Drag Factors in Spins and on Hills John Daily Jackson Hole Scientific Investigations, Inc. Box 2206 Jackson, WY 83001 (307) 733-4559 jhsi@rmisp.com Drag Factor Adjustment Adjusting the drag factor for
Single Vehicle Loss of Control
 . Single Vehicle Loss of Control the natural motion is to continue in the same direction weight shifts to outside of turn INERTIA weight shifts to outside of turn INERTIA friction a yaw occurs when the
FRONTAL OFF SET COLLISION
 FRONTAL OFF SET COLLISION MARC1 SOLUTIONS Rudy Limpert Short Paper PCB2 2014 www.pcbrakeinc.com 1 1.0. Introduction A crash-test-on- paper is an analysis using the forward method where impact conditions
Accident Reconstruction & Vehicle Data Recovery Systems and Uses
 Research Engineers, Inc. (919) 781-7730 7730 Collision Analysis Engineering Animation Accident Reconstruction & Vehicle Data Recovery Systems and Uses Bill Kluge Thursday, May 21, 2009 Accident Reconstruction
SHORT PAPER PCB OBLIQUE COLLISIONS ENGINEERING EQUATIONS, INPUT DATA AND MARC 1 APPLICATIONS. Dennis F. Andrews, Franco Gamero, Rudy Limpert
 SHORT PAPER PCB 8-2006 OBLIQUE COLLISIONS ENGINEERING EQUATIONS, INPUT DATA AND MARC 1 APPLICATIONS By: Dennis F. Andrews, Franco Gamero, Rudy Limpert PC-BRAKE, INC. 2006 www.pcbrakeinc.com 1 PURPOSE OF
MOTOR VEHICLE HANDLING AND STABILITY PREDICTION
 MOTOR VEHICLE HANDLING AND STABILITY PREDICTION Stan A. Lukowski ACKNOWLEDGEMENT This report was prepared in fulfillment of the Scholarly Activity Improvement Fund for the 2007-2008 academic year funded
JCE4600 Fundamentals of Traffic Engineering
 JCE4600 Fundamentals of Traffic Engineering Introduction to Geometric Design Agenda Kinematics Human Factors Stopping Sight Distance Cornering Intersection Design Cross Sections 1 AASHTO Green Book Kinematics
Research on Skid Control of Small Electric Vehicle (Effect of Velocity Prediction by Observer System)
") Proc. Schl. Eng. Tokai Univ., Ser. E (17) 15-1 Proc. Schl. Eng. Tokai Univ., Ser. E (17) - Research on Skid Control of Small Electric Vehicle (Effect of Prediction by Observer System) by Sean RITHY *1
Proc. Schl. Eng. Tokai Univ., Ser. E (17) 15-1 Proc. Schl. Eng. Tokai Univ., Ser. E (17) - Research on Skid Control of Small Electric Vehicle (Effect of Prediction by Observer System) by Sean RITHY *1
Chapter III Geometric design of Highways. Tewodros N.
 Chapter III Geometric design of Highways Tewodros N. www.tnigatu.wordpress.com tedynihe@gmail.com Introduction Appropriate Geometric Standards Design Controls and Criteria Design Class Sight Distance Design
SHORT PAPER PCB OBLIQUE COLLISIONS ENGINEERING EQUATIONS, INPUT DATA AND MARC 1 APPLICATIONS. Dennis F. Andrews, Franco Gamero, Rudy Limpert
 SHORT PAPER PCB 5-2006 OBLIQUE COLLISIONS ENGINEERING EQUATIONS, INPUT DATA AND MARC 1 APPLICATIONS By: Dennis F. Andrews, Franco Gamero, Rudy Limpert PC-BRAKE, INC. 2006 www.pcbrakeinc.com 1 PURPOSE OF
Simple Gears and Transmission
 Simple Gears and Transmission Simple Gears and Transmission page: of 4 How can transmissions be designed so that they provide the force, speed and direction required and how efficient will the design be?
Deceleration Rates of Vehicles with Disabled Tires
 Deceleration Rates of Vehicles with Disabled Tires 2017-01-1427 Daniel Koch, Gray Beauchamp, and David Pentecost Kineticorp LLC Published 03/28/2017 CITATION: Koch, D., Beauchamp, G., and Pentecost, D.,
Calculated Brake Channel
 Why? For driver development - to complement the channel. Figure 1 - Brake and trace A calculated channel can help you figure out whether the driver is getting the most from the s, and allows for comparison
THE IMPORTANCE OF DYNAMIC TESTING IN DETERMINING THE YAW STABILITY OF VEHICLES
 THE IMPORTANCE OF DYNAMIC TESTING IN DETERMINING THE YAW STABILITY OF VEHICLES Stephen M. Arndt Don C. Stevens Safety Engineering & Forensic Analysis, Inc. Mark W. Arndt Transportation Safety Technologies,
Copyright Laura J Prange
 Copyright 2017 Laura J Prange Vehicle Dynamics Modeling for Electric Vehicles Laura J Prange A thesis submitted in partial fulfillment of the requirements for the degree of Master of Science in Mechanical
Introduction. 3. The sample calculations used throughout this paper are based on a roadway posted at 35 mph.
 Calculating a Legally Enforceable Yellow Change Interval For Turning Lanes in California by Jay Beeber, Executive Director, Safer Streets L.A., Member ITE and J. J. Bahen, Jr., P.E., Life Member National
Reduction of Self Induced Vibration in Rotary Stirling Cycle Coolers
 Reduction of Self Induced Vibration in Rotary Stirling Cycle Coolers U. Bin-Nun FLIR Systems Inc. Boston, MA 01862 ABSTRACT Cryocooler self induced vibration is a major consideration in the design of IR
Crash Test Overview Rollover Crashes
 Crash Test Overview Rollover Crashes 24 th Annual IATAI Conference September 15-17, 2010 Presented by John Daily Jackson Hole Scientific Investigations, Inc. Box 2206 Jackson, WY 83001 (307) 733-4559 john@jhscientific.com
Physics 2. Chapter 10 problems. Prepared by Vince Zaccone For Campus Learning Assistance Services at UCSB
 Physics 2 Chapter 10 problems 10.6 A machinist is using a wrench to loosen a nut. The wrench is 25cm long, and he exerts a 17-N force at the end of the handle. a) What torque does the machinist exert about
1. What data might a car leave behind at the scene of an accident?
 Bellwork 2-16-16 It takes 8,460 bolts to assemble an automobile, and one nut to scatter it all over the road. Author Unknown 1. What data might a car leave behind at the scene of an accident? 1 5 9 ACCIDENT
Physics 2048 Test 2 Dr. Jeff Saul Fall 2001
 Physics 2048 Test 2 Dr. Jeff Saul Fall 2001 Name: Group: Date: READ THESE INSTRUCTIONS BEFORE YOU BEGIN Before you start the test, WRITE YOUR NAME ON EVERY PAGE OF THE EXAM. Calculators are permitted,
CEE 320. Fall Horizontal Alignment
 Horizontal Alignment Horizontal Alignment Objective: Geometry of directional transition to ensure: Safety Comfort Primary challenge Transition between two directions Fundamentals Circular curves Superelevation
Vehicle Dynamics and Control
 Rajesh Rajamani Vehicle Dynamics and Control Springer Contents Dedication Preface Acknowledgments v ix xxv 1. INTRODUCTION 1 1.1 Driver Assistance Systems 2 1.2 Active Stabiüty Control Systems 2 1.3 RideQuality
Pre-lab Quiz/PHYS 224 Faraday s Law and Dynamo. Your name Lab section
 Pre-lab Quiz/PHYS 224 Faraday s Law and Dynamo Your name Lab section 1. What do you investigate in this lab? 2. In a dynamo, the coil is wound with N=100 turns of wire and has an area A=0.0001 m 2. The
Road Accident Investigation. specialists in the UK who use mathematics to reconstruct the probable manoeuvres
 Road Accident Investigation The phrases the police service and using mathematics are not usually associated with each other. There are however a small number of police officers and other specialists in
Study of the Performance of a Driver-vehicle System for Changing the Steering Characteristics of a Vehicle
 20 Special Issue Estimation and Control of Vehicle Dynamics for Active Safety Research Report Study of the Performance of a Driver-vehicle System for Changing the Steering Characteristics of a Vehicle
Bill the Cat, tied to a rope, is twirled around in a vertical circle. Draw the free-body diagram for Bill in the positions shown. Then sum the X and
 Assignment (a) No assigned WH. (b)read motion in the presence of resistive forces (finish the chapter). Go over problems covered in classes. (c)read: System and Environments, Work done by a constant force,
TREAD and TRACTION. Tread- The grooved surface of a tire that grips the road.
 1 NAME: HOUR: DATE: NO: Chapter 5: Natural Laws and Car Control GRAVITY- Is the force that pulls all things to Earth. UPHILL DRIVING- Gravity will decrease your car down when going uphill, unless you use
3.9 Accident Investigation Data (5.9).notebook February 28, 2018
.notebook February 28, 2018") Objective Today I will determine skid speed using formulas. Bellwork 1) What is the reaction distance for Jane traveling 55mph? 2) What is the braking distance for Jane driving 55mph? 3) If Jane decides
Objective Today I will determine skid speed using formulas. Bellwork 1) What is the reaction distance for Jane traveling 55mph? 2) What is the braking distance for Jane driving 55mph? 3) If Jane decides
Recommendations for AASHTO Superelevation Design
 Recommendations for AASHTO Superelevation Design September, 2003 Prepared by: Design Quality Assurance Bureau NYSDOT TABLE OF CONTENTS Contents Page INTRODUCTION...1 OVERVIEW AND COMPARISON...1 Fundamentals...1
Improvement of Vehicle Dynamics by Right-and-Left Torque Vectoring System in Various Drivetrains x
 Improvement of Vehicle Dynamics by Right-and-Left Torque Vectoring System in Various Drivetrains x Kaoru SAWASE* Yuichi USHIRODA* Abstract This paper describes the verification by calculation of vehicle
Rotational Kinematics and Dynamics Review
 Rotational Kinematics and Dynamics Review 1. The Earth takes slightly less than one day to complete one rotation about the axis passing through its poles. The actual time is 8.616 10 4 s. Given this information,
White Paper: The Physics of Braking Systems
 White Paper: The Physics of Braking Systems The Conservation of Energy The braking system exists to convert the energy of a vehicle in motion into thermal energy, more commonly referred to as heat. From
ISO 8855 INTERNATIONAL STANDARD. Road vehicles Vehicle dynamics and road-holding ability Vocabulary
 INTERNATIONAL STANDARD ISO 8855 Second edition 2011-12-15 Road vehicles Vehicle dynamics and road-holding ability Vocabulary Véhicules routiers Dynamique des véhicules et tenue de route Vocabulaire Reference
How and why does slip angle accuracy change with speed? Date: 1st August 2012 Version:
 Subtitle: How and why does slip angle accuracy change with speed? Date: 1st August 2012 Version: 120802 Author: Brendan Watts List of contents Slip Angle Accuracy 1. Introduction... 1 2. Uses of slip angle...
ABS. Prof. R.G. Longoria Spring v. 1. ME 379M/397 Vehicle System Dynamics and Control
 ABS Prof. R.G. Longoria Spring 2002 v. 1 Anti-lock Braking Systems These systems monitor operating conditions and modify the applied braking torque by modulating the brake pressure. The systems try to
A KINEMATIC APPROACH TO HORIZONTAL CURVE TRANSITION DESIGN. James A. Bonneson, P.E.
 TRB Paper No.: 00-0590 A KINEMATIC APPROACH TO HORIZONTAL CURVE TRANSITION DESIGN by James A. Bonneson, P.E. Associate Research Engineer Texas A&M University College Station, TX 77843-3135 (409) 845-9906
View Numbers and Units
 To demonstrate the usefulness of the Working Model 2-D program, sample problem 16.1was used to determine the forces and accelerations of rigid bodies in plane motion. In this problem a cargo van with a
Simple Gears and Transmission
 Simple Gears and Transmission Contents How can transmissions be designed so that they provide the force, speed and direction required and how efficient will the design be? Initial Problem Statement 2 Narrative
EDR Case Studies Intersection Crash
 EDR Case Studies Intersection Crash Presented by Richard R. Ruth, P.E. At 2017 IPTM Special Problems rick@ruthconsulting.com 313-910-5809 Copyright Ruth 2017 - Authorized for use by IPTM and SAE 1 Case
Review on Handling Characteristics of Road Vehicles
 RESEARCH ARTICLE OPEN ACCESS Review on Handling Characteristics of Road Vehicles D. A. Panke 1*, N. H. Ambhore 2, R. N. Marathe 3 1 Post Graduate Student, Department of Mechanical Engineering, Vishwakarma
III B.Tech I Semester Supplementary Examinations, May/June
 Set No. 1 III B.Tech I Semester Supplementary Examinations, May/June - 2015 1 a) Derive the expression for Gyroscopic Couple? b) A disc with radius of gyration of 60mm and a mass of 4kg is mounted centrally
EDR Analyst Guide EACH Yes No (says not) Doesn t Say check DL for other criteria How much Longitudinal Lateral Graph Graph important
 Doesn t Say check DL for other criteria How much Longitudinal Lateral Graph Graph important") 1. Are there any EDR s available from any of the vehicles involved that are supported by CDR? (Check help file) 2. Is there more than one EDR in any of the accident vehicles? Ford PCM or GM ROS? (Check
1. Are there any EDR s available from any of the vehicles involved that are supported by CDR? (Check help file) 2. Is there more than one EDR in any of the accident vehicles? Ford PCM or GM ROS? (Check
WP Application and Use of Linear Interpolation Models: A Case Study. Investigative Training Service, LLC. Eric Hunter, P.E.
 WP 2016-1 Application and Use of Linear Interpolation Models: A Case Study Eric Hunter, P.E. Investigative Training Service, LLC. Copyright 2015 Engineering Dynamics Corporation ABSTRACT Computer simulations
Passenger Vehicle Steady-State Directional Stability Analysis Utilizing EDVSM and SIMON
 WP# 4-3 Passenger Vehicle Steady-State Directional Stability Analysis Utilizing and Daniel A. Fittanto, M.S.M.E., P.E. and Adam Senalik, M.S.G.E., P.E. Ruhl Forensic, Inc. Copyright 4 by Engineering Dynamics
Simulating Rotary Draw Bending and Tube Hydroforming
 Abstract: Simulating Rotary Draw Bending and Tube Hydroforming Dilip K Mahanty, Narendran M. Balan Engineering Services Group, Tata Consultancy Services Tube hydroforming is currently an active area of
Vehicle Dynamics and Drive Control for Adaptive Cruise Vehicles
 Vehicle Dynamics and Drive Control for Adaptive Cruise Vehicles Dileep K 1, Sreepriya S 2, Sreedeep Krishnan 3 1,3 Assistant Professor, Dept. of AE&I, ASIET Kalady, Kerala, India 2Associate Professor,
METHOD FOR TESTING STEERABILITY AND STABILITY OF MILITARY VEHICLES MOTION USING SR60E STEERING ROBOT
 Journal of KONES Powertrain and Transport, Vol. 18, No. 1 11 METHOD FOR TESTING STEERABILITY AND STABILITY OF MILITARY VEHICLES MOTION USING SR6E STEERING ROBOT Wodzimierz Kupicz, Stanisaw Niziski Military
A STUDY OF HUMAN KINEMATIC RESPONSE TO LOW SPEED REAR END IMPACTS INVOLVING VEHICLES OF LARGELY DIFFERING MASSES
 A STUDY OF HUMAN KINEMATIC RESPONSE TO LOW SPEED REAR END IMPACTS INVOLVING VEHICLES OF LARGELY DIFFERING MASSES Brian Henderson GBB UK Ltd, University of Central Lancashire School of Forensic & Investigative
Head light sight distance is the distance visible to a driver during night driving under the illumination of head light
 HPTER 13. SIGHT DISTNE NPTEL May 24, 2006 hapter 13 Sight distance 13.1 Overview The safe and efficient operation of vehicles on the road depends very much on the visibility of the road ahead of the driver.
Headlight Test and Rating Protocol (Version I)
") Headlight Test and Rating Protocol (Version I) February 2016 HEADLIGHT TEST AND RATING PROTOCOL (VERSION I) This document describes the Insurance Institute for Highway Safety (IIHS) headlight test and
Headlight Test and Rating Protocol (Version I) February 2016 HEADLIGHT TEST AND RATING PROTOCOL (VERSION I) This document describes the Insurance Institute for Highway Safety (IIHS) headlight test and
Post-Impact Dynamics for Vehicles with a High Yaw Velocity
 Post-Impact Dynamics for Vehicles with a High Yaw Velocity 2016-01-1470 Nathan A. Rose, Neal Carter, and Gray Beauchamp Kineticorp LLC Published 04/05/2016 CITATION: Rose, N., Carter, N., and Beauchamp,
Low Speed Rear End Crash Analysis
 Low Speed Rear End Crash Analysis MARC1 Use in Test Data Analysis and Crash Reconstruction Rudy Limpert, Ph.D. Short Paper PCB2 2015 www.pcbrakeinc.com e mail: prosourc@xmission.com 1 1.0. Introduction
Strategies for Negotiating Hills and Curves
 Idaho Driver Education and Training Strategies for Negotiating Hills and Curves M9-1 DRIVING THROUGH CURVES Curves Come in a Variety of Designs Curves have a higher risk because there are many line-ofsight
Driven Damped Harmonic Oscillations
 Driven Damped Harmonic Oscillations Page 1 of 8 EQUIPMENT Driven Damped Harmonic Oscillations 2 Rotary Motion Sensors CI-6538 1 Mechanical Oscillator/Driver ME-8750 1 Chaos Accessory CI-6689A 1 Large Rod
distance travelled circumference of the circle period constant speed = average speed =
 Lecture 6 Circular motion Instantaneous velocity and speed For an object travelling in the uniform circular motion, its instantaneous velocity is not constant because the direction of the object is continuously
SHORT PAPER PCB IN-LINE COLLISIONS ENGINEERING EQUATIONS, INPUT DATA AND MARC 1 APPLICATIONS. Dennis F. Andrews, Franco Gamero, Rudy Limpert
 SHORT PAPER PCB 3-2006 IN-LINE COLLISIONS ENGINEERING EQUATIONS, INPUT DATA AND MARC 1 APPLICATIONS By: Dennis F. Andrews, Franco Gamero, Rudy Limpert PC-BRAKE, INC. 2006 www.pcbrakeinc.com 1 PURPOSE OF
Mr. Freeze QUALITATIVE QUESTIONS
 QUALITATIVE QUESTIONS Many of the questions that follow refer to the graphs of data collected when riding Mr. Freeze with high tech data collection vests. With your I.D., you can borrow a vest without
TECHNICAL NOTE. NADS Vehicle Dynamics Typical Modeling Data. Document ID: N Author(s): Chris Schwarz Date: August 2006
: Chris Schwarz Date: August 2006") TECHNICAL NOTE NADS Vehicle Dynamics Typical Modeling Data Document ID: N06-017 Author(s): Chris Schwarz Date: August 2006 National Advanced Driving Simulator 2401 Oakdale Blvd. Iowa City, IA 52242-5003
TECHNICAL NOTE NADS Vehicle Dynamics Typical Modeling Data Document ID: N06-017 Author(s): Chris Schwarz Date: August 2006 National Advanced Driving Simulator 2401 Oakdale Blvd. Iowa City, IA 52242-5003
Faraday's Law of Induction
 Purpose Theory Faraday's Law of Induction a. To investigate the emf induced in a coil that is swinging through a magnetic field; b. To investigate the energy conversion from mechanical energy to electrical
ROLLOVER CRASHWORTHINESS OF A RURAL TRANSPORT VEHICLE USING MADYMO
 ROLLOVER CRASHWORTHINESS OF A RURAL TRANSPORT VEHICLE USING MADYMO S. Mukherjee, A. Chawla, A. Nayak, D. Mohan Indian Institute of Technology, New Delhi INDIA ABSTRACT In this work a full vehicle model
Unit 8 ~ Learning Guide Name:
 Unit 8 ~ Learning Guide Name: Instructions: Using a pencil, complete the following notes as you work through the related lessons. Show ALL work as is explained in the lessons. You are required to have
Evaluation of the ARAS HD ICATS System in Relation to the RICSAC Staged Crash Events.
 1 AWP #2013-3 Evaluation of the ARAS HD ICATS System in Relation to the RICSAC Staged Crash Events. Mike Kennedy, ACTAR, and Paul Hetherington, BTACS ABSTRACT ARAS HD is a software application designed
MONTANA TEEN DRIVER CURRICULUM GUIDE Lesson Plan & Teacher Commentary. Module 2.2 Basic Control and Vehicle Location
 MONTANA TEEN DRIVER CURRICULUM GUIDE Lesson Plan & Teacher Commentary Module 2.2 Basic Control and Vehicle Location Lesson Objective (from Essential Knowledge and Skills Topics): Topic 6. Performing Basic
SAE Baja - Drivetrain
 SAE Baja - Drivetrain By Ricardo Inzunza, Brandon Janca, Ryan Worden Team 11 Engineering Analysis Document Submitted towards partial fulfillment of the requirements for Mechanical Engineering Design I
Triple Fatal Motorcycle Crash On Wellington Road And Ferguson Line South of London, Ontario
 Triple Fatal Motorcycle Crash On Wellington Road And Ferguson Line South of London, Ontario Posting Date: Sept 4-2015 Motorcycles such as those pictured in this file photo continue to over represent the
Hovercraft
 1 Hovercraft 2017-2018 Names: Score: / 44 Show all equations and work. Point values are shown in parentheses at the end of the question. Assume g=9.8 m/s/s for all calculations. Include units in your answer.
Newton s First Law. Evaluation copy. Vernier data-collection interface
 Newton s First Law Experiment 3 INTRODUCTION Everyone knows that force and motion are related. A stationary object will not begin to move unless some agent applies a force to it. But just how does the
Cable Car. Category: Physics: Balance & Center of Mass, Electricity and Magnetism, Force and Motion. Type: Make & Take.
 Cable Car Category: Physics: Balance & Center of Mass, Electricity and Magnetism, Force and Motion Type: Make & Take Rough Parts List: 1 Paperclip, large 2 Paperclips, small 1 Wood stick, 1 x 2 x 6 4 Electrical
Vehicle functional design from PSA in-house software to AMESim standard library with increased modularity
 Vehicle functional design from PSA in-house software to AMESim standard library with increased modularity Benoit PARMENTIER, Frederic MONNERIE (PSA) Marc ALIRAND, Julien LAGNIER (LMS) Vehicle Dynamics
Tech Tip: Trackside Tire Data
 Using Tire Data On Track Tires are complex and vitally important parts of a race car. The way that they behave depends on a number of parameters, and also on the interaction between these parameters. To
EXPERIMENT 13 QUALITATIVE STUDY OF INDUCED EMF
 220 13-1 I. THEORY EXPERIMENT 13 QUALITATIVE STUDY OF INDUCED EMF Along the extended central axis of a bar magnet, the magnetic field vector B r, on the side nearer the North pole, points away from this
GEOMETRIC ALIGNMENT AND DESIGN
 GEOMETRIC ALIGNMENT AND DESIGN Geometric parameters dependent on design speed For given design speeds, designers aim to achieve at least the desirable minimum values for stopping sight distance, horizontal
Sight Distance. A fundamental principle of good design is that
 Session 9 Jack Broz, PE, HR Green May 5-7, 2010 Sight Distance A fundamental principle of good design is that the alignment and cross section should provide adequate sight lines for drivers operating their
WEEK 4 Dynamics of Machinery
 WEEK 4 Dynamics of Machinery References Theory of Machines and Mechanisms, J.J.Uicker, G.R.Pennock ve J.E. Shigley, 2003 Prof.Dr.Hasan ÖZTÜRK 1 DYNAMICS OF RECIPROCATING ENGINES Prof.Dr.Hasan ÖZTÜRK The
Dynamics Cart Accessory Track Set (2.2m version)
") Includes Teacher's Notes and Typical Experiment Results Instruction Manual and Experiment Guide for the PASCO scientific Model ME-9458 and ME-9452 012-05024E 6/94 Dynamics Cart Accessory Track Set (2.2m
Includes Teacher's Notes and Typical Experiment Results Instruction Manual and Experiment Guide for the PASCO scientific Model ME-9458 and ME-9452 012-05024E 6/94 Dynamics Cart Accessory Track Set (2.2m
(HIGHWAY GEOMETRIC DESIGN -1)
") LECTURE HOUR-21 TE-1(10CV56) UNIT-3 (HIGHWAY GEOMETRIC DESIGN -1) Typical Cross section of highway class: Typical two lane National or state highway (Rural section) Typical single lane road with paved
LECTURE HOUR-21 TE-1(10CV56) UNIT-3 (HIGHWAY GEOMETRIC DESIGN -1) Typical Cross section of highway class: Typical two lane National or state highway (Rural section) Typical single lane road with paved
Friction. Coefficients of friction for rubber on roads are listed in the table. asphalt road) Dry road Wet road 0.53
 Dry road Wet road 0.53") Conceptual questions Friction 1 Most bikes have normal tires: some have fats. a Suppose the wheels on both a normal bike (not shown) and the bikes above have outside diameters of 67 cm. By using your own
Conceptual questions Friction 1 Most bikes have normal tires: some have fats. a Suppose the wheels on both a normal bike (not shown) and the bikes above have outside diameters of 67 cm. By using your own
Environmental Envelope Control
 Environmental Envelope Control May 26 th, 2014 Stanford University Mechanical Engineering Dept. Dynamic Design Lab Stephen Erlien Avinash Balachandran J. Christian Gerdes Motivation New technologies are
1.half the ladybug's. 2.the same as the ladybug's. 3.twice the ladybug's. 4.impossible to determine
 1. A ladybug sits at the outer edge of a merry-go-round, and a gentleman bug sits halfway between her and the axis of rotation. The merry-go-round makes a complete revolution once each second. The gentleman
Extracting Tire Model Parameters From Test Data
 WP# 2001-4 Extracting Tire Model Parameters From Test Data Wesley D. Grimes, P.E. Eric Hunter Collision Engineering Associates, Inc ABSTRACT Computer models used to study crashes require data describing
Maximum Superelevation: Desirable, Allowable, and Absolute
 Maximum Superelevation: Desirable, Allowable, and Absolute Nazmul Hasan, M. Eng. SNC-Lavalin Inc. ancouver, ON ABSTRACT The maximum values of superelevation are often qualified as desirable, allowable
25 B43 B43.1 THE MEASUREMENT OF e/m BY THE BAINBRIDGE METHOD
 25 B43 B43.1 THE MEASUREMENT OF e/m BY THE BAINBRIDGE METHOD OBJECT The object of this experiment is to use the Bainbridge method to determine the electron chargeto-mass ratio. DESCRIPTION OF APPARATUS
International Conference on Mechanics, Materials and Structural Engineering (ICMMSE 2016)
") International Conference on Mechanics, Materials and Structural Engineering (ICMMSE 2016) Comparison on Hysteresis Movement in Accordance with the Frictional Coefficient and Initial Angle of Clutch Diaphragm
International Conference on Mechanics, Materials and Structural Engineering (ICMMSE 2016) Comparison on Hysteresis Movement in Accordance with the Frictional Coefficient and Initial Angle of Clutch Diaphragm
Compliance Test Results. of Independently Manufactured. Automotive Replacement Headlamps. to FMVSS 108. Study I. March 18, 2003
 Compliance Test Results of Independently Manufactured Automotive Replacement Headlamps to FMVSS 108 Study I March 18, 2003 Prepared By Certified Automotive Parts Association 1518 K Street NW, Suite 306
Dynamics Cart Accessory Track Set (1.2m version)
") Includes Teacher's Notes and Typical Experiment Results Instruction Manual and Experiment Guide for the PASCO scientific Model ME-9435A and ME-9429A 012-05035E 7/94 Dynamics Cart Accessory Track Set (1.2m
Includes Teacher's Notes and Typical Experiment Results Instruction Manual and Experiment Guide for the PASCO scientific Model ME-9435A and ME-9429A 012-05035E 7/94 Dynamics Cart Accessory Track Set (1.2m
The University of Melbourne Engineering Mechanics
 The University of Melbourne 436-291 Engineering Mechanics Tutorial Twelve General Plane Motion, Work and Energy Part A (Introductory) 1. (Problem 6/78 from Meriam and Kraige - Dynamics) Above the earth
FMVSS 126 Electronic Stability Test and CarSim
 Mechanical Simulation 912 North Main, Suite 210, Ann Arbor MI, 48104, USA Phone: 734 668-2930 Fax: 734 668-2877 Email: info@carsim.com Technical Memo www.carsim.com FMVSS 126 Electronic Stability Test
VTU EDUSAT PROGRAMME -17 DYNAMICS OF MACHINES (10 ME 54) Unit-7 ADARSHA H G GYROSCOPE
 Unit-7 ADARSHA H G GYROSCOPE") VTU EDUSAT PROGRAMME -17 DYNAMICS OF MACHINES (10 ME 54) 1.0 INTRODUCTION Unit-7 GYROSCOPE Gyre is a Greek word, meaning circular motion and Gyration means the whirling motion. A gyroscope is a spatial
VTU EDUSAT PROGRAMME -17 DYNAMICS OF MACHINES (10 ME 54) 1.0 INTRODUCTION Unit-7 GYROSCOPE Gyre is a Greek word, meaning circular motion and Gyration means the whirling motion. A gyroscope is a spatial
Crash Cart Barrier Project Teacher Guide
 Crash Cart Barrier Project Teacher Guide Set up We recommend setting the ramp at an angle of 15 and releasing the cart 40 cm away from the barrier. While crashing the cart into a wall works, if this is
Using HVE to Simulate a Nine Vehicle Accident Involving a Heavy Truck
 Using HVE to Simulate a Nine Vehicle Accident Involving a Heavy Truck Eric Rossetter, Benjamin Ewers III, Bradford Coburn, Yomi Agunbiade Principia Engineering, Inc. Abstract Multi-vehicle high-speed accidents
Case Study UAV Use on a Crash Scene Versus Total Station Sergeant Daniel Marek Nevada Highway Patrol
 Case Study UAV Use on a Crash Scene Versus Total Station Sergeant Daniel Marek Nevada Highway Patrol How comfortable is your couch?? Case selected for: First use of a UAV by Nevada law enforcement under
Chapter 9 Motion Exam Question Pack
 Chapter 9 Motion Exam Question Pack Name: Class: Date: Time: 63 minutes Marks: 63 marks Comments: Page of 49 The graphs in List A show how the velocities of three vehicles change with time. The statements
Abstract Previous studies have reported and validated equations
 2018-01-0529 Published 03 Apr 2018 Further Validation of Equations for Motorcycle Lean on a Curve Nathan A. Rose, Neal Carter, and Connor Smith Kineticorp LLC Citation: Rose, N.A., Carter, N., and Smith,
FMVSS 121 Brake Performance and Stability Testing
 FMVSS 121 Brake Performance and Stability Testing FINAL REPORT - Revision A SwRI Project No. 03-05190 Prepared for Mr. Bill Washington Air Brake Systems 4356 E. Valley Road Mount Pleasant, MI 48804-0293
Keywords: driver support and platooning, yaw stability, closed loop performance
 CLOSED LOOP PERFORMANCE OF HEAVY GOODS VEHICLES Dr. Joop P. Pauwelussen, Professor of Mobility Technology, HAN University of Applied Sciences, Automotive Research, Arnhem, the Netherlands Abstract It is
GEOMETRIC ALIGNMENT AND DESIGN
 GEOMETRIC ALIGNMENT AND DESIGN Geometric parameters dependent on design speed For given design speeds, designers aim to achieve at least the desirable minimum values for stopping sight distance, horizontal
MECA0494 : Braking systems
 MECA0494 : Braking systems Pierre Duysinx Research Center in Sustainable Automotive Technologies of University of Liege Academic Year 2017-2018 1 MECA0494 Driveline and Braking Systems Monday 23/10 (@ULG)
time in seconds Amy leaves diving board
 1 Amy dives from the high diving board at a swimming pool. Look at the graph of her motion. speed in m / s 15 10 Amy enters water P Q 5 0 0 0.5 1.0 1.5 2.0 2.5 time in seconds Amy leaves diving board (a)
ME201 Project: Backing Up a Trailer Using Vector Analysis
 ME201 Project: Backing Up a Trailer Using Vector Analysis Assigned date: January 26, 2018 Due date: March 16, 2018 INTRODUCTION Many drivers use a trial-and-error approach when they back up a vehicle with