Development Of Hybrid Supervisory Controller And Energy Management Strategy For P2 Phev
|
|
|
- Maria Thomas
- 5 years ago
- Views:
Transcription

. Wayne State University Theses. 601. https://digitalcommons.wayne.edu/oa_theses/601 This Open Access Thesis is brought to you for free and open access by DigitalCommons@WayneState.")
1 Wayne State University Wayne State University Theses Development Of Hybrid Supervisory Controller And Energy Management Strategy For P2 Phev Guilin Zhu Zhu Wayne State University, Follow this and additional works at: Part of the Mechanical Engineering Commons Recommended Citation Zhu, Guilin Zhu, "Development Of Hybrid Supervisory Controller And Energy Management Strategy For P2 Phev" (2017). Wayne State University Theses This Open Access Thesis is brought to you for free and open access by It has been accepted for inclusion in Wayne State University Theses by an authorized administrator of
2 DEVELOPMENT OF HYBRID SUPERVISORY CONTROLLER AND ENERGY MANAGEMENT STRATEGY FOR P2 PHEV by Guilin Zhu THESIS Submitted to the Graduate School of Wayne State University, Detroit, Michigan in partial fulfillment of the requirements for the degree of MASTER OF SCIENCE 2017 MAJOR: MECHANICAL ENGINEERING Approved By: Advisor Date
3 ACKNOWLEDGEMENT I would like to express the deepest appreciation to my thesis advisor Dr. Jerry Ku for his understanding, generous guidance and support which make it possible for me to finish my work. Next I would like to thank my committee members, Dr. Chin-An Tan and Dr. Hao Ying for serving as my committee members and comments and suggestions. I would also like to thank EcoCAR 3 team and all team members of Wayne State University that I have worked with during EcoCAR 3 Year 3. Without system and modeling foundation from past team members contribution, I would not have finished my thesis successfully. Thanks again. WSU EcoCAR 3 team gave me the opportunity to learn and further cultivate my technical skills in automotive field, especially for hybrid electric vehicle. Lastly, I would also like to thank my family for always supporting and believing in me, and continuous encouragement throughout my years of study and my life. ii
4 TABLE OF CONTENTS Acknowledgement... ii TABLE OF CONTENTS... iii LIST OF FIGURES... vii List of Tables... x 1 Introduction The EcoCAR3 Competition Wayne State University EcoCAR 3 Architecture Outline of Thesis Background and Literature Review Introduction Parallel Hybrid Electric Vehicle Architecture Control System Design for PHEV Component control level Hybrid supervisory control level Energy management strategy for PHEV Rule-based Energy Management Strategy Optimization-based Energy Management Strategy Dynamic Programming Equivalent consumption minimization strategies (ECMS) Literature Review iii
5 3 Controls Requirements for Hybrid Supervisory Controller Software Development Process Controls Requirements Controls Requirements for HSC Development of Hybrid Supervisory Controller Introduction Hybrid Supervisory Controller Software Structure Diagnostic Development Fault Detection Strategy Fault Mitigation Strategy Critical Fault Validated on the MIL/SIL Fault-Scenario Description Fault Diagnostic Strategy Diagnostic Strategy Validation in MIL/SIL Test case Development Mode Selection and Torque Split Mode Selection Blended Charge Depleting Strategy Torque Distribution Strategy Simulation Setup Charge Sustaining Strategy iv
6 Torque Distribution Strategy Simulation Setup Regenerative Braking Mode Torque Request Subsystem Energy Analysis Performance for E&EC Drive Cycle Energy Consumption Optimization-based Energy Management Strategy Introduction Instantaneous Equivalent Fuel Consumption Analysis Torque Distribution Strategy Motor torque candidate and engine torque candidate Torque Split Optimization Torque Request Subsystem SOC Correction Simulation Results Energy Consumption Comparison Drive Cycle US06Highway US06 City HWFET Drive Cycle v
7 5.6.5 Energy Consumption Comparison in E&EC event Conclusion and Future Work Conclusion Discussion and Future Work Validation Future Work Appendix A A.1 List of Abbreviations A.2 DFMEA A.3 Test cases Documents for safety critical algorithms Appendix B B.1 ECMS Algorithm in MATLAB Reference Abstract vi
8 LIST OF FIGURES Figure 1 Powertrain Configuration of Clutch-less P2 PHEV... 2 Figure 2 Control System Architecture... 3 Figure 3General Configuration of a Parallel Hybrid Drivetrain [1]... 6 Figure 4Configurations of Parallel HEV [4]... 7 Figure 5 Parallel Control System... 8 Figure 6 Energy path during discharge and charge for Parallel PHEV [15] Figure 7 Software Development Process: V-Model Figure 8 Hybrid Supervisory Controller Development Process Figure 9 Requirements on signal diagnostics Figure 10 Hybrid Supervisory Controller Software Structure Figure 11 Fault Detection Strategy Figure 12 The engine crankshaft and coupler Figure 13 Broken bolt Figure 14 Engine and motor speed and feedback torque during fatal incident Figure 15 DFMEA for the specific fault scenario Figure 16 Fault Insertion and Fault Detection Figure 17 a) Engine and motor torque request; b) Battery SOC under fault scenario Figure 18 Fault Insertion, Detection, system level status Figure 19 Engine torque and motor torque, speed trace Figure 20 Mode selection in torque distribution Figure 21 Energy flows in Blended CD mode Figure 22 Various engine operating lines Figure 23 Battery SOC with various scale factors Figure 24 Speed trace and battery SOC Figure 25 Driver Torque Request, Motor torque and Engine torque vii
9 Figure 26 E&EC Drive Cycle Engine operation Figure 27 Engine Charge mode in CS mode Figure 28 Motor Assist mode in CS mode Figure 29 Charge Sustaining Mode Figure 30 Speed Trace and SOC under CS mode Figure 31 All torque request for City and Highway drive cycle Figure 32 Engine Operating Points under CS mode Figure 33 Energy path for Regenerative Braking Figure 34 Speed Trace and Battery SOC with/without Regen Figure 35 Motor output torque Figure 36 Engine and motor torque control Figure 37 Engine and electric motor torque request Figure 38 E&EC Full drive cycle and battery SOC depletes Figure 39 Motor torque and engine torque request Figure 40 Energy Management Strategy in HEVs Figure 41 ECMS torque control strategy flow chart Figure 42 Engine Fuel Flow Rate Map Figure 43 Energy path in discharge phase Figure 44 Energy path in charge case Figure 45 ECMS Control Algorithm Figure 46 Torque control system and actuators constraints Figure 47 Engine torque and Motor torque request subsystem Figure 48 Penalty function for SOC correction Figure 49 Vehicle Speed trace and battery SOC with or without correction Figure Speed Trace and Battery SOC in CS mode Figure 51 All torque requests using optimization based control strategy viii
10 Figure 52 Transmission Estimated Gear Figure 53 a) Engine Operating Points of 505 drive cycle for ECMS, b) Engine Operating Points for rulebased control strategy Figure Drive Cycle and SOC profile Figure 55 US06 Highway drive cycle and SOC profile Figure 56 US06 City drive cycle and SOC profile Figure 57 HWFET drive cycle and SOC profile Figure 58 Three drive cycles speed trace and SOC profile Figure 59 Engine fuel consumption Figure 60Engine Operating Points with ECMS Figure 61Engine Operating Points with Rule based Control ix
11 List of Tables Table 1 Test Requirements for Vehicle Startup operation Table 2 Critical Safety Requirements for HSC Table 3 Diagnostic checks and remedial actions for safety critical functions Table 4 Fault Mitigation Strategy Overview Table 5 Safety Critical Function Testing Summary Table 6 Torque request equations for Blended CD mode control strategy Table 7 Scale factor for engine operating line Table 8 Vehicle Energy Consumption with different scale factors Table 9 Torque Control strategy in CS mode Table 10 E&EC drive cycle profile Table 11 Vehicle Energy Consumption for E&EC drive cycle Table 12 Energy Consumption Comparison for 505 drive cycle Table 13 Energy Consumption Comparison for US06 Highway drive cycle Table 14 Energy Consumption Comparison for US06 City drive cycle Table 15 Energy Consumption Comparison for HWFET drive cycle Table 16 Comparison of vehicle energy consumption for optimized and rule-based control strategies x
12 1 1 Introduction The powertrain of a parallel hybrid electric vehicle (PHEV) is a hybrid system with engine and electric motor powertrain systems, which provides an opportunity for energy management. Compared to the conventional vehicle, hybrid electric vehicles with high voltage battery and internal combustion engine have more complicated powertrain systems and ECUs, therefore, control system also becomes more complex. Under a hybrid supervisory controller (HSC), the power requested by driver is strategically distributed between engine and electric motor, and the distribution of driver requested power is supervised by energy management system which is the key technologies of PHEV. This thesis discusses the development and implementation of hybrid supervisory controller for Wayne State University EcoCAR 3 clutch-less pre-transmission (P2) parallel PHEV, and an optimization based control strategy was proposed to reduce the energy consumption of PHEV. 1.1 The EcoCAR3 Competition The EcoCAR 3 project is a four-year competition sponsored by General Motors and the U.S. Department of Energy challenging 16 universities teams to reengineer a 2016 Chevrolet Camaro to be a performance plug-in hybrid electric vehicle. A pre-transmission (P2) without clutch parallel architecture was chosen by Wayne State University EcoCAR3 team in Year 3. The final objectives of this competition are to reduce energy consumption, greenhouse gas (GHG) emissions, criteria (regulated) emissions, and petroleum energy use (PEU), while to maintain the safety, drivability, performance and acceptability. In Year 3 of EcoCAR 3, WSU EcoCAR 3 controls team developed the supervisory control system based on our architecture and validated control strategies implemented on HSC under Model in the Loop (MIL), Software in the Loop (SIL) and Hardware in the Loop (HIL) by using dspace, and ultimately validate control strategies in the vehicle.

13 2 1.2 Wayne State University EcoCAR 3 Architecture The Wayne State EcoCAR 3 team chooses the clutch-less pre-transmission parallel PHEV in Year 3. In P2 architecture, two powertrain systems are presented with a 2.4L LEA engine from GM running on E85, and a GKN AF-130 electric motor, controlled by a RMS PM150DX inverter. Coupled in line an 8L45 8-speed automatic transmission from GM is presented, In the trunk, a Bosch 10.7 kwh battery pack consisting of 8 Li-Ion modules as well as a BRUSA On-Board charger are also equipped to provide electric energy to drive the vehicle. The clutch-less P2 parallel powertrain system is shown in Figure 1. Figure 1 Powertrain Configuration of Clutch-less P2 PHEV In this configuration, the clutch between engine and electric motor was remove compared to normal P2 architecture, instead, a coupler was placed to mechanically connect engine with electric motor. The WSU PHEV was required to have a total range over 150 miles, and four operational modes, which includes blended charge depleting mode, charge sustaining mode, sports mode and engine only mode. The controls development of PHEV is discussed in detail in chapter 4. Figure 2 shows the WSU EcoCAR 3 control system structure, driver sends torque request to hybrid supervisory controller (HSC) which is responsible for managing driver commands as well as requested signals from hybrid component systems, and it also serves as gateway between stock vehicle CAN and team

14 3 added CAN networks. The HSC then optimally distributed the torque request between engine and electric motor and sent command signals to individual controller modules, as shown in figure Outline of Thesis Figure 2 Control System Architecture In Year3, the hybrid powertrain system was fully integrated into the vehicle, and component controls and testing were also conducted to meet the requirements of competition. In addition, the hybrid vehicle model including engine, motor, battery, etc. was also developed by controls team in Simulink/Stateflow to test the algorithms needed to control the hybrid electric vehicle. This thesis aims to detail the development of a hybrid supervisory controller for WSU PHEV, including controls requirements, system diagnostics, operational modes and torque distribution strategies. Those controls algorithms are discussed in detail in chapter 4. The thesis work mainly focus on two aspects of development of hybrid supervisory controller: torque distribution strategies and validation, fault detection and mitigation development. Chapter 2 discusses the literature review which includes the methods and strategies for developing hybrid supervisory controller as
15 4 well as energy management strategies developed and implemented in current PHEV. Chapter 3 details the controls requirements and WSU EcoCAR 3 team HSC software structure. Chapter 4 details the development of hybrid supervisory controller, including fault detection and mitigation strategies implemented on HSC, torque control strategies within each operational mode and validation for control strategies under Model in the Loop (MIL) as well as Software in the Loop (SIL). Another goal of this thesis is to propose a new energy management strategy which supervisors two powertrain systems and distributes power between engine and electric motor more efficiently. In chapter 5, a more detailed energy management strategy is discussed, and energy consumption is also conducted based on new control strategy as well as validation results. Chapter 6 discusses the conclusion and future work needs to be done for WSU EcoCAR 3 team.
16 5 2 Background and Literature Review 2.1 Introduction This chapter provides background information for the hybrid electric vehicle architecture and the development of hybrid supervisory controller as well as energy management strategies for PHEV. 2.2 Parallel Hybrid Electric Vehicle Architecture The Hybrid electric vehicles have two types of energy sources, electricity and fuel. Fuel represents that a fuel tank is required for internal combustion engine (ICE) to produce mechanical power, and electricity represents that a high voltage battery system is required to store the energy, and a traction motor will be used to produce mechanical power as well. The parallel hybrid electric vehicles allow both engine and electric motor to deliver torque to drive the wheels, and traction power may be produced by ICE only, by electric motor only or by both ICE and motor. Since both engine and electric motor are coupled to the driveline of the wheels by clutch, and electric motor can function as generator to charge the high voltage battery by regenerative braking or taking the power from engine when its output power is greater than driver requested power. Figure 3 shows the configuration of general parallel hybrid powertrain system.
17 6 Figure 3 General Configuration of a Parallel Hybrid Drivetrain [1] In parallel hybrid powertrain, there are two kinds of mechanical coupling: torque coupling and speed coupling. Torque coupling can add the torque of engine and electric motor together and deliver the total torque to the wheels. The advantages of torque coupling are that the engine and motor can be controlled independently but the speed of engine and motor cannot be controlled independently due to the fixed relationship between them. In speed coupling, the speed of engine and electric motor can be added together and torques are linked together [2]. More specifically, hybrid powertrain has different implementation of parallel architectures, depending on the placement of motor, there are five different architectures which are corresponding to the placement of the motor in the system [3], as illustrated in figure 4, including P0, P1, P2, P3, P4.
18 7 Figure 4Configurations of Parallel HEV [4] As shown in the figure 4 above, P0 configuration represents that motor is located at the input to the engine, and P1 represents motor is located at the output of the engine, in which engine and motor can be isolated from the transmission by a clutch C0, P2 represents motor is located between the engine and transmission, P3 represents motor is located at the transmission and P4 represents that motor is mounted on axle. C0 and C1 are clutches. 2.3 Control System Design for PHEV In hybrid electric vehicles, there are multiple torque sources (engine and electric motors) to generate mechanical energy required to drive the vehicle. Compared to conventional vehicles with single torque source and simple control systems, hybrid electric vehicles have more complicated control systems, which is properly manage the energy of two torque sources. The key function of control system in HEVs is energy management, the strategy of energy management is to optimally distribute the power between engine and electric motor to meet the driver requested power while to reduce energy consumption and emissions. There are two levels of control system in HEVs, supervisory control and component level control, the main functions of supervisory controller are to distribute torque to different torque sources and determine status of each component controller and subsystem/component (detect faults and failures). While component controllers, which contain main functionalities of physical components, receive command signals from

19 8 supervisory controller as well as generate command signals to control actuators. Figure 5 shows the interconnecting scheme along with supervisory controller and ECUs. Figure 5 Parallel Control System Component control level In HEVs, the number of electronic control units (ECUs) need to control various aspects of vehicle and a typical car on the road today have from 40 to 100 microcontrollers [5], those controllers are used to control powertrain components, chassis, etc. Component controllers consist of engine control module (ECM), motor control module (MCU), battery management system (BMS), transmission control module (TCM) and other regular controller modules in conventional vehicles. Component controllers interact with other control modules via Control Area Network (CAN), and receive command signals from supervisory controllers or other component controllers to meet the driver requirements [2]. Therefore, for each individual component controller, they are also responsible for controlling their corresponding actuators, like battery and engine, etc. and request responses are reported to supervisory controller which in turn makes the control decision.
20 Hybrid supervisory control level The supervisory controller is considered to be the key part of the HEV control system, which provides high level management among all other controllers. HSC takes and processes all important signals from the other lower level controllers including Motor Control Module (MCU), Battery Management system (BMS), etc. and it also receives driver intended signals like accelerator pedal position (APP), key position and brake pedal position (BPP), as shown in figure 5, to make decisions for final execution [6]. The supervisory controller is to include the following functions: determine the status of each controller and subsystem/component, interpret driver inputs and determine how and to what degree requests can be fulfilled and oversee the startup and shutdown of the vehicle. Improving energy efficiency is also a goal of supervisory controller, this is accomplished through optimizing the control strategy of distributing torque between engine and electric motors, energy management strategy maintains the vehicle at its highest efficient operating point and coordinates the status of engine, motor, battery, like State of Charge (SoC), temperature, etc. For instance, multiple operation modes in HEV like charge sustaining mode, regenerative braking mode are able to reduce fuel consumption as well as emissions. 2.4 Energy management strategy for PHEV In the conventional vehicles, there is no need for energy management system, since only one torque source is presented in the vehicle and driver can deliver the power instantly by accelerator pedal position and brake pedal position. However, in hybrid electric vehicles, energy management system is necessary to be taken since vehicle doesn t have idea that how much torque can be delivered by electric motor or engine. Due to the complicated structure of PHEVs, the design of control strategies is a challenging task. A lot of research has been carried out in this field. The main objective energy management strategy in hybrid electric vehicles is to minimize the energy consumption over a defined drive cycle and satisfy driver s power demand with
21 10 optimum vehicle performance. However, fuel economy and emission minimization are conflicting problems, a smart energy management strategy is used to satisfy trade-off between them [7]. Various control strategies are proposed to manage the energy between multiple energy sources, many researchers [8-11] have devoted their attention to the design and implementation of energy management strategy in HEVs. The energy management strategy can be mainly categorized in two types [12]: ruledbased strategy and optimization -based strategies. Rule-based control strategy is fundamental and robust control scheme that depends on the mode of operation [7], while in optimization based control strategies, the goal of this strategy is to minimize the cost function to find local or global optimization Rule-based Energy Management Strategy The rule-based control strategies are fundamental and robust scheme that depends on the operation modes of vehicle, this control strategy can be easily implemented in real time to manage the power flow in hybrid electric powertrain, and rules are mostly defined by intuition, mathematical model or heuristic and generally without prior knowledge of drive cycle. Although these control strategies are robust and computationally efficient which can provide significant energy economy, they cannot guarantee the optimal performance of the vehicle in all situations and do not involve explicit minimization. Rule-based control strategy can be further divided into deterministic rule-based and fuzzy rule-based [13-14]. In deterministic rule-based control, it includes power follower control, state machine based control and on/off control. The deterministic rule-based control strategies are designed with the aid of engine operating maps, power flows within the powertrain and driving experience [7]. In the state machine based control, the transition between states is usually based on driver torque demand, vehicle speed, and status of hybrid powertrain systems as well as battery SOC, this part of control strategy is discussed in detail in chapter 4. However, this control strategy is unable to find the optimal torque distribution between engine and electric motor and require a lot of calibration.
22 Optimization-based Energy Management Strategy As mentioned previously, the energy management strategy aims to determine the optimal power split between the engine and electric motor. In optimization based energy management strategy, the strategies tend to minimize the cost function, the cost function includes minimization of energy consumption, emission, etc. There are two types of optimization based energy management strategy: global optimization and real time optimization [15]. Global optimization is also numerical optimization method, like dynamics programming [16], genetic algorithms [17], simulated annealing [18], the global optimal solution is calculated numerically by minimization of a cost function over a fixed drive cycle. The real-time optimization, on the other hand, uses analytical method to find local optimization which is closed to globally optimal solution. The Equivalent Consumption Minimization strategy (ECMS) [19,20] provides a real-time energy management of HEVs which consists in minimization at each time step of the optimization of a defined instantaneous cost function. This strategy is reviewed in detail in the next section Dynamic Programming Dynamic Programming is a numerical method for solving multistage decision making problems [16]. The implementation of dynamic programming is capable of providing an optimal solution to the power split between engine and electric motor while maintaining the battery OSC in certain threshold, however, this control strategy is only implementable in simulation environment, since it requires the prior knowledge of drive cycle, like road condition, grade, driver style, etc. but dynamic programming can be used to formulate and tune actual controllers and develop rule based controls [7]. Since the main drawbacks of the DP are computationally intensive and not implementable in real time, a ruled-based control combined with DP is presented [21], researchers derived rules from DP solutions to obtain near-optimal solution, this strategy not only makes it possible to calibrate the rule-based controller but also gives the near optimal solution in the real driving situation.
23 Equivalent consumption minimization strategies (ECMS) Equivalent consumption minimization strategy is real time optimization method, which provides an effective solution for energy management problems in HEVs. ECMS calculates the instantaneous fuel consumption at each time step in the drive cycle, and it does not require prior knowledge of drive cycle [19]. In charge sustaining hybrid vehicles, high voltage battery is used as energy buffer since the state of charge of the battery in this mode maintains under a certain threshold, this means all electric energy comes from fuel and battery can be seen as reversible tank. Any electric energy used in discharge of the battery will be replenished from fuel in the future or from regenerative braking. The core principle of ECMS is the equivalent cost vale that is assigned to the electric energy, this value represents the use of electrical energy used is equivalent to using a certain amount of fuel [15]. As shown in figure 6. Figure X shows the energy path during the discharge and charge phase in parallel PHEV. In discharge phase, the electric motor provides the mechanical energy and the energy used in this phase will be replenished from the fuel tank. In charge phase, the electric motor acts as generator to charge the battery by engine, the dotted line shows that the energy charged by the engine will provide mechanical energy to save the fuel [15].
![13 Figure 6 Energy path during discharge and charge for Parallel PHEV [15] 2.](/docs-images/88/117929303/images/24-0.jpg "5 Literature Review The paper written by Yatsko [22] presents the development and validation of control system for hybrid electric vehicle, the paper discusses the hybrid supervisory control")
24 13 Figure 6 Energy path during discharge and charge for Parallel PHEV [15] 2.5 Literature Review The paper written by Yatsko [22] presents the development and validation of control system for hybrid electric vehicle, the paper discusses the hybrid supervisory control development and validation, fault detection and mitigation, as well as energy management strategy. The hybrid supervisory control strategy developed in this paper is divided into three parts: vehicle mode selection, torque distribution or energy management, tactical control logic which includes regenerative braking, transmission shifting. A more detailed fault detection and mitigation strategy is presented to prevent critical failures occurring during the normal vehicle operation, the overall mitigation strategy mainly includes four operation modes: normal operation, power limiting, disable operating modes and shutdown vehicle, which are used to maintain safe vehicle operation. Crain [23] emphasis the control system development and validation process to meet the vehicle technical requirements (VTS), this paper presents the overall software structure for supervisory controller, which contains inputs conversion, diagnostics, mode selection, component control and output conversions. The control strategy is also discussed by outlining CD and CS modes as well as additional modes in mode selection block. In addition to supervisory controller, the paper also presents electrical powertrain hardware
25 14 and ICE powertrain hardware. With control system implemented in the vehicle, some performance tests and validation are conducted under SIL and HIL. Harries and Brian Neal [24] demonstrates the development and validation for supervisory controller and power management control algorithm is also discussed to control the vehicle during charge sustaining operation. The paper first implemented a simplified bang-bang controller to operate at global minimum BSFC for engine and then a power tracking controller is proposed to reduce the energy consumption on simulated drive cycle. Two control strategies proposed in the paper are tested and compared under SIL and power tracking controller achieved almost % reduction in fuel losses during EPA drive cycle. Manning [25] detail the control strategy for charge sustaining mode and development of the controls for diagnostics for series-parallel PHEV. The charge sustaining control strategy proposed in the thesis accounts for a variety of system operating points and penalizes or rewards certain operating points for some vehicle status conditions, like battery SOC. The control strategies are tested under SIL and HIL to validate the effectiveness of control system in real vehicle. Karmustaji [26] proposed a real-time optimization based power flow controller for energy consumption and emissions reduction for parallel PHEV, in this thesis, a basic power flow controller is presented as a baseline controller, and then two optimization based power flow controllers using shift schedule and shift logic are presented to find the appropriate power split between the ICE and EM to reduce the energy consumption as well as emissions, to compare the effectiveness of optimization based controller, the real time energy and emission minimization controllers are tested under city and highway drive cycles when compared to the basic power flow controller, and optimization based controllers effectively reduced the energy consumption. In Bovee s [27] work, a new version of supervisory controller algorithm was presented and tested under SIL environment, dynamic control algorithms are developed for charge depleting and charge sustaining mode based on Equivalent Consumption Minimization Strategy (ECMS). The charge depleting strategy
26 15 includes a simplified version of ECMS that was able to select the most efficient torque split between front and rear electric machines, while charge sustaining strategy contains a full version of ECMS with multiple maps that were optimized offline to split the torque between engine, front EM, and rear EM. The ECMS algorithm adapted in this paper is implemented offline so it doesn t require large computation time and new version of supervisory controller strategy increase the al electric range and reduce UF weighted fuel consumption over the baseline control strategy. The previous work greatly benefits the development of this study, in this study, a supervisory controller was developed to control the interaction between powertrain components for WSU EcoCAR3. A rule-based control and fault detection and mitigation strategy were also incorporated into the supervisory controller and validated under model in the loop environment. The development of fault detection and mitigation is included in the thesis scope, To minimize the energy consumption, a real-time optimization based control strategy, which is different from offline optimization strategy in Bovee s work, was developed to control the engine and electric motor. The idea of ECMS algorithm was highly adapted from the research of Tammer Basar, Antonio Bicchi [15]. However, a combination of rule-based control strategy based on ECMS is also proposed in the thesis.
27 16 3 Controls Requirements for Hybrid Supervisory Controller 3.1 Software Development Process To effectively design a control system software, a software development process V-model is adopted by WSU EcoCAR3 controls team. This is a systematic way of progressing from requirements to final software, which defines steps necessary to successfully design, implement a validated control system, as shown in figure 7 below. Controls requirements are the first step in the V-model, in the left side of V-model, system functions and requirements are defined, implemented in the software, and the right of V-model includes the validation and verification of control system. For instance, if a function was designed and implemented in the test/simulation phase, then before moving to the next step: software integration, the software needs to be checked if the software module works as expected for all combinations of inputs. In the final step of vehicle test, the software still needs to be checked against the requirements and functions defined in the designing phase. Figure 7 Software Development Process: V-Model

28 17 The V model is the key process in the development of hybrid supervisory controller. Figure 8 shows a detailed example of HSC development process. In the function designing phase, the main function of hybrid supervisory controller can be divided into several sub-functions, including driver torque request, torque distribution, vehicle startup/shutdown, controller handshaking, etc. and then each sub-function is developed and implemented based on previous conceptual software design phase, finally the functions implemented in the module are tested under software in the loop (SIL), hardware in the loop (HIL) and vehicle in the loop (VIL) which is vehicle test. Figure 8 Hybrid Supervisory Controller Development Process 3.2 Controls Requirements As mentioned in previous section, control requirements are the first step in the V-model. Following the development of control requirements, the control algorithms must be developed to satisfy the goal of initial design and VTS. The controls requirements can be derived from competition rules, hybrid powertrain functionality, vehicle technical specifications, etc.
29 18 There are different types of requirements, including requirements on controller input/output, functional requirements, diagnostic requirement as well as testing requirements. Control requirements can keep track of algorithms implemented in the code. Therefore, this requirement analysis can give the team a whole idea of what functionalities vehicle would need in the designing phase Controls Requirements for HSC In Year 3, team needs to develop controller requirements that drive the development of activities in software. The control requirements can be divided into four levels: requirements on controller input/output, functional requirements, diagnostic requirement as well as testing requirements. Requirements on HSC input/output include interfaces existed between the HSC and ECUs, like signals sent and received by HSC, and data type as well as name conversion are defined in the requirements. The functional requirements for hybrid supervisory controller are to define how vehicle behaves and what functions vehicle needs to accomplish safe hybrid vehicle operation, including vehicle startup/shutdown, vehicle powertrain enabling, mode selection, torque distribution within each mode, thermal control system as well as regenerative braking behavior, etc. Each subsystem above involves lower level and detailed control requirements, for instance, requirements for thermal system control includes input/output to the thermal system, and functional requirements based on thermal system layout and goals of design. Diagnostic requirements include three different level of diagnostic, component signal diagnostics, component functionality assessment, system level functionality assessments, figure 9 shows an example of requirements on signal diagnostic.
30 19 System/Requirement Req Number Requirement Date modifed 1.Driver Signal Diagnostic DIAG_S_001 When APP% (signalvalue) is >-2 AND < 102 signal is in range (SignalInRange) and signalfault=0 9/20/2016 APP Validity Detection DIAG_S_002 If signalvalue (APP %) is > 102 APP should go to Signal High state and the flag is set (signalfault=1). Any time the sig 9/20/2016 DIAG_S_003 If signalvalue (APP %) is < -2 signal APP should go to the Signal Low state and the flag is set (signalfault=1). Anytim 9/20/2016 APP Mismatch Detection DIAG_S_004 If the difference of APP1 and APP2 is less than 0.01, tolerance is in normal range and Drv_APP_Agree is set to 1, o 2/18/2017 BPP Validity Detection DIAG_S_005 When the BPP% is > 100 OR < 0 then set BPP_valid to 0 9/20/2016 DIAG_S_006 When the BPP% is >0 OR BPP%==0 AND BPP% <0 OR BPP%== 100 set BPP_valid to 1 9/20/2016 Brake Failure Detection DIAG_S_007 When APP AND BPP AND VehSpeed>5mph for more than 1 second, set Brakefail to 1; 2/18/2017 Key Position Validity Detection PRNDL Position Validity Detection DIAG_S_009 DIAG_S_011 When the keypos is > 3 OR keypos < 0, set KeyPos_valid to 0 When the PRNDL is > 4 OR PRNDL < 0, set PRNDL_valid to 0 9/20/2016 2/18/2017 DIAG_S_010 DIAG_S_012 When the keypos is > 0 OR keypos= 0 AND keypos < 0 OR keypos= 3, set KeyPos_valid to 1 When the PRNDL is > 4 OR PRNDL < 0, set PRNDL_valid to 1 9/20/2016 2/18/2017 Figure 9 Requirements on signal diagnostics Testing requirements include all critical functions implemented in the HSC that need to be tested, for instance, vehicle startup operation, PRNDL, etc. Table 1 list a sample of vehicle startup/enabling procedure requirements. 3.1 PRNDL Park The powertrain does not transmit any torque to the wheels or allow the vehicle to roll when PRNDL is in P Vehicle speed=0 SIL/HIL/In vehicle 1. Start vehicle by turning key state to crank 2. Set PRNDL position to P 3. Set APP > 10% 4. Set BPP = 0% Reverse The powertrain transmits only torque to the wheels that propel the vehicle in reverse when the PRNDL is in R Vehicle speed<0 SIL/HIL/In vehicle 1. Start vehicle by turning key state to crank 2. Set PRNDL position to R 3. Set APP > 10% 4. Set BPP = 0% Neutral The powertrain does not transmit any torque to the wheels when the PRNDL is in N Vehicle speed=0 SIL/HIL/In vehicle 1. Start vehicle by turning key state to crank 2. Set PRNDL position to N 3. Set APP > 10% 4. Set BPP = 0% Drive The powertrain transmits torque to the wheels to propel the vehicle forward when the PRNDL is in D Vehicle speed>0 SIL/HIL/In vehicle 1. Start vehicle by turning key state to crank 2. Set PRNDL position to D 3. Set APP > 10% 4. Set BPP = 0% 3.2 Startup/Enabling Procedure Vehicle in Park The vehicle will not start if the PRNDL is not in P Vehicle does not start (signal TBD) SIL/HIL 1. Set PRNDL to D, R or N 2. Set APP=0% 3. Set BPP =100% 4. Turn key to crank
31 Brake Pedal Depressed The vehicle will not start if the brake pedal is not depressed a minimum of 10% Vehicle does not start (signal TBD) SIL/HIL 1. Set PRNDL to P 2. Set APP=0% 3. Set BPP =7% 4. Turn key to crank Accelerator Pedal Not Depressed The vehicle will not start if the accelerator pedal is depressed more than 3% Vehicle does not start (signal TBD) SIL/HIL 1. Set PRNDL to P 2. Set APP=5% 3. Set BPP =100% 4. Turn key to crank Table 1 Test Requirements for Vehicle Startup operation
32 21 4 Development of Hybrid Supervisory Controller 4.1 Introduction The hybrid supervisory control is a high level controller that interprets driver demand and controls interaction between powertrain components by their respective control units, it typically sends out analog, digital and CAN signals to sub-controllers to fulfill torque or speed request from engine or motor, and determine the appropriate torque split between two components as well as correct operating mode for hybrid electric vehicle. In addition, the key functions of HSC include energy management strategy and fault detection and mitigation which assess the status of hybrid powertrain components. The HSC mainly interacts with different components control modules including engine control module, transmission control module, battery management system, body control module, motor control module. The HSC is primarily divided into four parts, the first part is driver requested torque, usually this part calculates the torque required at the wheels based on accelerator pedal position or brake pedal position and vehicle speed, which is the key input to the torque distribution. The second part is mode selection and torque distribution, the propulsive torque split strategies will be explored in next section, the last part is fault diagnostics which assess the status of signals, powertrain as well as system level, it s derived from team s DFMEA (Appendix A.1) 4.2 Hybrid Supervisory Controller Software Structure The hybrid supervisory controller takes different kinds of signals including analog, digital and CAN signals, which are transmitted through team added high speed GM CAN networks. The signals coming from lower level component controllers are then fed into main HSC functions which is illustrated in figure 10. The output signals from hybrid supervisory controller are mostly control signals to component control module, such as engine torque demand, motor torque demand, etc. Those signals which are required by vehicle will be separated into messages needed by individual controllers. It also includes signals required by stock vehicle.

33 22 Figure 10 Hybrid Supervisory Controller Software Structure As mentioned previously, the signals coming from lower level controllers will be fed into fault detection block which consists of three diagnostics levels including component signals diagnostics, component functionality assessment and system level diagnostics, the details in different level of diagnostics will be explored in the next sections. Signals from fault detection are then sent to driver demand block to determine drive requested torque based on APP or BPP as well as other signals such as vehicle speed, transmission ratio and vehicle mode, etc. Fault mitigation and mode selection block will take signals from fault detection to determine the available vehicle operating mode, and then torque distribution block will calculate command torque for engine and motor. There are also other functions in the HSC, such as regenerative braking behavior, vehicle startup and shutdown. 4.3 Diagnostic Development Fault Diagnosis algorithm contains fault detection and mitigation strategies for safety critical systems which is derived from the team performed DFMEA (Appendix A.1). Fault detection algorithm identifies and detects possible failures and faults of powertrain components, which is accomplished by receiving signals from component controllers, and fault mitigation algorithm takes actions that would need to mitigate faults for safety concern. DFMEA documentation defines each item or function in the vehicle that should be examined for any potential failures, potential failures are discussed to estimate how often the fault occurs and the severity level of failure as well as the possibility of detection. The DFMEA also documents the detection and mitigation strategies to verity and validate that failure can be managed under safe operation. The failures with high RPN numbers are discussed in the next section and safety requirements of HSC are
34 23 derived from DFMEA based on RPN numbers in Appendix. Table 2 below shows the safety requirements for critical functions in the HSC. Table 2 Critical Safety Requirements for HSC Control Unit Vehicle Hybrid Supervisory Controller (HSC) Safety Functions The HSC should monitor the actual accelerate pedal position and brake pedal position The HSC should monitor the actual torque of EM against the request torque The HSC should monitor the actual torque of engine against the request torque The HSC should monitor the transmission rotation direction against the gear position The HSC should monitor 12V power supply The HSC should monitor the actual gear position The HSC should monitor the engine speed against electric motor speed. The HSC should monitor High voltage battery limit The HSC should monitor engine temperature and motor temperature against their maximum and minimum. The HSC should monitor the CAN communication for each controller Fault Detection Strategy Fault detection strategy only detects the faults or failures for each powertrain components as well as system level. The fault detection strategy is organized by three different levels, including signal diagnostics, component diagnostic and system level diagnostics. Each part provides different level functionality assessments. For instance, Signal diagnostics is mainly to assess signals coming from each powertrain controller module to check validity of data or whether signals are out of safe range, and the results of signal diagnostics will be assessed to determine each component s current level of functionality in the component diagnostics, eventually previous results will go to system diagnostics to determine the overall functionality of entire powertrain. The fault detection algorithm structure is presented in figure 11. Figure 11 Fault Detection Strategy There are several different techniques for detecting faults, the fault detection strategies implemented by EcoCAR3 team are mainly threshold techniques, which are easiest fault diagnosis to implement. The threshold technique is to set certain limit or threshold for signals that need to be monitored, if one of these
35 24 signal values go outside the threshold which means something is wrong. This technique is widely used for monitoring component temperature, speed or high voltage and current. The validation in SIL environment for fault detection strategy will be explored explicitly in the next section Fault Mitigation Strategy Fault mitigation strategy is directly related to fault detection and the function of fault mitigation is to maintain the safe operation of vehicle and try to avoid large deviation from driver s demand. Different faults would result in various mitigation strategies. Some faults will require vehicle operation to be stopped, some will change to limo mode, while some will simply result in the display of an indicator light on the user interface. In the HSC algorithm, vehicle operation is stopped when an accelerator pedal fault occurs. However, in the case of some faults, like ground fault detection, only a warning is presented depending on the value of the resistance drop between the high voltage bus and chassis ground. A table of diagnostics checks and remedial actions taken by HSC is shown in table 3. For other faults like overtemperature of battery or motor, it s possible that the action taken by the HSC to limit power or increase speed of cooling fan. An example of safety critical fault will be shown in section Table 3 Diagnostic checks and remedial actions for safety critical functions Requirements Required condition (Detection Strategy) Remedial Action if Conditions are not met APP 1 Voltage in range 0.485V<=APP1<=2.17V Shut off the vehicle APP 2 Voltage in range 0.973V<=APP2<=4.27V Shut off the vehicle APP 1 and APP2 Agree APP1 = APP2 ± 1% Shut off the vehicle BPP out of range 0<=BPP<=100% Shut off the vehicle Motor CAN Engine CAN TCM CAN BCM CAN BMS CAN Fault occurs include overruns, timeouts, and data mismatch. Alive Rolling counter is used to determine if the component is still communicating on the CAN Disable respective component
36 25 DC-DC CAN Engine Speed Engine Speed<6500 RPM Engine Torque Command=0 Engine Coolant Engine Coolant Temp<100 C Limit Engine Power Temperature Engine Coolant Temp<120 C Disable Engine Motor Speed Motor Speed<8000 RPM Disable motor Motor Temperature Motor Temp<150 C Disable Motor Battery Voltage Battery Current Battery Contactors BattVolt<419V BattVolt>291V BattCurr<180V BattCurr>-315V Contactor Status=Contactor Command Disable Inverter/Clear fault/engine only mode Disable HV battery Disable HV battery Battery SOC SOC>10% Disable HV battery High range and low range BattTemp<30 C Limit the HV battery power BattTemp>0 C Battery Temperature Critical range: Disable Battery/Vehicle go BattTemp<55 C to Engine only mode BattTemp>-28 C Ground Fault Detection Power Electronics Coolant Temperature Motor Torque Mismatch Isolation Resistance/Battery Voltage>500 / V Coolant tem sensor<45 C Coolant tem sensor<65 C Mismatch Degraded Mismatch Limphome Illuminate the indicator Turn on fan, radiators Disable power electronics MotTrqCmd decreases to 70% of commanded torque MotTrqCmd decreases to 30% of commanded torque Engine Torque Mismatch Mismatch Critical Mismatch Degraded Mismatch Limphome Mismatch Critical Disable Motor EngTrqCmd decreases to 70% of commanded torque EngTrqCmd decreases to 30% of commanded torque Disable Engine


37 Critical Fault Validated on the MIL/SIL In this section, a full control system development for the specific fault scenario in WSU EcoCAR3 team is discussed, the process first starts by identifying safety requirement derived from DFMEA documentation for this specific fault, and then detection strategy and mitigation strategy are verified and validated for this fault under MIL/SIL Fault-Scenario Description During the Year3 vehicle testing, a mechanical failure related to coupler occurred and the bolts connected the engine crankshaft with electric motor were broken for the first time, as shown in figure 12, figure 13 shows that all six bolts are sheared by the large torque requested from engine and electric motor, and they have the same intersecting surface, as shown in figure 13. Figure 12 The engine crankshaft and coupler


38 27 Figure 13 Broken bolt This fatal fault has been analyzed for several reasons, improper bolt specification is the main issue for this fault, however, based on the CAN log data which is derived from vehicle testing CAN messages, as shown in figure 14, it s clear that this fault actually occurred at the time when vehicle transitioned from CD mode to CS mode, which means that vehicle request too much torque at the beginning of engine charging mode since negative torque requested from motor increases the stress of mechanical connection between engine and electric motor.


39 28 Figure 14 Engine and motor speed and feedback torque during fatal incident Fault Diagnostic Strategy In order to avoid this fatal fault in the future testing activity, the safety analysis is conducted for this specific fault scenario. The first step of safety analysis is to derive the safety requirement, which is the beginning of control system development process. The safety requirement can be derived from DFMEA, as shown in the following figures. Due to the limitation of clutch-less P2 parallel architecture, this fault can be specific scenario since mechanical failure to coupler between engine and electric motor can lead to undesired acceleration/deceleration, over speed of the engine or even the damage to the electric motor. Therefore, a robust fault detection and mitigation strategy for this fault can greatly decrease the occurrence of this fault and let vehicle operate in a safe mode when fault happens. Figure 15 DFMEA for the specific fault scenario Fault Detection The fault can be detected based on the comparison of engine speed and electric motor speed, as shown in CAN log data from vehicle testing, when fault happens, the difference of engine speed and motor speed can be over 1000 rpm, which indicates that the fault already occurred, therefore, a fault mitigation is taken in HSC to operate vehicle in a safe mode. The fault detection strategy can be divided into two levels: Degraded and Critical level. Fault Mitigation
40 29 The goal of fault mitigation strategy is to maintain the safe vehicle functionality, if the speed mismatch fault is triggered, then the vehicle will shut down completely to avoid further damage to the motor or engine. In degraded level, the engine torque and electric motor commanded torque are limited during engine charging or regenerative braking mode. Table 4 Fault Mitigation Strategy Overview Requirements Condition Preventing actions Normal Operation Speed Mismatch< 50 rpm No action taken Limited Operation 50 rpm<speed Reduce motor negative torque Mismatch<100 rpm and engine torque by 50%; Critical Operation Speed Mismatch> 100 rpm Shut down the vehicle; Diagnostic Strategy Validation in MIL/SIL Fault detection and mitigation strategy are implemented in the team s HSC to validate the effectiveness of the strategy under MIL/SIL environment by using Simulink. In WSU EcoCAR3 team s vehicle simulator, the fault is inserted in the engine plant model, and vehicle simulator is running under 505 drive cycle. 1) Degraded Level In this level, once the difference of engine speed and electric motor speed is over 50 rpm, the engine torque and electric motor requested torque will be reduced by 50%, the fault insertion and fault detection are shown in figure 16.

41 30 Figure 16 Fault Insertion and Fault Detection Figure 17 a) Engine and motor torque request; b) Battery SOC under fault scenario Figure 17 above shows that at time of 200s, the fault was inserted to the system, the fault detection in the HSC detected the fault quickly and mitigation action is taken to limit the engine torque and electric motor
42 31 torque in the HSC. Battery SOC wen down at the moment when the fault was detected and mitigated, since during the engine charging mode, the negative requested motor torque was limited, as shown in black rectangle in the figure 17. once there is no fault detected in the HSC, the vehicle goes to normal CS operation to keep sustain the SOC. 2) Critical Level In the critical fault level, when the speed mismatch is over critical threshold, the vehicle will shut down completely to avoid further damage the engine or electric motor which may be caused by major failure. Figure 18 Fault Insertion, Detection, system level status
43 32 Figure 19 Engine torque and motor torque, speed trace Figure 18 above shows that this critical fault is inserted at about 200s, and system level functionality status goes to offline when the fault is detected in the HSC. The results of fault detection are then passed to the torque distribution; the remedial action would be taken by HSC to determine the available modes of operation based on diagnostics. The plot figure 19 above shows that when fault occurs the vehicle will shut down and motor torque output will go to 0, since motor dynamics is not implemented in the plant model, the torque would be 0 immediately when fault occurs Test case Development Test case is important document in the process of requirements and testing development, it documented procedure for performing verification and validation of supervisory controller. Test cases were executed for safety critical functions in the SIL/HIL environment and eventually in the vehicle, and the results of test executed by the control code will be compared to the expected results, and how supervisory controller respond to the fault scenarios and what remedial actions are taken would be defined in the document as well.
44 33 Test cases are detailed and step by step procedures to be followed to execute a specific test, for instance, during the development of diagnostics, test cases need to cover all safety-critical functions and fault scenarios, as explained in section 4.3.3, an engine and motor speed mismatch fault scenario needs to be considered and detected by fault detection algorithm in the supervisory controller. Table 5 provides a summary of the safety critical tests to date. The tests developed in Year3 cover the faults which make ECUs or component unable to meet the driver demand, the results of tests executed by the control code will be compared to the expected results. Step-by-step procedures for test cases that have been developed for modeling and simulation provided in the Appendix. Table 5 Safety Critical Function Testing Summary 3.1 Accelerator Pedal Name and Description Accelerator Pedal Signal Range If any of the two accelerator pedal signal is out of range the vehicle receives only idle torque (limphome) Accelerator Pedal Mismatch If the istantaneous value of the APP1 does not equal the value of APP2 within a +/- 1% the vehicle receives idle torque Brake Pedal Signal Range If the brake pedal signal is out of range vehicle shuts down Brake Pedal Signal Fault BPP depressed at a certain vaule but vehicle does not decelerate at expected rate 3.2 PRNDL Park The powertrain does not transmit any torque to the wheels or allow the vehicle to roll when PRNDL is in P Reverse The powertrain transmits only torque to the wheels that propel the vehicle in reverse when the PRNDL is in R Pass/Fail Criteria APP > APPmax APP Status = High Vehicle mode = Limphome mode APP <APPmin APP Status = Low Vehicle mode = Limphome mode APP Agree =0 Vehicle mode= Limphome mode BPP Status = Out of range Vehicle mode = Shutdown BPP Status = Signal Fault Vehicle mode = Shutdown Vehicle speed=0 Vehicle speed<0 Primary Testing Environment SIL/HIL SIL/HIL SIL/HIL SIL/HIL SIL/HIL SIL/HIL/In vehicle SIL/HIL/In vehicle
45 Neutral The powertrain does not transmit any torque to the wheels when the PRNDL is in N Drive The powertrain transmits torque to the wheels to propel the vehicle forward when the PRNDL is in D Powertrain Torque Control Torque Direction Fault The regenerative braking torque direction is incorrect when braking. Vehicle Direction Fault The vehicle does not move in the intended direction when in drive gear. Vehicle speed=0 Vehicle speed>0 Motor torque output=0; the regenerative braking will be off. Vehicle mode = Shutdown SIL/HIL/In vehicle SIL/HIL/In vehicle SIL/HIL SIL/HIL 4.4 Mode Selection and Torque Split The mode selection block takes signals from drive request and diagnostics block and contains two major functions: Choosing the mode of operation. The HSC was developed by using rule based control strategies, a set of rules were defined during the design phase, the mode selection block was modeled by Stateflow to represent vehicle operational modes, and transitions between those modes are pre-defined by a set of logical conditions and fault detection information from diagnostics block, for some safety critical faults, the current vehicle operational mode will be stopped if those faults occur, however, some faults will lead to limo mode to ensure the vehicle safe operation while meeting driver demands. The second major function is to find appropriate torque split between the engine and electric motor, the torque split calculations are modeled within each mode by Simulink function, which will be explored in detail in the next section, and an optimization based torque split strategy will also be presented in chapter 5. The control strategy interprets the driver pedal intention as a torque request, which is a function of the maximum torque available at the current speed. If driver torque request is less than zero, then the vehicle is braking, the motor captures the maximum possible regenerative braking energy available within the inverter and battery constraints as well as vehicle operation mode.

46 Mode Selection The criteria used in Simulink is to select the proper hybrid operation mode for all conceivable situations that may be encountered, fault modes were developed that can be used in the case of limited functionality of any or all powertrains. Four modes were developed in the stateflow environment with Simulink, the logic determines the criteria for transitioning between mode, which is shown in figure 20. First, the vehicle will go to default mode which is blended CD mode with high initial SOC when vehicle is enabled and ready, some diagnostic signals from fault detection block are highest priority checks, since vehicle will be forced into fault mode, like engine only mode when those diagnostics signals are active. Second, CS mode will start when high voltage battery SOC < CS_SOC_MIN which is minimum SOC threshold (18%) or CS switch on is triggered by the driver. Engine only mode will be entered only if normal vehicle operational modes are offline which means critical faults occur in the electric powertrain system. In sports mode, this mode can be triggered by the driver s switch, and improve performance of vehicle. Figure 20 Mode selection in torque distribution Blended Charge Depleting Strategy A deterministic rule-based control strategy is developed to perform torque distribution between engine and electric mode within blended CD mode, to meet the torque requirements at the wheels, since there was no clutch between engine and electric motor, the engine output shaft will be always coupled to the motor, therefore, a motor dominant blended CD control strategy was developed to split the torque to meet the


47 36 driver requested torque. Figure 21 provides an illustration of energy flows for blended CD mode. During the blended CD mode, the engine will be always on and produce torque at the wheels, so the entire driver torque request can be delivered by both engine and motor torque. However, since due to the limitation of our current clutch-less pre-transmission parallel architecture, the engine needs to be always on otherwise the engine will be a load to motor if vehicle is running in normal EV mode. Driver requested torque can be calculated based on accelerator pedal position and brake pedal position and then converted to driver intended axle torque, the equation can be performed in the following: T T T gear diff req max max Axle eng mot ratio ratio The driver intended axle torque will be fed into mode selection block to perform torque split between engine and motor. Figure 21 Energy flows in Blended CD mode Torque Distribution Strategy There are several control strategies employed during blended CD mode, such as engine-dominant blended strategy and electric-dominant blended strategy [28]. As mentioned previously, since there was no clutch between engine and motor, to analyze the impact of different control strategies on energy consumption. An engine -dominant is more likely to be implemented in our architecture. However, for the sake of optimizing
48 37 the energy consumption in E&EC event, which is the longest and most resource intensive driving event in the competition [29]. Therefore, a new blended strategy was presented in this section: Mode Torque Request Threshold Torque Distribution Strategy Treq Teng,small Tmot,max Teng, cmd Tsmall Tmot, cmd max 0, Treq Tsmall Blended CD T Mode req Teng,small Tmot,max T min T, T T Tmot, cmd Tmot,max Table 6 Torque request equations for Blended CD mode control strategy eng, cmd eng,opt req mot,max Table 6 shows that torque distribution strategies involve two different sub-modes of operation associated with driver requested torque, and control strategies are discussed in detail in above table. when driver requested torque is less than the addition of maximum torque of electric motor and limited engine torque, the electric motor will produce majority of torque, while engine still needs to produce a small amount of torque, due to our clutch-less P2 architecture, this small amount of torque is discussed in later section. When driver requested torque is very large and requires power that is greater than maximum motor power, the electric motor will produce maximum power under high voltage battery limited power and inverter limited power, while the engine compensates the gap between motor command torque and driver requested torque but the torque commanded by engine is limited under optimal engine operating line. In order to determine how much torque that engine can produce during CD mode for the sake of reducing UF-weighted total energy consumption, a set pf pre-defined engine operating line are determined to evaluate how much total energy are consumed during the E&EC event. Figure 22 shows various engine operating lines are defined according to the amount of percentage of max engine torque at current engine speed available. The optimal engine operating line was scaled down to different levels, as listed in table 7. The engine available torque based on current engine speed is limited by those lines. Scale Factor 20% 30% 40% 50% 60% 80% 100% Table 7 Scale factor for engine operating line
49 38 Figure 23 shows that with different scale factors, battery SOC depletes at different speed due to engine producing torque. It shows that the speed of SOC depleting increases when the scale factor decreases, which means that the contribution of engine also decreases. Table 8 presents the UF-weighted energy consumption for different engine torque level. One can see that vehicle has the lowest fuel consumption which is only 4.07 gallon when the scale factor is 0.6. however, the UF-weighted energy consumption increases when the scale factor increases, in order to find a tradeoff between energy consumption and CD range, 0.3 of scale factor is selected to limit the engine torque during CD mode. Figure 22 Various engine operating lines
50 39 Scalin g factor UF CD Range (mile) Figure 23 Battery SOC with various scale factors Fuel Consumption (Gal) Vehicle Energy Consumption (Wh/km) CD Energy Consumption (Wh/km) Equivalent CS Fuel Consumption (Wh/km) UF-Weighted Energy Consumption (Wh/km) PEU WTW (Wh PE/km) Table 8 Vehicle Energy Consumption with different scale factors Simulation Setup To perform the blended control strategy analysis for PHEV, the E&EC city and highway drive cycle was chosen to run the simulation with initial 89% of SOC. The following section shows the results obtained in SIL for blended CD mode during a specified drive cycle as mentioned previously. Figure 24 shows the drive cycle in detail with average speed of 39 mph, and maximum speed of 55.3 mph, and Figure 25 shows the change of battery SOC, it s clear that engine torque is limited to certain level when the it s in CD mode so that vehicle has longer CD range.
51 40 Figure 24 Speed trace and battery SOC Figure 25 Driver Torque Request, Motor torque and Engine torque


52 41 Figure 26 E&EC Drive Cycle Engine operation Charge Sustaining Strategy When SOC drops below a limit SOC, the vehicle mode will go to charge sustaining mode, in which the SOC of the battery sustains a certain level. In CS mode, both engine and electric motor are working together to produce torque at wheels. As expected, engine efficiency plays an important role in energy analysis, therefore, the key to improve the overall energy consumption is to let the engine work at the highest efficient operation. For CS control strategy, it s undesirable to have significant energy coming from engine charging to the battery, since the path of energy from engine to the battery and then to the wheels is less efficient than the path of energy from engine directly to the wheels, as shown in figure 27. Therefore, it s desirable to have engine working at optimal operation, and vehicle takes excess charging energy. The CS control strategy also involves three sub-modes of operation regarding to battery SOC and driver power demand. The control strategy is discussed in detail in the next section.
53 42 Figure 27 Engine Charge mode in CS mode Figure 28 Motor Assist mode in CS mode Torque Distribution Strategy As discussed previously, the control strategy that often charges the high voltage battery by using the engine is expected to have greater fuel consumption in CS mode. Therefore, a new engine dominant control strategy in CS mode is discussed below. 1) When SOC drops below CS_SOC_MIN which is lower limit for battery SOC, and driver requested torque is less than optimal engine operation, then it s desirable to have engine working at optimal operation, and excess energy is taken to charge the battery to increase the SOC, since motor assisting in this case will improve the engine operation region thus increasing the engine efficiency.
54 43 2) When SOC is higher than the pre-defined CS maximum SOC threshold, in addition, driver requested torque is pre-defined torque threshold, which means it s not mandatory to charge the battery to sustain the SOC, therefore, vehicle can be driven in normal CD blended mode, since as mentioned previously, the electric motor will produce majority of torque, while engine still needs to produce a small amount of torque. When driver requested torque is very large and requires power that is greater than maximum motor power, the electric motor will produce maximum power under high voltage battery limited power and inverter limited power, while the engine compensates the gap between motor command torque and driver requested torque but the torque commanded by engine is limited under optimal engine operating line. 3) When SOC drops below a critical SOC level and driver torque request is greater than desired operation region, if engine still works at optimal operating point then it s hard for battery to sustain at desired SOC level, battery working at low SOC may cause higher battery internal resistance, so the torque distribution strategy implemented in this mode is to let engine deliver maximum torque under current engine speed and motor acts as generator to charge the battery to increase the SOC. Table 9 below shows the detailed torque distribution strategies in CS mode. Figure 29 shows the sub-modes in charge sustaining mode and transition between two sub-modes. Mode CS Mode- Engine Charging CS- Mode- Motor Assisting Torque Request and SOC Threshold SOC CS_SOC_MIN T T Torque Distribution Strategy eng, cmd eng, opt eng, opt req Tmot, cmd max T mot,max, Treq Teng, opt SOC SOC _critical T T eng, cmd eng,max Teng, opt T req Tmot, cmd max Tmot,max,min Tmot,max, Treq Teng,max SOC CS_SOC_MAX T T eng, cmd small Treq Teng,small T mot,max Tmot, cmd max 0, Treq Tsmall T T SOC CS_SOC_MAX T min T, T T Treq Teng,small T mot,max Tmot, cmd Tmot,max Table 9 Torque Control strategy in CS mode eng, cmd eng,opt req mot,max

55 Simulation Setup Figure 29 Charge Sustaining Mode As discussed previously, CS control strategies involve three cases associated with current battery SOC and driver power demand. The E&EC city and highway drive cycle is used. As shown in Figure 30. the difference between initial SOC and final SOC is within allowable limit, which is 5% for HEV. Figure 32 the engine operating points for E&EC drive cycle. It s clear that most of engine operating points are located under optimal operating line which is the highest efficiency for engine. Figure 30 Speed Trace and SOC under CS mode

56 45 Figure 31 All torque request for City and Highway drive cycle Figure 32 Engine Operating Points under CS mode Regenerative Braking Mode In hybrid electric or pure electric vehicles, the regenerative braking can effectively improve the fuel economy by recuperating the kinetic energy during the deceleration. The regenerative braking can be
57 46 coupled with mechanical brake to decelerate the vehicle at the same time. Figure 33 illustrates the energy flow from wheels to the battery. Figure 34 shows the drive cycle with 60mph to 0mph braking and battery SOC changes with regenerative braking enabled and disabled. It s clear that battery SOC increases approximately by 0.2% when vehicle decelerates and the energy was captured back to the battery. Figure 33 Energy path for Regenerative Braking Figure 34 Speed Trace and Battery SOC with/without Regen


58 47 Figure 35 Motor output torque 4.5 Torque Request Subsystem During the transient conditions, the engine cannot follow the driver torque request so this can be solved by motor compensation, since the engine is much slower than the electric motor. Figure 36 below shows the relationship between engine torque and electric motor torque. Figure 36 Engine and motor torque control

59 48 Figure 37 Engine and electric motor torque request If driver torque request changes from point C to point D in figure 36, due to the limit of engine response dynamics, the engine cannot change operating points from C to D instantaneously, therefore, during transient condition, the difference between actual engine torque and driver torque request is sent to the electric motor, so that the motor can compensate the torque difference faster than the engine. Although this strategy has small impact on fuel consumption, the drivability is greatly improved by this method. 4.6 Energy Analysis As mentioned previously, Emissions and Energy Consumption (E&EC) in EcoCAR3 is an important event during the competition where the on -road testing is conducted over a pre- defined drive cycle to evaluate the total energy consumption of the vehicle that each team designed. In this section, a E&EC full drive cycle was used with over approximately 103 miles, which consists of drive to track, seven repeating City/Highway around circle track and drive back from track drive cycle, as shown below. This section outlines the energy analysis over EcoCAR3 E&EC drive cycle based on the control strategies discussed in previous sections.
60 49 To Track*1 CityHighway*3 20 minutes break CityHighway*4 From Track*1 E&EC Drive Cycle Maximum Speed (mph) 70 Average Speed (mph) 37.9 Overall Distance (mile) Maximum Grade (%) Table 10 E&EC drive cycle profile Performance for E&EC Drive Cycle In this section, simulation was conducted based on E&EC full drive cycle, the vehicle was driven in CD and CS mode to test the control strategies discussed in previous sections. As shown in figure 38, the vehicle drives around 25 miles when battery SOC is lower than CS transition threshold, and battery SOC sustains at stable level when vehicle is in CS mode.
61 50 Figure 38 E&EC Full drive cycle and battery SOC depletes Figure 39 Motor torque and engine torque request With engine working during CD mode, the CD range of vehicle was significantly extended, however, the energy consumption increases due to fuel consumption in CD mode. Figure 39 shows the all torque request during the entire drive cycle, one can see that motor delivers most torque request in CD mode and also captures the kinetic energy during regenerative braking. In CS mode, energy operates at optimal operating line and extra torque is used to charge the battery to sustain SOC level Energy Consumption To evaluate the energy consumption for CD and CS control strategies in E&EC drive cycle, For UFweighted energy consumption, fuel and electric consumption needs to be calculated by applying UF to the CD and CS modes, the equations below show the total energy consumption calculation [29]: Energy Consumption UF weighted [kwh/km] = (EC CD UF + EC CS (1 UF))[kWh/km] Table 11 shows the vehicle energy consumption for entire drive cycle, which meets the team s VTS requirements. Table 11 Vehicle Energy Consumption for E&EC drive cycle
62 51 UF CD Range (mile) Fuel Consumption (Gal) Vehicle Energy Consumption (Wh/km) PEU WTW (Wh PE/km) GHG WTW (g GHG/km) CD Energy Consumption (Wh/km) Equivalent CS Fuel Consumption (Wh/km) UF-Weighted Energy Consumption (Wh/km)
63 52 5 Optimization-based Energy Management Strategy 5.1 Introduction As discussed in the previous section, energy management strategy are algorithms that distribute the power between engine and electric motor to reduce the energy consumption and improve the performance of HEVs, energy management takes vehicle states, like pedal positions, battery SOC, etc. to make decisions. A modified equivalent consumption minimization strategy (ECMS) is proposed in this section, the ECMS is a real-time optimization method, which calculates the instantaneous fuel consumption at each time step in the drive cycle and offers locally optimal operating point of engine and electric motor [15]. The ECMS is designed by calculating the total energy consumption which is the sum of actual fuel consumption of engine and virtual electric energy consumption of electric motor. Typically, this strategy is calculated based on real-time and no predictions are necessary but only few vehicle state constraints are needed, such as battery SOC, driver torque request at the wheels, etc. Compared to deterministic rule-based control strategy which is discussed in the previous sections, this strategy can offer optimal torque distribution between ICE and EM to improve the fuel economy while maintaining battery SOC at the same level. In this chapter, the instantaneous equivalent fuel consumption is analyzed in charge sustaining mode, and then torque distribution strategy based on ECMS is proposed to find the torque optimization among driver torque request at each time step, and finally a penalty function for state constraints and charge sustainability is developed to guarantee that the battery SOC does not exceed the limit. Figure 40 Energy Management Strategy in HEVs

, which represents the cost to the electrical energy consumption.")
64 Instantaneous Equivalent Fuel Consumption Analysis In this section, an equivalent consumption minimization strategy (ECMS) is implemented in P2 parallel PHEV, the main objective of this control strategy is to find the optimal torque distribution between the engine and the electric motor. Figure X shows that this optimization-based control strategy flow chart. The ECMS requires the information from driver torque request, and current vehicle status, such as engine speed, battery state of charge (SOC), motor speed to calculate near optimal torque split, and then battery SOC is fed into parameter correction block to correct equivalent factor s(t), which represents the cost to the electrical energy consumption. Figure 41 ECMS torque control strategy flow chart This real-time control strategy contains three aspects: instantaneous equivalent fuel consumption equation, SOC correction and instantaneous optimization. Instantaneous equivalent fuel consumption is the concept that battery can be seen as energy buffer [15], and during charge sustaining mode for PHEV, the electrical energy consumed needs to be replenished using fuel from the engine charging in the future, therefore, an equivalent energy consumption function associated with virtual electric energy consumption is analyzed and built to be objective function, which is discussed in the following. J m t s t m t eq ice batt
65 54 In the equation, mice t means instantaneous engine fuel consumption (g/s), it can be calculated by looking up in the map which is the function of engine torque and engine speed, as shown in figure 42 means the equivalent future fuel consumption which can be added to the actual engine fuel consumption to represent the instantaneous fuel consumption in charge sustaining mode. mbatt t s t is equivalent factor which assigns a cost to the use of electric energy, converting electrical energy into equivalent fuel energy. In this control strategy, when battery SOC is higher than target SOC, the equivalent factor can be assigned to a smaller value, then the cost of electrical energy becomes lower and battery tends to be discharged like charge depleting mode, when the SOC is lower than target SOC, the equivalent factor can be assigned to a bigger value which increases the cost of using electrical energy, the battery tends to be charged like charge increasing mode, therefore, this value plays an important role in regulating battery SOC, which is discussed in the next section. Figure 42 Engine Fuel Flow Rate Map In the discharge case, the battery and engine can provide power to the wheels at the same time, however, in order to replenish the energy consumed in this discharge phase, the electrical power needs to be charged
, mot is motor efficiency, Qlhv m")
66 55 using fuel from engine charging in the future. Figure 43 shows the energy path in the discharge phase. The instantaneous fuel consumption equation in discharge case can be shown in the following: Tm m Jeq mice t s t Q dis mot lhv Where Tm is motor command torque (Nm), mot is motor efficiency, Qlhv m is motor speed (rpm), dis is battery discharge efficiency, is the fuel lower heating value (the energy content per unit of mass). In this case, s t can be represented as the chain efficiencies of transforming fuel energy into electrical energy, so s t 1 eng chg. From the energy path below, one can see that the electrical energy consumed in discharge phase will be replenished in the future by engine, and thus in the energy domain, the chemical energy converts to the mechanical energy and then to the electrical energy, which suffer the energy losses in this process. Figure 43 Energy path in discharge phase In the charge case, the instantaneous fuel consumption equation in discharge case can be shown in the following:

67 56 T J m t s t m m eq ice mot chg Qlhv Where chg is battery charge efficiency. During the charge phase, the electrical power that charged by the engine in the future will save the actual fuel, the mechanical energy provided by the engine is converted into electrical energy, battery SOC increases, as shown in figure 44, the energy path in the rectangle represents that the electrical energy charged by engine will be depleted in the future to save the actual energy. The equivalent factor shows the chain of efficiency of converting electrical power to fuel as well, which is the same with equivalent factor in discharge phase. Figure 44 Energy path in charge case 5.3 Torque Distribution Strategy As discussed in the previous section, the instantaneous fuel consumption has been presented to show the total fuel consumption including actual fuel consumption and virtual fuel consumption associated with electrical energy, the key point of ECMS is to find the instantaneous torque optimization which takes account for all efficiencies of converting fuel to electrical energy or vice versa.
68 57 The purpose of torque distribution optimization is to take driver request torque, vehicle speed, accelerator pedal position, equivalent factor, current gear position in the transmission and engine speed to find the optimal torque split between engine and electric motor. In order to find the optimal torque split between engine and electric motor, the minimal instantaneous fuel consumption has to be found and then determine the respective engine torque and motor torque corresponding to the minimal total fuel consumption. In this section, the equivalent fuel consumption is calculated by using discretized electric motor torque as control variable, since the driver torque request is fixed at each time step, the motor torque that gives the lowest equivalent fuel consumption is selected. Figure 45 shows that at each time step, the sum of motor torque candidate and engine torque candidate is always equal to driver torque request, therefore, in this case, torque request can be divided to several control variables. Figure X shows the ECMS control algorithm flowchart which clearly explain how the optimal torque distribution is obtained in this control algorithm. The equation below shows the objective function: Jeq,min min Jeq k Per the P2 parallel architecture, the torque and speed are limited by mechanical constraints min max min T T T m max m

69 58 Figure 45 ECMS Control Algorithm Motor torque candidate and engine torque candidate As discussed previously, the motor torque and engine torque candidate can be calculated by driver torque request and their actuator mechanical constraints, as shown in figure 46. To calculate each possible motor torque pairs at each time step, the lower limit for motor torque is max, T T T T mot,min m req m eng,max m mot,max, regen m The maximum available motor regenerative torque is based on the motor limit and battery capability. The upper limit for motor torque candidate is mot,max min T T T m req m mot,avail m The upper and lower motor torque are used for determining available control variables at current motor speed. The motor torque candidate can be T T : T : T mot, candidate mot,min mot,max

70 59 Therefore, the respective engine torque limit can be, T T T eng m req m mot candidate Figure 46 Torque control system and actuators constraints Torque Split Optimization After obtaining the motor torque candidate and engine torque candidate, the control algorithm in figure 45 is main process for optimizing torque split between engine and motor in real time. The ECMS algorithm takes discretized motor torque as control variables and calculate the total equivalent fuel consumption for each combinations of motor torque candidates and engine torque candidates, and then minimal equivalent fuel consumption is selected to find the most efficient engine torque request and motor torque request for driver total torque demand at each time step. Once the most efficient motor torque request is determined, it can be sent to the engine torque determination block to calculate engine torque request to the ECM Torque Request Subsystem The engine torque request determined by HSC usually changes rapidly, therefore a rate limiter is necessary to prevent the engine from changing operating points too rapidly. A torque request strategy for engine and electric motor was proposed to improve the drivability, as shown figure 47.


71 60 Figure 47 Engine torque and Motor torque request subsystem The preliminary engine torque coming from torque distribution is limited by rate limit if the engine operating point change too fast, and the difference between preliminary engine torque and demanded engine torque is added to the preliminary motor torque to meet driver torque request. 5.4 SOC Correction The ECMS algorithm does not guarantee the sustainability of battery state of charge, since it only finds the minimal total equivalent fuel consumption. In charge sustaining mode for HEVs, the difference between initial battery SOC and final SOC should be limited to 4%, therefore, a penalty function is applied to the objective function to change the cost of electrical energy, the penalty is shown below [15]: 3 t arg et max min p 1 SOC t SOC SOC SOC / 2 This subsystem compares the current SOC to targeted SOC for charge sustaining mode, based on the results of comparison, this subsystem outputs an equivalent factor that is used for weighting the cost of electrical energy consumption in instantaneous equivalent fuel consumption, as shown in equation below: J m t p t s t m t eq ice batt
72 61 As shown in figure 48 below, when SOC is smaller than target SOC which is 18% in this case, the penalty factor is greater than 1, then higher cost is assigned to the electrical power, and battery tends to more likely be charged, when the cost is lower, the battery is more likely discharged. Figure 48 Penalty function for SOC correction In order to show the SOC sustainability based on penalty function, the figure 48 shows that with the SOC correction function, the battery SOC can sustain at certain level, and only 0.48% of battery energy lost. Without this SOC correction function, the controller tends to use electrical energy more likely since the electrical energy has less contribution to the equivalent fuel consumption, that is, the path of energy from engine to the battery and then to the wheels is less efficient than the path of energy from engine directly to the wheels. Therefore, the adjustment of equivalent factor in real-time allows the vehicle to sustain battery SOC adaptively based on drive cycles. Figure 49 shows the battery SOC changes when SOC correction was applied for 505 drive cycle. It s clear that battery SOC was back to the targeted SOC when SOC correction was applied.
73 62 Figure 49 Vehicle Speed trace and battery SOC with or without correction 5.5 Simulation Results According to the discussion above, the real-time optimization based control strategy was implemented in MATLAB/Simulink, as shown in Appendix. in this section, CS mode is performed in the simulation based on 505 drive cycle, figure 50 shows the speed trace and SOC profile in charge sustaining mode under new control strategy with SOC correction strategy, where the initial SOC and final SOC are almost identical, there is only 0.36% difference between them.
74 63 Figure Speed Trace and Battery SOC in CS mode Figure 51 All torque requests using optimization based control strategy
75 64 Figure 52 Transmission Estimated Gear Figure 53 a) Engine Operating Points of 505 drive cycle for ECMS, b) Engine Operating Points for rulebased control strategy Figure 53 above shows that engine operating points in 505 drive cycle for rule-based control strategy and ECMS controller, from the figure, one can see that most of engine operating points are in the lowest fuel consumption area under new control strategy, which is shown in the red circle.
76 Energy Consumption Comparison A rule-based control strategy was discussed in chapter 4, which has four different modes, charge depleting mode is default mode, and when battery SOC is lower than a pre-defined threshold, the charge sustaining mode is triggered to sustain the SOC at stable level. To compare the energy consumption between the optimization based control strategy and rule-based control strategy, four EcoCAR3 drive cycles are used in the MIL environment which include 505, HWFET and US06 city and highway portion. Figure 54, 55, 56, 57 show all four drive cycles trace and SOC profile with two different control strategies, and all engine operating points for optimization based controller plots are shown in Appendix. Table 12, 13, show the SOC-corrected total energy consumption comparison between two control strategies during charging sustaining mode. SOC -corrected fuel consumption can be calculated by the following equation [29]: FC SOC corrected [ kg km ] = (Mass fuel [kg] + EC electric,cs [kwh] 0.25 LHV fuel [ kwh ) kg ] cycle distance[km] EC equivalent fuel,cs [ kwh km ] = FC SOC corrected [ kg km ] LHV fuel [ kwh kg ] One can see that both two strategies can sustain SOC within pre-defined limit. However, ECMS strategy decreased the total energy consumption by 7.1%, 8.5% 5.7%, 1.6% compared with the rule-based control strategy, while maintaining small SOC difference during CS mode. Therefore, from energy consumption in table 12,13,14, 15, it s clearly that ECMS controller reduced more energy consumption during city drive cycles than highway drive cycles.
77 Drive Cycle Figure Drive Cycle and SOC profile Ruel Based Control ECMS Control Strategy Comparison Fuel Consumption (L) SOC-corrected fuel % consumption (Wh/km) Delta SOC (%) Table 12 Energy Consumption Comparison for 505 drive cycle US06Highway
78 67 Figure 55 US06 Highway drive cycle and SOC profile Ruel Based Control ECMS Control Strategy Improvement Fuel Consumption (L) SOC-corrected fuel % consumption (Wh/km) Delta SOC (%) Table 13 Energy Consumption Comparison for US06 Highway drive cycle US06 City Figure 56 US06 City drive cycle and SOC profile Ruel Based Control ECMS Control Strategy Comparison Fuel Consumption (L) SOC-corrected fuel % consumption (Wh/km) Delta SOC (%) % Table 14 Energy Consumption Comparison for US06 City drive cycle
79 HWFET Drive Cycle Figure 57 HWFET drive cycle and SOC profile Ruel Based Control ECMS Control Strategy Comparison Fuel Consumption (L) SOC-corrected fuel % consumption (Wh/km) Delta SOC (%) Table 15 Energy Consumption Comparison for HWFET drive cycle Energy Consumption Comparison in E&EC event A combination of rule-based for charge depleting mode and ECMS control strategy for charge sustaining mode was implemented in the hybrid supervisory controller in EcoCAR3 plant model simulator. The vehicle simulator was used to test different control strategies implemented in HSC and evaluate the effect that new control strategies would have on the overall vehicle energy consumption as well as fuel economy. In order to determine the new control strategy is effective or not, the energy consumption from new control strategy is compared to the energy consumption results from rule-based control strategy. In charge depleting mode, both rule-based control and ECMS based controller have the same control strategy, which is blended CD control strategy. In charge sustaining mode, the ECMS based controller had different control strategy from rule-based which is discussed in detail in chapter 4.
80 69 In order to compare the energy consumption between two control strategies under EcoCAR3 E&EC event, the vehicle simulator is used to run full E&EC drive cycles in both charge depleting mode and charge sustaining mode, the results for energy consumption for two control strategies are listed in table 16. Figure 58 shows the E&EC drive cycle for two control strategies and battery state of charge during the entire drive cycle. It s clearly that battery SOC sustains at targeted SOC level during CS mode with new control strategy, while rule-based control strategy oscillates under certain upper and lower SOC threshold. Figure 60 and Figure 61 shows the engine operating points for two control strategies, one can see that most of engine operating points under new control strategy are within highest efficiency region, while for rulebased control strategy, most of operating points scattered. Figure 58 Three drive cycles speed trace and SOC profile
81 70 Figure 59 Engine fuel consumption Figure 60Engine Operating Points with ECMS Figure 61Engine Operating Points with Rule based Control Table 16 below shows the vehicle energy consumption and fuel consumption for optimized and rule-based control strategies. The results show that optimized control strategy had fuel consumption of 3.92 gallon which is 9.9% decrease over rule- based control strategy, the optimized control strategy also had Wh/km of UF-weighted energy consumption which is 7.4% decrease over rule-based control strategy while
82 71 maintaining the SOC at targeted level. The decreases that optimized control strategy had make a significant difference on energy consumption for hybrid electric vehicles. Table 16 Comparison of vehicle energy consumption for optimized and rule-based control strategies Ruel Based Control ECMS Control Strategy Improvement Fuel Consumption (gal) % UF weighted Energy % Consumption (Wh/km) PEU WTW % (Wh PE/km) GHG WTW (g GHG/km) %
83 72 6 Conclusion and Future Work 6.1 Conclusion This study presents a detailed control strategies for hybrid supervisory controller of plug-in hybrid electric vehicles. Some techniques pertaining to control system development for clutch-less P2 architecture are briefly discussed in the thesis, like model based design, and software development process, V-cycle, which have great significant on development of vehicle control system. A software development process was discussed in the thesis, which begins with the development of control requirements, referring to figure 7, V-cycle plays a significant role in developing control strategies for electric control units (ECUs). The requirements can be determined by the goal of competition and components interface, which are used for designing control system algorithms. The control requirements developed in the thesis are mainly for developing hybrid supervisory controller (HSC), which is a high level controller that interprets driver demand and controls interaction between powertrain components by their respective control units, it determines the appropriate torque split between two components as well as correct operating mode for hybrid electric vehicle. In this study, hybrid supervisory controller is divided into four parts: driver requested torque subsystem, mode selection and torque distribution, fault diagnostics as well as output. In torque distribution subsystem, the vehicle distributes the torque between engine and electric motor based on driver demanded power and current engine or electric motor power limits. This strategy is commonly used in automotive industry currently. The HSC is also able to perform diagnostics for all critical components to detect faults and mitigate faults as well as prevent faults. The clutch-less P2 architecture chosen by WSU EcoCAR 3 team leads to different control strategy in CD mode compared to normal P2 architecture, In CD mode, control strategy enables the engine always deliver limited torque so that the electric motor is not necessary to drag the engine for the sake of reducing total energy consumption, the electric motor produces the remaining torque to meet the driver requested torque. In CS mode, vehicle enables engine work at the highest efficient operation and extra torque produced is used to charge the battery to sustain the battery SOC.
84 73 The HSC algorithms implemented in the thesis is tested under WSU EcoCAR3 vehicle simulator in Model in the Loop (MIL), which contains all electric components and stock vehicle components modeled by Simulink as well as Simscape. The vehicle simulator is used to test effectiveness of control strategies in PHEV. In addition, an optimized control strategy based on ECMS is proposed in the thesis, the charge depleting has the same control strategies with rule-based control strategy, since due to the limitation of clutch-less P2 architecture, the engine cannot be off when vehicle is in CD mode. The charge sustaining contains a different control strategy from rule-based control strategy. It optimizes the torque distribution between engine and electric motor in real time, as illustrated explicitly in chapter 5. To test the effectiveness of optimized control strategy for PHEV, the HSC with new control strategy was tested under EcoCAR3 vehicle simulator in MIL. Final results show that optimized control strategy had fuel consumption of 3.92 gallon which is 9.7% decrease over rule- based control strategy, the optimized control strategy also had Wh/km of UF-weighted energy consumption which is 7.4% decrease over rule-based control strategy while maintaining the SOC at targeted level. Another advantage of this optimized control strategy is the sustainability of battery SOC whatever the drive conditions change. However, although optimized control strategy had lower fuel consumption during E&EC event, the algorithm runs in real time and evaluate each torque control variable at each time step which is computationally intensive when implementing this control strategy in real controller in the vehicle. 6.2 Discussion and Future Work Validation The optimized control strategy and rule based control strategy proposed in the thesis still need to be validated under hardware in the loop (HIL) and implemented in the vehicle s controller. In the hardware in the loop environment, the HSC needs to be configured in the real controller and communicate with component controllers in dspace through CAN bus. This can be done before testing in the real vehicle. Once the HSC control strategy is validated in the HIL, the strategy will be transferred to the real vehicle,
85 74 and this can be done by driving on the road and collecting data to compare with the results in the Simulink model Future Work As mentioned previously, the emissions in hybrid electric vehicles is also an important criterion for evaluating the fuel economy of HEVs. However, the ECMS implemented in the thesis does not take emissions into consideration, which may cause the torque distribution strategy to be not optimal solutions. In order to optimize the torque distribution properly, the control strategy also needs to take consideration for transmission gear shifting which is also important control variable in energy management strategy. Therefore, those issues can be solved by multi-objective optimization strategy. The huge disadvantage of the real-time optimized control strategy is computation time which may cause issues in the real controller when implemented the control strategy in the vehicle. To solve this problem, the control strategy can be optimized offline by perform simulation for all different kinds of drive cycle and create optimal torque distribution map as a function of various inputs, like driver torque demand, accelerator pedal position, engine speed, gear position, etc.
86 75 Appendix A A.1 List of Abbreviations AVTC CD CS E85 EC ECMS ECU EM E&EC FC HIL HSC ICE MIL PHEV SIL SOC UF VIL VTS WSU Advanced Vehicle Technology Competition Charge Depleting Charge Sustaining 85% ethanol and 15% gasoline fuel by volume Energy consumption Equivalent Consumption Minimization Strategy Electric Control Unit Electric Motor Emission and Energy Consumption Fuel Consumption Hardware in the Loop Hybrid Supervisory Controller Internal Combustion Engine Model in the Loop Plug-in Hybrid Electric Vehicle Software in the Loop State of Charge Utility factor Vehicle in the Loop Vehicle Technical Specification Wayne State University

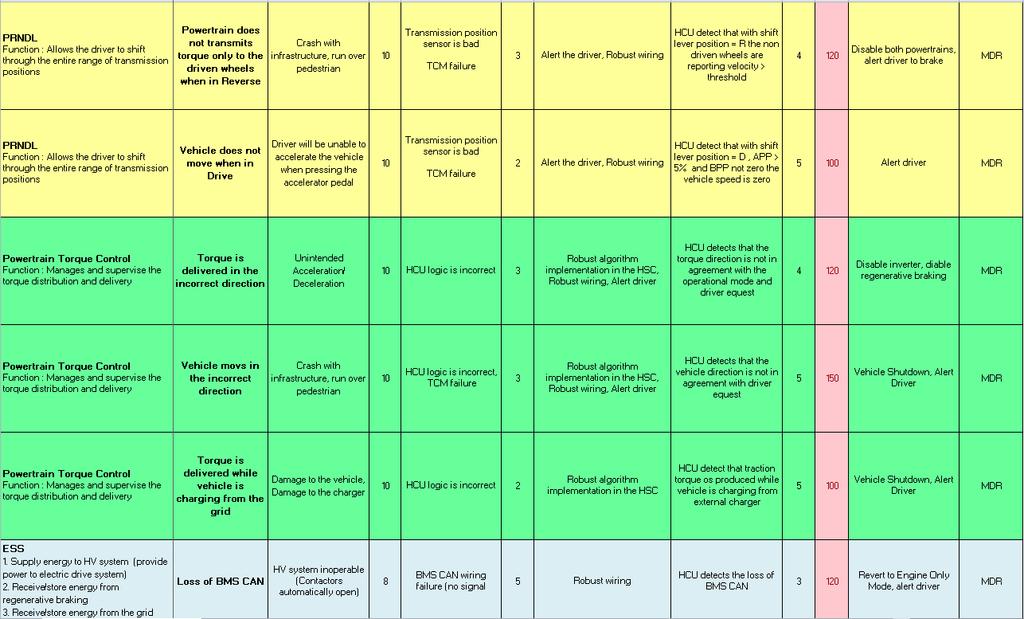
87 A.2 DFMEA 76
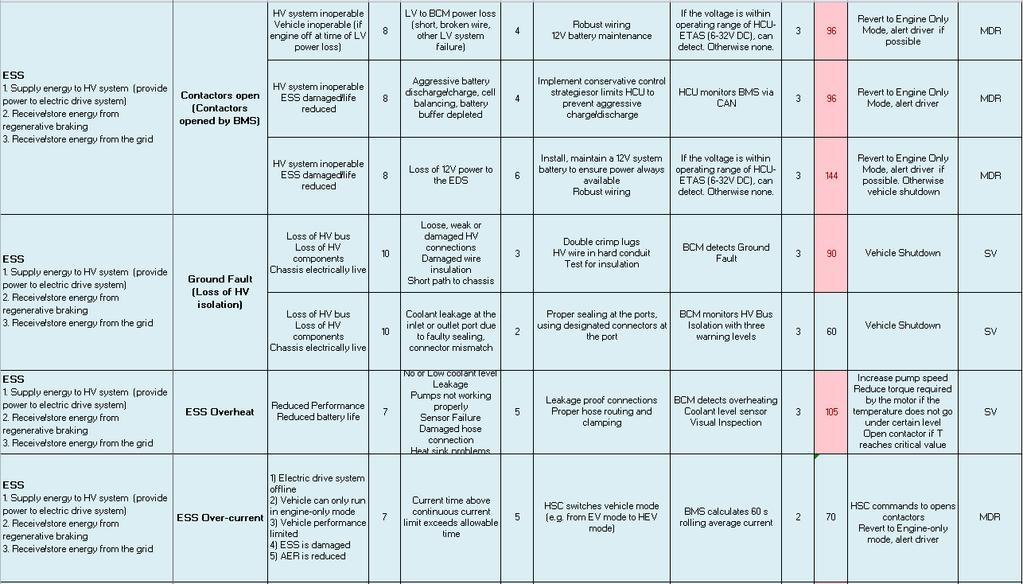
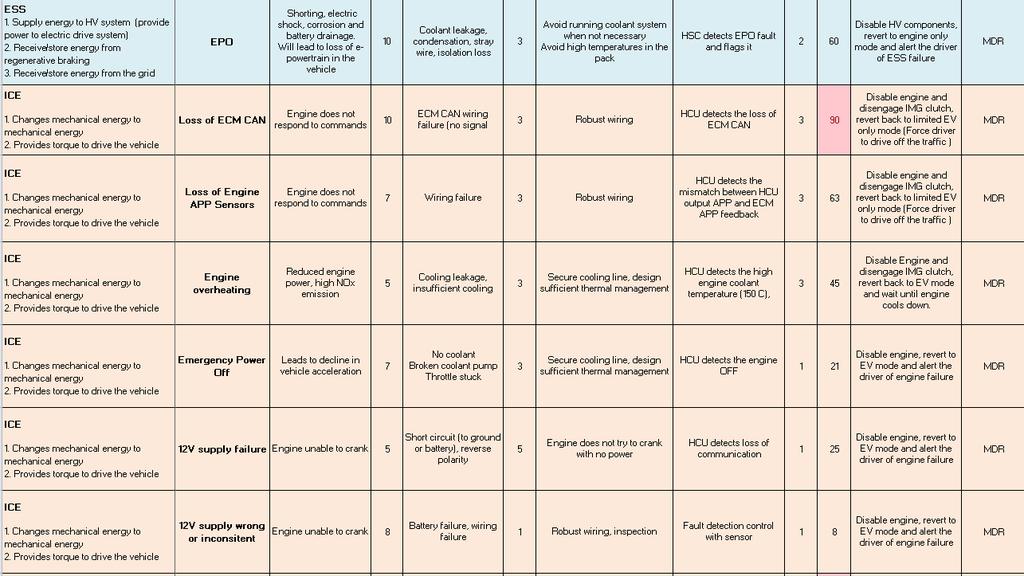
88 77
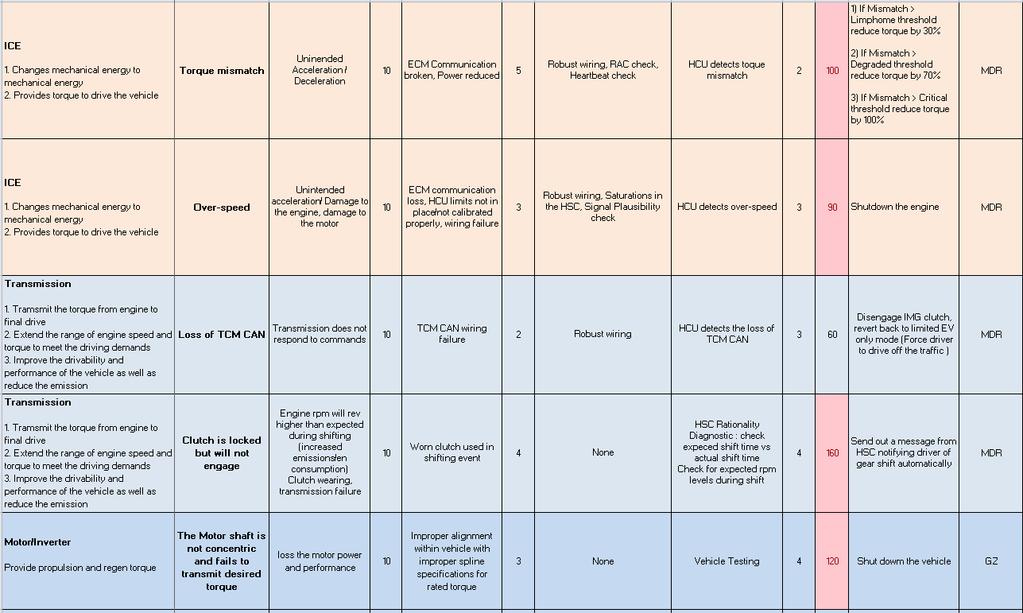
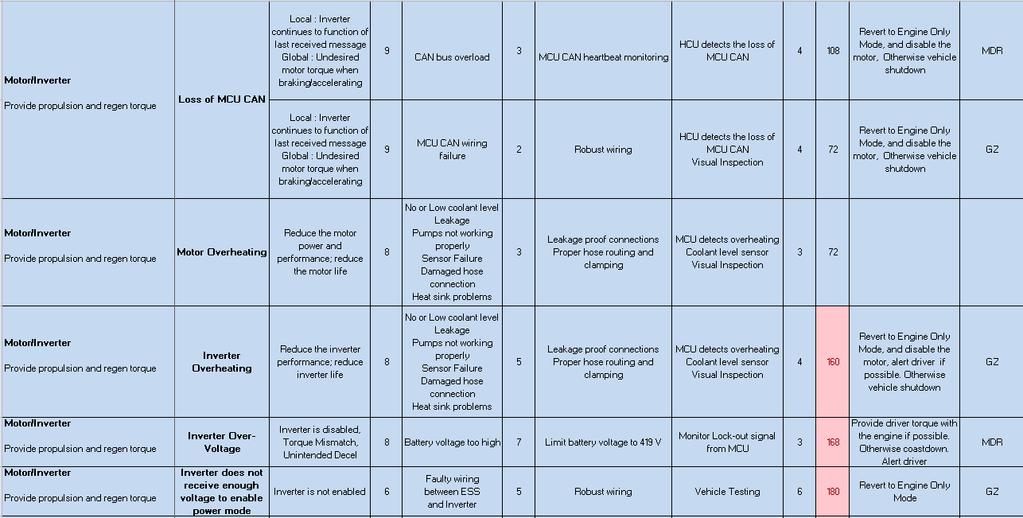
89 78

90 79 A.3 Test cases Documents for safety critical algorithms Test Case Overview <APP1 and APP2 mismatch> Priority: High Version: 1.0 Test Platform: MIL, SIL, HIL Last Updated: 11/4/2016 DFMEA Number: Author: Guilin Zhu Test Case Description: The test simulates the case in which there is a mismatch fault between APP1 and APP2. When the pedal position value of the two sensors does not agree within 1%, the Drv_APP_Agree and APP_Valid sets to 0. To implement the fault, Mismatch_APP_ONwill be implemented intoapp_fault_insertion block, and when the fault triggers, APP2 signal will be set to cal.app.mismatch_value+0.01 value. To perform this test, the tester needs to set the mismatch fault for APP1 and APP2 before running the simulation and the fault will be implemented by running fault script. Once the simulation is complete the tester will compare the obtained results with the expected results to determine if the test is passed. The test is considered passed when the simulation results match the expected results. Test Case Procedure Test Initialization: 1)under the Input Conversions->DriverInput_Conversions-> Override APP1 (%), set control port to 0 2) under the Input Conversions->DriverInput_Conversions-> Override APP (%)2, set control port to 0. 3) Select the 505 drive cycle from the GUI 4) Set SOC to 90% from the GUI in order to run CD mode as default mode. 5) Run initial filemain_init.m to initialize the model parameters
91 80 Test Body: Test Completion: Test Case Summary Expected Results: 1) Run Fault_Trigger.m to insert the fault, and Mismatch_APP_ON(under Plant Actuators -> Analog ->APP_Fault_Insertion) will set to 1 and all other faults will be 0 when fault triggers 2) Run the model 3) Check the results obtained in the Scope block for each fault 1)Record the result 2)Restore the original state of model 3) Run Fault_Clean.m to clean the APP_Mismatch fault Pass/Fail criteria: CD mode: 1) Vehicle speed=0; 2) Motor torque output =0; Engine-Only mode: 1) Vehicle speed=0; 2) Engine torque output=0; Under the Signal diagnostic-> Driver signal diagnostic, Drv_APP_Agree will be 0, and ->systemdiag->esystemdiagnostics, esystemstatus will be 0 and icssystemstatus will also be 0; Under Camaro Plant Model ->Chassis, chas_lin_spd_out, the speed of vehicle will go to 0; Under Camaro Plant Model->IMG->IMG Plant->Electric Machine, mot_trq_out will be 0; Test Case Overview <APP1 and APP2 Out of range> Priority: High Version: 1.0 Test Platform: MIL, SIL, HIL Last Updated: 11/4/2016 DFMEA Number: Author: Guilin Zhu Test Case Description: The test simulates the case in which there is an out-of-range fault between APP1 and APP2. When the pedal position value of the two sensors exceed a critical threshold, the Drv_APP1_[%]_SigValid ordrv_app2_[%]_sigvalidset to 0. To implement the fault, APP1_OOR_ON and APP2_OOR_ON will be implemented intoapp_fault_insertion block, and when the fault triggers, APP1 or APP2 signal will be set to cal.app1.in_max_sc_prcnt+1 value. To perform this test, the tester needs to set out-of-range fault for APP1 or APP2 before running the simulation and the fault will be implemented by running fault script. Once the simulation is complete the tester will compare the obtained results with the expected results to determine if the test is passed. The test is considered passed when the simulation results match the expected results. Test Case Procedure Test Initialization: 1)under the Input Conversions->DriverInput_Conversions-> Override APP1 (%), set control port to 0 2) under the Input Conversions->DriverInput_Conversions-> Override APP (%)2, set control port to 0, and override all other signals 3) Select the 505 drive cycle from the GUI 4) Set SOC to 90% from the GUI in order to run CD mode as default mode.
92 81 5) Run initial filemain_init.m to initialize the model parameters Test Body: Test Completion: Test Case Summary Expected Results: 1) Run Fault_Trigger.m to insert the fault, and APP1_OOR_ON or APP2_OOR_ON (under Plant Actuators -> Analog ->APP_Fault_Insertion) will set to 1 and all other faults will be 0 when fault triggers 2) Run the model 3) Check the results obtained in the Scope block for each fault 1)Record the result 2)Restore the original state of model 3) Run Fault_Clean.m to clean the APP_OOR fault Pass/Fail criteria: CD mode: 3) Vehicle speed=0; 4) Motor torque output =0; Engine-Only mode: 3) Vehicle speed=0; 4) Engine torque output=0; Under the Signal diagnostic-> Driver signal diagnostic, Drv_APP1_[%]_SigValid or Drv_APP2_[%]_SigValidwill be 0, and ->systemdiag->esystemdiagnostics, esystemstatus will be 0 and icssystemstatus will also be 0; Under Camaro Plant Model ->Chassis, chas_lin_spd_out, the speed of vehicle will go to 0; Under Camaro Plant Model->IMG->IMG Plant->Electric Machine, mot_trq_out will be 0; Test Case Overview <BPP Fault> Priority: High Version: 1.0 Test Platform: MIL, SIL, HIL Last Updated: 11/4/2016 DFMEA Number: Author: Guilin Zhu Test Case Description: The test simulates the case in which the brake pedal is depressed but the vehicle fails to decelerate at an acceptable rate. When the commanded BPP (%) failed to produce acceptable deceleration values or vehicle deceleration is 0 when BPP>0, then the Brake_Failedflagsets to 1. To implement the fault, BPP Fault will be inserted into the Chassis block. When the BPP fault is triggered, the vehicle acceleration which is chas_plant_lin_accel will be set to 1/10 of original value, therefore the vehicle will fail to decelerate at an acceptable value. To perform this test, the tester needs to set fault for BPP before running the simulation and the fault will be implemented by running fault script. Once the simulation is complete the tester will compare the obtained results with the expected results to determine if the test is passed. The test is considered passed when the simulation results match the expected results. Test Case Procedure Test Initialization: 1) under the Input Conversions->DriverInput_Conversions-> Override BPP (%), set control port to 0.
93 82 Test Body: Test Completion: Test Case Summary Expected Results: 2) undercamaro Fault Detection->Input Conversions, override all other signals to normal value. 3) Select the 505 drive cycle from the GUI 4) Set SOC to 90% from the GUI in order to run CD mode as default mode. 5) Run initial filemain_init.m to initialize the model parameters 1) Run Fault_Trigger.m to insert the fault, and BPP_Flt(under Camaro Plant Model-> Chassis) will set to 1. 2) Run the model 3) Check the results obtained in the Scope block for each fault 1)Record the result 2)Restore the original state of model 3) Run Fault_Clean.m to clean the BPP_Flt fault Pass/Fail criteria: 1) Vehicle speed=0; 2) Motor torque output/engine torque output =0; Under the Signal diagnostic-> Driver signal diagnostic, Brak_Failed will be 1, and ->systemdiag->esystemdiagnostics, esystemstatus will be 0 and icssystemstatus will also be 0; Under Camaro Plant Model ->Chassis, chas_lin_spd_out, the speed of vehicle will go to 0; Under Camaro Plant Model->IMG->IMG Plant->Electric Machine, mot_trq_out will be 0; Test Case Overview <PRNDL Fault> Priority: High Version: 1.0 Test Platform: MIL, SIL, HIL Last Updated: 11/4/2016 DFMEA Number: Author: Guilin Zhu Test Case Description: The test simulates the case in which the actual and commanded shift state is not the same (i.e. commanded state is park, but the vehicle is in drive). When the commanded shift state (ShftLvrPos) does not agree with the actual shift state (TransEstGear), the propulsive net torque will be set to 0, PRNDL shift failed then sets to 1. To implement the fault, PRNDL Fault will be inserted into the Camaro Plant Model->Transmission block. When commanded shift lever position is in Park, drive or reserve, the fault actual shift state would set to be drive, reverse, and drive which may cause severe accidents, then the PRNDL_shift_failed will be 1 and vehicle will be shut down. To perform this test, the tester needs to set fault for PRNDL fault before running the simulation and the fault will be implemented by running fault script. Once the simulation is complete the tester will compare the obtained results with the expected results to determine if the test is passed. The test is considered passed when the simulation results match the expected results. Test Case Procedure Test Initialization: 1) under the Input Conversions->DriverInput_Conversions-> Override LvrPosTrnsShft, set control port to 0. 2) undercamaro Fault Detection->Input Conversions->TransEstGear, set control port to 0, override all other signals to normal value.
94 83 Test Body: Test Completion: Test Case Summary Expected Results: 3) Select the 505 drive cycle from the GUI 4) Set SOC to 90% from the GUI in order to run CD mode as default mode. 5) Run initial filemain_init.m to initialize the model parameters 1) Run Fault_Trigger.m to insert the fault, and PRNDL_Flt(under Camaro Plant Model-> Transmission) will set to 1. 2) Run the model 3) Check the results obtained in the Scope block for each fault 1)Record the result 2)Restore the original state of model 3) Run Fault_Clean.m to clean the PRNDL_Flt fault Pass/Fail criteria: 1) Vehicle speed=0; 2) Motor torque output/engine torque output =0; Under the Signal diagnostic-> Driver signal diagnostic, PRNDL_shift_failed will be 1, and ->systemdiag->esystemdiagnostics, esystemstatus will be 0 and icssystemstatus will also be 0; Under Camaro Plant Model ->Chassis, chas_lin_spd_out, the speed of vehicle will go to 0; Under Camaro Plant Model->IMG->IMG Plant->Electric Machine, mot_trq_out will be 0; Test Case Overview <Loss of CAN> Priority: High Version: 1.0 Test Platform: MIL, SIL, HIL Last Updated: 10/29/2016 DFMEA Number: Author: Guilin Zhu Test Case Description: The test simulates the case in which there is loss of component CAN communication. Faults that occur include overruns, timeouts, and data mismatch Alive Rolling Counters (ARC) are used as software watchdogs to determine if a component is still communicating on the CAN network. In this test, we can only test the case that loss of MCU CAN. When the loss of CAN fault happens, the propulsive net torque will also be set to 0, MCURollingAliveActive then sets to 0. To implement the fault, Loss of CAN Fault will be inserted into the Camaro Plant Model->IMG->Electric machine->soft MCU. When MCU_CAN_fault is inserted, data mismatch occurs when the ARC sent by the component do not match the ARC expected by the HSC, so the motor and MCU will be disabled, esystemstatus will be offline, the vehicle thus will be shutdown. To perform this test, the tester needs to set fault for Loss of CAN fault before running the simulation and the fault will be implemented by running fault script. Once the simulation is complete the tester will compare the obtained results with the expected results to determine if the test is passed. The test is considered passed when the simulation results match the expected results. Test Case Procedure Test Initialization: 1) under the Input Conversions->MCU_Conversions-> Override rollingalivecnt [123], set control port to 0.
95 84 Test Body: Test Completion: Test Case Summary Expected Results: 2) undercamaro Fault Detection->Input Conversions, override all other signals to normal value. 3) Select the 505 drive cycle from the GUI 4) Set SOC to 90% from the GUI in order to run CD mode as default mode. 5) Run initial filemain_init.m to initialize the model parameters 1) Run Fault_Trigger.m to insert the fault, and MCU_CAN_fault (under Camaro Plant Model-> IMG->Electric Machine->Soft MCU) will set to 1. 2) Run the model 3) Check the results obtained in the Scope block for each fault 1)Record the result 2)Restore the original state of model 3) Run Fault_Clean.m to clean the MCU_CAN_fault Pass/Fail criteria: 1) Motor torque output =0; 2) MCU_Status=0; 3) esystemstatus=0; icesystemstatus=2; 4) Vehicle mode switch to Engine only mode from CD mode; Under the Signal diagnostic-> Mot signal diagnostic, MCURollingAliveActivewill be 0, and ->systemdiag->esystemdiagnostics, esystemstatus will be 0 and icesystemstatus will be 1 when loss of MCU CAN triggers; Under HSC ->Powertrain Manager->Torque Distribution, the vehicle mode will change from 1 to 5 which is Engine only mode; Under Camaro Plant Model->IMG->IMG Plant->Electric Machine, mot_trq_out will be 0; Test Case Overview <Motor Torque Mismatch> Priority: High Version: 1.0 Test Platform: MIL, SIL, HIL Last Updated: 10/29/2016 DFMEA Number: Author: Guilin Zhu Test Case Description: The test simulates the case in which there is a torque mismatch between torque command from HSC and torque feedback from MCU. There are three levels of torque mismatch which are torque degraded, limphome and critical error level, and mitigation strategy thus will be different for each of them. When the Motor torque mismatch fault happens, the fault mitigation strategy under Torque Distribution block will take actions based on types of torque mismatch under fault detection block, if motor torque mismatch occurs, MCU_Torque_Mismch will be set to 1. To implement the fault, Motor torque mismatch fault will be inserted into the Camaro Plant Model->IMG->Electric machine->mot_trq_out. When MCU_Torque_Mismchis inserted, the motor torque output will be altered and do not match the commanded torque from HSC, so the fault will be detected by the Fault Detection block, then esystemstatus will be offline or limited based on the types of torque mismatch fault, remedial actions will be in place.
96 85 Test Case Procedure Test Initialization: Test Body: Test Completion: Test Case Summary Expected Results: To perform this test, the tester needs to set fault for motor torque mismatch fault before running the simulation and the fault will be implemented by running fault script. Once the simulation is complete the tester will compare the obtained results with the expected results to determine if the test is passed. The test is considered passed when the simulation results match the expected results. 1) under the Input Conversions->MCU_Conversions-> Override MCUTrqCmd_Nm, set control port to 0. 2) undercamaro Fault Detection->Input Conversions->Torq_Feedback, et control port to 0. 3) Select the 505 drive cycle from the GUI 4) Set SOC to 90% from the GUI in order to run CD mode as default mode. 5) Run initial filemain_init.m to initialize the model parameters 1) Run Fault_Trigger.m to insert the fault, and MotTrqMismatch (under Camaro Plant Model-> IMG->Electric Machine) will be set to corresponding mismatch value based on mismatch types. 2) Run the model 3) Check the results obtained in the Scope block for each fault 1)Record the result 2)Restore the original state of model 3) Run Fault_Clean.m to clean the MotTrqMismatch Pass/Fail criteria (Mismatch type=1/2): 1) MCU_Status=1; 2) esystemstatus=1; 3) mot_trq_out will be limited to corresponding limited torque. 1)Under the Component diagnostic-> Motor component diagnostic, MCU_Torque_Mismchwill be 1, and ->systemdiag->esystemdiagnostics, esystemstatus will be 1 when fault triggers; 2)Under Camaro Plant Model->IMG->IMG Plant->Electric Machine, mot_trq_out will be 0; Pass/Fail criteria (Mismatch type=3): 1) Motor torque output =0; 2) MCU_Status=0; 3) esystemstatus=0; icesystemstatus=2; 4) Vehicle mode switch to Engine only mode from CD mode; Under the Component diagnostic-> Motor component diagnostic, MCU_Torque_Mismchwill be 1, and ->systemdiag->esystemdiagnostics, esystemstatus will be 0 and icesystemstatus will be 1 when fault triggers; Under HSC ->Powertrain Manager->Torque Distribution, the vehicle mode will change from 1 to 5 which is Engine only mode; Under Camaro Plant Model->IMG->IMG Plant->Electric Machine, mot_trq_out will be 0; Test Case Overview <Torque Direction Mismatch> Priority: High Version: 1.0
97 86 Test Platform: MIL, SIL, HIL Last Updated: 11/12/2016 DFMEA Number: Author: Guilin Zhu Test Case Description: The test simulates the case in which there is a regenerative braking torque direction mismatch, result in propulsion rather than braking. When the regenerative braking torque direction mismatch happens, Regen_Torque_Dir will be set to 1. To implement the fault, Regen_Torque_Dir will be inserted into the Camaro Plant Model->IMG->Electric machine. When Regen_Torque_Dir fault is inserted, the motor torque command will be altered when the vehicle is required to use regenerative braking system however the vehicle will have unintended acceleration, so the fault will be detected by the Fault Detection block, esystemstatus will be limited, and regenerative braking system will be disabled. To perform this test, the tester needs to set fault for Regen_Torque_Dir fault before running the simulation and the fault will be implemented by running fault script. Once the simulation is complete the tester will compare the obtained results with the expected results to determine if the test is passed. The test is considered passed when the simulation results match the expected results. Test Case Procedure Test Initialization: Test Body: 1) under the Input Conversions->MCU_Conversions-> Override MCUTrqCmd_Nm, set control port to 0. 2) undercamaro Fault Detection->Input Conversions->Torq_Feedback, set control port to 0. 3) undercamaro Fault Detection->Input Conversions, override all other signals to normal value. 4) Select the 505 drive cycle from the GUI 5) Set SOC to 90% from the GUI in order to run CD mode as default mode. 6) Run initial filemain_init.m to initialize the model parameters 1) Run Fault_Trigger.m to insert the fault, and Regen_Torque_Dir (under Camaro Plant Model-> IMG->Electric Machine) will be set to corresponding mismatch value based on mismatch types. 2) Run the model 3) Check the results obtained in the Scope block for each fault Test Completion: Test Case Summary Expected Results: 1)Record the result 2)Restore the original state of model 3) Run Fault_Clean.m to clean the Regen_Torque_Dir Pass/Fail criteria: 1) MCU_Status=1; 2) esystemstatus=1; 3) Regenerative braking system will be disabled. Under the Component diagnostic-> Motor component diagnostic, Regen_Torque_Dir Mismatch will be 1, and ->systemdiag->esystemdiagnostics, esystemstatus will be 1 when fault triggers; Under Camaro Plant Model->IMG->IMG Plant->Electric Machine, negative torque output will be 0;
98 87 Test Case Overview <Vehicle Direction Fault> Priority: High Version: 1.0 Test Platform: MIL, SIL, HIL Last Updated: 11/4/2016 DFMEA Number: Author: Guilin Zhu Test Case Description: The test simulates the case in which the vehicle does not move in the intended direction when in drive gear. The propulsive net torque will be set to 0, vehicle direction fault will be set to 1; To implement the fault, Vehicle Direction Fault will be inserted into the Camaro Plant Model->Transmission block->transestgear. When commanded shift lever position is in drive, the vehicle will drive in reverse which may cause severe accidents, then the vehicle direction fault will be 1 and vehicle will be shut down. To perform this test, the tester needs to set fault for vehicle direction fault before running the simulation and the fault will be implemented by running fault script. Once the simulation is complete the tester will compare the obtained results with the expected results to determine if the test is passed. The test is considered passed when the simulation results match the expected results. Test Case Procedure Test Initialization: Test Body: 1) under the Input Conversions->DriverInput_Conversions-> Override LvrPosTrnsShft, set control port to 0. 2) undercamaro Fault Detection->Input Conversions->TransEstGear, set control port to 0, override all other signals to normal value. 3) Select the 505 drive cycle from the GUI 4) Set SOC to 90% from the GUI in order to run CD mode as default mode. 5) Run initial filemain_init.m to initialize the model parameters 1) Run Fault_Trigger.m to insert the fault, and Vehicle Direction Fault (under Camaro Plant Model-> Transmission) will set to 1. 2) Run the model 3) Check the results obtained in the Scope block for each fault Test Completion: Test Case Summary Expected Results: 1)Record the result 2)Restore the original state of model 3) Run Fault_Clean.m to clean the Vehicle Direction Fault Pass/Fail criteria: 1) Vehicle speed=0; 2) Motor torque output/engine torque output =0; Under the Signal diagnostic-> Driver signal diagnostic, PRNDL_shift_failed will be 1, and ->systemdiag->esystemdiagnostics, esystemstatus will be 0 and icesystemstatus will also be 0; Under Camaro Plant Model ->Chassis, chas_lin_spd_out, the speed of vehicle will go to 0; Under Camaro Plant Model->IMG->IMG Plant->Electric Machine, mot_trq_out will be 0;

99 88 Appendix B B.1 ECMS Algorithm in MATLAB Figure X Engine and Motor torque control based on ECMS function [Eq_Fuel,Ele_fuel,Mot_Cmd] = fcn(mot_low,mot_upper,engspd,t_req,s_dis,s_chg) %#codegen %#codegen n=0; i=0; Equ=0; Equ_Fuel=0; Mot_Cmd=0; delta=0;
SIL, HIL, and Vehicle Fuel Economy Analysis of a Pre- Transmission Parallel PHEV
 EVS27 Barcelona, Spain, November 17-20, 2013 SIL, HIL, and Vehicle Fuel Economy Analysis of a Pre- Transmission Parallel PHEV Jonathan D. Moore and G. Marshall Molen Mississippi State University Jdm833@msstate.edu
Model-Based Design and Hardware-in-the-Loop Simulation for Clean Vehicles Bo Chen, Ph.D.
 Model-Based Design and Hardware-in-the-Loop Simulation for Clean Vehicles Bo Chen, Ph.D. Dave House Associate Professor of Mechanical Engineering and Electrical Engineering Department of Mechanical Engineering
The MathWorks Crossover to Model-Based Design
 The MathWorks Crossover to Model-Based Design The Ohio State University Kerem Koprubasi, Ph.D. Candidate Mechanical Engineering The 2008 Challenge X Competition Benefits of MathWorks Tools Model-based
INVENTION DISCLOSURE MECHANICAL SUBJECT MATTER EFFICIENCY ENHANCEMENT OF A NEW TWO-MOTOR HYBRID SYSTEM
 INVENTION DISCLOSURE MECHANICAL SUBJECT MATTER EFFICIENCY ENHANCEMENT OF A NEW TWO-MOTOR HYBRID SYSTEM ABSTRACT: A new two-motor hybrid system is developed to maximize powertrain efficiency. Efficiency
Ming Cheng, Bo Chen, Michigan Technological University
 THE MODEL INTEGRATION AND HARDWARE-IN-THE-LOOP (HIL) SIMULATION DESIGN FOR THE ANALYSIS OF A POWER-SPLIT HYBRID ELECTRIC VEHICLE WITH ELECTROCHEMICAL BATTERY MODEL Ming Cheng, Bo Chen, Michigan Technological
HYBRID ELECTRIC VEHICLE SYSTEM MODELING AND CONTROL
 HYBRID ELECTRIC VEHICLE SYSTEM MODELING AND CONTROL Second Edition Wei Liu General Motors, USA WlLEY Contents Preface List of Abbreviations Nomenclature xiv xviii xxii 1 Introduction 1 1.1 Classification
Team Members: Joshua Ax, Michael Krause, Jeremy Lazzari, Marco Peyfuss. Faculty Advisors: Dr. Thomas Bradley, Dr. Sudeep Pasricha
 Team Members: Joshua Ax, Michael Krause, Jeremy Lazzari, Marco Peyfuss Faculty Advisors: Dr. Thomas Bradley, Dr. Sudeep Pasricha Graduate Research Assistants: Jamison Bair, Gabriel DiDomenico, Vipin Kukkala
Building Fast and Accurate Powertrain Models for System and Control Development
 Building Fast and Accurate Powertrain Models for System and Control Development Prasanna Deshpande 2015 The MathWorks, Inc. 1 Challenges for the Powertrain Engineering Teams How to design and test vehicle
Efficiency Enhancement of a New Two-Motor Hybrid System
 World Electric Vehicle Journal Vol. 6 - ISSN 2032-6653 - 2013 WEVA Page Page 0325 EVS27 Barcelona, Spain, November 17-20, 2013 Efficiency Enhancement of a New Two-Motor Hybrid System Naritomo Higuchi,
VTool: A Method for Predicting and Understanding the Energy Flow and Losses in Advanced Vehicle Powertrains
 VTool: A Method for Predicting and Understanding the Energy Flow and Losses in Advanced Vehicle Powertrains Robert Jesse Alley Thesis submitted to the faculty of the Virginia Polytechnic Institute and
DIRECT TORQUE CONTROL OF A THREE PHASE INDUCTION MOTOR USING HYBRID CONTROLLER. RAJESHWARI JADI (Reg.No: M070105EE)
") DIRECT TORQUE CONTROL OF A THREE PHASE INDUCTION MOTOR USING HYBRID CONTROLLER A THESIS Submitted by RAJESHWARI JADI (Reg.No: M070105EE) In partial fulfillment for the award of the Degree of MASTER OF
DIRECT TORQUE CONTROL OF A THREE PHASE INDUCTION MOTOR USING HYBRID CONTROLLER A THESIS Submitted by RAJESHWARI JADI (Reg.No: M070105EE) In partial fulfillment for the award of the Degree of MASTER OF
Five Cool Things You Can Do With Powertrain Blockset The MathWorks, Inc. 1
 Five Cool Things You Can Do With Powertrain Blockset Mike Sasena, PhD Automotive Product Manager 2017 The MathWorks, Inc. 1 FTP75 Simulation 2 Powertrain Blockset Value Proposition Perform fuel economy
Incorporating Drivability Metrics into Optimal Energy Management Strategies for Hybrid Vehicles. Daniel Opila
 Incorporating Drivability Metrics into Optimal Energy Management Strategies for Hybrid Vehicles Daniel Opila Collaborators Jeff Cook Jessy Grizzle Xiaoyong Wang Ryan McGee Brent Gillespie Deepak Aswani,
Modeling and Simulate Automotive Powertrain Systems
 Modeling and Simulate Automotive Powertrain Systems Maurizio Dalbard 2015 The MathWorks, Inc. 1 Model-Based Design Challenges It s hard to do good Model-Based Design without good models Insufficient expertise
Development of Series Mode Control of a Parallel-Series Plug-In Hybrid Electric Vehicle THESIS
 Development of Series Mode Control of a Parallel-Series Plug-In Hybrid Electric Vehicle THESIS Presented in Partial Fulfillment of the Requirements for the Degree Master of Science in the Graduate School
Predictive Control Strategies using Simulink
 Example slide Predictive Control Strategies using Simulink Kiran Ravindran, Ashwini Athreya, HEV-SW, EE/MBRDI March 2014 Project Overview 2 Predictive Control Strategies using Simulink Kiran Ravindran
Lead Acid Batteries Modeling and Performance Analysis of BESS in Distributed Generation
 Murdoch University Faculty of Science & Engineering Lead Acid Batteries Modeling and Performance Analysis of BESS in Distributed Generation Heng Teng Cheng (30471774) Supervisor: Dr. Gregory Crebbin 11/19/2012
Modeling and Simulation of Plug-in Hybrid Electric Powertrain System for Different Vehicular Applications
 Modeling and Simulation of Plug-in Hybrid Electric Powertrain System for Different Vehicular Applications by Rui Cheng B.Eng, Beijing University of Technology, 2012 A Thesis Submitted in Partial Fulfillment
Development of a Series Parallel Energy Management Strategy for Charge Sustaining PHEV Operation
 Development of a Series Parallel Energy Management Strategy for Charge Sustaining PHEV Operation Peter Christopher Manning Thesis submitted to the faculty of the Virginia Polytechnic Institute and State
dspace Embedded Success Greg Jankord Ph.D. Wilson Perez M.S.
 dspace Embedded Success Greg Jankord Ph.D. Wilson Perez M.S. 1 Overview What is EcoCAR? Vehicle Architecture Guided by Model-Based Design xil Process Real Time Development and Data Analysis Future Work
Dr. Charles Kim. EcoCar Team 2 (R.E.V)
") EECE 401 Senior Design I Department of Electrical and Computer Engineering Howard University Dr. Charles Kim EcoCar Team 2 (R.E.V) Katrelle Jones, Seitu Brathwaite, Tarik Wright, Derrick Rumbolt, D Angelo
EECE 401 Senior Design I Department of Electrical and Computer Engineering Howard University Dr. Charles Kim EcoCar Team 2 (R.E.V) Katrelle Jones, Seitu Brathwaite, Tarik Wright, Derrick Rumbolt, D Angelo
Experience the Hybrid Drive
 Experience the Hybrid Drive MAGNA STEYR equips SUV with hybrid drive Hybrid demo vehicle with dspace prototyping system To integrate components into a hybrid vehicle drivetrain, extensive modification
Modeling and Simulating a Performance Hybrid Electric Vehicle
 Modeling and Simulating a Performance Hybrid Electric Vehicle A Thesis Presented in Partial Fulfillment of the Requirements for the Degree Master of Science in the Graduate School of The Ohio State University
Signature of the candidate. The above candidate has carried out research for the Masters Dissertation under my supervision.
 DECLARATION I declare that this is my own work and this dissertation does not incorporate without acknowledgement any material previously submitted for a Degree or Diploma in any other University or institute
Compatibility of STPA with GM System Safety Engineering Process. Padma Sundaram Dave Hartfelder
 Compatibility of STPA with GM System Safety Engineering Process Padma Sundaram Dave Hartfelder Table of Contents Introduction GM System Safety Engineering Process Overview Experience with STPA Evaluation
Plug-in Hybrid Systems newly developed by Hynudai Motor Company
 World Electric Vehicle Journal Vol. 5 - ISSN 2032-6653 - 2012 WEVA Page 0191 EVS26 Los Angeles, California, May 6-9, 2012 Plug-in Hybrid Systems newly developed by Hynudai Motor Company 1 Suh, Buhmjoo
Variable Intake Manifold Development trend and technology
 Variable Intake Manifold Development trend and technology Author Taehwan Kim Managed Programs LLC (tkim@managed-programs.com) Abstract The automotive air intake manifold has been playing a critical role
Development of Engine Clutch Control for Parallel Hybrid
 EVS27 Barcelona, Spain, November 17-20, 2013 Development of Engine Clutch Control for Parallel Hybrid Vehicles Joonyoung Park 1 1 Hyundai Motor Company, 772-1, Jangduk, Hwaseong, Gyeonggi, 445-706, Korea,
Semi-Active Suspension for an Automobile
 Semi-Active Suspension for an Automobile Pavan Kumar.G 1 Mechanical Engineering PESIT Bangalore, India M. Sambasiva Rao 2 Mechanical Engineering PESIT Bangalore, India Abstract Handling characteristics
Modeling and Control of Hybrid Electric Vehicles Tutorial Session
 Modeling and Control of Hybrid Electric Vehicles Tutorial Session Ardalan Vahidi And Students: Ali Borhan, Chen Zhang, Dean Rotenberg Mechanical Engineering, Clemson University Clemson, South Carolina
Type Paper Number Here
 Type Paper Number Here Validation and Analysis of the Fuel Cell Plug-in Hybrid Electric Vehicle Built by Colorado State University for the EcoCAR 2: Plugging into the Future Vehicle Competition Author,
development of hybrid electric vehicles
 IPG Technology Conference Karlsruhe 2012 A multi physical simulation architecture to support the development of hybrid electric vehicles James Chapman CAE Simulation Group Jaguar Land Rover Embedded Systems
COMPREHENSIVE COMPONENTS MONITORING
 Automobili Lamborghini s.p.a. OBDII MY 09 Section 16 Page 1 COMPREHENSIVE COMPONENTS MONITORING Automobili Lamborghini s.p.a. OBDII MY 09 Section 16 Page 2 Description Automobili Lamborghini s.p.a. OBDII
Dylan Lewis Lewton. Dissertations and Theses
 Dissertations and Theses 12-2016 Application of Floating Pedal Regenerative Braking for a Rear-Wheel-Drive Parallel-Series Plug-In Hybrid Electric Vehicle with an Automatic Transmission Dylan Lewis Lewton
MECA0500: PARALLEL HYBRID ELECTRIC VEHICLES. DESIGN AND CONTROL. Pierre Duysinx
 MECA0500: PARALLEL HYBRID ELECTRIC VEHICLES. DESIGN AND CONTROL Pierre Duysinx Research Center in Sustainable Automotive Technologies of University of Liege Academic Year 2017-2018 1 References R. Bosch.
PHEV Control Strategy Optimization Using MATLAB Distributed Computing: From Pattern to Tuning
 PHEV Control Strategy Optimization Using MATLAB Distributed Computing: From Pattern to Tuning MathWorks Automotive Conference 3 June, 2008 S. Pagerit, D. Karbowski, S. Bittner, A. Rousseau, P. Sharer Argonne
MORSE: MOdel-based Real-time Systems Engineering. Reducing physical testing in the calibration of diagnostic and driveabilty features
 MORSE: MOdel-based Real-time Systems Engineering Reducing physical testing in the calibration of diagnostic and driveabilty features Mike Dempsey Claytex Future Powertrain Conference 2017 MORSE project
Low Carbon Technology Project Workstream 8 Vehicle Dynamics and Traction control for Maximum Energy Recovery
 Low Carbon Technology Project Workstream 8 Vehicle Dynamics and Traction control for Maximum Energy Recovery Phil Barber CENEX Technical review 19 th May 2011 Overview of WS8 Workstream 8 was set up to
Integration of EtherCAT in Advanced Test Systems Solutions and Challenges. Dr. Frank Schütte, Andreas Tenge, Dr. László Juhász dspace GmbH, Paderborn
 Integration of EtherCAT in Advanced Test Systems Solutions and Challenges Dr. Frank Schütte, Andreas Tenge, Dr. László Juhász dspace GmbH, Paderborn ETG 2013 Introduction Actual developments in the mobile
Regenerative Braking System for Series Hybrid Electric City Bus
 Page 0363 Regenerative Braking System for Series Hybrid Electric City Bus Junzhi Zhang*, Xin Lu*, Junliang Xue*, and Bos Li* Regenerative Braking Systems (RBS) provide an efficient method to assist hybrid
1) The locomotives are distributed, but the power is not distributed independently.
 The locomotives are distributed, but the power is not distributed independently.") Chapter 1 Introduction 1.1 Background The railway is believed to be the most economical among all transportation means, especially for the transportation of mineral resources. In South Africa, most mines
Chapter 1 Introduction 1.1 Background The railway is believed to be the most economical among all transportation means, especially for the transportation of mineral resources. In South Africa, most mines
OPTIMORE - Optimised Modular Range Extender for every day customer usage AVL SCHRICK project summary
 AVL SCHRICK project summary GA05 / final meeting 18./19. September 2014 Gothenburg, Sweden AVL SCHRICK work packages and deliverables overview Work Package 5 Functional Safety (WP lead) D 5.1 - Item Definition
Accelerated Testing of Advanced Battery Technologies in PHEV Applications
 Page 0171 Accelerated Testing of Advanced Battery Technologies in PHEV Applications Loïc Gaillac* EPRI and DaimlerChrysler developed a Plug-in Hybrid Electric Vehicle (PHEV) using the Sprinter Van to reduce
Understanding the benefits of using a digital valve controller. Mark Buzzell Business Manager, Metso Flow Control
 Understanding the benefits of using a digital valve controller Mark Buzzell Business Manager, Metso Flow Control Evolution of Valve Positioners Digital (Next Generation) Digital (First Generation) Analog
elektronik Designing vehicle power nets A single simulation tool from initial requirements to series production
 www.atzonline.de elektronik 04 April 2013 Volume 8 Offprint from ATZelektronik 4/2013 Springer Automotive Media Springer Fachmedien Wiesbaden GmbH for Bosch Engineering Designing vehicle power nets A single
THE FKFS 0D/1D-SIMULATION. Concepts studies, engineering services and consulting
 THE FKFS 0D/1D-SIMULATION Concepts studies, engineering services and consulting r e s e a r c h i n m o t i o n. VEHICLE IN MOTION On the basis of constant engine speeds and loads, the combustion engine
Design Modeling and Simulation of Supervisor Control for Hybrid Power System
 2013 First International Conference on Artificial Intelligence, Modelling & Simulation Design Modeling and Simulation of Supervisor Control for Hybrid Power System Vivek Venkobarao Bangalore Karnataka
Balancing operability and fuel efficiency in the truck and bus industry
 Balancing operability and fuel efficiency in the truck and bus industry Realize innovation. Agenda The truck and bus industry is evolving Model-based systems engineering for truck and bus The voice of
Increasing Efficiency of Hybrid Electric Vehicles Using Advanced Controls
 Increasing Efficiency of Hybrid Electric Vehicles Using Advanced Controls by Patrick Ellsworth A thesis presented to the University of Waterloo in fulfillment of the thesis requirement for the degree of
Switching Control for Smooth Mode Changes in Hybrid Electric Vehicles
 Switching Control for Smooth Mode Changes in Hybrid Electric Vehicles Kerem Koprubasi (1), Eric Westervelt (2), Giorgio Rizzoni (3) (1) PhD Student, (2) Assistant Professor, (3) Professor Department of
Early Stage Vehicle Concept Design with GT-SUITE
 1/18 Early Stage Vehicle Concept Design with GT-SUITE Katsuya Minami Honda R&D Co., Ltd., Automotive R&D Center, Japan Benefits of 1D-Simulation 2/18 How each component is operating during legislative
Model Based Design: Balancing Embedded Controls Development and System Simulation
 All-Day Hybrid Power On the Job Model Based Design: Balancing Embedded Controls Development and System Simulation Presented by : Bill Mammen 1 Topics Odyne The Project System Model Summary 2 About Odyne
AUTOMOTIVE ELECTRIFICATION
 AUTOMOTIVE ELECTRIFICATION ELECTRIFICATION SOLUTIONS SYSTEM INTEGRATION Markus Maier AVL Europe ITS ELECTRIFICATION TEST SYSTEMS AVL Electrification Test Systems First System sold by 2009 Business Unit
Dual power flow Interface for EV, HEV, and PHEV Applications
 International Journal of Engineering Inventions e-issn: 2278-7461, p-issn: 2319-6491 Volume 4, Issue 4 [Sep. 2014] PP: 20-24 Dual power flow Interface for EV, HEV, and PHEV Applications J Ranga 1 Madhavilatha
APPLICATION OF VARIABLE FREQUENCY TRANSFORMER (VFT) FOR INTEGRATION OF WIND ENERGY SYSTEM
 FOR INTEGRATION OF WIND ENERGY SYSTEM") APPLICATION OF VARIABLE FREQUENCY TRANSFORMER (VFT) FOR INTEGRATION OF WIND ENERGY SYSTEM A THESIS Submitted in partial fulfilment of the requirements for the award of the degree of DOCTOR OF PHILOSOPHY
APPLICATION OF VARIABLE FREQUENCY TRANSFORMER (VFT) FOR INTEGRATION OF WIND ENERGY SYSTEM A THESIS Submitted in partial fulfilment of the requirements for the award of the degree of DOCTOR OF PHILOSOPHY
MECA0500: PLUG-IN HYBRID ELECTRIC VEHICLES. DESIGN AND CONTROL. Pierre Duysinx
 MECA0500: PLUG-IN HYBRID ELECTRIC VEHICLES. DESIGN AND CONTROL Pierre Duysinx Research Center in Sustainable Automotive Technologies of University of Liege Academic Year 2017-2018 1 References R. Bosch.
Development of SPORT HYBRID i-mmd Control System for 2014 Model Year Accord
 Introduction of new Development technologies of SPORT HYBRID i-mmd Control System for 2014 Model Year Accord Development of SPORT HYBRID i-mmd Control System for 2014 Model Year Accord Hirohito IDE* Yoshihiro
Low Carbon Vehicle Technology Program
 Low Carbon Vehicle Technology Program Workstream 6: Vehicle Supervisory Control (VSC) Date: 18 th May 2011 Speaker: Cian Harrington, Cranfield University Workstream team members: Jaguar Land Rover, Ricardo,
HIGH VOLTAGE vs. LOW VOLTAGE: POTENTIAL IN MILITARY SYSTEMS
 2013 NDIA GROUND VEHICLE SYSTEMS ENGINEERING AND TECHNOLOGY SYMPOSIUM POWER AND MOBILITY (P&M) MINI-SYMPOSIUM AUGUST 21-22, 2013 TROY, MICHIGAN HIGH VOLTAGE vs. LOW VOLTAGE: POTENTIAL IN MILITARY SYSTEMS
HIGH-RELIABILITY POUCH CELL CONNECTION AND COST ASPECTS OF A ROBUST BMS SOLUTION
 HIGH-RELIABILITY POUCH CELL CONNECTION AND COST ASPECTS OF A ROBUST BMS SOLUTION 3rd Israeli Power Sources, Batteries, Fuel-Cells, Smart-Grid & EV Conference May 29 th / 30 th 2013, Herzelia Dr. Uwe Wiedemann
Enova Hybrid Systems
 Enova Hybrid Systems Study Guide Study Guide Enova Hybrid Systems EDUCATION 2009 Navistar, Inc. 4201 Winfield Road, Warrenville, IL 60555 All rights reserved. No part of this publication may be duplicated
GRPE/HDH Engine-Base Emissions Regulation using HILS for Commercial Hybrid Vehicles JASIC
 GRPE/HDH-03-04 -Base Emissions Regulation using HILS for Commercial Hybrid Vehicles JASIC 1 Regulation of Emissions from Commercial Vehicles--- Needs for -Base Compared to passenger cars, heavy commercial
Analysis and Design of the Super Capacitor Monitoring System of Hybrid Electric Vehicles
 Available online at www.sciencedirect.com Procedia Engineering 15 (2011) 90 94 Advanced in Control Engineering and Information Science Analysis and Design of the Super Capacitor Monitoring System of Hybrid
ME 455 Lecture Ideas, Fall 2010
 ME 455 Lecture Ideas, Fall 2010 COURSE INTRODUCTION Course goal, design a vehicle (SAE Baja and Formula) Half lecture half project work Group and individual work, integrated Design - optimal solution subject
EMC System Engineering of the Hybrid Vehicle Electric Motor and Battery Pack
 The Southeastern Michigan IEEE EMC Society EMC System Engineering of the Hybrid Vehicle Electric Motor and Battery Pack Presented by: James Muccioli Authors: James Muccioli & Dale Sanders Jastech EMC Consulting,
Optimal energy efficiency, vehicle stability and safety on the OpEneR EV with electrified front and rear axles
 Optimal energy efficiency, vehicle stability and safety on the OpEneR EV with electrified front and rear axles Berlin, Monday 17 June 2013 Dr. Stephen Jones, AVL Emre Kural, AVL Alexander Massoner, AVL
Development of a Multibody Systems Model for Investigation of the Effects of Hybrid Electric Vehicle Powertrains on Vehicle Dynamics.
 Development of a Multibody Systems Model for Investigation of the Effects of Hybrid Electric Vehicle Powertrains on Vehicle Dynamics. http://dx.doi.org/10.3991/ijoe.v11i6.5033 Matthew Bastin* and R Peter
Optimizing Battery Accuracy for EVs and HEVs
 Optimizing Battery Accuracy for EVs and HEVs Introduction Automotive battery management system (BMS) technology has advanced considerably over the last decade. Today, several multi-cell balancing (MCB)
AUTONOMIE [2] is used in collaboration with an optimization algorithm developed by MathWorks.
![AUTONOMIE [2] is used in collaboration with an optimization algorithm developed by MathWorks.](/thumbs/80/80679005.jpg "AUTONOMIE [2] is used in collaboration with an optimization algorithm developed by MathWorks.") Impact of Fuel Cell System Design Used in Series Fuel Cell HEV on Net Present Value (NPV) Jason Kwon, Xiaohua Wang, Rajesh K. Ahluwalia, Aymeric Rousseau Argonne National Laboratory jkwon@anl.gov Abstract
Impact of Fuel Cell System Design Used in Series Fuel Cell HEV on Net Present Value (NPV) Jason Kwon, Xiaohua Wang, Rajesh K. Ahluwalia, Aymeric Rousseau Argonne National Laboratory jkwon@anl.gov Abstract
Design and evaluate vehicle architectures to reach the best trade-off between performance, range and comfort. Unrestricted.
 Design and evaluate vehicle architectures to reach the best trade-off between performance, range and comfort. Unrestricted. Introduction Presenter Thomas Desbarats Business Development Simcenter System
WHITE PAPER. Preventing Collisions and Reducing Fleet Costs While Using the Zendrive Dashboard
 WHITE PAPER Preventing Collisions and Reducing Fleet Costs While Using the Zendrive Dashboard August 2017 Introduction The term accident, even in a collision sense, often has the connotation of being an
University Of California, Berkeley Department of Mechanical Engineering. ME 131 Vehicle Dynamics & Control (4 units)
") CATALOG DESCRIPTION University Of California, Berkeley Department of Mechanical Engineering ME 131 Vehicle Dynamics & Control (4 units) Undergraduate Elective Syllabus Physical understanding of automotive
CATALOG DESCRIPTION University Of California, Berkeley Department of Mechanical Engineering ME 131 Vehicle Dynamics & Control (4 units) Undergraduate Elective Syllabus Physical understanding of automotive
CHAPTER 1 INTRODUCTION
 CHAPTER 1 INTRODUCTION 1.1 CONSERVATION OF ENERGY Conservation of electrical energy is a vital area, which is being regarded as one of the global objectives. Along with economic scheduling in generation
Construction of a Hybrid Electrical Racing Kart as a Student Project
 Construction of a Hybrid Electrical Racing Kart as a Student Project Tobias Knoke, Tobias Schneider, Joachim Böcker Paderborn University Institute of Power Electronics and Electrical Drives 33095 Paderborn,
Real-world to Lab Robust measurement requirements for future vehicle powertrains
 Real-world to Lab Robust measurement requirements for future vehicle powertrains Andrew Lewis, Edward Chappell, Richard Burke, Sam Akehurst, Simon Pickering University of Bath Simon Regitz, David R Rogers
Contents. Preface... xiii Introduction... xv. Chapter 1: The Systems Approach to Control and Instrumentation... 1
 Contents Preface... xiii Introduction... xv Chapter 1: The Systems Approach to Control and Instrumentation... 1 Chapter Overview...1 Concept of a System...2 Block Diagram Representation of a System...3
Optimal Control Strategy Design for Extending. Electric Vehicles (PHEVs)
") Optimal Control Strategy Design for Extending All-Electric Driving Capability of Plug-In Hybrid Electric Vehicles (PHEVs) Sheldon S. Williamson P. D. Ziogas Power Electronics Laboratory Department of Electrical
Optimal Control Strategy Design for Extending All-Electric Driving Capability of Plug-In Hybrid Electric Vehicles (PHEVs) Sheldon S. Williamson P. D. Ziogas Power Electronics Laboratory Department of Electrical
Developing a Methodology for Certifying Heavy Duty Hybrids based on HILS
 Developing a Methodology for Certifying Heavy Duty Hybrids based on HILS 1 Working Paper No. HDH-10-05 (10th HDH meeting, 05 June 2012) Developing a Methodology for Certifying Heavy Duty Hybrids based
Battery Evaluation for Plug-In Hybrid Electric Vehicles
 Battery Evaluation for Plug-In Hybrid Electric Vehicles Mark S. Duvall Electric Power Research Institute 3412 Hillview Avenue Palo Alto, CA 9434 Abstract-This paper outlines the development of a battery
Vehicle Performance. Pierre Duysinx. Research Center in Sustainable Automotive Technologies of University of Liege Academic Year
 Vehicle Performance Pierre Duysinx Research Center in Sustainable Automotive Technologies of University of Liege Academic Year 2015-2016 1 Lesson 4: Fuel consumption and emissions 2 Outline FUEL CONSUMPTION
PARALLEL HYBRID ELECTRIC VEHICLES: DESIGN AND CONTROL. Pierre Duysinx. LTAS Automotive Engineering University of Liege Academic Year
 PARALLEL HYBRID ELECTRIC VEHICLES: DESIGN AND CONTROL Pierre Duysinx LTAS Automotive Engineering University of Liege Academic Year 2015-2016 1 References R. Bosch. «Automotive Handbook». 5th edition. 2002.
INTELLIGENT ENERGY MANAGEMENT IN A TWO POWER-BUS VEHICLE SYSTEM
 2011 NDIA GROUND VEHICLE SYSTEMS ENGINEERING AND TECHNOLOGY SYMPOSIUM MODELING & SIMULATION, TESTING AND VALIDATION (MSTV) MINI-SYMPOSIUM AUGUST 9-11 DEARBORN, MICHIGAN INTELLIGENT ENERGY MANAGEMENT IN
MODELING AND SIMULATION OF A HYBRID ELECTRIC VEHICLE SYSTEM
 MODELING AND SIMULATION OF A HYBRID ELECTRIC VEHICLE SYSTEM by Eng. Hala Shaban Mohamed Khalil Electronics Research Institute A Thesis Submitted To The Faculty of Engineering at Cairo University In Partial
Our Approach to Automated Driving System Safety. February 2019
 Our Approach to Automated Driving System Safety February 2019 Introduction At Apple, by relentlessly pushing the boundaries of innovation and design, we believe that it is possible to dramatically improve
University of New Hampshire: FSAE ECE Progress Report
 University of New Hampshire: FSAE ECE Progress Report Team Members: Christopher P. Loo & Joshua L. Moran Faculty Advisor: Francis C. Hludik, Jr., M.S. Courses Involved: ECE 541, ECE 543, ECE 562, ECE 633,
AVL SERIES BATTERY BENCHMARKING. Getting from low level parameter to target orientation
 1 AVL SERIES BATTERY BENCHMARKING Getting from low level parameter to target orientation CONTENTS OVERVIEW 1. AVL Introduction 2. Focus Series Battery Benchmarking 3. Benchmarking process 4. Target comparability
STRYKER VEHICLE ADVANCED PROPULSION WITH ONBOARD POWER
 2018 NDIA GROUND VEHICLE SYSTEMS ENGINEERING AND TECHNOLOGY SYMPOSIUM POWER & MOBILITY (P&M) TECHNICAL SESSION AUGUST 7-9, 2018 - NOVI, MICHIGAN STRYKER VEHICLE ADVANCED PROPULSION WITH ONBOARD POWER Kevin
A GENERAL PURPOSE VEHICLE POWERTRAIN MODELING AND SIMULATION SOFTWARE - VPSET
 A GENERAL PURPOSE VEHICLE POWERTRAIN MODELING AND SIMULATION SOFTWARE - VPSET ASHOK NEDUNGADI, SwRI, USA, Anedungadi@swri.edu MIKE POZOLO, US ARMY, TARDEC, USA MIKE MIMNAGH, NSWC, USA ABSTRACT VPSET (Vehicle
Intelligent Energy Management System Simulator for PHEVs at a Municipal Parking Deck in a Smart Grid Environment
 Intelligent Energy Management System Simulator for PHEVs at a Municipal Parking Deck in a Smart Grid Environment Preetika Kulshrestha, Student Member, IEEE, Lei Wang, Student Member, IEEE, Mo-Yuen Chow,
ESTIMATION OF VEHICLE KILOMETERS TRAVELLED IN SRI LANKA. Darshika Anojani Samarakoon Jayasekera
 ESTIMATION OF VEHICLE KILOMETERS TRAVELLED IN SRI LANKA Darshika Anojani Samarakoon Jayasekera (108610J) Degree of Master of Engineering in Highway & Traffic Engineering Department of Civil Engineering
Using Trip Information for PHEV Fuel Consumption Minimization
 Using Trip Information for PHEV Fuel Consumption Minimization 27 th International Battery, Hybrid and Fuel Cell Electric Vehicle Symposium (EVS27) Barcelona, Nov. 17-20, 2013 Dominik Karbowski, Vivien
Integration of complex Modelica-based physics models and discrete-time control systems: Approaches and observations of numerical performance
 Integration of complex Modelica-based physics models and discrete-time control systems: Approaches and observations of numerical performance Kai Wang 1 Christopher Greiner 1 John Batteh 2 Lixiang Li 2
Plug-in Hybrid Electric Vehicle Control Strategy Parameter Optimization
 Plug-in Hybrid Electric Vehicle Control Strategy Parameter Optimization Aymeric Rousseau 1, Sylvain Pagerit 2, and David Wenzhong Gao 3 1 Center for Transportation Research, Argonne National Laboratory,
B60W. Definition statement. Relationships with other classification places CPC - B60W
 B60W CONJOINT CONTROL OF VEHICLE SUB-UNITS OF DIFFERENT TYPE OR DIFFERENT FUNCTION; CONTROL SYSTEMS SPECIALLY ADAPTED FOR HYBRID VEHICLES; ROAD VEHICLE DRIVE CONTROL SYSTEMS FOR PURPOSES NOT RELATED TO
DYNA4 Open Simulation Framework with Flexible Support for Your Work Processes and Modular Simulation Model Library
 Open Simulation Framework with Flexible Support for Your Work Processes and Modular Simulation Model Library DYNA4 Concept DYNA4 is an open and modular simulation framework for efficient working with simulation
Using ABAQUS in tire development process
 Using ABAQUS in tire development process Jani K. Ojala Nokian Tyres plc., R&D/Tire Construction Abstract: Development of a new product is relatively challenging task, especially in tire business area.
THERMAL MANAGEMENT SYNERGY THROUGH INTEGRATION PETE BRAZAS
 THERMAL MANAGEMENT SYNERGY THROUGH INTEGRATION PETE BRAZAS 1 Propulsion System Trends Evolution of the TMM A Closer Look at Electrification System Integration Approach Outlook Powertrain Technology Roadmap
Automobile Body, Chassis, Occupant and Pedestrian Safety, and Structures Track
 Automobile Body, Chassis, Occupant and Pedestrian Safety, and Structures Track These sessions are related to Body Engineering, Fire Safety, Human Factors, Noise and Vibration, Occupant Protection, Steering
Modern Auto Tech Study Guide Chapter 38 Pages Hybrid Drive Systems 48 Points. Automotive Service
 Modern Auto Tech Study Guide Chapter 38 Pages 694 723 Hybrid Drive Systems 48 Points Automotive Service Hybrid abbreviated version of hybrid electric vehicle (HEV); a type of vehicle that uses two types
Next-generation Inverter Technology for Environmentally Conscious Vehicles
 Hitachi Review Vol. 61 (2012), No. 6 254 Next-generation Inverter Technology for Environmentally Conscious Vehicles Kinya Nakatsu Hideyo Suzuki Atsuo Nishihara Koji Sasaki OVERVIEW: Realizing a sustainable