#H1_2017 Orange financial results
|
|
|
- Clinton Collins
- 5 years ago
- Views:
Transcription


1 #H1_2017 Orange financial results Stéphane Richard Chairman and CEO Ramon Fernandez Deputy CEO, Chief Financial and Strategy Officer 27 July 2017
2 Disclaimer This presentation contains forward-looking statements about Orange. Although we believe these statements are based on reasonable assumptions, they are subject to numerous risks and uncertainties, including matters not yet known to us or not currently considered material by us, and there can be no assurance that anticipated events will occur or that the objectives set out will actually be achieved. Important factors that could cause actual results to differ from the results anticipated in the forward-looking statements include, among others: the success of Orange s strategy, particularly its ability to maintain control over customer relations when facing competition with OTT players, risks related to banking activities, loss or disclosure to third parties of customers data, Orange s ability to withstand intense competition in mature markets, networks or software failures due to cyberattacks, damage to networks caused by natural disasters, terrorist acts or other reasons, various frauds affecting Orange or its clients, Orange s ability to retain the necessary skills given the high level of employee retirements and the development of new needs, difficulties in integrating newly acquired businesses as part of the telecommunication sector s consolidation in Europe, its ability to capture growth opportunities in emerging markets and the risks specific to those markets, possible adverse health effects associated with the use of telecommunications equipment, risks related to the single brand strategy, the eruption of a global financial or economic crisis, fiscal and regulatory constraints and changes, the results of litigation regarding regulations, competition and other matters, disagreements with its co-shareholders in companies that Orange does not control, the terms of access to capital markets, interest rate or exchange rate fluctuations, Orange's credit ratings, changes in assumptions underlying the accounting value of certain assets resulting in their impairment, and credit risks or counterparty risks on financial transactions. More detailed information on the potential risks that could affect our financial results is included in the Registration Document filed on April 6, 2017 with the French Autorité des Marchés Financiers (AMF) and in the annual report on Form 20-F filed on April 7, 2017 with the U.S. Securities and Exchange Commission. Forward-looking statements speak only as of the date they are made. Other than as required by law, Orange does not undertake any obligation to update them in light of new information or future developments. 2
3 Section one H highlights
4 2017* H1 2017* Revenue 20.3 bn +1.4% + 138m +1.1% + 222m H Group achievements Adjusted EBITDA ** 6.0 bn 2017* +2.4% +79 m 2017* H1 2017* +2.2% +130 m H1 2017* Capex 3.3 bn +3.8% +65 m +3.0% +95 m yoy : comparison with the same period of the previous year, on a comparable basis unless otherwise specified All Group level mentions include both telecom and banking activities. Conversely, all mentions excluding Orange bank are explicitly called Telecom ** see slide 29 for EBITDA adjustments Net debt / Adjusted EBITDA 1.92x H x ytd 4 * yoy cb

5 Sustained investment efforts to keep our competitive advantage in connectivity % of population covered by 4G and yoy growth 99.8% 99.6% 98% 93% 92% 87% 80.1% +4.4pt +0.5pt +3pt +4pt +10pt +13pt +9pt Poland Belgium Moldova Spain France Romania Slovakia FTTH connectable homes yoy H CAPEX 3.3bn +3.0% yoy +95m yoy Telecom yoy +2.2% + 70m As % of rev. 16.0% +0.2pt yoy Spain 10.7 m +28% France 7.9 m +34% Poland 2.0 m x2 5


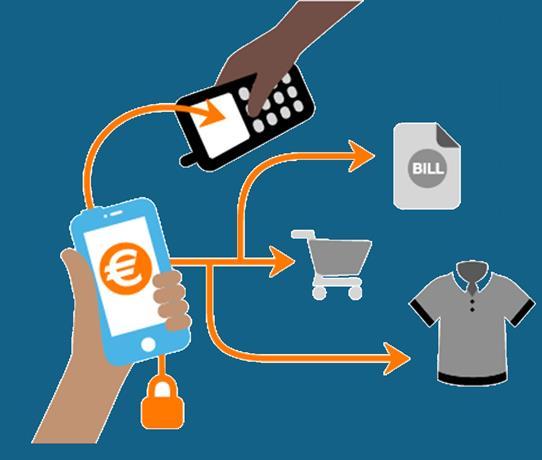
6 and content Enriching connectivity through mobile finance 6
7 Section two Financial results overview


 and a mobile voice contract. -2.")

8 Convergence, the bedrock of our commercial performance Convergent B2C customer base in m % of broadband B2C customer base France Spain Poland % +5% +51% % % % Churn improvement with convergence* Convergence: client with an offer combining at least one broadband access (xdsl, FTTx or LTE4Fixed with cell-lock) and a mobile voice contract. -2.5pts -7pts -3pts B2C billed services quarterly ARPCO (Average Revenue Per Convergent Offer), in /month % yoy % yoy % yoy Convergent billed service revenue B2C yoy growth +9% +13% +26% 8 * Churn differential between convergent B2C customers and total fixed BB B2C customers
9 Acceleration of revenue growth, in almost all our footprint Group revenue growth yoy +0.5% +0.1% +0.6% +0.0% +0.8% +1.0% +0.8% +1.4% -0.9% -0.2% Q3 15 Q Q3 16 Q revenue evolution, telecom (in m) H revenue* 20.3bn % + 138m H % + 222m 10, Europe: + 129m ,210 * Orange Bank Net Banking Income is not included in Group revenues but in Group other operating income 9 16 cb France Spain Poland Belgium & Lux. Central Europe Africa Enterprise IC&SS 17 Middle eliminations East
10 Growth in adjusted EBITDA driven by revenue growth and cost efficiency Adjusted Ebitda growth (telecom, yoy in %) +1.6% +1.7% +0.1% +1.6% +4.8% +2.2% +2.4% -2.1% -1.2% -1.6% Q3 15 Q Q3 16 Q Adjusted EBITDA evolution (telecom, in m) adjusted EBITDA margin (telecom, in %) H Adjusted EBITDA (telecom) 2017 yoy +2.5% + 83m H yoy +2.4% + 140m 3, , bn As % of rev. 33.2% +0.4pt yoy As % of rev. 29.6% +0.4pt yoy 32.9% 33.2% cb Revenues growth Costs evolution 17
11 Operational efficiency plan in France supports increase in adjusted EBITDA margin +1.0 pt H1 17 adjusted EBITDA margin yoy evolution in France Non exhaustive list of KPIs Customer management efficiency program % digital interactions out of total care in June 49.8% (+7p yoy) % digital in total commercial transactions in June 27.5% (+5p yoy) «Orange et moi» app : unique visitors in June 4.7m (+31% yoy) Change in # of customer service calls in H1 Distribution and sales efficiency program sales commission costs in H1 Cost efficiency program % commercial transactions / total transactions in stores in H % yoy -34% yoy 49% (+4pt yoy) program total gross savings yoy in H1-64m - 18m Customer related network production & maintenance efficiency program Explore 2020 number of reported failures on fixed lines (retail market) in H1 IT management efficiency program -3.6% yoy - 44m change in IT operations management costs -6% yoy - 29m 11
12 Excluding the effect resulting from BT shares, net income from continuing activities grew by 105m, up +10% yoy 1, m m 127 1, Adjusted EBITDA improvement yoy Less EBITDA adjustments* than in H In 2016, positive effect of the tax litigation on the share of fees and expenses 4. 4 Effect resulting from BT shares (loss on partial disposal of BT and depreciation of retained BT shares) Net income from continuing activities H Change in reported EBITDA (cb) Change in income tax Change in Others Net income from continuing activities H before BT Effect from BT shares Net income from continuing activities H * see details on slide 29
13 Net debt to Adjusted EBITDA ratio fully in line with the guidance of 2x in the medium term in bn change in working capital and fixed asset payables net financial interests paid income tax paid other operational and financial elements spectrum and licences paid dividends paid to minority interests coupons on subordinated notes Net debt end of 2016 Adj. EBITDA - CAPEX Telecom Dividend paid to ORA shareholders Net debt end of June 2017 before partial disposal of BT shares Partial disposal of BT shares Net debt end of June x Net Debt / Adjusted EBITDA Telecom 1.92x 13
14 Section three Business review
15 2017 France Total revenues stabilized, with growth in fixed compensating pressure in mobile in m 17 yoy cb H1 17 yoy cb Revenues 4, % 8, % mobile services 1, % 3, % mobile equipment % % fixed services 2, % 5, % other revenues % % Adjusted EBITDA 3, % Adjusted EBITDA margin 35.7% +1.0pt CAPEX 1, % CAPEX/revenues 18.1% +0.2pt Revenue evolution (yoy in %) 10% 5% 0% -5% -10% -15% 16 Total -1.6% Broadband services -0.5% Q % Q4 16 Mobile services -0.1% 17 PSTN +5.0% +0.5% -1.1% -10.1% 17 Broadband ARPU Quarterly ARPU YoY evolution 33.8 Mobile ARPU Quarterly ARPU YoY evolution 21.7 Convergence (B2C) 15 * Churn differential between convergent B2C customers and total fixed BB B2C customers +0.4% % 16 Quarterly billed services ARPCO, /month % yoy o/w Open : 64.2 ; +0.5%yoy +1.6% Q % Q % Q % Q % % 17 Revenues +9% +1.4% % 17 Number of mobile lines per convergent offer Churn differential* yoy -2.5 pts
16 2017 France commercial performance Strong net adds in mobile and broadband despite a very competitive environment Mobile contract net adds (in 000s) and churn rate net adds excl M2M quarterly churn rate in % Fixed BB net adds (in 000s) FTTH ADSL and others % 11.4% Q3 16 Q % of broadband B2C customers are on convergent offers (+3pt yoy) Q Q % of FTTH net adds are new clients 92% of 4G population coverage (+10pts yoy) #1 position 7.9m of FTTH connectable homes (+34% yoy) 67% 72% of B2C voice contract customers have a 4G plan (+15pts yoy) of B2C mobile-voice contracts are on SIM-only offers (+14pt yoy) 1.7m of FTTH customers (+43% yoy) of retail BB customers are on 41.5% high-end offers * (+1.8pt yoy) 16 *Play and Jet

17 2017 Spain Revenue and EBITDA growth driven by growth in customer base, ARPU and Wholesale +3.5% in m 17 yoy cb H1 17 yoy cb Revenues 1, % 2, % mobile services % 1, % mobile equipment % % fixed services % 1, % other revenues % % Adjusted EBITDA % Adjusted EBITDA margin 27.5% +1.6pt CAPEX % CAPEX/revenues 20.5% -2.1pt Revenue evolution** (yoy in %) Total Broadband services Mobile services Broadband ARPU Quarterly ARPU, /month 32 Mobile ARPU Quarterly ARPU, /month 14, , Q3 16 Q Q % 13,5 13,6 Q , % 10% 9% 8% +7.8% +7.9% +8.5% +8.8% +8.3% Convergence (B2C) Quarterly billed services ARPCO, /month % yoy Revenues +13% 7% +6.2% 0% 16 Q3 16 Q % 17 Number of mobile lines per convergent offer Churn differential* yoy -7 pts 17 ** Starting 2017, fixed LTE is reported in fixed broadband (previously in mobile) * Churn differential between convergent B2C customers and total fixed BB B2C customers
18 2017 Spain commercial performance Strong performance on mobile post-paid thanks to more for more strategy Mobile contract net adds and churn rate net adds in 000s quarterly churn rate in % Fixed BB net adds (in 000s) FTTH ADSL and others 16.3% 18% Q Q % of broadband B2C customers are on convergent offers (+1.3pt yoy) Q3 16 Q m 4G customers (+35% yoy) 10.7m FTTH connectable homes (+2.4m yoy) 99% of B2C mobile voice contract are on SIM-only offers 1.95m FTTH customers (x1.6 yoy) 47% penetration of the FBB base 3.1m B2C broadband convergent customers (+154k yoy) 541k TV customers 13% penetration of the FBB base 18
19 2017 Poland Strong success of convergent offers sustaining fixed and mobile net adds in m 17 yoy cb H1 17 yoy cb Revenues % 1, % mobile services % % mobile equipment % % fixed services % % other revenues % % Adjusted EBITDA % Adjusted EBITDA margin 27.7% -1.9pt CAPEX % CAPEX/revenues 14.5% -0.4pt 43% 2.0m FTTH connectable homes yoy x2 Fixed Broadband +9% 2.3m customers Broadband B2C convergent customers +12pt +191 Mobile contract net adds* in 000s Fixed broadband net adds* in 000s Convergence (B2C) Quarterly billed services ARPCO, /month % yoy Revenues +26% * Starting 2017, wireless for fixed is reported in fixed broadband (previously in mobile) Number of mobile lines per convergent offer Churn differential** yoy -3 pts ** Churn differential between convergent B2C customers and total fixed BB B2C customers
20 2017 Belgium & Luxembourg Strong mobile contract net adds with ARPU growth thanks to more for more strategy yoy in m 17 yoy cb H1 17 yoy cb Revenues % % mobile services % % mobile equipment % % fixed services % % other revenues % % Adjusted EBITDA % Adjusted EBITDA margin 25.5% +1.7pt CAPEX % CAPEX/revenues 12.5% +2.3pt 50% % of active 4G customers +30pts Fixed Broadband x2.4 88k customers 64k Orange Love customers x6 Belgium mobile contract net adds excl. M2M in 000s Belgium contract ARPU growing despite EU roaming Quarterly ARPU, yoy growth +2.1% +2.8% % +1.0% % 16 Q3 16 Q Q3 16 Q
21 2017 Central European countries Solid service revenue growth boosted by data monetization and smartphone penetration in m 17 yoy cb H1 17 yoy cb Revenues % % mobile services % % mobile equipment % % fixed services % % other revenues % % Adjusted EBITDA % Adjusted EBITDA margin 35.9% +0.6pt CAPEX % CAPEX/revenues 11.7% -2.0pt 3.9m 4G customers yoy +60% Fixed Broadband +22%* 337k customers Revenue growth boosted by Romania (yoy in %) Total Central Europe Romania Slovakia Moldova 15% Central Europe mobile contract net adds (excl. M2M) in 000s % 5% +11.0% +7.1% +4.4% % -5% +0.1% 16-10% 16 Q3 16 Q Q3 16 Q * * At comparable base as wireless for fixed is reported in fixed broadband starting 2017
22 2017 Africa & Middle East Upswing in both commercial dynamic and revenue growth in m 17 yoy cb H1 17 yoy cb Revenues 1, % 2, % mobile services 1, % 2, % mobile equipment % % fixed services % % other revenues % % Adjusted EBITDA % Adjusted EBITDA margin 30.7% -0.2pt CAPEX % Capex/revenues 17.2% +2.2pt New business drivers continue to sustain growth +65% Orange Money revenue growth yoy in 32m customers 10m active customers in last 30 days Revenues growth in % +2.3% +2.5% +2.7% +1.6% +0.7% 16 Q3 16 Q Mobile net adds in m Q3 16 Q % Data revenue growth yoy in 4G available in 11 countries +6% B2B revenue growth yoy in 22
23 2017 Enterprise Better than with IT and integration services partially offsetting legacy trends in m 17 yoy cb H1 17 yoy cb Revenues 1, % 3, % voice % % data % 1, % IT&IS % 1, % mobile % % Adjusted EBITDA % Adjusted EBITDA margin 17.4% -0.6pt CAPEX % CAPEX/revenues 4.9% +0.3pt Security revenue growth Cloud revenue growth +27% yoy +15% yoy Mobile contract net adds excl.m2m (mostly in France) Revenues per segment (yoy in %) 6.0% Total Voice & Data & Mobile IT & integration services +3.3% % 0.0% -0.2% +0.2% -0.1% -2.0% -1.3% % -3.0% -6.0% 16 Q316 Q Q3 16 Q
24 Section four 2017 guidance


25 Group adjusted EBITDA 2017 > 2016 comparable basis 2017 guidance confirmed Net debt / Adjusted EBITDA Telecom Around 2x in the medium term 2017 dividend* *subject to shareholders approval **ex-date December 5th, record date December 6th, payment date December 7th Dividend 0.65 December 7 th, 2017** 2017 interim of 0.25 M&A policy Selective with focus on existing footprint 25
26 Appendices
27 Appendix: B2C + B2B Orange customers in France Mobile KPIs (in thousands) Q3 16 Q Mobile customers (excl. MVNOs) 28,612 28,966 29,508 30,033 30,489 31,150 Contract 24,581 25,069 25,759 26,486 27,090 27,842 M2M 4,277 4,611 5,115 5,711 6,228 6,829 Excluding M2M 20,305 20,457 20,644 20,775 20,862 21,012 Prepaid 4,030 3,897 3,748 3,547 3,398 3,308 Mobile volume market share (in %)* 35.1% 35.3% 35.4% 35.5% 35.7% 35,9% Fixed KPIs (in thousands) Q3 16 Q Broadband customers 10,830 10,923 11,056 11,151 11,220 11,290 o/w xdsl 9,698 9,686 9,693 9,643 9,587 9,548 o/w FTTH customers 1,075 1,181 1,308 1,452 1,579 1,690 Broadband market share (in %)* 40.0% 40.1% 40.3% 40.2% 40.2 % 40.2% Net adds broadband market share (in %)* 45.3% 64.2% 58.1% 36.8% 37.0% >40% * Numbers for the latest quarter are company estimates. 27
28 Revenues yoy evolution France Group Spain Poland Central European countries Africa & the Middle-East Enterprise -4% -3% -2% -1% 0% 1% 2% +1.4% % Q4 +1.0% Q3 +0.8% 0.0% % Q4 +0.1% Q3 +0.5% -0.2% % Q4-0.6% Q3-2.3% -3.4% % yoy Europe Belgium & Luxemburg 28-2% -1% 0% 1% 17 Q4 Q % 0% 2% 4% 6% 8% 10% 17 Q3Q4 16 Q3Q4 15 Q3Q % -10% -5% 0% 5% 17 Q3Q4 16 Q3Q4 15 Q3Q % -2% -1% 0% 1% 2% Q3 Q % -10% -5% 0% 5% 10% Q4 Q3Q4 17 Q3Q4 14 Q3 +8.8% -8% -6% -4% -2% 0% 2% 14 Q3Q4 15 Q3Q4-2.2% 17 Q3Q % -15% -10% -5% 0% 5% Q3 15 Q3Q4 17 Q3Q4 16 Q4 +3.5% % -7.5% -5.0% -2.5% 2.5% 5.0% 7.5% 14 Q4 Q3 15 Q4 Q3 16 Q4 Q %
29 EBITDA adjustments in m 16 cb 17 actual H1 16 cb H1 17 actual Adjusted EBITDA 3,300 3,380 5,848 5,978 restructuring and integration litigations labour related o\w Senior Part Time portfolio review and others Reported EBITDA 3,023 3,201 5,461 5,778 29
30 Excluding the effect resulting from BT shares, net income from continuing activities grew by 105 m H H H in m historical cb actual adjusted EBITDA 5,913 5,848 5,978 adjustments* reported EBITDA 5,592 5,461 5,778 depreciation & amortization -3,279-3,351 impairment of goodwill & assets share of profit (losses) of associates 0 3 operating income 2,141 2,434 effects resulting from BT shares -349 financial result (excluding BT) tax net income from continuing activities 1, net income from discontinued activities 2,249 net income from consolidated Group 3, minority interests net income Group share 3, * see details on slide 28
31 High liquidity as of 30 June 2017 combined with a balanced repayment profile Bonds*/bank loans/leases repayment as of 30 June 2017 (Telecom, in bn) Liquidity position as of 30 June 2017 (Telecom, in bn) bonds exchangeable bonds bank loans & others 14,3 14,3 0,9 0,4 3,6 3,1 4,9 4,4 2,1 1,3 3,5 2,5 0,6 13,2 8,0 6,3 S * after hedging >2021 cash available credit lines liquidity position as of 30 June 2017 Current rating of long term debt Gross debt structure Strong liquidity position of 14.3bn as of 30 June 2017, 8bn in cash. Pro-active and opportunistic liability management: Moody s S&P Fitch ratings Baa1 stable BBB+ stable BBB+ stable 89% with fixed rate 80% in bonds (after hedging) in March, bond issuance of years, with a coupon of 0.75% and years with a coupon of 1.5%, and in June, issuance of bonds exchangeable in BT shares for 517m GBP, with a 2021 maturity and negative interest rate after return in euro.
#Q3_2017 Orange financial results
 #Q3_2017 Orange financial results Ramon Fernandez Deputy CEO, Chief Financial and Strategy Officer 26 October 2017 Disclaimer This presentation contains forward-looking statements about Orange. Although
#FY_2017. Orange financial results. Stéphane Richard Chairman and CEO. Ramon Fernandez Deputy CEO, Chief Financial and Strategy Officer
 #FY_2017 Orange financial results Stéphane Richard Chairman and CEO Ramon Fernandez Deputy CEO, Chief Financial and Strategy Officer 21 February 2018 Disclaimer This presentation contains forward-looking
#Q3_2018. Orange financial results. Ramon Fernandez Deputy CEO, Finance, Performance and Europe. 25 October 2018
 #Q3_20 Orange financial results Ramon Fernandez Deputy CEO, Finance, Performance and Europe 25 October 20 Disclaimer This presentation may contain forward-looking statements about Orange, particularly
#FY2015. Orange financial results. Stéphane Richard Chairman and CEO. Ramon Fernandez Deputy CEO, Chief Financial and Strategy Officer
 #FY2015 Orange financial results Stéphane Richard Chairman and CEO Ramon Fernandez Deputy CEO, Chief Financial and Strategy Officer 16th February 2016 disclaimer This presentation contains forward-looking
#Q3_2015. Orange financial results. Ramon Fernandez Deputy CEO, Chief Financial and Strategy Officer. 22nd October 2015
 #Q3_2015 Orange financial results Ramon Fernandez Deputy CEO, Chief Financial and Strategy Officer 22nd October 2015 disclaimer This presentation contains forward-looking statements about Orange. Although
#H1_2015. Orange financial results. Stéphane Richard. Ramon Fernandez Deputy CEO, Chief Financial and Strategy Officer.
 #H1_2015 Orange financial results Stéphane Richard Chairman and CEO Ramon Fernandez Deputy CEO, Chief Financial and Strategy Officer 28th July 2015 disclaimer This presentation contains forward-looking
Orange Investors data book
 Orange Investors data book 2Q 2018 Table of contents Definitions Sheet 1 2 Group Sheet 2 Profit & loss statement, operating cash flow and capital evolution 4 Sheet 3 Cash flow statement of telecoms activities
Orange investors data book
 Orange investors data book table of contents definitions sheet 1 Group sheet 2 consolidated profit & loss and capital evolution statements sheet 3 consolidated cash flows statements sheet 4 comparable
Orange investors data book
 ² Orange investors data book table of contents definitions sheet 1 Group sheet 2 consolidated profit & loss, operating cash flow and capital evolution statements sheet 3 consolidated cash flows statements
2017 Q3 results. Millicom International Cellular S.A. Mauricio Ramos, CEO Tim Pennington, CFO October 25, 2017
 2017 Q3 results Millicom International Cellular S.A. Mauricio Ramos, CEO Tim Pennington, CFO October 25, 2017 Disclaimer This presentation may contain certain forward-looking statements with respect to
1 st Half 2018 Results. August 1 st, 2018
 1 st Half 2018 Results August 1 st, 2018 H1 HIGHLIGHTS & CATEGORY SPOTLIGHTS Gonzalve BICH 2 First Half 2018 Key Messages Challenging market and business environment Continued investment in targeted Brand
2018 Q3 results. Millicom International Cellular S.A. Cable expansion accelerating. Mauricio Ramos, CEO Tim Pennington, CFO October 24 th, 2018
 2018 Q3 results Cable expansion accelerating Mauricio Ramos, CEO Tim Pennington, CFO October 24 th, 2018 Millicom International Cellular S.A. Disclaimer This presentation may contain certain forward-looking
Q3 & 9M 2018 Results Presentation. October 24 th, 2018
 Q3 & 9M 2018 Results Presentation October 24 th, 2018 Q3 & 9M HIGHLIGHTS & CATEGORY SPOTLIGHTS Gonzalve BICH 3Q and 9M 2018 Results Presentation 2 9 Months 2018 Key Messages Continued challenging trading
I remind you that our presentation is available on our website. We can start from the first 2 slides that show Piaggio Group First
 CONFERENCE CALL 2009 1 st HALF RESULTS Good afternoon and welcome to everybody. I remind you that our presentation is available on our website. We can start from the first 2 slides that show Piaggio Group
PT Indosat Tbk 1H 2014 Results
 PT Indosat Tbk 1H 2014 Results Agenda Financial and Operational Highlights Management Focus and Key Updates Supplemental Information 2 Financial and Operational Highlights 1H14 YoY Overview Consolidated
Strong performance by the Bolloré Group s operating activities in 2018 Mr Cyrille Bolloré unanimously appointed Chairman and Chief Executive Officer
 PRESS RELEASE 2018 results (1) March 14, 2019 Strong performance by the Bolloré Group s operating activities in 2018 Mr Cyrille Bolloré unanimously appointed Chairman and Chief Executive Officer Revenue:
4Q16/FY16 Financial and operating data *
 4Q16/FY16 Financial and operating data * Index Disclaimer Key Financial data by BU FY Key Financial data by BU quarter Domestic Business Results Domestic Wireline Results Domestic Mobile Results TIM Brasil
Valvoline Fourth-Quarter Fiscal 2016 Earnings Conference Call. November 9, 2016
 Valvoline Fourth-Quarter Fiscal 2016 Earnings Conference Call November 9, 2016 Forward-Looking Statements This presentation contains forward-looking statements within the meaning of Section 27A of the
FISCAL YEAR MARCH 2015 FIRST QUARTER FINANCIAL RESULTS. Mazda Roadster 25 th Anniversary Model
 FISCAL YEAR MARCH 2015 FIRST QUARTER FINANCIAL RESULTS Mazda Roadster 25 th Anniversary Model Mazda Motor Corporation July 31, 2014 1 PRESENTATION OUTLINE Highlights Fiscal Year March 2015 First Quarter
MONRO MUFFLER BRAKE, INC. PROVIDES FOURTH QUARTER AND FISCAL 2017 FINANCIAL RESULTS
 CONTACT: John Van Heel Chief Executive Officer (585) 647-6400 Robert Gross Executive Chairman (585) 647-6400 FOR IMMEDIATE RELEASE Brian D Ambrosia Senior Vice President Finance Chief Financial Officer
Third Quarter 2017 Performance and Business Update. October 26, 2017
 Third Quarter 2017 Performance and Business Update October 26, 2017 1 Important Notice Please read this management presentation together with the Company s press release issued earlier today announcing
Bernstein Strategic Decisions Conference 2018
 Bernstein Strategic Decisions Conference 2018 Forward-Looking Statements Certain statements in this presentation, other than statements of historical fact, including estimates, projections, statements
FISCAL YEAR MARCH 2018 FIRST QUARTER FINANCIAL RESULTS
 FISCAL YEAR MARCH 2018 FIRST QUARTER FINANCIAL RESULTS PRESENTATION OUTLINE Highlights Fiscal Year March 2018 First Quarter Results Fiscal Year March 2018 Full Year Forecast Structural Reform Stage 2 Progress
FISCAL YEAR MARCH 2015 FIRST HALF FINANCIAL RESULTS. New Mazda Demio
 FISCAL YEAR MARCH 2015 FIRST HALF FINANCIAL RESULTS New Mazda Demio Mazda Motor Corporation October 31, 2014 1 PRESENTATION OUTLINE Highlights Fiscal Year March 2015 First Half Results Fiscal Year March
FISCAL YEAR MARCH 2014 FINANCIAL RESULTS
 FISCAL YEAR MARCH 214 FINANCIAL RESULTS Mazda CX-5 Mazda Atenza Mazda Motor Corporation April 25, 214 New Mazda Axela 1 PRESENTATION OUTLINE Highlights Fiscal Year March 214 Results Fiscal Year March 215
FISCAL YEAR MARCH 2015 THIRD QUARTER FINANCIAL RESULTS. Updated Mazda CX-5 (Japanese specification model)
") FISCAL YEAR MARCH 2015 THIRD QUARTER FINANCIAL RESULTS Updated Mazda CX-5 (Japanese specification model) Mazda Motor Corporation February 4, 2015 1 PRESENTATION OUTLINE Highlights Fiscal Year March 2015
FISCAL YEAR MARCH 2015 THIRD QUARTER FINANCIAL RESULTS Updated Mazda CX-5 (Japanese specification model) Mazda Motor Corporation February 4, 2015 1 PRESENTATION OUTLINE Highlights Fiscal Year March 2015
FISCAL YEAR MARCH 2018 FIRST HALF FINANCIAL RESULTS
 FISCAL YEAR MARCH 2018 FIRST HALF FINANCIAL RESULTS PRESENTATION OUTLINE Highlights Fiscal Year March 2018 First Half Results Fiscal Year March 2018 Full Year Forecast Progress of Key Initiatives/ Business
Results Presentation
 Results Presentation 2 Q4 15 Strong commercial and financial performance 3 Key Group achievements Q4 15 4 Group underlying revenue per segment 5 Group underlying revenue by product group 6 Fixed Internet
Lazydays Holdings, Inc. Reports Second Quarter 2018 Financial Results
 News Contact: +1 (813) 204-4099 investors@lazydays.com Lazydays Holdings, Inc. Reports Second Quarter 2018 Financial Results Tampa, FL (August 9, 2018) Lazydays Holdings, Inc. ( Lazydays )(NasdaqCM: LAZY)
Third Quarter 2018 Performance and Business Update. October 24, 2018
 Third Quarter 2018 Performance and Business Update October 24, 2018 1 Important Notice Please read this management presentation together with the Company s press release issued earlier today announcing
282m 75% +575m. Net sales Operating income before non-recurring items. Operating margin before non-recurring items. Net Loss.
 First-Half 2009 Financial Highlights Net sales Operating income before non-recurring items Operating margin before non-recurring items Net Loss Net debt-to-equity ratio Free cash flow** 7,134m 282m 4.0%
3 rd Quarter 2017 Results
 Inside your life! 3 rd Quarter 2017 Results October 25, 2017 Mobile Automotive Display Semiconductor IoT LED Contents Ⅰ. Q3 2017 Earnings Summary Ⅱ. Earnings Highlight & Outlook Ⅲ. Results & Outlook by
FOURTH QUARTER 2013 RESULTS
 FOURTH QUARTER 213 RESULTS 12 MARCH 214 LUCA BETTONTE, CEO DISCLAIMER This document contains certain forward-looking information that is subject to a number of factors that may influence the accuracy of
February Annual Results February 13, 2008
 February 2008 1 Annual Results February 13, 2008 AGENDA AGENDA 2007 Highlights 2007 Financial Results x Competitiveness Sales and products dynamic International 2008 Outlook February 2008 2 2007: performance
Q Financial Results
 Q3 2018 Financial Results 1 Forward-looking statement The statements on the future in this presentation, including expected sales and earnings, are associated with risks and uncertainties and may be affected
Financial Data Supplement Q4 2017
 Bank Financial Data Supplement Q4 2017 2 February 2018 Due to rounding, numbers presented throughout this document may not sum precisely to the totals we provide and percentages may not precisely reflect
Preliminary Results 12 May 2009
 Preliminary Results 12 May 2009 Working together for Greener logistics solutions For period ended 28 February 2009 www.stobartgroup.com Highlights Year of growth, laying foundations for the multimodal
third QUARTER 2012 October 26, 2012
 third QUARTER 212 October 26, 212 Helena norrman Senior Vice President Communications third QUARTER 212 October 26, 212 This presentation contains forward-looking statements. Such statements are based
Q Analyst Teleconference. 9 August 2018
 9 August 218 Disclaimer This presentation contains forward-looking statements that reflect the Company management s current views with respect to certain future events. Although it is believed that the
April Título da apresentação DD.MM.AAAA
 Aquisition of Shell Argentina downstream assets April 2018 Título da apresentação DD.MM.AAAA DISCLAIMER This presentation contains estimates and forward-looking statements regarding our strategy and opportunities
Kongsberg Automotive ASA. Fourth quarter February 28, 2019
 Kongsberg Automotive ASA Fourth quarter - February 28, 2019 Highlights Q4 Sales Revenues grew by 21 (7.3%) YoY to 288 including negative FX effects of 1. We booked new business with 77 in expected annual
Results Presentation
 Results Presentation Continued revenue growth: Q2 15 Group underlying revenue + 1.5% YoY to 1,505 m Core revenue +2.4% to 1,094 m, on higher Fixed and Mobile revenues BICS revenue -0.8% YoY, v.s. high
Healthier Net Profit under Stronger IDR
 Investor Bulletin, First Half 2002 Healthier Net Profit under Stronger IDR As of June 2002, the consolidated revenue in USD increased by 32% y.o.y. Due to IDR strengthening against USD, in IDR revenue
Saft Groupe SA reports Quarterly Financial Information for the third quarter of 2007
 N 61-07 Saft Groupe SA reports Quarterly Financial Information for the third quarter of 2007 Paris, 9 th November 2007 - Saft, leader in the design, development and manufacture of high-end batteries for
Proposed acquisition of Areva Distribution. December 2, 2009
 Proposed acquisition of Areva Distribution December 2, 2009 Disclaimer All forward-looking statements are Schneider Electric management s present expectations of future events and are subject to a number
SECOND QUARTER 2015 RESULTS
 SECOND QUARTER 2015 RESULTS 7 AUGUST 2015 LUCA BETTONTE, CEO DISCLAIMER This document contains certain forward-looking information that is subject to a number of factors that may influence the accuracy
CONFERENCE CALL RESULTS Q1 2017
 CONFERENCE CALL RESULTS Q1 2017 May 5, 2017 Marc Bunz (CFO) Nicolas-Fabian Schweizer (CTO) AGENDA Market & Strategy Update Financials 2016 Financials Q1 2017 Outlook SCHWEIZER Share Schweizer Electronic
BERNSTEIN STRATEGIC DECISIONS CONFERENCE 2018
 ABB LTD, NEW YORK CITY, USA, 31 MAY 2018 Positioned for profitable growth BERNSTEIN STRATEGIC DECISIONS CONFERENCE 2018 Ulrich Spiesshofer, CEO Important notice This presentation includes forward-looking
Jaguar Land Rover Results For the quarter ended 30 June August 2015
 Jaguar Land Rover Results For the quarter ended 30 June 2015 7 August 2015 1 Disclaimer Statements in this presentation describing the objectives, projections, estimates and expectations of Jaguar Land
FISCAL YEAR END MARCH 2013 FIRST QUARTER FINANCIAL RESULTS
 FISCAL YEAR END MARCH 213 FIRST QUARTER FINANCIAL RESULTS New MAZDA CX-5 Mazda Motor Corporation July 31, 212 1 PRESENTATION OUTLINE Highlights Fiscal Year End March 213 Results Update of Structural Reform
Monro, Inc. Second Quarter Fiscal 2019 Earnings Call. October 25, 2018
 Monro, Inc. Second Quarter Fiscal 2019 Earnings Call October 25, 2018 Safe Harbor Statement and Non-GAAP Measures Certain statements in this presentation, other than statements of historical fact, including
FISCAL YEAR MARCH 2018 THIRD QUARTER FINANCIAL RESULTS
 FISCAL YEAR MARCH 2018 THIRD QUARTER FINANCIAL RESULTS PRESENTATION OUTLINE Highlights Fiscal Year March 2018 Nine Month Results Fiscal Year March 2018 Full Year Forecast Progress of Key Initiatives 1
Lazydays Holdings, Inc. Reports Third Quarter 2018 Financial Results
 News Contact: +1 (813) 204-4099 investors@lazydays.com Lazydays Holdings, Inc. Reports Third Quarter 2018 Financial Results Tampa, FL (November 8, 2018) Lazydays Holdings, Inc. ( Lazydays ) (NasdaqCM:
AUTUMN CONFERENCE CHEUVREUX Paris. Cheuvreux Conference - Paris
 AUTUMN CONFERENCE CHEUVREUX Paris September 25 juillet 20 th, 2012 1 This presentation does not constitute an offer to sell, or a solicitation of an offer to buy, PEUGEOT SA ( Company ) shares. This presentation
Revised 1 Key Performance Indicators
 Revised 1 Key Performance Indicators 2011/12, 2012/13 & first 3 quarters of 2013/14 Sheet 1 Sheet 2 Sheet 3 Sheet 4 Sheet 5 Sheet 6 Sheet 7 Sheet 8 Sheet 9 Income statement & free cash flow BT Global Services
First half 2017 Results September 1, 2017
 PRESS RELEASE First half 2017 Results September 1, 2017 Full consolidation of Vivendi Group from April 26, 2017 and Sale to Vivendi of the Bolloré Group s 59.2% stake in Havas for 2,317 million euros completed
Conférence d Automne - Cheuvreux. Paris, September 26 th, 2011
 Conférence d Automne - Cheuvreux Paris, September 26 th, 2011 This presentation may contain forward-looking statements. Such forward-looking statements do not constitute forecasts regarding the Company
FISCAL YEAR MARCH 2014 FIRST HALF FINANCIAL RESULTS. New Mazda Axela (Overseas name: New Mazda3)
") FISCAL YEAR MARCH 2014 FIRST HALF FINANCIAL RESULTS New Mazda Axela (Overseas name: New Mazda3) Mazda Motor Corporation October 31, 2013 1 PRESENTATION OUTLINE Highlights Fiscal Year March 2014 First Half
FISCAL YEAR MARCH 2014 FIRST HALF FINANCIAL RESULTS New Mazda Axela (Overseas name: New Mazda3) Mazda Motor Corporation October 31, 2013 1 PRESENTATION OUTLINE Highlights Fiscal Year March 2014 First Half
Statistical tables S 0. Money and banking. Capital market. National financial account. Public finance
 Statistical tables Money and banking Page S South African Reserve Bank: Liabilities... 2 South African Reserve Bank: Assets... 3 Corporation for Public Deposits: Liabilities... 4 Corporation for Public
MONRO, INC. ANNOUNCES SECOND QUARTER FISCAL 2018 FINANCIAL RESULTS
 CONTACT: Brett Ponton Chief Executive Officer (585) 647-6400 FOR IMMEDIATE RELEASE Brian D Ambrosia Senior Vice President Finance Chief Financial Officer (585) 647-6400 Investors and Media: Effie Veres
Kongsberg Automotive ASA. Third quarter November 7, 2018
 Kongsberg Automotive ASA Third quarter - November 7, Q3 Highlights Continued improvements in turbulent times Revenues increased YoY by MEUR 18.3 (~8%) to MEUR 259 including negative FX effects of MEUR
Conference Call H Düsseldorf August 4, 2016
 R H E I N M E TA L L A G T H E T EC H N O LO GY G RO U P FO R S EC U R I T Y A N D M O B I L I T Y Conference Call Düsseldorf August 4, 2016 RHEINMETALL AG 2016 Rheinmetall Group Highlights Increased sales,
2015 Interim Results Announcement
 China Petroleum & Chemical Corporation 2015 Interim Results Announcement August 27, 2015 Hong Kong Cautionary Statement This presentation and the presentation materials distributed herein include forward-looking
Q3 Interim Report 2016
 Q3 Interim Report 216 Lennart Evrell President & CEO Håkan Gabrielsson CFO Strong earnings and high mine production Revenues 9,733 (9,764) MSEK EBIT ex PIR* 1,318 (1,55) MSEK EBIT 1,529 (88) MSEK Free
2 ND QUARTER 2016 INVESTOR PRESENTATION 26 AUGUST Geir Håøy, President and CEO Hans-Jørgen Wibstad, CFO
 2 ND QUARTER 2016 INVESTOR PRESENTATION 26 AUGUST 2016 Geir Håøy, President and CEO Hans-Jørgen Wibstad, CFO WORLD CLASS - through people, technology and dedication Page 2 HIGHLIGHTS Stable activity level
JAGUAR LAND ROVER RESULTS FOR THE THREE MONTHS ENDED 31 DECEMBER th FEBRUARY 2017
 JAGUAR LAND ROVER RESULTS FOR THE THREE MONTHS ENDED 31 DECEMBER 2016 14 th FEBRUARY 2017 DISCLAIMER Statements in this presentation describing the objectives, projections, estimates and expectations of
SOLLERS IFRS RESULTS
 SOLLERS IFRS RESULTS 2017 03.05.2018 2 1. 2017 SOLLERS STRATEGIC DEVELOPMENTS 2. RUSSIAN AUTOMOTIVE MARKET OVERVIEW 3. SOLLERS OPERATING AND FINANCIAL PERFORMANCE IN 2017 4. SOLLERS JOINT VENTURES RESULTS
On track. Investor and Analyst Presentation On the Occasion of the Release of the Preliminary Figures for FY 2011 Hanover, 19 January 2012
 On track. Investor and Analyst Presentation On the Occasion of the Release of the Preliminary Figures for FY 2011 Agenda Delticom at a Glance Business Model Profit & Loss Balance Sheet Outlook 2 Agenda
H1 2018: Strong organic order growth and profitability increase
 Sulzer Management Ltd Neuwiesenstrasse 15 8401 Winterthur Switzerland Phone +41 52 262 30 00 Fax +41 52 262 31 00 In the first half of 2018, Sulzer s rebound continued. Order intake increased by 11.6%
Q Sales inc. VAT 17 January 2013
 Sales growth in the fourth quarter and in 2012 Continued growth in emerging markets, notably Latin America, better quarter in France Q4 2012 sales (inc. VAT): +0.8% to 22.9bn Full-year 2012 sales (inc.
Fiscal Year 2012: Year of record operational performance
 Ranshofen, March 1, 2013 Fiscal Year 2012: Year of record operational performance Year of record operational performance: - 327,800 tons of external shipments - 266,900 tons of scrap charged in Ranshofen
Q RESULTS. 24 th April 2018
 Q1 2018 RESULTS 24 th April 2018 DISCLAIMER This presentation does not constitute an offer to sell, or a solicitation of an offer to buy, PEUGEOT SA ( Company ) shares. This presentation may contain forward-looking
ENEL PUBLISHES 2018 SECOND QUARTER AND FIRST HALF GROUP OPERATING DATA REPORT
 Media Relations Investor Relations T +39 06 8305 5699 T +39 06 8305 7975 F +39 06 8305 3771 F +39 06 8305 7940 ufficiostampa@enel.com investor.relations@enel.com enel.com enel.com ENEL PUBLISHES 2018 SECOND
Establishment of Joint Venture with PSA for EV Traction Motor Business
 NIDEC CORPORATION Establishment of Joint Venture with PSA for EV Traction Motor Business Nidec Corporation December 4 th, 2017 Note Regarding Forward-looking Statements These presentation materials and
Paris Tuesday, April 1, Europcar Groupe 2007 Annual Results
 Paris Tuesday, April 1, 2008 Europcar Groupe 2007 Annual Results Speakers Salvatore Catania Chief Executive Officer, Europcar Groupe Charles Desmartis Chief Financial Officer, Europcar Groupe 1 Europcar
NET SALES at September 30, 2014
 NET SALES at September 30, 2014 October 22, 2014 1 Net sales at September 30, 2014 October 22, 2014 Net sales of 14,558m in a still slowing global market The market slowdown observed since the second quarter
Good demand in Hiab continued
 24 April 218 Good demand in Hiab continued Cargotec s January March 218 interim report Mika Vehviläinen, CEO Mikko Puolakka, CFO Cargotec s January-March 218 interim report 24/4/218 1 Contents 1. Group
Roadshow Presentation
 Roadshow Presentation June 2, Wilfried Trepels, CFO 1 SAF-HOLLAND - Components Fifth Wheels Kingpins Suspensions Landing Gear Axle Systems 2 SAF-HOLLAND - Business Units Trailer Systems Powered Vehicle
Presentation to Investors Q results ROYAL DSM HEALTH NUTRITION MATERIALS
 Presentation to Investors Q3 2016 results ROYAL DSM HEALTH NUTRITION MATERIALS Safe harbor statement This presentation may contain forward-looking statements with respect to DSM s future (financial) performance
Earnings conference call Q3 2016
 Earnings conference call Q3 2016 Bo Annvik, CEO / Åke Bengtsson, CFO October 25, 2016 1 Agenda Business Highlights Market Update Sales Financials Outlook Public offer 2 Business Highlights Q3 2016 Solid
TOFAŞ RESULTS WEBCAST PRESENTATION
 TOFAŞ 31.12.2017 RESULTS WEBCAST PRESENTATION 02.02.2018 AGENDA Highlights Turkish Automotive Industry Production Domestic Market Developments Tofaş Domestic Market Performance Export Markets & Tofaş Performance
Conference Call. Preliminary Key Figures Financial Year Bochum, February 7, GEA Group
 Conference Call Preliminary Key Figures Financial Year 2010 Bochum, February 7, 2011 GEA Group Disclaimer All figures for 2010 are preliminary and have therefore not yet been audited. The yearend financial
Third quarter AB Volvo
 Third quarter 2013 Third quarter 2013 TRUCKS EUROPE Excellent reception of the new products decision to optimize manufacturing Highlights in Commercial launch of the new product ranges Strong order situation
Money and banking. Flow of funds for the third quarter
 Statistical tables Money and banking Page S South African Reserve Bank: Liabilities... 2 South African Reserve Bank: Assets... 3 Corporation for Public Deposits: Liabilities... 4 Corporation for Public
Second quarter AB Volvo
 1 VOLVO GROUP Strengthened focus on core business divests Volvo Aero Enterprise value of SEK 6.9 billion. Completion expected during the third quarter of 2012. acquires shares in Deutz AG Largest shareholder
Mon. 4/19 AM Harley-Davidson, Inc Fourth Quarter Update
 Mon. 4/19 AM Harley-Davidson, Inc. 2013 Fourth Quarter Update January 30, 2014 2013 Fourth Quarter Update These slides are intended to support the material discussed in the corresponding conference call.
Record CY 2016 EPS-diluted-adjusted of $6.12, an increase of $1.10 Y-O-Y. Q EPS-diluted-adjusted of $1.28, a decrease of $0.11 Y-O-Y.
 1 2 3 Q4 2016 global deliveries up 0.1 million units year-over-year (Y-O-Y), a 3.3% increase. Volume gains primarily in North America and China, offset by reductions in International Operations (excluding
ABLC! Advancing Renewable Chemicals! November 10, 2014! Copyright 2014 Renewable Energy Group, Inc.
 ABLC! Advancing Renewable Chemicals! November 10, 2014! Safe Harbor Statement! This presentation contains certain forward-looking statements within the meaning of the Private Securities Litigation Reform
RENAULT GROUP SOCIETE GENERALE CONFERENCE
 RENAULT GROUP SOCIETE GENERALE CONFERENCE DOMINIQUE THORMANN, EVP, CFO & RCI Banque CEO NOVEMBER 30th, 2011 DISCLAIMER Information contained within this document may contain forward looking statements.
NET SALES AT SEPTEMBER 30, October 28, 2013
 NET SALES AT SEPTEMBER 30, 2013 October 28, 2013 1 NET SALES AT 30 SEPTEMBER 30, 2013 October 28, 2013 Net Sales of 15,282m over First 9 Months, Sales Volumes Up 2% in 3 rd Quarter Markets: up in Q3 Europe:
MONRO MUFFLER BRAKE, INC. ANNOUNCES FOURTH QUARTER AND FISCAL 2015 FINANCIAL RESULTS
 CONTACT: John Van Heel Chief Executive Officer (585) 647-6400 Robert Gross Executive Chairman (585) 647-6400 Catherine D Amico Executive Vice President Finance Chief Financial Officer (585) 647-6400 Investors:
SOLLERS IFRS RESULTS 1H2017
 SOLLERS IFRS RESULTS 1H2017 28.08.2017 2 1. 1H2017 SOLLERS STRATEGIC DEVELOPMENTS 2. RUSSIAN AUTOMOTIVE MARKET OVERVIEW 3. SOLLERS OPERATING AND FINANCIAL PERFORMANCE IN 1H2017 4. SOLLERS JOINT VENTURES
On track. Investor and Analyst Presentation On the Occasion of the Release of the Preliminary Figures for 9M 2011 Hanover, 18 October 2011
 On track. Investor and Analyst Presentation On the Occasion of the Release of the Preliminary Figures for 9M 2011 Agenda Delticom at a Glance Business Model Profit & Loss Balance Sheet Outlook 2 Agenda
Key Performance Indicators Q4 2015/16
 Key Performance Indicators Q4 2015/16 For the quarter ended 31 March 2016. Published 5 May 2016 Sheet 1 Sheet 2 Sheet 3 Sheet 4 Sheet 5 Sheet 6 Sheet 7 Sheet 8 Sheet 9 Sheet 10 Sheet 11 Income statement
EXANE BNP PARIBAS 13th European Seminar June 8, 2011
 EXANE BNP PARIBAS 13th European Seminar June 8, 2011 This presentation may contain forward-looking statements. Such forward-looking statements do not constitute forecasts regarding the Company s results
National Treasury Presentation to the Standing Committee on Finance: South African Airways SOC Ltd ( SAA )
") National Treasury Presentation to the Standing Committee on Finance: South African Airways SOC Ltd ( SAA ) Presenter: National Treasury 18 November 2015 90 day Action Plan In November 2014, the Ministers
National Treasury Presentation to the Standing Committee on Finance: South African Airways SOC Ltd ( SAA ) Presenter: National Treasury 18 November 2015 90 day Action Plan In November 2014, the Ministers
AMAG posts record shipments in 2013; dividend recommendation of 0.60 EUR per share
 Ranshofen, 28 February 2014 AMAG posts record shipments in 2013; dividend recommendation of 0.60 EUR per share Shipments at an all-time high of 351,700 tonnes (t) in 2013, compared with 344,200 t a year
FISCAL YEAR MARCH 2015 FINANCIAL RESULTS. New Mazda CX-3 (Japanese specification model)
") FISCAL YEAR MARCH 2015 FINANCIAL RESULTS New Mazda CX-3 (Japanese specification model) Mazda Motor Corporation April 24, 2015 1 PRESENTATION OUTLINE Highlights Fiscal Year March 2015 Results Fiscal Year
FISCAL YEAR MARCH 2015 FINANCIAL RESULTS New Mazda CX-3 (Japanese specification model) Mazda Motor Corporation April 24, 2015 1 PRESENTATION OUTLINE Highlights Fiscal Year March 2015 Results Fiscal Year
Mercado Libre. First Quarter 2018 Results. Investor Relations
 Mercado Libre First Quarter 2018 Results Investor Relations This presentation may make forward-looking statements relating to such matters as continued growth prospects for the company, industry trends