AN EXPERIMENTAL ANALYSIS OF MAGNETORHEOLOGICAL (MR) DAMPING FOR VIBRATION MITIGATION
|
|
|
- Jack Blake
- 5 years ago
- Views:
Transcription
1 AN EXPERIMENTAL ANALYSIS OF MAGNETORHEOLOGICAL (MR) DAMPING FOR VIBRATION MITIGATION A thesis presented to the faculty of the Graduate School of Western Carolina University in partial fulfillment of the requirements for the degree of Master of Science in Technology. By William Ralph Deaton IV Advisor: Dr. Sudhir Kaul Assistant Professor Department of Engineering and Technology Committee Members: Dr. Wesley Stone, Engineering and Technology Dr. Robert Adams, Engineering and Technology June 2015
2 ACKNOWLEDGEMENTS I would like to thank my advisor and committee members for their assistance and encouragement thorough the entirety of this process. Beyond my committee, I want to particularly thank Dr. James Zhang, Dr. Wes Stone, Dr. Aaron Ball, and Dr. Martin Tanaka for allowing me the opportunity to enter graduate school here. I hope I have repaid the favor that I feel I owe. I also extend many thanks to my associates (in no particular order) within the Mechanical Graduate program, with whom I got to spend many hours commiserating together: Alton Lackey, Adam Henson, Theo Waltz, Ben Stewart, Chaoke Dong, Clark Sechrest, Jacob Rogers, Shahab Karimi, and Mitra Shabani Samghabady. Lastly, I would like to extend my sincere thanks to my wife, Sherri Deaton, who has shown endless patience and support in dealing with me. Without her, I don t think that I could have completed this significant undertaking. ii
3 TABLE OF CONTENTS LIST OF TABLES... iv LIST OF FIGURES... v ABSTRACT... vii CHAPTER 1 : INTRODUCTION Scope of Thesis Overview of Thesis Key Terms... 3 CHAPTER 2 : LITERATURE REVIEW Magnetorheological Fluid Magnetorheological Damping Applications and Devices Semi-active Control Magnetorheological Damping - Vibration Mitigation Conclusion CHAPTER 3 : DAMPING CHARACTERISTICS AND MODELING Transmissibility Frequency Response Modeling Modeling Results and Discussion Conclusion CHAPTER 4 : EXPERIMENTAL RESULTS Damper Characterization Shaker Table Testing Damping Results Conclusion CHAPTER 5 : CONCLUSIONS AND FUTURE WORK Research Goals Results and Observations Future Work WORKS CITED APPENDIX A: MATLAB PROGRAMS APPENDIX B: SPECIFICATIONS AND DATA SHEETS iii
4 LIST OF TABLES Table 3.1: Damper Parameters Table 4.1: Damper Characterization list of test runs Table 4.2: Damper Parameters two configurations Table 4.3: Test Settings (shaker table) Table 4.4: Comparison RMS and maximum acceleration iv
5 LIST OF FIGURES Figure 2.1: Magnetorheological fluid [6] Figure 2.2: Operation modes for Magnetorheological fluids [4] Figure 2.3: Acceleration hysteresis plot [11] Figure 3.1: Frequency response plot, logarithmic scale; payload of 11.5 kg, damper current of 0.5A, frequency sweep from 9-16 Hz, amplitude of 400 mvpp Figure 3.2: Base Excitation Model 1 DOF Figure 3.3: Displacement Transmissibility versus normalized excitation frequency as a function of input current Figure 3.4: Force Transmissibility versus normalized excitation frequency as a function of input current Figure 4.1: MR Damper and Control Kit Figure 4.2: Test setup for damper characterization Figure 4.3: Force-displacement characteristics (at 10 mm/min) Figure 4.4: Force-displacement characteristics (at 20 mm/min) Figure 4.5: Experimental setup block diagram Figure 4.6: Shaker table test setup Figure 4.7: Damper support fixture partial assembly Figure 4.8: Damper support fixture complete assembly Figure 4.9: Payload assembly Figure 4.10: Screen shot of shaker table data collection settings Figure 4.11: Screen shot of shaker table acceleration data collection Figure 4.12: Acceleration versus time for a constant excitation frequency (10 Hz, 200mVpp), input current of 0.4A, payload of 14.9 kg Figure 4.13: Frequency response plot (logarithmic scale) for constant excitation frequency (10 Hz, 200mVpp), input current of 0.4A, payload of 14.9 kg Figure 4.14: Hysteresis plot for constant excitation frequency (10 Hz, 200mVpp), input current of 0.4A, payload of 14.9 kg Figure 4.15: Acceleration versus time for a payload of 11.5 kg, damper current of 0.2A, frequency sweep from 9-16 Hz, amplitude of 400 mvpp Figure 4.16: Frequency response plot, logarithmic scale; payload of 11.5 kg, damper current of 0.2A, frequency sweep from 9-16 Hz, amplitude of 400 mvpp Figure 4.17: Payload acceleration versus table acceleration plot; payload of 11.5 kg, damper current of 0.2A, frequency sweep from 9-16 Hz, amplitude of 400 mvpp Figure 4.18: Acceleration versus time plot; payload of 11.5 kg, damper current of 0.7A, frequency sweep from 9-16 Hz, amplitude of 400 mvpp Figure 4.19: Frequency response plot, logarithmic scale; payload of 11.5 kg, damper current of 0.7A, frequency sweep from 9-16 Hz, amplitude of 400 mvpp Figure 4.20: Payload acceleration versus table acceleration plot; payload of 11.5 kg, damper current of 0.7A, frequency sweep from 9-16 Hz, amplitude of 400 mvpp Figure 4.21: Acceleration versus time plot; payload of 14.9 kg, damper current of 0.2A, frequency sweep from 9-16 Hz, amplitude of 400 mvpp Figure 4.22: Frequency response plot, logarithmic scale; payload of 14.9 kg, damper current of 0.2A, frequency sweep from 9-16 Hz, amplitude of 400 mvpp Figure 4.23: Payload acceleration versus table acceleration plot; payload of 14.9 kg, damper current of 0.2A, frequency sweep from 9-16 Hz, amplitude of 400 mvpp Figure 4.24: Acceleration versus time plot; payload of 14.9 kg, damper current of 0.7A, frequency sweep from 9-16 Hz, amplitude of 400 mvpp v
6 Figure 4.25: Frequency response plot, logarithmic scale; payload of 14.9 kg, damper current of 0.7A, frequency sweep from 9-16 Hz, amplitude of 400 mvpp Figure 4.26: Payload acceleration versus table acceleration plot; payload of 14.9 kg, damper current of 0.7A, frequency sweep from 9-16 Hz, amplitude of 400 mvpp Figure 4.27: Comparison of base and payload RMS values, payload: 11.5 kg, amplitude: 400 mvpp, frequency sweep: 9-16 Hz over 60 seconds Figure 4.28: Comparison of base and payload RMS values, payload: 14.9 kg, amplitude: 400 mvpp, frequency sweep: 9-16 Hz over 60 seconds Figure 4.29: Comparison of base and payload peak acceleration values, payload: 11.5 kg, amplitude: 400 mvpp, frequency sweep: 9-16 Hz over 60 seconds Figure 4.30: Comparison of base and payload peak acceleration values, payload: 14.9 kg, amplitude: 400 mvpp, frequency sweep: 9-16 Hz over 60 seconds Figure 4.31: Comparison of base and payload RMS acceleration values over various amplitudes of excitation (200, 400, 600mVpp). Frequency sweep: 9-16 Hz over 60 seconds, payload: 11.5 kg.45 Figure 4.32: Comparison of base and payload peak acceleration values over various amplitudes of excitation (200, 400, 600mVpp). Frequency sweep: 9-16 Hz over 60 seconds, payload: 11.5 kg.45 Figure 5.1: Comparison of RMS acceleration between payload and base as a function of payload mass and input current Figure 5.2: Comparison of peak acceleration between payload and base as a function of payload mass and input current Figure 5.3: RMS acceleration varying excitation amplitude, 11.5 kg payload Figure 5.4: Peak acceleration varying excitation amplitude, 11.5 kg payload vi
7 ABSTRACT AN EXPERIMENTAL ANALYSIS OF MAGNETORHEOLOGICAL (MR) DAMPING FOR VIBRATION MITIGATION William Ralph Deaton IV, M.S.T Western Carolina University (June 2015) Advisor: Dr. Sudhir Kaul Magnetorheological (MR) dampers have emerged as a viable means of semi-active damping in multiple industry applications. The semi-active nature of these dampers is a significant attribute since the damper functions as a passive damper in the event of a failure. While there have been other smart materials like ferroelectric, piezoelectric, shape memory alloys, etc. that have been successfully used, MR fluids exhibit a unique combination of completely reversible effect, very low response time, high durability and very low energy requirements that make them suitable for vibration control in a wide variety of applications. This study presents results from an experimental investigation that has been carried out to evaluate the performance of a MR damper for vibration mitigation. The capability of a commercial MR damper to isolate a payload from base excitation is analyzed and the damper parameters are identified to simulate the capability of the damper with regards to transmissibility. Simulation results are presented for multiple levels of damping exhibited by the MR damper. Multiple iterations of testing have been performed in order to evaluate the influence of variables such as input current to the electromagnet of the damper, mass of the payload, excitation frequency and excitation amplitude. Although temperature is known to be a significant parameter that influences the performance of the MR damper, it has not been critical for the purposes of this study. This can be primarily attributed to the small displacement amplitudes that have been used for excitation. Results indicate that the MR damper is successful in mitigating vibrations transmitted to the payload. Vibration mitigation is quantified by comparing the root mean square (RMS) of the time history of acceleration of the base with that of the payload. Peak values of acceleration are vii
8 also compared. Displacement transmissibility results directly demonstrate the variable damping capability of the MR damper. Although the stiffness constant of the damper may also change, it is not seen to vary appreciably in this study since the excitation amplitude is limited to a low threshold. The damper is found to be robust with an inherent ability of handling payload and excitation variability. It is observed that increasing the input current to the electromagnet around the MR fluid directly results in an increase in damping, therefore, making the use of these dampers viable in applications where payloads and excitation inputs are expected to change during operation. These features of robustness and controllability make the use of MR dampers very attractive in a large range of applications. viii
9 CHAPTER 1 : INTRODUCTION Active materials are being increasingly investigated to overcome constraints associated with material selection. Magnetorheological (MR) fluid is one such active material that can offer a range of damping properties instead of one fixed damping value, as is common with passive dampers. However, the challenge in using MR dampers is that they exhibit highly nonlinear attributes such as hysteresis, saturation, etc. Furthermore, direct control of damping characteristics of MR dampers is difficult since damping levels are governed by the strength of the magnetic field, velocity input, displacement amplitude as well as operating and fluid temperatures. There is a significant amount of existing literature that investigates different aspects of usage and control of MR fluids [1 3]. MR dampers have been used and investigated for two decades. However, they have not been as commonly used as traditional dampers, shock absorbers, spring-damper systems, or rubber dampers. Some comparisons have been drawn between the effectiveness of passive dampers and active damping, and to identify the pros and cons associated with the use of a smart material such as MR fluid for damping. Though there is a large body of work in the existing literature on the use and application of MR dampers, the use of these dampers is still not widespread. The robustness of these dampers in the presence of variables such as damper current, excitation amplitude, excitation frequency, etc. is still being actively investigated for various applications. This study focuses on evaluating the performance of a commercial MR damper in order to comprehend its capability in the presence of multiple variables, with the input from the shaker table as the primary source of excitation. The study involves an experimental determination of the variable damping capability of the MR damper, and identification of its semi-active damping over a range of excitation levels. The aim of this study is to develop a holistic understanding of the capabilities of the damper, and identify its limitations for vibration mitigation. This thesis seeks to answer the following questions: 1
10 1. What is the influence of variables such as excitation amplitude, excitation frequency, damper current, and payload on vibration mitigation capabilities of a MR damper in the presence of base excitation? 2. How do the damping and stiffness properties of the MR damper change? How do these changing properties influence vibration mitigation? 1.1. Scope of Thesis This thesis examines the capability of a commercially available MR damper through experimental analysis. The damper is tested on the tensile tester to identify its varying stiffness and damping characteristics. These characteristics are used to develop a preliminary mathematical model to compute expected acceleration transmissibility and force transmissibility for a single degree-of-freedom model. Subsequently, the damper is used to perform testing on the shaker table in the presence of varying excitation frequency, varying excitation amplitude, varying payload and changing input current of the electromagnet of the damper. All the variables are changed within the technical capabilities of the damper as well as the capabilities of the equipment in the laboratory. The acceleration data is captured through accelerometers and then collected through a data acquisition system. The data is subsequently postprocessed and analyzed in MATLAB. It may be noted that this thesis does not aim to determine the optimum settings or conditions for the damper. This is primarily because the optimum settings will largely depend on the specific application that the damper is being used for. Also, this thesis does not develop a control algorithm or program to continuously vary the damping levels. The control algorithm would also significantly depend on the application for which the damper is being used. The primary contribution of this research is in answering the research questions identified in the previous section, and in outlining an elaborate experimental procedure that can be used repeatedly to test a MR damper for vibration mitigation Overview of Thesis This section provides an overview of the entire document. In Chapter 1, a brief introduction is provided along with the research questions and a chapter-by-chapter overview. Chapter 2 discusses the 2
11 relevant background and the existing literature associated with this study. Literature on semi-active control and active materials is also briefly discussed in this chapter. Chapter 3 discusses the mathematical model that has been developed to simulate a single degreeof-freedom system that is subject to base excitation. The parameters identified from tensile testing of the MR damper are used for the model. Overall results of expected acceleration and force transmissibility with varying damping levels are also presented in this chapter. Chapter 4 presents all the details associated with the development of the experimental setup. The experimental results are discussed and analyzed in detail. Chapter 5 summarizes the main findings and the main results of this study. Trends observed with multiple test parameters are also discussed in this chapter. The future scope of research for this study is also discussed in this chapter Key Terms Following is a list of some of the key terminology that is relevant to this thesis and will be used throughout the document: Rheology The study of the flow and deformation of matter. Magnetorheological fluid (MR fluid) A fluid whose viscosity and flow characteristics can be altered with the application of a magnetic field [4]. Hysteresis This is a property associated with the time dependence of a parameter. It is exhibited by many dynamic systems. Damper A device designed to mitigate the transfer of forces from one object to another connected object. A damper can be passive, semi-active or active. Shaker table An electro-dynamic testing device that can generate a wide range of frequencies and amplitudes of vibration. Shaker Base (Base) The top plate of the shaker table that can be used as the test table. Payload The load connected to the damper that is excited through the shaker table. 3
12 CHAPTER 2 : LITERATURE REVIEW Researchers have been studying various means of minimizing the forces transmitted from one structural member to another for a very long time, particularly for applications where vibrations can cause damage or fatigue over a period of time. This chapter lists some recent research from the existing literature that is relevant to the content of this study. This chapter also provides the pertinent background information that is not covered in Chapter 1. A brief discussion is provided on the findings from some of the research that has been reviewed during the course of this study Magnetorheological Fluid Magnetorheological (MR) fluid belongs to a group of materials classified as smart materials due to their ability to change their properties in response to an external stimulus [4]. MR fluids change their rheological (fluid or plastic flow) properties through the application of an external magnetic field. There are multiple means of using this fluid in applications such as MR elastomers, MR fluids, and MR foams. Usage of MR fluid in a damper is pretty common and is the focus of this study. MR fluid is a dense suspension of magnetized particles dispersed within a supporting liquid medium, usually oil or silicone-based. The magnetized particles in the fluid are typically 10-7 to 10-5 meters in diameter [4]. Without the influence of a magnetic field, the particles are uniformly distributed within the supporting medium, behaving as a viscous fluid. Upon application of a magnetic field, the particles re-orient themselves into alignment of the field, providing a structural rigidity to the fluid. Up to a limit, an increase in the strength of the magnetic field directly increases the effective viscosity of the fluid. This transition is completely reversible and can be achieved in milliseconds [1, 4]. An illustration of MR fluid structure, with and without a magnetic field, can be seen in Figure 2.1. It may be noted that another material called as the Electro-Rheological (ER) fluid exhibits similar properties. ER fluids exhibit properties that are similar to MR fluids with a similar makeup of particles of significantly small size that are suspended in an oil-based medium, but the primary difference is in the mode of activation an electrical field as opposed to a magnetic field. Despite the similarities between ER and MR fluids, a 4

13 significant drawback to extensive usage of ER fluids is their requirement of a very high electrical field, often approaching 5kV/mm. In comparison, an electromagnet controlling the MR fluids may require up to 12V to produce an equivalent effect [5]. Figure 2.1: Magnetorheological fluid [6]. By varying the strength of a magnetic field within close proximity of the MR fluid, the effective yield strength of the fluid can be directly modified by using an electromagnet with a change in the input current of the electromagnet. MR fluids can be used in various operational modes. The three main modes are the valve or flow mode, the shear mode, and the squeeze mode [4]. These modes are illustrated in Figure
![Figure 2.2: Operation modes for Magnetorheological fluids [4].](/docs-images/85/91560901/images/14-0.jpg "There are pros and cons to each of the three modes that have been discussed in the relevant literature along with the design and applications of the dampers using these three modes [1].")
14 Figure 2.2: Operation modes for Magnetorheological fluids [4]. There are pros and cons to each of the three modes that have been discussed in the relevant literature along with the design and applications of the dampers using these three modes [1]. For the purposes of this study, the valve mode is of particular interest since it is commonly used in MR dampers Magnetorheological Damping While passive dampers in the form of hydraulic dashpots have existed for a long time in various forms, dampers that exhibit an ability to vary their damping properties are relatively more recent. Although a mechanical adjustment of the size of the fluid aperture can be used to vary damping levels, these designs have severe limitations in terms of their operating range, and also exhibit a relatively long response time. MR dampers mitigate these limitations with near-infinite adjustability and a response time measuring in milliseconds. This has made the use of MR damping possible in applications that can benefit from semi-active damping Applications and Devices Currently, the most well-known application of MR dampers is within the automotive sector under such trade names as MagnaRide that has been developed by General Motors [5]. Manufacturers of some high-end vehicles are taking advantage of the MR damper s easily-adjustable properties to provide a driver-selectable suspension setting that can overcome the tradeoff between handling and ride comfort. A passive suspension system typically involves a compromise between ride comfort and handling since the choice of the design parameters associated with these characteristics meets the needs of one at the 6
15 expense of the other. The 2016 Chevrolet Camaro is an example of a vehicle featuring the MagnaRide system, allowing for selection of pre-determined ride settings, such as a Sport or Track mode, with MR dampers serving as the adjustable suspension components Semi-active Control MR dampers are categorized as semi-active. This indicates that these dampers retain some of their damping properties even when there is no power supply, or even when the controller fails. In such cases the damper reverts to a passive state, working as a passive damper. This property is a significant advantage over similar systems which are not semi-active, since in the event of a power failure (or other similar failures) the MR damper can continue to function as a damper, albeit at a potentially reduced capacity. This is an advantage over fully active dampers that have significant power requirements, and lead to complete breakdown in case of a power failure or a controller failure. The development of control algorithms for MR dampers becomes complex due to some specific characteristics exhibited by the fluids such as hysteresis and saturation. These characteristics and issues associated with shear thickening and temperature dependence of the fluid have been investigated in the existing literature [2, 3]. Furthermore, control characteristics are important since damping levels cannot be controlled directly. Damping is controlled indirectly by changing the current input to the electromagnet that in turn governs the damping levels [2]. There has also been a significant amount of research in the development of mathematical models that can be used to simulate the behavior of MR fluids. These models include high fidelity models such as the Bouc-Wen model [7] with an inherent evolutionary variable and multiple parameters that can be used to represent the hysteretic behavior. The Bouc-Wen model is accurate but computationally intensive and could be difficult to implement in an online control environment. However, this model is pretty accurate for the purposes of simulation, as demonstrated in the literature [7]. Recursive models have been used by incorporating the time history of displacement and velocity [8, 9] in order to explore possible models that can be used for control. Such models have an inherent ability to adapt to changing inputs and operating conditions, and can be used to predict the expected damping force that can in turn be used to compute control parameters. However, it has been 7
16 reported that including force feedback in the recursive model is critical and may not be practical in some applications [9]. It is pointed out in the literature that the performance of a suspension system that uses MR dampers is largely dependent on the choice of the control algorithm [10]. It is, therefore, crucial to perform elaborate testing in order to clearly determine the influence of control parameters on the capability of a suspension system that uses MR dampers Magnetorheological Damping - Vibration Mitigation Experimental aspects of vibration mitigation have been studied with semi-active dampers that can be tuned [11] by using a paddle damper. This study is important to the research presented in this document because of some similarities in the experimental techniques. Sarigul-Klijn et all [11] created an MR damper by saturating a section of open-cell foam with commercially available MR fluid, and activated it with an electromagnet. A shaker table was used to generate vibrational forces, and accelerometers were attached to the base of the shaker as well as the payload situated on top of the damper. The acceleration of the payload was compared to the acceleration of the base in terms of hysteresis loops. These loops could be analyzed to determine the level of damping of the device. Figure 2.3 shows one such hysteresis plot from this paper. 8
17 Figure 2.3: Acceleration hysteresis plot [11]. A quarter-car model is commonly used in the dynamic analysis of suspensions systems for automobiles. One such study includes the experimental analysis of alternative semi-active control methods [12]. This study tested three different control policies for semi-active dampers. The study used a MR damper that was built in what is referred to as a quarter-car test setup. The ratio between the sprung mass and input displacement was measured and compared between the three policies. Some aspects of this study are relevant to this research since the MR damper was used in evaluating control strategies for the suspension system. Another study on the use of a semi-active suspension system using MR fluids was tested on the road and showed a comparison between passive damping and MR damping [13]. This study replaced the passive dampers on a vehicle s suspension with MR dampers that were controlled by an algorithm that was developed specifically for the study. The test vehicle was driven over a road surface at various speeds, and the ride quality was monitored by a number of accelerometers placed throughout the vehicle. According to this study, None of the previously published works on MR dampers deals with the 9
18 investigation of vehicle suspension system installed with MR dampers under the real road profile. This study has been useful for comparing the results obtained in the proposed research. Other studies have also evaluated the mechanical performance of a MR damper experimentally [14], particularly to determine the controllability of the damper with the change of current of the electromagnet. The use of magnetorheological dampers has also been investigated for shock isolation [15] to investigate the practical aspects associated with replacing a passive shock isolation system with a semiactive shock isolation system consisting of a MR damping system. However, this study was entirely theoretical, and incorporated several control methods to assess shock isolation without any experimental validation. The experimental setup for this research study resembles the setup used in other similar studies (e.g. [11]). This setup consists of a shaker table that provides a vibration input directly to the damper that is mounted on the shaker table. The payload is assembled to the damper and is excited through the shaker table. The transmissibility plots and the acceleration hysteresis plots resulting from this test setup of the MR damper are directly compared to passive damping settings and to the multiple settings of the damper Conclusion In summary, the literature study conducted for this research has been used to identify some critical parameters associated with MR fluids and MR dampers. These parameters have been useful for designing the experimental setup and for developing the test matrix for this study. Additionally, the literature study has been used to develop an understanding of MR dampers and to build an overall context for the research. This thesis tests the robustness of a commercial MR damper in order to quantify its capability to mitigate vibrations in a controllable manner. Acceleration transmissibility is evaluated for a base shaking configuration and the influence of multiple parameters such as the input current to the electromagnet, displacement amplitude, and input frequency is evaluated. The theoretical models used for this research are discussed in Chapter 3 followed by the presentation of experimental results in Chapter 4. Chapter 5 lists the conclusions and the scope for future work. 10
19 CHAPTER 3 : DAMPING CHARACTERISTICS AND MODELING This chapter discusses the mathematical model used to analyze displacement and force transmissibility of the damper. The results are compared to an undamped system in order to evaluate the use of active damping. The analysis results are discussed in detail Transmissibility The capabilities of the magnetorheological (MR) Damper used in this study can be expressed in terms of transmissibility. However, since the damper behavior can be controlled by the current input to the electromagnet, the transmissibility of this damper exhibits varying characteristics. In this study, acceleration at the excitation source has been directly measured and compared to the acceleration of the isolated mass (payload). Theoretically, these accelerations are typically expressed in terms of a ratio between the payload and the base to evaluate acceleration transmissibility. To obtain the damper parameters, a universal testing machine has been used to load the damper under various conditions and levels of current input to the damper. This testing yielded the forcedeflection and force-velocity characteristics, enabling the identification of the MR damper parameters seen in Table 3.1. This testing and test setup are discussed in detail in Chapter 4. In Table 3.1, k i is the stiffness of the MR damper; c i is the damping constant, and the damping ratio, =. Table 3.1: Damper Parameters. Current k i c i ζ i ζ i (A) (N/m) (Ns/m) (m = 11.5 kg) (m = 14.9 kg) Frequency Response Looking at the difference in the frequency response between the base and payload, transmissibility of vibrations can be directly compared. The frequency response charts that were created 11
20 in this study show the differences in the frequency response of the base (input) and payload (output). The data that was collected during testing was in time domain and has been transformed into frequency domain by applying the Fast Fourier transform, and noise has been removed by using a Butterworth filter. The transformed is then plotted to compare the base and payload signals. One such example of a frequency response chart is shown in Figure 3.1, generated from the experimental data. All the plots for the test configurations will be discussed in detail in Chapter 4. Figure 3.1: Frequency response plot, logarithmic scale; payload of 11.5 kg, damper current of 0.5A, frequency sweep from 9-16 Hz, amplitude of 400 mvpp Modeling To create a mathematical model to examine transmissibility and frequency response, a simplified spring-mass-damper model has been used. This is a single degree of freedom system with a lumped mass that is excited at the base, as seen in Figure 3.2 below. 12
21 x m c i k i x b Figure 3.2: Base Excitation Model 1 DOF. The governing equation for the model shown in Figure 3.2 is shown in Equation = (3.1) In Equation 3.1 and Figure 3.2, m is the mass, k i is the stiffness of the damper, and c i is the damping constant of the system. The subscript i is indicative of the MR damper s ability to change its properties with the change of input current to the electromagnet. Also, x is the displacement of the isolated mass (m), x b is the displacement of the base, and f is the external force acting on the mass. Displacement and acceleration transmissibility are both expressed as ratios of the payload to the base, using displacement or acceleration values as appropriate. These ratios are mathematically equal, as shown in Equation 3.2 below. The second part of the equation relates the parameters from Table 3.1 and the frequency ratio (excitation frequency over natural frequency of the system) to transmissibility. = = =! = "#! $!!% &! (3.2) In Equation 3.2, the subscripts d and a refer to displacement and acceleration, respectively. T d is the displacement transmissibility and T a is the acceleration transmissibility. Also, r i is the frequency ratio between the base excitation frequency and the natural frequency. Force transmissibility (T f) can be directly computed from the displacement transmissibility as: 13
22 ' = ( = ( (3.3) The capability of the damper can be assessed from displacement transmissibility and force transmissibility. However, there is an inherent trade-off between force transmissibility and displacement transmissibility for the frequency ratio of r i > 2. This will be demonstrated further in the subsequent discussion for the damper used in this study Modeling Results and Discussion The simulations for displacement and force transmissibility are presented in this section. MATLAB has been used for all mathematical modeling. The data from Table 3.1 is used for the simulations. In the plots, the X-axis is the ratio of excitation frequency to the natural frequency of the system and the Y-axis is the transmissibility. Only four current levels are used since the stiffness (k i) and damping (c i) constants are not seen to change appreciably with small changes in current. The damping ratio is calculated for the two payloads that are used for experimentation, and is listed in Table 3.1. It can be seen from the data that the damping constant increases with the increasing current input while the stiffness constant does not change appreciably. This has also been reported in the existing literature. The displacement transmissibility and force transmissibility plots for the base excitation system shown in Figure 3.2, with the use of the MR damper, are shown in Figure 3.3 and Figure 3.4. As can be seen from Figure 3.3, increasing the input current reduces displacement transmissibility before the frequency ratio of 2, whereas there is an increase in displacement transmissibility with increasing input current after the frequency ratio of 2. 14
23 Figure 3.3: Displacement Transmissibility versus normalized excitation frequency as a function of input current. As seen in Figure 3.3, the displacement transmissibility has a predictable shape for all the current levels, even though the magnitude of the peak varies with current applied to the damper. Beyond a frequency ratio of approximately 2, the five plots exhibit a mitigation of transmissibility, with the lower level of damping (lower current) resulting in lower transmissibility (T d). It may be noted that Figure 3.3 represents acceleration transmissibility as well. 15
24 Figure 3.4: Force Transmissibility versus normalized excitation frequency as a function of input current. Figure 3.4 shows the force transmissibility plot for the MR damper, and compares it to an undamped system. This plot shows that the change in current to the damper has a significant effect on force transmissibility over the change in frequency. With an increase in current, the force transmissibility reduces with the increase of frequency ratio until the frequency ratio of 2. The undamped system is identical to the damper with 0A current input Conclusion Comparing Figures 3.3 and 3.4, after reaching the frequency ratio of approximately 2, the displacement and force transmissibility characteristics of the MR damper sharply diverge from each other. While T d starts at 1, with base displacement being matched by the payload, with an increase in frequency ratio (beyond the natural frequency) T d decreases, approaching 0. Figure 3.4 shows that T f is near 0 at low frequency ratios, and increases with the natural frequency. Similar to displacement transmissibility, the 16
25 current level has a significant impact on the magnitude of the peak. Current level continues to have an impact on the shape of the plot beyond the natural frequency, with an increasing current level increasing the T f value. The divergence of the two models at the frequency ratio of 2 suggests a trade-off between force and displacement transmissibility beyond that frequency. The findings from the mathematical models match expectations from the relevant literature. The behavior of the MR damper can be directly attributed to the increase in damping with the increasing input current that governs the behavior of the electromagnet of the damper. However, a crucial difference between a passive damper and the MR damper is that the damping levels can be changed continuously to meet the requirements of the isolation system with a changing payload or with a changing excitation frequency. The results from force transmissibility in Figure 3.4 are consistent with the findings from the displacement transmissibility plot, highlighting the ability of the MR damper to meet the needs of active damping. It may be noted that there are multiple models of an MR damper in the existing literature, particularly in order to represent hysteresis and saturation behavior over large displacement amplitudes. However, the focus of this study is on small amplitudes of displacements. Therefore, these models have not been used for the purposes of this study. 17

26 CHAPTER 4 : EXPERIMENTAL RESULTS This chapter presents the highlights of the experimental results obtained during the course of the study. The steps involved in planning and executing the experimental work are also included. The results are analyzed and discussed in detail Damper Characterization The magnetorheological (MR) damper used in this study was procured from LORD Corporation. This is a mono-tube damper (RD ) with a maximum stroke length of 74 mm, a body diameter of 42.1 mm and a maximum extended length of 248 mm. The input current to the electromagnet can be varied up to a maximum of 2 A with an intermittent input, and up to 1.5 A with a constant input. The MR damper and the controller kit used in this study are shown in Figure 4.1. Figure 4.1: MR Damper and Control Kit. The damper used in this study was characterized in order to establish a baseline that could be used to comprehend the behavior of the damper. The characterization results were used to identify the stiffness behavior of the damper at different input currents to the electromagnet. Since the MR damper 18
. The tensile tester used for these tests is manufactured by Instron (Model No: 5967).")
27 exhibits a semi-active behavior, it is essential to characterize the damper at different levels of input current. A series of tests were performed on a Universal Tensile Testing machine (also called as the tensile tester). The tensile tester used for these tests is manufactured by Instron (Model No: 5967). A picture of the test setup used for damper characterization is shown in Figure 4.2. It may be noted that mounting pins had to be manufactured to clamp the upper and lower end of the damper to the two grippers of the tensile testing machine, as shown in Figure 4.2. Figure 4.2: Test setup for damper characterization. The use of the mounting pins prevented possible damage to the eyes of the damper, and allowed for some freedom of rotation. The damper was placed as vertically as possible within the grippers. The following loading procedure was followed for the testing: Turn on machine and computer, turn on compressed air line for the grippers; Insert a pin into upper (rod end) eye of the damper and place upper end of damper with the pin in the gripper, ensuring that the faces of the pin contact the surfaces of the grippers, allowing rotation of the damper body; Close the upper gripper and open the lower gripper; 19
28 Lower the upper cross member, allowing the lower damper eye with the inserted pin to descend; Stop movement when lower pin/eye is at an appropriate height to have its faces entirely contacted by the gripper surface; Close the lower gripper, ensuring that only the faces of the pin are contacted; Move the grippers by 10 mm (closer to each other) to ensure that the damper will not be damaged by accidental over-extension during testing. This test procedure ensured that testing is performed midway through the damper stroke. The damper was firmly held by the grippers of the tensile tester, and the test was conducted in compression. The variables of interest during this test were the compression rate and the compression force along with the current supplied to the damper through the controller kit. Relative to full extension, the test range was from 10 mm to 40 mm of compression. It may be noted that the damper has a maximum stroke length of 54 mm. The testing can be classified into two categories: constant velocity and constant force. The tests with a constant velocity setting had a response variable of force exerted by the damper. The load was applied at a variable rate ranging from 10 to 20 mm/min. The input current for the electromagnet of the damper was varied from 0 to 1.5 A in various increments. The increments and the variables associated with this test are listed in Table 4.1. Another series of tests was conducted in order to focus on applying a constant force so as to determine an appropriate payload for the damper when it is used for testing on the shaker table. This is specifically important because the damper has an in-built gas charged accumulator. Tests were performed at multiple constant loads and the current to the electromagnet of the damper was varied. 20
29 Table 4.1: Damper Characterization list of test runs. Amperage (A) Rate (N) Amperage (A) Rate (N) Amperage (A) Rate (mm/min) Amperage (A) Rate (mm/min) Amperage (A) Rate (N) Amperage (A) Rate (mm/min) Some of the test results obtained from the damper characterization are shown in Figure 4.3 and Figure 4.4. It can be discerned from the force-displacement characteristics that the damper stiffness increases as the input current to the electromagnet increases. Also, the saturation level is seen to increase with the increasing strain rate. Note that in both Figures, the 0A and 0.1A lines overlap significantly. 21
30 Figure 4.3: Force-displacement characteristics (at 10 mm/min). Figure 4.4: Force-displacement characteristics (at 20 mm/min). The damper parameters identified from the characterization test discussed above are shown in Table 4.2. Only four current levels are used since the stiffness (k i) and damping (c i) constants are not seen to change 22
31 appreciably with small changes in current. The damping ratio is calculated for the two payloads that were used for experimentation in shaker testing. It can be seen from the data that the damping constant increases with the increasing current input while the stiffness constant does not change appreciably. This has also been reported in the existing literature [7]. Table 4.2: Damper Parameters two configurations. Current k i c i ζ i ζ i (A) (N/m) (Ns/m) (m = 11.5 kg) (m = 14.9 kg) The damper characterization discussed in this section is used to develop the shaker table test that will be discussed in Section Shaker Table Testing A layout of the experimental setup used for the shaker table testing is shown in Figure 4.5. The shaker table that was used to generate the excitation for this experiment is an Unholtz Dickie model S452 LP (low profile), with a model SA-15 control unit. Data acquisition system Base accelerometer Payload Shaker table Payload accelerometer MR Damper Power supply & MR control Controller Figure 4.5: Experimental setup block diagram. As shown in Figure 4.5, The MR damper is connected to the single degree-of-freedom shaker table to provide base excitation. The piston end of the damper is assembled to the payload and the other 23

32 end of the damper is securely assembled to the top plate of the shaker table. Accelerometers are connected to the top plate of the shaker table as well as the payload. Both accelerometers are connected to the data acquisition system. The electromagnet of the MR damper is connected to the controller kit that is in turn connected to a DC power supply. A National Instruments c-daq-9172 with a NI 9234 accelerometer module is used for data collection at a sampling frequency of 1600 Hz. A pair of Dytran 3019A accelerometers are used in conjunction with their respective power amplifiers. The shaker table is driven by its controller through a function generator. An Agilent 33220A 20 MHz Function/Arbitrary waveform generator was connected to the control unit, and was used to generate the input signal for the shaker table testing. The armature, the driven part of the shaker, has a pattern of mounting studs permanently attached to the surface, with each stud having a 3/8-16 threaded hole. It may be noted that data collection is started after several cycles of excitation in order to allow the system to settle. A picture of the entire test setup is shown in Figure 4.6. Figure 4.6: Shaker table test setup. 24


33 Several components were fabricated in order to assemble the test setup. To connect the lower eye of the damper to the table, a bracket was designed and milled. A mounting bolt was inserted through a hole in the bracket to connect the damper to the top surface of the shaker table. In order to keep the damper upright, an aluminum collar was fabricated. This collar was pocketed by using a milling machine in order to make an interior diameter equal to the outside diameter of the damper body. A slot was cut through the collar, and a screw was threaded into it so that the tension on the damper could be adjusted. Initially, a single support bracket was made out of aluminum to limit movement in the axis not constrained by the damper eye. While this setup did limit unwanted motion of the damper, there was an excessive side-to-side movement, especially with a payload and with input vibration from the shaker table. Such a degree-of-freedom could have potentially introduced errors into accelerometer data collection, or even damaged the damper. A new set of braces was fabricated to support the damper. A picture of the fixture fabricated to support the damper is shown in Figure 4.7. Figure 4.7: Damper support fixture partial assembly. 25

34 To enhance the rigidity of the damper support, an additional support was provided. With these supports, the damper could be centered on the table, with the braces oriented at 90 degrees from each other. This design located the damper rigidly without providing an additional degree-of-freedom even after assembling the payload and providing vibrational inputs from the shaker. The final supporting fixture is shown in Figure 4.8. Figure 4.8: Damper support fixture complete assembly. The payloads for testing were made from a combination of weights, these were selected based on availability and the overall payload capability of the shaker. The payload weights were built from a combination of 10 kg, 6.6 kg and 4.9 kg weights. These weights were used to provide payloads of 11.5 Kg and 14.9 Kg for testing. To secure the range of weights to the top of the damper, an aluminum bracket was made. This bracket fit over the upper eye of the damper, and had a pin pass through the eye and the bracket to hold them together. Set screws were tapped into the lower part of the bracket to prevent any relative rotation between the bracket and the damper. A bolt was inserted through the top of the bracket, 26

35 and passed through a plate and the payload weights. The accelerometer fixture for the payload was a threaded block that went onto the end of the rod, securing the payload. The complete payload assembly with the accelerometer is shown in Figure 4.9. Figure 4.9: Payload assembly. The two accelerometers used to measure acceleration during this study were mounted so as to allow a comparison of the input excitation with the acceleration experienced by the payload. The accelerometer mounted on the shaker table was threaded into an insert that had internal ¼-28 threads to match the accelerometer, and 3/8-16 external threads to match the integrated studs on the shaker table. As mentioned earlier, and shown in Figure 4.9, the payload accelerometer was threaded directly into a block that also acted as a nut to secure the payload to the payload bracket and the upper damper eye. Both accelerometers were connected to power amplifiers, and then to the data acquisition system through coaxial cables. 27

36 A National Instruments c-daq-9172 unit with a NI 9234 accelerometer module was used to collect the acceleration data through LabView. Each data set was output into a folder with the log name as the label, and each folder contained three files: a TDMS file, which was the log file and could be opened using Microsoft Excel; a TDMS_INDEX file used by the software, and a text file that contained the metadata about the data set, the log name and description, number of samples, log duration, and other information. Figure 4.10 shows a screen shot of the software interface. Each data collection run was conducted so as to record analog acceleration signals from two channels 0 and 1 (from the base and the payload respectively). The settings for both channels were identical. The voltage output from the accelerometers was discretized at the sampling frequency in terms of millivolts (mv) with a sensitivity of 10 mv/g, as seen in Figure It may be noted that the unit g represents acceleration due to gravity (9.81 m/s 2 ), and is a commonly used unit in acceleration measurements. A screen shot of the live data collection is shown in Figure Figure 4.10: Screen shot of shaker table data collection settings. 28
, and the lower graph displays data from channel 1 (payload acceleration).")
37 Figure 4.11: Screen shot of shaker table acceleration data collection. In Figure 4.11, the top graph displays data from channel 0 (base acceleration), and the lower graph displays data from channel 1 (payload acceleration). For all the test runs, the shaker table input was provided by the frequency generator through the controller. The damper was controlled separately by the control module, and the input current to the electromagnet of the damper was measured by a multimeter. The overall test setup corresponds to the block diagram shown in Figure 4.5. All post-processing of the data was performed in MATLAB. The post-processing consisted of filtering the data, transforming the time domain data into frequency domain, and calculating metrics such as the root mean square (RMS) and the peak values of acceleration to evaluate vibration mitigation capability of the damper. The output of all the test runs is shown in the next section. The testing on the shaker table consisted of two main settings constant frequency, and frequency sweep. Table 4.3 shows a list of the settings used for each variable. 29
38 Table 4.3: Test Settings (shaker table). Amplitude (mvpp) Static Frequency (Hz) Frequency Sweeps (Hz) Current (amps) Payload (Kg) All tests runs lasted for two to three minutes. Due to the possibility of an increase in the fluid temperature during testing, a fan was used during the test runs and temperature was monitored during testing. The temperature was found to be remain within 65 to 75 degrees Fahrenheit. After the first few runs, the temperature was not recorded any more since the temperature did not vary significantly. As seen in Table 4.3, two types of runs were made using the shaker table constant frequency runs, and runs with frequency sweeps Damping Results This section summarizes all the results. Although a large number of runs were performed at varying amplitudes and frequencies, a limited amount of data is presented in this section to showcase the main findings about the capability of the damper. Figures 4.12 through 4.14 show typical results from the constant frequency testing. The results indicate that acceleration levels were generally reduced between the table and payload, as seen in the time response as well as the frequency response. There is no shift in frequency, as seen from the frequency response, but the accelerations are mitigated. Figure 4.12 shows a comparison between the acceleration of the table (or base) and the acceleration of the payload in the time domain when the base is excited at 10 Hz. As can be clearly discerned, the acceleration of the payload is significantly mitigated. 30

39 Figure 4.12: Acceleration versus time for a constant excitation frequency (10 Hz, 200mVpp), input current of 0.4A, payload of 14.9 kg. Figure 4.13 shows the comparison of the data shown in Figure 4.12 in the frequency domain. The ability of the damper to mitigate vibration is again apparent, as seen by the significantly lower amplitude of the payload response in the frequency domain. Figure 4.14 shows a hysteresis plot to further compare the base acceleration amplitude with the payload acceleration. The difference between the ranges of acceleration amplitudes can be examined from the hysteresis plot. 31
40 Figure 4.13: Frequency response plot (logarithmic scale) for constant excitation frequency (10 Hz, 200mVpp), input current of 0.4A, payload of 14.9 kg. 32
41 Figure 4.14: Hysteresis plot for constant excitation frequency (10 Hz, 200mVpp), input current of 0.4A, payload of 14.9 kg. It may be noted that the frequency response in Figure 4.13 regards to the magnitude of acceleration in the frequency domain. Output from some more test runs is shown in the subsequent part of this section, particularly from the test runs involving a frequency sweep from 9 to 16 Hz. Figures 4.15 and 4.16 show one such result for a payload of 11.5 kg in the time and frequency domains respectively. Some vibration mitigation can be seen from the time domain results in Figure 4.15, and multiple peaks are observed in Figure 4.16 since the input excitation covers a range of frequency. Mitigation is seen to be higher in certain frequency ranges due to the inherent natural frequency of the system being tested. This will be discussed further. 33
42 Figure 4.15: Acceleration versus time for a payload of 11.5 kg, damper current of 0.2A, frequency sweep from 9-16 Hz, amplitude of 400 mvpp. Figure 4.16: Frequency response plot, logarithmic scale; payload of 11.5 kg, damper current of 0.2A, frequency sweep from 9-16 Hz, amplitude of 400 mvpp. 34
43 Figure 4.17 shows a hysteresis plot to compare the ranges of acceleration between the payload and the base. This plot does not show an appreciable difference between the ranges of acceleration. However, these results can be interpreted better by comparing peak accelerations and RMS accelerations at several input currents. This will be discussed in the subsequent part of this section. Figure 4.17: Payload acceleration versus table acceleration plot; payload of 11.5 kg, damper current of 0.2A, frequency sweep from 9-16 Hz, amplitude of 400 mvpp. Another set of test results is shown in Figures 4.18 through The main distinction between these results and the results in Figures 4.15 through 4.17 is that the input current to the electromagnet of the damper has been increased from 0.2 A to 0.7 Hz. Although there is no appreciable difference between the two set of results in the time and frequency domains, a comparison of the maximum and RMS levels of acceleration will demonstrate that the increase in the current enhances damping. 35

44 Figure 4.18: Acceleration versus time plot; payload of 11.5 kg, damper current of 0.7A, frequency sweep from 9-16 Hz, amplitude of 400 mvpp. Figure 4.19: Frequency response plot, logarithmic scale; payload of 11.5 kg, damper current of 0.7A, frequency sweep from 9-16 Hz, amplitude of 400 mvpp. 36
45 Figure 4.20: Payload acceleration versus table acceleration plot; payload of 11.5 kg, damper current of 0.7A, frequency sweep from 9-16 Hz, amplitude of 400 mvpp. Two more sets of results are shown in Figures 4.21 through 4.23 and Figures 4.24 through 4.26 for the higher payload at two distinct current levels. Similar conclusions can be drawn from these additional sets. 37

46 Figure 4.21: Acceleration versus time plot; payload of 14.9 kg, damper current of 0.2A, frequency sweep from 9-16 Hz, amplitude of 400 mvpp. Figure 4.22: Frequency response plot, logarithmic scale; payload of 14.9 kg, damper current of 0.2A, frequency sweep from 9-16 Hz, amplitude of 400 mvpp. 38

47 Figure 4.23: Payload acceleration versus table acceleration plot; payload of 14.9 kg, damper current of 0.2A, frequency sweep from 9-16 Hz, amplitude of 400 mvpp. Figure 4.24: Acceleration versus time plot; payload of 14.9 kg, damper current of 0.7A, frequency sweep from 9-16 Hz, amplitude of 400 mvpp. 39
48 Figure 4.25: Frequency response plot, logarithmic scale; payload of 14.9 kg, damper current of 0.7A, frequency sweep from 9-16 Hz, amplitude of 400 mvpp. Figure 4.26: Payload acceleration versus table acceleration plot; payload of 14.9 kg, damper current of 0.7A, frequency sweep from 9-16 Hz, amplitude of 400 mvpp. 40
49 The RMS and peak values of acceleration are computed to compare the levels of acceleration between the base and the payload. This is done to objectively analyze the test results obtained from different levels of input current, and in order to comprehend the capability of the damper. Table 4.4 summarizes this comparison for all the runs that were performed for an input of frequency sweeps between 9 and 16 Hz. All the accelerations in the Table 4.4 are in units of g. It may be noted that the data presented in this table are not exhaustive, and do not present all the data that were collected as part of this study. This table is being used to represent some of the highlights of the results obtained during the testing performed on the shaker table. 41
50 Table 4.4: Comparison RMS and maximum acceleration. Root Mean Square (RMS) Acceleration Values, in units of 'g' Payload of 11.5 kg Payload of 14.9 kg Amplitude (mvpp) Amplitude (mvpp) Current (A) Location Current (A) Location Base Base 0 Payload Payload 0.2 Base Base Payload Payload Base Base Payload Payload Base Base Payload Payload Base Base Payload Payload Base Base Payload Payload Base Base Payload Payload Base Base Payload Payload Maximum Acceleration Values, in units of 'g' Payload of 11.5 kg Payload of 14.9 kg Amplitude (mvpp) Amplitude (mvpp) Current (A) Location Current (A) Location Base Base 0 Payload Payload 0.2 Base Base Payload Payload Base Base Payload Payload Base Base Payload Payload Base Base Payload Payload Base Base Payload Payload Base Base Payload Payload Base Base Payload Payload
51 The comparison between the RMS and peak values of acceleration between the base and payload is shown in the form of bar graphs in Figs to The RMS acceleration is seen to be mitigated at all current levels in Figures 4.27 and 4.28 with the exception of 0 A. This is because damping is particularly low where there is no current input to the electromagnet of the damper Payload: 11.5 kg, RMS acceleration, 400 mvpp Acceleration (g) Base Payload Input current (A) Figure 4.27: Comparison of base and payload RMS values, payload: 11.5 kg, amplitude: 400 mvpp, frequency sweep: 9-16 Hz over 60 seconds Payload: 14.9 kg, RMS acceleration, 400 mvpp Acceleration (g) Base Payload Input current (A) Figure 4.28: Comparison of base and payload RMS values, payload: 14.9 kg, amplitude: 400 mvpp, frequency sweep: 9-16 Hz over 60 seconds. 43
52 The mitigation levels are particularly high when the peak values of acceleration are compared, as seen in Figures 4.29 and Mitigation is seen to increase to 60% or above when the input current is increased to 0.5A or above. These results are indicative of the semi-active capability of the damper, that is to say that the damper can be adjusted to provide a specific level of vibration isolation. Payload: 11.5 kg, Peak acceleration, 400 mvpp Acceleration (g) Base Payload Input current (A) Figure 4.29: Comparison of base and payload peak acceleration values, payload: 11.5 kg, amplitude: 400 mvpp, frequency sweep: 9-16 Hz over 60 seconds. Payload: 14.9 kg, Peak acceleration, 400 mvpp Acceleration (g) Base Payload Input current (A) Figure 4.30: Comparison of base and payload peak acceleration values, payload: 14.9 kg, amplitude: 400 mvpp, frequency sweep: 9-16 Hz over 60 seconds. 44
53 Figures 4.31 and 4.32 show one more comparison between the acceleration levels of the base and the payload with the changing excitation amplitude. As can be seen from these figures, the mitigation stays high even with increased excitation amplitudes, particularly when the peak levels are compared, as seen in Figure Payload: 11.5 kg, RMS acceleration, varied amplitudes 0.05 Acceleration (g) mv 400mv 600mv Excitation amplitude (peak-to-peak) 0.5 amps Base 0.5 amps Payload 0.7 amps Base 0.7 amps Payload Figure 4.31: Comparison of base and payload RMS acceleration values over various amplitudes of excitation (200, 400, 600mVpp). Frequency sweep: 9-16 Hz over 60 seconds, payload: 11.5 kg. Acceleration (g) Payload: 11.5 kg, Peak acceleration, varied amplitudes 200mv 400mv 600mv Excitation amplitude (peak-to-peak) 0.5 amps Base 0.5 amps Payload 0.7 amps Base 0.7 amps Payload Figure 4.32: Comparison of base and payload peak acceleration values over various amplitudes of excitation (200, 400, 600mVpp). Frequency sweep: 9-16 Hz over 60 seconds, payload: 11.5 kg. 45
54 4.4. Conclusion From the test results discussed in this chapter, it can be concluded that the MR damper exhibits characteristics that demonstrate a semi-active behavior. Direct control of input current to the electromagnet of the damper can be used to reduce the force that is transmitted to a payload due to base excitation. The damper is seen to behave consistently with increase in the current resulting in an increase in damping. Peak accelerations were found to be reduced by 50 to 70% in some cases, showcasing the capability of the damper with adjustable current. The damper characterization demonstrates very little change in stiffness. This characterization is used to build the model for calculating transmissibility. The test setup developed for this study is reliable and robust and can be used for future testing. 46
55 CHAPTER 5 : CONCLUSIONS AND FUTURE WORK While the existing damping technologies are pretty effective and are being widely used in automotive and industrial applications, there is a universal pursuit for improvement in order to enhance ergonomics and increase fatigue life. To this end, active materials are being investigated and utilized more often to overcome limitations and constraints associated with current technologies involving passive damping. The focus of this study has been on one such semi-active material that has shown promise, namely magnetorheological fluid that is used in dampers Research Goals The primary goal of this research is to gain a clear understanding of a commercial MR damper and its properties and characteristics within a range of test conditions. While these test conditions include several variables at multiple levels, some of the extreme limits of the damper s capabilities have not been investigated in this study due to constraints of the test facilities. Some of these aspects of research limitations are discussed in Section 5.3 as part of possible future scope for this study. The main influences of multiple variables affecting the damper s capability in mitigating vibrations are investigated and presented in this chapter Results and Observations From the analysis of all the data collected for this study, it can be concluded that the damper behavior is generally seen to be as per expectations of a semi-active damper. There are some exceptions or observations that may be attributed to different reasons or a lack of extensive data. In general, increasing the input current to the electromagnet resulted in an enhancement of vibration mitigation with an increase in the difference between the base and payload accelerations. In many cases, however, the rise in the current level caused a disproportionate increase in the acceleration of the base. This is exemplified from the results in Figure 4.29 in Chapter 4, which shows peak acceleration values for a payload of 11.5 kg. The RMS values for the same data set are seen in Figure 4.27, where somewhat similar results are shown both base and payload are seemingly affected by a change in current, but the base is seen to be 47
56 affected more severely than the payload. The relative increase in the acceleration levels at the base is not proportional to the increase in the acceleration levels of the payload. The underlying reasons for this are not completely understood and will require further investigation. The stiffness of the damper is seen to remain constant with an increase in the input current while the damping constant increases, as seen in Table 4.2 in Chapter 4. Although the stiffness constant may also increase with the increasing current, this has not been observed in this study since small excitation amplitudes have been used for base excitation. Changes in excitation frequency (within the tested range) do not appear to have a significant effect on vibration mitigation. However, the excitation amplitude is seen to have a direct effect on acceleration levels. In all cases, the input current supplied to the electromagnet of the damper is seen to have a direct influence on transmitted vibration and can be used as the control variable for the damper. The change in input current directly influences the strength of the magnetic field, affecting the fluid s yield strength, as discussed in Chapters 2 and 3. External factors such as the mass of the payload are seen to have a significant influence, as seen in Figures 5.1 and 5.2. Figures 5.1 and 5.2 show the difference between the RMS accelerations of the base and the payload at multiple levels of input current for two different payloads. The acceleration of the base is consistently higher than the acceleration of the payload for all test cases, as seen in Figures 5.1 and 5.2, but there is no apparent trend in the level of mitigation. 48
57 Base RMS -Payload RMS kg Amperage to damper 14.9kg Figure 5.1: Comparison of RMS acceleration between payload and base as a function of payload mass and input current Peak Base -Peak Payload kg kg Amperage to Damper Figure 5.2: Comparison of peak acceleration between payload and base as a function of payload mass and input current. Figures 5.3 and 5.4 show the effects of excitation amplitude at two different current levels (0.5 A and 0.7 A) and at a constant payload of 11.5 kg. While the RMS acceleration is highest at the excitation 49
58 amplitude of 400mV, there is no clear trend within this data. Further data collection may be necessary in order to comprehend this effect Acceleration (g) mv 400mv 600mv Amplitude of excitation 0.5 amps 0.7 amps Figure 5.3: RMS acceleration varying excitation amplitude, 11.5 kg payload. Acceleration (g) mv 400mv 600mv Amplitude of excitation 0.5 amps 0.7 amps Figure 5.4: Peak acceleration varying excitation amplitude, 11.5 kg payload. By comparing the RMS values of the measured accelerations from the base and payload, there is an observable trend of increased vibration mitigation with an increase in input current. This trend is 50
59 especially noticeable when comparing the peak acceleration of the base to the payload, as in Figure 4.29, while comparing the peak values at a payload of 11.5 kg. This can be compared to Figure 4.30, where a payload of 14.9 kg is used and the peak accelerations are compared between the base and payload. For the payload of 11.5 kg, the reduction in the maximum acceleration ranges from 4.2% to 47.5%. However, input current above 1 A increases the maximum acceleration. This is possibly due to a significant increase in damping and can be corroborated from the transmissibility plots discussed in Chapter 3. The comparison of RMS acceleration shows a mitigation ranging from 0.75% to 2.6%. This is relatively lower than the comparison of the maximum acceleration levels since the RMS value represents the entire time history and because base excitation is provided from 9 to 16 Hz. Similar results have been reported in the literature for shock isolation through MR dampers. For a payload of 14.9 kg, a 29% increase over the payload of 11.5 kg, the mitigation results range from 4.7% to 39.8% while comparing the RMS and the maximum values of acceleration between the payload and the base. These levels of mitigation are comparable to the performance with the lower payload. This test serves as a validation of the capability of the MR damper in dealing with variable payloads due to its inherent ability to adjust damping levels. It can be concluded that the experimental setup and the test method developed for this study are robust and can be replicated for a similar study of vibration mitigation. The setup also allows for easy and efficient changes of payload, as well as the simple adjustments to the excitation levels and input current to the damper. The influence of variables such as payload mass, excitation amplitude and excitation frequency has been successfully assessed through the setup designed for this study. It is found that the damper is robust and is capable of handling payload and excitation variability. The semi-active nature of the MR damper is a key attribute, meaning that the damper continues to be functional even if the control circuit and the electromagnet fail. With regards to the data collected from this study, it may be necessary to investigate other measures of quantification of acceleration over a large period in time. While the RMS values of acceleration are convenient and provide one value, they may not adequately represent the results. The 51
60 peak values of acceleration are convenient to use but they only represent one value of acceleration in the entire time history and could, therefore, be misleading. The choice of the appropriate range of excitation frequency is important in any vibration testing. In this study, the range of excitation frequency has been selected to be well above the natural frequency (around 1 Hz) in order to evaluate vibration mitigation at high frequency ratios (9 and above). However, this may not capture the needs of some systems and needs to be evaluated carefully on a case-by-case basis Future Work There are several directions that the future work with the MR damper could take. A direct continuation of this research would be to simply continue collecting data at multiple additional settings in order to verify the repeatability of the data presented, and to statistically determine any trends that may be present. An important aspect of this line of continuation would be to use excitation frequency as a factor at multiple levels instead of using a frequency sweep. This would significantly increase the amount of data collection, but could provide more insight into the capability of the damper. There is a significant difference between the peak and RMS values of acceleration, as expected. It may be worth investigating a more consistent method of simplifying and reporting the acceleration values, or modifying the test method for that purpose. This modification may in fact be necessary to run a statistical analysis on the various input factors. Future work could involve the investigation of a control algorithm for the damper. This could potentially quantify the outputs from properly placed accelerometers and adjust the current to the damper accordingly, resulting in an actively adjusting damping system in a closed loop. Current literature outlines various control schemes and methods but the control algorithms are non-trivial since the damping level is not directly controlled and is dependent on multiple variables. The experimental setup developed in this study can be used for this purpose. Other future work can include a continued investigation into the damper s capabilities with further investigation under a broader range of frequencies, for instance between 10 and 500 Hz with multiple higher payloads. This study could include higher displacement amplitudes, but that would 52
61 require another shaker table. The use of a shock dynamometer would allow testing the damper at higher displacements amplitudes (at the expense of higher frequencies), this could greatly expand the scope of the research. Other areas of work could include an investigation of environmental effects such as temperature. It is known that the MR damper exhibits a strong temperature dependent behavior. An investigation of the damper s performance across a broad range of temperatures would be useful for any real-life application of the damper. Durability and fatigue testing of the damper at multiple duty cycles could provide valuable information during the selection process of a suitable damper. During the course of this study, the damper was never excited continuously for more than ten minutes at a given time. This limited usage does not represent the needs of an application that may involve more than a million cycles of operation. The use of the damper can also be investigated for specific applications. One such study is being currently undertaken by a fellow graduate student in our research group that involves the use of MR dampers in a motorcycle suspension system. 53
62 WORKS CITED [1] Olabi, A.G., Grunwald, A., 2007, Design and application of a magneto-rheological fluid, Materials and Design, Vol. 28, pp [2] Zhang, X., Li, W., Gong, X.L., 2008, Study on magnetorheological shear thickening fluid, Smart Materials and Structures, Vol. 17, pp [3] Choi, S., Seong, M., Ha, S., 2009, Vibration control of an MR vehicle suspension system considering both hysteretic behavior and parameter variation, Smart Materials and Structures, Vol. 18, pp [4] Carlson, J.D., Jolly, M.R., 2000, MR fluid, foam, and elastomer devices, Mechatronics, Vol. 10, pp [5] Namuduri, C.S., Golden, M.A., Praeckel, J., 2003, Concurrent research and development of a magnetic ride control system, Industrial Electronics Society, IECON '03, The 29th Annual Conference of the IEEE, Vol. 3, pp [6] Wilson, T. (n.d.), Retrieved June 10, 2015, from [7] Ikhouane, F., Dyke, S.J., 2007, Modeling and identification of a shear mode magnetorheological damper, Smart Materials and Structures, Vol. 16, pp [8] Kaul, S., 2011, Recursive modeling of a magnetorheological damper, International Journal of Mechanical and Materials Engineering (IJMME), Vol. 6, pp [9] Strydom, A., Kaul, S., Els, P.S., 2012, Magneto-rheological (MR) Damper Modeling for Semi-active Control without Force Feedback, ASME-IDETC, DETC , Chicago, IL. [10] Dong, X., Yu, M., Liao, C., Chen, W., 2010, Comparative research on semi-active control strategies for magneto-rheological suspension, Nonlinear Dynamics, Vol. 59, pp
63 [11] Sarigul-Klijn, N., Lopez, I., Sarigul-Klijn, M., Karnopp, D., 2007, Vibration mitigation using passive active tunable (PAT) system: Experimental aspects, Journal of Vibration and Acoustics, Vol. 129, pp [12] Ahmadian, M., Pare, C.A., 2000, A quarter-car experimental analysis of alternative semiactive control methods, Journal of Intelligent Material Systems and Structures, Vol. 11, pp [13] Yu, M., Liao, C.R., Chen, W.M., Huang, S.L., 2006, Study on MR semi-active suspension system and its road testing, Journal of Intelligent Material Systems and Structures, Vol. 17, pp [14] Liu, C.X., Liu, X.H., Gao, X.L., Yu, H., Lin, G.W., 2015, Mechanics Performance of a Novel Magneto-Rheological Fluid Damper, Journal of Testing and Evaluation, Vol. 43, DOI: /JTE [15] Choi, Y-T., Wereley, N.M., 2008, Shock Isolation Systems Using Magnetorheological Dampers, Journal of Vibration and Acoustics, Vol. 130, pp
64 APPENDIX A: MATLAB PROGRAMS All the MATLAB programs developed and used for this study are provided in Appendix A. The following MATLAB program provides an example of the post-processing and analysis that has been performed after collecting the accelerometer data. % Data - description of data set aa=xlsread('name of excel file'); aa_base=aa(:,2)/10; %column 2 in the excel file is channel 0, base %[B,A] = butter(6,50/800,'low'); [B,A] = butter(6,[5/ /800]); %h = fvtool(b,a); a_base=filter(b,a,aa_base); rms_base_static=norm(a_base)/sqrt(length(a_base)-1) max_base_static=max(abs(a_base)) aa_payload=aa(:,3)/10; %column 3 in the excel file is channel 1, payload %[B,A] = butter(6,50/800,'low'); [B,A] = butter(6,[5/ /800]); a_payload=filter(b,a,aa_payload); rms_payload_static=norm(a_payload)/sqrt(length(a_payload)-1) max_payload_static=max(abs(a_payload)) figure,plot(aa(:,1),abs(a_base),'g',aa(:,1),abs(a_payload),'r'),grid legend('table','payload'),xlabel('time (s)'), ylabel('acceleration (g)') title('title of plot') % xlim([5 100]) Fs=1600; L=length(a_base); y_b=a_base; NFFT=2^nextpow2(L); y_bf=fft(y_b,nfft)/l; f_b=fs/2*linspace(0,1,nfft/2+1); % rms_bf=norm(y_bf)/sqrt(length(y_bf)-1) L=length(a_payload); y_p=a_payload; NFFT=2^nextpow2(L); y_pf=fft(y_p,nfft)/l; f_p=fs/2*linspace(0,1,nfft/2+1); % rms_pf=norm(y_pf)/sqrt(length(y_pf)-1) figure,semilogx(f_b,2*abs(y_bf(1:nfft/2+1)),'g') % plots frerquency response, x-axis is a logarithmic scale hold on semilogx(f_p,2*abs(y_pf(1:nfft/2+1)),'r'),grid 56
65 legend('table','payload'),xlabel('frequency (Hz)'),ylabel('Frequency Response') %xlim([1 100]) title('title of plot') figure,plot(f_b,2*abs(y_bf(1:nfft/2+1)),'g') % plots frerquency response, x- axis is a linear scale hold on plot(f_p,2*abs(y_pf(1:nfft/2+1)),'r'),grid legend('table','payload'),xlabel('frequency (Hz)'),ylabel('Frequency Response') title('title of plot') %figure, plot(f_p,(abs(y_pf(1:nfft/2+1))./abs(y_bf(1:nfft/2+1)))'),grid %figure, semilogx(f_p,(abs(y_pf(1:nfft/2+1))./abs(y_bf(1:nfft/2+1)))'),grid % Transmissibility % Ta=a_payload./a_base; % Fs=1600; % L=length(Ta); % NFFT=2^nextpow2(L); % Taf=fft(Ta,NFFT)/L; % Taff=Fs/2*linspace(0,1,NFFT/2+1); % figure, semilogx(taff,2*abs(taf(1:nfft/2+1))),grid % xlim([5 100]) % xlabel('frequency (Hz)'),ylabel('Acceleration Transmissibility') figure, scatter(a_base,a_payload),grid % scatter plot of acceleration values xlim([ ]),ylim([ ]) xlabel('table acceleration (g)'),ylabel('payload acceleration (g)') title('title of plot') 57
66 The following MATLAB program has been used to generate Figures 3.3 and 3.4, the theoretical models for force and displacement transmissibility for the MR damper at various current levels. % Transmissibility m=10;%kg k=0.1*1000;% N/m c=0; zeta=c/(2*sqrt(m*k)); wn=sqrt(k/m); T=[];Tf=[]; for r=0:0.1:15; t=sqrt((1+(2*zeta*r)^2)/((1-r^2)^2+(2*zeta*r)^2)); tf=r^2*t; T=[T t];tf=[tf tf]; end figure, plot(0:0.1:15,t,'--rs','linewidth',2),grid hold on k=0.1*1000;% N/m c=2.5;%n-s/m zeta=c/(2*sqrt(m*k)); wn=sqrt(k/m); T0=[];T0f=[]; for r=0:0.1:15; t=sqrt((1+(2*zeta*r)^2)/((1-r^2)^2+(2*zeta*r)^2)); t0f=r^2*t; T0=[T0 t];t0f=[t0f t0f]; end plot(0:0.1:15,t0,'-b','linewidth',2) hold on k=0.15*1000;% N/m c=20;%n-s/m zeta=c/(2*sqrt(m*k)); wn=sqrt(k/m); T0_5=[];T0_5f=[]; for r=0:0.1:15; t=sqrt((1+(2*zeta*r)^2)/((1-r^2)^2+(2*zeta*r)^2)); t0_5f=r^2*t; T0_5=[T0_5 t];t0_5f=[t0_5f t0_5f]; end plot(0:0.1:15,t0_5,'c','linewidth',2) hold on 58
67 k=0.15*1000;% N/m c=30;%n-s/m zeta=c/(2*sqrt(m*k)); wn=sqrt(k/m); T1=[];T1f=[]; for r=0:0.1:15; t=sqrt((1+(2*zeta*r)^2)/((1-r^2)^2+(2*zeta*r)^2)); t1f=r^2*t; T1=[T1 t];t1f=[t1f t1f]; end plot(0:0.1:15,t1,'-.k','linewidth',2) hold on k=0.15*1000;% N/m c=37.5;%n-s/m zeta=c/(2*sqrt(m*k)); wn=sqrt(k/m); T1_5=[];T1_5f=[]; for r=0:0.1:15; t=sqrt((1+(2*zeta*r)^2)/((1-r^2)^2+(2*zeta*r)^2)); t1_5f=r^2*t; T1_5=[T1_5 t];t1_5f=[t1_5f t1_5f]; end plot(0:0.1:15,t1_5,'-*g','linewidth',2),ylim([0 3]),xlim([0 5]) legend('undamped','0a','0.5a','1a','1.5a'),xlabel('frequency ratio \omega/\omega_n'),ylabel('t_d'),title('displacement Transmissibility') figure,plot(0:0.1:15,t0,'-b',0:0.1:15,t0_5,'c',0:0.1:15,t1,'-.k',0:0.1:15,t1_5,'-*g','linewidth',2),grid ylim([0 3]),xlim([0 5]) legend('0a','0.5a','1a','1.5a'),xlabel('frequency ratio \omega/\omega_n'),ylabel('t_d'),title('displacement Transmissibility') figure,plot(0:0.1:15,tf,'--rs',0:0.1:15,t0f,'- b',0:0.1:15,t0_5f,'c',0:0.1:15,t1f,'-.k',0:0.1:15,t1_5f,'- *g','linewidth',2),grid ylim([0 3]),xlim([0 5]) legend('undamped','0a','0.5a','1a','1.5a'),xlabel('frequency ratio \omega/\omega_n'),ylabel('t_f'),title('force Transmissibility') 59
68 The following MATLAB program has been used to analyze and plot the data collected from the tensile testing, and subsequently used to characterize the damper. data_1 = xlsread('data_1'); t1 = data_1(:,1); % time in seconds x1 = data_1(:,2); % displacement in mm xdot1=diff(x1)/0.1; xdot1=[0; xdot1]; f1 = data_1(:,3); % force in N (also called kgf) figure, plot(x1,f1),grid,ylim([0 20]) xlabel('displacement (mm)'), ylabel('force (N)') title('damper Characteristics - 0A') figure, scatter(xdot1,f1),grid xlabel('velocity (mm/s)'), ylabel('force (N)') title('damper Characteristics - 0A') data_2 = xlsread('data_2'); t2 = data_2(:,1); % time in seconds x2 = data_2(:,2); % displacement in mm xdot2=diff(x2)/0.1; xdot2=[0; xdot2]; f2 = data_2(:,3); % force in N figure, plot(x2,f2),grid,ylim([0 20]) xlabel('displacement (mm)'), ylabel('force (N)') title('damper Characteristics - 0.5A') figure, scatter(xdot2,f2),grid xlabel('velocity (mm/s)'), ylabel('force (N)') title('damper Characteristics - 0.5A') data_3 = xlsread('data_3'); t3 = data_3(:,1); % time in seconds x3 = data_3(:,2); % displacement in mm xdot3=diff(x3)/0.1; xdot3=[0; xdot3]; f3 = data_3(:,3); % force in N figure, plot(x3,f3),grid,ylim([0 20]) xlabel('displacement (mm)'), ylabel('force (N)') title('damper Characteristics - 1.5A') figure, scatter(xdot3,f3),grid xlabel('velocity (mm/s)'), ylabel('force (N)') title('damper Characteristics - 1.5A') data_4 = xlsread('data_4'); t4 = data_4(:,1); % time in seconds x4 = data_4(:,2); % displacement in mm xdot4=diff(x4)/0.1; xdot4=[0; xdot4]; f4 = data_4(:,3); % force in N 60
69 figure, plot(x4,f4),grid,ylim([0 20]) xlabel('displacement (mm)'), ylabel('force (N)') title('damper Characteristics - 1A') figure, scatter(xdot4,f4),grid xlabel('velocity (mm/s)'), ylabel('force (N)') title('damper Characteristics - 1A') figure,plot(x1,f1,x2,f2,x4,f4,x3,f3,'linewidth',2),grid,ylim([0 20]) legend('0a','0.5a','1a','1.5a') xlabel('displacement (mm)'), ylabel('force (N)') title('damper Characteristics') 61
70 APPENDIX B: SPECIFICATIONS AND DATA SHEETS Appendix B provides the specification sheets for the main equipment used during this research. The specification sheets for the damper, the controller kit, the power amplifier, the accelerometer and the shaker table are included for reference. 62

71 63


72 64
73 65


74 66


75 67
76 68

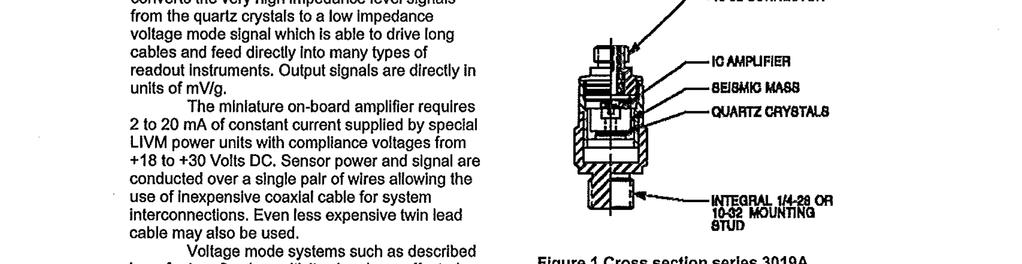

77 69


78 70


79 71
80 72

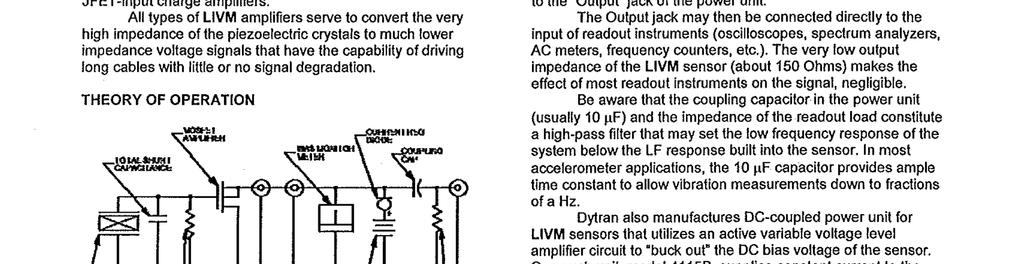

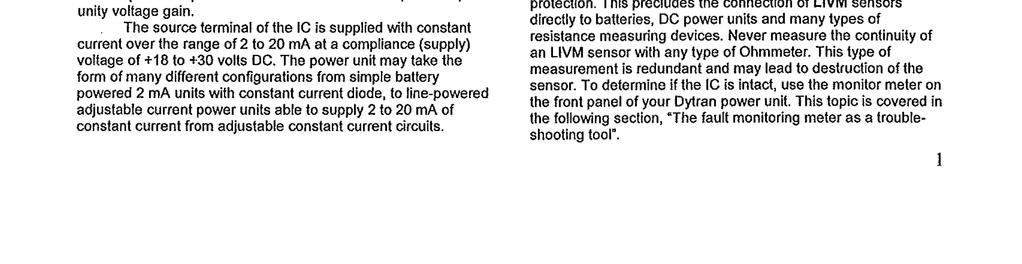
81 73


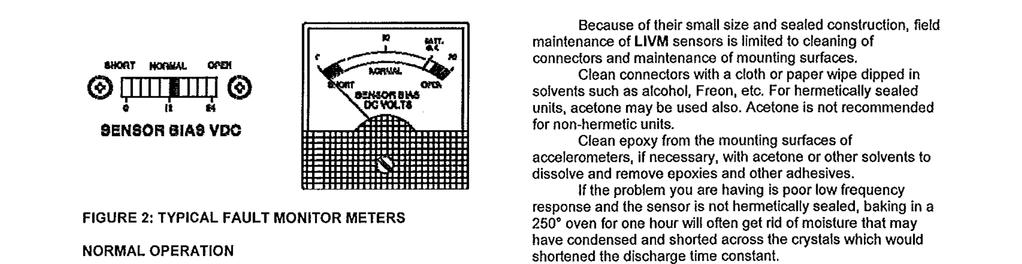
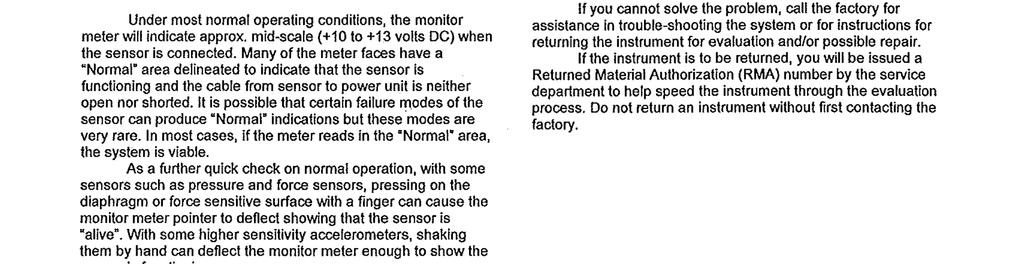
82 74

83 75
Chapter 2. Background
 Chapter 2 Background The purpose of this chapter is to provide the necessary background for this research. This chapter will first discuss the tradeoffs associated with typical passive single-degreeof-freedom
CHAPTER 6 MECHANICAL SHOCK TESTS ON DIP-PCB ASSEMBLY
 135 CHAPTER 6 MECHANICAL SHOCK TESTS ON DIP-PCB ASSEMBLY 6.1 INTRODUCTION Shock is often defined as a rapid transfer of energy to a mechanical system, which results in a significant increase in the stress,
Semi-Active Suspension for an Automobile
 Semi-Active Suspension for an Automobile Pavan Kumar.G 1 Mechanical Engineering PESIT Bangalore, India M. Sambasiva Rao 2 Mechanical Engineering PESIT Bangalore, India Abstract Handling characteristics
Chapter 2 Dynamic Analysis of a Heavy Vehicle Using Lumped Parameter Model
 Chapter 2 Dynamic Analysis of a Heavy Vehicle Using Lumped Parameter Model The interaction between a vehicle and the road is a very complicated dynamic process, which involves many fields such as vehicle
Chapter 4. Vehicle Testing
 Chapter 4 Vehicle Testing The purpose of this chapter is to describe the field testing of the controllable dampers on a Volvo VN heavy truck. The first part of this chapter describes the test vehicle used
KINEMATICAL SUSPENSION OPTIMIZATION USING DESIGN OF EXPERIMENT METHOD
 Jurnal Mekanikal June 2014, No 37, 16-25 KINEMATICAL SUSPENSION OPTIMIZATION USING DESIGN OF EXPERIMENT METHOD Mohd Awaluddin A Rahman and Afandi Dzakaria Faculty of Mechanical Engineering, Universiti
Optimization of Seat Displacement and Settling Time of Quarter Car Model Vehicle Dynamic System Subjected to Speed Bump
 Research Article International Journal of Current Engineering and Technology E-ISSN 2277 4106, P-ISSN 2347-5161 2014 INPRESSCO, All Rights Reserved Available at http://inpressco.com/category/ijcet Optimization
ISSN: SIMULATION AND ANALYSIS OF PASSIVE SUSPENSION SYSTEM FOR DIFFERENT ROAD PROFILES WITH VARIABLE DAMPING AND STIFFNESS PARAMETERS S.
 Journal of Chemical and Pharmaceutical Sciences www.jchps.com ISSN: 974-2115 SIMULATION AND ANALYSIS OF PASSIVE SUSPENSION SYSTEM FOR DIFFERENT ROAD PROFILES WITH VARIABLE DAMPING AND STIFFNESS PARAMETERS
Air Bearing Shaker for Precision Calibration of Accelerometers
 Air Bearing Shaker for Precision Calibration of Accelerometers NOMENCLATURE Jeffrey Dosch PCB Piezotronics 3425 Walden Avenue, Depew NY DUT Device Under Test S B DUT sensitivity to magnetic field [(m/sec
Modeling, Design and Simulation of Active Suspension System Frequency Response Controller using Automated Tuning Technique
 Modeling, Design and Simulation of Active Suspension System Frequency Response Controller using Automated Tuning Technique Omorodion Ikponwosa Ignatius Obinabo C.E Evbogbai M.J.E. Abstract Car suspension
Mathematical Modelling and Simulation Of Semi- Active Suspension System For An 8 8 Armoured Wheeled Vehicle With 11 DOF
 Mathematical Modelling and Simulation Of Semi- Active Suspension System For An 8 8 Armoured Wheeled Vehicle With 11 DOF Sujithkumar M Sc C, V V Jagirdar Sc D and MW Trikande Sc G VRDE, Ahmednagar Maharashtra-414006,
Influence of Parameter Variations on System Identification of Full Car Model
 Influence of Parameter Variations on System Identification of Full Car Model Fengchun Sun, an Cui Abstract The car model is used extensively in the system identification of a vehicle suspension system
A STUDY OF HYDRAULIC RESISTANCE OF VISCOUS BYPASS GAP IN MAGNETORHEOLOGICAL DAMPER
 ACTA UNIVERSITATIS AGRICULTURAE ET SILVICULTURAE MENDELIANAE BRUNENSIS Volume 64 134 Number 4, 2016 http://dx.doi.org/10.11118/actaun201664041199 A STUDY OF HYDRAULIC RESISTANCE OF VISCOUS BYPASS GAP IN
EFFECTIVE SOLUTIONS FOR SHOCK AND VIBRATION CONTROL
 EFFECTIVE SOLUTIONS FOR SHOCK AND VIBRATION CONTROL Part 1 Alan Klembczyk TAYLOR DEVICES, INC. North Tonawanda, NY Part 2 Herb LeKuch Shocktech / 901D Monsey, NY SAVIAC Tutorial 2009 Part 1 OUTLINE Introduction
MODELING SUSPENSION DAMPER MODULES USING LS-DYNA
 MODELING SUSPENSION DAMPER MODULES USING LS-DYNA Jason J. Tao Delphi Automotive Systems Energy & Chassis Systems Division 435 Cincinnati Street Dayton, OH 4548 Telephone: (937) 455-6298 E-mail: Jason.J.Tao@Delphiauto.com
Experimental Investigation of Effects of Shock Absorber Mounting Angle on Damping Characterstics
 Experimental Investigation of Effects of Shock Absorber Mounting Angle on Damping Characterstics Tanmay P. Dobhada Tushar S. Dhaspatil Prof. S S Hirmukhe Mauli P. Khapale Abstract: A shock absorber is
Simulation and Analysis of Vehicle Suspension System for Different Road Profile
 Simulation and Analysis of Vehicle Suspension System for Different Road Profile P.Senthil kumar 1 K.Sivakumar 2 R.Kalidas 3 1 Assistant professor, 2 Professor & Head, 3 Student Department of Mechanical
Magneto-Rheological (MR) Suspension Systems FOR INDUSTRIAL APPLICATIONS
 Suspension Systems FOR INDUSTRIAL APPLICATIONS") Magneto-Rheological (MR) Suspension Systems FOR INDUSTRIAL APPLICATIONS Improving Operator Comfort, Health and Safety Operators of heavy machinery spend a lot of time in harsh and unpleasant vibration
Magneto-Rheological (MR) Suspension Systems FOR INDUSTRIAL APPLICATIONS Improving Operator Comfort, Health and Safety Operators of heavy machinery spend a lot of time in harsh and unpleasant vibration
CHAPTER 4: EXPERIMENTAL WORK 4-1
 CHAPTER 4: EXPERIMENTAL WORK 4-1 EXPERIMENTAL WORK 4.1 Preamble 4-2 4.2 Test setup 4-2 4.2.1 Experimental setup 4-2 4.2.2 Instrumentation, control and data acquisition 4-4 4.3 Hydro-pneumatic spring characterisation
Reduction of Self Induced Vibration in Rotary Stirling Cycle Coolers
 Reduction of Self Induced Vibration in Rotary Stirling Cycle Coolers U. Bin-Nun FLIR Systems Inc. Boston, MA 01862 ABSTRACT Cryocooler self induced vibration is a major consideration in the design of IR
INTRODUCTION. I.1 - Historical review.
 INTRODUCTION. I.1 - Historical review. The history of electrical motors goes back as far as 1820, when Hans Christian Oersted discovered the magnetic effect of an electric current. One year later, Michael
Sport Shieldz Skull Cap Evaluation EBB 4/22/2016
 Summary A single sample of the Sport Shieldz Skull Cap was tested to determine what additional protective benefit might result from wearing it under a current motorcycle helmet. A series of impacts were
CHAPTER 1 INTRODUCTION
 CHAPTER 1 INTRODUCTION 1.1 CONSERVATION OF ENERGY Conservation of electrical energy is a vital area, which is being regarded as one of the global objectives. Along with economic scheduling in generation
The Application of Simulink for Vibration Simulation of Suspension Dual-mass System
 Sensors & Transducers 204 by IFSA Publishing, S. L. http://www.sensorsportal.com The Application of Simulink for Vibration Simulation of Suspension Dual-mass System Gao Fei, 2 Qu Xiao Fei, 2 Zheng Pei
SMART FLUID SELF ADAPTIVE DAMPER SYSTEM (SFSADS)
") SMART FLUID SELF ADAPTIVE DAMPER SYSTEM (SFSADS) Santhosh Sivan. K 1, Chandrasekar Sundaram 2 and Hari Krishnan. R 3 ABSTRACT 1,2 Department of Automobile Engineering, Anna University, MIT, Chennai, India
SMART FLUID SELF ADAPTIVE DAMPER SYSTEM (SFSADS) Santhosh Sivan. K 1, Chandrasekar Sundaram 2 and Hari Krishnan. R 3 ABSTRACT 1,2 Department of Automobile Engineering, Anna University, MIT, Chennai, India
Comparison Between Passive And Semi-Active Suspension System Using Matlab/Simulink
 IOSR Journal of Mechanical and Civil Engineering (IOSR-JMCE) e-issn: 2278-1684,p-ISSN: 2320-334X, Volume 13, Issue 4 Ver. I (Jul. - Aug. 2016), PP 01-06 www.iosrjournals.org Comparison Between Passive
1576. Development of a variable-damping magnetorheological damper with multiple poles
 1576. Development of a variable-damping magnetorheological damper with multiple poles Yaojung Shiao 1, Wen-Hwar Kuo 2, Quang-Anh Nguyen 3, Chao-Wei Lai 4 1, 3, 4 Department of Vehicle Engineering, National
Localized-Based Control Algorithm For Passenger Ride Comfort
 Localized-Based Control Algorithm For Passenger Ride Comfort by Suk Jin Kim A thesis presented to the University of Waterloo in fulfillment of the thesis requirement for the degree of Master of Applied
Vibration Measurement and Noise Control in Planetary Gear Train
 Vibration Measurement and Noise Control in Planetary Gear Train A.R.Mokate 1, R.R.Navthar 2 P.G. Student, Department of Mechanical Engineering, PDVVP COE, A. Nagar, Maharashtra, India 1 Assistance Professor,
Electromagnetic Fully Flexible Valve Actuator
 Electromagnetic Fully Flexible Valve Actuator A traditional cam drive train, shown in Figure 1, acts on the valve stems to open and close the valves. As the crankshaft drives the camshaft through gears
Modeling, Design and Simulation of Active Suspension System Root Locus Controller using Automated Tuning Technique.
 Modeling, Design and Simulation of Active Suspension System Root Locus Controller using Automated Tuning Technique. Omorodion Ikponwosa Ignatius Obinabo C.E Abstract Evbogbai M.J.E. Car suspension system
Application of Airborne Electro-Optical Platform with Shock Absorbers. Hui YAN, Dong-sheng YANG, Tao YUAN, Xiang BI, and Hong-yuan JIANG*
 2016 International Conference on Applied Mechanics, Mechanical and Materials Engineering (AMMME 2016) ISBN: 978-1-60595-409-7 Application of Airborne Electro-Optical Platform with Shock Absorbers Hui YAN,
Magnetorheological suspension damper for space application
 Magnetorheological suspension damper for space application Ing. Michal Kubík Supervisors Doc. Ing. Ivan Mazůrek, CSc. Ing. Jakub Roupec, Ph.D. Institute of Machine and Industrial Design Faculty of Mechanical
MGA Research Corporation
 MGA Research Corporation Real Time Simulation Testing Gerald Roesser David Nagle Thomas Hutter MGA Research Corporation 1 MGA Research Corporation PRESENTERS Gerald Roesser BSEE MGA Associate since 2001
Vibration Fundamentals Training System Hands-On Turnkey System for Teaching Vibration Fundamentals
 Vibration Fundamentals Training System Hands-On Turnkey System for Teaching Vibration Fundamentals www.haopute.com email:info@haopute.com phone:02884625157 mobile:18982185717 An Ideal Tool for Optimizing
Using ABAQUS in tire development process
 Using ABAQUS in tire development process Jani K. Ojala Nokian Tyres plc., R&D/Tire Construction Abstract: Development of a new product is relatively challenging task, especially in tire business area.
Research on vibration reduction of multiple parallel gear shafts with ISFD
 Research on vibration reduction of multiple parallel gear shafts with ISFD Kaihua Lu 1, Lidong He 2, Wei Yan 3 Beijing Key Laboratory of Health Monitoring and Self-Recovery for High-End Mechanical Equipment,
Comparison between Optimized Passive Vehicle Suspension System and Semi Active Fuzzy Logic Controlled Suspension System Regarding Ride and Handling
 Comparison between Optimized Passive Vehicle Suspension System and Semi Active Fuzzy Logic Controlled Suspension System Regarding Ride and Handling Mehrdad N. Khajavi, and Vahid Abdollahi Abstract The
Control and Simulation of Semi-Active Suspension System using PID Controller for Automobiles under LABVIEW Simulink
 International Journal of Current Engineering and Technology E-ISSN 2277 4106, P-ISSN 2347 5161 2017 INPRESSCO, All Rights Reserved Available at http://inpressco.com/category/ijcet Research Article Control
Magneto Rheological Semi-Active Damper with External By-pass Circuit in Modular Structure
 ANALELE UNIVERSITĂłII EFTIMIE MURGU REŞIłA ANUL XVII, NR. 2, 2010, ISSN 1453-7397 Alexandru Boltoşi, Cristina OpriŃescu, Amalia łîrdea Magneto Rheological Semi-Active Damper with External By-pass Circuit
Chapter 32: Principles of Active Vibration Control: Magneto-rheological fluids
 Chapter 32: Principles of Active Vibration Control: Magneto-rheological fluids Introduction: A magneto-rheological fluid (MR fluid) is a type of smart fluid in a carrier fluid, usually a type of oil. When
Passive Vibration Reduction with Silicone Springs and Dynamic Absorber
 Available online at www.sciencedirect.com Physics Procedia 19 (2011 ) 431 435 International Conference on Optics in Precision Engineering and Nanotechnology 2011 Passive Vibration Reduction with Silicone
Development and Control of a Prototype Hydraulic Active Suspension System for Road Vehicles
 Development and Control of a Prototype Hydraulic Active Suspension System for Road Vehicles Suresh A. Patil 1, Dr. Shridhar G. Joshi 2 1 Associate Professor, Dept. of Mechanical Engineering, A.D.C.E.T.,
CHAPTER 1. Introduction and Literature Review
 CHAPTER 1 Introduction and Literature Review 1.1 Introduction The Active Magnetic Bearing (AMB) is a device that uses electromagnetic forces to support a rotor without mechanical contact. The AMB offers
Master of Engineering
 STUDIES OF FAULT CURRENT LIMITERS FOR POWER SYSTEMS PROTECTION A Project Report Submitted in partial fulfilment of the requirements for the Degree of Master of Engineering In INFORMATION AND TELECOMMUNICATION
Application of Steering Robot in the Test of Vehicle Dynamic Characteristics
 3rd International Conference on Mechatronics, Robotics and Automation (ICMRA 2) Application of Steering Robot in the Test of Vehicle Dynamic Characteristics Runqing Guo,a *, Zhaojuan Jiang 2,b and Lin
THE PENNSYLVANIA STATE UNIVERSITY DEPARTMENT OF ENGINEERING SCIENCE AND MECHANICS ACTIVE SUSPENSION FOR V2V AND V2I LEARNING OF ROAD COMFORT
 THE PENNSYLVANIA STATE UNIVERSITY DEPARTMENT OF ENGINEERING SCIENCE AND MECHANICS ACTIVE SUSPENSION FOR V2V AND V2I LEARNING OF ROAD COMFORT XIAOMING LIANG Spring 2013 A thesis submitted in partial fulfillment
Load Analysis and Multi Body Dynamics Analysis of Connecting Rod in Single Cylinder 4 Stroke Engine
 IJSRD - International Journal for Scientific Research & Development Vol. 3, Issue 08, 2015 ISSN (online): 2321-0613 Load Analysis and Multi Body Dynamics Analysis of Connecting Rod in Single Cylinder 4
Development and validation of a vibration model for a complete vehicle
 Development and validation of a vibration for a complete vehicle J.W.L.H. Maas DCT 27.131 External Traineeship (MW Group) Supervisors: M.Sc. O. Handrick (MW Group) Dipl.-Ing. H. Schneeweiss (MW Group)
Development of analytical process to reduce side load in strut-type suspension
 Journal of Mechanical Science and Technology 24 (21) 351~356 www.springerlink.com/content/1738-494x DOI 1.7/s1226-9-113-z Development of analytical process to reduce side load in strut-type suspension
VALMONT MITIGATOR TR1
 VALMONT MITIGATOR TR1 Research Verification of the Valmont TR1 Damper Performance MITIGATOR TR1 VIBRATION DAMPER The Valmont TR1 damper has been specifically designed using vibration theory and innovative
MAGNETORHEOLOGICAL FLUID DAMPER WITH EXTERNAL MAGNETIC CIRCUIT. Alexandru Boltosi, Adrian Chiriac, Liviu Bereteu, Ramona Nagy, Voichiţa Hule
 Analele Universităţii de Vest din Timişoara Vol. LII, 2008 Seria Fizică MAGNETORHEOLOGICAL FLUID DAMPER WITH EXTERNAL MAGNETIC CIRCUIT Alexandru Boltosi, Adrian Chiriac, Liviu Bereteu, Ramona Nagy, Voichiţa
EFFECTIVENESS OF THE ACTIVE PNEUMATIC SUSPENSION OF THE OPERATOR S SEAT OF THE MOBILE MACHINE IN DEPEND OF THE VIBRATION REDUCTION STRATEGIES
 Journal of KONES Powertrain and Transport, Vol. 25, No. 3 2018 EFFECTIVENESS OF THE ACTIVE PNEUMATIC SUSPENSION OF THE OPERATOR S SEAT OF THE MOBILE MACHINE IN DEPEND OF THE VIBRATION REDUCTION STRATEGIES
Using MATLAB/ Simulink in the designing of Undergraduate Electric Machinery Courses
 Using MATLAB/ Simulink in the designing of Undergraduate Electric Machinery Courses Mostafa.A. M. Fellani, Daw.E. Abaid * Control Engineering department Faculty of Electronics Technology, Beni-Walid, Libya
Study on Dynamic Behaviour of Wishbone Suspension System
 IOP Conference Series: Materials Science and Engineering Study on Dynamic Behaviour of Wishbone Suspension System To cite this article: M Kamal and M M Rahman 2012 IOP Conf. Ser.: Mater. Sci. Eng. 36 012019
Comparison Of Multibody Dynamic Analysis Of Double Wishbone Suspension Using Simmechanics And FEA Approach
 International Journal of Research in Engineering and Science (IJRES) ISSN (Online): 232-9364, ISSN (Print): 232-9356 Volume 2 Issue 4 ǁ April. 214 ǁ PP.31-37 Comparison Of Multibody Dynamic Analysis Of
FAILURE ANALYSIS & REDESIGN OF A BRAKE CALLIPER SUPPORT. Prof. A. Bracciali, Dr. F. Piccioli, T. De Cicco
 FAILURE ANALYSIS & REDESIGN OF A BRAKE CALLIPER SUPPORT Prof. A. Bracciali, Dr. F. Piccioli, T. De Cicco Dipartimento di Meccanica e Tecnologie Industriali Università di Firenze, via Santa Marta 3, 50139
Influence of Cylinder Bore Volume on Pressure Pulsations in a Hermetic Reciprocating Compressor
 Purdue University Purdue e-pubs International Compressor Engineering Conference School of Mechanical Engineering 2014 Influence of Cylinder Bore Volume on Pressure Pulsations in a Hermetic Reciprocating
Active vibration reduction applied to the compressor of an air-conditioning unit for trams
 Active vibration reduction applied to the compressor of an air-conditioning unit for trams J. Bös, E. Janssen, M. Kauba and D. Mayer Fraunhofer Institute for Structural Durability and System Reliability
Optimal design of a double coil magnetorheological fluid damper with various piston profiles
 11 th World Congress on Structural and Multidisciplinary Optimisation 07 th -12 th, June 2015, Sydney Australia Optimal design of a double coil magnetorheological fluid damper with various piston profiles
Modeling of 17-DOF Tractor Semi- Trailer Vehicle
 ISSN 2395-1621 Modeling of 17-DOF Tractor Semi- Trailer Vehicle # S. B. Walhekar, #2 D. H. Burande 1 sumitwalhekar@gmail.com 2 dhburande.scoe@sinhgad.edu #12 Mechanical Engineering Department, S.P. Pune
Redesign of exhaust protection cover for high air flow levelling valve
 IOSR Journal of Mechanical and Civil Engineering (IOSR-JMCE) e-issn: 2278-1684,p-ISSN: 2320-334X, Volume 11, Issue 2 Ver. II (Mar- Apr. 2014), PP 90-96 Redesign of exhaust protection cover for high air
Comparing FEM Transfer Matrix Simulated Compressor Plenum Pressure Pulsations to Measured Pressure Pulsations and to CFD Results
 Purdue University Purdue e-pubs International Compressor Engineering Conference School of Mechanical Engineering 2012 Comparing FEM Transfer Matrix Simulated Compressor Plenum Pressure Pulsations to Measured
Chapter 7. Alternative Control Methods
 Chapter 7 Alternative Control Methods The purpose of this chapter is to survey other modifications to the skyhook control policy, known as the groundhook and hybrid control policies. These control policies
Proceedings of the World Congress on Engineering 2008 Vol II WCE 2008, July 2-4, 2008, London, U.K.
 Development and Optimization of Vibration Protection Seats (Tempered Springs) for Agricultural Tractor Ch.Sreedhar 1, Assoc. Professor; Dr. K.C.B. Raju 2, Dy.G.M.BHEL; Dr. K. Narayana Rao 3, AICTE; Abstract:
DIRECT TORQUE CONTROL OF A THREE PHASE INDUCTION MOTOR USING HYBRID CONTROLLER. RAJESHWARI JADI (Reg.No: M070105EE)
") DIRECT TORQUE CONTROL OF A THREE PHASE INDUCTION MOTOR USING HYBRID CONTROLLER A THESIS Submitted by RAJESHWARI JADI (Reg.No: M070105EE) In partial fulfillment for the award of the Degree of MASTER OF
DIRECT TORQUE CONTROL OF A THREE PHASE INDUCTION MOTOR USING HYBRID CONTROLLER A THESIS Submitted by RAJESHWARI JADI (Reg.No: M070105EE) In partial fulfillment for the award of the Degree of MASTER OF
A Comparison of the Effectiveness of Elastomeric Tuned Mass Dampers and Particle Dampers
 003-01-1419 A Comparison of the Effectiveness of Elastomeric Tuned Mass Dampers and Particle Dampers Copyright 001 Society of Automotive Engineers, Inc. Allan C. Aubert Edward R. Green, Ph.D. Gregory Z.
test with confidence HV Series TM Test Systems Hydraulic Vibration
 test with confidence HV Series TM Test Systems Hydraulic Vibration Experience. Technology. Value. The Difference. HV Series TM. The Difference. Our philosophy is simple. Provide a system designed for optimum
A REVIEW OF TWO WHEELER VEHICLES REAR SHOCK ABSORBER
 A REVIEW OF TWO WHEELER VEHICLES REAR SHOCK ABSORBER Ganapati Somanna Vhanamane SVERI s College of Engineering Pandharpur, Solapur, India Dr. B. P. Ronge SVERI s College of Engineering Pandharpur, Solapur,
Development of a Dual Mode Vibration Isolator for a Laser Communication Terminal
 Development of a Dual Mode D-Strut@ Vibration Isolator for a Laser Communication Terminal Dale T. Ruebsamen, James Boyd*, Joe Vecera. and Roger Nagel Abstract This paper provides a review of the development
Chapter 5. Design of Control Mechanism of Variable Suspension System. 5.1: Introduction: Objective of the Mechanism:
 123 Chapter 5 Design of Control Mechanism of Variable Suspension System 5.1: Introduction: Objective of the Mechanism: In this section, Design, control and working of the control mechanism for varying
Full Scale Experimental Evaluation for Cable Dampers
 Full Scale Experimental Evaluation for Cable Dampers Liang Dong, Tian Jingxian, Du Chuang, Ma Jinlong Abstract One of the key techniques for building long span cable-stayed bridge is the mitigation of
Transmission Error in Screw Compressor Rotors
 Purdue University Purdue e-pubs International Compressor Engineering Conference School of Mechanical Engineering 2008 Transmission Error in Screw Compressor Rotors Jack Sauls Trane Follow this and additional
Variable Valve Drive From the Concept to Series Approval
 Variable Valve Drive From the Concept to Series Approval New vehicles are subject to ever more stringent limits in consumption cycles and emissions. At the same time, requirements in terms of engine performance,
Estimation of Unmeasured DOF s on a Scaled Model of a Blade Structure
 Estimation of Unmeasured DOF s on a Scaled Model of a Blade Structure Anders Skafte 1, Rune Brincker 2 ABSTRACT This paper presents a new expansion technique which enables to predict mode shape coordinates
Switch design optimisation: Optimisation of track gauge and track stiffness
 1 Switch design optimisation: Optimisation of track gauge and track stiffness Elias Kassa Professor, Phd Department of Civil and Transport Engineering, NTNU Trondheim, Norway E-mail: elias.kassa@ntnu.no
Virtual Durability Simulation for Chassis of Commercial vehicle
 Virtual Durability Simulation for Chassis of Commercial vehicle Mahendra A Petale M E (Mechanical Engineering) G S Moze College of Engineering Balewadi Pune -4111025 Prof. Manoj J Sature Asst. Professor
a. Open the Lab 2 VI file in Labview. Make sure the Graph Type is set to Displacement (one of the 3 tabs in the graphing window).
.") Lab #2 Free Vibration (Experiment) Name: Date: Section / Group: Part I. Displacement Preliminaries: a. Open the Lab 2 VI file in Labview. Make sure the Graph Type is set to Displacement (one of the 3 tabs
Lab #2 Free Vibration (Experiment) Name: Date: Section / Group: Part I. Displacement Preliminaries: a. Open the Lab 2 VI file in Labview. Make sure the Graph Type is set to Displacement (one of the 3 tabs
ENERGY ANALYSIS OF A POWERTRAIN AND CHASSIS INTEGRATED SIMULATION ON A MILITARY DUTY CYCLE
 U.S. ARMY TANK AUTOMOTIVE RESEARCH, DEVELOPMENT AND ENGINEERING CENTER ENERGY ANALYSIS OF A POWERTRAIN AND CHASSIS INTEGRATED SIMULATION ON A MILITARY DUTY CYCLE GT Suite User s Conference: 9 November
TEST METHODS CONCERNING TRANSPORT EQUIPMENT
 PART IV TEST METHODS CONCERNING TRANSPORT EQUIPMENT - 403 - CONTENTS OF PART IV Section Page 40. INTRODUCTION TO PART IV... 407 40.1 PURPOSE... 407 40.2 SCOPE... 407 41. DYNAMIC LONGITUDINAL IMPACT TEST
Damping Loss Factor for Damping Materials for Continuous Structures
 Damping Loss Factor for Damping Materials for Continuous Structures P. H. Mathuria and U. P. Kulkarni mathuria@usa.net unmeshkulkarni@mailcity.com ABSTRACT The half power bandwidth method is used for measuring
STRUCTURAL BEHAVIOUR OF 5000 kn DAMPER
 STRUCTURAL BEHAVIOUR OF 5000 kn DAMPER I.H. Mualla Dr. Eng. CTO of DAMPTECH A/S E.D. Jakupsson Dept. of Civil Engineering, Technical University of Denmark L.O. Nielsen Professor, Dept. of Civil Engineering,
2. Write the expression for estimation of the natural frequency of free torsional vibration of a shaft. (N/D 15)
") ME 6505 DYNAMICS OF MACHINES Fifth Semester Mechanical Engineering (Regulations 2013) Unit III PART A 1. Write the mathematical expression for a free vibration system with viscous damping. (N/D 15) Viscous
ME 6505 DYNAMICS OF MACHINES Fifth Semester Mechanical Engineering (Regulations 2013) Unit III PART A 1. Write the mathematical expression for a free vibration system with viscous damping. (N/D 15) Viscous
Lead Acid Batteries Modeling and Performance Analysis of BESS in Distributed Generation
 Murdoch University Faculty of Science & Engineering Lead Acid Batteries Modeling and Performance Analysis of BESS in Distributed Generation Heng Teng Cheng (30471774) Supervisor: Dr. Gregory Crebbin 11/19/2012
ASTM D4169 Truck Profile Update Rationale Revision Date: September 22, 2016
 Over the past 10 to 15 years, many truck measurement studies have been performed characterizing various over the road environment(s) and much of the truck measurement data is available in the public domain.
DESIGN AND EXPERIMENTATION OF TEST RIG TO CHARACTERIZE HYDROSTATIC DRIVEFOR LINEAR ACTUATOR
 DESIGN AND EXPERIMENTATION OF TEST RIG TO CHARACTERIZE HYDROSTATIC DRIVEFOR LINEAR ACTUATOR Sherif Elbaz 1, Moatasem 2, Ibrahim 3, Nabila 4, Mohamed 5 1 Automotive Engineering Department, Ain-Shames University,
Analysis and control of vehicle steering wheel angular vibrations
 Analysis and control of vehicle steering wheel angular vibrations T. LANDREAU - V. GILLET Auto Chassis International Chassis Engineering Department Summary : The steering wheel vibration is analyzed through
A NEW METHODOLOGY FOR DETECTION OF A LOOSE OR WORN BALL JOINTS USED IN VEHICLES SUSPENSION SYSTEM
 Proceedings of the 7th International Conference on Mechanics and Materials in Design Albufeira/Portugal 11-15 June 2017. Editors J.F. Silva Gomes and S.A. Meguid. Publ. INEGI/FEUP (2017) PAPER REF: 6658
Automobile Body, Chassis, Occupant and Pedestrian Safety, and Structures Track
 Automobile Body, Chassis, Occupant and Pedestrian Safety, and Structures Track These sessions are related to Body Engineering, Fire Safety, Human Factors, Noise and Vibration, Occupant Protection, Steering
STATIC AND FATIGUE ANALYSIS OF LEAF SPRING-AS A REVIEW
 STATIC AND FATIGUE ANALYSIS OF LEAF SPRING-AS A REVIEW Vishal Gavali 1, Mahesh Jadhav 2, Digambar Zoman 3 1,2, 3 Mechanical Engineering Department, LGNSCOE Anjaneri Nashik,(India) ABSTRACT In engineering
Development of a Multibody Systems Model for Investigation of the Effects of Hybrid Electric Vehicle Powertrains on Vehicle Dynamics.
 Development of a Multibody Systems Model for Investigation of the Effects of Hybrid Electric Vehicle Powertrains on Vehicle Dynamics. http://dx.doi.org/10.3991/ijoe.v11i6.5033 Matthew Bastin* and R Peter
Racing Tires in Formula SAE Suspension Development
 The University of Western Ontario Department of Mechanical and Materials Engineering MME419 Mechanical Engineering Project MME499 Mechanical Engineering Design (Industrial) Racing Tires in Formula SAE
The Shock Absorber Handbook Second Edition
 The Shock Absorber Handbook Second Edition John C. Dixon, Ph.D, F.I.Mech.E., F.R.Ae.S. Senior Lecturer in Engineering Mechanics The Open University, Great Britain IICIUTIHHIIL BICINTINNIIM. John Wiley
Non-Contact Sensor Performance Report
 Non-Contact Sensor Performance Report Abstract The 30mm non-contact sensor (Encoder) was subjected to a variety of tests outside of the recommended usage parameters. The separation distance, planar tilt,
Active Control of Sheet Motion for a Hot-Dip Galvanizing Line. Dr. Stuart J. Shelley Dr. Thomas D. Sharp Mr. Ronald C. Merkel
 Active Control of Sheet Motion for a Hot-Dip Galvanizing Line Dr. Stuart J. Shelley Dr. Thomas D. Sharp Mr. Ronald C. Merkel Sheet Dynamics, Ltd. 1776 Mentor Avenue, Suite 17 Cincinnati, Ohio 45242 Active
Relative ride vibration of off-road vehicles with front-, rear- and both axles torsio-elastic suspension
 Relative ride vibration of off-road vehicles with front-, rear- and both axles torsio-elastic suspension Mu Chai 1, Subhash Rakheja 2, Wen Bin Shangguan 3 1, 2, 3 School of Mechanical and Automotive Engineering,
Vibration Analysis of an All-Terrain Vehicle
 Vibration Analysis of an All-Terrain Vehicle Neeraj Patel, Tarun Gupta B.Tech, Department of Mechanical Engineering, Maulana Azad National Institute of Technology, Bhopal, India. Abstract - Good NVH is
QuickStick Repeatability Analysis
 QuickStick Repeatability Analysis Purpose This application note presents the variables that can affect the repeatability of positioning using a QuickStick system. Introduction Repeatability and accuracy
Comparing PID and Fuzzy Logic Control a Quarter Car Suspension System
 Nemat Changizi, Modjtaba Rouhani/ TJMCS Vol.2 No.3 (211) 559-564 The Journal of Mathematics and Computer Science Available online at http://www.tjmcs.com The Journal of Mathematics and Computer Science
White paper: Pneumatics or electrics important criteria when choosing technology
 White paper: Pneumatics or electrics important criteria when choosing technology The requirements for modern production plants are becoming increasingly complex. It is therefore essential that the drive