The University of Akron Human Powered Vehicle Team
|
|
|
- Maximillian Parrish
- 5 years ago
- Views:
Transcription

1 The University of Akron Honors Research Projects The Dr. Gary B. and Pamela S. Williams Honors College Spring 2016 The University of Akron Human Powered Vehicle Team Maria E. Rizzo University of Akron, Andrew J. Derhammer University of Akron, Christopher M. Trowbridge University of Akron, Timothy M. Nutt University of Akron, Joseph R. Boyd University of Akron, See next page for additional authors Please take a moment to share how this work helps you through this survey. Your feedback will be important as we plan further development of our repository. Follow this and additional works at: Part of the Acoustics, Dynamics, and Controls Commons, Computer-Aided Engineering and Design Commons, Manufacturing Commons, Mechanics of Materials Commons, Other Engineering Commons, and the Other Mechanical Engineering Commons Recommended Citation Rizzo, Maria E.; Derhammer, Andrew J.; Trowbridge, Christopher M.; Nutt, Timothy M.; Boyd, Joseph R.; Marcum, Jeremy W.; Adams, Jonathan E.; Haiss, Donald G.; Wood, Julia; Goshia, Brian D.; Fagan, Scott T.; Everhard, Joshua D.; and Slivka, Rebecca L., "The University of Akron Human Powered Vehicle Team" (2016). Honors Research Projects This Honors Research Project is brought to you for free and open access by The Dr. Gary B. and Pamela S. Williams Honors College at IdeaExchange@UAkron, the institutional repository of The University of Akron in Akron, Ohio, USA. It has been accepted for inclusion in Honors Research Projects by an authorized administrator of IdeaExchange@UAkron. For more information, please contact mjon@uakron.edu, uapress@uakron.edu.
2 Author Maria E. Rizzo, Andrew J. Derhammer, Christopher M. Trowbridge, Timothy M. Nutt, Joseph R. Boyd, Jeremy W. Marcum, Jonathan E. Adams, Donald G. Haiss, Julia Wood, Brian D. Goshia, Scott T. Fagan, Joshua D. Everhard, and Rebecca L. Slivka This honors research project is available at
3

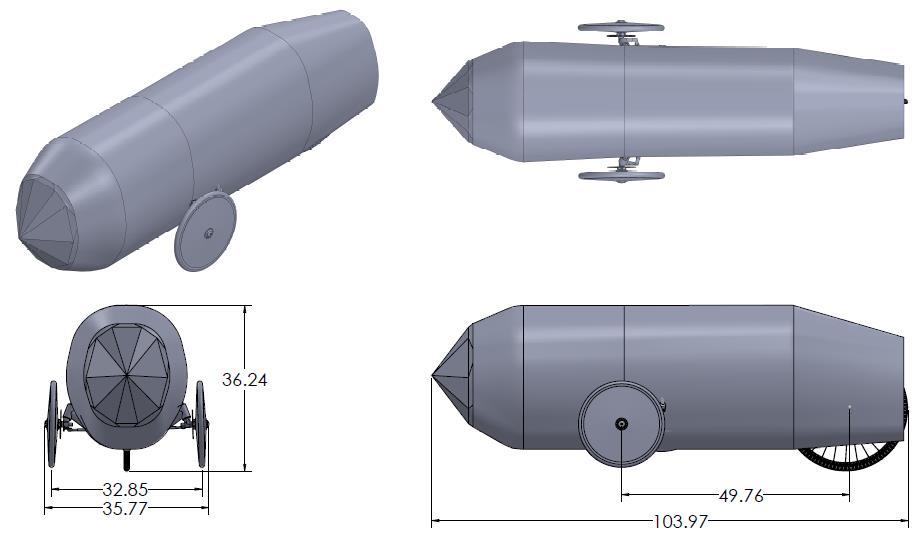
4 The University of Akron Human Powered Vehicle Team 2016 ASME HPV Challenge East Vehicle Number: 29 Vehicle Name: Klokan Drivetrain Andrew Derhammer Ergonomics Christopher Trowbridge Timothy Nutt Frame Joseph Boyd Jeremy Marcum Fairing Jonathan Adams Maria Rizzo Lighting Donald Haiss Julia Wood Innovation Brian Goshia Scott Fagan Joshua Everhard Steering Rebecca Slivka Advisor: Dr. Scott Sawyer
5
6 Abstract The University of Akron Human Powered Vehicle Team s 2016 vehicle, Klokan, was designed, manufactured and tested with safety, reliability, performance and ease of use in mind. The vehicle is a fully faired tadpole trike with a lightweight aluminum frame constructed from T6 tubing having a total weight of 8.9 lbs. To complement the lightweight frame, the fairing is constructed from polycarbonate, PETG and carbon fiber strips which combine into a lightweight, easy to manufacture weather barrier and aerodynamic structure. Klokan was designed to be a safe and efficient mode of everyday transportation which ensures that riders are sufficiently protected by a rollover protection system (RPS) which was designed to meet the ASME HPVC requirements with a minimum safety factor of two. The project scope includes all aspects of design and fabrication to create a vehicle that is easy to manufacture, easy to use, safe, and low cost to facilitate its usability in everyday situations. The team completed research on how to improve the manufacturability, reliability, and performance through analysis of designs, computer based modeling, and physical testing to validate that the bike meets team goals as well as exceeding the requirements set by the ASME Human Powered Vehicle Competition. The frame was designed in a manner that reduces welding through the use of bends and allows for precision fixturing to be manufactured and used to construct multiple frames quickly and efficiently. The fairing s modular construction reduces the need for specialized tooling while minimizing weight and construction time. The team designed and successfully implemented an innovative rollover warning system which actively monitors the percentage of vehicle load on each tire and warns the driver through audible tone and visual warning light prior to a dangerous rollover becoming imminent.
7 Table of Contents VI Design 1 a. Objectives 1 b. Background 1 c. Prior Work 1 d. Organizational Timeline 2 e. Design Specifications 2 f. Concept Development and Selection Methods 2 g. Innovation 4 h. Description 4 VII Analysis 7 a. RPS Analyses 7 b. Structural Analyses 9 c. Aerodynamic Analyses 14 d. Cost Analyses 20 e. Product Lifestyle Energy/CO 2 Analyses 21 f. Other Analyses 22 VIII Testing 23 a. RPS Testing 23 b. Developmental Testing 24 c. Performance Testing 28 IX Safety 29 a. Design for Safety 29 b. Hazard Analyses 30 X Conclusion 30 a. Comparison Design Goals, Analysis, and Testing 30 b. Evaluation 30 c. Recommendations 31 XI References 32
8 VI Design a. Objectives In the second consecutive year competing, the team this season focused on improving with the knowledge and experience gained from the first season of competition. Building on the team s first experience building a human powered vehicle in 2015, the following objectives were established: Design for manufacturing After building one vehicle, the team learned about the capabilities of suppliers and of the university s machine shop. This vehicle and the process to create it better utilizes the available resources and is designed to more simply create functional members and assemblies. Maintain or improve drivetrain functionality, handling characteristics, and ergonomics of the 2015 vehicle The 2015 vehicle provides a solid benchmark for an HPV, and the team aims to create a vehicle that meets or exceeds the quality of various aspects of the 2015 vehicle through an increased budget and a better knowledge of HPVs. Demonstrate an innovation that advances the state-of-the-art At the inception of the team in 2014, the team realized the vast history of human powered vehicles and exceptional people who are and have been innovating in the industry make useful and novel ideas unlikely to be created by inexperienced students. The team primarily serves an educational purpose, but this object expands the mission to continuing to incrementally enhance HPVs. b. Background For many years, bicycles were mainly used for recreational and professional sports. In the last decade or so the growing popularity of the Go Green manifesto has led to an emerging demand for human powered vehicles throughout the world. People are now beginning to use these vehicles as their primary mode of transportation to decrease their fossil fuel usage while improving their overall health. These vehicles not only promote healthy and sustainable lifestyles, but they also require less energy to operate and travel time than simply walking to a destination. (Matthes, Salvagione, & Paul, n.d.) One of the main drawbacks of cycles for daily travel is the fact that the rider is not as well protected from both environmental factors and/or crashes. By adding a fairing to a recumbent bike, the practicality of the bike becomes more similar to an automobile. (Wilson & Papadopoulos, 2004) The fairing also decreases the drag forces on the bike, requiring less energy to be input into the vehicle when riding. Roll hoops and triangulation of a tricycle design helps to dissipate energy in the event of a collision, further protecting the driver. c. Prior Work The steering design comes from the 2015 season, which was documented in the associated design report. Based on the performance of that steering geometry, the team used the same calculators for determining the steering geometry for this vehicle with a slight reduction in caster angle to reduce the force required to turn while retaining strong self-centering characteristics. 1

9 In the analysis of the 2015 vehicle, turning forces were calculated. These calculations were referred to for the 2016 vehicle calculations. The team used the same flow simulation settings in SolidWorks 2015 in order to calculate the drag force and coefficient of drag of the fairing design iterations. The calculations of the 2016 vehicle were compared to the 2015 vehicle results. d. Organizational Timeline e. Design Specifications Accommodate riders from 5 3 to 6 2 Unlike many commercial HPVs, Klokan must quickly adjust between riders of vastly different sizes due to the height differences between male and female riders on the team. Top speed of 40 MPH The 2015 goal was to reach a maximum speed of 35 MPH, and the 2015 vehicle was able to reach a top speed of 38 MPH. Further aerodynamic and ergonomic refinements should be analyzed to ensure the vehicle achieves 40 MPH in the sprint race. Weight of 50 lbs. Commercial velomobiles typically weigh more than 50 lbs. and considering that the lightest vehicle UAkron has ever competed with was 55 lbs., this is a specification to push the envelope of simplicity, integration and specialized materials. Comply with ASME HPVC requirements In order to compete, Klokan must comply with the ASME requirements for the RPS, field of view, turning radius, and braking distance. Meet or exceed functionality of every past University of Akron HPV Based on the experience gained by much of the team last year, the team intends to produce the highest performing HPV ever created by UAkron students. f. Concept Development and Selection Methods To select the type of vehicle to design, the team created a weighted decision matrix (Table 1) with criteria to suit the team from a design and construction standpoint as well as from the perspective of the team members as riders. 2


10 Table 1 Vehicle layout weighted decision matrix Criteria Weight Prone Trike Prone Bike Delta Trike Recumbent Bike Tadpole Trike Cost Safety Comfort Speed/Aerodynamics Agility Suitable for Beginners Complexity Prior Experience Total Weighted Total With the tadpole trike configuration selected, the team sought to build on the success of the 2015 tadpole trike vehicle. Decisions throughout the design process were guided by feedback on the 2015 vehicle as shown in Table 2. Table 2 Feedback and adjustments generated from the 2015 vehicle Feedback The vehicle was sufficiently stable but required a relatively high force to steer. The vehicle showed excellent anti-rollover characteristics and turning radius but could not fit through a doorway. All racing situations utilized only one chainring. Seat angle was comfortable but more upright than necessary. Welds weakened critical areas. Adjustment Reduce caster angle Reduce track Eliminate front derailleur and shifter during races Lay seat back further Substitute bends instead of welds More than mere adjustments, Klokan comes out of a detailed design review of the 2015 vehicle where weight savings, simplicity, reliability, and performance were considered. Table 3 shows an example of how the team redesigned the closure for the adjustable crank tube. Table 3 Redesign of crank tube clamp Closure Type Weight (lbs.) Cost Time Pipe Patch Clamp $50 <1 hour Bolt-on 3


11 Welded 0.18 $20 2 hours Design 2 hours Machine and weld Brackets and QR Levers 2016 g. Innovation To increase achievable performance and safety of the human powered vehicle, the idea of a rollover alert system was implemented. This alert system uses strain gauges to compare the vertical forces exerted on each tire. This signal is generated by a half Wheatstone bridge configuration and sent to a microcontroller. Sample data was collected and interpreted to determine appropriate upper and lower bounds of rollover based on the strain gauge readings. Finally, a buzzer system was added to the circuit to warn the rider when potential for rollover was occurring. This innovation is useful to the riders not only for safety purposes, but to motivate the riders to perform to their maximum potential and maintain maximum speed while executing turns. h. Description h.1 General Vehicle Design The 2016 University of Akron Human Powered Vehicle is a tadpole trike as shown in Figure 1. Figure 1 - Vehicle without fairing h.2 Frame The frame of the vehicle is constructed from aluminum tubes. The frame consists of 2, 1.75, 1 and T6 tubing which has been post-weld heat treated to a T6 temper. All tubing has wall thickness of The front tires connect to a 1.75 draw bent tube which connects to the crank tube and main body of the frame. The rear tire is attached via triangulated tubing which is connected to the 2 diameter main support tube and 1 diameter seat rail/rollover protection system as shown in Figure 2. 4

12 The crank is attached to a telescoping tube for adjustable length. Light weight quick release clamps secure the telescoping crank to the main frame under tube. Figure 2 - Frame h.3 Rollover Protection System This design integrates the rollover protection system into the seat by extending the seat rails over and around the rider's head and body as shown in Figure 2. This seat/roll bar also serves as an anchor point for the seat belt, and the roll bar helps to support the rider's head. The rollover protection system is further reinforced through the use of triangulation with the seat stay and chain stay tubes. The rear tire is attached via triangulated tubing which is connected to the 2 diameter main support tube and 1 diameter seat rail/rollover protection system as shown in Figure 2. h.4 Steering The steering system consists of a direct steer handle combination which also holds the brake and shifter levers. The right spindle is linked to the left spindle via a tie rod below the driver s legs. This particular design was chosen for its simplicity and ease of use. The design was compared to a center mounted steering wheel or handle bar that would prohibit free leg motion while pedaling. An underside, rotational steering design was also considered but would restrict the leg motion during turns. The direct steer design provides simple, robust steering which is easily modified to meet a driver s needs as shown in Figure 3. 5


13 Figure 3- Steering h.5 Fairing The fairing encloses the rider and most of the frame. The wheels are not completely enclosed by the fairing and have carbon fiber wheel covers installed onto them. A wheel cover is shown in Figure 4. Figure 4 - Wheel Covers The fairing structure consists of carbon fiber strips which were water jet cut from carbon fiber sheeting. The carbon fiber fairing structure is wrapped with plastic sheeting to form the aerodynamic structure. These carbon fiber strips are shown in Figure 5. 6


14 Figure 5 - Carbon fiber strips The vehicle s fairing provides weather protection and aerodynamics. The fact that the fairing does not enclose the wheels means that the driver will not be subjected to water spray in rainy conditions. h.6 Drivetrain Klokan utilizes a 2x10 drivetrain system actuated by a trigger shifter. The cassette and 53/39 chain rings provide a range of gears for various riders, speeds, and terrains. The team uses SPD type clipless pedals for enhanced power, comfort, and safety. Clipless pedals ensure that the rider s feet do not leave the pedals and get caught under the frame. VII Analysis a. RPS Analyses Objective Method Results To insure the safety of the rider in the rollover scenario through compliance with ASME HPVC requirements Solidworks FEA analysis is used for the loading of the frame to assess the deflections and stresses The frame and RPS both exceed the ASME requirements for deflection. The Rollover Protection System was designed to keep the rider safe and free from harm if an accident was to occur while riding. The system was designed to absorb significant amounts of energy during a wreck; with allowing the frame to absorb the energy the impact of the crash on the driver will be mitigated. The main way the design was made to absorb energy is the triangulation of the frame that is a large advantage of having a tadpole trike style. The triangulated frame helped to reinforce and support other sections of the bike in the event of a crash. The roll hoop support bar was originally connecting the chain stay to the seat stay but was later moved to connect the seat stay to the roll hoop for reduced deflection. See Figure 6 for the original bar as a gray line. Another huge energy absorbing addition to the design was the use of tight radii curves and bends in the frame. 7

15 The system was also designed so that the largest rider would remain safely inside the RPS when the bike is both on its side and completely overturned. The four point safety harness will ensure that the rider will be secured to the frame/seat if an accident was to happen. The ergonomics team completed a motion analysis of both the largest and smallest rider. The motion analysis used the motion capture lab at the university to map out the rider volume. The roll hoop was designed to accommodate the largest rider and insure he or she would remain inside the system. More information about the motion capture analysis can be found in the Developmental Testing section below. The last main design goal of the system was to minimize the amount of scrapes and/or cuts on the riders limbs during a crash. The fact that the tadpole trike design of the bike tends to keep the riders safer and better protected during a crash. If the bike were to partially roll over, the triangulation between the front wheels and the roll hoop will insure riders remain unharmed. The steering system will also minimize scrapes also help to minimize scrapes on the riders arms. Since the drivers arms will be low and close to the body, they are less likely to get caught on something or scrap against the ground. A finite element analysis (FEA) was completed on the final design to validate the safety of the vehicle in the event of an accident. Below is a screen shot of the frame when 600 lbs. is applied 12 off the vertical roll hoop. Figure 6 - Top Loading Condition on Frame The scale of the deformation ranges from 1.0 mm to mm; the team s goal was to keep the deformation from this load below 5.1 cm. The maximum deformation seen from the 600 lbs. load was about 3.3 mm. The bike was also loaded with a horizontal force of 300 lbs. force in order to simulate the bike being involved in a partial roll over collision or a side impact. The scale of the horizontal side load deflection ranges from 1.0mm to 7.24mm. The maximum deflection is near the end of the spar tube where the deflection is around 7mm. 8
16 Figure 7 - Horizontal Loading Condition on Frame The team s goal was to keep the maximum deflection below 3.8 cm which was achieved according to the FEA calculations. The team will be completing testing on the assembled frame in a week or so; more explanations of the testing that will be done can be found in the RPS testing section below. RPS RESULTS Deflection Min. Factor of Safety 600 lb. top load 4.0 mm lb. side load 7.2 mm 2.7 Table 4 - RPS Analysis Results b. Structural Analyses Objective Method Results Optimize the frame to withstand the forces associated with riding the vehicle in various high stress scenarios Solidworks FEA analysis will be used for the loading of the frame to assess the deflections and stresses Seat geometry and rear triangulation was modified to maintain a safety factor of 2 or more All of the structural analysis is to verify that the frame can withstand the forces associated with riding the vehicle in various high stress scenarios. All results are with a frame of 6061-T6 aluminum tubing of the diameters previously specified. The first load case to be considered is with a rider on flat ground pedaling with a force of 250 lb. as shown in Figure 8 and Figure 9. For this load case, the vehicle is constrained by the three tires which are in contact with the ground. 9


17 Figure 8 Deformations from Pedaling Force Applied to Frame Figure 9 - Factor of Safety from Pedaling Forces on Frame This shows a maximum deflection of 3.9mm and a minimum factor of safety of 1.9 which is acceptable. The next loading scenario simulates what will be seen in a turn as shown in Figure 10 and Figure 11. This scenario includes the person sitting in the seat, and being pushed sideways into the vehicle. The driver will also transmit a force into the crank tube as the rider braces into the turn. Again, the wheels are fixed since they are in contact with the ground in this scenario. When the bike is turning, the maximum forces are encountered in a near rollover condition. The vehicle will be near rollover when the reaction force on the inside tire is 0 N. First, it can be assumed that the total weight of the vehicle and rider is 290 lbs. Now dividing the weight of the rider and bike between the three tires evenly, the reaction per tire is 97 lbf. Summing the moments about the center of the vehicle and at ground level while approximating 10
 This result can now be used to calculate the maximum velocity from which a 10 turn radius can be entered before a rollover will occur: a N = V2 r Substituting the number into the")
18 the Center of Gravity of the bike, rider and fairing to be 12 in from ground level, the following sum of the moments equation is calculated. 1.18(97) + 9a N (1) = 0 (1) a N = 12.7 ft s 2 (2) This result can now be used to calculate the maximum velocity from which a 10 turn radius can be entered before a rollover will occur: a N = V2 r Substituting the number into the Equation (2) we get the following: 12.7 = V 2 max 10 V max = 11.3 ft s mi = 7.7 hr This normal acceleration can now be used to calculate the side load that will be acting on the bike while in a near rollover scenario: (4) (5) Side Load = = lbf (6) 32.2 This result can now be applied to the frame as previously specified for a turn to find the resulting FEA results. (3) Figure 10 - Frame Deformations from Right Hand Turn 11


19 Figure 11 - Factor of Safety Values from Right Hand Turn Loading These results show that the vehicle frame deflects a maximum of 4mm with a minimum factor of safety of 2.7 which is more than acceptable. The final loading scenario is when the vehicle is braking heavily. In this scenario, there is a large amount of force being distributed through the seat belt and into the seat tubes. The rear wheel is lifting off of the ground, and the front wheels are fixed to the ground. Figure 12 - Deformation on Frame from Braking Condition 12
20 Figure 13 - Factor of Safety Values from Braking Forces The results of this analysis show that the maximum deflection is 15mm (which is not necessarily accurate since the rear wheel is lifting off of the ground) and the minimum factor of safety is 2 which is acceptable. Table 5 - Structural Analysis Results STRUCTURAL Deflection Min. Factor of Safety RESULTS Pedaling 3.9 mm 1.9 Turning 4.0 mm 2.7 Braking 15.3 mm 2.0 Braking 15.3 mm 2.0 The structural analyses led to adjusting how the seat supports interface with the main frame tube. Figure 14 shows how the interface between the frame tube and seat brace was changed to improve structural analyses results. Frame Tube First Iteration Seat Brace Frame Tube Second Iteration Seat Brace Figure 14 Seat brace coping change 13
. To begin the fairing design, the team analyzed last year's style.")

21 c. Aerodynamic Analyses Objective Method Results To decrease the aerodynamic drag force acting on the fairing s geometry SolidWorks Flow Simulation was used to simulated drag forces. At 45 MPH, the Klokan will see a drag force of 5.20 lbs. (21.11 N). To begin the fairing design, the team analyzed last year's style. Modifications were made on the material, manufacturability, cost, and frontal area. Carbon fiber straps were added as a skeleton to provide rigidity and lighter weight. The design was also modified based on rider profile and safety/ergonomics. These changes allowed for an improved performance of the fairing while reacting to the flow simulation. At first, two designs were considered: rider head outside of the fairing and rider head inside of the fairing. Figure 15 - Initial Fairing Design After initial testing, the latter design was accepted for further iterations. Figure 15 above and Figure 16 illustrate the first basic design the team considered. Before the computational fluid dynamics (CFD) analysis could begin, the fundamentals were brought into question. The fundamental equation for drag force (7) can be rearranged into the formula to calculate the coefficient of drag (8). Where, F D = Drag force by pressure c D = Coefficient of drag by pressure V = Fluid velocity A = Frontal area ρ = Fluid density Fluid = Air F D = 0.5 c D V 2 A ρ (7) c D = 2F D ρav 2 (8) 14
")

22 Figure 16 - First Iteration c D (average) = F D (average) = 9.950N = 2.237lb In order to validate that the fairing design sufficiently reduces the drag forces on the vehicle, SolidWorks Flow Simulation 2015 was used to perform a Computational Fluid Dynamics (CFD) analysis. This analysis calculated the drag forces that the fairing would experience at different speeds. By performing the simulation at 5, 10, 15, 20, 30, 40, and 45 mph, the team was provided with the full range of speeds that the bicycle will experience at competition. In the simulation, surface goals in the z-direction were calculated in order to determine the average drag force in the assembly at the various speeds. All surfaces were selected in order to get an accurate reading. Using this value, the coefficient of drag could be calculated using equation 8. A boundary condition was created in order to simulate the ground (real wall). The velocity in the z-direction (in direction of the drag) was added for the wall motion. It was assumed that the fluid was air and the flow type was laminar and turbulent. From here, iterations were performed with the first design in order to come up with a style that would promote less drag force. This new style involved creating a cone at the front of the fairing. The analysis revealed enhancements on the drag force and coefficients of drag. Figure 17 below shows the modified design. Figure 17 - Second Iteration The second design improved the drag force at high speeds and decreased the coefficient of drag at all speeds. However, this design lengthened the front nose of the fairing by 14-inch and did not change the tail of the fairing which the team felt held room for improvements as well. Table 6 shows how the 14-inch nose was chosen based on the added benefit of its geometry. Extending the nose beyond 14-inch displayed diminishing returns. Based on the required power for past 15
23 fairing designs, 14-inch nose was chosen in order to reach 40 MPH. The analysis output a smaller drag force, allowing the team to use the same amount of power to reach a higher speed. The graph that validated the 14-inch nose is Figure 18. Table 6 Second Iteration (Nose Length Modifications) Second Iteration (Speed = 40 MPH) Length of nose (in) Coefficient of Drag Drag Force (N) Drag Force (lbs.) Figure 18 - Comparison of Drag Forces with Previous Year's Results A third iteration was modeled to include a gurney flap on the tail, which is shown in Figure 19. This geometry was added with the hope to reduce the low pressure drag behind the tail by increasing the turbulence in the rear of the vehicle. Unfortunately, after analysis at high speeds, the addition of the gurney flap slightly increased the overall drag force. 16


24 Figure 19 -Third Iteration A fourth model, shown in Figure 20 was created to have the tail mimic the nose s geometry. With improved numbers resulting, especially at high speeds, the team decided to modify the tail even more by lengthening it slightly and creating more of a point in order to yield better effects. Figure 20 - Fourth Iteration After many iterations were completed in order to balance the model and ensure all sections were benefiting each other, a final model was chosen, which is shown in Figure 21 below. Figure 21 Fourth Iteration Error! Reference source not found. shows the comparison between the fourth and fifth iterations of the fairing design using SolidWorks Flow Simulation. With the modified tail, the drag force decreased until around 20 MPH, demonstrating how its geometry mainly impacts the fairing at higher speeds. The flow trajectories also improved with this design, which are illustrated in Figure
25 Drag Force (lbf) Coefficient of Drag Speed (mph) Speed (m/s) Speed (ft/s) Table 7 - Fifth Iteration (Final Design) 4th Iteration 5th Iteration Coefficient of Drag Drag Force (N) Drag Force (lbs.) Coefficient of Drag Drag Force (N) Drag Force (lbs.) th Iteration: Drag Force and Coefficient of Drag vs. Speed Velocity (mph) Drag Force with Fairing Coefficient of Drag with Fairing Drag Force without Fairing Coefficient of Drag without Fairing Figure 22 - Fifth Iteration (Final Iteration) Drag Force and Drag Coefficient vs. Speeds Figure 22 illustrates how much the fairing impacts the aerodynamics of the vehicle. It reduces the drag force to one half of the original value without the fairing at high speeds. The figures below reveal the flow trajectories of air around the frame without the fairing (Figure 23 and the frame with the fairing (Figure 24) at an anticipated maximum speed of 45 MPH. Without the fairing, the frame and the human body do not permit the boundary layers of air to remain laminar due to the sudden shift of unsymmetrical geometry, thus creating a large stagnation point and turbulent vortices directly behind the rider. The streamlined shape and large contour sides of the fairing reduce the turbulence of air escaping the tail section compared to the unfaired vehicle. 18


26 Figure 23 - Flow Trajectories without Fairing Figure 24 - Flow Trajectories with Fairing The team wanted to be able to remove the front section of the fairing in order to assist with staying cool in the endurance part of the competition. Below is Figure 25 that illustrates the flow trajectories with the front section removed from the fairing. Figure 25 - Flow Trajectories with Only Back Section of Fairing 19
 Table 8 Drag Force (Frame with Back of the Fairing vs.")
27 With the front section of the fairing removed, there is a distortion between the streamlines which causes the air to become turbulent. Nevertheless, these forces are still less than the vehicle with no fairing, which is shown in Table 8 below. Run Speed (MPH) Table 8 Drag Force (Frame with Back of the Fairing vs. Frame without the Fairing) Speed (m/s) Speed (ft./s) Frame with Back of the Fairing Coefficient of Drag Drag Force (N) Drag Force (lbs.) Coefficient of Drag Frame without Fairing Drag Force (N) Drag Force (lbs.) Average The combination of laminar flow and favorable pressure distribution results obtained by using the CFD analysis at 40 MPH yields a coefficient of drag and drag force, respectively, of the fairing of and 3.90lb as compared to 1.01 and 10.32lb without the fairing. Use of the fairing significantly enhances the performance of the vehicle and improves the expected speeds during the competition. d. Cost Analyses Objective Method Results To minimize costs of materials and labor when designing and manufacturing Klokan Using low cost materials that were easily manufactured and purchased only essential components The team manufactured a faster, lighter vehicle for a very economical cost. One of the main challenges the team faced was to minimalize development and manufacturing costs of the vehicle. Many vendors were consulted when searching for components and materials. The largest challenge encountered was the tradeoff between the high-performance products and pricing. Some vendors donated materials, some donated time using their facilities as well as others just donating money to the team. The monetary and nonmonetary donations received from the sponsors are not included in the following cost analysis and equivalent values of donations are adjusted for. The cost analysis was completed by adding a line item for each required item along with estimated costs for outsourced labor and facilities rentals. 20
28 e. Product Lifestyle Energy/CO2 Analyses Objective Method Results Calculate impact on the environment in energy consumed (J) and CO2 throughout the lifecycle of their HPV Compare the environmental impact to other modes of transportation Klokan demonstrates less than 1/10 th of the carbon footprint of a small car per mile. Human powered vehicles, such as the ones used in this competition, are some of the most efficient vehicles at converting raw energy from the environment into kinetic energy in the form of forward motion. An off the shelf consumer bike has the potential to convert about 85 to 90 percent of the energy input at the pedals into forward motion (Stetler, 2010). The team estimates the ability of its HPV to be closer to 95 percent because of the measures taken to reduce resistance and sources of energy loss across the system as a whole. The energy to the pedals is supplied by converting chemical energy in the human body into kinetic energy in muscles in the legs. Humans are able to convert about 25 percent of the energy they take in into usable energy. The other 75 percent is used to maintain normal bodily functions. This is consistent across any mode of transportation no matter if it is human powered or not, so is able to be neglected (Stetler, 2010). The team was able to compare a cars ability to convert chemical energy into kinetic energy to the HPV. Most consumer cars, using gasoline, are only able to convert between 14 and 30 percent of the chemical energy into forward movement, with the rest being lost to mechanical inefficiencies, heat, and friction (US Energy Information Administration, 2015). The energy lost to inefficiencies in the system by a HPV is much less than that of an average consumer car. One reason for this would be the complexity of the energy conversion system in a car, while a HPV is very simple. Another would be the extra mass that is moving with a car versus a HPV. This is related to the previous point in that the car has to carry around more parts in its energy conversion system, while the bike has a very small number of parts and mass to carry around. The CO2 generated is also substantially less with a HPV than a car. The CO2 generated from a HPV is solely from the human breathing. When a human exhales, about 5 percent of the gases produced are CO2. Humans exhale approximately 3 liters of gas with every breath. During exercise one takes between 40 and 50 breaths per minute. The net CO2 emissions are 6.75 L of CO2 per minute of hard riding on a HPV. When one gallon of E10 gasoline (10 percent fuel ethanol by volume) is burned in a car, 17.5 pounds of CO2 are created. One pound of CO2 at 1 atm has volume of 248 liters (US Energy Information Administration, 2015). An average new car has a fuel efficiency of 35 mpg, at normal city speeds of 35 mph, it will burn gallons per minute (U.S. Department of Transportation). This results in 72 L of CO2 per minute of driving. The driver and passengers are also breathing during this time, so adding that to the equation, we find that net CO2 emissions are 75 L per minute plus 2.5 liters per minute for every passenger (not including the driver) in the car. This is more than ten times greater CO2 footprint than a HPV. 21
29 Along with reducing the CO2 footprint, the team made a conscious effort to minimize the wasted materials when building our HPV. For building fixtures and jigs used to manufacture the vehicle, the team used materials that were scrapped from last year. The vehicle was designed in full in SolidWorks in order to create an accurate BOM. This allowed the team to reduce the materials consumed down to only what was needed and in turn, reduced the overall waste. The impact on the environment from extruding raw materials is as small as possible. Any unused material will be used next year for creating fixtures, jigs, or in the vehicle itself. After this vehicle has completed its designed purpose and is at the end of its competition life, it will be used for research purposes in order to improve future designs. f. Other Analyses f.1 Drivetrain Gearing Selection Objective Methods Results Select a cassette and crankset that allow the riders to remain in their optimum cadence range throughout racing Calculate velocities in high and low gears at high and low cadences and assess power required on a 15% grade in low gear A 53/39T crankset and 11-39T cassette was chosen. The team chose a 700x32c rear tire for a supple ride and high speeds. The velocities were calculated with the equation below, using the cadence, number of teeth on respective gears, and the circumference of the tire. v = N cadence N crank N cassette c tire To ensure that the lowest speed the vehicle could comfortably achieve was feasible for steep hills, the climbing power required on a 15% grade was calculated using the equation below. Aerodynamic drag is neglected because the velocity is low, and rolling resistance is small in comparison to the power to gain potential energy. P = F v = m total g Grade v Using those equations, the team made selections based on data in Table 9. Table 9 Drivetrain calculations from selected cranks and cassette Cadence (RPM) Chainring Teeth Cassette Teeth Speed (MPH) Climbing Power (15% Grade) (W) N/A N/A 350 watts plus rolling resistance is an intense effort for the team s riders, but the gearing is sufficient for the terrain and riders. The big-big and small-small combinations show that either 22
 in SolidWorks was used as a baseline for judging RPS strength.")

30 chainring could be used alone for the endurance race, which allows for adjusting crank length quickly and not adjusting chain length because switching chainrings adjusts chain requirements. VIII Testing a. RPS Testing Initially, Finite Element Analysis (FEA) in SolidWorks was used as a baseline for judging RPS strength. The FEA results showed that the vehicle should pass this test with minimal deflection and a high factor of safety. The physical testing supports the FEA simulations. Test setups and data are included in Figures 25 and 26 below. The complete frame was brought to a partner company s testing center where a pneumatic actuator was used to compress the frame with the specified testing forces. In the 12 off vertical loaded test, the maximum deflection was measured to be inches when 600 lbs. were applied. Due to geometric constraints, the frame was secured at the rear dropouts instead of near the seatbelt attachment. It was decided that this would model a more conservative scenario because the maximum deflection would be greater due to the increased distance from the fixed points. When 300 lbs. were applied in the lateral direction to the frame, the maximum deflection was measured to be in. The frame was supported at the seatbelt attachment points while the force was applied at a location near the riders shoulder. The frame passed the vertical and lateral loading test requirements and has been deemed adequate for the required loading scenarios. Figure 26: Frame setups for vertical and lateral deflection test 23
31 Vertical Loading Data Lateral Loading Data Load (lbs) Displacement (in) Load (lbs) Displacement (in) Figure : Vertical and horizontal loading test data a.1 Developmental Testing a.2 Motion Capture for Ergonomics When designing a human-powered vehicle for a team-based racing competition, it is very important to consider ergonomics, or human factors, in the design so that all of the riders will be able to comfortably fit in the frame, reach the pedals, fit in the fairing, and see out the windows. Since one of the goals for this year s competition is to reduce the vehicle s weight, the team wanted to do more developmental work with ergonomics to more accurately determine the volume the riders would need in order to minimize the volume and weight of the fairing and frame. Minimizing the volume also helps reduce the frontal area of the fairing for improved aerodynamics. One way in which the team found an ergonomic design was by doing motion capture testing. The team used the University of Akron s Biomedical Engineering Department s motion capture lab to very accurately capture the motion of markers placed at various points on the tallest and shortest riders as they pedaled. The coordinates of the markers were recorded by infrared cameras that were placed in positions around the rider such that at least two IR cameras could view each marker at a time. The spherical markers were placed at multiple points on the rider with double-sided tape, in locations on the body that define the outer volume and that locate the person relative to where they would be in the vehicle s frame. The major points for defining the volume are the kneecaps, heels, toes, shoulders, and top of head. The major points for positioning the rider relative to the frame are the hips and the marker placed on the top of the pedal rig. The test subjects sat reclined on an exercise bench at various seat angles. An adjustable rig for the pedals had been built, which could be raised and lowered. The horizontal distance between the rider and the pedals was adjusted by moving the seat, since the pedals were set in a fixed position on the floor. 24


32 Figure 28: Our tallest team member getting ready for motion capture In Figure 28, above, the tallest rider is getting ready for the first motion capture test. One of the IR cameras is visible behind him on a tripod. There were 6 of them, and their layout in the initial test is shown in Figure 29. Figure 29: computer display of motion capture IR cameras in test 1 The goal of the initial test was to learn how to use the motion capture lab effectively and how to get usable results from the data. The first rider did 4 trial runs, with several different pedal 25
33 heights and a couple seat angles. The seat angle and pedal locations were initially adjusted to those found on the 2015 Vehicle for a benchmark. Next, the pedals were raised and the bench was moved closer as needed for the rider s optimum leg extension, at varying amount for the subsequent test runs. Experience with the 2015 Vehicle demonstrated that the angle of the frame tube going to the pedals would need to be increased from the 2015 setup because the angle of the 2015 vehicles crank allowed for some rider s heels to scrape the bottom of the fairing. The motion capture data was collected as long lists of coordinates for each marker, in a spreadsheet which had been converted from a comma separated values file. Several different programs and methods were attempted until a suitable method of converting the raw data into a usable volume model was found. Creo was found to be the best 3D modeling program for importing point clouds. After the results from the initial test were analyzed, the next set of motion capture tests were planned for both the tallest and shortest rider. The goals for the second test were to determine the optimum crank tube angle and try to get the two riders test data at that same angle. The shortest rider went through the test first, then the geometry was adjusted so that the pedals were in position for the tallest rider but with relative pedal positions corresponding to the same crank tube angle. The optimum crank tube angle was found through later analysis of the results of the shortest rider s tests. The point cloud data was imported into Creo, as with the initial trial, and the vertical gap between the lowest point of the heel marker and where the bottom of the fairing would need to be to clear the speed bump were measured. Next the position of the bottom bracket (center of rotation of the pedals) for each test configuration was determined. Finally, the lowest allowable crank tube angle was determined. After the optimum crank tube angle was determined to be 25, a 3 rd and final test with each of the test subjects was to be performed with the pedals set to the heights and distances that would give that angle. The test rig would need to be set up with each rider in a way that would be consistent with the crank tube being at 25. Data from the first two motion capture trials were used to determine the hypotenuse of a triangle defined by the distance between the hip location and bottom bracket, for each rider. The hypotenuse of each rider would be used to determine the relative positions of the bench and the bottom bracket for each rider s test setup. As shown in the figure below, the Creo model from previous tests was used to find the relative vertical and horizontal distances between the hip and bottom bracket with the hypotenuse line at a 25 angle, for each rider. Then those numbers were entered into a spreadsheet to get the easy-to-measure distances to use for the test setup. 26

34 Figure 30: diagram used to plan the final motion capture test After finishing the final motion capture test and getting the data, Creo models were made from each rider s data, to obtain the final rider volume needed to design the bike. Figure 31 shows the model of the shortest rider s final testing results, with the paths of some of the markers labeled. The solid circle between the toe and heel paths is the bottom bracket, which was placed correctly in the model by measuring the distance between the center of the bottom bracket and the location of the marker on the top of the tube the pedals were mounted on. That marker is visible above the bottom bracket. The hip markers theoretically shouldn t move much, since they are supposed to be at the center of rotation of the leg, but they did follow a short semicircular path because it is difficult to place the marker in exactly the right location and the hips move a little while pedaling. The approximate real hip location was found by drawing arcs through the hip marker data and then placing a point midway between the center points of those two arcs. The assembly model of the motion capture paths in the frame was used to design the fairing. Figure 31 Motion Capture model of shortest rider s day 3 results 27


35 Coastdown Distance (in) Additionally, the motion capture data and rider measurements were utilized to make a mannequin model that could be placed in the frame model to design the seat angle and roll bar height, as well as to help with window placement. That assembly is shown in Figure 32. Figure 32 Mannequin of tallest rider in frame model b. Performance Testing b.1 Front tire rolling resistance comparison between tires and pressures psi 85 psi 100 psi 120 psi Scorcher Durano Front Tire Pressures Figure 33 Coastdown testing results comparing coastdown distance past the minimum average distance To compare the rolling resistance between the two sets of front tires at various pressures a coast down test was conducted. Figure 33 shows the results of the coastdown testing, with the average of each configuration and 90% confidence interval based on the student s t-distribution. For each set of tires at each of the pressures, the vehicle was released from a specific point on a hill. The bike rolled down the hill, onto a level surface, and coasted until it came to rest. The distance the vehicle travelled was measured, and the test was repeated a minimum of three times at each selected pressure per tire. The distances were all measured relative to the shortest run. Tire pressures were chosen based off of the minimum and maximum pressures stated on the tire. 28
36 The Schwalbe Duranos showed less rolling resistance than the Greenspeed Scorchers with a p- value of less than For optimal performance during the sprint race, the Schwalbe tire should be used at 120 psi. While the Scorcher exhibited more rolling resistance, its higher volume design makes it more suitable for attenuating the bumps and obstacles encountered in the endurance race. IX Safety The University of Akron collaborated with Cleveland Tooling University to efficiently provide a 30-module industrial safety training online, and educate new team members on machine functionalities and safety in the shop. Subsequently, these members were trained by experienced machinists in the university, enabling them to optimally contribute to the team by machining parts and components on demand. All through the building phase, basic safety precautions were strictly enforced to prevent injuries. Safety glasses, steel toed boots were mandatory. Team members followed a safe dress code. Welders wore helmets, gloves and jackets. a. Design for Safety The bike was designed with safety in mind, not only for the riders but also for the bystanders when the bike is in operation. This year s bike is equipped with new innovative electrical features to help assure everyone stays safe. To make sure riders stay safe, a roll over protection system was designed, tested and implemented into the bike. The roll hoop was design so that all riders would be sufficiently protected under the hoop. Also, the rider will have a four point seat belt to help hold them in place if an accident were to occur. The seatbelt secures the operator across the shoulders and the waist. The rider wearing a helmet when riding the bike. The windshield installed on the front of the viewing area will help the rider to clearly see what is in front of him or her without having to worry about debris or insects getting in their eyes. A rear view mirror was another designed safety feature to improve the limited rear visibility while riding the bike. Disk brakes are an added feature that allows the rider to stop the bike extremely quickly when needed. This year, another huge safety innovation was added to the bike. This vehicle has the ability to warn the rider if the bike is close to tipping over. An Arduino controlled system uses strain gauges and a few other electronics to give feedback on the dynamics of the vehicle. This system will not only help the rider be less likely to tip the bike in a hard turn, but it can help the rider more safely push the limits of the vehicle. A few safety features were added to help others see and hear the bike when coming. Reflective tape was attached to the bike to improve the vehicle visibility to bystanders and other vehicles nearby. A horn was also added so that those close by can be warned that the bike is approaching. Head lights and taillights were also an added safety feature when designing the bike; if those nearby can see the vehicle and know what the driver is planning to do, accidents can be avoided. In addition, a mirror is attached for an increased field of view for the rider. 29
37 b. Hazard Analyses Manufacturing and operational hazards were analyzed and minimized using various techniques. First off, personal protective equipment was properly used according to the rules and regulations set by the team and the university. Welding masks, jackets and gloves were worn when welding the frame and other components to the bike. General protective equipment and procedures was followed when working in the machine shop. The bike fairing was created from carbon fiber ribs. The sheets of laminated 5k 5HS carbon fiber were cured in an autoclave. The sheets were cut using a waterjet which is a safe and efficient way to cut the sheets. The fairing is made of mainly Polypropylene which is a very non-reactive, impact resistant material, and it is also innocuous. One of the most hazardous issues that arises when riding a fully faired vehicle is rider being cut or hurt inside during an accident. The team made it a point to remove all the sharp edges to the carbon fiber ribs. The fasteners used on the fairing do not protrude from the inside, and fairing will also be filed down as smooth as possible to increase rider safety. Also, routine preventative maintenance will be addressed on the vehicle before any driver shall ride. Lubricated components will be addressed and up kept as needed. Any visual signs of wear and/or fatigue on components will be taken care of or replaced of as necessary, such as replacement of brakes, tire pressures and tire alignment. X Conclusion a. Comparison Design Goals, Analysis, and Testing The various analyses predict that Klokan will meet the goals set forth. The goals were informed by analysis and vice versa. Table 10 summarizes the observations of Klokan with respect to design goals. Table 10 Comparison of goals and testing results Goal Result Accommodate riders All riders could comfortably drive the vehicle without unplanned from 5 3 to 6 2 modifications. Top speed of 40 MPH Testing is planned for after fairing construction. CFD analysis predicts that 40 MPH will be achieved. Racing weight of 50 lbs. Final estimated weight of 45 lbs. (Including unassembled pieces) Design for Frame manufacturing time decreased from 4 weeks to 1.5 weeks. manufacturing Useful Innovation Functional innovation executed that enhances safety and HPV performance. Comply with ASME RPS testing is planned for March 31. FEA results predict a HPVC requirements successful evaluation. Other requirements are anticipated to be met. b. Evaluation At the time of submission, Klokan was riding but did not have the complete fairing attached and could not be fully evaluated. 30
38 Ergonomics were evaluated by having the entire team ride the vehicle to verify everyone was comfortable. Top speed testing will be carried out on a flat, straight course. The vehicle will be run in both directions and the top speed will be declared the lower trap speed recorded of the highest trap speeds of the two directions. Design for manufacturing and clever fixtures made bending, machining, and welding the frame a more precise and efficient operation, such that the team made a second frame in less than a week. The rollover warning system succeeds in warning the rider of approaching rollover. This will be further evaluated by releasing riders on a tight road course with and without the rollover warning system to evaluate the lap time differences caused by stability feedback. c. Recommendations This frame design minimized weight while resulting in a frame durable enough to compete but stiffness during pedaling should be improved. To mitigate this in the future, reduce the tolerance for deflection in the pedaling loading structural analysis. A smaller rear wheel would also reduce the flex in the frame. 31
39 XI References China wants bikes back to counter smog. (2006, June 19). Retrieved from IOL: Jones, D. E. (1970, April). JonesBike 1_0001. Retrieved from Socrates Berkeley : Matthes, R., Salvagione, P., & Paul, D. (n.d.). Human Power. Retrieved from Science Cycling: Stetler, B. (2010, October 23). Energy Efficiency of Bicycle Transportation. Retrieved from Stanford.edu: U.S. Department of Transportation. (n.d.). Average Fuel Efficiency of U.S. Light Duty Vehicles. Retrieved from Department of Transportation Office of the Assistant Secretary for Research and Technology: _statistics/html/table_04_23.html US Energy Information Administration. (2015, July 7). How Much Carbon Dioxide Is Produced by Burning Gasoline and Diesel Fuel? Retrieved from eia.gov: Wilson, D. G., & Papadopoulos, J. (2004). Bicycling Science. Cambridge: The MIT Press. 32

40 XII Appendix a. Rollover Alert System Report 1.0 Design 1.1 An excerpt from Bicycling Science states, Most tricycles cannot lean, so fast cornering is possible only by hiking one s body to the inside of the turn to avoid rollover. [1] Due to the tadpole tricycle design of the vehicle, it is more difficult for the rider to recognize the balance of the vehicle in a turn compared to a two-wheeled design. The purposed strain gauge rollover warning system provides an alternate method to avoiding rollover and warns the rider as rollover boundaries are approached. Strain gauges mounted to the vehicle frame detect vertical forces changing in the crossmember and transmit the live front tire weight distribution data to a microcontroller in real time. The microcontroller is programmed to determine if there is a risk of rollover and warn the driver by means of a buzzer. The risk of a dangerous rollover is reduced through the rollover sensing system and the rider is safer. 1.2 If a cost efficient and functionally effective strain gauge alert system can be developed, a similar system could very well be implemented on three-wheeled human powered vehicles in the future. With a proper encasement, secure wires, and a battery pack, a self-sufficient system could be installed standard on human powered vehicles and provide the benefit of rollover safety. With the use of a microcontroller, a prototyping board, a half Wheatstone bridge, an op-amp, a power supply, and strain gauges, the development of a rollover alert system is very feasible. 2.0 Concept Evaluation 2.1 A basic circuit diagram and code for reading strain gauges with a microprocessor system was initially used in the development of a prototype [2]. With a few modifications to the code, readings from the prototype system were obtained. Continuous iterations were performed with each iteration involving the modification of both hardware and coding until the predicted results were achieved. By the time the rollover protection system was to be applied to the tricycle for further testing, the initial code had been completely changed and additional hardware had been added for data capturing. Using 350 Ω strain gauges, 20 gauge copper wire, and a JB Weld adhesive, the strain gauges were applied to opposite sides of a scrap piece of sheet aluminum for initial testing (Figure 1). Figure 2 shows the initial strain gauge and half Wheatstone configuration [3]. In this setup, the strain gauges are placed opposite of each other, one in tension and one in compression, and register a combined change in resistance through the half Wheatstone bridge configuration. Figure Ω strain gauge affixed to the prototype aluminum sheet Figure 2- Prototype Strain Gauge Configuration 33
ASME Human Powered Vehicle
 ASME Human Powered Vehicle By Yousef Alanzi, Evan Bunce, Cody Chenoweth, Haley Flenner, Brent Ives, and Connor Newcomer Team 14 Mid-Point Review Document Submitted towards partial fulfillment of the requirements
SAE Mini BAJA: Suspension and Steering
 SAE Mini BAJA: Suspension and Steering By Zane Cross, Kyle Egan, Nick Garry, Trevor Hochhaus Team 11 Progress Report Submitted towards partial fulfillment of the requirements for Mechanical Engineering
2008 Human Powered Vehicle Product Design Specifications Report Winter 2008 February 4 th, 2008
 Portland State University Maseeh College of Engineering and Computer Science 2008 Human Powered Vehicle Product Design Specifications Report Winter 2008 February 4 th, 2008 PSU Advisor: Derek Tretheway
SAE Baja - Drivetrain
 SAE Baja - Drivetrain By Ricardo Inzunza, Brandon Janca, Ryan Worden Team 11 Engineering Analysis Document Submitted towards partial fulfillment of the requirements for Mechanical Engineering Design I
Stationary Bike Generator System (Drive Train)
") Central Washington University ScholarWorks@CWU All Undergraduate Projects Undergraduate Student Projects Summer 2017 Stationary Bike Generator System (Drive Train) Abdullah Adel Alsuhaim cwu, 280zxf150@gmail.com
Central Washington University ScholarWorks@CWU All Undergraduate Projects Undergraduate Student Projects Summer 2017 Stationary Bike Generator System (Drive Train) Abdullah Adel Alsuhaim cwu, 280zxf150@gmail.com
Human Powered Vehicle Challenge. Problem Formulation and Project Plan Document
 Human Powered Vehicle Challenge By Matt Gerlich, Alex Hawley, Phillip Kinsley, Heather Kutz, Kevin Montoya, Erik Nelson Team 9 Problem Formulation and Project Plan Document Submitted towards partial fulfillment
2012 Dalhousie University Formula SAE Design Report
 Dalhousie University Car #47 - Formula SAE Michigan fsae@dal.ca Introduction 2012 Dalhousie University Formula SAE Design Report The 2012 Dalhousie University Formula SAE Team is competing in Formula SAE,
ASME Human Powered Vehicle
 ASME Human Powered Vehicle By Yousef Alanzi, Evan Bunce, Cody Chenoweth, Haley Flenner, Brent Ives, and Connor Newcomer Team 14 Problem Definition and Project Plan Document Submitted towards partial fulfillment
University of Wisconsin-Platteville Formula SAE Design Report
 2012-2013 University of Wisconsin-Platteville Formula SAE Design Report Introduction The 2012-2013 University of Wisconsin-Platteville Formula SAE Team is competing in Formula SAE, Nebraska, for the second
Robotic Device for Cleaning of Photovoltaic Arrays V2
 Robotic Device for Cleaning of Photovoltaic Arrays V2 Design Team Greg Belogolovsky, Steve Bennett, Istvan Hauer, Salome Morales, Leonid Nemiro Design Advisor Constantinos Mavroidis, Ph.D. Richard Ranky,
SAE Mini BAJA: Suspension and Steering
 SAE Mini BAJA: Suspension and Steering By Zane Cross, Kyle Egan, Nick Garry, Trevor Hochhaus Team 11 Project Progress Submitted towards partial fulfillment of the requirements for Mechanical Engineering
New Frontier in Energy, Engineering, Environment & Science (NFEEES-2018 ) Feb
 Feb") RESEARCH ARTICLE OPEN ACCESS DESIGN AND IMPACT ANALYSIS OF A ROLLCAGE FOR FORMULA HYBRID VEHICLE Aayush Bohra 1, Ajay Sharma 2 1(Mechanical department, Arya College of Engineering & I.T.,kukas, Jaipur)
RESEARCH ARTICLE OPEN ACCESS DESIGN AND IMPACT ANALYSIS OF A ROLLCAGE FOR FORMULA HYBRID VEHICLE Aayush Bohra 1, Ajay Sharma 2 1(Mechanical department, Arya College of Engineering & I.T.,kukas, Jaipur)
Design And Development Of Roll Cage For An All-Terrain Vehicle
 Design And Development Of Roll Cage For An All-Terrain Vehicle Khelan Chaudhari, Amogh Joshi, Ranjit Kunte, Kushal Nair E-mail : khelanchoudhary@gmail.com, amogh_4291@yahoo.co.in,ranjitkunte@gmail.com,krockon007@gmail.com
Stationary Bike Generator System
 Central Washington University ScholarWorks@CWU All Undergraduate Projects Undergraduate Student Projects Spring 2017 Stationary Bike Generator System Rakan Alghamdi Central Washington University, rk_rk11@hotmail.com
Team HPV: A Quick Review
 : A Quick Review Prepared By: Tyler Jandreau, Taylor Brown, Jamie Huffman, Joey Stine, Kevin Villa, Matt Strand, Kyle Chapman, Jimmy Woodard, Adam Cooper and is only reproducible with permission of 1 Overall
Design and Analysis of suspension system components
 Design and Analysis of suspension system components Manohar Gade 1, Rayees Shaikh 2, Deepak Bijamwar 3, Shubham Jambale 4, Vikram Kulkarni 5 1 Student, Department of Mechanical Engineering, D Y Patil college
FE151 Aluminum Association Inc. Impact of Vehicle Weight Reduction on a Class 8 Truck for Fuel Economy Benefits
 FE151 Aluminum Association Inc. Impact of Vehicle Weight Reduction on a Class 8 Truck for Fuel Economy Benefits 08 February, 2010 www.ricardo.com Agenda Scope and Approach Vehicle Modeling in MSC.EASY5
SAE Mini Baja. Frame Team. Ahmed Alnattar, Neil Gehr, Matthew Legg. Project Proposal
 SAE Mini Baja Frame Team Project Proposal Ahmed Alnattar, Neil Gehr, Matthew Legg 12-3-14 1 Overview Introduction Customer s Needs and Project Goals Constraints, Objectives, QFD, and Timeline Concept Generation
SAE Mini Baja By Ahmed Alnattar, Neil Gehr, and Matthew Legg Team 11
 SAE Mini Baja 2014-2015 By Ahmed Alnattar, Neil Gehr, and Matthew Legg Team 11 Final Report Document April 22, 2015 Submitted towards partial fulfillment of the requirements for Mechanical Engineering
Project Report Cover Page
 New York State Pollution Prevention Institute R&D Program 2015-2016 Student Competition Project Report Cover Page University/College Name Team Name Team Member Names SUNY Buffalo UB-Engineers for a Sustainable
SAE Baja - Drivetrain
 SAE Baja - Drivetrain By Ricardo Inzunza, Brandon Janca, Ryan Worden Team 11A Concept Generation and Selection Document Submitted towards partial fulfillment of the requirements for Mechanical Engineering
Contact: New Technology for the Concrete Jungle
 SRBSYSTEMS New Technology for the Concrete Jungle SRB Titan Precast Magnet Clamps The new SRB Titan precast magnet clamp will be the world s strongest precast magnet for its size. The SRB Titan is substantially
COMPANY PRESENTATION
 COMPANY PRESENTATION COMPANY PROFILE Elka Suspension was founded in 2000 and quickly established itself as the North American leader in aftermarket suspension manufacturing through a revolutionary approach
The Wildcat Formula Racing 2017 Sponsor Information Packet
 The Wildcat Formula Racing 2017 Sponsor Information Packet A Letter from the Team Captain Thank you for your interest in Formula SAE at the University of Arizona, also known as Wildcat Formula Racing.
An Analysis of Less Hazardous Roadside Signposts. By Andrei Lozzi & Paul Briozzo Dept of Mechanical & Mechatronic Engineering University of Sydney
 An Analysis of Less Hazardous Roadside Signposts By Andrei Lozzi & Paul Briozzo Dept of Mechanical & Mechatronic Engineering University of Sydney 1 Abstract This work arrives at an overview of requirements
Introduction: Problem statement
 Introduction: Problem statement The goal of this project is to develop a catapult system that can be used to throw a squash ball the farthest distance and to be able to have some degree of accuracy with
COMMUTER SCOOTER. Design Team Andrew Bates, Christopher Holtzman Michael Lewon, Sant Vangavolu. Design Advisor Professor Jim Papadopoulos
 COMMUTER SCOOTER Design Team Andrew Bates, Christopher Holtzman Michael Lewon, Sant Vangavolu Design Advisor Professor Jim Papadopoulos Abstract In a city environment, most commuters take mass transit.
Solar Boat Capstone Group
 Solar Boat Capstone Group Design Team Chris Maccia, Jeff Tyler, Matt Knight, Carla Pettit, Dan Sheridan Design Advisor Prof. M. Taslim Abstract Every year Solar Splash, the IEEE World Championship of intercollegiate
R I T. Rochester Institute of Technology. Human Powered Vehicle Team Sponsorship and Information Packet
 R I T Rochester Institute of Technology Human Powered Vehicle Team 2010-2011 Sponsorship and Information Packet Rochester Institute of Technology Human Powered Vehicle Team Kate Gleason College of Engineering
ME 455 Lecture Ideas, Fall 2010
 ME 455 Lecture Ideas, Fall 2010 COURSE INTRODUCTION Course goal, design a vehicle (SAE Baja and Formula) Half lecture half project work Group and individual work, integrated Design - optimal solution subject
DESIGN AND ANALYSIS OF TUBULAR CHASSIS OF GO-KART
 DESIGN AND ANALYSIS OF TUBULAR CHASSIS OF GO-KART Prashant Thakare 1, Rishikesh Mishra 2, Kartik Kannav 3, Nikunj Vitalkar 4, Shreyas Patil 5, Snehal Malviya 6 1 UG Students, Department of Mechanical Engineering,
2012 Baja SAE Drivetrain
 2012 Baja SAE Drivetrain A thesis submitted to the Faculty of the Mechanical Engineering Technology Program of the University of Cincinnati in partial fulfillment of the requirements for the degree of
SAFERIDER Project FP SAFERIDER Andrea Borin November 5th, 2010 Final Event & Demonstration Leicester, UK
 SAFERIDER Project FP7-216355 SAFERIDER Advanced Rider Assistance Systems Andrea Borin andrea.borin@ymre.yamaha-motor.it ARAS: Advanced Rider Assistance Systems Speed Alert Curve Frontal Collision Intersection
P5 STOPPING DISTANCES
 P5 STOPPING DISTANCES Practice Questions Name: Class: Date: Time: 85 minutes Marks: 84 marks Comments: GCSE PHYSICS ONLY Page of 28 The stopping distance of a car is the sum of the thinking distance and
Summary briefing on four major new mass-reduction assessment for light-duty vehicles
 Summary briefing on four major new mass-reduction assessment for light-duty vehicles In 2010-2012, in the development of US passenger vehicle standards for model years 2017-2025, there were many questions
Remote Control Helicopter. Engineering Analysis Document
 Remote Control Helicopter By Abdul Aldulaimi, Travis Cole, David Cosio, Matt Finch, Jacob Ruechel, Randy Van Dusen Team 04 Engineering Analysis Document Submitted towards partial fulfillment of the requirements
INTRODUCTION Team Composition Electrical System
 IGVC2015-WOBBLER DESIGN OF AN AUTONOMOUS GROUND VEHICLE BY THE UNIVERSITY OF WEST FLORIDA UNMANNED SYSTEMS LAB FOR THE 2015 INTELLIGENT GROUND VEHICLE COMPETITION University of West Florida Department
F.I.R.S.T. Robotic Drive Base
 F.I.R.S.T. Robotic Drive Base Design Team Shane Lentini, Jose Orozco, Henry Sick, Rich Phelan Design Advisor Prof. Sinan Muftu Abstract F.I.R.S.T. is an organization dedicated to inspiring and teaching
OVERSIZED DERAILLEUR PULLEY EFFICIENCY TEST
 OVERSIZED DERAILLEUR PULLEY EFFICIENCY TEST SUMMARY 0.49 watts efficiency difference was measured between a 10T-10T pulley combination and a 15T-15T pulley combination, with chain tension and bearing variables
2008 Human Powered Vehicle
 Portland State University Maseeh College of Engineering and Computer Science 2008 Human Powered Vehicle Progress Report Winter 2008 March 12 th, 2008 PSU Advisor: Team: Derek Tretheway Ben Bolen Erik Chamberlain
Human Powered Vehicle Challenge. Concept Generation and Selection Document
 Human Powered Vehicle Challenge By Matt Gerlich, Alex Hawley, Phillip Kinsley, Heather Kutz, Kevin Montoya, Erik Nelson Team 9 Concept Generation and Selection Document Submitted towards partial fulfillment
Progress Report. Maseeh College of Engineering & Computer Science Winter Kart 2. Design Team Atom Falcone Austin Greene. Nick Vanklompenberg
 Progress Report Maseeh College of Engineering & Computer Science Winter 2016 Kart 2 Design Team Atom Falcone Austin Greene Jesse Majoros Nick Vanklompenberg Jake Waterman Jeffrey Williamson Faculty Advisor
FRONTAL OFF SET COLLISION
 FRONTAL OFF SET COLLISION MARC1 SOLUTIONS Rudy Limpert Short Paper PCB2 2014 www.pcbrakeinc.com 1 1.0. Introduction A crash-test-on- paper is an analysis using the forward method where impact conditions
DESIGN OF AUTOMOBILE S BODY SHAPE AND STUDY ON EFFECT OF AERODYNAMIC AIDS USING CFD ANALYSIS
 DESIGN OF AUTOMOBILE S BODY SHAPE AND STUDY ON EFFECT OF AERODYNAMIC AIDS USING CFD ANALYSIS Akshay S 1, Ashik Vincent 2, Athul Anand R 3, George Kurian 4, Dr. Shajan Kuriakose 5 1,2,3,4 B-Tech Degree
Safety factor and fatigue life effective design measures
 Safety factor and fatigue life effective design measures Many catastrophic failures have resulted from underestimation of design safety and/or fatigue of structures. Failure examples of engineered structures
Simple Gears and Transmission
 Simple Gears and Transmission Simple Gears and Transmission page: of 4 How can transmissions be designed so that they provide the force, speed and direction required and how efficient will the design be?
ADVANCED HIGH-STRENGTH STEEL FRONT RAIL SYSTEM PHASE II
 ADVANCED HIGH-STRENGTH STEEL FRONT RAIL SYSTEM PHASE II John Catterall General Motors Corporation Background Lightweighting initiatives have demonstrated that advanced high strength steels (AHSS) can be
White Paper. Compartmentalization and the Motorcoach
 White Paper Compartmentalization and the Motorcoach By: SafeGuard, a Division of IMMI April 9, 2009 Table of Contents Introduction 3 Compartmentalization in School Buses...3 Lap-Shoulder Belts on a Compartmentalized
Structural Analysis of Student Formula Race Car Chassis
 Structural Analysis of Student Formula Race Car Chassis Arindam Ghosh 1, Rishika Saha 2, Sourav Dhali 3, Adrija Das 4, Prasid Biswas 5, Alok Kumar Dubey 6 1Assistant Professor, Dept. of Mechanical Engineering,
Electromagnetic Fully Flexible Valve Actuator
 Electromagnetic Fully Flexible Valve Actuator A traditional cam drive train, shown in Figure 1, acts on the valve stems to open and close the valves. As the crankshaft drives the camshaft through gears
Simulation of Structural Latches in an Automotive Seat System Using LS-DYNA
 Simulation of Structural Latches in an Automotive Seat System Using LS-DYNA Tuhin Halder Lear Corporation, U152 Group 5200, Auto Club Drive Dearborn, MI 48126 USA. + 313 845 0492 thalder@ford.com Keywords:
EFFECTIVENESS OF COUNTERMEASURES IN RESPONSE TO FMVSS 201 UPPER INTERIOR HEAD IMPACT PROTECTION
 EFFECTIVENESS OF COUNTERMEASURES IN RESPONSE TO FMVSS 201 UPPER INTERIOR HEAD IMPACT PROTECTION Arun Chickmenahalli Lear Corporation Michigan, USA Tel: 248-447-7771 Fax: 248-447-1512 E-mail: achickmenahalli@lear.com
Using ABAQUS in tire development process
 Using ABAQUS in tire development process Jani K. Ojala Nokian Tyres plc., R&D/Tire Construction Abstract: Development of a new product is relatively challenging task, especially in tire business area.
USING INSPIRE AS AN UPFRONT DESIGN, OPTIMIZATION & SIMULATION TOOL FOR EXISITNG MANUAL GEARBOX COMPONENTS
 USING INSPIRE AS AN UPFRONT DESIGN, OPTIMIZATION & SIMULATION TOOL FOR EXISITNG MANUAL GEARBOX COMPONENTS Lokesh Kumar Gupta Manager Drive Line Eicher Polaris Plot- SP1 & 2, Kukas Jaipur India 302028 Lkgupta@eicherpolaris.in
Applications in Design & Engine. Analyzing Compound, Robotic Machines
 v2.1 Compound Machines ering Applications in Design & Engine Analyzing Compound, Robotic Machines Educational Objectives At the conclusion of this lesson, students should be able to: Understand the relationship
Numerical Simulation of the Aerodynamic Drag of a Dimpled Car
 Numerical Simulation of the Aerodynamic Drag of a Dimpled Car By: Ross Neal Abstract: The drag coefficient of a dimpled half-car of various dimple radii and densities and a half-car without dimples was
Cane Creek Double Barrel Instructions
 Cane Creek Double Barrel Instructions Congratulations on your purchase of the Cane Creek Double Barrel rear shock. Developed in partnership with Öhlins Racing, the Double Barrel brings revolutionary suspension
SAE Mini Baja. Final Presentation. Benjamin Bastidos, Jeramie Goodwin, Eric Lockwood Anthony McClinton, Caizhi Ming, Ruoheng Pan May 2, 2014
 SAE Mini Baja Final Presentation Benjamin Bastidos, Jeramie Goodwin, Eric Lockwood Anthony McClinton, Caizhi Ming, Ruoheng Pan May 2, 2014 Overview Project Introduction Need Statement Frame Design and
Simulation and Validation of FMVSS 207/210 Using LS-DYNA
 7 th International LS-DYNA Users Conference Simulation Technology (2) Simulation and Validation of FMVSS 207/210 Using LS-DYNA Vikas Patwardhan Tuhin Halder Frank Xu Babushankar Sambamoorthy Lear Corporation
Formula Electric
 2016-2017 Formula Electric Dear Sponsorship Partner, Thank you for taking an interest in McGill Formula Electric. Each year, we design, build and race an electric formula SAE car at competitions against
SAE Mini Baja: Suspension and Steering
 SAE Mini Baja: Suspension and Steering Project Proposal Zane Cross, Kyle Egan, Nick Garry, Trevor Hochhaus NAU December 3, 2014 Overview 2 Problem Definition and Project Plan Concept Generation Design
Human Powered Vehicle Concept Design Report
 Human Powered Vehicle Concept Design Report Prepared by: Marcel Lilavois (Mech E.) Mohammed Zumman Rahman (Mech E.) Kyle Smith (Mech E.) Latwan Warren (Mech E.) Jon Weimer (Mech E.) Faculty Advisor: Suryanarayana
Technical regulations for The Sun Trip Adventure June 29, 2014
 Technical regulations for The Sun Trip Adventure June 29, 2014 www.thesuntrip.com / Edition #2 / MILAN - ASTANA / 2015 CONTENTS Preamble Page 2 1. Overview Page 3 2. Types of Bikes Page 3 2.1 Dimensions
Proven Pulling Power.
 TR 4500 SERIES Proven Pulling Power. As a dedicated mover, the TR 4500 Series provides the pulling power and strength needed to significantly improve throughput while transporting heavy loads on carts.
Design of a Jet Impingement Research Setup
 Design of a Jet Impingement Research Setup Design Team Ghanim Al Qassim, Rebecca Meritz, Zach Stebbings, Stefan Tropsa Design Advisor Prof. Mohammed Taslim Email: M.taslim@neu.edu Abstract Jet impingement
2014 University of Cincinnati Baja SAE Braking System
 2014 University of Cincinnati Baja SAE Braking System A Baccalaureate thesis submitted to the School of Dynamic Systems College of Engineering and Applied Science University of Cincinnati In partial fulfillment
Fueling Savings: Higher Fuel Economy Standards Result In Big Savings for Consumers
 Fueling Savings: Higher Fuel Economy Standards Result In Big Savings for Consumers Prepared for Consumers Union September 7, 2016 AUTHORS Tyler Comings Avi Allison Frank Ackerman, PhD 485 Massachusetts
Arms Race Prosthetic Arm Engineering Challenge: FINAL REPORT
 Arms Race Prosthetic Arm Engineering Challenge: FINAL REPORT After designing, testing, revising, building, re-testing, and modifying your final Prosthetic Arm, each student is required to prepare a Report
ALCOA Project Design Engineering Design 009 Team 7 12/16/13 Submitted to Wallace Catanach
 ALCOA Project Design Engineering Design 009 Team 7 12/16/13 Submitted to Wallace Catanach Tim O Neill (tjo5125@psu.edu) Jacob Eaton (jne5074@psu.edu) Andrew McDonagh (apm186@psu.edu) Bryan O Donnell (byo5060@psu.edu)
ENERGY ANALYSIS OF A POWERTRAIN AND CHASSIS INTEGRATED SIMULATION ON A MILITARY DUTY CYCLE
 U.S. ARMY TANK AUTOMOTIVE RESEARCH, DEVELOPMENT AND ENGINEERING CENTER ENERGY ANALYSIS OF A POWERTRAIN AND CHASSIS INTEGRATED SIMULATION ON A MILITARY DUTY CYCLE GT Suite User s Conference: 9 November
Design and Optimisation of Roll Cage of a Single Seated ATV
 IOSR Journal of Mechanical and Civil Engineering (IOSR-JMCE) e-issn: 2278-1684,p-ISSN: 2320-334X, Volume 12, Issue 2 Ver. III (Mar - Apr. 2015), PP 56-61 www.iosrjournals.org Design and Optimisation of
Will the MIM Safe Variocage fit in my vehicle?
 Frequently Asked Questions What makes the MIM Safe Variocage the safest animal transport cage on the market? Will the MIM Safe Variocage fit in my vehicle? How can I choose a Variocage that is the correct
VARIABLE DISPLACEMENT OIL PUMP IMPROVES TRACKED VEHICLE TRANSMISSION EFFICIENCY
 2018 NDIA GROUND VEHICLE SYSTEMS ENGINEERING AND TECHNOLOGY SYMPOSIUM POWER & MOBILITY (P&M) TECHNICAL SESSION AUGUST 7-9, 2018 NOVI, MICHIGAN VARIABLE DISPLACEMENT OIL PUMP IMPROVES TRACKED VEHICLE TRANSMISSION
Orbital Test Stand. By Mary Begay, Brett Booen, Calvin Boothe, James Ellis and Nicholas Garcia. Team 7. Project Proposal Document
 Orbital Test Stand By Mary Begay, Brett Booen, Calvin Boothe, James Ellis and Nicholas Garcia Team 7 Project Proposal Document Submitted towards partial fulfillment of the requirements for Mechanical Engineering
FE Modeling and Analysis of a Human powered/electric Tricycle chassis
 FE Modeling and Analysis of a Human powered/electric Tricycle chassis Sahil Kakria B.Tech, Mechanical Engg UCOE, Punjabi University Patiala, Punjab-147004 kakria.sahil@gmail.com Abbreviations: SAE- Society
Waste Heat Recovery from an Internal Combustion Engine
 Waste Heat Recovery from an Internal Combustion Engine Design Team Josh Freeman, Matt McGroarty, Rob McGroarty Greg Pellegrini, Ming Wood Design Advisor Professor Mohammed Taslim Abstract A substantial
Your web browser (Safari 7) is out of date. For more security, comfort and. the best experience on this site: Update your browser Ignore
 is out of date. For more security, comfort and. the best experience on this site: Update your browser Ignore") Your web browser (Safari 7) is out of date. For more security, comfort and Activitydevelop the best experience on this site: Update your browser Ignore Circuits with Friends What is a circuit, and what
Your web browser (Safari 7) is out of date. For more security, comfort and Activitydevelop the best experience on this site: Update your browser Ignore Circuits with Friends What is a circuit, and what
Design of Formula SAE Suspension
 SAE TECHNICAL PAPER SERIES 2002-01-3310 Design of Formula SAE Suspension Badih A. Jawad and Jason Baumann Lawrence Technological University Reprinted From: Proceedings of the 2002 SAE Motorsports Engineering
University of New Hampshire: FSAE ECE Progress Report
 University of New Hampshire: FSAE ECE Progress Report Team Members: Christopher P. Loo & Joshua L. Moran Faculty Advisor: Francis C. Hludik, Jr., M.S. Courses Involved: ECE 541, ECE 543, ECE 562, ECE 633,
Non-Linear Finite Element Analysis of Typical Wiring Harness Connector and Terminal Assembly Using ABAQUS/CAE and ABAQUS/STANDARD
 Non-Linear Finite Element Analysis of Typical Wiring Harness Connector and Terminal Assembly Using ABAQUS/CAE and ABAQUS/STANDARD Boya Lakshmi Narayana William G Strang Aashish Bhatia Delphi Automotive
Solar Power-Optimized Cart
 Solar Power-Optimized Cart Initial Project and Group Identification Document Due: September 17, 2013 Group #28 Group Members: Jacob Bitterman Cameron Boozarjomehri William Ellett Potential Sponsors: Duke
COMPUTATIONAL FLOW MODEL OF WESTFALL'S 2900 MIXER TO BE USED BY CNRL FOR BITUMEN VISCOSITY CONTROL Report R0. By Kimbal A.
 COMPUTATIONAL FLOW MODEL OF WESTFALL'S 2900 MIXER TO BE USED BY CNRL FOR BITUMEN VISCOSITY CONTROL Report 412509-1R0 By Kimbal A. Hall, PE Submitted to: WESTFALL MANUFACTURING COMPANY May 2012 ALDEN RESEARCH
Survey Report Informatica PowerCenter Express. Right-Sized Data Integration for the Smaller Project
 Survey Report Informatica PowerCenter Express Right-Sized Data Integration for the Smaller Project 1 Introduction The business department, smaller organization, and independent developer have been severely
White Paper. Phone: Fax: Advance Lifts, Inc. All rights reserved.
 White Paper TURNTABLE AppLicATioN GUidE This section covers the full range of turntables manufactured by Advance Lifts. The basic information necessary to select an appropriate turntable for an application
MOONBUGGY REPORT. Submitted by Galgotias College of Engineering and Technology Team 1 1, Knowledge Park-2 Greater Noida, Uttar Pradesh INDIA
 MOONBUGGY REPORT Submitted by Galgotias College of Engineering and Technology Team 1 1, Knowledge Park-2 Greater Noida, Uttar Pradesh INDIA TEAM DETAILS Our Moonbuggy design consists of its suspension
White Paper: The Physics of Braking Systems
 White Paper: The Physics of Braking Systems The Conservation of Energy The braking system exists to convert the energy of a vehicle in motion into thermal energy, more commonly referred to as heat. From
2015 Project Plan Report
 2015 Project Plan Report Jack Haiston, jhaiston@outlook.com, (970) 420-0943 Tyler Norris, tnorris93@me.com, (513) 288-0258 Loren Christensen, lchristensen92@gmail.com, (719) 580-0750 Nathan Houser, nthnhsr@rams.colostate.edu,
Maverick Engineering Personal Transportation Vehicle. Brian Wolfe Joe Bilinski Tim Ferlin Mike Schiavone
 Maverick Engineering Personal Transportation Vehicle Brian Wolfe Joe Bilinski Tim Ferlin Mike Schiavone Overview Design Goals Design Discussion Performance Testing and Competition Areas for Improvement
Second Generation Bicycle Recharging Station
 Second Generation Bicycle Recharging Station By Jasem Alhabashy, Riyadh Alzahrani, Brandon Gabrelcik, Ryan Murphy and Ruben Villezcas Team 13 Final Report For ME486c Document Submitted towards partial
RNRG WHITE PAPER Early Detection of High Speed Bearing Failures
 BACKGROUND RNRG worked with a large wind turbine owner in North America to demonstrate that the TurbinePhD condition monitoring system can detect faults early and reduce maintenance costs. An evaluation
PROJECT AQUILA 211 ENGINEERING DRIVE AUBURN, AL POST LAUNCH ASSESSMENT REVIEW
 PROJECT AQUILA 211 ENGINEERING DRIVE AUBURN, AL 36849 POST LAUNCH ASSESSMENT REVIEW APRIL 29, 2016 Motor Specifications The team originally planned to use an Aerotech L-1520T motor and attempted four full
EJE 120 Competitive Comparison
 EJE 120 Competitive Comparison Jungheinrich EJE 120 vs. The Competition Toyota 7HBW23 / Raymond 102XM Crown WP2300 Hyster W40Z / Yale MPB040 Disclosure Statement The data and information relating to competitors
Design and Front Impact Analysis of Rollcage
 International Conference on Challenges and Opportunities in Mechanical Engineering, Industrial Engineering and Management Studies 7 Design and Front Impact Analysis of Rollcage Gautam Yadav and Ankit Jain
Preliminary Detailed Design Review
 Preliminary Detailed Design Review Project Review Project Status Timekeeping and Setback Management Manufacturing techniques Drawing formats Design Features Phase Objectives Task Assignment Justification
New Development of Highly Efficient Front-Wheel Drive Transmissions in the Compact Vehicle Segment
 New Development of Highly Efficient Front-Wheel Drive Transmissions in the Compact Vehicle Segment Introduction Dr. Ing. Ansgar Damm, Dipl.-Ing. Tobias Gödecke, Dr. Ing. Ralf Wörner, Dipl.-Ing. Gerhard
DESIGN AND DEVELOPMENT OF A SUSPENSION SYSTEM USED IN ROUGH- TERRAIN VEHICLE CONTROL FOR VIBRATION SUPPRESSION IN PLANETARY EXPLORATION
 DESIGN AND DEVELOPMENT OF A SUSPENSION SYSTEM USED IN ROUGH- TERRAIN VEHICLE CONTROL FOR VIBRATION SUPPRESSION IN PLANETARY EXPLORATION Arvin Niro College of Engineering University of Hawaiʽi at Mānoa
Performance evaluation for various braking systems of street motorcycles
 Performance evaluation for various braking systems of street motorcycles Introduction This report covers a series of motorcycle braking tests aimed at measuring the performance of the front brake and of
Simulating Rotary Draw Bending and Tube Hydroforming
 Abstract: Simulating Rotary Draw Bending and Tube Hydroforming Dilip K Mahanty, Narendran M. Balan Engineering Services Group, Tata Consultancy Services Tube hydroforming is currently an active area of
APPENDIX A: Background Information to help you design your car:
 APPENDIX A: Background Information to help you design your car: Solar Cars: A solar car is an automobile that is powered by the sun. Recently, solar power has seen a large interest in the news as a way
Technology for Safe and Lightweight Automobiles
 AUTOMOTIVE Plastics Application Technology for Safe and Lightweight Automobiles Sudhakar R. Marur Table of Contents Preface...xv Chapter 1 Introduction to Plastics Application Technology... 1 1.1 Introduction...1