RURAL ELECTRIFICATION IN INDIA CUSTOMER BEHAVIOUR AND DEMAND FEBRUARY 2019
|
|
|
- Dominick Baldwin Hensley
- 5 years ago
- Views:
Transcription

1 RURAL ELECTRIFICATION IN INDIA CUSTOMER BEHAVIOUR AND DEMAND FEBRUARY

2 2
3 ABOUT US Smart Power India Smart Power India (SPI) is the key agency implementing the Rockefeller Foundation s Smart Power initiative. SPI extends power to those without sufficient access, with the goal of ending energy poverty and transforming the livelihoods of the underserved. To this end, SPI works to build and nurture ecosystems which promote sustainable and scalable models for delivering electricity access. Initiative for Sustainable Energy Policy The Initiative for Sustainable Energy (ISEP) is an interdisciplinary research program at the John Hopkins University School of Advanced International Studies. ISEP uses cutting-edge social and behavioural science to design, test, and implement better energy policies in emerging economies. The aim of ISEP is to identify opportunities for policy reforms that allow emerging economies to pursue human development at minimal economic and environmental cost. The initiative explores such opportunities both proactively, with continuous policy innovation and bold ideas, and by responding to policymakers demands and needs in sustained engagement and dialogue. 3
4 ACKNOWLEDGEMENTS We thank all the survey participants who took the time to respond to our questions and shared their views and preferences. We also acknowledge the leadership and core team of Smart Power India (SPI) and Initiative for Sustainable Energy Policy (ISEP) who directed this study. Leadership Team Ashvin Dayal, Associate VP, MD- Power, The Rockefeller Foundation Clare Boland Ross, Senior Associate Director, The Rockefeller Foundation Jaideep Mukherji, Chief Executive Officer, Smart Power India Sidhartha Vermani, Senior Director, Smart Power India Core Team of Authors Shalu Agrawal, Research Associate, Initiative for Sustainable Energy Policy Nidhi Bali, Program Manager, Smart Power India Dr. Johannes Urpelainen, Founding Director, Initiative for Sustainable Energy Policy Research Advisory Dr. S. P Harish, Assistant Professor, Government College of William and Mary Aseem Mahajan, Ph. D Candidate, Government, Harvard University Daniel Thomas, Ph. D Candidate, Political Science, Columbia University Ryan Kennedy, Associate Professor, University of Houston Survey Team Morsel Research and Development Pvt Ltd, Lucknow Photography Monica Tiwari

5 FOREWORD Led by the Government s outstanding efforts towards electrification, India has witnessed a massive transformation over the last decade with the grid now present everywhere. Enhancing these efforts with actions that can enable supply of quality electricity to the last mile is an ongoing task. Jaideep Mukherji Chief Executive Officer Smart Power India Smart Power India (SPI) was established by the Rockefeller Foundation to advance the Smart Power program, and complement the Government of India s efforts in realizing the goals of rural electricity access. Based on SPI s work, we have observed that the delivery models which evolve from customers needs and demand patterns are sustainable. However, there are gaps in our understanding of crucial issues, including the quantification of baseline demand in rural areas, and the evaluation of factors which can improve consumption levels and payment behavior. Bridging these gaps is critical to devise viable electricity delivery solutions for under-served rural populations. SPI commissioned this study to dive deeper into the aspects of demand and customer behavior in rural areas. Perhaps for the first time ever, a study has been able to provide an estimate of village electricity demand. Another important insight is that wide gaps in access are still present in the case of rural micro-enterprises. These are paying customers and often the ones with higher consumption. Only 65% of the rural enterprises surveyed reported grid-connections and many reported reliance on diesel. Customer satisfaction, an important barometer of sustained use, is another area that requires attention. Presently, almost 40% of grid-electricity users do not express satisfaction with grid-electricity services. Dissatisfaction stems from attributes of reliability and adequacy. With regards to affordability, the impact of poor metering and irregular billing and collections contributes to negative perceptions. These findings and frameworks are relevant not only to India, but to many countries that are reforming their electricity sectors, as well as to those advancing national electrification programs. We hope that SPI s pursuit to bring these learnings forward, supported by strong evidence, will inspire efforts to deliver quality service to customers service that will underpin viable models of electrification and bring well-being to rural communities. Jaideep Mukherji, Chief Executive Officer Smart Power India

6 FOREWORD India is leading the global progress in electricity access. The country is on track to achieve the target of universal access to electricity much before the 2030 target date. Within this fast-changing electrification context lies the genesis of this study. Sidhartha Vermani Senior Director, Smart Power India This study set out to answer fundamental questions. Does everyone in the villages now have access to quality electric power? Is improved access delivering electricity to rural micro-enterprises? Do the electrified villages receive the quality and quantum of electricity that is required to see improvements in their lives? And if we looked at the citizens as recipients of electricity as a service, what are their expectations and levels of satisfaction? Smart Power India and ISEP commissioned this large-scale study across four Indian states. A few overarching findings stand out. First, the level of electricity access, if measured by infrastructural availability of the electric grid, stands high across villages in the surveyed states. This is true even for the lagging states like Bihar and Uttar Pradesh. However, the adoption of an electric connection has not improved everywhere and across different customer segments. Second, rural microenterprises largely remain unconnected from the electric grid and rely upon diesel generators amongst many other sources. Third, having an electric connection doesn t guarantee the energy s reliable supply and service redress from the supplier. This leads to disenchanted customers and a persistent perception of poor value. An outcome of all these is that the overall village electricity consumption in these villages, after stacking multiple sources of electricity, is only about half of the national average for residential consumption. The study recommends that servicing rural areas with a larger quantum of energy, which goes beyond basic household lighting is crucial. With electricity available, there will be greater opportunities for rural micro-enterprises to build upon existing ventures as well as embark upon new enterprises that were hitherto unviable because of the dearth of electricity. This will not only fuel rural economic growth but will also catalyse a cycle, making the markets attractive for the suppliers. Second, as natural monopolies, state electric utilities have a set market and the customer paradigm is not natural, because of which they see the customers as ratepayers. There is a need to build a strong understanding of customer segments and their requirements. There are learnings emerging from within the surveyed states. In Odisha, better service indicators among rural customers have not just led to a higher share of satisfied customers, but also higher consumption. Similarly, experiences of customers being serviced by private solar mini-grids show that a high-quality, reliable, and customized electricity service improves customer satisfaction. Companies and industries make some of their best decisions when they take time to understand and engage customers. Electric utilities are not exceptions. Competitive industries understand the value of the customer in the equation. A bigger lesson to learn is that the provision of adequate electricity access must go hand-in-hand with an understanding of the demand behaviour of the customers. Adoption, experience and usage are all important pieces of the value chain. As a first step, it requires giving the rural electricity customer a seat at the table. Sidhartha Vermani, Senior Director, Smart Power India

7 FOREWORD Energy in rural India is undergoing a rapid transformation. The Government of India s Saubhagya scheme has brought electricity to 25 million households, but many states continue to struggle with poor quality of electricity service. Load shedding, outages, and voltage fluctuation prevent rural communities from realizing the full potential of electric power. Distributed renewable energy resources such as solar mini-grids offer a new solution to the problem of reliable power. Dr. Johannes Urpelainen Prince Sultan bin Abdulaziz Professor and Director of Energy, Resources and Environment Founding Director, Initiative for Sustainable Energy Policy (ISEP) Johns Hopkins School of Advanced International Studies A collaboration between Smart Power India (SPI) and the Initiative for Sustainable Energy Policy (ISEP), this report explores the nature of India s rural electricity demand. The report draws on a survey of 10,000 households and 2,000 rural enterprises in 200 villages across four states: Bihar, Uttar Pradesh, Odisha, and Rajasthan. The study offers new insights into baseline electricity demand in a diverse set of rural communities. Our survey data allows us to estimate total electricity demand from different sources, ranging from the electric grid to solar home systems and diesel generators. An important and original feature of the survey methodology is a robust validation of the results with daily energy audits to a random sample of rural communities. The primary insight from the survey is that the use of electric power remains underwhelming in rural India. Most households and rural enterprises use minimal amounts of electricity. Productive loads to power the rural economy are rare exceptions. To put it bluntly, large swaths of rural India have missed the opportunity to exploit electric power for economic growth. These results call for vigorous and sustained efforts to empower the rural economy. Policymakers in India must solve two intertwined problems. The first is the lack of economic opportunity. Without stronger agricultural and industrial supply chains, rural communities cannot sustain the kinds of anchor consumers that would make high-quality rural electricity service financially sustainable. The second is the lack of adequate and reliable power that would enable productive activities, such as foodstuff processing or light industry. To solve the problem of stagnant rural power demand, the first step is to describe and diagnose the problem. We have taken this step in our collaboration, and the next step is to develop actionable, evidence-based policy solutions. It is our hope that a robust understanding of the baseline electricity demand in rural India serves both as an alarm and a planning tool for policymakers. Johannes Urpelainen Prince Sultan bin Abdulaziz Professor and Director of Energy, Resources and Environment (ERE)
8 8
9 Contents Executive Summary About the Study 02 Key Findings 02 Implications and Actions The Power of Putting the Customer First Providing Access to Electricity 10 Understanding Electricity Customers and Demand 10 Introducing the Study 11 Using this Study Personifying the Rural Electricity Customer Rural Household Customers 15 Rural Enterprise Customers Sources of Electricity Rural Households 23 Rural Enterprises Drivers of Customer Satisfaction Factors hindering Electricity Adoption 37 Factors influencing Customer Satisfaction 43 Learning from the Experiences of Mini-Grid Customers 50 Key Takeaways Characterizing Rural Electricity Demand Household Electricity Consumption 55 Electricity Consumption of Rural Enterprises 59 Electricity Consumption in Agriculture 63 Electricity Consumption at the Village Level 66 Key Takeaways Planning for Success Closing Remarks Annexures Glossary List of Abbreviations End Notes and References
10 List of Figures Figure 2.1: Percentage distribution of rural households across states, by customer socioeconomic profile Figure 2.2: Distribution of rural enterprises, by commercial activity Figure 2.3: Distribution of rural enterprises across states, by scale of operation Figure 2.4: Scale of rural enterprises, by commercial activity Figure 3.1: Gap between availability and adoption of grid-electricity for rural households, by state Figure 3.2: Electricity sources used by households across states Figure 3.3: Electricity sources used, by customer profile Figure 3.4 (a&b): Lighting sources used by un-electrified households Figure 3.5: Primary source of lighting for rural households, by state Figure 3.6: Gap between availability and adoption of grid-electricity for enterprises, by state Figure 3.7: Electricity sources used by rural enterprises, by state Figure 3.8: Electricity sources used by rural enterprise Figure 3.9: Electricity sources used by rural enterprises, by scale Figure 3.10 (a&b): Lighting sources used by un-electrified enterprises Figure 3.11: Primary sources of lighting for rural enterprises, by state Figure 4.1: Household reasons for not connecting to electric grid Figure 4.2: Share of households with metered grid-electricity connections, by state Figure 4.3: Frequency of receipt of grid-electricity bill by households, by state Figure 4.4: Household expense on grid-electricity, by socioeconomic status Figure 4.5: Correlation between adoption of grid-electricity and duration of power supply among households Figure 4.6: Reasons for not connecting to electric grid, by enterprises Figure 4.7 (a&b): Share of enterprises with metered grid-electricity connections and frequency of receipt of bill Figure 4.8: Household users perceptions about grid-electricity, by satisfaction level Figure 4.9: Satisfaction levels of rural households with grid-electricity, by state Figure 4.10: Share of enterprise customers satisfied with grid-electricity, by state Figure 4.11: Correlation between perceptions of users and non-users regarding grid-electricity Figure 4.12: Enterprise users perceptions regarding grid-electricity, by satisfaction level Figure 4.13: Awareness, availability, and adoption of mini-grid electricity Figure 4.14: Use of mini-grid electricity, by household socioeconomic status Figure 4.15: Perceptions of household mini-grid users Figure 4.16: Perceptions of enterprise mini-grid users Figure 5.1: Average electricity consumption of households, by state Figure 5.2: Average electricity consumption of households, by electricity source Figure 5.3: Distribution of households across MTM tiers of electricity consumption in kwh/month, by state Figure 5.4: Purpose of electricity use among rural households, by state Figure 5.5: Distribution of households across MTM tiers of electricity consumption, by village category Figure 5.6: Average electricity consumption of rural enterprises, by state Figure 5.7: Average electricity consumption of enterprises, by electricity source Figure 5.8: Distribution of rural enterprises, by MTM tier of electricity consumption Figure 5.9: Share of households that use irrigation pump sets, by state Figure 5.10: Type of irrigation pumps used, by state Figure 5.11: Annual electricity consumption of households for irrigation (kwh/year), by state Figure 5.12: Distribution of survey villages, by daily electricity consumption (kwh/day) Figure 5.13: Composition of village-level electricity demand, by state Figure 5.14: Type of appliances that drive household electricity demand Figure 5.15: Ownership and use of key household appliances Figure 5.16: Type of appliances that drive enterprise electricity demand Figure 5.17: Ownership and use of key appliances used in rural enterprises
11 List of Tables Table 2.1: Demographic profile of rural households, by economic status 17 Table 3.1: Metrics to measure the supply-side and demand-side gaps in grid-electricity access 24 Table 4.1: Average monthly expenditure of enterprises on different electricity sources 43 Table 4.2: Parameters of grid-electricity service across states 47 Table 5.1: Multitier matrix for classifying household electricity consumption 57 Table 5.2: Demand drivers and level of access for rural households 60 Table 5.3: Variation in monthly electricity consumption, by enterprise type 62 Table 5.4: Demand drivers and level of access for rural enterprises 64 Table 5.5: Characteristics of villages segmented by electricity consumption 68

12 CHAPTER 1 1
13 EXECUTIVE SUMMARY Executive Summary India is at the cusp of energy transformation, leading the global progress in electricity access. Between 2000 and 2016, half a billion people gained access to electricity in India, increasing the share of grid-electrified households from 43% to 82%. Since then, several new efforts are underway at central and state levels, with the goal of achieving universal household electrification by March While enabling access to electricity is a crucial first step, the goal of extending the electric grid to India s villages has eclipsed the need to provide quality access and service to the rural customers. Studies have pointed out that demand-side issues appear more significant in explaining the current gaps in electricity access. There is a need to better understand the factors that influence customer attitudes and decisions about electricity adoption and use. Even more important is to assess whether the current levels of electricity access are satisfactory, as many customers with electricity continue to face power outages and poor-quality supply. These are concerns that need to be addressed to realize the United Nations Sustainable Development Goal 7: Affordable and Clean Energy to ensure access to affordable, reliable and modern energy for all. About the Study This report is a collaboration between Smart Power India (SPI), a subsidiary of the Rockefeller Foundation and the Initiative for Sustainable Energy Policy (ISEP), at the Johns Hopkins School of Advanced International Studies. The report distils learnings on electricity access and customer demand. One of the unique contributions of this report is the insight on baseline electricity demand at a village level, including the use of electricity for productive purposes. The findings in this report are based on primary data collected from customer surveys of over 10,000 rural households and 2,000 rural enterprises across four Indian states Bihar, Uttar Pradesh, Odisha and Rajasthan. This report also provides insights into customer experiences under different electricity delivery models public sector distribution companies (DISCOMs), solar mini-grids, and private distribution franchises. Key Findings Electricity Sources Used by Rural Customers Grid-electrification coverage and adoption is high among rural households with the electric grid emerging as the primary source of electricity and lighting for many. However, gaps are prevalent with the rural micro-enterprises. In the study area, only 65% of enterprises had grid-electricity connections. While the share of connected rural enterprises is over 90% in Odisha and Rajasthan, it is lower than 60% in Uttar Pradesh and Bihar. Non-grid sources such as solar home systems, rechargeable batteries, mini-grids, and diesel generators form an important part of the rural electricity mix. Sixteen percent of households and 40% of enterprises use non-grid sources. 2
14 EXECUTIVE SUMMARY Barriers to Electricity Adoption Most households without grid-electricity cite affordability as a key barrier. While households are economically disadvantaged, concerns about affordability are a manifestation of the gaps in electricity meter coverage and billing efficiency, because of which customers have to bear inflated electricity bills. With the rural enterprises, affordability concerns are associated with high connection costs and the availability of alternatives that give customers the flexibility to get reliable electricity. An uncertain power supply and the long duration of power cuts can also deter potential customers from adopting electric grid-connections. One in two grid-users faces a power cut of at least 8 hours daily. Besides the inconvenience, an unreliable electricity supply forces a customer to bear additional expenses on power back-ups. Drivers of Customer Satisfaction Only 60% of electric grid-users are satisfied with the DISCOMs services. Such high levels of dissatisfaction should be a cause for concern as it links them to negative perceptions of electricity service. An inter-state comparison confirms that states, such as Odisha with better service parameters like longer supply hours, better meter coverage and regular billing have a higher share of satisfied customers. Service reliability and adequacy drive customer satisfaction more than the perception of affordability. Insights from the experiences of mini-grid customers suggest that a high-quality, reliable, and customized electricity service can help improve customer satisfaction. Over 80% of mini-grid users display satisfaction with their connections, despite citing affordability challenges. Rural Electricity Demand and its Drivers Average electricity demand of surveyed rural households is 39 kwh per month, which is half of the national average for residential consumption. This demand is being serviced by different sources of electricity with customers often stacking multiple sources. The electricity demand of electric grid-users is higher at 51 kwh per month. Average electricity demand of rural enterprises is also low at 39.5 kwh per month. Enterprise electricity demand varies with commercial activity as well as the scale of operation. Several enterprises with high electricity demand use diesel generators, reflecting the latent demand for electricity. An average village has a total electricity demand of 1,826 kwh per day, with about 52% contributed by households, 7% by enterprises, and the remainder by agriculture. Various sources of electricity, including diesel generators, serve this electricity demand. 3
15 EXECUTIVE SUMMARY Low consumption in rural areas is due to fewer appliances in use. Most of the electrified rural households use electricity for lighting and air circulation, but less than half use it for entertainment and less than a fifth use it for medium to high-power appliances such as a refrigerators, irons, and mixer-grinders. Apart from socioeconomic characteristics, a key predictor of rural electricity demand is hours of supply. Access to reliable and longer hours of electricity supply is correlated to higher adoption of grid-electricity. Implications and Actions DISCOMs should expand the focus of their electrification efforts beyond households, to include rural enterprises engaged in non-farm activities. These are the potential paying customers with a steady demand for quality electricity supply. Some of these enterprises with high electricity demand use expensive sources, such as diesel generators and that is revenue lost for electricity utilities. To make grid-electricity attractive for rural customers, electric utilities need to ensure universal meter coverage and timely billing and payment collection. This can ease concerns about the affordability of grid-electricity and ensure sustained electricity use for customers with limited needs and capacity to pay. Electricity service providers need to adopt a customer-first approach and work toward improving customer satisfaction levels. Towards this end, electricity service providers need to improve the reliability and quality of their supply. Given the role of non-grid solutions in facilitating electricity access, there is a parallel need for continued policy support for such solutions. They could supplement as well as complement the efforts for the electric grid-based rural electrification. Electricity demand in villages might increase with reliable supply and enabling of new productive use activities. Policies need to support adoption of medium to high-power appliances in rural areas, which could help to stimulate demand. Concluding Remarks It is hoped that this study will provide a fresh insight into the dynamic and fast-changing rural electricity market in India. A better understanding of rural customers is critical to identify diverse customer needs and devise customized solutions and strategies to reach under-served and un-served rural populations. 4
16

17 CHAPTER 1 7
18 THE POWER OF PUTTING THE CUSTOMER FIRST 1. The Power of Putting the Customer First Providing Access to Electricity 10 Understanding Electricity Customers and Demand 10 Introducing the Study 11 Using this Study 13 8
19 CHAPTER 1 Driving across rural India, it is easy to observe just how far electricity has penetrated the hinterland. In Bihar, for example, a state that was recently declared as 100% electrified, utility poles stretch across fields of green, evidence of the reach of the electric grid. The Government of India s Saubhagya (Pradhan Mantri Sahaj Bijli Har Ghar Yojana) scheme has done much to provide these connections exempt of initial connection fee to homes across rural India, and the numbers tell a remarkable story. The pace of electrification has rapidly increased, with 40 million people coming on-grid each year since Between 2000 and 2016, half a billion people gained access to electricity in India, increasing the share of grid-electrified households from 43% to 82%. i The pace of electrification also rapidly increased, with 40 million people coming on-grid each year since Paradoxically, studies consistently reflect that evidence of this wider electricity coverage in rural India does not automatically equate to higher rates of adoption and consistent use. India is still far from realizing the United Nation s Sustainable Development Goal 7: Ensuring access to affordable, reliable and modern energy for all. When the Saubhagya scheme was launched in September 2017, an estimated 30 million households in India lacked access to grid-electricity, with a majority of those identified as poor rural households. ii The challenge isn t necessarily coverage; among those that do have access to power, there is a significant share of electrified households and commercial establishments facing several supply-side challenges, including unscheduled power cuts, and poor quality supply with frequent interruptions, and low voltages. In a bid to address these issues themselves, many rural customers often stack different sources of electricity. Patterns vary by household and commercial establishment, based on need. Witness the real-life example of a chemist on one side of a village street who uses just solar power at his store. He has selected a customized package with pricing that meets his needs. Across the road, his competitor uses a combination of sources: the electric grid, a solar mini-grid, and a diesel generator. This Smart Power India (SPI) study is based on one of the largest customer surveys of the Indian electricity sector. It is a review of rural electricity markets, customer segments, and customer preferences; findings could be used to design interventions and recommend measures for improving access and adoption of electricity in rural areas. The survey covered more than 10,000 rural households and 2,000 rural enterprises across four Indian states Uttar Pradesh, Bihar, Odisha, and Rajasthan in a bid to better understand rural customers and their demand. This report s four key objectives, with related actionable items for both the government and the private sector, are: Map the availability and use of sources of electricity in rural areas across different geographies. Identify key barriers hindering the adoption and use of electricity by rural customers. Establish a baseline of electricity consumption by rural households and enterprises, and identify the key drivers of electricity demand and customer satisfaction. Identify replicable learnings from alternative delivery models. 9
20 THE POWER OF PUTTING THE CUSTOMER FIRST Providing Access to Electricity Rural electricity access is provided by state-owned utilities with distribution companies (DISCOMs) playing a key role. In providing access to the electric grid, utilities bear high infrastructure costs, transmission losses, power theft, and operational difficulties. iii That is in addition to the acknowledged challenges of last-mile electricity delivery. Several electricity delivery models have emerged to meet that gap, including various public-private partnership-based constructs like the distribution franchise model. DISCOMs, under the distribution franchise model, outsource their electricity distribution activities to private players in order to reduce Aggregate Technical & Commercial (AT&C) losses, improve operational efficiency, and ensure improved customer service. Odisha, for example, has the largest number of electricity divisions licensed to three private companies; they cater to both urban and rural customers. These companies have implemented several initiatives to improve customer experience, such as spot billing machines and 24x7 customer-care centers. Despite this approach, and its implementation across many states in India, iv experiences with this model remain mixed. Then, there are a large number of private and not-for-profit players providing distributed renewable energy (DRE) based solutions. More than 14,000 microand mini-grids v and over two million solar home systems have been deployed in India. DRE mini-grids are commonly small solar power plants with a peak-load capacity between 10 and 100 kw. They are used to supply electricity in a specific area through a dedicated distribution network. While a large share of minigrids have been installed under the Deen Dayal Upadhyaya Gram Jyoti Yojana (DDUGJY) scheme, others are operated by private players, often supported by philanthropic organizations. These centralized and decentralized interventions offer opportunities to accelerate ongoing efforts toward universal electricity access. However, the extent to which such interventions facilitate access and meet customer expectations is less understood. Understanding Electricity Customers and Demand It s a fair question: If there are many electricity service providers in the Indian market, why are there gaps in access? The answers perhaps lie in policies and programs that approach the subject of electricity access from a supply-side perspective. In August 2015, the Indian government launched the DDUGJY in order to achieve 100% village electrification within 1000 days. That target was met in April 2018, when the government declared every village in India as electrified but this only means that at least 10% of households in every village were connected to the electric grid. Moving beyond this limited definition of village electrification, the government s next target, under the Saubhagya scheme, was set at 100% household electrification by March Both government initiatives are commendable, and reflect policy focus on the issue of electricity access. They also indicate the supply-side approach inherent in 10
21 CHAPTER 1 rural electrification drives. However, as some studies have pointed out, demandside issues appear more significant in explaining current gaps in electricity access. These issues include, among others: significant barriers to adoption, low electricity demand due to lack of appliances, and poor satisfaction with the level and quality of service. vi Previous studies of gaps in electricity access in India have also pointed to factors such as low affordability, lack of clarity about procedures, and an unreliable supply. Even as these broadly indicate areas of concern, there remains an insufficient in-depth understanding of how and why these factors influence customer attitudes and decisions about adoption and use. For instance, claims of customers citing affordability as a barrier to adoption are intriguing, given that domestic electricity connections are heavily subsidized in India. ix There also appears to be an inadequate understanding of electricity demand, and its drivers, in rural areas. x This is on account of limited information available in public domain. Few studies of the electricity landscape in India have delved into issues of electricity demand and its drivers; they largely focus on urban customers and rely on general household surveys, which often lack comprehensive data on xi, xii energy use. Adding to the unknown, electrification drives such as the Indian Government s Saubhagya scheme have largely focused on households as potential customers, while overlooking rural commercial enterprises. Such gaps are symptomatic of a disconnect between electricity suppliers and their customers, and an inadequate understanding of customers electricity needs and attitudes toward different sources. This holds true for both grid-electricity services and DRE providers. Despite the physical availability of grid-infrastructure today, many rural customers fail to utilize electricity connections. DRE providers, in turn, face difficulties in identifying the right customer segments, marketing strategies, and billing mechanisms. For the industry at large, a closer look at demand patterns and customer perceptions of and experiences with electricity services, is likely to provide a richer understanding of barriers to electricity use, and drivers of customer satisfaction. Introducing the Study This study collected primary data for rural households, enterprises, and communities spread across four states in India: Bihar, Odisha, Rajasthan, and Uttar Pradesh, which together account for 70% of all un-electrified households in India. These states have also seen diverse interventions and delivery models, while providing electricity access and better customer service. Given multiple research objectives, and the complex nature of the issue, the study employed a mix of data collection strategies, including social surveys complemented by qualitative interviews. The findings are based on social surveys of 10,049 households and 2,019 enterprises spread across 200 villages in the states of Bihar, Odisha, Rajasthan, and Uttar Pradesh. Villages surveyed were selected through purposive sampling, which covered villages with different types of electricity interventions grid-electricity managed by public DISCOMs, grid-electricity managed by private distribution franchises, and private solar mini-grids. vii,viii 11
22 THE POWER OF PUTTING THE CUSTOMER FIRST STUDY SAMPLE 10,049 2, HOUSEHOLDS (50 in each village) ENTERPRISES (10 in each village) VILLAGES DISTRICTS STATES UTTAR PRADESH DISTRICTS: Balrampur, Farrukhabad, Kushinagar, Hardoi, Lakhimpur Kheri, Pratapgarh, Rae Bareli, Shajahanpur, Shrawasti, Sitapur, Unnao, Agra, Azamgarh, Jhansi, Mirzapur BIHAR DISTRICTS: Araria, East Champaran, Gaya, Gopalganj, Saran, Siwan, Supaul, West Champaran, Munger, Rohtas ODISHA RAJASTHAN DISTRICTS: Kota, Ajmer, Baran, Bikaner, Dhaulpur, Jhalawar, Karauli, Sawai Madhopur DISTRICTS: Puri, Nayagarh, Khorda, Cuttak, Jagatsinghpur, Kendrapara, Dhenkanal, Anugul, Ganjam, Balangir, Deogarh, Kalahandi, Kandhamal, Sambalpur 12
23 CHAPTER 1 Overall, the study covered 50 villages with solar mini-grids (referred to as MG villages), 50 villages with electricity distribution franchises (referred to as DF villages), and 100 villages without mini-grid or distribution franchises, but similar to the MG villages and DF villages in terms of population and distance from the nearest town. This approach enabled measurement and comparison of attitudes, perceptions, and satisfaction of electricity users and non-users with access to different types of electricity services. Within each village, 50 households and 10 enterprises were sampled in a random manner. 1 Additional details on the research design and methodology employed are available in Annex 1. Using this Study SPI believes this study will provide fresh insights into the dynamic and fast-changing rural electricity market in India. A better understanding of rural customers is instrumental in identifying diverse needs and constraints in electricity access. It s an understanding that, in turn, could help devise customized solutions and drive consumption among both underserved and unserved rural populations across the country. SPI also trusts that its work on the role of alternative electricity delivery models will inspire approaches that complement government efforts and the 24x7 Power for All program 2 in providing quality electricity in a reliable and timely manner. This report includes the following: Annexes, which present details of the methodology adopted. A glossary, which captures definitions of key words and phrases in the report; italicized words indicate terms defined in the glossary. End notes that provide references to external data sources 1. Only villages with a minimum of 20 rural enterprises were included in this study. 2. The program is a joint initiative between the central and state governments in India, with the objective to ensure 24x7 affordable and quality power supply to all customers by March
24 2. Personifying the Rural Electricity Customer Rural Household Customers 15 Rural Enterprise Customers 18 14
25 CHAPTER 2 Rural audiences, like any other group of customers, display diversity in their social and economic statuses, with differences observed among both households and rural enterprises. These differences influence not just demand for electricity, but also customer attitudes and preferences toward various sources. This chapter makes the case that understanding this socioeconomic diversity facilitates a better understanding of electricity needs and choices in rural India. It first reviews households and then rural enterprises. Rural Household Customers This study assess the stated and observed ownership of durable assets, housing characteristics, and the availability of certain amenities, such as toilets and LPG connections to segment customers. To facilitate a deeper understanding of usage patterns in rural households, this study assesses the stated and observed ownership of durable assets, housing characteristics, and the availability of certain amenities, such as toilets and Liquified Petroleum Gas (LPG) connections for cooking. 3 This information assists in the identification and development of four household profiles, as indicated below. Each category also exhibits distinct levels of education, primary occupation, and income which, as seen going forward, are also drivers of electricity demand. The Four Rural Household Customer Profiles A.Rural Poor: Where most households have kutcha 4 houses with one room. A majority own bicycles, and a few houses are connected to the grid. B.Rural Lower: Where most households have semi-pucca or pucca 5 houses, with two to three rooms. Some houses have toilets and are equipped with LPG connections. A majority own agricultural land, have grid-electricity connections, and own bicycles and electric fans. C.Rural Middle: Where most households have pucca houses, with two to four rooms and toilets on the premises. A vast majority own agricultural land, have LPG connections, are on the grid, and own electric fans, television sets, and motorcycles. D.Rural Affluent: Where all households have pucca houses with at least four rooms, toilets, and an LPG connection in the house. All of them own agricultural land with grid-electricity connections, electric fans, bicycles, and motorized two-wheelers. A vast majority own television sets, while every second household has a motorized four-wheeler. 3. For details on methodology, see Annex Houses made from mud, thatch, or other low-quality materials. Levels of education vary by profile; decision makers in rural affluent households are typically educated beyond the high school, potentially increasing household living standards. Those in rural poor households are typically illiterate, with some having school education. A majority of those in rural lower and rural middle households have school education, with some educated beyond the 10th class (Table 2.1). 5. Houses made with high-quality materials throughout, including the floor, roof, and exterior walls. 15
26 PERSONIFYING THE RURAL ELECTRICITY CUSTOMER CUSTOMER PROFILES RURAL HOUSEHOLD Study categorises households into four groups, based on : household ownership of durable assets, housing characteristics, and availability of certain public amenities. Rural Poor Households Where most households have roughly constructed (kuccha) houses with one room. A majority own bicycles, and a few houses are also connected to the grid. Rural Lower Households Where most households have semi-finished (semi-pucca) or fully constructed (pucca) houses, with two to three rooms. Some houses have toilets and are equipped with LPG connections. A majority of them own agricultural land, bicycles, have grid-electricity connections, and electric fans. Rural Middle Households Where most households have pucca houses, with two to four rooms and toilets in the premises. A vast majority own agricultural land, have LPG connections, are on the grid, and own electric fans, television sets, and motorcycles. Rural Affluent Households Where all households have pucca houses with at least four rooms, toilets, and an LPG connection in the house. All of them own agricultural land with grid-electricity connection, electric fans, bicycles, and motorised two-wheelers. A vast majority own television sets, while every second household has a motorised four-wheeler. 16
27 CHAPTER 2 Table 2.1 : emographi pro le of rural households e onomi status Household Characteristics Household s Economic Status Rural Poor Rural Lower Rural Middle Rural Affluent Highest education level of household head: No formal education 56% 40% 23% 13% Up to class 9 37% 44% 45% 36% Class 10 and above 7% 16% 31% 51% Primary source of household income: Labor (agriculture or non-agriculture) 73% 56% 35% 10% Agriculture and allied activities 12% 27% 31% 46% Salaried job or business 15% 17% 34% 44% Income and expenditure statistics: Annual Income (INR) 58,700 78,000 1,14,000 1,87,000 Monthly expenses (INR) ,500 Low High Distribution of Household Customers by state Acronym: INR, Indian Rupee. This study finds that the distribution of various household profiles is broadly similar across all four states studied (Figure 2.1). Across states, an average of 9% fall under the rural poor category. However, a higher share of households in Uttar Pradesh belong to the rural poor and rural lower category. Odisha and Rajasthan have high shares of rural middle households. 6 Figure 2.1: Percentage distribution of rural households across states, by customer socioeconomic profile Households (%) Overall Uttar Pradesh Bihar Odisha Rajasthan Due to the research design, this distribution is representative only for the districts covered in this study and not representative at the state level. Rural Poor Rural Lower Rural Middle Rural Affluent 17
28 PERSONIFYING THE RURAL ELECTRICITY CUSTOMER Rural Enterprise Customers Enterprises in rural India are heterogeneous, with a diversity of commercial activities and scale of operation. Two-thirds of rural enterprises engage in retail trade, with the remaining one-third providing a wide range of services (Figure 2.2). Among the more common enterprises are grocery shops, followed by shops selling fast-moving consumer goods such as ready-made items, hardware, sweets, and snacks. Also familiar to every marketplace are service-based enterprises such as tailors and personal care services, such as beauty parlors. For a definition of these enterprise activities, please refer to the Glossary at the end of this report. A limited number of enterprises engage in agricultural services, such as flour mills, dairy, warehouses, and cold storage, because such enterprises are generally located near farms or within households. The survey, however, sampled enterprises located within a larger marketplace. Figure 2.2: Distribution of rural enterprises, by commercial activity Enterprises (%) 24.0 Grocery shop 3.0 Fruit/juice shop 10.0 Sweets/snacks shop 11.0 Ready-made goods 9.0 Hardware 2.0 Agri-inputs shop 6.0 Medical store 4.0 Mobile repair 3.0 Cybercafe 1.0 Photo studio 5.0 Tailoring shop 6.0 Beauty parlor 1.0 Carpentry 5.0 Cycle repair 4.0 Car service centre 3.0 Medical clinic 2.0 Flour mill 1.0 Warehouses 1.0 Cold storages 0.2 Dairy shop 1.0 Others Retail-based enterprises Service-based enterprises 7. For details on methodology, see Annex
29 CHAPTER 2 Rural enterprise profiles are based on enterprise building characteristics, the number of employees, and inventory value. 7 As a result, this study identifies three profiles of the rural enterprise. The Three Rural Enterprise Customer Profiles A.Rural small enterprises: Where most enterprises operate from rented spaces with kutcha or semipucca structures with a small shop area of less than 100 square feet (sq.ft). These are predominantly owner-managed shops, with very few enterprises having employees. A majority have inventory stock with a value less than INR 30,000 at a given point in time, reflecting their small scale of operation. B.Rural mid enterprises: Where most of these shops have fully constructed (pucca) structures that are small to medium in size, and two-thirds of businesses own their shops. While a majority are owner-managed shops, a third have employees assisting the owner. A majority have inventory stock with a value between INR 30,000 to INR 1,50,000 at a given point in time. 24% of enterprises surveyed are rural small, a majority (58%) are rural mid, with the remaining 18% belonging to the rural large profile. C.Rural large enterprises: Almost all these shops have pucca structures; a medium to large area, which could be greater than 250 sq.ft; with most entrepreneurs owning their shops. A majority of these shops have employees, and an inventory value greater than INR 1,50,000 at a given point in time. Distribution of Enterprise Customers by state Based on the above classification, 24% of enterprises surveyed are rural small, a majority (58%) are rural mid, with the remaining 18% belonging to the rural large profile (Figure 2.3). The distribution of rural enterprises is broadly similar across the four states, with Bihar having a relatively higher share of rural large enterprises. Figure 2.3: Distribution of rural enterprises across states, by scale of operation Enterprises (%) Overall Uttar Pradesh Bihar Odisha Rajasthan Rural Small Rural Mid Rural Large Most enterprise activities in rural India are carried out at different scales of operation; the study analyzed that scale for each of the retail- and service-based categories. 19
30 PERSONIFYING THE RURAL ELECTRICITY CUSTOMER CUSTOMER PROFILES RURAL ENTERPRISE Study categorises enterprises into three groups based on: enterprise building characteristics, the number of employees and inventory value. Rural Small Enterprise Where most enterprises operate from rented spaces with kutcha or semi-pucca structures with a small shop area of less than 100 square feet. Rented spaces Less than 100 sq.ft area Inventory stock values less than INR 30,000 These are predominantly owner-managed shops, with very few enterprises having employees. A majority have inventory stock with value less than INR 30,000 reflecting their small scale of operation. Rural Mid Enterprise Where most of these shops have fully constructed (pucca) structures that are small to medium in size, and two-thirds of businesses own their shops. Two third business own their shops and owner managed shops Between 100 and 250 sq.ft area Inventory stock with value between INR 30,000 to INR 1,50,000 While a majority are owner-managed shops, a third have employees assisting the owner. A majority have inventory stock with value between INR 30,000 to INR 1,50,000 reflecting their medium scale of operation. Rural Large Enterprise Almost all these shops have pucca structures, a medium to large area, which could be greater than 250 sq.ft, with most entrepreneurs owning their shops. Most own their shops Greater than 250 sq.ft area Inventory stock with value greater than INR 1,50,000 A majority of these shops have employees, and an inventory value greater than INR 1,50,000 reflecting their larger scale of operation. 20
31 CHAPTER 2 With the exception of fruit and juice shops, most enterprises engaging in retail trade belong to the rural mid scale and rural large scale categories. Service-based enterprises, such as flour mills, operate only at a rural mid scale or rural large scale. Enterprises such as cybercafes, photo studios, mobile repair, etc., are also predominantly rural mid and rural large enterprises. Any remaining service-based enterprises belong to either the rural small or rural mid categories.. Even though these findings are specific to the areas covered in this study, it confirms that commercial activities pursued by rural enterprises are at varied scales (Figure 2.4) Figure 2.4: Scale of rural enterprises, by commercial activity Enterprises (%) Grocery shop Fruit/juice shop Sweets/snacks shop Ready-made goods Hardware Agri-inputs shop Medical store Mobile repair Cyber cafe Photo studio Tailoring shop Beauty parlor Carpentry Cycle repair shop Car service centre Medical clinic Others Retail-based enterprises Rural Small Rural Mid Rural Large Service-based enterprises "Others" include cold storage, warehouse, and dairy or chilling center, which together comprise 2% of the total sample. The next chapter sheds light on different types of electricity sources used by rural enterprises, and how this type of adoption is interlinked with their socioeconomic characteristics. 21
32 3. Sources of Electricity Rural Households 23 Rural Enterprises 27 22
33 CHAPTER 3 Marketplaces and households in Indian villages are anything but stereotypical; even in rural settings, customers more often than not have the option of choosing between multiple products, based on needs, tastes, and price-points. Stores that line the main shopping area, for example, include providers of Internet services, school supplies, vegetable vendors, and small restaurants that serve both food and community news. Adding to that variety are the choices that each business owner makes when it comes to electricity. Whether choosing electric grid, solar mini-grids, diesel generators, or other options, they are guided by habit, differing business strategies, past experiences, and current economic realities. Information on and perceptions of sources of electricity in rural India isn t as clearly defined. While existing literature talks of the diversity of energy sources used by households for lighting and cooking, few studies look at the diversity of electricity sources used by rural households; even fewer focus on rural enterprises. This is an important distinction, one with direct bearing on policy and financial decisions made by governments, and business decisions made by the private sector to further develop rural India. This study considers three dimensions that facilitate a better understanding of electricity sources across diverse geographies and contexts: the adoption of grid-electricity; the role of different non-grid solutions in facilitating electricity access; and specific lighting solutions used by the un-electrified population. xiii,xiv Rural Households Recent years have seen the pace of electrification intensify across India, with the government reporting 100% electrification of villages in April That growth comes with a tacit acknowledgment that additional work is required, work that will move services beyond the physical infrastructure. Adoption of Grid-Electricity Seventy-five percent of households within the study area reported the use of grid-electricity. Gaps in access to grid-electricity were analyzed using metrics defined in Table 3.1. xv As per the survey data, 90% of rural households have an electric pole within 50 meters of their house. xvi The remaining 10% have electric poles located further away, a visible reflection of gaps in the penetration of electric grid s infrastructure. For such households, the absence of grid connections can be mainly attributed to lack of infrastructure, or a supply-side gap. However, the presence and awareness of grid-electricity does not always equate to a 100% rate of adoption. Fifteen percent of households in the study area do not have grid connections despite the availability of an electric pole near their home. The gap between availability and adoption reflects lack of demand for grid-electricity, the reasons for which are discussed later in Chapter 4. 23
34 SOURCES OF ELECTRICITY Table 3.1: Metrics to measure the supply-side and demand-side gaps in grid-electricity access Metric Construction Findings Availability rate Hook-up rate Access rate (Households that have electricity connection or electric pole within 50 meter distance) / (Total households) (Households that have electricity connection) / (Households for which infrastructure is available within 50 meter distance) (Households that use electricity) / (Total households) 90% 84% 75% Unserved population (100%) (Access rate) 25% Demand-side gap (Availability rate) (Access rate) 15% Supply-side gap (Unserved population) (Demand-side gap) 10% Note: Adapted from the World Bank s 2014 study titled Power for all: Electricity access challenge in India. Findings on the adoption of grid-electricity become more relevant when we look at statistics for households, grouped by states. While the availability of the electric grid is high across all four states studied, the share of grid-users is more than 90% in villages located in Bihar and Odisha but lower than 60% in Uttar Pradesh. The task of household electrification is going to be challenging in Uttar Pradesh, where efforts are needed to ensure adequate provisioning of grid-infrastructure, as well as addressing of demand-side challenges. In Rajasthan, Bihar, and Odisha, however, gaps in access to grid-electricity are primarily due to lack of demand from customers. Figure 3.1: Gap between availability and adoption of grid-electricity for rural households, by state Households (%) UTTAR PRADESH BIHAR ODISHA 90 RAJASTHAN 92 Availability Rate Access Rate 24
35 CHAPTER 3 Non-Grid-Electricity Use Despite the increasing footprint of grid-electricity, this study finds that several non-grid sources 8 are in use; these include, primarily, solar home systems, followed by rechargeable batteries, mini-grid electricity, and diesel generators (Figure 3.2). Overall 16% of households use non-grid-electricity sources, half of which also have grid connections. This is an important finding, as there is an assumption that non-grid sources are popular only among un-electrified households. In addition, past studies on the state of electricity access do not report such high levels of penetration of non-grid solutions in rural India. xvii The number illustrates the role played by non-grid sources both in enhancing the quality and reliability of access for those who are grid connected, and in facilitating electricity access for households lacking electric grid connections. Figure 3.2: Electricity sources used by households across states Households (%) Overall Uttar Pradesh Bihar Odisha Rajasthan Grid electricity Mini-grid electricity Solar Home System Rechargeable battery Diesel generator None Geographically, more than 95% of non-grid users in the study area are concentrated in Bihar and Uttar Pradesh. Annex 3.1 contains a list of electricity sources used by households belonging to villages with alternative electricity interventions. Usage Across Customer Segments This report previously examined four profiles of rural households. Perhaps unsurprisingly, less than a third of rural poor households use grid-electricity, with only two-thirds of rural lower households accessing the electric grid. A significant share of households in these two socio-economic categories use non-grid sources to meet their electricity needs, relying particularly on mini-grid, solar home systems, and batteries. 8. All electricity sources other than grid-electricity are referred to as non-grid-electricity sources. Grid-electricity is the most popular source among rural middle and rural affluent households, with non-grid sources used mainly for backup purposes. It s a reminder that the use of grid-electricity consistently increases with the parallel growth of a household s socioeconomic status (Figure 3.3). 25
36 SOURCES OF ELECTRICITY Figure 3.3: Electricity sources used, by customer profile Households (%) Rural Poor Rural Lower Rural Middle Rural Affluent Grid electricity Mini-grid electricity Solar Home System Rechargeable battery Diesel generator None Rural Households That Do Not Use Electricity The decision not to use electricity is a function of availability as well as affordability. A significant number of un-electrified homes (17%) remain, and a majority of these are rural poor and rural lower households. This is despite ongoing electrification drives and the availability of multiple alternative sources. Geographically, a majority (73%) of such households are in the eastern districts of Uttar Pradesh, which points to, and raises concerns about, the presence of systematic barriers hindering electricity access. Un-electrified households meet their lighting needs mostly with the use of kerosene lamps and lanterns, with a few using modern lighting sources such as solar lanterns, emergency lights, and torch lights (Figure 3.4 (a) and (b)). Figure 3.4 (a&b): Lighting sources used by un-electrified households (a)share of households using electricity (%) Lighting sour es used un ele tri ed households (%) 17 Kerosene Lamps/Lanterns 91 Solar Lanterns 28 Emergency Lights Torch Lights 9 Electricity users Electricity non-users Electricity non-users 26
37 CHAPTER 3 Sources of Lighting Rural households use various sources of electricity and lighting, with several households stacking multiple options. This then raises a question about the primary source of lighting in use. Data from households surveyed show that grid-electricity is the primary source for a majority of the surveyed population. Kerosene is the next most used source of lighting (Figure 3.5). In Uttar Pradesh, one in four households continues to rely on kerosene lamps and lanterns. In contrast, in states with a higher adoption of grid-electricity such as Odisha the reliance on kerosene for lighting is significantly lower. Figure 3.5: Primary source of lighting for rural households, by state Households (%) Overall Uttar Pradesh Bihar Odisha Rajasthan Grid electricity Solar Home System Diesel generator Others Mini-grid electricity Rechargeable battery Kerosene lamp None Others include solar lanterns, emergency lights, candles and torch lights Rural Enterprises One hundred percent electrification of villages is an impressive achievement by any measure and so is the work done under Saubhagya, the government s ongoing electrification initiative. The program largely focuses on household electrification, perhaps unintentionally prioritizing Ghar over Dukaan. The results are predictable: only 65% of enterprises connect to the electric grid. Enterprises that have better access to reliable electricity rely less on diesel, can offer better services and stay open longer increasing income for that entrepreneur, and creating prosperity within communities. They are, in effect, engines for growth within the rural economy. Nearly every small business invariably operates on a simple precept: I work to earn enough money that will feed my family, educate my children, and provide for my parents. I work to perhaps leave something for my family. The definition of enough money varies, depending on the strength of a business owner s vision. 27
38 SOURCES OF ELECTRICITY Policies and schemes don t necessarily consider the voice of the rural enterprise customer; one-size-fits-all electricity is just one example. Given constraints in supply and pricing, usage varies by the nature of the enterprise, with owners often using several sources of electricity to meet their needs. Commercial enterprises in rural India are, and should remain, an integral part of plans to increase rural prosperity and growth. Yet their overall adoption of grid-electricity lags behind that of rural households, making it increasingly critical to focus on consistency and quality delivery of electricity to this segment. This study finds that electricity usage is highest among enterprises engaging in skill-based services, or those which are capital intensive, including mobile repairs, cybercafes, photo studios, medical stores, and hardware shops. Adoption of Grid-Electricity In the survey of rural enterprises across four states, the study found that only 65% had grid-electricity connections. This percentage is lower than that of households in the area, with particularly low adoption rates in Bihar (58%) and Uttar Pradesh (43%). There are two primary reasons behind these low rates of adoption: (i) gridelectricity for enterprises is not subsidized as domestic electricity connections, and (ii) ongoing schemes for rural electrification largely focus on households. As with households, gaps in electricity access among rural enterprises is mainly a reflection of demand-side concerns. Approximately 90% of enterprises have an electric pole within a 50-meter distance, but only 65% have taken a grid connection. This leaves 25% of enterprises lacking grid-electricity, despite the physical proximity and availability of grid-infrastructure. The gap between availability and access is particularly high in the states of Bihar and Uttar Pradesh (Figure 3.6). Factors explaining these gaps are discussed in subsequent chapters. Figure 3.6: Gap between availability and adoption of grid-electricity for enterprises, by state Enterprises (%) UTTAR PRADESH BIHAR % ODISHA 94 RAJASTHAN 91 Availability Rate Access Rate 28
39 CHAPTER 3 Non-Grid Sources of Electricity In the absence of a concerted effort targeting rural enterprises, 40% of rural enterprises use non-grid-electricity sources to meet their lighting and other service needs. Rechargeable batteries, solar home systems, solar mini-grids and diesel generators are common non-grid sources; their popularity varies across states (Figure 3.7). 40% of rural enterprises use non-grid-electricity sources. Some service-based enterprises like flour mills and carpentry shops use expensive non-grid sources like diesel to power high wattage motor loads. In Bihar and Uttar Pradesh, one in two rural enterprises use non-grid-electricity sources, while the share is 16% for enterprises in Odisha and Rajasthan. For details on electricity sources used by enterprises in different village categories surveyed, see Annex 3.2. Electricity Sources by Commercial Activity The choice of electricity source for a rural enterprise varies with the type of commercial activity and the scale of operation. The use of grid as well as non-gridelectricity sources is highest among enterprises engaged in services such as mobile repair, photo studios, and cybercafes. These enterprises largely stack several sources of electricity, driven by a higher need for reliable electricity access. The study finds that a majority (60 to 70%) of enterprises engaged in retail trade, use grid-electricity; some also use non-grid sources. Some service-based enterprises like flour mills and carpentry shops use expensive non-grid sources like diesel to power high wattage motor loads. A significant share of enterprises engaged in activities such as repair services and tailoring do not use any electricity at all. This may be partly attributed to economic constraints, as a significant share of these enterprises operate at a very small scale (Figure 3.8). Figure 3.7: Electricity sources used by rural enterprises, by state Enterprises (%) Overall Uttar Pradesh Bihar Odisha Rajasthan Grid electricity Mini-grid electricity Solar Home System Rechargeable battery Diesel generator None 29
40 SOURCES OF ELECTRICITY Figure 3.8: Electricity sources used by rural enterprise 100 Enterprises (%) Grocery shop Fruit/juice shop Sweets/snacks shop Readymade goods Hardware shop Agri-inputs shop Medical store Mobile repair Cyber café Photo-studio Tailoring shop Beauty Parlour Carpentry shop Cycle repair shop Car service centre Medical clinic Flour mills Others Retail based enterprises Service based enterprises Grid-electricity Non-grid sources None Unsurprisingly, the use of grid-electricity increases with the scale of operation of an enterprise; those with more assets and inventory are more likely to use this as a source, potentially due to higher capacity and the willingness to pay for access (Figure 3.9). The scale of operation also determines the increasing use of non-grid sources, as enterprises stack their sources to meet their needs; this is a cyclical process that would need to be addressed to ensure true growth for rural enterprises. Enterprises lacking electricity access generally belong to the rural small and sometimes rural mid customer profiles. Figure 3.9: Electricity sources used by rural enterprises, by scale Enterprises (%) Rural Small Grid electricity Mini-grid electricity Rural Mid Solar Home System Rechargeable battery Rural Large Diesel generator None 30
41 LANDSCAPE OF ELECTRICITY ACCESS ACROSS STATES DEMAND METRICS Customers with grid-electricity available* to them SUPPLY METRICS Average hours of grid-electricity supply per day UTTAR PRADESH 82% 82% 90% BIHAR 97% 93% ODISHA 98% 100% RAJASTHAN 98% 98% UTTAR PRADESH BIHAR ODISHA RAJASTHAN * Measured as the availability of an electric pole within 50 meter distance HOUSEHOLDS ENTERPRISE Hours of grid-electricity supply between 6pm and 12 am Customers who use grid-electricity UTTAR PRADESH Households 58% 42% BIHAR Households 91% 9% Enterprise 44% 56% Enterprise 58% 42% UTTAR PRADESH BIHAR ODISHA RAJASTHAN ODISHA RAJASTHAN Households Enterprise 90% 10% 94% 6% Households Enterprise 92% 8% 91% 9% Share of grid users having metered connections Share of grid users receiving electricity bills on time UTTAR PRADESH UTTAR PRADESH Household Customers with grid-electricity Enterprise Customers with grid-electricity Customers without grid-electricity 41% 52% 21% 32% Customers who use non - grid sources Customers who use only non - grid sources BIHAR 81% BIHAR 40% UTTAR PRADESH BIHAR UTTAR PRADESH BIHAR 57% 40% 26% 50% 18% 68% 16% 32% 3% 36% ODISHA 90% ODISHA 87% 59% 67% ODISHA RAJASTHAN ODISHA RAJASTHAN RAJASTHAN RAJASTHAN 1.7% 17% 1.3% 13% 0% 0.6% 0.3% 2% 80% 77% 78% 84% HOUSEHOLDS ENTERPRISE HOUSEHOLDS ENTERPRISE 31 32
42 CHAPTER 3 Enterprises That Do Not Use Electricity This study also reveals an interesting statistic about rural enterprises: 14% do not use any kind of formal electricity source at all. A third of these unelectrified enterprises rely on diverse and often multiple lighting sources, ranging from kerosene and candles to solar lanterns and emergency lights (Figure 3.10 (a) and (b)). However, a majority of un-electrified businesses (65%) do not use any lighting source, and they largely operate in villages in Uttar Pradesh. The number seems plausible, as these enterprises mainly operate during daylight hours and rely on sunlight for their lighting needs. Sources of Lighting Enterprises stack multiple electricity sources, and those who do not have any formal source of electricity use alternatives for lighting purposes. Overall, among enterprises, grid-electricity is the most popular primary source of lighting for rural enterprises across all states. This is followed by alternatives: mostly solar home systems, rechargeable batteries, and mini-grids (Figure 3.11). In Uttar Pradesh, specifically, alternatives are the primary source of lighting for more than 65% of rural enterprises. This stands in contrast to observations made about rural households, where kerosene lamps remain the second most popular source in large part because of ready, and exclusive, access to subsidized kerosene for poor households. The data also indicates that with no access to this subsidized kerosene, rural enterprises have moved toward cleaner electricity and lighting sources. Figure 3.10 (a&b): Lighting sources used by un-electrified enterprises (a)share of enterprises using electricity (%) Lighting sour es used un ele tri ed enterprises (%) 14 None Kerosene Lamps/Lanterns Solar Lanterns Emergency Light Torch Light Candles 6 14 Electricity users Electricity non-users Electricity non-users (%) 33
43 SOURCES OF ELECTRICITY Figure 3.11: Primary sources of lighting for rural enterprises, by state Enterprises (%) Overall Uttar Pradesh Bihar Odisha Rajasthan Grid electricity Solar Home System Diesel generator Others Mini-grid electricity Rechargeable battery Kerosene lamp None Others include solar lanterns, emergency lights, candles and torch lights Key Takeaways Grid-electrification coverage and adoption is high across states with the electric grid emerging as the primary source of electricity and lighting for many. Non-grid sources such as solar home systems, rechargeable batteries, and mini-grid electricity form an important part of the rural electricity mix. Despite the physical availability of grid-electricity, almost a third of rural enterprises in Bihar and Uttar Pradesh rely exclusively on various non-grid sources. The choice of these sources of electricity varies by geography and economic status for households. For enterprises, these choices vary by type of commercial activity. Multiple gaps in access to electricity remain, particularly in the state of Uttar Pradesh. Gaps are much more prevalent in the case of rural enterprises who currently use and pay for alternatives, including expensive options such as diesel. As a segment, they are not necessarily identified and served effectively by electricity providers. The study s findings also give rise to several important questions. Why, for example, is the adoption of grid-electricity low despite being available? What barriers hinder the adoption of certain other sources, like mini grid electricity? And, what factors drive the sustained use of, and customer satisfaction with, electricity? Subsequent chapters attempt to answer these questions. 34
44 35
45 4. Drivers of Customer Satisfaction Factors hindering Electricity Adoption 37 Factors influencing Customer Satisfaction 43 Learning from the Experiences of Mini-Grid Customers 50 Key Takeaways 53 36
46 CHAPTER 4 The larger objectives of the universal electrification program in India go beyond achieving 100% connections to sustaining high standards of service to the satisfaction of the end customer. Achieving these objectives, therefore, requires an understanding of the factors that hinder the full adoption of electricity and those that drive customer satisfaction with electricity access. This chapter explores why some customers do not use electricity despite its availability, and identifies measures to address the current gaps. Importantly, the study investigates factors that can lead to higher adoption of and improved customer satisfaction with electricity sources. Factors hindering Electricity Adoption Rural Households This study s assessment of the realities on the ground, indicate that there exist several factors that both directly and indirectly influence the decisions of rural customers of electricity decisions that result in 15% of rural households not adopting grid-electricity despite being in close proximity to the grid-infrastructure. Based on customer responses, there are three key factors that explain the lack of adoption of grid-electricity: 1. An inability to afford grid-electricity, 2. Difficulty in getting a grid connection, and 3. Inadequate and unreliable power supply (Figure 4.1). An Inability to Afford Grid-Electricity Grid-electricity is viewed as expensive by a majority of households without grid connections. It is an intriguing claim by non-users, especially given the subsidized tariff made available. Analysis of the economic status and monthly expenditures of these households shows that only a fourth of these users are rural poor households, with kutcha houses and hardly any durable assets. However, the remaining three-fourths who claim an inability to afford grid-electricity belong to the rural lower and rural middle categories, with monthly expenditures of more than INR For such households, the use of grid-electricity for lighting and other basic needs would imply a consumption of less than 30 units per month, or a monthly electricity expense of less than INR 200, depending on the State tariffs (as shown in Annex 4.1). If these households were to use grid-electricity, their expense would be less than 6.7% of their monthly household expenditure. This is comparable with expenses incurred by current grid-users, who spend 6.4% of their household expenses on grid-electricity. 9. Under the scheme, un-electrified households with below poverty line (BPL) cards or meeting certain inclusion criteria can get freeelectricity connections, while others can get the connection for INR 500 (to be recovered in 10 instalments.) In other words, with the exception of a few households with limited resources, grid-electricity appears to be well within the purchasing capacity of a majority of non-users. Why then do non-users perceive grid-electricity as unaffordable? Any issues with the high up-front cost of electricity connection, as pointed out by earlier studies, have been significantly addressed under the ongoing Saubhagya scheme. 9 37
47 DRIVERS OF CUSTOMER SATISFACTION Figure 4.1: Household reasons for not connecting to electric grid Use non-grid sources 4 No proof of residence 2 Inadequate supply Unreliable supply 7 7 Could not get connection 20 Cannot afford 80 Share of unele tri ed households ith ele tri pole ithin m distan e Note: The total sum is greater than 100, as several households gave more than one reason. There appear to be other underlying reasons behind perceptions of unaffordability. More than 80% of non-users of grid-electricity citing these concerns are located in Uttar Pradesh, where there are two key issues. i) A high share of unmetered connections. Nearly half of the grid-connected households in Uttar Pradesh lack metered connections (Figure 4.2). They are charged a fixed monthly tariff of INR 400, a tariff that benefits wealthier households with high-load appliances. Poorer households, who need a fraction of the electricity for basic needs such as lighting and the charging of mobile phones, suddenly find themselves paying a much higher per-unit cost. The numbers tell the story. A household using two 7-watt LED bulbs for 12 hours per day would consume only 5 units of electricity per month. With a metered connection, such a household in Uttar Pradesh will have to pay only INR 65 per month at current tariffs; with unmetered connections, the expenses rise to the aforementioned INR 400 per month, equivalent to INR 80 per unit. ii) Irregularity in bill generation and collection. In Uttar Pradesh, only 20% of grid-connected households receive an electricity bill on a regular basis, i.e., once in every one or two months. However, more than two-thirds of households surveyed have either never received any bill, or receive it at irregular intervals, ranging from once in six months to once in several years (Figure 4.3). The absence of regular bills increases the burden of arrears for late payment on households that can ill afford additional payments. It also takes away the opportunity to plan household expenses and limit electricity consumption-in the event of receiving any high bills. Some households also reported problems with disproportionately inflated electricity bills. This may happen due to erroneous meter readings by the electricity department personnel, or the practice of generating bills using average consumption levels recorded through meters installed at a feeder level. 38
48 CHAPTER 4 Figure 4.2: Share of households with metered grid-electricity connections, by state 48 Households (%) Uttar Pradesh Bihar Odisha Rajasthan Yes No Yes, but not functional Figure 4.3: Frequency of receipt of grid-electricity bill by households, by state Households (%) Uttar Pradesh Bihar Odisha Rajasthan Regularly Irregularly Never New connection Such challenges in metering and billing in Uttar Pradesh are also evident from the fact that average monthly expenses on grid-electricity by households, in the state, are similar across all socioeconomic groups (Figure 4.4). This clearly illustrates that electricity expenses in Uttar Pradesh are not adequately linked to electricity consumption patterns shown in Annex 4.2. In the other three states studied, expenditure on grid-electricity increases with household socioeconomic status, and is linked to patterns of consumption. This also reflects that even households with limited capacity to pay, in these states, can meet their electricity needs at affordable costs. For instance, in Odisha, which has favorable statistics on meter coverage and regular billing, a fourth of grid-users incur electricity bills of less than INR 110 per month. These are comparable with expenses on kerosene use by un-electrified households. 39
49 DRIVERS OF CUSTOMER SATISFACTION Figure 4.4: Household expense on grid-electricity, by socioeconomic status 1,800 1,600 Household expense on grid ele tricity (INR/month) 1,400 1,200 1, Uttar Pradesh Bihar Odisha Rajasthan Socio-economic Status Rural Poor Rural Lower Rural Middle Rural Affluent Acronym: INR, Indian Rupee. In order to ensure that rural households find grid-electricity affordable, it would be important to improve meter coverage and ensure timely and accurate payment collection systems. Difficulties in Getting a Grid Connection Under the Saubhagya scheme, state electricity departments have been organizing awareness camps and fast-tracking applications for grid connections. Despite the ease of processes, a significant share of the households cite difficulty in getting a connection (Figure 4.1). Findings supplemented with qualitative interviews reveal that some households missed the opportunity to participate in these camps because they were away from their village at that time. Others did not have proper documentation, such as proof of residence, and for that reason they could not get a connection. The lack of documentation as a reason is also confirmed by other studies. Households with low levels of education face difficulty in preparing paperwork, including applications for grid connections. xviii Additionally, field insights point towards delays in the processing of applications by distribution companies, especially in Uttar Pradesh. xix Government statistics report that household electrification is close to saturation levels, which indicates that these concerns are being addressed. However, for households yet to be electrified, the challenges of getting a connection are likely to become even higher, as many of these are rural poor households with less education, often located farther away in difficult and remote terrains. 40
50 CHAPTER 4 Figure 4.5: Correlation between adoption of grid-electricity and duration of power supply among households 100 Share of grid onne ted households A erage grid ele tri it suppl in illage hours da Note: The blue line represents Loess or local regression curve. Inadequate and Unreliable Power Supply Power that is available when rural households need it the most can be, at best, a tenuous affair; one in two households with grid-electricity face a power cut of at least eight hours per day. During evening hours, more than a third face power cuts of at least three hours. Besides the inconvenience, a lack of reliable and adequate hours of power supply is also likely to deter potential users, especially those with limited resources. Survey findings show that the share of grid-connected households is higher in villages with a longer duration of power supply (Figure 4.5). 10 This also aligns with the finding that Uttar Pradesh, with the lowest share of grid-users, also has the lowest number of hours of average daily and evening power supply, at 12 hours and 3 hours, respectively. An important concern associated with inadequate and unreliable power supply is the need for backup lighting and electricity sources, together with the associated expenditure. Eighty-six percent of grid-connected households use at least one additional source of electricity or lighting, with kerosene as the most popular backup. 10. This association should be viewed with caution. It is also likely that hours of power supply is higher in villages with greater number of gridusers, which serves as an incentive for DISCOMs. In addition to paying electricity bills, grid-users have to spend INR 78 per month on kerosene use, which is comparable to what un-electrified households spend, at INR 94 per month. For economically weaker households on the grid, this implies additional expenditure on backup sources. Apart from the inconvenience and discomfort, power outages also contribute to perceptions that grid-electricity is unaffordable. 41
51 DRIVERS OF CUSTOMER SATISFACTION Rural Enterprises Enterprises cite multiple reasons for not using grid-electricity (Figure 4.6), including lack of documented proof of address for the shop, or a lack of ownership of the shops that are rented. 11 Research findings, however, point to two key factors that explain why certain rural enterprises do not use grid-electricity, despite its availability: The use of non-grid sources, which obviates the need for grid-electricity, and The perception that grid-electricity is expensive and unaffordable. Figure 4.6: Reasons for not connecting to electric grid, by enterprises Shop on rent 3 No address proof 2 Inadequate supply 10 Unreliable supply 15 Could not get connection 12 Cannot afford 42 Use non-grid sources 47 Share of unele tri ed enterprises ith ele tri pole ithin m distan e The Use of Non-Grid Sources Rural enterprises surveyed in Bihar and Uttar Pradesh are well aware of non-grid sources and find these readily available. For instance, among surveyed enterprises in these states, more than 90% have heard about the solar home systems, and around 50% are aware of mini-grid electricity. In cases where grid-electricity appears expensive and unattractive, enterprises have adopted cheaper alternatives. Table 4.1 shows that enterprises using non-grid sources, with the exception of private diesel generators, incur smaller electricity expenses than those using grid-electricity. Even though grid-users also have higher electricity consumption, these numbers indicate that many rural enterprises have chosen to reduce their electricity costs by adopting alternative solutions to suit their electricity needs. For instance, in Uttar Pradesh, enterprises using mini-grid or a connection from diesel generator operators, incur half the average monthly expenditure of grid-electricity users. Preferences for alternative solutions are also linked to the economic status of enterprises; a majority of those without grid-electricity operate at small or medium scales. 11. During field visits, many enterprises operating from rented shops were found using katiya (illegal) connections in Uttar Pradesh. However, some enterprises also use expensive sources like diesel generators with high capital and operational costs. Most are located in Uttar Pradesh and use diesel generators because they do not find grid-electricity reliable and adequate. These enterprises, which operate high-powered appliances such as welding machines and flour mills, can benefit from access to reliable and cheaper electricity services, making them attractive customers for electricity utilities in rural areas. 42
52 CHAPTER 4 Table 4.1: Average monthly expenditure of enterprises on different electricity sources Electricity source Overall Uttar Pradesh Bihar Odisha Rajasthan Grid-electricity Solar mini-grid Rechargeable battery Diesel generator (connections) Diesel generator (private) 5,699 6,545 4,924 1,778 - Note: This excludes the top 5% values to avoid distortion due to outliers. Acronym: INR, Indian Rupee. An Inability to Afford Grid-Electricity As in the case of households, on the basis of monthly expenditures, grid-electricity is within the purchasing capacity of most enterprises. For example, 75% of the enterprises who cite affordability as a concern earn more than INR 5000 per month. If these enterprises were to use grid-electricity for basic lighting and cooling needs, a majority would incur less than INR 250 per month, as seen in Annex 4.3. This constitutes less than 5% of their monthly income and is comparable with the 4% (on average) expenses incurred by grid-connected enterprises. However, this level of expenditure holds true only if enterprises can avail themselves of metered electricity connections and receive bills at regular intervals. In Bihar and Uttar Pradesh, less than 60% of enterprise grid connections are metered and less than 40% receive bills on a regular basis (Figures 4.7 (a) and (b)). High up-front costs for grid-electricity connections are another challenge faced by rural enterprises. Data reveal that enterprises have to pay INR 2800 on average as a connection fee. This is a prohibitive cost for many rural enterprises, particularly those with limited electricity needs and a low capacity to pay. In addition, power outages, particularly during the evening, further reduce the attractiveness of grid-electricity. Factors influencing Customer Satisfaction Rural Households Household electrification is approaching saturation levels under the Saubhagya scheme, primarily on account of easy availability of grid-electricity connections for no fee or at a subsidized connection fee. However, there are concerns about the sustained use of electricity for recently electrified households, particularly in the absence of satisfactory services. xx Survey data show that 40% of household users do not express satisfaction with their grid-electricity services. 43
53 DRIVERS OF CUSTOMER SATISFACTION Figure 4.7 (a&b): Share of enterprises with metered grid-electricity connections and frequency of receipt of bill Share of grid-connected households (%) (a)metered connections (b)bill frequency Uttar Pradesh Bihar Uttar Pradesh Bihar Yes No Regularly Irregularly Yes, but not functional Never New connection Shared/illegal connection To better understand drivers of customer satisfaction, users were asked about their perceptions toward different attributes of grid-electricity service. 12 Figure 4.8 shows that satisfied customers hold a positive perception about most service attributes, particularly the reliability, adequacy, and quality of supply. Thus, the customer satisfaction is driven mainly by reliability, adequacy, and quality of electricity supply, even more than the perception about affordability. In contrast, lack of satisfaction with grid-electricity is associated with negative perception towards supply parameters as well as affordability. If these concerns are not addressed, some of the dissatisfied customers may not find value for money affecting their willingness to pay for and use of electricity on a sustained basis. As per the survey, unsatisfied customers typically have a lower willingness to pay for reliable electricity supply as compared to those who are satisfied. 13 Figure 4.8: Household users perceptions about grid-electricity, by satisfaction level Reliable Customer perception is measured on a three-point scale, by asking whether they agree or disagree with the (positively framed) statements about each of the service attribute. For example: Do you agree or disagree with the following statements about grid-electricity? a. Grid-electricity is reliable. 1. Disagree, 2. Neutral, 3. Agree. Redress services Adequate 13. Respondents were asked to share their maximum willingness to pay for uninterrupted electricity supply that would allow them to use all desired appliances. Satisfied users Affordable Not Satisfied users Good quality 44
54 CUSTOMER PERCEPTION AND SATISFACTION Customer Satisfaction with electricity is driven by their perceptions towards different attributes of electricity services. USERS SATISFACTION WITH GRID ELECTRICTY HOUSEHOLDS 59% atisfied 62% atisfied PERCEPTION OF GRID ELECTICITY USERS Unsatisfied Households ADEQUATE 23% EASY REDRESS 28% USERS Satisfied Households AFFORDABLE 24% RELIABLE 81% ADEQUATE 80% NON USER Households GOOD QUALITY 79% AFFORDABLE 20% EASY REDRESS 25% ENTERPRISE NON USERS AWARENESS OF GRID ELECTRCITY 70% Non users have grid electricty available near their house HOUSEHOLDS 60% Non users have grid electricty available near their house ENTERPRISE ONLY 27% Non users think its easy to get grid connection ONLY 50% Non users think its easy to get grid connection USERS Satisfied Enterprises RELIABLE 74% ADEQUATE 78% USERS Unsatisfied Enterprises EASY REDRESS 38% GOOD QUALITY 80% NON USER nterprises ADEQUATE 27% AFFORDABLE 36% AFFORDABLE 34% EASY REDRESS 38% HOUSEHOLDS ENTERPRISES POOR PERCEPTION 45 46
55 CHAPTER 4 Satisfaction levels vary across the states, with one out of two grid-users in Uttar Pradesh and Bihar not satisfied with grid-electricity. Odisha, on the other hand, has a high share of satisfied customers (Figure 4.9). The grid-electricity customers in Odisha receive good quality and reliable services at a lower cost than any of the other states in this study. Odisha s experience underscores a key finding: customers in states with higher satisfaction levels typically receive longer hours of power supply, face fewer instances of voltage drops, and receive bills timely (Table 4.2). Additionally, one of the differences in the case of Odisha is that many parts of the state are served by private distribution franchisees, and that may have a role to play in largely positive customer experiences. Figure 4.9: Satisfaction levels of rural households with grid-electricity, by state 73 Households (%) Uttar Pradesh Bihar Odisha Rajasthan Satisfied Neutral Not Satisfied Table 4.2: Parameters of grid-electricity service across states Parameters of grid-electricity service Uttar Pradesh Bihar Odisha Rajasthan Daily supply hours (average) Evening supply hours (average) Days with low voltages per month (average) Metered connections 48% 71% 86% 79% Regular billing 21% 40% 87% 78% Average electricity bill (INR/month)
56 DRIVERS OF CUSTOMER SATISFACTION Rural Enterprises As per the survey, a significant 38% of the enterprises who use grid-electricity are either indifferent or explicitly dissatisfied with their connections. The satisfaction levels also vary across states (Figure 4.10). Figure 4.10: Share of enterprise customers satisfied with grid-electricity, by state Enterprises (%) Uttar Pradesh Bihar Odisha Rajasthan Satisfied Neutral Not Satisfied Note: A high number of enterprise users were satisfied with grid-electricity in Bihar. These are gaps in customer satisfaction that should be a cause of worry for distribution companies, and for two reasons. 1. A lack of satisfaction can influence the willingness of existing users to pay for their electricity bills. The survey finds satisfied users are willing to pay a higher electricity bill for reliable power supply, as compared to those who are not satisfied (Annex 4.4). 2. A lack of satisfaction implies that these grid-users do not hold positive perceptions of grid-electricity. Together with the presence of other barriers to adoption, the negative perceptions of current users can lead to negative word-of-mouth reviews. The perception of non-users toward grid-electricity is positively correlated with that of grid-users. 14 In villages where users of the grid have a negative outlook, any non-users also tend to have a predominantly negative outlook, possibly due to the word-of-mouth effect (Figure 4.11). While these trends are visible across all states studied, the extent of dissatisfaction with different service attributes also varies across states. 14. The analysis is done at a village level, as people-to-people interaction is stronger within village boundaries, rather than across it. It is based on a continuous Perception Index. Value 0, 0.5 and 1 represent negative, neutral and positive perception of grid-electricity service. See Annex 4.5 for details on methodology. Lack of reliable and adequate power supply is an issue across all states, predominantly in Uttar Pradesh. The most pressing concern for enterprises surveyed in Bihar is the potential lack of redress services, which may adversely limit productive activities. 48
57 CHAPTER 4 Electricity utilities need to work toward improving customer satisfaction levels in order to ensure sustained use of electricity, and they also need to attract more enterprises to take up grid-electricity connections. Improving customer service parameters is an important part of the efforts needed: A majority of dissatisfied users find grid-electricity unreliable, of poor quality, unaffordable, and difficult to get serviced in time (Figure 4.12). Electricity suppliers could address these concerns by making connection fee charges less daunting, increasing the availability of metered connections, ensuring the regular collection of bills, and guaranteeing the provision of a reliable and quality power supply. Figure 4.11: Correlation between perceptions of users and non-users regarding grid-electricity 1.00 Average Perception of enterprises ithout grid ele tri it A erage per eption of enterprises ith grid ele tri it Note: The blue line represents linear regression line. Figure 4.12: Enterprise users perceptions regarding grid-electricity, by satisfaction level Reliable Redress services Adequate Affordable 80 Good quality Satisfied users Not Satisfied users 49

58 DRIVERS OF CUSTOMER SATISFACTION Learning from the Experiences of Mini-Grid Customers Solar mini-grids are an important solution for tackling the challenge of rural electricity access. This section provides insights on the adoption of mini-grid electricity based on surveys of users and non-users of solar mini-grids across 50 villages in Uttar Pradesh and Bihar. Awareness, Availability, and Adoption of Mini-Grid Electricity As part of this study, 2,510 households and 504 enterprises were surveyed in 50 villages with solar mini-grids. Findings reveal that 75% of the rural population in these villages is aware of solar mini-grids. While 72% of households reported having heard about solar mini-grids, the share is higher among enterprises at 88%. Additionally, about 43% of households and 76% of enterprises in villages with mini-grids also agree that they know many people who use mini-grid electricity. Yet the fact remains that only 7% of households and 34% of enterprises surveyed use mini-grid electricity. Even though awareness about mini-grids plays a crucial role in their adoption, the wide gap between awareness and adoption could be partly attributed to the fact that villages have a limited amount of mini-grid coverage. Only 33% of all households in a village have a mini-grid available in their hamlet; this share is 70% for rural enterprises. 15 This is in line with the typical strategies adopted by mini-grid companies; the mini-grids are located close to commercial market areas, with a focus on promoting electricity access for productive purposes. xxi 15. Assuming that unaware households and enterprises do not have the technology in their hamlet. The majority of those who don t want to continue Figure 4.13 illustrates the gap between availability and adoption of mini-grid connection. While half of the rural enterprises with a mini-grid available in their hamlet have taken the connection, only one in five households with mini-grids in their hamlet use mini-grid electricity. 50
59 CHAPTER 4 Figure 4.13: Awareness, availability, and adoption of mini-grid electricity 88 Respondents in mini-grid villages (%) 72 Awareness Gap 33 Availability Gap 7 Adoption Gap Households Enterprises Heard about mini-grid Mini-grid in hamlet Use mini-grid The use of mini-grid electricity also varies with the socioeconomic profile of households and the type of commercial activity pursued by enterprises. Even though awareness and availability levels are comparable across households belonging to different socioeconomic groups, 80% of households using mini-grids belong to the rural lower and rural middle categories (Figure 4.14). Figure 4.14: Use of mini-grid electricity, by household socioeconomic status Households (%) Rural Poor Rural Lower Rural Middle Rural Affluent Heard about mini-grid Mini-grid in hamlet Use mini-grid 51
60 DRIVERS OF CUSTOMER SATISFACTION Satisfaction and Perceptions About Mini-Grid Electricity Survey results reveal that a vast majority of mini-grid users are satisfied with their connections. Data show that 80% of household users and 90% of enterprise users in the mini-grid villages say they are satisfied or very satisfied with their connections. The degree of customer satisfaction is also reflected in the fact that more than 90% of mini-grid customers agree that they will recommend the mini-grid electricity to others. Additionally, 80% of household users and 90% of enterprise users reported that they would like to continue with their mini-grid connections. 16 Satisfaction for mini-grid users can be gauged from their perceptions about mini-grid service. 17 Figures 4.15 and 4.16 show that the majority of mini-grid users find mini-grid electricity reliable, adequate, of good quality, and easy to get serviced in case of faults. In contrast, few mini-grid users hold positive perception about the various service attributes of grid-electricity. More than three-fourths of mini-grid users find mini-grid electricity adequate and reliable for their needs, despite availing themselves of an average of 7 hours of daily power supply. In contrast, grid-electricity users in these villages receive 12 hours of power supply, yet only 40% of them find the electric grid adequate and reliable. These different perceptions of adequacy and reliability can be explained by the fact that mini-grid users receive uninterrupted electricity during the critical evening hours (typically 5:00 p.m. to 11:00 p.m.), while electric grid-users have to face, on average, 3 hours of power cuts during evening hours. This suggests that rural customers find solar mini-grid electricity an attractive option because of the uninterrupted and quality power supply especially during evening hours, and the easy access to repair or redress services when required. However, a significant proportion of mini-grid customers do not find mini-grid electricity affordable, though this doesn t seem to influence their satisfaction with the services. This reinforces that a better service experience is a more important factor versus pricing. Figure 4.15: Perceptions of household mini-grid users Households (%) Reliable The majority of those who don t want to continue their connection are the ones who find mini-grid expensive 17. Customers perception about mini-grid electricity measured for six key service attributes: ease of getting grid-electricity connection, ease of getting repair services, affordability, reliability, adequacy and quality of power supply. Customer perception is measured on a three-point scale, by asking whether the respondent agrees or disagrees with the positively-framed statements on each of the service attribute. Easy to get connection Redress services Good quality Grid electricity Mini-grid electricity Adequate Affordable 52
61 CHAPTER 4 Figure 4.16: Perceptions of enterprise mini-grid users Enterprises (%) Reliable Easy to get connection Adequate Redress services Affordable 92 Good quality Grid electricity Mini-grid electricity Key Takeaways 35% of rural enterprises in the study area do not have electric grid connections. Electricity access for rural enterprises is a critical challenge that needs attention from policy makers and DISCOMs in future electrification efforts. Factors that hinder the adoption of grid-electricity include: Poor customer service that leads to customers negative perceptions and dissatisfaction. Affordability challenges that are related to lack of metering and gaps in billing and collections. Other affordability concerns, in the case of rural enterprises, that are mainly associated with high connection costs and the availability of alternatives. Reliance of several high-electricity-consuming rural enterprises on diesel generators an expensive alternative which highlights the opportunities for DISCOMs to expand their customer base. An uncertain power supply and the long duration of power cuts that deters potential customers from taking electric grid connections and additionally poses risks to the sustained use of electricity from the electric grid. The study also finds that around 40% of grid-electricity users are not satisfied with current levels of service. Customer perceptions of the reliability, adequacy, and quality of service are the important drivers of customer satisfaction, even more than perceptions about affordability. Service providers need to look for ways to improve customer satisfaction, and they could learn from the experiences in Odisha, which has comparatively better service parameters than the other three states studied. This parallels insights from the experiences of mini-grid customers, who also confirm that improved services lead to higher satisfaction levels and to more satisfied customers. 53
62 5. Characterizing Rural Electricity Demand Household Electricity Consumption 55 Electricity Consumption of Rural Enterprises 59 Electricity Consumption in Agriculture 63 Electricity Consumption at the Village Level 66 Key Takeaways 71 54
63 CHAPTER 5 The earlier chapters discussed how rural communities rely on various, and often multiple, sources of electricity. Chapter 4 also discussed the factors that drive satisfaction with those sources. This chapter sheds light on electricity consumed by rural households, enterprises, and agricultural users, and it identifies the drivers of increased rural electricity consumption. To estimate consumption, the study analyzed the ownership and use of appliances for residential, commercial, and agricultural purposes in rural areas. Helping categorize consumption levels is the World Bank s Energy Sector Management Assistance Program (ESMAP): the multitier matrix (MTM), a useful tool to evaluate levels of electricity access. This study thereafter aggregated the estimates of electricity consumption for domestic, commercial, and agricultural purposes into a general baseline of demand of an average surveyed village. The average electricity consumption of rural households, in the study area, from all sources of electricity, is 39.3 kwh/month. Household Electricity Consumption The average electricity consumption of rural households in the study area, from all sources of electricity, is 39.3 kwh/month. 18,19 This translates to a per capita annual consumption of 87 kwh, approximately half the all-india average for residential customers at 153 kwh. xxii Average consumption levels vary across states. Uttar Pradesh, where 40% of households surveyed do not use grid-electricity, has comparatively lower consumption levels than other states (Figure 5.1). Figure 5.1: Average electricity consumption of households, by state 69 (kwh/month) Uttar Pradesh Bihar Odisha Rajasthan 18. See Annex 5.1 for details on framework used to estimate baseline electricity consumption of households. 19. This includes households which use no electricity at all (i.e. zero value). 20. Undertaken by India s National Sample Survey Organization (NSSO). Sampling methodology of the surveys vary in terms of village and respondent selection. Household consumption levels also vary with the type of electricity source in use. As per this survey, households using only grid-electricity consume on average about 51 units per month. This estimate is similar to the rural household consumption estimate (53 units per month) from the Consumer Expenditure Survey The data also show that the electricity consumption of households using grid-electricity is much higher than that of households using only non-grid sources (Figure 5.2). For instance, the average demand of grid-only users is six times that of solar home system only users and 15 times that of mini-grid only users. 55
64 CHARACTERIZING DEMAND FOR RURAL ELECTRICITY Figure 5.2: Average electricity consumption of households, by electricity source 51 (kwh/month) Grid electricity (only) Mini-grid electricity (only) Solar home system (only) Battery (only) Diesel generator (only) The low consumption of non-grid users is due to multiple reasons: Most households with non-grid sources use smaller capacity systems or packages. Two cases in point illustrate this: 99% of solar home system users own a system of up to 200 watt peak capacity, which limits their consumption to less than 1 kwh/day; 90% of mini-grid users have availed themselves of fixed price packages that they use for LED bulbs, charging their mobile phones, and using a few fans for 5 to 8 hours in a day. 21 It is households with limited needs and an inability to pay who use non-grid sources as an exclusive electricity source. Using the Multitier Matrix to Assess Levels of Electricity Access for Households Developed by the World Bank s ESMAP, xxiii the MTM is a useful tool for evaluating the level of electricity access for a household. The tool goes beyond binary metrics of whether or not a household has an electricity connection. This tool helps better understand variations across surveyed households. On the MTM, household electricity consumption ranges from no electricity use (Tier 0) to highest consumption tier (Tier 5). Tier ranges are linked to the amount of electricity consumed, along with an indication of the purpose for which electricity is used (Table 5.1). The survey finds electricity consumption varies significantly across households (Figure 5.3). 36% of households surveyed fall in Tier 1 and Tier 2, i.e. use electricity for general lighting, air circulation, or televisions. Another 38% fall in Tier 3, i.e., use some medium power appliances. Only 9% of households consume more than 100 units per month, i.e., fall in Tier 4 and Tier As per the survey, 93% (i.e. 101/109) of households, which use mini-grid exclusively, own only light bulbs and mobile phones, and the remaining 7% also use a table or ceiling fan. The state of household electricity access varies widely across states (Figure 5.3). The share of Tier 1 and Tier 2 households is higher in Uttar Pradesh and Bihar. In contrast, more than two-thirds of households in Odisha and Rajasthan fall in Tier 3 and above. 56
65 CHAPTER 5 Table 5.1: Multitier matrix for classifying household electricity consumption Consumption tiers Tier 0 Tier 1 Tier 2 Tier 3 Tier 4 Tier 5 Consumption level (kwh per month) (0-0.36) [0.36-6) [6-30) [30-100) [ ) [250, above) Indicative appliances in use, as per the MTM None Task lights and mobile phones General lights, mobile phones, televisions, and fans (if needed) Tier 2 and any medium-power appliances Tier 2 and any high-power appliances Tier 2 and any very high-power appliances Indicative appliances in use, as per the survey None Lights and mobile phones Lights, mobile phones, fans, televisions Tier 2 and food processors, refrigerators Tier 3 and electric irons, desert coolers, washing machines Tier 4 and submersible water pumps, electric stoves Figure 5.3: Distribution of households across MTM tiers of electricity consumption in kwh/month, by state Households (%) Uttar Pradesh Bihar Odisha Rajasthan Tier 0 (0-0.36) Tier 1 [0.36-6) Tier 2 [6-30) Tier 3 [30-100) Tier 4 [ ) Tier 5 [250, above) Figure 5.4 shows how households use electricity across states; the use of electricity for cooling, entertainment, 22 and household chores, 23 is highest in Odisha, followed by Rajasthan, Bihar and Uttar Pradesh. These medium to high-power appliances constitute the bulk of electricity used by the households, explaining variations in household distribution on MTM tiers. 22. These include television sets, radios, and music systems. 23. These include appliances such as refrigerators, foor-processors/mixergrinders, washing machines, water pumps, irons and stoves. 57
66 CHARACTERIZING DEMAND FOR RURAL ELECTRICITY Figure 5.4: Purpose of electricity use among rural households, by state Share of households using electricity (%) Uttar Pradesh Bihar Odisha Rajasthan Lighting Mobile charging Cooling Entertainment Household chores The data show that there is also a correlation between the presence of alternative electricity delivery models and the levels of electricity access in households. Villages with private electricity distribution franchises have a higher share of households in higher-level tiers, as compared to similar villages 24 with only public distribution companies (Figure 5.5). However, more evidence is needed to assess the causal impact of such interventions on electricity access. Figure 5.5: Distribution of households across MTM tiers of electricity consumption, by village category Without Distribution Franchisee (Non-DF) With Distribution Franchisee Households (%) Tier 0 (0-0.36) Tier 1 [0.36-6) Tier 2 [6-30) Tier 3 [30-100) Tier 4 [ ) Tier 5 [250, above) What Drives Electricity Demand Among Rural Households? 24. Villages were sampled to ensure comparability of villages with alternative delivery models and those without them (see Annex 1.1 for sampling details). Annex 5.2 illustrates the socioeconomic profile of households in different village categories. The MTM framework is useful when evaluating the state of electricity access and experiences with electricity services. However, there are factors that influence the amount of electricity consumed, acting either as drivers of or barriers to electricity demand. A linear regression analysis was conducted to investigate these aspects, which then identified four key predictors of household electricity demand. The highlights are presented below, with details in Annex The economic status of households: On average, and with other factors remaining equal, households with a higher economic status consume more electricity than those with a lower economic 58
67 CHAPTER 5 status. This may be because households with a higher economic status tend to have larger houses, higher asset ownership and a higher capacity to pay, as profiled in Chapter The education level of the head of household: On average, and with other factors remaining equal, households where primary decision makers are educated up to and beyond Class 10, use more electricity than other households. 3. Primary sources of household income: Households where salaried jobs or businesses are the primary source of income tend to consume more electricity than those who rely on agriculture or labor. It is potentially a reflection of uncertainty and seasonality in income flows associated with the latter two activities. 4. Hours of grid-electricity supply in the village: On average, households in villages with longer hours of grid-electricity supply, consume more electricity. Access to reliable and longer hours of electricity supply can facilitate the use of appliances for longer hours. In addition, a steady supply encourages households to adopt the grid and invest in more appliances. 25 Findings also suggest that each hour of a power cut negatively influences electricity demand among rural enterprises, implying that unreliable electricity supply acts as a barrier to higher electricity use. Table 5.2 shows the economic status, education, and income source of households falling under each of the MTM Tiers. It is evident that households in Tier 0 and Tier 1 generally belong to rural poor and rural lower categories, have heads of household with little schooling, and depend on labor-intensive activities for their livelihood. Most households in Tier 3 and above levels of access are in villages that receive at least 12 hours of grid-electricity supply. A majority of households in Tier 2 and Tier 3 belong to the rural lower or rural mid categories, have heads of household with some education, income from agriculture, and at times, from labor-intensive activities. Households in Tier 4 and Tier 5 belong to the rural affluent or rural mid categories, have well educated heads of household, most with income from salaried jobs, business, or agricultural activities. Table 5.2 also shows that many households in Tier 3 and above are in villages that receive at least 12 hours of grid-electricity supply. In contrast, households in Tier 0 and Tier 1 are concentrated in villages with less than 12 hours of grid-electricity supply. Electricity Consumption of Rural Enterprises This study surveyed rural enterprises found in marketplaces of targeted villages; these enterprises ranged from retail shops to those providing various services. The electricity demands of these enterprises, similar to those of households, is generally low, with an average consumption of 39.5 units a month (Figure 5.6). 25. There is a moderate correlation between the variables hours of gridelectricity supply and the stock of appliances (wattage). 59
68 CHARACTERIZING DEMAND FOR RURAL ELECTRICITY Table 5.2: Demand drivers and level of access for rural households Household Characteristics Tier 0 (0-0.36) Tier 1 [0.36-6) Tier 2 [6-30) ESMAP multitier matrix Tier 3 [30-100) Tier 4 [ ) Tier 5 [250, above) Total Socioeconomic status of households 1: Rural Affluent : Rural Middle : Rural Lower : Rural Poor Total (%) Highest education level of household heads 1. Class 10 and above : Up to class : No formal education Total (%) Primary source of houshold income 1: Salaried job or business : Agriculture and livestock : Labor activities Total (%) Daily hours of grid-supply in village 1. More than 18 hours : Up to 18 hours : Less than 12 hours Total (%) Low High Note: Darker shades are associated with comparatively higher share of customers. Figure 5.6: Average electricity consumption of rural enterprises, by state 66 (kwh/month) Uttar Pradesh Bihar Odisha Rajasthan 60
69 CHAPTER 5 Figure 5.7: Average electricity consumption of enterprises, by electricity source Enterprise electricity demand (kwh/month) Grid electricity (only) Mini -grid electricity (only) Solar home system (only) Battery (only) Diesel generator (only) Average value Enterprise consumption levels also vary with the type of electricity source in use (Figure 5.7). Estimates for grid-only enterprise users are higher an average of 44 units per month than those using non-grid sources such as solar home systems, mini-grids, and rechargeable batteries. However, some enterprises use diesel generators either privately owned diesel generators, or connections from diesel generator operators. The average consumption of such users is many times higher than that of others, because of relatively high electricity consumption by enterprises like flour mills that rely on these diesel generators. These high use customers are potential grid-electricity customers, as they are used to paying for expensive sources. Using the Multitier Matrix to assess levels of electricity access for enterprises The MTM for electricity consumption was also used to analyse electricity use by enterprises. 26 Sixty percent of rural enterprises surveyed in this study use less than 30 units per month, i.e. they fall into Tier 1 or Tier 2 (Figure 5.8). Only a fourth of rural enterprises are in higher tiers, implying the use of medium to high power appliances. Enterprise consumption also varies across states; the share of enterprises falling in Tier 3 and above is higher in Odisha and Rajasthan. The share of Tier 1 enterprises is higher in Bihar and Uttar Pradesh, primarily due to the high use of non-grid sources. 26. The classification is meant for measuring household electricity consumption. However, in absence of any comparable classification for microenterprises, where energy needs can vary widely, we employ the household MTM framework, to facilitate comparison. 27. These include grocery shops, and shops selling fruits, juices, sweets, clothes, bags, medicines, electronic items, jewellery, etc. 28. These include tailoring shops, carpentry shops, cycle, bike or car repair shops, medical clinics, and warehouses. Electricity consumption also varies by commercial activity, which in turn determines the types of productive use appliances needed by rural enterprises. Overall, 5% of enterprises fall in Tier 4 and Tier 5, and use high power appliances. A majority of these are either flour mills, photo studios, cybercafes, or mobile repair shops. Table 5.3 shows the average monthly consumption of enterprises grouped by the type of product, or services provided by them. Flour mills have, on average, the highest levels of consumption, at around 800 units a month. This is 20 times the average for the whole sample, mainly because flour mills need high-power motors typically 10HP for milling purposes. Similarly, enterprises providing technology-enabled services consume 1.5 times the average consumption of all enterprises together. 61
70 CHARACTERIZING DEMAND FOR RURAL ELECTRICITY Figure 5.8: Distribution of rural enterprises, by MTM tier of electricity consumption Enterprises (%) Overall Uttar Pradesh Bihar Odisha Rajasthan Tier 0 (0-0.36) Tier 1 [0.36-6) Tier 2 [6-30) Tier 3 [30-100) Tier 4 [ ) Tier 5 [250, above) Enterprises engaging in retail trade 27 or other services 28 use electricity primarily for lighting and air circulation, with the occasional use of other appliances, including refrigerators, weighing scales, and air compressors. A significant share of retail and service-based enterprises do not use any electricity at all. This lowers the average electricity consumption of rural enterprises. Annex 5.4 lists the electricity consumption of different types of enterprises surveyed. What Drives Electricity Demand Among Rural Enterprises? A linear regression analysis conducted to identify key predictors of enterprise electricity demand, resulted in four variables emerging as significant predictors as presented below. Annex 5.5 further details the results. 1. The enterprise s scale of operation: On average, and with other factors remaining equal, enterprises with a larger scale of operation have a significantly higher electricity consumption as compared to those operating on a smaller scale. This is mainly because enterprises with larger scales of operation are the ones with greater need, capacity to pay, more assets, more employees, and a shop of their own as profiled in Chapter 2. Table 5.3: Variation in monthly electricity consumption, by enterprise type Enterprise type Sample size Average for all enterprises (kwh/month) Retail trade Services Technology-enabled services Flour mills All rural enterprises
71 CHAPTER 5 2. The nature of commercial activity: Enterprises with motor-based usage and those engaged in technology-enabled services have significantly higher consumption rates, as compared to those providing other services, or operating retail shops. This is because the nature of commercial activity dictates the electrical appliances needed by an enterprise, in turn determining their consumption levels. 3. The education level of the enterprise owner: Enterprises with more educated owners, have, on average, slightly higher electricity consumption than other enterprises, even when controlling for the scale of operation. 4. Hours of grid-electricity supply in the village: All other things being equal, enterprises located in villages with longer hours of grid-electricity supply, have higher electricity consumption. This suggests that each hour of a power cut is negatively associated with electricity demand among rural enterprises, essentially acting as a barrier to higher electricity use for productive purposes. Table 5.4 shows the scale of operation and commercial activity of rural enterprises under each MTM tier. It also shows the distribution of enterprises by hours of grid-electricity supply available to that tier, based on the survey. A majority of enterprises in higher consumption Tiers 4 and 5 are flour mills, or provide technologyenabled services like cyber-cafes and photo studios. A majority of enterprises in Tiers 4 and 5 are flour mills, or provide technologyenabled services. Most of these are rural large or rural mid scale enterprises, reflecting a higher capacity to pay. Tier 2 and Tier 3 enterprises are mainly rural mid scale and many engage in retail trade and service activities. Tier 0 and Tier 1 enterprises are typically very small enterprises with limited ability to pay and limited assets. Table 5.4 also shows that most enterprises in Tier 2 and above, are in villages that receive at least 12 hours of grid-electricity supply. In contrast, enterprises in Tiers 0 and 1 are concentrated in villages with less than 12 hours of grid-electricity supply. We also observe that several enterprises in villages with long power cuts are in higher tiers. But this is due to their reliance on backup sources such as private diesel generators. Electricity Consumption in Agriculture A significant portion of rural households in India rely on agriculture for their livelihood and the sector accounts for more than a fifth of power consumption in India. xxiv This study also explores electricity demand for agricultural use in the surveyed rural areas. Electricity for Irrigation 29. Diesel pumps are also included. More than 9 million farmers in India use diesel pumps, due to poor power supply or inability to get electricity connections for agriculture. Thus, the use of diesel pumps amounts to equivalent electricity consumption by way of electric pumps, if these were made available to the farmers. Electricity on Indian farms is almost exclusively used for running irrigation pumps; other farming equipment is powered by other fuels like crude oil and diesel. xxv This study captured agricultural demand for electricity by collecting information on the ownership and use of both electric and diesel irrigation pumps
72 CHARACTERIZING DEMAND FOR RURAL ELECTRICITY Table 5.4: Demand drivers and level of access for rural enterprises Drivers of Enterprise Electricity Demand Tier 0 (0-0.36) Tier 1 [0.36-6) Tier 2 [6-30) ESMAP multitier matrix Tier 3 [30-100) Tier 4 [ ) Tier 5 [250, above) Total Scale of operation 1: Rural Large : Rural Mid : Rural Small Total (%) Commerical activity 1: Flour mills : Technology enabled services : Other services : Retail trade Total (%) Highest education level of enterprise owner 1. Diploma or graduate Class 10 or : Up to class : No formal education Total (%) Daily hours of grid-supply in village 1. More than 18 hours : Up to 18 hours : Less than 12 hours Total (%) Note: Darker shades represent comparatively higher share of customers. Low High The survey reveals that 35% of total households surveyed use irrigation pump sets, underscoring the scale and importance of irrigation in the rural economy. The prevalence of pump irrigation significantly varies across states, as shown in Figure 5.9. While almost half of the total households in Uttar Pradesh and Bihar use motorized pumps for irrigation, the share is much lower in Rajasthan and Odisha. Such state-wise variations could also indicate the extent of groundwater usage for cultivation. Annex 5.6 details these findings. The survey shows that diesel irrigation pumps are more prevalent than electric ones. Less than a fourth of households that irrigate use electric pumps. This indicates that despite high subsidies on agricultural electricity, xxvi there remains a gap in use of grid-electricity for agricultural purposes. 64
73 CHAPTER 5 Figure 5.9: Share of households that used irrigation pump sets, by state Households (%) Overall Uttar Pradesh Bihar Odisha Rajasthan The type of irrigation pumps also varies across states, with higher presence of diesel pumps in Bihar (Figure 5.10). Annex 6.5 details state-wise statistics on the share of electric and diesel-powered irrigation in the four surveyed states. Figure 5.10: Type of irrigation pumps used, by state Households using irrigation pumps (%) Overall Uttar Pradesh Bihar Odisha Rajasthan Diesel pumps Electric pumps Note: The sum is less than 100, as few users reported pumps running on other fuels, or manual pumps. Electricity Consumption and Its Variations 30. Annual estimates are reported here, unlike the monthly estimates in case of households. This is because electricity consumption in agriculture is seasonal, and concentrated over less than 90 days in a year for 90% users. 31. Average estimated for households using either diesel or electric irrigation pumps. See Annex 6.7 for details on methodology used for estimating electricity consumption for diesel and electric pumps. On average, farmers using irrigation pumps consume an equivalent of 954 units of electricity per year, 30 i.e., approximately 80 units per month, for operating their irrigation pumps. 31 However, consumption varies significantly across states, as households in Rajasthan consume 4.5 times the average consumption levels, and those in Odisha and Bihar use less than half of the overall average. The wide variation across states can be partly attributed to the differences in ground water level. Consumption does not vary much with the source of electricity used to run irrigation pumps, except in Rajasthan. A lack of variation in Bihar, Uttar Pradesh, and Odisha, may be partially due to under-reporting of consumption hours by 65
74 CHARACTERIZING DEMAND FOR RURAL ELECTRICITY electric pump users, evident in the unusually high per unit electricity cost observed in the survey data. Figure 5.11 shows the electricity consumption of electric and diesel pump users across all four states. Figure 5.11: Annual electricity consumption of households for irrigation (kwh/ year), by state 4579 Average electricity consumption (kwh/year) Overall Uttar Pradesh Bihar Odisha Rajasthan Diesel pump users Electric pump users Electricity Consumption at the Village Level This study attempted to create a baseline of electricity consumption in each revenue village. It used estimates of electricity consumption by rural households, rural enterprises and, separately, for agricultural activities. This chapter presents key findings, with additional details available in Annex 5.8. Baseline Consumption and Its Variation Across Villages The average daily electricity consumption of revenue villages surveyed in this study is 1826 kwh per day. 32 However, the estimated electricity consumption, aggregated at village-level, varies widely, from 350 to 12,000 kwh per day across surveyed villages. Figure 5.12 shows the distribution of villages according to their daily electricity consumption. Village-level electricity demand also varies across states. More than 90% of villages in Bihar, Odisha, and Uttar Pradesh, consume less than 3,000 kwh per day (Figure 5.13). 32. Like in case of households and enterprises, these estimates reflect electricity consumption from both grid and off-grid sources. However, these do not include consumption within institutional settings, such as that of banks, ATMs, education and health facilities, etc. Households account for a majority of the electricity use in villages in Bihar and Odisha. But, in Rajasthan and Uttar Pradesh, village demand is mainly driven by high electricity consumption for irrigation. While rural enterprises represent a smaller share of village-level electricity demand, the share is consequential and densely clustered (Annex 5.9). On an average, households account for half of the consumption in the village, while agriculture and rural enterprises account for 41% and 7% of village demand, respectively. 66
75 CHAPTER 5 Figure 5.12: Distribution of survey villages, by daily electricity consumption (kwh/day) Share of villages (%) < 1,000 < 2,000 < 3,000 < 5,000 >= 5,000 Electricity consumption (kwh/day) Figure 5.13: Composition of village-level electricity demand, by state Average electricity consumption (kwh/day) ,155 1,228 2,863 1,636 Overall Uttar Pradesh Bihar Odisha Rajasthan Households Enterprises Agriculture What Drives Electricity Demand in Villages? Electricity demand in a village is determined by the size of the village, the number of households, the extent of commercial activity, and the share of electricity use for irrigation. Survey results showed villages with higher consumption levels have more households and enterprises, and also display a significantly higher share of electricity use for agriculture (Table 5.5). Electricity use for agriculture is influenced by a variety of factors, such as local climate, cropping patterns, groundwater levels, and availability of pumping equipment, together with state policies on irrigation. The electricity demand of households and enterprises depends on the types of appliances used, which this study explores in greater detail. 67
76 CHARACTERIZING DEMAND FOR RURAL ELECTRICITY Table 5.5: Characteristics of villages segmented by electricity consumption Across 200 sampled villages Statistic Village segments by daily consumption (kwh) < 1,000 < 2,000 < 3,000 < 5,000 >= 5,000 No. of villages No. of households per village ,169 1,466 1,873 No. of enterprises per village Number of flour mills per village Share of household demand (%) Share of enterprise demand (%) Share of agricultural demand (%) Average aggregate electricity demand (kwh/day) Households ,218 1,962 2,399 Enterprises Agriculture ,798 4,750 Village 757 1,408 2,407 3,934 7,479 Household Appliances Driving Village Electricity Demand At the village level, appliances for air circulation and space cooling account for most of the electricity used. This is followed by the use of appliances for lighting, household chores, and entertainment purposes (Figure 5.14). Overall, nine household appliances account for 95% of the electricity demand of rural households in the study area (Figure 5.15). Appliances for air circulation, such as ceiling fans, table fans, and desert coolers together account for 57% of household electricity use within a typical village. As seen in Figure 5.15, there is an opportunity to further increase the ownership of these appliances and this could also drive future electricity demand in rural areas. Lighting accounts for 24% of village demand. Presently, LED lights at 60% ownership levels, constitute less than 5% of household lighting electricity demand, with the rest coming from incandescent bulbs. 68
77 CHAPTER 5 Figure 5.14: Type of appliances that drive household electricity demand Household electricity demand (%) Air circulation Lighting Entertainment Household chores Figure 5.15: Ownership and use of key household appliances Ceiling fans Incandescent bulbs Table fans Desert coolers Water pumps LED lights Television sets Electric irons Refrigerators , Appliance ownership (%) Share in household electricity demand (%) Average hours of use Average wattage Submersible pumps for extracting drinking water is an important household appliance. They constitute 5% of total household consumption; in the absence of piped water supply in most rural areas, richer households are turning toward individually owned water pumps. Appliances such as refrigerators and electric irons are used by less than 7% of households, but still constitute 5% of household demand. The ownership of such medium to larger power appliances is limited within rural areas at present. Future increases in the ownership and use of such medium to high power appliances could act as an important driver of electricity demand. 69
78 CHARACTERIZING DEMAND FOR RURAL ELECTRICITY Enterprise Appliances Driving Village Electricity Demand The productive use of electricity is the major constituent of electricity demand for all rural enterprises considered together. This is followed by electricity use for air circulation and lighting purposes (Figure 5.16). Flour mills, followed by photocopying machines and printers, refrigerators, and welding machines, are key appliances driving the productive use of electricity. Electricity use for air circulation is driven by ceiling fans and table fans. Overall, nine appliances account for 90% of overall electricity demand by rural enterprises, across the four surveyed states (Figure 5.17). Figure 5.17 illustrates how certain appliances, despite their low ownership, constitute a major part of enterprise electricity demand in rural areas. For instance, flour mills are used by just 2% of enterprises, but account for 40% of electricity demand of all enterprises taken together. Similarly, welding machines account for 3% demand, despite being used by less than 0.5 % of enterprises. This highlights the immense potential to stimulate electricity demand by supporting productive use activities. Figure 5.16: Type of appliances that drive enterprise electricity demand Enterprise electricity demand (%) Air circulation Lighting Productive use Figure 5.17: Ownership and use of key appliances used in rural enterprises Flour mills Ceiling fans Table fans Printer/ Refrigerators LED bulbs Welding photocopiers machine Incandescent bulbs Laptops 7, , Appliance ownership (%) Share in household electricity demand (%) Average hours of use Average wattage 70
79 CHAPTER 5 Key Takeaways Understanding electricity consumption is crucial for the effective planning and delivery of electricity services. Using survey data, this study finds that both rural households and enterprises use electricity for varied purposes. Most households use electricity for lighting, mobile charging and air circulation, with some also using it for entertainment and household chores. Rural enterprises use electricity largely for lighting and cooling purposes, and only few use electricity to power appliances of productive use. Electricity consumption of rural households and enterprises is typically low, around 39 kwh per month. It varies significantly across households and enterprises. It also varies with states, and with the type of electricity sources and appliances in use. Electricity demand of rural households is positively correlated to:» The economic and educational status of households» Reliable and longer hours of electricity supply» Access to salaried jobs or business. Electricity demand of rural enterprises is positively correlated to:» Reliable and longer hours of electricity supply» Scales of operation» The nature of the enterprise» Education levels of the owner. Increased ownership of appliances including those for air circulation could fuel electricity demand. Increased ownership and use of productive appliances can build enterprise demand. Currently, a majority of the enterprises that have moderate to high consumption levels are flour mills or shops providing technology-enabled services, including cybercafes and mobile repair shops. A third of rural households use irrigation pumps, of which 75% use diesel-powered pumps; the remainder mostly use electric pumps. An average village in the surveyed sample has a total electricity demand of 1,826 kwh per day, with an estimated 52% contributed by households and 7% by enterprises. Villages with alternative delivery models like private distribution franchises for grid-electricity have a higher share of households in higher consumption tiers of the MTM as compared to those without. 71
80 6. Planning for Success 72
81 CHAPTER 6 This study was conducted to identify the barriers faced by rural customers in getting access to electricity, and to identify the drivers of customer satisfaction and rural electricity demand. The findings, based on the primary data from 10,049 rural households and 2,019 rural enterprises, highlight the need for coordinated efforts on multiple fronts to ensure higher adoption rates and the sustained use of electricity. The lessons learned from the experiences of customers of alternative electricity delivery models like mini-grids and distribution franchises also highlight the benefits of focusing on customer service. Recommendations from this study, presented in this section, could be instrumental in realigning policy priorities and efforts toward universal access to reliable, affordable, and sustainable electricity for all. Bridge Gaps in Rural Electricity Access by Addressing Adoption Barriers The ongoing Saubhagya scheme continues at pace; as of January 10, 2019, 99.5% of all willing households in the country have been connected to the central grid. When the survey was conducted in April, May, and June of 2018, 75% of households had grid connections. The increase in connections since the survey is an effort that rightly deserves praise. However, willingness is a curious concept. While 99.5% of all willing households in rural India may now be connected to the grid, there still remain 5.8 million households that are unconnected and currently classified as unwilling. 33 That is a significant number, and one that poses challenges especially in states like Uttar Pradesh, which has the highest share of un-electrified households. Future efforts on electrification need to concentrate on low-income households, particularly in Uttar Pradesh, where a significant share remains un-electrified. Even as households are increasingly connected to the grid, a significant number of rural enterprises remain unconnected. In the study area, only 65% of enterprises had grid-electricity connections; the share is more than 90% in Odisha, but lower than 60% in Uttar Pradesh and Bihar. There are low connection rates in the latter two states despite the availability of grid-infrastructure in close vicinity. It is reflective of a lack of policy focus on the electrification of rural enterprises, which are vital to rural economic growth. xxvii 33. The Saubhagya scheme was launched in September 2017, to electrify around 30 million households by December As per the Union Power ministry s Saubhagya dashboard, 24.2 million households have been electrified (as of January 10, 2019), leaving a balance of 5.8 million un-electrified households. At their core, rural enterprises are attractive customers with a steady demand for a good quality supply of electricity. Some of these enterprises currently pay for expensive non-grid sources, such as diesel generators and that is revenue lost for local utilities. This should encourage policy makers and DISCOMs to expand the focus of their electrification efforts beyond households to include rural enterprises engaged in non-farm activities. Bridging current gaps in electricity access would require measures to help rural households and enterprises adopt electricity. Most households without grid-electricity cite affordability as a key barrier. While some of these households 73
82 PLANNING FOR SUCCESS are economically deprived, concerns about affordability are also a manifestation of gaps in meter coverage and billing efficiency, due to which customers have to bear disproportionately higher electricity bills. A third of rural households rely only on non-grid sources, highlighting the importance of solutions that give customers the flexibility to manage their costs. In the case of rural enterprises, poor access to grid services, and the availability of affordable and reliable non-grid alternatives, are the major reasons behind low rates of adoption; 60% of enterprises without grid connections rely on non-gridelectricity sources. This is because enterprises using grid-electricity have to pay a high connection fee of INR 2800 on average, and a high recurring expenditure of INR 500/- month, as per the survey. Non-grid solutions, such as solar home systems and mini-grids, allow enterprises to meet their desired electricity needs with better reliability and service. Access to electricity is not merely a function of infrastructure provisioning, but also perceptions of electricity service and its affordability. Measures such as universal meter coverage, and timely billing and payment collection, can help alleviate negative concerns about the affordability of grid-electricity, by bringing in transparency in consumption and bill amounts. These are benefits that the Indian government is pursuing under the Ujwal DISCOM Assurance Yojana (UDAY) scheme. Under this initiative, the government is pursuing universal metering of all electricity connections by In tandem, the Saubhagya scheme includes new meters with every connection. Study data show that several gaps in metering remain, including installed meters that are not working. At scale, this can have important implications for plans related to the universal installation of pre-paid meters as envisaged under the draft amendments to the National Tariff Policy, Current gaps in metering and billing systems indicate that appropriate measures would be needed to install and maintain smart or pre-paid meters; they would be exposed to risks related to tampering, meter failure, or network connectivity issues. Despite the presence of electric grid-infrastructure in villages across the country, there are still non-grid sources in use across rural areas that bridge electricity access gaps. While some customers use non-grid sources as a supplement to their grid-electricity connection, many use non-grid sources as the primary electricity source, and as a preferred alternative to grid-electricity. Driving their choices is a sense of control over the supply of electricity and the ability to receive desired services at a reasonable cost. Solutions such as mini-grids continue to serve gaps in access through the provision of basic electricity access, especially for rural enterprises. Given the role of non-grid solutions in facilitating electricity access, there is a parallel need for continued policy support for these solutions. They could supplement as well as complement the efforts for grid-based rural electrification. 74
83 CHAPTER 6 Improve Customer Service to Drive Satisfaction with Service Delivery The provision of an electricity connection is the first step toward electricity access, but cannot remain the last one. It is important to ensure that customers obtain services that meet their expectations. This research finds only around 60% of grid-users are satisfied with their services, while the remaining 40% are dissatisfied, or indifferent. Such high levels of dissatisfaction should be cause for concern, as they are linked to negative perceptions of electricity service. An inter-state comparison confirms that states with better service parameters, such as Odisha, have a higher share of satisfied customers. Electricity service providers need to adopt a customer-first approach and consciously work towards improving customer satisfaction levels. The experience of electric grid-users in Odisha where most districts are under the distribution franchise model suggests that better service parameters can lead to more satisfied customers. The importance of customer focused service can be gauged from the experiences of mini-grid electricity users. Around 7% of households and 34% of enterprises in the 50 villages with mini-grids use mini-grid electricity. The study finds that a vast majority of mini-grid users are satisfied or very satisfied with their connections, despite citing affordability challenges and availing, on average, just 6 hours of electricity a day. Good service experiences influence their perceptions, especially in terms of the certainty and quality of power supply. In addition, supply during evening hours, easy access to timely services, and continual engagement between service provider and customers shape their positive experiences. In contrast, fewer users hold positive perceptions about grid-electricity. Insights from the experiences of mini-grid customers suggest that a high-quality, reliable, and customized electricity service can help improve customer satisfaction. A majority of grid-users who are not satisfied find the service unreliable, of poor quality, and unaffordable. This is understandable, as one out of every two grid-users in the study area faces a power cut of at least 8 hours on a daily basis. Besides the inconvenience, unreliable power supply forces customers to bear additional expenses on backup sources; those backups can be economically prohibitive for those with a limited capacity to pay. This puts the sustained use of grid-electricity at risk, especially among those who have been recently connected and have ready access to non-grid alternatives. Satisfaction levels among customers of rural electricity are driven far more by perceptions of reliability and adequacy; both qualities rank above perceptions of affordability. The study recommends that electricity service providers prioritize improvement in the reliability and quality of their supply. This will ensure that customers find value for their money, and continue to use electricity on a sustained basis. It may also encourage new customers, as the perceptions of non-users are positively linked with that of current users. 75

84 76
85 Efforts are already underway to address many of the gaps identified in this study. Under the 24x7 Power for All program, the Indian government is aggressively pursuing the target of providing a 24x7 reliable power supply by April 1, Other studies confirm gradual but significant improvements in the hours of supply and meter coverage. xxviii However, this study s findings show that much more ground needs to be covered, particularly in the states of Bihar and Uttar Pradesh. Build Rural Electricity Demand through Quality Supply and Appliance Penetration In order to provide satisfactory services, electricity suppliers need to understand electricity consumption patterns as well as the needs of diverse customer segments. As per this study, the average electricity demand of rural households is around 39 units per month, which is significantly lower than their urban counterparts. Electricity demand varies with the household economic status and primary income source, as well as the education level of household decision makers. A third of households are known to consume less than 30 units of electricity per month, using it mainly for lighting, mobile charging, and air circulation. Another half are known to consume more than 30 units per month; their share is highest in Odisha, followed by Rajasthan, Bihar, and Uttar Pradesh. Enterprises consume, on average, around 39.5 units per month. Electricity demand varies with commercial activity as well as scale of operation, which is determined by the type of productive appliances used. For instance, 5% of enterprises consume more than 100 units per month; most of these enterprises are flour mills that currently use non-electric motors, or shops providing technology-enabled services such as printing and cybercafes. However, a majority of rural enterprises engaged in retail trade and services use less than 30 units per month, highlighting the need for solutions that cater to these levels of demand in a viable manner. Current consumption levels in rural areas are typically low when assessed using the ESMAP s multitier matrix. Efforts are needed to boost rural electricity demand by expanding electricity services to both unserved and underserved customers, particularly rural enterprises. The latter can serve as high-paying customers for service providers, as they incur higher electricity expenses and display a higher willingness to pay as compared to household customers. Wide variations observed in electricity consumption across rural customers underscore the need to better understand electricity demand and its drivers. Policy makers and DISCOMs should facilitate access to disaggregated consumption data in public domain for evidence-based decision-making. Low consumption in rural areas is also on account of fewer appliances currently in use. Appliances for air circulation like fans and coolers account for approximately 60% of electricity demand of rural enterprises, even though the penetration of these appliances is far from saturation. Similarly, less than 20% of households have appliances for household chores such as refrigerators, irons, food processors, water pumps, etc.; these account for a sixth of household electricity demand. Future increases in electricity demands by rural households will be driven by the adoption of such appliances, which are ubiquitous in urban settings. 77
86 PLANNING FOR SUCCESS Most rural households are yet to adopt medium-to-high-wattage appliances, which would drive future increases in household electricity demand. This implies that demand levels are not yet set for households. Policy makers and other stakeholders can stimulate electricity demand in rural households by facilitating the adoption of medium-to-high-power appliances. In the case of rural enterprises, appliances for productive use account for more than 60% of enterprise electricity demand, even though only a third of enterprises currently use them. Flour mills constitute just 2% of the enterprises surveyed, but account for 40% of electricity demand of all enterprises taken together. Similarly, welding machines account for 3% of the demand, despite their being used by less than 0.5% of enterprises. Photocopying machines, printers, and refrigerators are other key appliances driving the productive use of electricity. At present, only a third of rural enterprises use appliances for productive use and even fewer use medium-to-high-wattage appliances. Policies need to drive adoption of appliances in rural services and productive applications. This can be instrumental in stimulating rural electricity demand, besides contributing to increased non-farm livelihood opportunities. Another key driver of electricity demand in rural areas is the reliability of power supply, measured as hours of electricity supply per day. This is because access to reliable and longer hours of electricity supply can facilitate the use of appliances for longer hours and incentivize customers to buy more appliances. On average, rural households and enterprises in villages that get longer hours of grid-electricity supply have higher levels of electricity consumption. In the absence of a reliable power supply, 86% of grid-connected households use at least one additional source of electricity or lighting, with kerosene as the most popular backup source. The use of non-grid alternatives is also high among rural enterprises. More than a third in Bihar and Uttar Pradesh use non-grid sources exclusively, which is reflective of the electricity demand unmet by grid-electricity. Provision of reliable and adequate electricity supply can significantly contribute toward higher electricity demand in rural areas, by way of incentivizing the adoption of more appliances and their use for longer durations. 78

87 CHAPTER 6 79
88 Concluding Remarks The study presents a customer s outlook of electricity access so as to improve understanding about the current gaps in this area, and identifies key barriers to electricity adoption and drivers of customer satisfaction. The study s findings highlight the need for coordinated efforts on multiple fronts to ensure higher adoption and sustained use of electricity. Learnings from the experience of customers served by alternative delivery models mini-grids and distribution franchise also highlight the benefits of a customer-first approach to delivery of electricity services. It is hoped that the report s findings and recommendations are useful for realigning policy priorities and strengthening efforts towards achieving the goal of universal access to reliable, affordable and sustainable electricity for all. 80
89 Annexures Annex 1: Research Design and Methodology This section discusses the sampling strategy employed for this study, along with details on the design of survey instruments and the data collection process. It also lists key limitations of the study. A.1.1 Sampling Strategy for Social Surveys The study employed a combination of purposive and stratified random sampling strategies for its household and enterprise surveys. The primary stratum comprised different types of villages that were classified on the basis of presence or absence of two particular delivery models solar mini-grids and distribution franchises. This approach allowed measurement and comparison of attitudes, perceptions, and satisfaction of electricity users and non-users who had access to different types of electricity services. Table A.1.1 contains a description of four categories of villages; table A.1.2 contains the list of districts covered under each category. Table A.1.1: Four categories of villages considered in this study Village Category Abbreviation Description Mini-grid villages MG-villages Villages with operational SPRD mini-grids. There are 91 villages spread across 19 districts in Uttar Pradesh and Bihar. Non mini-grid villages Non MG-villages Villages in the same district as SPRD villages, but without mini-grids. These are villages which could serve as prospective sites. Distribution franchise villages DF-villages Villages in districts being served by the distribution franchises. These are mainly located in 8 districts within Odisha. Non distribution franchise villages Non DF-villages Villages in 20 districts across four states, which could be prospective sites for distribution franchises. It should be noted that the study was restricted to villages which shared some structural similarities with existing mini-grid villages (MG villages). This was done because a minimum level of electricity demand is essential for commercially viable operations by electricity providers; MG villages provide a good point of reference, as these are chosen after due site assessment processes. Table A.1.3 highlights the criteria used to prepare the profile of a typical village, using data from both Census 2011 and SPI s mini grid site evaluations. a Sources: Asher, S., Nagpal, K., & Novosad, P. (2017). The cost of remoteness: Evidence from 600,000 Indian villages (working paper, April). Retrieved from conference.iza.org/ 81
90 ANNEXURE Table A.1.2: Districts used for sampling villages, by intervention category Village Category State Districts from which villages were sampled MG and non-mg villages DF villages Bihar Uttar Pradesh Odisha Araria, East Champaran, Gaya, Gopalganj, Saran, Siwan, Supaul, West Champaran Balrampur, Farrukhabad, Hardoi, Kushinagar, Lakhimpur Kheri, Pratapgarh, Rae Bareli, Shajahanpur, Shrawasti, Sitapur, Unnao Puri, Nayagarh, Khorda, Cuttack, Jagatsinghpur, Kendrapara, Dhenkanal, Anugul Bihar Munger, Rohtas Non-DF villages Odisha Rajasthan Uttar Pradesh Ganjam, Balangir, Deogarh, Kalahandi, Kandhamal, Sambalpur Kota, Ajmer, Baran, Bikaner, Dhaulpur, Jhalawar, Karauli, Sawai Madhopur Agra, Azamgarh, Jhansi, Mirzapur Andreas, K. (2006). Regional disparities in electrification of India do geographic factors matter? Centre for Energy Policy and Economics Working Paper No. 51. Zurich: Centre for Energy Policy and Economics. In order to sample 200 villages, researchers created a separate sampling frame for each village category (as discussed in Table A.1.1). The frame excluded all revenue villages failing to meet the first two criteria. From each sampling frame, researchers then randomly sampled 50 villages, in proportion to the number of villages per district, but blocking the sampling by district. Table A.1.4 shows the distribution of sampled villages across different states and intervention categories. Table A.1.3: Criteria used for selecting villages sharing structural similarities with existing mini grid villages Criteria Rationale Values for a typical SPRD village Population of census village Distance from nearest town Determines the number of customers and electricity demand at village level. Indicator of village remoteness, which has been found to be negatively correlated with household and village electrification as well as with rural living standards. 2,000-12,000 5 km - 36 km Presence of clustered shops/ enterprises Determines the electricity demand for productive purposes. Presence of at least 20 rural enterprises 82
91 Table A.1.4: Distribution of sample villages across states State MG villages Non-MG villages DF villages Non-DF villages Bihar Uttar Pradesh Odisha Rajasthan Total In the absence of secondary data on the number of enterprises in villages, field verification was the only way to ascertain whether sampled villages met the third criteria. As a result, a waiting list was created to allow replacement of villages that did not have at least one market area that contained a minimum of 20 enterprises/ shops. Overall, one in two villages had to be replaced due to an inadequate number of enterprises/shops. This is also a reflection of how commercial markets in rural areas are currently limited to certain villages. From each of the 200 sampled revenue villages, surveys were conducted with 50 households, 10 enterprises, and a village leader (Sarpanch or his/her representative). All households and enterprises were sampled randomly within the geographic boundaries of the revenue village, using the strategy shown below. A. Strategy adopted for sampling households: The survey team entered the revenue village and consulted Panchayat officials or village elders to obtain information about up to the six biggest hamlets in the village and the number of households in each of them. The sample of 50 survey households was allocated to these hamlets in proportion to the total number of households in each. Within each hamlet, the survey team selected a random spot (say a temple, water tank, etc.). From that location, the team selected a random direction and sampled every 10th household in that direction. If a household refused to participate, the next neighboring household was surveyed. B. Strategy adopted for sampling enterprises (shops): There are a variety of commercial entities in villages, such as retail shops (grocery, fruits/juice stand, etc.), service shops (photocopying, cybercafe, mobile repair, etc.), and commercial processing entities (flour mills, etc.). Researchers devised an innovative strategy for sampling enterprises within villages that ensured a representative sampling, while capturing different types of shops. The survey team first conducted a mapping exercise to count different types of shops available in the village, and categorized the shops into three broad 83
92 ANNEXURE groups. In villages with more than 300 shops, rather than list every shop, every 10th shop was counted as part of the mapping exercise. Using this information, a sample of 10 survey shops was allocated to each of the three groups in proportion to the total shops encountered within each group. The survey team then selected a random spot in the market and chose a random direction, in which every 10th shop was identified and assessed for sampling. The shop was surveyed only if the category to which it belonged did not have enough shops of the same kind already surveyed. If a shop owner refused to participate in the survey, then the neighboring shop was assessed for sampling. A.1.2 Sampling Strategy for Qualitative Interviews For the purpose of qualitative interviews, 5 intervention and 5 non-intervention villages were selected from the 200 sampled villages. In each such village, qualitative interviews were conducted with 5 households and 5 enterprises. Care was taken to ensure that entities surveyed in quantitative surveys were not interviewed again, so as to obtain a fresh perspective and additional information each time. Efforts were made to ensure that those being interviewed comprised grid-electricity users and non-users, as well as those using other alternatives. A.1.3 Design of Survey Instruments Detailed questionnaires (survey instruments) for each of the planned social surveys and interviews were developed, all of which were administered by handheld tablet device. Initial drafts of questionnaires were based on the review of existing survey instruments and insights from a weeklong field visit in Hardoi (Uttar Pradesh). Field vists involved qualitative interviews with households, enterprises, and village heads, to understand the range of challenges faced by rural communities and the diversity of electricity sources and appliances in use. The questionnaires underwent several rounds of revisions, particularly after two pilot surveys were conducted in Saran (Bihar) and Bhubaneshwar (Odisha), which yielded detailed inputs on the ease of administration, the nature of responses, and the proficiency of enumerators in data coding. In order to reduce errors during data entry, and enable closer monitoring and periodic data quality checks, the surveys were conducted using handheld tablets. Accordingly, the digital versions of questionnaires were thoroughly tested and revised, based on inputs from pilot surveys and classroom training exercises. The final household and enterprise questionnaires (designed to be completed within 45 minutes) comprised questions in the following broad categories: 1. Social, economic, and demographic profile 2. Current sources of electricity and lighting 3. Expenditures and satisfaction with electricity and lighting sources 4. Ownership, hours of use, and power ratings of electric appliances 5. Awareness and attitude toward alternative electricity sources, particularly mini-grids 6. Willingness to pay for different levels of electricity services A.1.4 Data Collection and Cleaning All surveys were conducted in the local language of the states (Hindi in Bihar, 84
93 Rajasthan, and Uttar Pradesh, and Odiya in Odisha). Two survey teams, comprising 35 enumerators for Hindi-speaking states and 20 enumerators for Odisha, were given in-person training by the research team. The training sessions, spread over four days each, involved classroom training on the basics of electricity sources and appliances, a detailed discussion of all survey questions, role plays by enumerators, and dry runs in nearby pilot villages. During the survey, periodic data quality checks were conducted on batches of survey data. This allowed for early identification and resolution of missing data points and faulty data entries, through data recollection and enumerator training, where needed. A.1.5 Study Limitations This study has been designed to fulfill multiple research objectives and the utmost care has been taken to ensure robust inference and analysis. However, there are a few limitations of the study design, which have a bearing on the findings. 1. The findings are specific to the four states in India where the survey was conducted. Even though the findings offer rich insights, which can be extended to other states, they are most specific to Uttar Pradesh, Bihar, Odisha and Rajasthan. 2. The study sample is not representative at the state level due to the choice of purposive sampling of villages. 3. The study estimates electricity consumption of rural households and enterprises based on the stated responses collected through in-person surveys. This was necessary, as electricity meter coverage is quite low in several parts of Uttar Pradesh and Bihar, where the study was focused. Therefore, the surveys rely on the ability of the respondents to recollect information about the appliances they used, their power ratings, and their daily hours of use. This raises some concerns about the accuracy of estimates. An attempt has been made to overcome some of these issues by conducting a follow-up observational survey with 300 households and around 100 enterprises across 10 villages. A comparison of consumption estimates from main survey data with the follow up observational survey yielded small error statistics. 4. There were several instances of missing data, particularly for questions focused on power rating of non-lighting appliances. In order to fill such gaps, assumptions had to be made to arrive at electricity consumption estimates, which would have contributed to some errors. To minimize this, the researchers collected information on appliance power rating from multiple sources, including surveys of electrical appliances used by shop owners in every village and secondary market research. 5. Rigorous training of enumerators was conducted to ensure that they understood the purpose behind each of the survey questions and were able to properly administer the questionnaire. A continuous follow up through quality checks on early batches of data was also undertaken and retraining conducted by the team leaders whenever it was found to be necessary. However, it is possible that some questions were improperly administered and some amount of enumerator bias and reporting errors cannot be overruled. 85
94 ANNEXURE Annex 2: Personifying the Rural Electricity Customer A.2.1: The Methodology Behind Personification of Rural Households There are two approaches to measuring household living standards. The first, and the more popular, approach is to use direct measures such as income or expenditure. The second approach is to use a proxy measure, in which a wealth index is constructed using the information on housing characteristics and ownership of durable assets. The SEC system (socioeconomic classification) adopted by the Market Research Society of India is one such classification. However, it uses electricity connection as one of the assessment parameters for classification and is hence not used for the purposes of this study. For this study, researchers used the proxy approach to measure and categorize rural households by their living standards. This method is particularly useful in assessing the long-term economic status of households. It is preferred over the direct approach, because households often under-report, or do not report, their incomes, because it is difficult to adequately capture expenditure data. Twelve percent of the respondents in this survey, for example, declined to share income-related information. To measure household living standards, researchers constructed an asset score, using survey information on housing characteristics, ownership of durable assets, and access to public amenities. Each of these assets was given a score as shown in Table A.2.1. To facilitate segregation, most items have a score of 1, while a few high-value items have a higher score of 2 or 4. The total score for each household was computed on the basis of items owned by the household and the weights assigned to each asset. The range of this asset score is [0 24]; households without any of the specified assets have a score of 0 and households having all specified assets have a score of 24. Using the asset score, researchers classified households into the following four categories: Asset score 0 6: Rural Poor Asset score 7 12: Rural Lower Asset score 13 18: Rural Middle Asset score 19 24: Rural Affluent Table A.2.2 lists assets owned by households under different categories. Researchers validated this classification by assessing the direct measures of living standards, such as income and expenditures. Table 2.1 in Chapter 2 shows that the average income and expenditures of a household steadily rise with the asset category. Assessments of primary sources of income also indicate that a majority of poor households rely on labor activities, with very few having salaried jobs or businesses of their own. When viewing households across categories, from rural poor to rural affluent, a key observation is lesser reliance of households on agriculture and greater reliance of salaried jobs and businesses. 86
95 Table A.2.1: Assets and scores used for measuring household living standard Criteria Score Housing characteristics House type Kutcha 1 Semi - pucca 2 Pucca 4 Number of rooms > 4 4 Availability of toilet 2 Durable assets Ownership of land 2 Vehicles Bicycle 1 Motorised two-wheeler 2 Motorised four-wheeler 4 Appliances Television 1 Fan 1 Public amenities Bank account 1 LPG connection 1 Grid connection 1 Researchers note that it is important to interpret these categories, or labels, in the context of the study, and its target of rural markets in low-income states. For example, the rural middle category and to a lesser extent the rural lower category represent households that meet their basic needs. As compared to urban areas, the consumption basket available in the rural areas is quite restricted. There is no direct equivalence between the rural and urban consumption categories. A.2.2: The Methodology Behind Classifying Rural Enterprises Commercial enterprises are heterogeneous in terms of the commercial activity being pursued, and their scale of operation. Given the diversity of economic activity pursued by enterprises, researchers employed a scoring methodology to capture the scale of operation of rural enterprises. 87
96 ANNEXURE Table A.2.2: Assets and amenities owned by households Asset ownership Rural Poor Rural Lower Rural Middle Rural Affluent Kutcha house 68% 25% 3% 0% Semi-pucca house 28% 39% 19% 4% Pucca house 4% 37% 78% 96% Number of rooms [1] 64% 25% 5% 0% Number of rooms [2-3] 36% 68% 57% 11% Number of rooms [>= 4] 0% 7% 38% 89% Availability of toilet 4% 29% 68% 92% Ownership of land 18% 52% 68% 97% Bicycle 53% 76% 83% 84% Motorised two-wheeler 1% 10% 58% 98% Motorised four-wheeler 0% 0% 3% 45% Television 1% 19% 56% 72% Fans 11% 52% 88% 97% Grid connection 27% 67% 92% 98% LPG connection 14% 38% 71% 87% Bank account 89% 97% 99% 99% Low High In order to classify enterprises by their scale of operation, researchers followed the proxy approach, similar to that employed for households. A scale index was constructed using the survey information on building characteristics such as shop area, type of structure, and ownership, as well as information about number of employees working at the shop and the estimated value of the shop inventory, Each of these variables was given a score as shown in Table A.2.3. Most variables have a score of 1, while high-value characteristics are given a higher score of 2 or 4, so as to facilitate segregation. The total score for each enterprise was computed using these scores and enterprise characteristics. The range of this scale index is [4 16]. Using a scale index, researchers classified rural enterprises into three categories as shown below. 1. Asset score 4 6: Rural Small enterprises 2. Asset score 7 10: Rural Mid enterprises 3. Asset score 11 16: Rural Large enterprises See Table A.2.4 for details on enterprise characteristics for each category. 88
97 Table A.2.3: Criteria and scores used to measure enterprises scale of operation Criteria Score Enterprise Characteristics Shop Structure Kutcha or semi-pucca 1 Pucca 2 Shop ownership 2 Shop Area < 100 sq.ft sq.ft. 2 > 250 sq.ft. 4 Number of employees other than owner None 1 One 2 More than one 4 Shop Inventory Value < INR 30,000 1 INR 30, ,000 2 > INR 150,000 4 Table A.2.4: Assets and amenities owned by enterprises Enterprise characterisitic Enterprises categorized by their scale of operation Rural Small Rural Mid Rural Large Kutcha or semi-pucca structure 53% 27% 16% Pucca structure 47% 73% 84% Shop area: < 100 sq.ft. 90% 56% 14% Shop area: sq.ft. 10% 40% 47% Shop area: > 250 sq.ft. 0% 4% 39% Ownership of shop 34% 66% 82% Number of employees: None 91% 63% 22% Number of employees: One 9% 31% 35% Number of employees: More than one 0% 6% 42% Inventory: < INR 30,000 71% 21% 3% Inventory: INR 30, ,000 29% 58% 27% Inventory: > INR 150,000 0% 21% 70% 89 Low High
98 ANNEXURE Annex 3: Sources of Electricity Figure A.3.1: Electricity Sources Used by Households, Across Village Categories Households (%) MG village Non-MG village DF village Non-DF village Grid electricity Mini-grid electricity Solar Home System Rechargeable battery Diesel generator None Note: In DF and non-df villages, where a higher share of households used grid-electricity, use of nongrid sources was limited. Figure A.3.2: Electricity Sources Used By Enterprises, Across Village Categories Enterprises (%) MG village Non-MG village DF village Non-DF village Grid electricity Mini-grid electricity Solar Home System Rechargeable battery Diesel generator None Notes: Mini-grid electricity was the second-most popular electricity source in MG villages. In DF and non-df villages, where a higher share of enterprises used grid-electricity, use of non-grid sources was limited. 90
99 Annex 4: Drivers of Customer Satisfaction Table A.4.1: Prescribed power tariffs for domestic connection, fiscal year 2018, by state State Consumption category Fixed charges (INR/month) Energy charges (INR/unit) Uttar Pradesh Unmetered Up to 100 units/month /kW units/month 3.50 Kutir Jyoti (unmetered) 350 Bihar Kutir Jyoti (up to 50 units/ month) Up to 50 units/month a 3.05 a units/month 20/kW 3.30 a 100 units and above 3.60 a Kutir Jyoti (up to 30 units) 80 0 Odisha Up to 50 units/month /kW units/month 4.30 BPL (Up to 50 units/month) Rajasthan Up to 50 units/month units/month a: These include state government prescribed subsidies. Source: Tariff order of respective states for the fiscal year
100 ANNEXURE Figure A.4.2: Electricity consumption patterns of rural households across states, by socioeconomic status Household expense on grid ele tri it R month Uttar Pradesh Bihar Odisha Rajasthan So io e onomi Status Rural Poor Rural Lower Rural Middle Rural Affluent Note: Electricity consumption progressively rose with households socioeconomic status across state Table A.4.3: Prescribed power tariffs for non-domestic connection, , by state State Consumption category Fixed charges (INR/ month) Energy charges (INR/unit) Uttar Pradesh Unmetered 1,000 - Metered 95/kW units 6.40 Bihar units 30/kW units and above units 5.40 Odisha units 30/kW units and above units 7.55 Rajasthan units 230 (up to 5 kw load) units and above 8.35 Source: Tariff order of respective states for the fiscal year
101 Figure A.4.4: Willingness to pay for uninterrupted electricity supply, by satisfaction level 900 Willingness to pay for reliable electricity (INR/ month) Not satisfied Satisfied Enterprise satisfa tion ith grid ele tri it Note: Satisfied users had higher willingness to pay for better-quality supply. A.4.5: Perception Index The perception of survey respondents is illustrated with the help of a Perception Index, constructed to obtain an overall attitude of a given respondent toward grid-electricity. The Perception Index is constructed using perceptions of enterprise users toward various attributes of grid-electricity service. These include the ease of getting a grid-electricity connection, the ease of redressal or getting repairs done, affordability, reliability, adequacy, and quality of power supply. Customer perception is measured on a three point scale, by asking whether they agree or disagree with the (positively framed) statements about each of the service attribute. For example: Do you agree or disagree with the following statements about grid-electricity? a. Grid-electricity is reliable. 1. Disagree, 2. Neutral, 3. Agree. Three-point was used in place of five-point scale, as the latter was leading to high attrition among the respondents during the pilot surveys. The Index was created in three stages: 1. Normalizing responses to each of the six perception questions 2. Adding all the normalized variables 3. Normalizing the final variable again Thus, the perception of a respondent toward attributes of grid-electricity is represented on a scale of 0 to 1 on the Perception Index. They represent negative and positive perceptions about all service attributes. A Perception Index rating of 0.5 indicates an overall neutral outlook toward grid-electricity. 93
102 ANNEXURE Annex 5: Characterizing Demand for Rural Electricity A.5.1: Estimating Electricity Consumption of Households and Enterprises The study employed energy use surveys to estimate electricity consumption of households and enterprises. These involve dwelling- or shop-level surveys to collect data on existing appliance ownership and hours of electricity use, and has been found to yield reliable demand estimates with errors lower than the surveys that collect aspirational electricity demand. xxix The study used the following formula for estimating monthly electricity demand (kwh/day) for each household. Electricity demand of rural enterprises was estimated using the same formula. E j = Sum of [W i * H i ] * 30/1000 for all i, where: E j is the monthly electricity demand of j th household in kwh i is the type of electric appliance W i is the power rating of i th appliance in use H i is the number of hours for which all of the i th appliance are used per day Assumptions used for appliance power rating In the survey, data on the power rating of each appliance used by the households/ enterprises was recorded. In many cases respondents reported wattages which didn t match the expected wattages from secondary research. The study winsorized such data points using upper and lower bound, which were identified with the help of secondary research and interviews with owners of shops selling electric appliances. Further, a significant share of respondents didn t know appliance wattages, particularly with appliances for non-lighting uses. In all such cases, the study assigned the mean values of wattages from the survey data (while excluding the erroneous data entries). Table A.5.1 and Table A.5.2 present the assumptions used for cleaning the appliance wattage data for households and enterprises, respectively. For some appliances, like TVs and refrigerators, where very few respondents were in a position to report the appliance wattages, the study collected information on the appliance capacity (inches for TVs and liters for refrigerators). With the help of this information and secondary analysis, typical wattage values were assigned to all respondents who were using these appliances. The assumptions used for certain household appliances are listed below: Television: The power consumption of TVs varies with size. Using the survey data on TV sizes (in sq. inches) and an aspect ratio of 16:9, we estimated power rating of televisions using the following formulae.» Area of TV = ((size in inches ^2) *(16/9)) / (1 +16^2/9^2)» Watt of TV = 0.18 *Area of TV The study uses the maximum annual power consumption of 1-star rated LCD TVs (BEE standards) for estimating the effective wattage of TVs. LCDs were chosen over the CRT and plasma market segments as over the past few years, the LCD TV segment has significantly captured the Indian market. xxx Further, choice of 1-star-rated TV is driven by the fact that rural customers are price sensitive and such a choice covers for the older and low-efficiency stock of TVs. Thus, a 21-inch 1-star rated LCD TV has an area of 121 sq. inches and consumes 35 watts. 94
103 Refrigerators: In the sample, less than 10% of households used refrigerators, with Samsung, Godrej, and LG being the most popular brands. As households found it difficult to share information on refrigerator size, the study didn t collect this data from them. To estimate the power consumption of refrigerators, the study used a standard rate of 362 kwh/year, which is the average consumption of a 1-star rated 260 liter direct cool refrigerator. xxxi This is a conservative figure assuming that rural customers, who are price sticky, would prefer cheaper but low-star rated products. The assumption roughly translates into a watt rating of W. Using a standard number is reasonably accurate, as the power consumption does not significantly vary with refrigerator size (339 units/year for 190 liter and 379 units/year for 310 liter). For households using refrigerators, this would imply inaccuracy of less than 3 units/month. However, the variation is significant with appliance rating, with 5-star rated appliances being 2.5 times more efficient. However, the study survey didn t collect information about this. Air conditioners: The study collected data on the size of air conditioners in tons, common in local parlance. To estimate power consumption, the study used the assumption that 1 ton is equivalent to 1,000 watts, 1.5 tons is equivalent to 2,000 watts, and a compressor activity rate of 75%. xxxii Flour mills and water pumps: The power rating of these appliances was collected in horsepower (HP) units, common in local parlance. The following conversion factor was used: 1 HP = 746 watts. Assumptions used for cleaning data on appliance hours of use The study collected total hours for which all appliances of a type are used per day (e.g., if 6 LEDs are used for 5 hours every day, the study recorded 30). In order to identify and correct for any potential measurement or reporting errors, the study conducted data quality checks on hours for which each appliance is being used (total hours/number of appliances of a type). The study capped this variable at certain predetermined limits for household data, as shown in Table A.5.3. For enterprises, the total hours for which the shop operates per day, was used as a cap. This helped in correcting a few erroneous data entries. The socioeconomic profile of households and enterprises varies across villages categorized by the presence and absence of two interventions: mini-grids and private distribution franchise for grid electricity. The study found that household and enterprise distribution is similar in mini-grid and non-mini-grid villages. It is also similar in villages with and without distribution franchises for electric grid electricity. This is in line with the research design that for every village with an intervention, a comparable village without the intervention in the same/similar districts is sampled (see A.1.1). The study also found that the distribution franchise and non-distribution franchise villages have a higher share of households belonging to middle- and high-income groups, as compared to the mini-grid type of villages. This also holds true for rural enterprises categorized by their scale of operation. 95
104 ANNEXURE Table A.5.1: Assumptions for cleaning the appliance wattage data for households Appliance name Lower bound Upper bound Mean values (used for filling missing values) (All values are in watts, unless specified) Incandescent bulb ompa t fluores ent lamp (CFL) LED bulb Tube light Mobile phone 5 Ceiling Fan Table Fan Television 14 inch 55 inch 21 inch Cooler Electric stove 500 3,000 1,192 Laptop 50 Refrigerator Iron for clothes 450 2, Grinder/mixer 100 1, Music system/ radio 15 Air conditioner 1 ton 1.5 ton 1 ton Washing machine 400 Fodder cutting machine 1 HP 5 HP 2 HP Water pump 0.5 HP 10 HP 2 HP This indicates that distribution franchises are present in more prosperous villages as compared to villages having mini-grid installations. This is potentially due to the site selection strategy of the operators of these interventions. While minigrid companies target populations, which are generally underserved by gridinfrastructure, private entities bid for distribution franchises in areas which have decent penetration of grid-infrastructure and scope for improvements in operational efficiency. 96
105 Table A.5.2: Assumptions for cleaning the appliance wattage data for enterprises Appliance name Lower bound Upper bound Mean values (used for filling missing values) (All values are in watts, unless specified) Incandescent bulb CFL LED bulb Tube light Mobile phone 5 Ceiling fan Table fan 72 Television 14 inch 55 inch 23 inch Desert cooler Refrigerator 50 litre 600 litre 222 litre Sewing machine Laptop 50 Printer/photocopy machine 350 Weighing machine 6 Flour or oil mill 1 HP 25 HP 10 HP 97
106 ANNEXURE Table A.5.3: Assumptions used for cleaning the data on appliance hours of use Appliance type Cap on hours of use per unit of appliance per day Incandescent bulb 24 CFL 24 LED bulb 24 Tube light 24 Ceiling fan 24 Table fan 24 Television 18 Desert cooler 24 Electric stove 6 Computer or laptop 24 Refrigerator 24 Electric iron 6 Grinder/mixer 2 Music system or radio 6 Air condiitoner 24 Washing machine 6 Fodder cutting machine 6 Water pumps 6 Others 24 Note: The cap of six hours on certain high-load appliances was based on the field research that had been conducted for the design of survey questionnaires. A.5.2 Socioeconomic profile of rural customers, across different villages The socioeconomic profile of households and enterprises varies across villages categorized by the presence and absence of two interventions: mini-grids and private distribution franchise for grid electricity. The study found that household and enterprise distribution is similar in mini-grid and non-mini-grid villages. It is also similar in villages with and without distribution franchises for electric grid electricity. This is in line with the research design that for every village with an intervention, a comparable village without the intervention in the same/similar districts is sampled (see A.1.1). 98
107 Figure A.5.1: Socioeconomic profile of rural households, by village category Non-DF village Households % DF village Non-MG village MG village Rural Poor Rural Lower Rural Middle Rural Affluent Figure A.5.2: Economic profile of rural enterprises, by village category Non-DF village DF village Non-MG village MG village Enterprises % Rural Small Rural Mid Rural Large A.5.3: Predictors of Household Electricity Demand In order to identify the predictors of household electricity demand, the study estimated a linear Ordinary Least Squared (OLS) regression model. The monthly household electricity consumption estimates are used as the dependent variable. The economic category of households (as discussed in Chapter 2), the education level of the household head, and the primary source of income of households, are used as the independent variables. For each of these, the study used appropriate dummy variables (variables ending with a question mark). The study also used average hours of grid supply at the village level as another independent variable, as it can influence the uptake of grid-electricity, the hours for which households can use electricity, and the nature of appliances that households decide to purchase. The model results are shown below: 99
108 ANNEXURE Table A.5.4: Results of linear regression analysis for household electricity demand Independent variables: Socioeconomic classification: Rural lower Socioeconomic classification: Rural mid Socioeconomic classification: Rural affluent Education: Up to class 9 Education: Class 10 and above Income: Labor activities Income: Salaried job or business Daily hours of grid supply in village Dependent variable: Household Electricity Demand (kwh/month) *** (1.149) *** (1.732) *** (3.730) (0.940) *** (1.364) (1.288) *** (1.665) *** (0.383) Observations 10,049 Adjusted R Note: Standard errors clustered at village level. State fixed effects included. * p <0.1, ** p <0.05, *** p < 0.01 Note on methodology: The objective of this regression exercise is mainly to identify the key drivers and barriers of electricity demand. To that extent, the direction and significance of estimates are more important than the magnitude of the coefficients. In order to facilitate simpler interpretation of the results, the two continuous variables in the model have been used in their original units, rather than in their logarithmic form. 100
109 A.5.4: Monthly Electricity Consumption of Enterprises (Excluding Flour Mills), by Type Figure A.5.3: Monthly electricity consumption of enterprises (Excluding Flour Mills), by type (kwh/month) Grocery shop Fruit/juice shop Sweets/snacks shop Ready-made goods Hardware shop Agri-inputs shop Medical store Mobile repair shop Cyber café Photo studio Tailoring shop Beauty parlour Carpentry shop Cycle repair shop Car service centre Medical clinic Warehouses Cold storages Dairy shop Others Average monthly demand (kwh/mon) Share of enterprises not using electricity (%) Note: Flour mills have the highest consumption among all enterprises (not shown in the graph). This is followed by enterprises engaged in technology-enabled services such as mobile repair shops, cybercafes, and photo studios. 101 A.5.5: Predictors of Enterprise Electricity Demand In order to identify the predictors of enterprise electricity demand, the study estimated a linear OLS regression model. The monthly electricity consumption estimates of enterprises are used as the dependent variable. The economic activity of enterprise, the scale of operation of enterprises (as discussed in Chapter 2), and the education level of the enterprise owner are used as the independent variables. For each of these, the study used appropriate dummy variables (variables ending with a question mark). The study also used average hours of grid supply at the village level as another independent variable, as it can influence the uptake of grid-electricity, the hours for which enterprises can use electricity, and the nature of appliances that enterprise decide to purchase. The model results are shown below: Note on methodology: As the electricity consumption of flour mills is multiple times that that of other enterprises, these constitute almost all of the outliers for all enterprises combined. In order to avoid any potential biases due to such extraordinarily high consumption values, all observations for enterprises operating flour mills were dropped for the purpose of this analysis. The main objective of this regression exercise is to identify the key drivers and barriers of electricity demand. To that extent, the direction and significance of estimates are more important than the magnitude of the coefficients. In order to
110 ANNEXURE facilitate simpler interpretation of the results, the two continuous variables in the model have been used in their original units, rather than in their logarithmic form. Table A.5.5: Results of linear regression analysis for enterprise electricity demand Independent variables: Scale: Rural Mid Scale: Rural Large Education: Up to class 9 Education: Class 10 or 12th Education: Diploma or Graduate Activity: ICT related services Activity: Other services Daily hours of grid supply in village Dependent variable: Enterprise Electricity Demand (kwh/month) 8.726*** (1.473) *** (2.956) 3.733* (2.028) 3.960** (1.638) 8.191*** (2.008) *** (3.791) (2.027) 1.567*** (0.321) Observations 1,975 Adjusted R Note: Standard errors clustered at village level. State fixed effects included. * p<0.1, ** p <0.05, ***c p <
111 A.5.6: Statistics on Irrigation and Source of Energy for each State Table A.5.6: Statistics on irrigation and source of energy, by state State Share of cropped area irrigated by groundwater Irrigated area as a share of total cropped area Share of electric pumps Share of diesel pumps Bihar 34% 55% 29% 67% Odisha 3% 25% 39% 53% Rajasthan 19% 24% 72% 28% Uttar Pradesh 60% 82% 17% 79% a Source: Agriculture Census of India, b Source: 5 th Census of Minor Irrigation Schemes, A.5.7: Estimating Agricultural Electricity Consumption This study did not involve a dedicated survey to capture electricity consumption for agricultural use. However, the study included few specific questions in the household survey to capture the use of motorized water pumps for irrigation purposes. The study collected data on the ownership and use of electric and diesel-powered irrigation pumps, which are most commonly used in India. Using these data, the study estimated the electricity consumption of each household for agricultural purposes using the formula given below: D agri = P d * D d * H d + P e * D e * H e, where 34. On average, households use electric pumps for 230 hours per year, which is equivalent to the operational use of 6 hours per day for 38 days in a year. In contrast, average annual pumping hours for diesel pump users are significantly lower at 150 hours, which is equivalent to using the pump for 6 hours per day for 25 days in a year. Further, less than 3% of users operate diesel pumps for more than 600 hours per year, as compared to 10% of electric pump users. The lower pumping hours of diesel pump users can be mainly attributed to their high operation costs as compared to the subsidized power tariffs for irrigation, and conforms to the earlier claims regarding the practice of deficit irrigation by farmers forced to rely on diesel pumps. Almost 40% of the households using irrigation pumps, report annual pumping hours of less than 50 hours per year. Such a low usage appears to be the case of households renting the irrigation pumps or buying water from the pump owners, which is a prevalent practice in Uttar Pradesh and Bihar, where all such households lie. P d is the power rating of the diesel pump in use D d is the number of days in a year for which the diesel pump was used for irrigation H d is the hours for which diesel pump was used each day of pumping P e is the power rating of the electric pump in use D e is the number of days in a year for which the electric pump was used for irrigation H e is the hours for which electric pump was used each day of pumping Note on data quality: The study conducted extensive data quality checks before data analysis. Several instances of missing data were observed for the variables capturing the power rating of irrigation pump sets. In such cases, the study assigned the district-level means of pump capacity for electric and diesel pump sets, respectively. This is because pump capacities significantly vary with the water level, which in turn vary across districts. However, the study noticed certain discrepancies between the data on pump usage and information on irrigation expenditure shared by the households. There appears to be under-reporting of data on the hours and days for which a household uses an irrigation pump, 34 as compared to the irrigation expenditure reported by the household. This is the case for almost half of the households using electric irrigation pumps, and around 15% households using diesel irrigation pumps. 35 This discrepancy can be attributed to either willful under-reporting by the respondents, or the errors in administering the survey by the enumerators. Capturing agricultural electricity demand requires a full battery of questions where irrigation demand for each season is asked separately along with crop type, in order to accurately capture information on 103
112 ANNEXURE irrigation practices. But, this could not be accommodated due to the paucity of time, and the focus of the survey on capturing household and enterprise demand. Overall, the estimates on agricultural electricity demand should be seen as conservative estimates. A.5.8: Estimating Village Level Electricity Demand The electricity demand of each revenue village is computed by adding the estimates for electricity consumption by households, enterprises, and agricultural loads. Household consumption is estimated by multiplying total households in a revenue village with the average household consumption (excluding outliers greater than three standard deviations). Enterprise consumption is estimated by multiplying the total number of shops (excluding flour mills) in a revenue village with the average enterprise consumption (excluding flour mills). Electricity consumption of flour mills is separately added to estimate the total enterprise consumption, as their consumption levels act as outliers for the small sample of 10 enterprises in a village. Agricultural electricity consumption is estimated by multiplying total households in a revenue village with the average electricity consumption by households for using electric or diesel (equivalent consumption) irrigation pumps. We assume that the total share of agricultural households in a revenue village is similar to the share observed in our survey based on random sampling of the households. In short, the study used the following formula to estimate the electricity demand for every i th revenue village: E vi = N hi * E hi + N ei * E ei + N fi * E fi + N hi * E ai for all i, where, N hi is the number of households in the village i, as per Census 2011 E hi is the average electricity demand of households in village i, as per survey estimates N ei is the number of rural enterprises (excluding flour mills) in the village i, as per the survey 36 E ei is the average electricity demand of enterprises (excluding flour mills) in village i, as per survey estimates N fi is the number of flour mills in the village i, as per survey E fi is the average electricity demand of all flour mills, as per survey estimates N hi is the number of households in the village i, as per Census 2011 E ai is the average electricity demand for agricultural loads in village i, as per survey estimates 35. These are rough estimates based on the expectation that per unit cost of electricity when using electric and diesel pump set should not exceed INR 10/unit and INR 30/unit. 36. For the purpose of sampling enterprises to be surveyed, we conducted a preliminary exercise to map the number of different types of enterprises in each revenue village surveyed. This gave us the data on total enterprises present in each village. In order to estimate electricity demand for a typical, or average village surveyed in this study, the study calculated the average of the village electricity demand. On average, survey villages have 860 households, 100 shops (including 2 flour mills), and 35% of households that use diesel- or electricity-powered water pumps for irrigation purposes. 104
113 A.5.9: Share in Village-level Electricity Consumption, by States Figure A.5.4: Share in Village-level Electricity Consumption, by States Share in Village Demand (%) Overall Uttar Pradesh Bihar Odisha Rajasthan Households Enterprise Agriculture Notes: Households were the main drivers of village electricity demand, especially in Bihar and Odisha. In Rajasthan and Uttar Pradesh, agricultural consumption accounted for 60% of village demand. 105
114 GLOSSARY Glossary Diesel Generator (DG) Connections: Connections from diesel generator operators, who supply diesel-based electricity to a group of customers for pre-defined hours and load capacity. Distribution Company (DISCOM): A company, mostly public sector, awarded the license to distribute electricity in a designated service area. Distribution Franchise: Granting of rights to a private agent to manage electricity distribution business in a designated area on behalf of the distribution licensee (Distribution Company or DISCOM). Distributed Renewable Energy (DRE): Refers to energy produced from small-scale local or on-site power plants that produce energy from renewable sources such as solar, wind, hydroelectric, or biomass. DRE is a decentralized alternative to the government electrical grid, although some types of DRE plants can be set up to buy or sell power to the government grid. Energy Services Company: An Energy Services Company is a business which provides electricity as a service to its customers. Electricity Customers: Current users and potential future users of electricity. Electricity Demand/Consumption: The actual amount of electricity consumed by an electricity customer measured in kwh. Electricity Access: The ability to experience and use good quality electricity during all times. Electricity Adoption: Where there is a willingness to be connected to the available electricity. Electricity Availability: When electricity infrastructure, i.e., electric distribution pole is within a 50-meter distance entailing no additional costs to be borne by the customer. Hook-up: The action of connecting to the available electricity. Kutcha: Building structures made from mud, thatch, or other low-quality materials. Metered Connections: Electricity connections with energy meters installed that measure and record the amount of electricity consumed by a residence, commercial building and the billing is done based on the reported consumption. Electric Grid: A synchronized network of electricity generators and customers connected through transmission and distribution lines and controlled by a common control center. Non-Grid Sources: Electricity sources, other than the electric grid. These include independent DRE-based mini-grids, solar home systems, rechargeable batteries, diesel generator connections from diesel operators, or private diesel generator sets. 106
115 Pre-Paid Meters: A device that monitors energy use after a customer has paid for the electricity in advance. A prepaid meter may disconnect service if the customer fails to pay or reaches a certain amount of electricity use. Private Diesel Generator: Diesel generators owned and used in private capacity by a household or an enterprise. Productive Use: The use of electricity as a direct input to the production of goods or the provision of services. Pucca: Building structures made with high-quality materials throughout, including the floor, roof, and exterior walls. Rechargeable Battery: An energy storage device which can be recharged with any electricity source for repeated use. Revenue Village: A small administrative region in India, a village with defined borders. One revenue village may contain many hamlets. Rural Enterprises: Commercial establishments or shops in rural areas, for example: Agricultural input shops: An enterprise selling inputs used for agricultural cultivation, such as fertilizers, seeds, etc.. Beauty parlor: An enterprise providing personal care services, especially for women, such hair cutting and make-up. Carpentry shops: An enterprise providing carpentry services such as making or repairing wooden furniture and furnishings. Cybercafe: An enterprise that offers Internet browsing facilities and houses related equipment such as computers. Dairy or milk chilling centers: An enterprise that collects, stores, and sells milk and milk products to retail customers or dairy companies. Flour mills: An enterprise that provides services such as milling of cereals or oil seeds and houses related equipment such as milling machines. Grocery shops: An enterprise that trades in everyday household use items, including food items and fast-moving consumer goods. Hardware shops: An enterprise that trades in metal tools, mechanical equipment, electrical supplies, and other hardware goods. Medical clinic: An enterprise that is a private owned health care facility where one or more medical professional advises outpatients. Mobile repair shops: An enterprise that provides repair services for mobile phones and related electronic items and sometimes also trades in those. Medical store: An enterprise that trades in pharmaceutical and medicinal products; a pharmacy. Photo studio: An enterprise that provides basic photography services. Ready-made goods: An enterprise that trades in finished textile products, including clothes, bags, shoes, etc. Sweets and snacks shops: An enterprise that prepares and sells sweetmeats and snacks. Tailoring shops: An enterprise that provides basic tailoring services. Warehouses and cold storages: An enterprise that provides storage services for perishable and non-perishable items, such as agricultural produce. Smart Meters: An advanced metering device that record the consumption of energy on real time basis and communicates the information to utilities for billing and monitoring purposes; can also receive information like pricing signals from utility. 107
116 GLOSSARY / ABBREVIATIONS Solar Home System: A stand-alone solar powered system, comprising a solar panel and battery, that typically powers lighting and few low wattage appliances like fans and television sets based on its capacity. Solar Lantern: A portable lighting-only device powered by solar energy. Solar Mini-Grid: A small-scale electricity distribution network that provides electricity to a localized group of customers, and generates electricity from solar panels potentially coupled with a storage or backup system. A typical mini-grid has a coverage area of 2 3 kilometers. Typical: A term used to denote average values or situation. List of Abbreviations AT&C losses DDUGJY DF Village DG DISCOMs DRE ESMAP INR kw kwh LED MG Villiage MTM Sq.ft SPI SPRD UDAY Aggregate Technical & Commercial losses Deen Dayal Upadhyaya Gram Jyoti Yojana Distribution Franchise Village Diesel Generator Distribution Company Distributed Renewable Energy Energy Sector Management Assistance Program Indian Rupee Kilowatt Kilowatt Hour Light Emitting Dioide Mini-grid Village Multitier Matrix Square Feet Smart Power India Smart Power for Rural Development Ujjwal DISCOM Assurance Yojana W p Watt peak 108
117 End Notes and References i ii iii iv v vi vii International Energy Agency. (2017). Energy Access Outlook 2017: From Poverty to Prosperity. World Energy Outlook Special Report (Vol. 94). Gill, B., & Gupta, A. (2019). Modi government flagship Saubhagya scheme achieves 95% target; universal electricity access close to reality. Retrieved January 16, 2019, from achieving-universal-electricity-access-saubhagya-scheme-clocks-95- target/ / Ganesan, K., Jain, A., Ray, S., Sharma, M., & Ghosh, A. (2014). Agenda for a Reformed Power Sector in India. Council on Energy Environment and water (CEEW). New Delhi. Gupta, A. (2016). Limited Success- Revisiting the Distribution Franchise Model. Retrieved November 26, 2018, from com/2016/11/08/limited-success/ Sen, Rajarshri (2018). Clean Energy Access Network, India: Solar PV Battery Manual Banerjee, S. G., Barnes, D., Singh, B., Mayer, K., & Samad, H. (2014). Power for All: Electricity Access Challenge in India. A World Bank Study. Washington DC. Banerjee, S. G., Barnes, D., Singh, B., Mayer, K., & Samad, H. (2014). Power for All: Electricity Access Challenge in India. A World Bank Study. Washington DC. viii Jain, A., Ray, S., Ganesan, K., Aklin, M., Cheng, C.-Y., & Urpelainen, J. (2015). Access to clean cooking energy and electricity: survey of states. Council on Enegry, Environment and Water, and Columbia University. ix x xi xii xiii xiv Mayer, K., Banerjee, S., & Trimble, C. (2015). Elite Capture : Residential Tariff Subsidies in India. Washington DC: World Bank. Chunekar, A., Varshney, S., & Dixit, S. (2016). Residential Electricity Consumption in India: What do We Know? Prayas (Energy Group). Mumbai, India. Filippini, M., & Pachauri, S. (2004). Elasticities of Electricity Demand in Urban Indian Households. Energy Policy, 32, Tiwari, P. (2000). Architectural, Demographic, and Economic Causes of Electricity Consumption in Bombay. Journal of Policy Modeling, 22(1), Asaduzzaman, M., Barnes, D. F., & Khandker, S. R. (2009). Restoring Balance, Bangladesh s Rural Energy Realities. ESMAP, World Bank. Chunekar, A., Varshney, S., & Dixit, S. (2016). Residential Electricity Consumption in India: What do We Know? Prayas (Energy Group). Mumbai, India. 109
118 ENDNOTES xv xvi xvii These definitions are adapted from the definitions used in a World Bank study. Source: Banerjee, S. G., Barnes, D., Singh, B., Mayer, K., & Samad, H. (2014). Power for All: Electricity Access Challenge in India. A World Bank Study. Washington DC. For distances larger than 50 meterres, new electric poles are required, which can increase the cost of electrification measurably. For smaller distances, it is assumed that it would be easier to get new connections. Source: Tongia, R. (2018). Microgrids in India Myths, Misunderstandings, and the Need for Proper Accounting. Brookings India (Vol. February). New Delhi. International Energy Agency. (2017). Energy Access Outlook 2017: From Poverty to Prosperity. World Energy Outlook Special Report (Vol. 94). xviii Johannes Urperlainen (2018). A key hurdle to Modi s rural electrification scheme is the paperwork. The Print. Accessed on Retrieved from xix xx xxi xxii Johannes Urperlainen (2018). Power distribution companies are slowing down Narendra Modi s Saubhagya scheme. The Print. Accessed on Retreived from Nhalur, S., Josey, A., & Mandal, M. (2018). Rural Electrification in India - From Connections for All to Power for All. Economic & Political Weekly, 53(45). Smart Power India. (2017). Expanding Opportunities for Renewable Energy Based Mini Grids in Rural India. Gurgaon. Chunekar, A., Varshney, S., & Dixit, S. (2016). Residential Electricity Consumption in India: What do We Know? Prayas (Energy Group). Mumbai, India. xxiii Bhatia, M., & Angelou, N. (2015). Beyond Connections: Energy Access Redefined. Energy Sector Management Assistance Program, World Bank. Washington DC. xxiv Planning Commission. (2014). Annual Report ( ) on the Working of State Power Utilities & Electricity Departments. New Delhi. xxv Jha, G. K., Pal, S., & Singh, A. (2012). Changing Energy-use Pattern and the Demand Projection for Indian Agriculture. Agricultural Economics Research Review, 25(1), xxvi Agrawal, S., & Jain, A. (2015). Solar Pumps for Sustainable Irrigation - A budget nuetral opportunity. Council on Energy, Environment and Water. New Delhi. xxvii Ministry of Power. (2019). Pradhanmantri Sahaj Bijli Har Ghar Yojana (Saubhagya). Retrieved Januray 10, 2019, from dashboard/main. xxviii Jain, A., Tripathi, S., Mani, S., Patnaik, S., Shahidi, T., & Ganesan, K. (2018). Access to Clean Cooking Energy and Electricity - Survey of States Council on Enegry, Environment and Water. New Delhi. 110
119 xxix Blodgett, C., Dauenhauer, P., Louie, H., & Kickham, L. (2017). Accuracy of Energy-use Surveys in Predicting Rural Mini-grid User Consumption. Energy for Sustainable Development, 41, xxx Abhyankar, N., Shah, N., Letschert, V., & Phadke, A. (2017). Assessing the Cost-Effective Energy Saving Potential from Top-10 Appliances in India. 9th International Conference on Energy Efficiency in Domestic Appliances and Lighting (EEDAL). University of California, Irvine. xxxi Bureau of Energy Efficiency. (2017). Know Your Star Label and Make the Right Choice. Retrieved from Session_2.pdf%0A%0A xxxii Chunekar, A., Kadav, K., Singh, D., & Sant, G. (2011). Potential Savings from Selected Super-Efficient Electric Appliances in India. Prayas Energy Group. Pune. (*) that the Trademarks and the associated logos of RF, SPI and ISEP are the property of the respective parties and neither party shall claim any interest, right or title in such intellectual property of the other party. 111
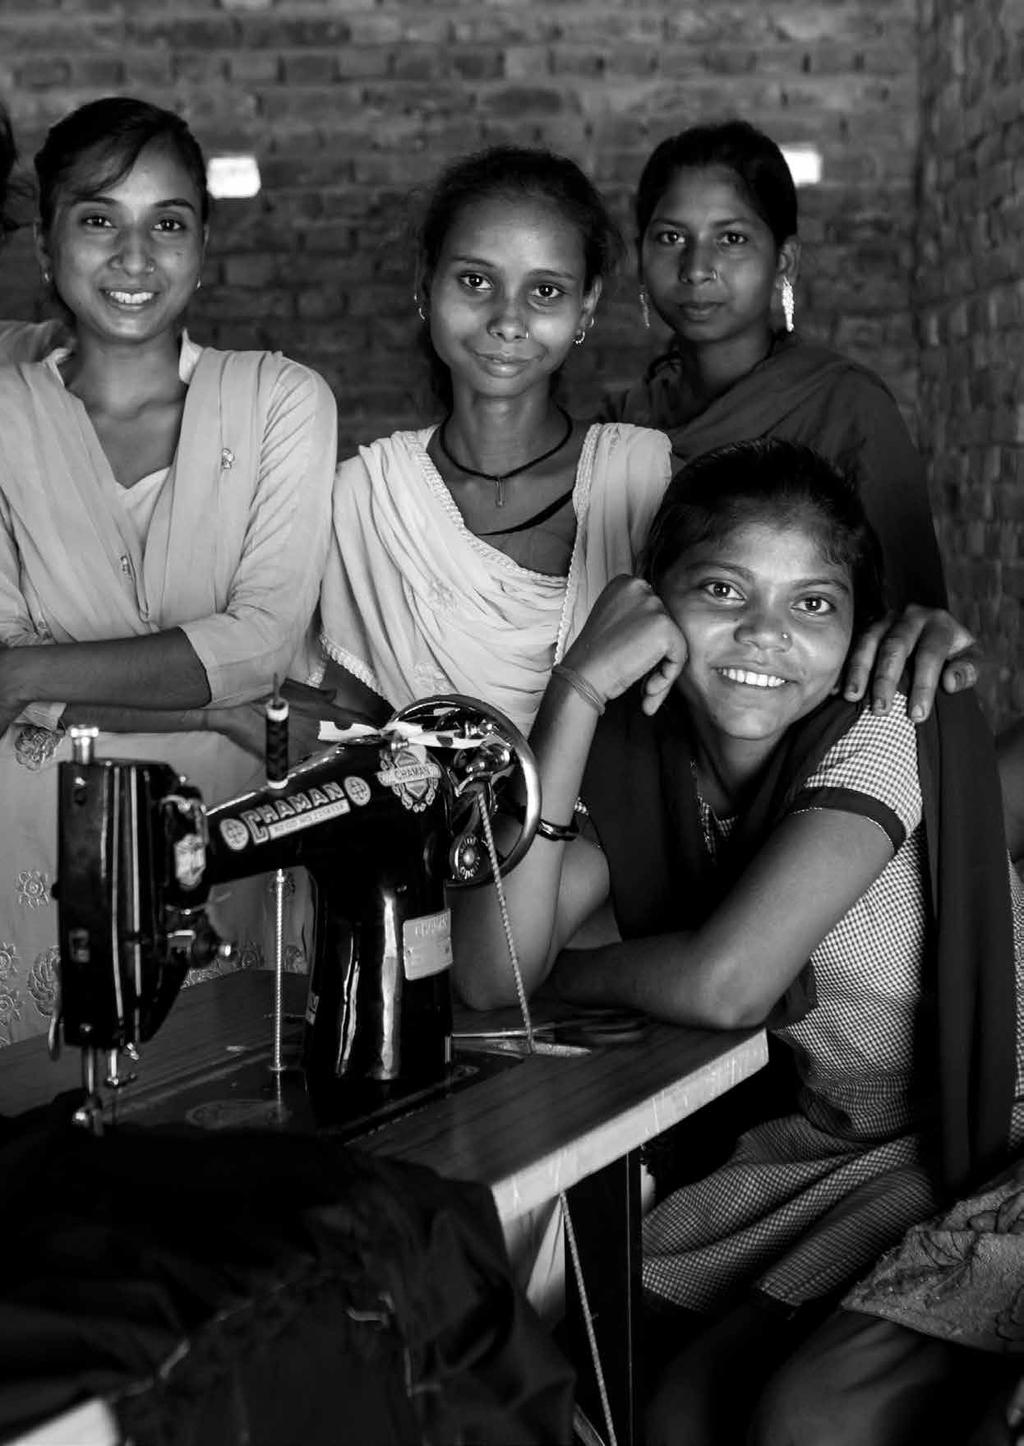
120 112
RURAL ELECTRIFICATION IN INDIA CUSTOMER BEHAVIOUR AND DEMAND FEBRUARY 2019
 RURAL ELECTRIFICATION IN INDIA CUSTOMER BEHAVIOUR AND DEMAND FEBRUARY 2019 1 ABOUT US Smart Power India Smart Power India, a subsidiary of the Rockefeller Foundation is the key agency for implementing
Multi-Tier Framework Survey Kenya
 Ministry of Energy & Petroleum, Kenya Multi-Tier Framework Survey Kenya Preliminary Results for 14 underserved counties in Kenya May 9, 2017 1 Part 1 Overview of the Approach 2 Introduction: Profile of
BMW GROUP DIALOGUE. HANGZHOU 2017 TAKE AWAYS.
 BMW GROUP DIALOGUE. HANGZHOU 2017 TAKE AWAYS. BMW GROUP DIALOGUE. CONTENT. A B C Executive Summary: Top Stakeholder Expert Perceptions & Recommendations from Hangzhou Background: Mobility in Hangzhou 2017,
Rural Energy Access: Promoting Solar Home Systems In Rural Areas In Zambia A Case Study. O.S. Kalumiana
 Rural Energy Access: Promoting Solar Home Systems In Rural Areas In Zambia A Case Study O.S. Kalumiana Department of Energy, Ministry of Energy & Water Development, P.O. Box 51254, Lusaka ZAMBIA; Tel:
Evaluation and modelling of demand and generation at distribution level for Smart grid implementation
 Evaluation and modelling of demand and generation at distribution level for Smart grid implementation Dr.Haile-Selassie Rajamani Senior Lecturer Energy and Smart Grid Research Group University of Bradford,
To Our Business Partners
 CSR CSR > Social Performance > To Our Business Partners To Our Business Partners We build relationships of trust by engaging in open communication, with mutual prosperity as our goal. To Our Dealers Basic
Lighting Up Bihar. Robin Burgess, LSE and IGC Michael Greenstone, MIT Nicholas Ryan, Harvard Anant Sudarshan, Harvard and JPAL
 Lighting Up Bihar Robin Burgess, LSE and IGC Michael Greenstone, MIT Nicholas Ryan, Harvard Anant Sudarshan, Harvard and JPAL 21 July, 2013 IGC Bihar Growth Conference J-PAL (Poverty Action Lab) International
ROAD-MAPPING CUSTOMER FACING APPLICATIONS TO ENABLE SMART GRID
 ROAD-MAPPING CUSTOMER FACING APPLICATIONS TO ENABLE SMART GRID JOSE ANTONIO T. VALDEZ VICE PRESIDENT MARKETING, CUSTOMER SOLUTIONS & INNOVATIONS MANILA ELECTRIC COMPANY ABOUT MERALCO 109 years in service
Smart Grid Foundation Course
 Introduction: The 21st century electric grid is witnessing several disruptive changes. After 100 years of centralized power generation and creation of massive electric grids, the shift is now towards de-centralized
northeast group, llc India Smart Grid: Market Forecast ( ) January group.com
 January group.com") northeast group, llc India Smart Grid: Market Forecast (2015 2025) January 2015 www.northeast- group.com India Smart Grid: Market Forecast (2015 2025) In many ways, India represents the best smart grid
northeast group, llc India Smart Grid: Market Forecast (2015 2025) January 2015 www.northeast- group.com India Smart Grid: Market Forecast (2015 2025) In many ways, India represents the best smart grid
CIP- Center for Innovation for the Poor Integrated Energy Centre Replication, urban to tribal
 CIP- Center for Innovation for the Poor Integrated Energy Centre Replication, urban to tribal Title: Integrated Energy Centre Replication, Orissa Case Study no: 6 Initiated in: 2013 Key terms: tribal,
Self-Driving Cars: The Next Revolution. Los Angeles Auto Show. November 28, Gary Silberg National Automotive Sector Leader KPMG LLP
 Self-Driving Cars: The Next Revolution Los Angeles Auto Show November 28, 2012 Gary Silberg National Automotive Sector Leader KPMG LLP 0 Our point of view 1 Our point of view: Self-Driving cars may be
RE: Comments on Proposed Mitigation Plan for the Volkswagen Environmental Mitigation Trust
 May 24, 2018 Oklahoma Department of Environmental Quality Air Quality Division P.O. Box 1677 Oklahoma City, OK 73101-1677 RE: Comments on Proposed Mitigation Plan for the Volkswagen Environmental Mitigation
CONTENT. Background and vision. Power Corner Business Model CHAPTER 2. Case Study of Tanzania. Power Corner Zambia & Scale Up CHAPTER 4
 PowerCorner 1 CONTENT CHAPTER 1 Background and vision CHAPTER 2 Power Corner Business Model CHAPTER 3 Case Study of Tanzania CHAPTER 4 Power Corner Zambia & Scale Up 2 BACKGROUND VISION 3 ENGIE GROUP BACKGROUND
Anil Agarwal Dialogue 2014
 De-centralised Micro Grids in India Anil Agarwal Dialogue 2014 Scale of the Rural Electrification Challenge As per Ministry of Power figures, Village Electrification stands at 93% However, Rural Household
BENCHMARKING URBAN TRANSPORT-A STRATEGY TO FULFIL COMMUTER ASPIRATION
 BENCHMARKING URBAN TRANSPORT-A STRATEGY TO FULFIL COMMUTER ASPIRATION Rahul Tiwari Senior City Transport Officer Directorate, Urban Administration and Development Bhopal & PhD Scholar (+91) 98930 44012
Denver Car Share Program 2017 Program Summary
 Denver Car Share Program 2017 Program Summary Prepared for: Prepared by: Project Manager: Malinda Reese, PE Apex Design Reference No. P170271, Task Order #3 January 2018 Table of Contents 1. Introduction...
Share with the GHSEA. Smart Energy Initiatives. Collaboration and a partner eco-system to achieve results
 Share with the GHSEA on behalf of the DSEA - learning and experience Color variant: Siemens Cool Gray Smart Energy Initiatives Collaboration and a partner eco-system to achieve results Realizing a Community-centric
The Potential Evolution of EVs to the Consumer Mainstream in Canada: A Geodemographic Segmentation Approach Presented by Mark R.
 1 The Potential Evolution of EVs to the Consumer Mainstream in Canada: A Geodemographic Segmentation Approach Presented by Mark R. Ferguson, PhD May 2017 2 3 Partners Social Costs and Benefits of Electric
Back ground Founded in 1887, and has expanded rapidly Altitude about 2500 meters above MSL Now among the ten largest cities in Sub Saharan Africa
 Back ground Founded in 1887, and has expanded rapidly Altitude about 2500 meters above MSL Now among the ten largest cities in Sub Saharan Africa Annual growth rate is 3.8% By 2020 population growth would
Solar PV based lighting in South Asia region: Institutional and Technological Trends
 International seminar on Solar Photovoltaic System: An Alternate Solution for the Growing Energy Demand Solar PV based lighting in South Asia region: Institutional and Technological Trends Debajit Palit
Car Sharing at a. with great results.
 Car Sharing at a Denver tweaks its parking system with great results. By Robert Ferrin L aunched earlier this year, Denver s car sharing program is a fee-based service that provides a shared vehicle fleet
Session 1: Implementing SDG 7 and Achieving Target 7.1 CAMBODIA CHHE LIDIN
 Session 1: Implementing SDG 7 and Achieving Target 7.1 CAMBODIA Seminar on Supporting Sustainable Development Goal 7, Target 7.1 By 2030 ensure universal access to affordable, reliable and modern energy
The Future of Energy Delivery: The Ongoing Grid Transformation
 The Future of Energy Delivery: The Ongoing Grid Transformation NALEO National Policy Institute on Energy 26 February, 2016 Hotel Maya, Long Beach, CA Lola Infante Director Generation Fuels and Market Analysis
Final Report. LED Streetlights Market Assessment Study
 Final Report LED Streetlights Market Assessment Study October 16, 2015 Final Report LED Streetlights Market Assessment Study October 16, 2015 Funded By: Prepared By: Research Into Action, Inc. www.researchintoaction.com
Electric Vehicle Charge Ready Program
 Electric Vehicle Charge Ready Program September 20, 2015 1 Agenda About SCE The Charge Ready Initiative Depreciation Proposals of The Charge Ready Initiative Challenges Outcomes September 20, 2015 2 About
Electric Vehicle Cost-Benefit Analyses
 Electric Vehicle Cost-Benefit Analyses Results of plug-in electric vehicle modeling in eight US states Quick Take M.J. Bradley & Associates (MJB&A) evaluated the costs and States Evaluated benefits of
REGIONAL MEETING ON SUSTAINABLE ENERGY
 REGIONAL MEETING ON SUSTAINABLE ENERGY FOR ASIA-PACIFIC LEAST DEVELOPED COUNTRIES SESSION 2: FINANCING INITIATIVES AND BUSINESS PLANS THAT WORK ELMAR ELBLING Senior Energy Access Specialist Asian Development
Consumers, Vehicles and Energy Integration (CVEI) project
 project") Consumers, Vehicles and Energy Integration (CVEI) project Dr Stephen Skippon, Chief Technologist September 2016 Project aims To address the challenges involved in transitioning to a secure and sustainable
Consumers, Vehicles and Energy Integration (CVEI) project Dr Stephen Skippon, Chief Technologist September 2016 Project aims To address the challenges involved in transitioning to a secure and sustainable
Future of Mobility and Role of E-mobility for Future Sustainable Transport. Petr Dolejší Director Mobility and Sustainable Transport
 Future of Mobility and Role of E-mobility for Future Sustainable Transport Petr Dolejší Director Mobility and Sustainable Transport ACEA MEMBERS 3 KEY FIGURES ABOUT THE INDUSTRY 12.1 million direct and
Electric Vehicle Charging Workshop Pride Park Stadium 7 March 2018
 Electric Vehicle Charging Workshop Pride Park Stadium 7 March 2018 EVS29 Montreal 20-24 June 2016 1 LCV September 16 The Office for Low Emission Vehicles Greg Clark - BEIS Chris Grayling- DfT Richard Harrington
Review of Retail Electricity Tariffs
 Review of Retail Electricity Tariffs Azerbaijan, China, India, Indonesia, Myanmar, Philippines, Thailand, Vietnam September 5, 2016 Cecilia Lee Supervisor: Mr. Yongping Zhai SDAS/SDCC Asian Development
ABB Next Level Big shift in power attractive opportunities
 Bernhard Jucker and Claudio Facchin, Capital Markets Day, London, ABB Next Level Big shift in power attractive opportunities Slide 1 Agenda Profitably growing ABB s power business Shifting the center of
Submission to the IESO re: RDGI Fund Virtual Net Metering Investigation Topic
 1. Introduction The Canadian Solar Industries Association (CanSIA) is a national trade association that represents the solar energy industry throughout Canada. CanSIA s vision is for solar energy to be
Respecting the Rules Better Road Safety Enforcement in the European Union. ACEA s Response
 Respecting the Rules Better Road Safety Enforcement in the European Union Commission s Consultation Paper of 6 November 2006 1 ACEA s Response December 2006 1. Introduction ACEA (European Automobile Manufacturers
Vermont Public Power Supply Authority 2018 Tier 3 Annual Plan
 Vermont Public Power Supply Authority 2018 Tier 3 Annual Plan Vermont s Renewable Energy Standard ( RES ) enacted through Act 56 in 2015 requires electric distribution utilities to generate fossil fuel
Innovation and Transformation of Urban Mobility Role of Smart Demand Responsive Transport (DRT) service
 service") Innovation and Transformation of Urban Mobility Role of Smart Demand Responsive Transport (DRT) service Eng. Mohammed Abubaker Al Hashimi Director of Planning & Business Development, Public Transport Agency
Innovation and Transformation of Urban Mobility Role of Smart Demand Responsive Transport (DRT) service Eng. Mohammed Abubaker Al Hashimi Director of Planning & Business Development, Public Transport Agency
Low Carbon Green Growth Roadmap for Asia and the Pacific FACT SHEET
 Smart grid Low Carbon Green Growth Roadmap for Asia and the Pacific FACT SHEET Key point The smart grid allows small- and medium-scale suppliers and individuals to generate and distribute power in addition
Summer Reliability Assessment Report Electric Distribution Companies Perspective
 Energy Association of Pennsylvania Summer Reliability Assessment Report Electric Distribution Companies Perspective to the Pennsylvania Public Utility Commission June 9, 2011 Harrisburg, PA Terrance J.
Unilever Sustainable Palm Oil Sourcing Policy
 Unilever Sustainable Palm Oil Sourcing Policy Introduction Unilever uses palm oil and its derivatives in margarine, soups, sauces, bouillon and ice cream as well as a range of home and personal care products.
BUILDING A ROBUST INDUSTRY INDEX BASED ON LONGITUDINAL DATA
 CASE STUDY BUILDING A ROBUST INDUSTRY INDEX BASED ON LONGITUDINAL DATA Hanover built a first of its kind index to diagnose the health, trends, and hidden opportunities for the fastgrowing auto care industry.
Tariff Design Issues: Approaches for Recovering Grid and System Costs
 Tariff Design Issues: Approaches for Recovering Grid and System Costs DG Energy - Workshop on Renewable Energy Self-Consumption Andreas Jahn Senior Associate 27 th March 2015 The Regulatory Assistance
PUBLIC TRANSPORTATION AS THE
 PUBLIC TRANSPORTATION AS THE BACKBONE OF MAAS Caroline Cerfontaine, Combined Mobility Manager, A WORLDWIDE ASSOCIATION 16 offices + 2 centres for transport excellence : A DIVERSE GLOBAL MEMBERSHIP 1500
EXPERIENCES IN ASIA FOR INTEGRATION OF SMART GRIDS AND RENEWABLES: THE SINGAPORE STORY
 EXPERIENCES IN ASIA FOR INTEGRATION OF SMART GRIDS AND RENEWABLES: THE SINGAPORE STORY ISGAN Workshop 8 March 2016 Mr Eugene Toh, Director, Policy Department, EMA EMA who we are and what we do Lead agency
The Future of Electrification
 BOSTON The Future of Electrification Opportunities and Challenges in Transitioning to an Electric Heating and Transportation Sector As a counter-narrative to the often-cited utility death spiral, the electrification
Labelling Smart Roads DISCUSSION PAPER 4/2015
 DISCUSSION PAPER 4/2015 December 2015 TABLE OF CONTENTS 1. Introduction... 3 2. The Smart Roads of the Future... 3 3. : Sustainability of road infrastructure... 4 4. : Sustainability in mobility management
Prospects for Rural Electrification in Africa
 Prospects for Rural Electrification in Africa Edward Miguel University of California, Berkeley and NBER NOVAFRICA Conference on Economic Development in Africa Lisboa, Portugal July 14, 2016 7/2016 Wolfram
Distributed Generation and the Importance of the Electric Power Grid
 Distributed Generation and the Importance of the Electric Power Grid Rick Tempchin Executive Director, Retail Energy Services Edison Electric Institute Edison Electric Institute The Edison Electric Institute
actsheet Car-Sharing
 actsheet Car-Sharing This paper was prepared by: SOLUTIONS project This project was funded by the Seventh Framework Programme (FP7) of the European Commission Solutions project www.uemi.net The graphic
Country Report 9. Lao PDR Country Report. Leeber Leebouapao National Economic Research Institute. March 2008
 Country Report 9 Lao PDR Country Report Leeber Leebouapao National Economic Research Institute March 2008 This chapter should be cited as Leebouapao, L. (2008), Lao PDR Country Report, in Soesastro, H.
Utility Rate Design for Solar PV Customers
 Utility Rate Design for Solar PV Customers Solar Power PV Conference & Expo Boston MA Presented by Richard Sedano February 24, 2016 The Regulatory Assistance Project 50 State Street, Suite 3 Montpelier,
Rural Electrification Workshop International Best Practices and Options for Policy Makers 4 5 April 2013, Yangoon, Union of Myanmar
 Rural Electrification Workshop International Best Practices and Options for Policy Makers 4 5 April 2013, Yangoon, Union of Myanmar Rural Electrification Policies in Cambodia Presented by Mr. Loeung Keosela
Green Power Feasibility Study Econet Lesotho
 Green Power This document has been written to provide information to mobile operators who are considering or planning to deploy green renewable power resources for base station and transmission sites.
The Energy Transition and Idea Creation: The energy transition perspective of a global energy operator
 The Energy Transition and Idea Creation: The energy transition perspective of a global energy operator Daniele Agostini, Head of Low Carbon and European Energy Policies Enel Holding Rome, March 3 rd, 2018
Rhode Island Division of Public Utilities and Carriers & Office of Energy Resources. Power Sector Transformation
 1 Rhode Island Division of Public Utilities and Carriers & Office of Energy Resources Power Sector Transformation Notice of Inquiry into the Electric Utility Business Model and Request for Stakeholder
Engineering Entrepreneurship. Ron Lasser, Ph.D. EN 0062 Class #
 Engineering Entrepreneurship Ron Lasser, Ph.D. EN 0062 Class #4 9-29-06 1 Biodiesel Incorporated The Case: It is about one group s efforts to identify a business opportunity Look at the Entrepreneurial
Net Metering in Missouri
 Net Metering in Missouri Make A Good Policy Great (AGAIN) Executive Summary More and more Americans every year are able to produce their own electricity. As the cost of solar continues to plummet, homeowners
Economics and Barriers to Solar Photovoltaic Applications in Barbados
 Economics and Barriers to Solar Photovoltaic Applications in Barbados Roland R Clarke PhD Clarke Energy Associates www.clarkeenergy@aol.com clarkeenergy@aol.com Presented to Alternative Energy: Pathways
Robustness and Cost Efficiency through User Flexibility in the Distribution Network
 Washington, April 20, 2015 Robustness and Cost Efficiency through User Flexibility in the Distribution Network Knut Samdal, Research Director SINTEF Energy Research knut.samdal@sintef.no 1 SINTEF is the
Electric Vehicle Charging: Supporting the Needs of All EV Drivers
 Electric Vehicle Charging: Supporting the Needs of All EV Drivers David Schatz, Director, Public Policy October 17, 2017 The Nation s Largest and Most Open EV Charging Network Largest Community of EV drivers
northeast group, llc Southeast Asia Smart Grid: Market Forecast ( ) Volume II October group.com
 Volume II October group.com") northeast group, llc Southeast Asia Smart Grid: Market Forecast (2014 2024) Volume II October 2014 www.northeast- group.com Southeast Asia Smart Grid: Market Forecast (2014-2024) Southeast Asia is a growing
northeast group, llc Southeast Asia Smart Grid: Market Forecast (2014 2024) Volume II October 2014 www.northeast- group.com Southeast Asia Smart Grid: Market Forecast (2014-2024) Southeast Asia is a growing
Spreading Innovation for the Power Sector Transformation Globally. Amsterdam, 3 October 2017
 Spreading Innovation for the Power Sector Transformation Globally Amsterdam, 3 October 2017 1 About IRENA Inter-governmental agency established in 2011 Headquarters in Abu Dhabi, UAE IRENA Innovation and
SMART DIGITAL GRIDS: AT THE HEART OF THE ENERGY TRANSITION
 SMART DIGITAL GRIDS: AT THE HEART OF THE ENERGY TRANSITION SMART DIGITAL GRIDS For many years the European Union has been committed to the reduction of carbon dioxide emissions and the increase of the
The Biodiesel Leader. Renewable Energy Group, Inc. (888) REG /13_00k
 REG /13_00k") The Biodiesel Leader Renewable Energy Group, Inc. (888) REG-8686 www.regi.com Renewable Energy Group and REG are registered trademarks of Renewable Energy Group, Inc. BIOHEAT is a registered trademark
The Biodiesel Leader Renewable Energy Group, Inc. (888) REG-8686 www.regi.com Renewable Energy Group and REG are registered trademarks of Renewable Energy Group, Inc. BIOHEAT is a registered trademark
NAVIGANT RESEARCH INTRODUCTION
 NAVIGANT RESEARCH INTRODUCTION NAVIGANT RESEARCH PROVIDES IN-DEPTH ANALYSIS OF GLOBAL CLEAN TECHNOLOGY MARKETS. The team s research methodology combines supply-side industry analysis, end-user primary
PROMOTING THE UPTAKE OF ELECTRIC AND OTHER LOW EMISSION VEHICLES
 Chair Cabinet Economic Growth and Infrastructure Committee Office of the Minister of Transport Office of the Minister of Energy and Resources PROMOTING THE UPTAKE OF ELECTRIC AND OTHER LOW EMISSION VEHICLES
Prospects for Rural Electrification in Africa
 Prospects for Rural Electrification in Africa Edward Miguel, University of California, Berkeley and NBER The Economics and Political Economy of Africa Conference George Washington University April 28,
1.2 + Billion people live in Darkness.
 Power to Empower 1.2 + Billion people live in Darkness. Power to Empower Husk Power Systems Manoj Sinha Co-Founder and CEO Impact Created in 5 Years Lighted 20,000 Households Employed 375 rural people;
Spreading Innovation for the Power Sector Transformation Globally. Amsterdam, 3 October 2017
 Spreading Innovation for the Power Sector Transformation Globally Amsterdam, 3 October 2017 1 About IRENA Inter-governmental agency established in 2011 Headquarters in Abu Dhabi, UAE IRENA Innovation and
When Grids Get Smart - ABB s Vision for the Power System of the Future
 When Grids Get Smart - ABB s Vision for the Power System of the Future When Grids Get Smart ABB s Vision for the Power System of the Future There is a convergence occurring between the business realities
Electricity System Reform in Japan and the Significance of International Grid Connection
 Sept. 8, 2016/Hall D7, Tokyo International Forum (Chiyoda-ku, Tokyo) International Symposium organized by Renewable Energy Institute Global Energy Interconnections; Status and Perspectives Realizing the
Grid Impacts of Variable Generation at High Penetration Levels
 Grid Impacts of Variable Generation at High Penetration Levels Dr. Lawrence Jones Vice President Regulatory Affairs, Policy & Industry Relations Alstom Grid, North America ESMAP Training Program The World
SPEECH. By Hon. Isak Katali Minister of Mines and Energy. Launch of the First Energy Shop. Mariental. 13 June 2011
 SPEECH By Hon. Isak Katali Minister of Mines and Energy Launch of the First Energy Shop Mariental 13 June 2011 Page 1 of 8 Director of Ceremonies Honourable Governor Members of the Diplomatic Corps Regional
Slide 1. ABB September 9, 2015
 Tarak Mehta, Head of Low Voltage Products, ABB Ltd., Capital Markets Day, Next Level Stage 2 New Electrification Products division: Power & Automation for the site Slide 1 Important notices Presentations
Deloitte Utility Electric Vehicle Survey
 Deloitte Utility Electric Vehicle Survey The Deloitte Utility EV Survey was conducted in 2017 and was previewed in Deloitte s report, Powering the future of mobility: How the electric power sector can
ENERGY FOR ALL: An Update. JIWAN ACHARYA Senior Energy Specialist
 ENERGY FOR ALL: An Update JIWAN ACHARYA Senior Energy Specialist ENERGY ACCESS SITUATION IN ASIA-PACIFIC 3.8 Billion Population in ADB s DMC s 2 Billion People without access to clean cooking 426 Million
A FIT FOR PURPOSE DISTRIBUTION NETWORK -Mini Grids- By Werikhe Godfrey Deputy Executive Director REA Uganda
 A FIT FOR PURPOSE DISTRIBUTION NETWORK -Mini Grids- By Werikhe Godfrey Deputy Executive Director REA Uganda Presentation Outline 1. Introduction 2. Key drivers of localized distribution 3. Challenges in
Off-Grid Renewable Energy Program in Myanmar. Pradeep Tharakan, PhD Senior Energy Specialist (Climate Change) Asian Development Bank
 Asian Development Bank") Off-Grid Renewable Energy Program in Myanmar Pradeep Tharakan, PhD Senior Energy Specialist (Climate Change) Asian Development Bank 1 ADB Off-grid Renewable Energy Program Phase 1: (October 2013 June 2014)
Off-Grid Renewable Energy Program in Myanmar Pradeep Tharakan, PhD Senior Energy Specialist (Climate Change) Asian Development Bank 1 ADB Off-grid Renewable Energy Program Phase 1: (October 2013 June 2014)
A Transformational Approach to Energy Supply. September 2016 Gail Scholes, Jo Gilbert
 A Transformational Approach to Energy Supply September 2016 Gail Scholes, Jo Gilbert About Robin Hood Energy The UK s first Local Authority-owned fully licensed gas and electricity supplier. Bourne from
Power Sector Trends: Focus on States
 Power Sector Trends: Focus on States Japan-India Climate Policy Research Workshop December 2017 Dr. Kartikeya Singh Deputy Director and Fellow Wadhwani Chair in U.S.-India Policy Studies CSIS ksingh@csis.org
Challenges Facing the City of Cape Town in Meeting Renewable Energy Targets
 Challenges Facing the City of Cape Town in Meeting Renewable Energy Targets Dr Bulumko Msengana Executive Director: Utility Services City of Cape Town Organised by International Perspective Greenhouse
The Smart Grid: Re-powering America George W. Arnold National Coordinator for Smart Grid Interoperability NIST Gaithersburg, MD April 28, 2010
 The Smart Grid: Re-powering America George W. Arnold National Coordinator for Smart Grid Interoperability NIST Gaithersburg, MD April 28, 2010 2 U.S. Electric Grid One of the largest, most complex infrastructures
EVSE Impact on Facility Energy Use and Costs
 EVSE Impact on Facility Energy Use and Costs Bhaskaran Gopalakrishnan Professor and Director of the Industrial Assessment Center Department of IMSE, Statler College West Virginia University Need to understand
Residential Survey Phase 2 Results
 1 Residential Survey Phase 2 Results Prepared for: United Energy December 2017 Contacts: Karyn Wong: kwong@woolcott.com.au Liz Sparham: lsparham@woolcott.com.au United Energy Residential Survey Results
WHITE PAPER. Preventing Collisions and Reducing Fleet Costs While Using the Zendrive Dashboard
 WHITE PAPER Preventing Collisions and Reducing Fleet Costs While Using the Zendrive Dashboard August 2017 Introduction The term accident, even in a collision sense, often has the connotation of being an
Rural Electrification. A Brief History GEORGIA S ELECTRIC MEMBERSHIP CORPORATION
 Rural Electrification A Brief History GEORGIA S ELECTRIC MEMBERSHIP CORPORATION Rural Electrification A BRIEF HISTORY OF RURAL ELECTRIFICATION IN AMERICA Most folks think the history of rural electrification
Stationary Energy Storage Solutions 3. Stationary Energy Storage Solutions
 Stationary Energy Storage Solutions 3 Stationary Energy Storage Solutions 2 Stationary Energy Storage Solutions Stationary Storage: Key element of the future energy system Worldwide growing energy demand,
CHEMICALS AND REFINING. ABB in chemicals and refining A proven approach for transforming your challenges into opportunities
 CHEMICALS AND REFINING ABB in chemicals and refining A proven approach for transforming your challenges into opportunities 2 ABB in Chemicals and Refining A proven approach for transforming your challenges
Utility Operator Model
 Mini-Grid Policy Toolkit- Case Study Country: KENYA Project: Rural electrification with governmentrun mini-grids Utility Operator Model Project Summary Site map of Kenyan mini-grid locations (red dots)
The Rural Electrification Senegal (ERSEN) Project: Electricity for over 90,000 persons.
 Project: Electricity for over 90,000 persons.") Information and communication are made easier Thanks to rural electrification, one can witness the emergence of new habits with regards to accessing information (TV, Radio). Each day, children from villages
Information and communication are made easier Thanks to rural electrification, one can witness the emergence of new habits with regards to accessing information (TV, Radio). Each day, children from villages
generate + manage + store + share
 generate + manage + store + share COMMUNITY ENERGY STARTER PACK for businesses and homes mondo.com.au CONNECTING COMMUNITIES Your guide to navigating the new energy landscape, energy hubs, mini grids and
ACEA Position Paper The European Commission s Action Plan on Alternative Fuels Infrastructure
 ACEA Position Paper The European Commission s Action Plan on Alternative Fuels Infrastructure February 2018 INTRODUCTION The European Commission presented its Clean Mobility Package on 8 November 2017
Madhya Pradesh Road Development Corporation: A Case Study of ADB Assistance for Institutional Development in the Transport Sector in India
 Madhya Pradesh Road Development Corporation: A Case Study of ADB Assistance for Institutional Development in the Transport Sector in India South Asia Transport Team Presented by Prodyut Dutt Asian Development
Reducing CO 2 emissions from vehicles by encouraging lower carbon car choices and fuel efficient driving techniques (eco-driving)
") Reducing CO 2 emissions from vehicles by encouraging lower carbon car choices and fuel efficient driving techniques (eco-driving) David Pryke, Head of Efficient Driving, Department for Transport, London
Reducing CO 2 emissions from vehicles by encouraging lower carbon car choices and fuel efficient driving techniques (eco-driving) David Pryke, Head of Efficient Driving, Department for Transport, London
Electric Vehicle Charging Station Infrastructure World 2012 (Summary)
") Electric Vehicle Charging Station Infrastructure World 2012 (Summary) Author: Helena Perslow, Senior Market Analyst helena.perslow@ihs.com IMS Research Europe IMS Research USA IMS Research China IMS Research
Electric Vehicle Charging Station Infrastructure World 2012 (Summary) Author: Helena Perslow, Senior Market Analyst helena.perslow@ihs.com IMS Research Europe IMS Research USA IMS Research China IMS Research
Uganda s Experience with Promotion of Rural Electrification - Connection subsidies
 Uganda s Experience with Promotion of Rural Electrification - Connection subsidies A Presentation Made at the Initiative Practitioner Workshop 14 th -16 th November 2011 Radisson Hotel, Dakar Senegal By
Strategic Plan
 2005-2015 Strategic Plan SUMMARY OF THE REVISED PLAN IN 2011 A decade focused on developing mass transit in the Outaouais A updated vision of mass transit in the region The STO is embracing the future
With New Programs and Renewable Resources, Xcel Energy Is Ready for the Future
 With New Programs and Renewable Resources, Xcel Energy Is Ready for the Future An Interview with Regional Vice President Jerome Davis By Kym Wootton December 9, 2015 Xcel Energy, an E Source member for
Smart Grid and Energy Efficiency in the U.S.
 Smart Grid and Energy Efficiency in the U.S. Presentation for the Israeli Smart Energy Association Tom Coleman U.S. Embassy Tel Aviv The First U.S. Power Grid Thomas Edison Pearl Street (lower Manhattan)
Case study: Sweden. E.on Sverige's residential electricity bill. Context
 Case study: Sweden E.on Sverige's residential electricity bill Context Sweden was one of the first countries in Europe to complete the deployment of smart electricity meters to household consumers. In