Revised Inventory Guidance For Locomotive Emissions
|
|
|
- Gregory McCarthy
- 6 years ago
- Views:
Transcription
1 Report No. SR Revised Inventory Guidance For Locomotive Emissions prepared for: Southeastern States Air Resource Managers, Inc. June 2004 prepared by: Sierra Research, Inc J Street Sacramento, California (916)
2 Report No. SR Revised Inventory Guidance for Locomotive Emissions Prepared for Southeastern States Air Resource Managers, Inc. June 2004 Prepared by: Sierra Research, Inc J Street Sacramento, CA (916) and Dr. Larry Caretto Consultant
3 Report No. SR Revised Inventory Guidance For Locomotive Emissions Table of Contents 1. Introduction Overview of Recommended Inventory Methodology Recommended Methods... 4 Class I Line-Haul Locomotives... 4 Class II and Class III Line-Haul Locomotives...11 Yard Operations...12 Appendix A Converting from Total Hydrocarbons (THC) to Other Measures of Organic Gases Appendix B Sample Calculations Appendix C Contact Information
4 1. INTRODUCTION This document illustrates how a state or local agency can calculate emissions from locomotives within an inventory area. Railroad locomotives used in the United States are primarily of two types: electric and diesel-electric. Electric locomotives are powered by electricity generated at stationary power plants and distributed by either a third rail or overhead catenary system. Emissions produced from the generation of this electricity are attributed to the power plants generating the electricity. Such emissions are not part of this inventory. Diesel-electric locomotives, on the other hand, use a diesel engine and an alternator or generator to produce the electricity required to power its traction motors. Emissions produced by these diesel engines are of interest in emission inventory development. Emissions for hydrocarbons (HC), carbon monoxide (CO), oxides of nitrogen (NOx), sulfur dioxide (SO2), and particulate matter (PM) from this source are covered here. This document is a revision of the previous guidance for determining emission factors from locomotives. 1 The main difference between this document and previous guidance is the use of revised emission factors to account for locomotive emission standards that are phased in between 2000 and In addition, estimated adjustment factors to systemwide fuel use have been included in this revision. Other sources of emissions from railroad operations include the small gasoline and diesel engines used on refrigerated and heated rail cars. These engines are thermostatically controlled, working independently of train motive power, and fall in the category of offhighway equipment, which are addressed as a separate offroad source category. Railroads can be separated into three classes based on size: Class I, Class II, and Class III. 2 Class I railroads represent the largest railroad systems in the country. Because of their size, Class I railroads operate over a large geographic area. Also, they carry most of the interstate freight and carry most of the passenger service. They are required to keep detailed records of their operations and to report yearly to the Surface 1 U. S. Environmental Protection Agency, Procedures for Emission Inventory Preparation Volume IV Mobile Sources, Office of Mobile Sources, EPA420-R , Chapter 6, December According to the Surface Transportation Board, Class I railroads are defined as railroads earning adjusted annual operating revenues for three consecutive years of $250,000,000 or more. Railroads with less than $250,000,000 revenues are classified as either Class II ($20,000,000 to $250,000,000 revenues) or Class III (less than $20,000,000 in revenues). -1-
5 Transportation Board (STB). 1 Information on the size of the Class I railroads, expressed in terms of their ton miles of freight and the amount of fuel used, is shown in Table B-1. Table B-2 shows the states in which the individual Class I railroads operate. Class II and III railroads represent the remainder of the rail transportation system and generally operate within smaller, localized areas. These smaller railroads are not subject to the same reporting requirements, and their recordkeeping may be less extensive. Also, their fleet of locomotives tends to be older, with the Class I railroads buying almost all of the new locomotives. The AAR maintains a listing, by state, of each railroad operating in the state. This includes all Class II and Class III railroads. This information is currently available at Locomotives within each of the classes can perform two different types of operations: line-haul and yard (or switch). Line-haul locomotives, which perform the line-haul operations, generally travel between distant locations, such as from one city to another. Yard locomotives, which perform yard operations, are primarily responsible for moving railcars within a particular railway yard. Following this introduction, Section 2 provides an overview of the recommended methodology, and Section 3 describes the recommended methods for calculating the emissions from various types of rail service based on generic or national operating characteristics. Information on converting from total hydrocarbons to other organic gases is provided in Appendix A, a sample inventory calculation is provided in Appendix B, and contact information is provided in Appendix C. ### 1 The Class I railroads operating in the United States are The Burlington Northern Santa Fe Railway (BNSF), CSX Transportation (CSXT), Grand Trunk Corporation (GTC), Kansas City Southern Railway (KCS), Norfolk Southern Consolidated Subsidiary Railways (NS), Soo Line Railroad (SOO), and Union Pacific Railroad (UP). Grand Trunk Corporation, which is a subsidiary of Canadian National, includes the Illinois Central and other railroads. The Soo Line is a subsidiary of Canadian Pacific Railway. -2-
6 2. OVERVIEW OF RECOMMENDED INVENTORY METHODOLOGY Four steps are necessary in order to assess locomotive emissions within an inventory area: 1. Railroad operations are separated into three distinct categories: (1) Class I - line-haul, (2) Class II and Class III line-haul, and (3) yard. 2. Separate information is obtained for each railroad operating in the inventory area. 3. Emissions for each pollutant are calculated for each railroad operating in the area. Each railroad may have two kinds of emissions: line-haul and yard. (Some small railroads that only operate in a rail yard will not have line-haul emissions.) 4. The total locomotive emissions in the inventory area are the sum of the line-haul and the yard emissions for each railroad operating in the inventory area. 1 The methods described here are based on annual inventories and annual data. Developing inventories for shorter time periods is straightforward because railroad traffic is relatively constant throughout the year and, therefore, less than annual calculations can be done by simple apportionment. The recommended methods described in Section 3 are based on a national locomotive fleet mix and average fuel consumption figures, with possible adjustments for local conditions of grade and train type. ### 1 The agency preparing the inventory can choose to sum both yard and line-haul emissions first, getting a total emissions number for each railroad. Alternatively, the agency can sum all the line-haul and all the yard emissions separately to get a measure of how much the two kinds of operations contributes to overall emissions in the area. -3-
7 3. RECOMMENDED METHODS The recommended methods for each of the three categories, as follows: Class I line-haul, Class II and Class III line-haul, and yard, are discussed separately below. Class I Line-Haul Locomotives For Class I line-haul locomotives, emissions are calculated by multiplying the amount of fuel consumed in the inventory area by the appropriate emission factors for each species. The following calculation is performed for each railroad and each species of interest. The results for each railroad are then summed to obtain the total Class I railroad emissions in the inventory area. The basic equation, with conversion factors, is given below. Railroad Annual Railroad Emission Factor ton Line Haul Emissions 1 fuel use pounds per 2000 lb Tons / year gallons / year thousand gallons thousand gallons 1000 gallons The two conversion factors can be combined to give the working equation shown below. Annual Railroad Emission Factor fuel use pounds per Railroad gallons / year thousand gallons Line Haul Emissions 2,000,000 Tons/ year [1] Class I Line-Haul Locomotives Fuel Consumption - If Class I line-haul locomotives traveled only within the inventory area, fuel consumption could be determined directly from the amount of fuel dispensed into the units. However, these line-haul locomotives travel predominantly interstate. Hence, they do not necessarily burn the fuel in the same location where the fuel was pumped, making it impossible to determine fuel consumption in the area of interest from information on fuel dispensed. -4-
8 In order to determine fuel consumption in the inventory area, it is necessary to allocate the total amount of fuel consumed for individual Class I railroads to the inventory area. This is done by dividing the traffic density (expressed in Gross Ton Miles, or GTM) for each Class I railroad track segment within the inventory area by the system-wide fuel consumption index (expressed in Gross Ton Miles per gallon or GTM/gal) for that railroad. 1 This process is repeated for each railroad. Railroad Traffic in Inventory Annual Railroad Area ( gross ton miles ) fuel use Railroad Fuel Consumption Index gallons / year ( gross ton miles per gallon ) [2] In any given area, there will be only a few active Class I railroads, and the railroad company staff should be able to perform this step and provide the amount of fuel consumed within the inventory area on request. In addition, this guidance includes a detailed explanation of how this step is performed based on published data and information that is available from the Surface Transportation Board for each railroad. (See the contact information in Appendix C for details on obtaining this information.) The inventory area traffic measure and the fuel consumption index are described separately below. Traffic Density - For every track segment within a state, each Class I railroad maintains information on traffic density (GTM), length (miles), direction, and geographic location. Therefore, it is possible to calculate the traffic density for an inventory area by summing the traffic densities for each track segment or portion thereof within the inventory area. This information can be obtained, for each area, either directly from the individual railroads or from the Association of American Railroads in Washington, D.C. (See specific contact information for the AAR in Appendix C.) The information should contain enough detail so that track segments or portions thereof can be assigned to the inventory area. However, if the agency is unable to perform this task, it may become necessary to obtain assistance from the Class I railroad in order to determine where the inventory area boundary intersects the track segment. (See contact information for Class I railroads in Appendix C.) The gross ton mile information may be supplied in one of two ways: (1) without the weight of the locomotives included, or (2) with the weight of the locomotives included. This distinction is important when calculating the fuel consumption index. 2 1 Some railroads may use other measures for these data. For example, UP reports data as a burn rate in gallons of fuel per thousand ton miles. For UP, the fuel consumption index used in this report would be computed by dividing 1000 by the burn rate reported by UP. 2 There are three items whose weight can be included in the measure of ton-miles: the freight, the railcars, and the locomotives. If the freight only is included, the measure is called net ton miles. The term gross ton miles is used for both the freight plus the railcars and the sum of all three (freight, railcars and locomotives). Thus, it is necessary to have different calculations of the fuel index, in gross ton miles per gallon, if the weight of the locomotives is or is not included in this measure for a particular railroad. -5-
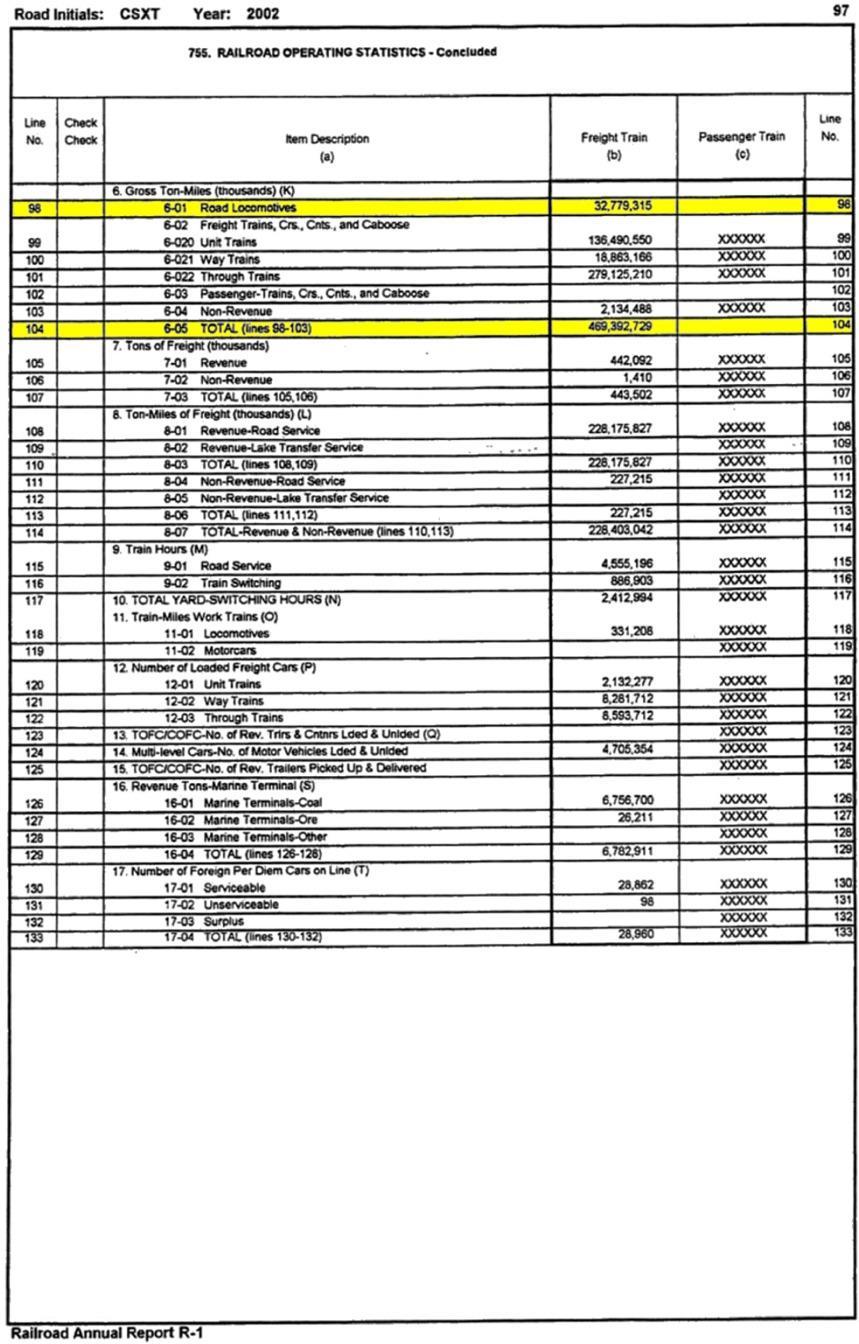
9 Fuel Consumption Index - The fuel consumption index (GTM/gal), for each Class I railroad within an inventory area, should be calculated by dividing the system-wide gross ton miles (GTM) by the system-wide fuel consumption (gal). This is shown in the following formula: Railroad Fuel Consumption Index ( gross ton miles per gallon ) Railroad Systemwide GrossTon Miles Railroad Systemwide Consumption ( gallons Fuel ) [3] Each Class I railroad is required to report these statistics each year to the STB in an annual report entitled R-1. Data in the R-1 report can be used to compute the fuel consumption index. (See Appendix C for information on obtaining the necessary schedules from the R-1 reports.) The approach used for this calculation depends on the way in which the traffic data are presented for the inventory area. The information on schedules 750 and 755 can be used, as described below and outlined in Table 1, to obtain the data necessary to compute the fuel consumption index, depending on the measure of gross ton miles, for each Class I railroad in the inventory area. A sample calculation is provided in Appendix B. Table 1 R-1 Report Data For Fuel Consumption Index Calculation Ton-mile measure Source of Data If weight of locomotives is included Fuel consumption Schedule 750, Line 1 Gross ton miles with locomotives Schedule 755, Line 104 If weight of locomotives is not included Ton-miles with locomotives Schedule 755, Line 98 Ton-miles without locomotives Subtract Schedule 755 Line 98 from Schedule 755 Line, 104 The appropriate measure of ton-miles is then divided into the fuel consumption to get the fuel consumption index. Expressed as an equation, this index is computed as follows if the weight of locomotives is included in the inventory gross ton miles reported by the railroad. -6-
10 Schedule 755 Railroad Fuel Consumption Index Line 104 Including Locomotives Schedule 750 ( gross ton miles per gallon ) Line 1 [4] The following equation is used if the weight of locomotives is not included. Schedule 755 Schedule 755 Railroad Fuel Consumption Index Line 104 Line 98 NOT Including Locomotives [5] Schedule 750 ( gross ton miles per gallon ) Line 1 An example of the R-1 schedules and the corresponding calculation is shown in Appendix B. Adjusted Fuel Consumption Index - The actual fuel use in a local inventory area may be different from the system-wide average. There are two adjustment factors one for grade and one for train type that can be used to adjust the fuel consumption index computed above to account for these factors in a local area. The correction for grade operation is based on two factors: the severity of the grade and the amount of operation on the grade. Although the final correction factor is quantitative, the inputs for determining the grade severity and the fraction of operation on the grade are qualitative, with some numerical guidance for the amount of operation on grade. Each of these factors has three levels, where the lowest level has no correction. (The correction factor is one.) Grade severity is a measure of the steepness of the grade and has three levels. The user should select one of the levels from the list below. 0 No significant grades in region or some grades that are generally slight. 1 Grades are significant part of operations in region. 2 Grade in region is exemplified by Cascade Range, Rocky Mountains, or Sierra Nevada. The amount of operation on grade is also a qualitative measure with some guidance numbers attached. The user should select one of the operation levels from the list below. 0 No significant operation on grades or some small fraction of operation on grades. -7-
11 1 A small but important part of operation in the region is on grades. This might correspond to about 15% the ton-miles being on grade. 2 Significant operation on grades in the region. This might correspond to about 30% of the operation being on grades in the region. The determination of the grade severity and the amount of operation on grades should be done in consultation with the railroads. If the railroad cannot provide this estimate, the planning agency may make its own individual estimate, based on any information available about railroad grades and amounts of operation on the grades. If there is no clear evidence for determining the amount and significance of grade operations, this factor should not be applied. Once the severity and amount of grade operation is determined, by selecting an index for 0 to 2 for both severity and amount of operation, the grade correction factor can be found from Table 2. The system-wide fuel consumption index should be multiplied by the factor shown in Table 2. Table 2 Adjustment Factors for Operation on Grade Grade Grade Operation Fraction Index In Row Below Severity Operation = 0 Operation =1 Operation = 2 Severity = Severity = Severity = The second correction factor deals with the fraction of ton-miles in the region that are operated by bulk freight, typically coal trains. These trains have a much greater amount of ton-miles per gallon. If the fraction of bulk freight were the same throughout the rail system, no correction for the nature of regional freight would be necessary. However, the fraction of bulk freight in a given region could be greater or less than the system-wide average. Such a variation in the fraction of bulk freight would cause an increase or decrease, respectively, in the ton-miles per gallon for the region as compared to the system-wide average. Table 3 provides a correction factor that can be used to account for differences in the fraction of ton-miles attributed to bulk freight in a local region. This table provides five different descriptions to characterize differences between the bulk freight fraction in a region and the system-wide bulk freight fraction. Class I Line-Haul Emission Factors - Because of changing emission standards for locomotives, the fleet average emission factors will be a function of calendar year. The emission factors to be used for line-haul locomotives, in a particular inventory year are shown in Table
12 Table 3 Correction Factors For Regional Differences In The Fraction Of Ton Miles Attributed To Bulk Freight Correction Factor Description of region 0.9 The region has almost no bulk freight The region s fraction of bulk freight is well below the system average. 1.0 The region s fraction of bulk freight is about the same as the system average The region s fraction of bulk freight is well above the system average The region has exceptionally large fractions of bulk freight as compared to the system average. Table 4 Class I Line-haul emission factors Inventory Factors (pounds per thousand gallons) Year HC CO NOx PM The emission factor for SO2 depends on the sulfur content of the fuel. There are no requirements for the sulfur content of fuel burned in locomotive engines. Railroads purchase fuel that meets the specifications for nonroad diesel fuel. The average sulfur content of nonroad diesel fuel is 2700 parts per million sulfur by weight (ppmw S); however, some suppliers will provide diesel fuels with lower sulfur contents. Starting in 2007, fuels burned in locomotive and marine diesel engines will have to meet a standard -9-
13 of 500 ppmw sulfur. This is the current EPA requirement for highway diesel fuel. Such fuel has an average sulfur content of 370 ppmw sulfur. Table 5 gives the projected emission factors for SO2, and the sulfur content of the fuel on which these emission factors are based. Table 5 SO2 Emission Factors (lbs/1000 Gallons) and Fuel Sulfur Content (ppmw S) Used For These Factors Year Factor ppmw S The sulfur content for 2007 is an average for the year in which the new standard is phased in. If an inventory is prepared on other than an annual basis, the figure should be adjusted for sulfur content. The emission factors in Table 5 can be used directly. However, if the railroad whose inventory is being prepared is able to supply an average sulfur content of its fuel use in the area, the emission factor may be adjusted as follows. Fuel Sulfur Content SO2 Emission SO2 Emission from Railroad Factor Used for Factor Fuel Sulfur Content Inventory Calculatio ns from table 3 from table 3 [6] If the railroad supplies the fuel sulfur content in another set of units, a unit conversion to ppmw is required before applying equation [6]. -10-
14 Class II and Class III Line-Haul Locomotives Similar to the recommended method for Class I line-haul locomotives, emissions from Class II and III line-haul locomotives are calculated by multiplying the amount of fuel consumed in the inventory area by the appropriate emission factors, using equation [7]. However, the method used for determining the fuel consumption is different for these locomotives. Annual Railroad Emission Factor fuel use pounds per Inventory Area gallons / year thousand gallons Railroad Emissions 2,000,000 Tons/ year [7] Class II and Class III Line-haul Locomotives Fuel Consumption - Since Class II and III railroad companies are not required to file R-1 reports, annual fuel consumption should be obtained directly through interviews or letters with each Class II and III railroad operating within the inventory area. This approach is sufficient because, unlike Class I line-haul operations, most Class II and III line-haul travel is predominantly within a relatively small geographic area. Therefore, in most instances, it is unnecessary to apportion system fuel use to an inventory area, because the fuel is consumed by the locomotives within the inventory area. For the small number of Class II and III railroads operating outside the inventory area, however, EPA recommends simply allocating the fuel consumption by track length or track density (GTM). Each Class II and III railroad can supply both track length and track density information. So, the percentage of fuel consumed is based on the percentage of track length or track density within the inventory area. If, for example, 30 percent of the track length, for a particular railroad, runs within the inventory area, then, in order to apportion the total fuel consumed in the inventory area, multiply the total fuel consumption for the railroad by Class II and Class III Line-Haul Locomotive Emission Factors - Class II and Class III railroads usually purchase their locomotives as used locomotives from Class I railroads. They generally do not purchase new line-haul locomotives, which are required to meet the standards for such locomotives in 2002 and later. In addition, they do not engage in a significant amount of locomotive rebuilding. The emission factors for these locomotives will therefore be significantly different from those of Class I railroads in future years. The emission factors for Class II and Class III line-haul locomotives have been developed by assuming that these railroads will have some small fraction of rebuilt locomotives. This may come from either rebuilds by the Class II or Class III railroads or from purchases of locomotives that were previously rebuilt by Class I railroads. -11-
15 Table 6 shows the emission factors for line-haul operations for Class II and Class III locomotives. This table contains the data that were placed in two tables for Class I locomotives. All the emission factors are shown as well as the fuel sulfur content on which the SO2 emission factor is based. Table 6 Class II and Class III Line-Haul Emission Factors Inventory Emission Factors (pounds per thousand gallons) Fuel S Year HC CO NOx PM SO 2 ppmw Yard Operations There are two possible methods for determining the locomotive emissions from yard operations. These methods are the same for all classes of railroads. The first method can be applied if the railroad can supply the total amount of fuel used for yard operations. In this case the fuel use, in thousand gallons per year, can be multiplied by the yard emission factors in Table 7 to determine the total emissions, using the equation below. Annual Railroad Yard Emission Factor fuel use for yard operations pounds per Inventory Area gallons / year thousand gallons Yard Emissions 2,000,000 Tons / year [8] -12-
16 The SO2 emission factors for yard operations shown in Table 7 is seen to be the same as that for line-haul operations. This is because all the sulfur in the fuel is assumed to be converted to SO2 during combustion. If the railroad can supply data on the actual average sulfur content of the fuel used, the emission factors for SO2 can be adjusted in the same manner as recommended for line-haul locomotives, using equation [6]. Inventory Year Table 7 Yard Emission Factors For All Railroad Classes Emission Factors (pounds per thousand gallons) HC CO NOx PM SO 2 Fuel S ppmw If the fuel used in yard locomotives is not available, the yard emissions may be determined from equation [9] by determining the number of locomotives used in yard operations and using the data on annual emissions per yard locomotive from Table 8. Yard Emissions for Number of Annual Emissions per Yard All Classes ( tons / year ) Yard Locomotives Locomotive ( tons / year ) [9] Equation [9] gives the annual emissions for one rail yard. The emissions for all rail yards are computed in a similar manner and summed to give the total yard emissions. (Alternatively, the emissions for one rail yard can be combined with the line-haul emissions of the railroad operating the yard to get the total emissions for each railroad.) Since yard locomotives operate within the boundaries of a railway yard, it is possible to determine the number of locomotives operating within an inventory area through -13-
17 interviews with the railway yard managers, who keep accurate records of yard locomotive operations. If this first approach proves unproductive, the number of yard locomotives can be determined by actually counting the units operating in each railway yard during a day. This is sufficient because the number of yard locomotives in operation each day remains relatively constant throughout the year. Switch yard engines are sent to railroad maintenance facilities according to regular schedules. When a particular yard locomotive is away getting maintenance or repair, the yard will replace the unit with another of approximately the same horsepower. Inventory Year Table 8 Annual Emissions per Yard Locomotive Emissions In Tons Per Year Per Yard Locomotive HC CO NOx PM SO 2 Fuel S ppmw The emission levels in Table 8 were calculated as follows. In the previous guidance, 1 EPA estimated that the average yard engine consumes 82,490 gallons of fuel per year. 2 1 U. S. Environmental Protection Agency, Procedures for Emission Inventory Preparation Volume IV Mobile Sources, Office of Mobile Sources, EPA420-R , Chapter 6, December The following text is taken from the previous EPA guidance: EPA estimated that, based on a reasonable activity or duty cycle and typical fuel consumption rates, the average yard engine consumes 228 gallons of fuel per day. Since yard locomotives can be assumed to operate 365 days a year (this assumes that when a yard engine is taken in for repairs it is replaced during that period), the average yard engine consumes 82,490 (226 X 365) gallons of fuel per year. -14-
18 The annual emissions per yard locomotive in Table 8 were determined by multiplying this fuel consumption estimate by each emission factor in Table 7. As in the previous calculations, a more accurate estimate of SO2 emissions can be obtained if the actual fuel sulfur content used by the railroad is known. If this fuel sulfur content is known, the emissions per yard locomotive shown in Table 8 can be adjusted as follows. Fuel Sulfur Content Tons of SO2 per Yard Tons of SO2 per from Railroad LocomotiveUsed for Yard Locomotive Fuel Sulfur Content Inventory Calculatio ns from table 8 from table 8 [10] ### -15-
19 Appendix A Converting from Total Hydrocarbons (THC) to Other Measures of Organic Gases The emission factors used for locomotive engines are based on flame-ionization measurements of total hydrocarbons. These can be converted to other measures used for organic emissions that are used for inventories and regulatory compliance using the factors in Table A-1. These factors are taken from an EPA report giving conversion factors for nonroad engines. The report acknowledges that the database for the conversion factor is sparse with only three on-highway engines from the 1970s and 1980s being used to develop these factors. 1 Table A-1 Conversion Factors for Organic Gas Measures (Multiply total hydrocarbons, THC, by the conversion factors shown to get the other hydrocarbon measures) Hydrocarbon measure Abbreviation Conversion Factor Non-methane organic gases NMOG Volatile organic compounds VOC Total organic gases TOG Non-methane hydrocarbons NMHC U.S. Environmental Projection Agency, Conversion Factors for Hydrocarbon Emission Components, Office of Transportation and Air Quality, EPA420-P , May A-1
20 Appendix B Sample Calculations The data from Class I railroad R-1 reports and the fuel index calculations required for inventory calculations are shown in Table B-1. Copies of example R-1 report sections employed in the CSXT calculations are provided after the table, with highlighting added to note the rows containing data used in the calculations shown in Table B-1. These calculations would not be required if the railroad supplied the fuel index in gross ton miles per gallon. The data in Table B-1 show the calculation of the fuel index in two ways, including and not including locomotives. The actual calculation would be done only one way to give a measure that is consistent with the gross-ton mile data supplied by the railroad. Note that the ton-mile data are recorded in the R-1 report as thousands of ton-miles. These data must be multiplied by 1,000 before dividing by the fuel use. A sample calculation of the annual fuel consumption from an actual emission inventory 1 is quoted below. (Although UP is cited in the third sentence, the data being discussed here are from BNSF; UP data are discussed in a later quote.) Class I line haul locomotives carry mainly interstate freight and most of the passenger service. Emissions were calculated by multiplying the amount of fuel consumed by these locomotives in the inventory area by the appropriate emission factors (EPA, 1992, Table 8-1). UP provided 1999 Gross Tons (GT) and a Fuel Consumption Index (FCI) for all trains scheduled to operate in the nonattainment area of Maricopa County (Appendix 4-3). The following calculations show how the line haul locomotive emissions were obtained. BNSF provided a Fuel Consumption Index (FCI) of 734 GTM/gal. (GTM = Gross Ton Miles) 1999 Gallons of Diesel per Line Segment =[ GT x Length of segment (miles) ] / FCI 1999 Gallons of Diesel per Line Segment 37,570,000 gross tons 49.0 miles 734 gross ton miles per gallon 2,508,079 gallons year 1 Maricopa County Environmental Services Division, 1999 Periodic Ozone Emissions Inventory for the Maricopa County Nonattainment Area, Phoenix, AZ, November B-1
21 Title, units and column letter used in formulas Data Source or calculation formula Burlington Northern Santa Fe (BNSF) CSX Transportation (CSXT) Grand Trunk Central (GTC) Kansas City Southern (KCS) Norfolk Southern (NS) SOO Line (SOO) Union Pacific (UP) Fuel Use, Gallons (A) R-1 Schedule 750, line 1 Table B-1 Railroad Data from Surface Transportation Board R-1 Schedules for 2002 Thousands of Thousands of Locomotive Ton Ton miles without Miles Locomotives (C) (D) Thousands of Total Ton Miles (B) R-1 Schedule 755, line 104 R-1 Schedule 755, line 98 (B) (C) Ton-miles per gallon with locomotives (E) ( B) 1000 A ( ) Ton-miles per gallon without locomotives (F) ( D) 1000 ( A ) 1,091,248, ,862,994 82,638, ,224, ,107, ,392,729 32,779, ,613, ,013, ,578,305 6,286,640 98,291, ,256,604 37,563,933 3,358,570 34,205, ,678, ,281,203 30,492, ,788, ,198,000 45,426,616 3,002,702 42,423, ,176,963,998 1,085,700,525 86,966, ,734, B-2
22 Table B-2 States in Which Class I Railroads Operate Railroad Burlington Northern Santa Fe CSX Transportation Grand Trunk Corporation Kansas City Southern Norfolk Southern SOO Line Union Pacific Abbreviation BNSF CSXT GTC KCS NS SOO UP States in which railroads operate Alabama, Arizona, Arkansas, California, Colorado, Idaho, Illinois, Iowa, Kansas, Louisiana, Minnesota, Mississippi, Missouri, Montana, Nebraska, Nevada, New Mexico, North Dakota, Oklahoma, Oregon, South Dakota, Tennessee, Texas, Utah, Washington, Wisconsin, Wyoming Alabama, Connecticut, Delaware, District of Columbia, Florida, Georgia, Illinois, Indiana, Kentucky, Louisiana, Maryland, Massachusetts, Michigan, Mississippi, Missouri, New Jersey, New York, North Carolina, Ohio, Pennsylvania, South Carolina, Tennessee, Virginia, West Virginia Alabama, Illinois, Indiana, Iowa, Kentucky, Louisiana, Michigan, Minnesota, Mississippi, Ohio, Tennessee, Wisconsin Alabama, Arkansas, Illinois, Kansas, Louisiana, Mississippi, Missouri, Oklahoma, Tennessee, Texas Alabama, Delaware, District of Columbia, Florida, Georgia, Illinois, Indiana, Iowa, Kansas, Kentucky, Louisiana, Maryland, Michigan, Mississippi, Missouri, New Jersey, New York, North Carolina, Ohio, Pennsylvania, South Carolina, Tennessee, Virginia, West Virginia Illinois, Indiana, Kentucky, Michigan, Minnesota, South Dakota, Wisconsin Arizona, Arkansas, California, Colorado, Idaho, Illinois, Indiana, Iowa, Kansas, Louisiana, Minnesota, Missouri, Montana, Nebraska, Nevada, New Mexico, North Dakota, Oklahoma, Oregon, Tennessee, Texas, Utah, Washington, Wisconsin, Wyoming B-3
23 B-4
24 B-5
25 The inventory document then computes the line-haul emissions for BNSF by multiplying this annual fuel use by the emission factors. It then cites the data used for UP, the other railroad operating in the nonattainment area. The Union Pacific Railway Company (UP) determined fuel consumption and calculated emissions following the same method as described above. Traffic density data and fuel consumption index were provided by UP (Appendix 4-4). The 1999 fuel consumption as reported by UP for line haul locomotives in Maricopa County is calculated as follows: 1999 Gallons of Diesel per Line Segment 68,380,000 gross tons 413 miles 722 gross ton miles per gallon 39,114,875 gallons year The inventory document then computes the line-haul emissions for UP by multiplying the annual fuel use just computed by the emission factors. There were no Class II or Class III locomotives operating in the nonattainment area, so the only calculation remaining is for yard locomotives. UP verified that four yard locomotives operated in BNSF verified that twelve yard locomotives operated in Therefore, the total number of yard locomotives in Maricopa County is sixteen. Emission calculations for these sixteen yard locomotives are shown below. Emissions (lb/year) = (number of yard/switch locomotives) x (emission factor, lbs/yard locomotive) The final emissions calculations for this inventory are shown in the table below. VOC NOx CO Locomotive Type tons/yr tons/yr tons/yr Line haul, Class I , ,302.8 Line haul, Classes II and III Yard operations Totals: , ,361.8 B-6
26 Appendix C Contact Information Association of American Railroads Mr. Mike Rush mrush@ Surface Transportation Board R-1 Report Schedules 750 and 755 Ms. Arlene Jeffcoat, Records Officer Fax Although the STB maintains some portions of the R-1 forms available for download, the items required for the computation of the fuel index were not available on-line at the time this guidance was written. To get the necessary schedules (750 and 755) send a FAX, like the sample FAX on the next page to the STB requesting schedules 750 and 755 for each Class I railroad in your region. Class I railroads Burlington Northern Santa Fe (BNSF) No contact information provided CSX Transportation (CSXT) No contact information provided Grand Trunk Corporation (GTC) No contact information provided Kansas City Southern (KCS) No contact information provided Norfolk Southern (NS) Environmental Department Norfolk Southern Corporation 110 Franklin Road, S.E. Roanoke, VA ,981, ,981,4651 (fax) Attn: Gibson Barbee, P.E. gvbarbee@nscorp.com C-1
27 Soo Line (SOO) Canadian Pacific Railway Environmental Services Attn: Grete Bridgewater Tel: Union Pacific (UP) No contact information provided C-2
28 FAX Date: To: Arlene Jeffcoat Fax Phone: From: Fax Phone: Subject: Request for R-1 schedules Number of pages including this one: 1 Please send me copies of Schedules 750 and 755 from the R-1 forms for the following Class I railroads for calendar year. Burlington Northern Santa Fe CSX Transportation Grand Trunk Corporation Kansas City Southern Norfolk Southern Soo Line Union Pacific Please mail these to the following address: I understand that you will bill me at a cost of one dollar ($1) per page for these schedules. Please send the bill to address shown above. Please give me a call at if you have any questions about this request. C-3
Manufactured Home Shipments by Product Mix ( )
") Manufactured Home Shipments by Product Mix (1990-2014) Data Source: Institute for Building Technology and Safety (IBTS) * "Destination Pending" represents month-end finished home inventory at a plant.
Manufactured Home Shipments by Product Mix (1990-2014) Data Source: Institute for Building Technology and Safety (IBTS) * "Destination Pending" represents month-end finished home inventory at a plant.
TRAFFIC VOLUME TRENDS
 Page 1 U. S. Department Transportation Federal Highway Administration Office Highway Policy Information TRAFFIC VOLUME TRENDS September Travel on all roads and streets changed by +2.5 (5.8 billion vehicle
MMWR 1 Expanded Table 1. Persons living with diagnosed. Persons living with undiagnosed HIV infection
 MMWR 1 Expanded Table 1 Expanded Table 1. Estimated* number of persons aged 13 years with (diagnosed and undiagnosed), and percentage of those with diagnosed, by jurisdiction and year United States, 2008
RELATIVE COSTS OF DRIVING ELECTRIC AND GASOLINE VEHICLES
 SWT-2018-1 JANUARY 2018 RELATIVE COSTS OF DRIVING ELECTRIC AND GASOLINE VEHICLES IN THE INDIVIDUAL U.S. STATES MICHAEL SIVAK BRANDON SCHOETTLE SUSTAINABLE WORLDWIDE TRANSPORTATION RELATIVE COSTS OF DRIVING
TRAFFIC VOLUME TRENDS July 2002
 TRAFFIC VOLUME TRENDS July 2002 Travel on all roads and streets changed by +2.3 percent for July 2002 as compared to July 2001. Estimated Vehicle-Miles of Travel by Region - July 2002 - (in Billions) West
Monthly Biodiesel Production Report
 Monthly Biodiesel Production Report With data for June 2017 August 2017 Independent Statistics & Analysis www.eia.gov U.S. Department of Energy Washington, DC 20585 This report was prepared by the U.S.
2009 Migration Patterns traffic flow by state/province
 Interstate and Cross-Border 2009 Migration Patterns traffic flow by state/province Based on 71,474 Interstate Household Goods Moves from January 1, 2009 through December 31, 2009 UNITED STATES ALABAMA
2010 Migration Patterns traffic flow by state/province
 Interstate and Cross-Border 2010 Migration Patterns traffic flow by state/province Based on 74,541 Interstate Household Goods Moves from January 1, 2010 through December 31, 2010 UNITED STATES ALABAMA
Failing the Grade: School Bus Pollution & Children s Health. Patricia Monahan Union of Concerned Scientists Clean Cities Conference May 13, 2002
 Failing the Grade: School Bus Pollution & Children s Health Patricia Monahan Union of Concerned Scientists Clean Cities Conference May 13, 2002 Outline School bus/diesel pollution and children s health
STATE. State Sales Tax Rate (Does not include local taxes) Credit allowed by Florida for tax paid in another state
 Credit allowed by Florida for tax paid in another state") tax paid in another state or isolated sales ALABAMA 2% ALASKA ARIZONA 5.6% ARKANSAS 6.5% CALIFORNIA 7.25% COLORADO 2.9% CONNECTICUT DELAWARE DISTRICT OF COLUMBIA GEORGIA 6.35% on motor vehicles with a
tax paid in another state or isolated sales ALABAMA 2% ALASKA ARIZONA 5.6% ARKANSAS 6.5% CALIFORNIA 7.25% COLORADO 2.9% CONNECTICUT DELAWARE DISTRICT OF COLUMBIA GEORGIA 6.35% on motor vehicles with a
ANNUAL FINANCIAL PROFILE OF AMERICA S FRANCHISED NEW-TRUCK DEALERSHIPS
 217 ANNUAL FINANCIAL PROFILE OF AMERICA S FRANCHISED NEW-TRUCK DEALERSHIPS Overview For 217, ATD Data our annual financial profile of franchised new medium- and heavyduty truck dealerships shows the following:
Honda Accord theft losses an update
 Highway Loss Data Institute Bulletin Vol. 34, No. 20 : September 2017 Honda Accord theft losses an update Executive Summary Thefts of tires and rims have become a significant problem for some vehicles.
DEAL ER DATAVI EW. Digital Marketing Index. June 2017
 DEAL ER DATAVI EW Digital Marketing Index June 2017 DATA DRIVES STRATEGY. Dealer DataView is a monthly automotive digital marketing index, based on Dealer.com s leading proprietary data, research and analytics.
8,975 7,927 6,552 6,764
 y = 0.1493x 4-23842x 3 + 1E+09x 2-4E+13x + 4E+17 R 2 = 0.9977 27,717 21,449 17,855 13,222 11,054 10,053 6/28/2009 6/24/2009 6/22/2009 6/20/2009 6/18/2009 6/16/2009 6/14/2009 6/8/2009 6/6/2009 6/4/2009
ESTIMATED NUMBER OF NEW CANCER CASES AND DEATHS BY STATE All Sites Brain and ONS Female Breast Uterine Cervix STATE Cases Deaths Cases Deaths
 All Sites Brain and ONS Female Breast Uterine Cervix Alabama 24,090 9,900 310 200 2,970 700 190 80 Alaska 2,530 830 * * 370 60 * * Arizona 27,600 10,260 470 280 3,470 740 210 80 Arkansas 14,800 6,230 200
Traffic Safety Facts. Alcohol Data. Alcohol-Related Crashes and Fatalities
 Traffic Safety Facts 2005 Data Alcohol There were 16,885 alcohol-related fatalities in 2005 39 percent of the total traffic fatalities for the year. Alcohol-Related Crashes and Fatalities DOT HS 810 616
DEAL ER DATAVI EW. Digital Marketing Index October 2017
 DEAL ER DATAVI EW Digital Marketing Index October 2017 DATA DRIVES STRATEGY. Dealer DataView is a monthly automotive digital marketing index, based on Dealer.com s proprietary data, research and analytics.
DEAL ER DATAVI EW. Digital Marketing Index August 2018
 DEAL ER DATAVI EW Digital Marketing Index August 2018 DATA DRIVES STRATEGY. The DataView is a monthly automotive digital marketing index, based on Dealer.com s proprietary data, research and analytics.
ESTIMATED NUMBER OF NEW CANCER CASES AND DEATHS BY STATE All Sites Brain & ONS Female Breast Uterine Cervix STATE Cases Deaths Cases Deaths
 ESTIMATED NUMBER OF NEW CANCER CASES AND DEATHS BY STATE -- 2019 All Sites Brain & ONS Female Breast Uterine Cervix Alabama 28,950 10,630 370 350 4,240 690 240 110 Alaska 3,090 1,120 50 * 470 70 * * Arizona
Introduction. Julie C. DeFalco Policy Analyst 125.
 Introduction The federal Corporate Average Fuel Economy (CAFE) standards were originally imposed in the mid-1970s as a way to save oil. They turned out to be an incredibly expensive and ineffective way
DOT HS October 2011
 TRAFFIC SAFETY FACTS 2009 Data DOT HS 811 389 October 2011 Motorcycles Definitions often vary across publications with respect to individuals on motorcycles. For this document, the following terms will
DOT HS July 2012
 TRAFFIC SAFETY FACTS 2010 Data DOT HS 811 639 July 2012 Motorcycles In 2010, 4,502 motorcyclists were killed a slight increase from the 4,469 motorcyclists killed in 2009. There were 82,000 motorcyclists
Traffic Safety Facts 1996
 U.S. Department of Transportation National Highway Traffic Safety Administration Traffic Safety Facts 1996 Motorcycles In 1996, 2,160 motorcyclists were killed and an additional 56,000 were injured in
Characteristics of Minimum Wage Workers: Bureau of Labor Statistics U.S. Department of Labor
 Characteristics of Minimum Wage Workers: 2012 Bureau of Labor Statistics U.S. Department of Labor February 26, 2013 In 2012, 75.3 million in the United States age 16 and over were paid at, representing
2013 Migration Patterns traffic flow by state/province
 Interstate and Cross-Border 2013 Migration Patterns traffic flow by state/province Based on 77,308 Interstate Household Goods Moves from January 1, 2013 through December 31, 2013 YUKON TERRITORY 0 0 BC
Traffic Safety Facts 2000
 DOT HS 809 326 U.S. Department of Transportation National Highway Traffic Safety Administration Traffic Safety Facts 2000 Motorcycles In 2000, 2,862 motorcyclists were killed and an additional 58,000 were
DEAL ER DATAVI EW. Digital Marketing Index. August 2017
 DEAL ER DATAVI EW Digital Marketing Index August 2017 DATA DRIVES STRATEGY. Dealer DataView is a monthly automotive digital marketing index, based on Dealer.com s leading proprietary data, research and
THE EFFECTS OF RAISING SPEED LIMITS ON MOTOR VEHICLE EMISSIONS
 THE EFFECTS OF RAISING SPEED LIMITS ON MOTOR VEHICLE EMISSIONS Prepared for: Office of Policy Planning and Evaluation Energy and Transportation Sectors Division U.S. Environmental Protection Agency Washington,
SEP 2016 JUL 2016 JUN 2016 AUG 2016 HOEP*
 Ontario Energy Report Q1 Electricity January March Electricity Prices Commodity Commodity cost comprises of two components, the wholesale price (the Hourly Ontario Energy Price) and the Global Adjustment.
2016 Migration Patterns traffic flow by state/province
 Interstate and Cross-Border 2016 Migration Patterns traffic flow by state/province Based on 75,427 Interstate Household Goods Moves from January 1, 2016 through December 15, 2016 NL 8 13 YUKON TERRITORY
SPECIFICATION SHEET: CMV_C1C2 2016beta Platform
 March 7, 2019 SPECIFICATION SHEET: CMV_C1C2 2016beta Platform Description: Category 1 and 2 Commercial Marine Vessel (cmv_c1c2) emissions, for simulating 2016 air quality 1. Executive Summary 1 2. Introduction
ANNUAL FINANCIAL PROFILE OF AMERICA S FRANCHISED NEW-CAR DEALERSHIPS
 ANNUAL FINANCIAL PROFILE OF AMERICA S FRANCHISED NEW-CAR DEALERSHIPS 2014 www./nadadata Overview NADA Data 2014 the annual financial profile of America s franchised new-car dealerships shows a robust and
Publisher's Sworn Statement
 Publisher's Sworn Statement Security Systems News provides comprehensive access to the physical security market. Its flagship monthly publication is the newspaper of record for the security industry. In
RETURN ON INVESTMENT LIQUIFIED NATURAL GAS PIVOTAL LNG TRUCK MARKET LNG TO DIESEL COMPARISON
 RETURN ON INVESTMENT LIQUIFIED NATURAL GAS PIVOTAL LNG TRUCK MARKET LNG TO DIESEL COMPARISON Year 1 Year 2 Year 3 Year 4 Year 5 Year 6 Year 7 Year 8 Year 9 Year 10 RETAIL BREAK EVEN AND IRR EXAMPLE FOR
EPA REGULATORY UPDATE PEI Convention at the NACS Show October 8, 2018 Las Vegas, NV
 EPA REGULATORY UPDATE 2018 PEI Convention at the NACS Show October 8, 2018 Las Vegas, NV 1 Periodic Operations and Maintenance Walkthrough Inspections - beginning no later than October 13, 2018 (40 CFR
MAGAZINE Publisher s Statement 6 months ended December 31, 2014 Subject to Audit
 MAGAZINE Publisher s Statement 6 months ended December 31, 2014 Subject to Audit Field Served: The 164-year old monthly journal of politics, economics, society, travel, culture and nature, as well as essays
Statement before the New Hampshire House Transportation Committee. Research on primary-enforcement safety belt use laws
 Statement before the New Hampshire House Transportation Committee Research on primary-enforcement safety belt use laws Jessica B. Cicchino, Ph.D. Insurance Institute for Highway Safety The Insurance Institute
State Laws Impacting Altered-Height Vehicles
 The following document is a collection of available state-specific vehicle height statutes and regulations. A standard system for regulating vehicle and frame height does not exist among the states, so
DRAFT. Arizona. Arkansas Connecticut. District of Columbia Hawaii Kansas. Delaware. Idaho Kentucky. Illinois Louisiana Minnesota Montana.
 Company name: * Website: * Name of company CEO/president/owner: * City of primary company headquarters: * State or territory of primary company headquarters: * Year company was founded: * Number of employees:
IGNITION INTERLOCK MANUFACTURER ORIGINAL AGREEMENT
 TRAFFIC SAFETY DIVISION APPLICATION FOR IGNITION INTERLOCK MANUFACTURER ORIGINAL AGREEMENT INSTRUCTIONS FOR COMPLETING THIS APPLICATION Before you begin working on this application, please go to; http://transportation.unm.edu/licensing/rules/
Tracking New Coal-Fired Power Plants. Coal s Resurgence in Electric Power Generation
 Tracking New Coal-Fired Power Plants Coal s Resurgence in Electric Power Generation February 24, 2004 Tracking New Coal-Fired Power Plants This information package is intended to provide an overview of
ANNUAL FINANCIAL PROFILE OF AMERICA S FRANCHISED NEW-CAR DEALERSHIPS
 2015 ANNUAL FINANCIAL PROFILE OF AMERICA S FRANCHISED NEW-CAR DEALERSHIPS NATIONAL AUTOMOBILE DEALERS ASSOCIATION Overview Steven Szakaly Chief Economist, NADA Patrick Manzi Senior Economist, NADA NADA
GoToBermuda.com. Q3 Arrivals and Statistics at September 30 th 2015
 Q3 Arrivals and Statistics at September 30 th 2015 1 Q3 Total Vacation Visitor Arrivals Q3 Arrivals 2014 2015 YTD 2014 YTD 2015 Air - Vacation 54,305 54,473 0.31% 168 117,639 116,700-0.80% (939) Cruise
Snow Removal Laws December 2010
 Snow Removal Laws December 2010 State Law Citations Alabama No specific laws. Citations may be issued if snow or ice accumulation obscures vision. Alaska Special regulations applies to all vehicles.: Public
Publisher's Sworn Statement
 Publisher's Sworn Statement FDMC is published monthly and is dedicated to providing the best practices in woodworking, technology and business to the people who manufacture furniture, cabinets, millwork
Secretary's Statistical Report Quarterly
 Date Sent: May 6, 200 Submitted by: G ALEXANDER BRYANT, SECRETARY ORGANIZATION ES COMPANIES NORTH AMERICAN DIVISION - Military Church ATLANTIC UNION CONFERENCE CANADA, SDA IN COLUMBIA UNION CONFERENCE
Energy, Economic. Environmental Indicators
 Energy, Economic and AUGUST, 2018 All U.S. States & Select Extra Graphs Contents Purpose / Acknowledgements Context and Data Sources Graphs: USA RGGI States (Regional Greenhouse Gas Initiative participating
ANNUAL FINANCIAL PROFILE OF AMERICA S FRANCHISED NEW-CAR DEALERSHIPS
 2017 ANNUAL FINANCIAL PROFILE OF AMERICA S FRANCHISED NEW-CAR DEALERSHIPS NATIONAL AUTOMOBILE DEALERS ASSOCIATION Overview This latest NADA Data, our comprehensive financial profile of new-car dealerships,
Results from the Auto Laundry News. Detailing Survey
 Detail Survey Cover:Detail Survey Cover T H E V O I C E 12/19/12 O F 12:23 PM T H E Page 27 C A R C A R E I N D U S T R Y Results from the Auto Laundry News 2013 Detailing Survey Results From The Auto
January * Kansas Stats/ Rankings. * Accident Stats
 KDOT Quick Facts January 2012 * Kansas Stats/ Rankings * CTP * Personnel * Revenue * Taxes * Accident Stats Table of Contents Kansas Public Road Miles and Vehicle Miles of Travel - Percent by Jurisdiction...
Provided by: Marshall & Sterling, Inc. Cellphone Use While Driving Laws by State
 Provided by: Marshall & Sterling, Inc. Cellphone Use While Driving Laws by State State H-held Young Bus Texting Alabama 16-year-old ; 17- year-old who have held an license for fewer than 6 months Alaska
Characteristics of Minimum Wage Workers: 2011
 Cornell University ILR School DigitalCommons@ILR Federal Publications Key Workplace Documents 3-2-2012 Characteristics of Minimum Wage Workers: 2011 Bureau of Labor Statistics Follow this and additional
Alaska (AK) Passenger vehicles, motorcycles 1959 and newer require a title ATV s, boats and snowmobiles do not require a title
 Passenger vehicles, motorcycles 1959 and newer require a title ATV s, boats and snowmobiles do not require a title") Alabama (AL) Passenger vehicles 1975 and newer require a Motorcycles, mopeds and trailers 1975 and newer require a ATVs, snowmobiles and boats do not require a Alaska (AK) Passenger vehicles, motorcycles
Alabama (AL) Passenger vehicles 1975 and newer require a Motorcycles, mopeds and trailers 1975 and newer require a ATVs, snowmobiles and boats do not require a Alaska (AK) Passenger vehicles, motorcycles
Optional State Sales Tax Tables
 Department of the Treasury Internal Revenue Service Publication 600 Cat. No. 46600Y Optional State Sales Tax Tables For use in preparing 2004 Returns You must keep your actual receipts showing gen- eral
*AUTO DEALER LICENSING REQUIREMENTS ALL 50 STATES*
 *AUTO DEALER LICENSING REQUIREMENTS ALL 50 STATES* ALABAMA DEALER LICENSE REQUIREMENTS Website: http://www.revenue.alabama.gov/licenses/mvdrl.html Ph: 334-242-9612 Per category: $10.00 Privilege License:
Summary findings. 1 Missouri has a greater population than any State ranked 1-9 in core group labor force participation.
 Labor in Missouri MSCDC Economic Report Series No. 9903 December 2000 By Professor John O. Ward, Chairman, UMKC Department of Economics Kurt V. Krueger, Department of Economics Graduate Student Michael
MERCEDES-BENZ TRANSMISSION VALVE BODY CONDUCTOR PLATE GENUINE FACTORY ORIGINAL 722.6xx MODELS
 MERCEDES-BENZ TRANSMISSION VALVE BODY CONDUCTOR PLATE GENUINE FACTORY ORIGINAL 722.6xx MODELS 1997-2007 1/23 C230C240C32C320C55CL500CL55CLK320CLK500CLK55E300.E320E420E4 MODELS Reasonable Deal I am present
U.S. Highway Attributes Relevant to Lane Tracking Raina Shah Christopher Nowakowski Paul Green
 Technical Report UMTRI-98-34 August, 1998 U.S. Highway Attributes Relevant to Lane Tracking Raina Shah Christopher Nowakowski Paul Green 1. Report No. UMTRI-98-34 Technical Report Documentation Page 2.
Quarterly Hogs and Pigs
 Quarterly Hogs and Pigs ISSN: 19-1921 Released December 28, 2012, by the National Agricultural Statistics Service (NASS), Agricultural Statistics Board, United s Department of Agriculture (USDA). United
State Safety Oversight Program
 State Safety Oversight Program Maps and Charts September 2015 Table of Contents States and Rail Fixed Guideway Public Transportation Systems (RFGPTS)... 3 RFGPTS by State and Mode... 4 RFGPTS Unlinked
2016 TOP SOLAR CONTRACTORS APPLICATION. Arizona. Arkansas Connecticut. District of Columbia Hawaii Kansas. Delaware
 Company Name: * Website: * Name of company CEO/President/Owner: * In which country is the primary company headquarters? * City of primary company headquarters: * State, province or territory of primary
Quarterly Hogs and Pigs
 Quarterly Hogs and Pigs ISSN: 9-92 Released December 20, 208, by the National Agricultural Statistics Service (NASS), Agricultural Statistics Board, United s Department of Agriculture (USDA). United s
TRAFFIC SAFETY FACTS Fatal Motor Vehicle Crashes: Overview. Research Note. DOT HS October 2017
 TRAFFIC SAFETY FACTS Research Note DOT HS 812 456 October 2017 2016 Fatal Motor Vehicle Crashes: Overview There were 37,461 people killed in crashes on U.S. roadways during 2016, an increase from 35,485
Tax Information. Federal Tax ID. Federal Tax ID: EPA Registration. EPA Registration #: California SG # California SG #:
 Tax Information Federal Tax ID NGL Crude Logistics LLC Debra Kelson 2900 N. Loop W., Suite 1250, Houston, TX 77092 Phone: 713-496-3900 Fax: 713-496-3902 Energytaxes@nglep.com Federal Tax ID: 47-0794813
FEB 2018 DEC 2017 JAN 2018 HOEP*
 Ontario Energy Report Q3 Electricity July September Electricity Prices Commodity Commodity cost comprises two components, the wholesale price (the Hourly Ontario Energy Price) and the Global Adjustment.
Results from the Auto Laundry News. Detailing Survey
 Detail Survey Cover:Detail Survey Cover T H E V O I C E 12/24/13 O F 10:45 AM T H E Page 33 C A R C A R E I N D U S T R Y Results from the Auto Laundry News 2014 Detailing Survey 2014 Detail Survey he
Snow Removal Laws November 2016
 Snow Removal Laws November 2016 State Law Citations Alabama No specific laws. Citations may be issued if snow or ice accumulation obscures vision. Alaska Special regulations applies to all vehicles: Public
U.S. Ethanol Production, Imports and Stocks
 U.S. Ethanol Production, Imports and Stocks Daniel O Brien and Mike Woolverton, Extension Agricultural Economists K-State Research and Extension January 12, 29 Trends in production, imports and ending
Snow Removal Laws September 2014
 Snow Removal Laws September 2014 State Law Citations Alabama No specific laws. Citations may be issued if snow or ice accumulation obscures vision. Alaska Special regulations applies to all vehicles.:
Sales of Fossil Fuels Produced from Federal and Indian Lands, FY 2003 through FY 2013
 Sales of Fossil Fuels Produced from Federal and Indian Lands, FY 2003 through FY 2013 June 2014 Independent Statistics & Analysis www.eia.gov U.S. Department of Energy Washington, DC 20585 This report
JOB CUT ANNOUNCEMENTS SURGE 45 PERCENT TO 76,835, HIGHEST MONTHLY TOTAL IN OVER THREE YEARS
 CONTACT Colleen Madden, Director of Public Relations Office: 312-422-5074 Mobile: 314-807-1568 colleenmadden@challengergray.com **EMBARGOED COPY** FOR RELEASE AT 7:30 A.M. ET, MARCH 7, 2019 JOB CUT ANNOUNCEMENTS
Wyoming Energy Projects
 Wyoming Energy Projects Wyoming Infrastructure Authority Spring Conference March 28-29, 2019 PacifiCorp Overview Two divisions Rocky Mountain Power and Pacific Power 5600 Employees 1.9 million electricity
ANNUAL FINANCIAL PROFILE OF AMERICA S FRANCHISED NEW-CAR DEALERSHIPS
 M I D Y E A R 2016 ANNUAL FINANCIAL PROFILE OF AMERICA S FRANCHISED NEW-CAR DEALERSHIPS NATIONAL AUTOMOBILE DEALERS ASSOCIATION Overview NADA Data now provides a biannual financial profile of new-car dealerships.
LexisNexis VIN Services VIN Only
 How to Read L e x i snexis VIN Services VIN Only LexisNexis shall not be liable for technical or editorial errors or omissions contained herein The information in this publication is subject to change
West's Ann.Cal.Vehicle Code 29004, Chain Strength. No More Slack Than For Proper Turning. Fifth-Wheel Kingpin Assemblies Exempt
 Alabama No provisions Found Alaska 13 AK ADC 04.275 Arizona Arkansas A.C.A. 27-35-111 * *When one (1) vehicle is towing another, there shall be an additional connection between the vehicles sufficient
Results from the Auto Laundry News. Detailing Survey
 Detail Survey Cover:Detail Survey Cover T H E V O I C E 12/17/14 O F 1:29 PM T H E Page 37 C A R C A R E I N D U S T R Y Results from the Auto Laundry News 2015 Detailing Survey 2015 Detail Survey he 2015
HALE STEEL PRICE LIST#0818 Effective August 1, 2018
 HALE STEEL PRICE LIST#0818 Effective August 1, 2018 TABLE OF CONTENTS Single Faced Flat Shelving... 4 Double Faced Flat Shelving... 5 Single Faced Integral Back Divider Shelving.... 6 Double Faced Integral
Driving with a Suspended License: Is It Worth It?
 Driving with a Suspended License: Is It Worth It? After being charged with a DUI the most common repercussion is the suspension of your driver s license. Having a suspended, or revoked, license presents
2008 Honda Civic EX. Vehicle Specifications. 4 Recalls. 22 events VIN: 2HGFG12888H Mid Range Car - Lower. Class 1.8L I4 MPI. Engine.
 2008 Honda Civic EX VIN: 2HGFG12888H563806 Vehicle Specs Accident Information 2008 Honda Civic EX 0 Records Found Title Information View Titles Vehicle Uses View Uses Events Odometer View Events 8 Records
Medium- and Heavy-Duty Vehicle Policies
 Medium- and Heavy-Duty Vehicle Policies This map contains state laws and regulations that affect medium- and heavy-duty vehicles. The policies include the following: Tax incentives: tax credits for vehicle
THE EMPLOYMENT AND ECONOMIC IMPACT OF THE VEHICLE SUPPLIER INDUSTRY IN THE U.S. mema.org DRIVING THE FUTURE 1
 DRIVING THE FUTURE THE EMPLOYMENT AND ECONOMIC IMPACT OF THE VEHICLE SUPPLIER INDUSTRY IN THE U.S. mema.org DRIVING THE FUTURE 1 THE LARGEST SECTOR OF MANUFACTURING JOBS IN THE UNITED STATES JUST GOT BIGGER
XTERRA AMERICA TOUR RULES FOR AMATEURS How to win an XTERRA Regional Championship
 XTERRA AMERICA TOUR RULES FOR AMATEURS How to win an XTERRA Regional Championship Step 1: Identify your XTERRA Region as determined by the location of your primary residence at the time of your first race
NASDPTS. National Survey
 NASDPTS (National Association of State Directors of Pupil Transportation Services) National Survey January 29, 2015 Whole Child Whole School Whole Community 1 Vehicle Definitions used for this Survey School
MOTORHOME REGULATIONS. length given)
") MOTORHOME REGULATIONS United States A l a b a m a Posted 45 13 6 102 65 Varies 20,000 lbs Class D Yes A l a s k a Posted 40 14 102 75 N/A N/A Class D Yes A r i zo n a Posted 45 13 6 96 65 Manuf. Stated
MOTORHOME REGULATIONS United States A l a b a m a Posted 45 13 6 102 65 Varies 20,000 lbs Class D Yes A l a s k a Posted 40 14 102 75 N/A N/A Class D Yes A r i zo n a Posted 45 13 6 96 65 Manuf. Stated
National Deaf-Blind Child Count Summary December 1, 2016 (Ages birth through 21*)
") Number Eligible to Receive Project Services on 12-1-2015 regardless of Part C or Part B status Total Number Served by State During Year Alabama 192 185 178 Alaska 22 17 17 Arizona 220 220 211 Arkansas
Number Eligible to Receive Project Services on 12-1-2015 regardless of Part C or Part B status Total Number Served by State During Year Alabama 192 185 178 Alaska 22 17 17 Arizona 220 220 211 Arkansas
National Deaf-Blind Child Count Summary December 1, 2017 (Ages birth through 21*)
") Number Eligible to Receive Project Services on 12-1-2017 regardless of Part C or Part B status Total Number Served by State During Year Alabama 198 196 188 Alaska 26 23 23 Arizona 236 216 211 Arkansas
Number Eligible to Receive Project Services on 12-1-2017 regardless of Part C or Part B status Total Number Served by State During Year Alabama 198 196 188 Alaska 26 23 23 Arizona 236 216 211 Arkansas
Shedding light on the nighttime driving risk
 Shedding on the nighttime driving risk An analysis of fatal crashes under dark conditions in the U.S., 1999-2008 Russell Henk, P.E., Senior Research Engineer Val Pezoldt, Research Scientist Bernie Fette,
Leveraging.05g NOx Certification & Volkswagen Status Update
 Leveraging.05g NOx Certification & Volkswagen Status Update AGENDA Building on a Strong Foundation What Does.05g NOx Mean to You and Your Customers? Leveraging Federal and State Incentive Programs Federal
Commercial Motor Vehicle Marking. And Identification Regulations
 Commercial Motor Vehicle Marking And Identification Regulations Federal Regulation Part 390.21 requires the following marking rules for all **qualifying Interstate for hire and private commercial motor
CYCLE SAFETY INFORMATION
 CYCLE SAFETY INFORMATION Government Relations Office 1235 S. Clark St., Ste. 600 Arlington, VA 22202 National Resource Office 2 Jenner, Ste. 150, Irvine, CA 92618-3806 www.msf-usa.org This Cycle Safety
CYCLE SAFETY INFORMATION
 CYCLE SAFETY INFORMATION Government Relations Office 1235 S. Clark St., Ste. 600 Arlington, VA 22202 National Resource Office 2 Jenner, Ste. 150, Irvine, CA 92618-3806 www.msf-usa.org This Cycle Safety
Signs, Flags and Lights
 Signs, Flags and Lights ALABAMA Oversize Load signs front and rear of any overwidth or overlength vehicle. Flags must be placed at front and rear corners of any over dimensional load or vehicle. Over 4'
Safety Belt Use in 2005, by Strength of Enforcement Law
 November 2005 DOT HS 809 970 Safety Belt Use in 2005 Use Rates in the States and Territories Donna Glassbrenner, Ph.D. In 2005, safety belt use in the United States ranged from 60.8 percent use in Mississippi
ENERGY WORKFORCE DEMAND
 NOVEMBER 2015 Center for Energy Workforce Development ENERGY WORKFORCE DEMAND MIDWEST REGION Center for Energy Workforce Development ENERGY WORKFORCE DEMAND MIDWEST REGION TABLE OF CONTENTS INTRODUCTION
Mail: Social Background
 Mail: Social Background Graduate Mail: Social Background Module OVERVIEW This short module collected basic information on where respondents were born, their birth weight (if known), and their race or ethnic
Estimating Tax Liability Using Stepped Up Basis
 Estimating Tax Liability Using Stepped Up Basis Terry Griffin (twgriffin@ksu.edu) and Tiffany Lashmet (Tiffany.DowellLashmet@ag.tamu.edu) Kansas State University Department of Agricultural Economics November
Fisher, Sheehan & Colton Public Finance and General Economics Belmont, Massachusetts
 NATURAL GAS PRICES BY CUSTOMER CLASS PRE- AND POST-DEREGULATION A State-by-State Briefing Guide October 1998 Prepared By: Fisher, Sheehan & Colton Public Finance and General Economics Belmont, Massachusetts
05/17/2011
 RETAIL DIESEL FUEL OUTLOOK A Fundamental Petroleum Trends Weekly Report Lehi German Tel: 816.505.0980 www.fundamentalpetroleumtrends.com Tuesday, May 17, 2011 Diesel Fuel Price Trends U.S. retail diesel
DG Energy Partners Solar Project Pricing Index Q4, Advisory Research Finance
 DG Energy Partners Solar Project Pricing Index Q4, 2013 Advisory Research Finance DGEP Project Pricing Index DGEP has developed the first Project Pricing Index (PPI) for solar projects in the United States.
COMPLIANCE BULLETIN APRIL 9, 2008 NEW FEDERAL VAPOR EMISSION REQUIREMENTS FOR GASOLINE DISPENSING FACILITIES, BULK PLANTS AND LOADING RACKS
 COMPLIANCE BULLETIN APRIL 9, 2008 NEW FEDERAL VAPOR EMISSION REQUIREMENTS FOR GASOLINE DISPENSING FACILITIES, BULK PLANTS AND LOADING RACKS BACKGROUND: The U.S. EPA issued a final rulemaking in January