Restraint Effectiveness in Reducing Heamace Injury-contacts with Interior Rail-like Surfaces
|
|
|
- Randolf Sparks
- 5 years ago
- Views:
Transcription
1 Restraint Effectiveness in Reducing Heamace Injury-contacts with Interior Rail-like Surfaces Daniel Blower Kenneth Campbell October 994 Final Report The University of Michigan Transportation Research Institute Ann Arbor, Michigan
2 Disclaimer The research reported herein was conducted under general research funds provided by the American Automobile Manufacturers Association. The opinions, findings, and conclusions expressed in this publication are not necessarily those of the AAMA.
3 Technical Report Documentation Page. Report No. UMTRI Government Accession No. 3. Recipient's Catalog No. 4. litle and Subtitle Restraint Effectiveness in Reducing Headmace Injury-contacts with Interior Rail-like Surfaces 7. Author($) Daniel Blower and Kenneth Campbell 9. Performing Organ~ation Name and Address The University of Michigan Transportation Research Institute 29 Baxter Road, Ann Arbor, Michigan Sponsoring Agency Name and Address American Automobile Manufacturers Association 743 Second Avenue, Suite 3 Detroit, Michigan Report Date October Performing Organization Code 8. Performing Organization Report No. UMTRI Wolt Unit No.. Contract or Grant NO. 9435G 3. Type of Report and Period Covered Special Report 4. Sponsoring Agency Code IS. Supplementary Notes 6. Abstract The objective of this analysis is to evaluate the effectiveness of restraints in preventing head face injury-contacts with interior rail-like surfaces, i.e., the front header, A-pillar, siderail, and B- pillar. In order to make comparisons by restraint use, an injury-contact rate is calculated as the number of injury-producing contacts per hundred involved occupants. Data are from the National Accident Sampling System (NASS) Crashworthiness Data System (CDS). The analysis is limited to passenger vehicle drivers in towaway, frontal impacts. Distributions of injury-producing contacts and injury-contact rates are presented for four restraint configurations: unrestrained, three-point belted, driver airbag alone, and driver airbag plus three-point belt. For each restraint configuration, distributions of contact points are presented and injury-contact rates are calculated. Special attention is given to headiface contacts with interior rail surfaces, particularly the front header and A-pillar. The fundamental finding is that the combination of airbags with three-point restraints substantially reduces the incidence of serious (AIS 2+) headlface injuries from contact with the front rail system. Drivers with airbags and threepoint restraints received.7 AIS 2+ headface injuries from the front rails per hundred drivers involved in frontal collisions. This compares with.577 per hundred for three-point restrained drivers and.65 for drivers with no restraints. In the cases where contact did occur, there was typically intrusion. Airbags and three-point restraints have much less impact on headlface injurycontact rates with the siderail and B-pillar in frontal collisions. It appears that headface contact with the siderail or B-pillar in frontal collisions is relatively unaffected by restraint use. 7. Key Words 8. Distribution Statement Injury rates, headface injuries, airbags, safety belts, restraint use Unlimited 9. Security Classif. (of this report) None 2. Securlty Classif. (of this page) None 2. No. of Pages Price.r

4
5 Table of Contents Introduction Summary of findings... Data... 2 Weights in NASS..., Method... 3 Discussion of results... 5 Distributions of injury-contacts Overall injury-contact rates Injury-contact rates by vehicle component... 9 Case review of serious (AIS 2+) headface injuries from front headera-pillar contact... 2 Appendix A Overview of data fle used in the analysis... 3 Case selection... 3 Comparison of airbag and non-airbag populations... 5 Appendix B Tables on injury-contacts with vehicle components Appendix C Note on comparing current results with previous work for this project... 35
6 Tables Table : Injury-contact points... 4 Table 2: Distribution of all injury contacts by contact point... 6 Table 3: Distribution of headface injury contacts by contact point... 7 Table 4: Injury rate per hundred drivers by AIS level and restraint type... 8 Table 5: Headlface injury rate per hundred drivers by AIS level and restraint type... 8 Table 6: Injury rate for all injuries per hundred drivers by injury source and restraint use... 9 Table 7: Injury rate for headface injuries per hundred drivers by injury source and restraint use... Table 8: AIS 2+ headlface injury rate per hundred drivers by rail component and restraint use...
7 Headmace Injury-contacts in the National Accident Sampling System Introduction The National Highway Traflic Safety Administration (NHTSA) has issued a proposed rulemaking (Docket 92-28; Notice 2) to require automobile manufacturers to install padding on the upper interior components to mitigate head and face injuries in the event of a collision. The interior rail-like surfaces to be padded are the front header, A- pillar, roof siderail, and the B-pillar. If adopted, the rule will require that rail-like surfaces be padded possibly as early as the 997 model year. At that time, airbags will be installed as standard equipment on all passenger vehicles. Much of the research in support of the proposed rulemaking used accident data that did not include a substantial number of cars with airbags, and the analyses themselves did not consider the effect of airbags in protecting against head and face injuries.' This report specifically addresses the role of airbags and three-point manual restraints in protecting against head and face injuries from interior rail surfaces in frontal collisions. Summary of findings The fundamental finding is that the combination of airbags and three-point restraints significantly reduces the incidence of serious (AIS 2+) headface injuries from contact with the front rail system (front header and A-pillar). Drivers with airbags and threepoint restraints received.7 AIS 2+ headlface injuries from the front rails per hundred drivers involved in a frontal collision. This compares with.577 for belts-only dnvers and.65 for drivers with no restraints. Though airbags substantially reduce headface contacts with the front rails, they do not eliminate them, However, in the cases where contact does occur, there is typically The primary document is Partyka, S.C., Serious head injury in light passenger vehicles from rail, header, and pillar contact. Docket No GR-3. National Traffic Highway Safety Administration, Washington, D.C.
 where a driver in a vehicle with a deployed airbag suffered serious head/face injuries associated with the fi-ont")
8 Page 2 Restraint Effectiveness in Reducing Head /Face Injury-contacts evidence of intrusion of the A-pillarlfront header into the passenger compartment. Four cases were found in the analysis file (see below for a discussion of the data) where a driver in a vehicle with a deployed airbag suffered serious head/face injuries associated with the fi-ont rails. In three of the cases there was evidence of intrusion of the rail system into the passenger compartment. In the fourth case, the unbelted driver was thrown across the car and struck the right A-pillar. Airbags and three-point restraints have much less impact on heaaface injury-contact rates with the siderail and B-pillar in frontal collisions. Calculated injury-contact rates were similar for all restraint combinations. Small sample sizes are a concern, but it appears that headlface contact with the siderail or B-pillar is relatively unaffected by restraint use. This is not surprising, since only frontal collisions are considered in this analysis. Data Five years of data from the National Accident Sampling System Crashworthiness Data System (NASS CDS) were combined to produce the analysis data file. Since sample sizes for crashes involving a deployed airbag are a concern, the data file included as many years of NASS as was feasible. The 992 NASS CDS file is the most current file available. The earliest practical year of NASS is the 988 file, which is the first year of the current data format and data collection protocol. The analysis file consisted of data from two groups of crash-involved vehicles. The first group is all vehicles in which an airbag deployed. The second group consisted of vehicles in which an airbag did not deploy, but which matched the airbag group on vehicle type, accident type, and collision severity. Cases chosen for the non-airbag comparison group met the following criteria:. Vehicle type limited to passenger cars and light passenger vehicles. 2. Direction of force o'clock to 2 o'clock. 3. Vehicle towed from the scene. 4. Cases with calculated delta-v under excluded. The purpose of these restrictions was to select a group of crash-involved vehicles that were not equipped with airbags, but which nevertheless matched the airbag-deployed group of cases in vehicle type, accident type, and crash severity. Although the match between the airbag and non-airbag group was satisfactory and probably the best achievable under the circumstances, it was not perfect. The groups compared very well on the distribution of the direction of force, but the airbag group had somewhat more larger cars. Also. despite excluding cases with a calculated delta-v under lomph from the non-airbag group, average delta-vs for the non-airbag group were slightly lower than for the airbag-deployed group, 5.7 versus 6.3. While not desirable, these are not

9 Restraint Effectiveness in Reducing Head /Face Injury-contacts Page 3 insurmountable problems and, in fact, taken together result in somewhat understating the effect of airbags in reducing headlface injury-contacts. A full discussion of case selection and the a comparison of the two groups is presented in appendix k Weights in NASS The NASS CDS file is a sample file of police-reported accidents. Weight variables are included in the file so that population totals can be estimated. For the 988 and 989 NASS files, the raw cases are weighted with the "national inflation factor." In 99, NASS data collection procedures were changed to smooth out investigators' workloads. Investigators worked on a fixed number of cases per week, rather than a fixed proportion of cases. At the same time, a new weight variable, the "ratio inflation factor," was added to the file to adjust for the new case selection procedure and to lower associated variances. Unfortunately, case weights still vary widely. For the airbag population, case weights range from.735 to 7, The range is even greater for the non-airbag population-.84 to 23, Consequently, the variances of estimates made using the file are also large. Method The focus in this analysis is on injuries associated with interior vehicle components, in particular, the front header, A-pillar, siderail, and B-pillar. Accordingly, the method adopted here counts the most severe injury associated with each vehicle component of interest. The first step in generating these "injury-contact" counts is to aggregate the variable for injury source into the twelve categories listed in table. Then, for each of the twelve contact points, the AIS classscation of the most severe injury is determined. For example, a driver may have received four injuries from components of the instrument panel. The original NASS CDS injury source variable breaks the instrument panel down into three areas: left, center, and right. The recoded injury source variable combines the three areas into one for the instrument panel as a whole. If one of the driver's injuries was attributed to the center of the panel and three to the left panel, in the file with the recoded variable, he would have four injuries from the instrument panel. The single injury with the highest AIS level among these four would be counted in the tables. An identical procedure is followed for the other eleven contact points. Some of the tables focus on injuries to the head or face. For these tables, injury records for all other body parts are discarded and then the procedure described here is followed. The analysis, then, addresses injuries associated with particular vehicle components, rather than a count of individual injuries or of injured persons. This approach has certain advantages. It avoids over-counting injuries. There are instances in the file where multiple injuries are coded for a single body part and a single contact point. For a facial fracture produced by contact with the A-pillar, there can be injury records for each of the broken bones. Counting each such fracture may skew the results by over-counting some injuries. On the other hand, taking only the maximum AIS injury for each occupant understates the injuries sustained. For example, an AIS-6 from the steering
10 Page 4 Restraint Effectiveness in Reducing Head /Face Injury-contacts wheel could mask an AIS-5 from the front header. The approach adopted here focuses on the main issue at hand, which is the injury-producing potential of specsc interior surfaces. Table : Injury-contact points Contact point Front headeria-pillar SideraiVB-pillar Steering assembly Instrument panel Side window Windshield Side door Roof Belt restraint Airbag Other interior Exterior NASS injury source code 3,22,32,5 23,33,52, ,26,35,36,2,4,5 2,2,27,28,3,3,37, ,24,34,4,44,46-49,5, One additional correction is made to the data. About % of the unweighted airbag contacts and 3% of the unweighted non-airbag contacts are of an "unknown" injury source. The injury-producing contact point could not be determined for these cases. Since the proportion of unknowns was higher for the airbag than the non-airbag groups, injury totals and injury-contact rates would be biased such that airbag rates would be overestimated relative to non-airbag rates. To correct for this bias, it was assumed that the unknown injury source contacts had the same distribution as the known source contacts, and they were distributed among the known cases accordingly. This adjustment was made separately within each AIS level. The body of the paper presents percentage distributions of injury-contacts and injurycontact rates. Injury-contact rates are a convenient way of comparing the absolute magnitude of injuries associated with different restraint combinations. Injury rates are calculated by dividing the number of the most severe injury-producing contacts by the number of exposed drivers. The result is then scaled to produce a rate of injury-contacts per exposed drivers (deployed driver airbag or matched non-airbag driver). The following equation was used: # injury contacts (injury rate) = * # exposed drivers A complete set of tables can be found in appendix B. These tables show the distribution of injury-contacts across various vehicle components for vehicles in which an airbag deployed and for comparable vehicles in comparable collisions where no airbag

11 Restraint Effectiveness in Reducing Head /Face Injury-contacts Page 5 deployed. The tables present raw counts, column percentages, and weighted totals of driver injury-contacts for the airbag and non-airbag groups, and within each group, for the situation where the driver used three-point manual restraints and where the driver was unbelted. In the discussion below, tables are presented which summarize the main results from the full set of tables found in appendix B. Discussion of results In the final NASS fle prepared for this project, there were 489 vehicles in which an airbag deployed. The drivers of those vehicles experienced 794 injuryproducing contacts, using the method for counting contacts described above. The comparison group of vehicles, chosen as involved in similar accidents of similar severity, included 2,66 cases (vehicles) in which drivers suffered 9,344 injury-producing contacts. This is ample data for the non-airbag group, but the airbag group still has relatively few cases, especially when looking at specific contact points and specific injury severities. In five years of NASS, there are only 37 contacts of any sort with the rail surfaces for drivers of airbag-deployed vehicles. Only 9 of these contacts were the most severe (maximum AIS) for the driver. Distributions of injury-contacts The distribution of injury-producing contacts with interior surfaces of passenger cars in frontal collisions is sigmficantly changed by the use of airbags and safety belt restraints. Drivers of vehicles with airbags, particularly when three-point restraints are used, have lower proportions of injury-contacts with the vehicle components in front of the driver and higher proportions of contacts with components of the restraint system. Contacts with components on the sides of the car are relatively unaffected. Table 2 shows the distribution of contacts for all types of injuries across the interior of the vehicle, Since all the cases considered here are frontal collisions, most of the contacts are with vehicle components in front of the driver. For drivers of cars without airbags, the steering assembly, instrument panel, and windshield account for most of the injurycontacts. Together these three contact points account for 52% of belted drivers' contacts and 78% of unbelted drivers' contacts. The difference between the belted and unbelted proportions is largely accounted for by the dramatic drop in injury-contacts with the windshield when three-point belts are used. Unbelted drivers receive 28.2% of injurycontacts from the windshield, compared with 9.% for drivers using three-point restraints. Note also that almost 2% of injury-contacts for belted drivers are with the restraint system itself. For drivers without airbag restraint systems, contacts with rail components-front header, A-pillar, siderail, B-pillar-are similar regardless of belt use: 3.2% for unbelted and 3.8% for belted drivers.
12 Page 6 Restraint Effectiveness in Reducing Head /Face Injury-contacts Table 2: Distribution of all injury contacts by contact point Injury source Front hdrla pillar SideraiIlB pillar Steer assembly Instrument panel Side window Windshield Side door Roof Belt restraint Airbag Other interior Exterior airbag belt no belt all no airbag belt no belt all In passenger vehicles equipped with airbags, a high proportion of injury-contacts are with the airbags themselves. This is particularly true when airbags are used in combination with three-point belt restraints. Injury-contacts with frontal components are not eliminated, but they are substantially reduced as a proportion of total contacts. The steering assembly, instrument panel, and windshield account for only 29.9% of the injury-contacts of drivers restrained by both airbags and belts, and 37.5% of the contacts for drivers restrained by airbags alone. Contact with the rail system is also substantially reduced in relation to drivers without airbags. Front header and A-pillar injury-contacts are reduced to only.3% for drivers who had both three-point belts and an airbag and.9% for dnvers with only an airbag. The comparable proportions are 3.8% and 3.2% for drivers with belts-only and no restraints, respectively. These are reductions by factors of 2 for the airbag-belt group over belts alone and 3.5 for the airbag-only group over no restraints. In contrast, 5.7% of injury-contacts are associated with the restraint system, either the belt or the airbag, for drivers with both deployed airbags and three-point restraints. Airbags are associated with 37.2% of the injury-contacts for drivers with airbags alone. Contacts with the siderail or B-pillar are fairly similar for all restraint-use categories. This is not unexpected, since the collisions are all frontal. The distribution of head/face contacts is also significantly altered by restraint use. Headiface injury-contacts naturally are primarily with surfaces in front of the driver. Drivers without airbags receive most of their headlface injury-contacts with the windshield, steering assembly, and front headera-pillar. For these drivers, belt use decreases the proportion of contacts with the windshield and increases the proportion of contacts with the steering assembly, instrument panel, and front headera-pillar complex. The front header or A-pillar account for over 2% of the headlface injurycontacts of belts-only drivers, compared with 6% for unbelted drivers. It appears that the reason unbelted drivers have a lower proportion of front rail contact is because they

13 Restraint Effectiveness in Reducing Head /Face Injury-contacts Page 7 were hitting the windshield. Almost 56% of the headface injuries of unbelted drivers were associated with contacting the windshield. Table 3: Distribution of headlface injury contacts by contact point Injury source Front hdria pillar SiderailIB pillar Steer assembly Instrument panel Side window Windshield Side door Roof Belt restraint Airbag Other interior Exterior airbag belt no belt all no airbag belt no belt all Drivers restrained by airbags have much lower percentages of headface injuries associated with the front rail system (front header or A-pillar). AU drivers of airbagdeployed vehicles have only.7% of their headlface injuries from the front rails, compared with 8.2% for drivers without airbags. Drivers restrained by both belts and airbags have less than % of their contacts with the front rails, while drivers restrained only by airbags suffered 3.2% of their headface injury-contacts from the front rails. These drivers also have lower proportions of contacts with the windshield, particularly drivers with both belts and airbags. In contrast, a high proportion of their injurycontacts were with the restraint system itself. This is particularly true for the belts-andairbags group. Almost 7% of their headface injuries are associated with the airbag, and a further % with the belt system. In a sense, these distributions show that the restraint system is working correctly. In order to have an effect, restraints must interpose between the driver, in this case, and the vehicle components. Contact that would otherwise be with the interior of the vehicle instead occurs with the restraint system. The driver of a vehicle with both safety belts and an airbag is held in place by the safety belts so that his forward momentum can be absorbed by the airbag. In contrast, note the high proportion of injury-contacts with the windshield and front rail system for drivers who used airbags without safety belts. The force of impact in some cases apparently threw these drivers around the airbag so their heads could collide with the other surfaces. Changes in percentage distributions is like squeezing a balloon-a decrease in one category necessarily requires an increase in another. Thus changes in percentages do not mean that injuries are literally shifted from one source to another, with the total

14 Page 8 Restraint Effectiveness in Reducing Head /Face Injury-contacts number of injuries remaining the same. Injury-contact rates help sort out how restraint types affect the total number of injury-contacts received. Overall injury-contact rates Table 4 shows injury-contact rates by restraint use calculated as the number of injurycontacts per hundred involved drivers for each of the restraint categories. All contact points on the vehicle and all body regions are included. Overall, the group with airbags actually has a higher injury-contact rate than the group without airbags, 8.4 versus The group with the lowest injury-contact rate is the group restrained only by three-point safety belts, with 78.4 injury-contacts per hundred involved drivers. The airbag-only group has an injury-contact rate similar to that of unrestrained drivers. Across AIS level, the two belted categories look similar, as do the two unbelted groups. The major difference between the injury-contact rates of the two belted groups (with an airbag and without an airbag) is in the injury-contact rate for AIS injuries, where drivers restrained by both airbags and three-point restraints have higher rates of AIS injuries. The rates for AIS 2 and AIS 3+ injuries are similar between the two belted groups. The airbag group as a whole looks better than the non-airbag group when headface contacts are considered, though three-point restraints alone still have the lowest overall injury-contact rate. Table 5 shows injury-contact rates for headface injuries by restraint type. All contact-points on the vehicle are included, though injuries are limited to those of the head and face. Again, restraint type has a large effect on the total

15 Restraint Effectiveness in Reducing Head /Face Injury-contacts Page 9 number of headface injury-contacts sustained. Unrestrained drivers have the highest total rate and the highest rate at each AIS level. Drivers using three-point safety belts alone, with no airbags, have the lowest overall rate, though the airbag-and-belt group has the lowest rates of AIS 2 and AIS 3+ injury-contacts. Differences with the threepoint-belt-only group are not marked however, other than at the AIS level. Note that all headface injury-contacts are included in this table, not just contacts with the rail system. Injury-contact rates by vehicle component An unexpected result shown in table 4 was that airbags do not seem to reduce the overall number of injury-contacts when all body regions and all contact points are considered. Three-point restraints alone have the lowest rates of injury-contacts, while the rates are about the same for airbags alone and no restraints at all. Overall, drivers with airbags experience about 2 more injury-contacts per hundred drivers than drivers without airbags. It should be emphasized that all injuries and all vehicle contact points, including restraint systems, are counted here. For drivers with no restraints, the steering assembly, instrument panel and windshield together account for about injury-contacts out of the total of 32 injury-contacts per hundred drivers (table 6). The major contact points for drivers with three-point belts are the steering assembly, instrument panel, and belt restraints themselves, which together account for about 5 injury-contacts, out of a total of The use of three-point restraints reduces the rate of injury-contact with the fi.ont header/a-pillar about 4%, from 4.2 to 3.. The largest reduction is in contact with the windshield, from over 37.3 to 7.. Injury source Front hdrla pillar SideraillB pillar Steer assembly Instrument panel Side window Windshield Side door Roof Belt restraint Airbag Other interior Exterior Table 6: Injury rate for all injuries per hundred drivers by injury source and restraint use airbag belt no belt all.37.i no airbag belt no belt all

16 Page Restraint Effectiveness in Reducing Head /Face Injury-contacts Drivers with airbags have much lower contact rates with vehicle components in front of the driver, except for the instrument panel. For drivers using both an airbag and a three-point restraint, injury-contact rates with the front header/a-pillar are only.37 per hundred drivers, or about contact per 35 drivers involved in a frontal collision. Where only an airbag is used, the rate is.89, or contact per 84 involved drivers. Still, these rates are substantially lower than the rates for drivers with three-point restraints only or no restraints, which are ( per 34) and 4.29 ( per 24) respectively. Headface contacts in frontal collisions with the forward rail components-the front header and A-pillar-are almost eliminated by the combination of airbags and threepoint restraints. Airbags alone, without three-point restraints, also substantially reduce headface contact with the front headera-pillar, though the rate is higher than for the combination of airbag-three-point restraint. There were.266 headface injury-contacts per hundred drivers with the front header/a-pillar for drivers with airbags and threepoint restraints (table 7). Drivers with airbags alone experienced.2 headface injurycontacts with the front headera-pillar. Both of these rates are substantially lower than the rates for three-point restraints only (2.64) and no restraints (3.696). Injury source Front hdrla pillar SideraillB pillar Steer assembly Instrument panel Side window Windshield Side door Roof Belt restraint Airbag Other interior Exterior Table 7: Injury rate for headlface injuries per hundred drivers by injury source and restraint use airbag belt no belt all.266.i no airbag belt no belt all Headfface contacts with the siderain-pillar system are much less affected by restraint type, The injury-contact rates, as shown in table 7, are somewhat lower for cars equipped with airbags, but they are low for all restraint types. This is not unexpected since only frontal collisions are considered in this analysis. The extremely low rate for the airbag-only cell is probably not accurate and reflects the small sample size for this group. Table 7 also shows how efficient the restraint system is at bearing the brunt of the impact in a frontal collision. Headlface injury-contacts with the steering assembly are
17 Restraint Effectiveness in Reducing Head /Face Injury-contacts Page almost eliminated by the combination of an airbag and three-point restraint. In fact, both of the airbag groups have very low rates of headface injury-contacts in comparison with the belts-only and no-restraints groups. In contrast, a large proportion of the injury-contact rate for both airbag-restrained groups is accounted for by the restraint system itself. This is particularly true for the airbag-three-point belt group, where over two-thirds of the headface injury-contacts are associated with the restraint system, primarily the airbag. Where the driver is restrained only by the airbag, about 3% of his injuries are associated with the airbag. The rates shown in table 7 include all AIS levels. As is clear from tables 4 and 5, AIS injuries dominate these rates. Eighty to 9% of headface injury-contacts are at the AIS level. Focusing on more serious headface injuries, defined as AIS 2+, gives a clearer picture of the effect of restraint use on headface injuries from contact with the rail system. Table 8 is restricted to just headlface injuries associated with the front header, A-pillar, siderail, and B-pillar. This table presents most succinctly the findings of the present analysis on the effect of restraint use on headlface contacts with the rail system. v Injury source Front hdr/a pillar SiderailIB pillar Table 8: AIS 2+ headlface injury rate per hundred drivers by rail component and restraint use airbag no airbag belt no belt all belt no belt all i , The combination of an airbag with three-point restraints almost eliminates serious headface injury associated with contacting the front header or A-pillar. There are only.7 serious (AIS 2+) headface injuries per hundred drivers, or per 4,286 drivers involved in a frontal collision. There is a "confidence interval" associated with this rate, since it is made using a sample file, so the real rate could be somewhat larger or smaller. But it is clear that the combination of an airbag with three-point restraints reduces headface injury-contacts with the front rail system to a very low, albeit nonzero level. For drivers restrained by an airbag alone, the rate is.6 ( per 63 drivers). The airbag-only rate is comparable to that for drivers with three-point belts only, so it is also clear that the greatest benefit comes from neither restraint system alone, but by their joint use. There appears to be little benefit from the airbag-three-point belt restraint system in protecting against serious headface injuries from contact with the siderail or B-pillar. Injury-contact rates are about the same for all restraint combinations, and only somewhat higher for the no-restraint category.2 Again, this is unsurprising, since this analysis is restricted to frontal collisions. 2 The zero rate for the airbag-only category is very likely an artifact of small sample sizes. The rates for all the other restraint categories are low; there are only 4 AIS 2t
18 Page 2 Restraint Effectiveness in Reducing Head /Face Injury-contacts Case review of serious (AIS 2+) headiface injuries from front headera-pillar contact Although airbags substantially reduce the incidence of serious headface injury-contacts with the front headera-pillar in frontal cohsions, they do not eliminate them. In the 5 years of NASS cases examined, of the 489 cases in which an airbag deployed, there were four instances where a dnver received an AIS 2+ headface injury associated with the front headeria-pillar. (See Tables B-7 and B-8 for the raw number of cases.) Three of these cases involved an unbelted driver. Intrusion was noted in three of the cases. The most severe headface injury was an AIS 6 associated with the left A-pillar. The driver was an 8-year old male, driving a 99 Chevrolet in a head-on crash with a total delta-v of 59mph. Crush of the passenger compartment was extensive. The toe pan was moved back 8 to 24 inches; the A-pillar, front header, and left side of the instrument panel intruded 2 to 8 inches; and the steering assembly intruded 6 to 2 inches. The driver was belted, but essentially the A-pillar and front header moved back into the driver's head. The driver sustained fatal injuries. The three other cases of AIS 2+ headface injuries from front rail contacts involved unbelted drivers, and in two of them there was intrusion of the f?ont structure of the car. In the case of an AIS 4 head injury, there was intrusion of 3 to 6 inches on both the left A- and B-pillars, and 2 to 8 inches of the instrument panel. The other intrusion came in a case of an AIS 2 head injury, also from the left A-pillar. Both the toe pan and the windshield were pushed back 6 to 2 inches. Given the displacement of the windshield, it is likely that the A-pillar was moved back as well. The final case of serious headface injuries associated with front rails is somewhat anomalous, because the contact to the driver's head came from the && A-pillar. The vehicle went off the road to the right and struck a roadside object at o'clock. The airbag deployed but since the driver was unbelted, he was able to slide across and strike the right side of the vehicle's interior, sustaining, among other injuries, an AIS 3 head injury. There was some intrusion ( to 3 inches) of the floor pan, but none related to the head injuries. headface injuries from all vehicle components for airbag-only drivers in the analysis file; and a zero rate makes no mechanical sense. See table B-9 in appendix B for the raw counts.
19 Appendix A Overview of data file used in the analysis Case selection As a first step, the injury records for drivers in all cases in which an airbag deployed were selected for the file. Cases in which an airbag did not deploy were also selected as a comparison group. The ideal comparison group would match the airbag-deployed cases on all relevant characteristics, except for lacking an airbag restraint system. Three characteristics were chosen to match the airbag-deployed cases as closely as possible: ) vehicle type; 2) accident severity as measured by towaway and delta-v; and, 3) direction of force. Airbags are currently installed primarily in passenger cars and light passenger vans. Accordingly, case vehicles in the non-airbag group were restricted to these vehicle types. Figure A- shows the distribution by vehicle type of the two groups. The two distributions match reasonably well. Almost 5% of airbag cases were 4-door sedans, compared with about 35% of the non-airbag cases. The non-airbag cases have a higher proportion of 2-door sedans, 3-door sedans, &door (hatchback) sedans, and stationwagons. But in general, the match is reasonable. minim unknown auto stat ionwagon 5door sedan 4dr sedan 3dr sedan 2door sedan Figure A-: Vehicle type for airbag and nonairbag cases in NASS combined file percent Almost all the airbag-deployed cases were towaways. There were 489 vehicles in NASS CDS where an airbag deployed and only seven were not towed. When these raw totals are properly weighted, over 98% of the airbag-deployed vehicles were towed
20 Appendix A from the scene. Accordingly, only towed vehicles were included in the comparison, nonairbag group of cases. The purpose of this filter was to provide some control for accident severity. Airbags are designed to be triggered only in relative severe collisions. It therefore meets expectations that, in almost all cases in the NASS CDS fle, the vehicle was towed when the airbag deployed. Since airbags are designed not to deploy when delta-v is less than to 5mph, airbag deployment effectively filters out collisions with delta-v under mph. In the NASS file, only 7% of the airbag deployment cases had calculated delta-vs under lmph. In order to better match the accident severity of the airbag deployment cases, cases with delta-v under lomph were removed from the non-airbag cases. The final filter to identlfj a similar accident population was direction of force. Almost all airbag deployments occur in frontal impacts. Figure A-2 shows the distribution of direction of force for airbag and non-airbag cases. The airbag cases fall almost entirely between and 2 o'clock. There were a few cases with 6 o'clock (rearend) impacts and 9 o'clock (driver's side), but virtually all cases fall between and 2. Taking only cases falling between and 2 o'clock for the non-airbag cases produces a remarkably similar distribution, as figure A-2 illustrates. Figure A-2: Direction of force for airbag and non-airbag vehicles in NASS combined file clock position To summarize: The data file constructed for this analysis consists of two groups. The first group is all vehicles in the NASS CDS file in which an airbag deployed. The second group consists of vehicles in which an airbag did not deploy, with the following further restrictions designed to select vehicles and accidents comparable to the airbag-deployed group: Page 4
21 Appendix A. Vehicle type limited to passenger cars and light passenger vans. (NASS body-type variable code levels -9, 2, and 2.) 2. Direction of force limited to o'clock to 2 o'clock. 3. Vehicle towed from the scene. 4. Cases with calculated delta-v under are excluded. Comparison of airbag and non-airbag populations Table A- shows the distribution of the maximum AIS injury for the driver by restraint use. Cases with deployed airbags are shown separately from those without airbags, and within those two groups, three-point manual restraints are shown separately from all other, including no restraints. Within the airbag group, "all other" includes some cases with lap belts only. Within the non-airbag group, "no belts" means no restraints of any kind. The purpose of table A- is to compare the injury severity of drivers with and without airbags in the analysis file. In this population of accidents, airbags do not appear to lower overall injury severity. A higher proportion of drivers without airbags have no injury than drivers with deployed airbags. Much of this difference is due to a higher proportion of AIS- injuries for the airbag population. These are minor injuries, skin abrasions and contusions, caused by contact with the airbag. However, the airbag population does not have a lower proportion of the most severe injuries than the nonairbag population. For AIS-6 (maximum) injuries, the proportions are about the same. The same is true for AIS-4 and 5. There are very few cases where the maximum AIS for the driver was 4-6, so statistically the findings are not sidcant. Nevertheless, we would have expected to find lower proportions for the highest maximum-ais. These findings suggest problems with the match between the two comparison groups, despite the effort described above to find a comparable non-airbag population. AIS level Not injured Minor Moderate Serious Severe Critical Maximum Table A- : Maximum AIS for the Driver by Restraint Use, NASS Air bag deployed No air bag 3 pt belt All other All pt belt No belt All Grand total Page 5
22 Appendix A Though the match by vehicle type is satisfactory, it is not perfect. In general, the airbag group is somewhat heavier. Figure A-3 shows cumulative percentages of vehicle curb weight for the different combinations of restraint use in the analysis file. There are more light vehicles in the non-airbag groups than among the vehicles equipped with airbags. About 5% of the non-airbag group weighed 2,5 pounds or less. The 5th percentile for the airbag-equipped group of cars is 2,8. It would be preferable that the weight profiles of all restraint groups be similar, but it is not surprising that airbagequipped vehicles are somewhat heavier. Most of the vehicles come from production years when airbags were offered on selected models only. These differences in curb weight probably bias driver injuries with respect to whether or not their vehicles are equipped with airbags; that is, drivers of heavier cars should have less severe injuries, all other things being equal. That the drivers of airbag-deployed vehicles have more minor injuries and about the same number of serious injuries could mean that they were in more serious collisions. Figure A-3: Cumulative Percent of Vehicle Curb Weight bag only belt only Curb weight ( s) The most direct measure of accident severity available in the NASS CDS file is "delta- V," the change in velocity of the vehicle as a result of the accident. Only 47% of the airbag cases have valid delta-vs, and 54.6% of the non-airbag cases have valid delta-vs. Though the proportion of missing data is high, calculating the mean delta-v for the airbag and non-airbag populations provides some evidence that the two populations had comparable accident severities, though the airbag vehicles may have been involved in slightly more severe collisions on average. Table A-2 shows delta-v by restraint use for the four combinations of airbag deployment and three-point manual restraint use. Overall, delta-v, where known, for the airbag population is only slightly higher than for the non-airbag population. For all airbag Page 6
23 Appendix A cases (with known delta-v) the average was By excluding delta-vs under from the non-airbag group, the average delta-v is 5.67, only.6 less than the airbag group. Table A-2: Delta V by restraint use NASS restraint use air bag & bell air bag only all air bag 3 point belt no restraints all non-air bag n mean sd Figure A-4 shows the cumulative distribution of delta-v for the various restraint categories. Even though cases with delta-v less than lomph are excluded from the nonairbag group, that group still has somewhat more low delta-v cases than the group of cases with deployed airbags. C Q, g 5.-- Q, a Figure A-4: Cumulative Percent of Vehicle Delta V for Restraint Categories bag only.belt only _- _ o. o ; I I I I I I I I, I I, I I I I I I I, Delta V The airbag population of vehicles rolled over somewhat more frequently than the nonairbag population. Three point four percent (weighted) of the airbag population rolled over, compared with.7% of the non-airbag group. Clearly, rollover occurred in only a small proportion of both populations, but twice as often in the airbag population. In sum, though every effort was made to chose a comparison group with vehicle, accident, and collision severity measures matching the vehicles with deployed airbags, success was mixed. The two files match well on the towaway criterion and direction of force. The match on vehicle types is reasonable, though there are somewhat more Page 7
24 Appendix A smaller cars among the non-airbag group. On the other hand, the airbag group of vehcles appears to have been involved in somewhat more severe collisions. Mean delta- V is slightly higher, and the cumulative distribution of delta-vs shows a higher proportion of non-airbag vehicles had lower delta-vs. Finally, the distributions of the maximum-ais injury sustained by the drivers are quite similar, except that a higher proportion of drivers without airbags sustained no injuries. As a result, comparisons between groups should be made with caution. Nevertheless, it should be observed that if the airbag-deployed vehicles were involved in somewhat more serious collisions, this analysis would understate the benefit of airbags in preventing injury and, in particular, protecting against headlface contact with the front rail-like components. Page 8

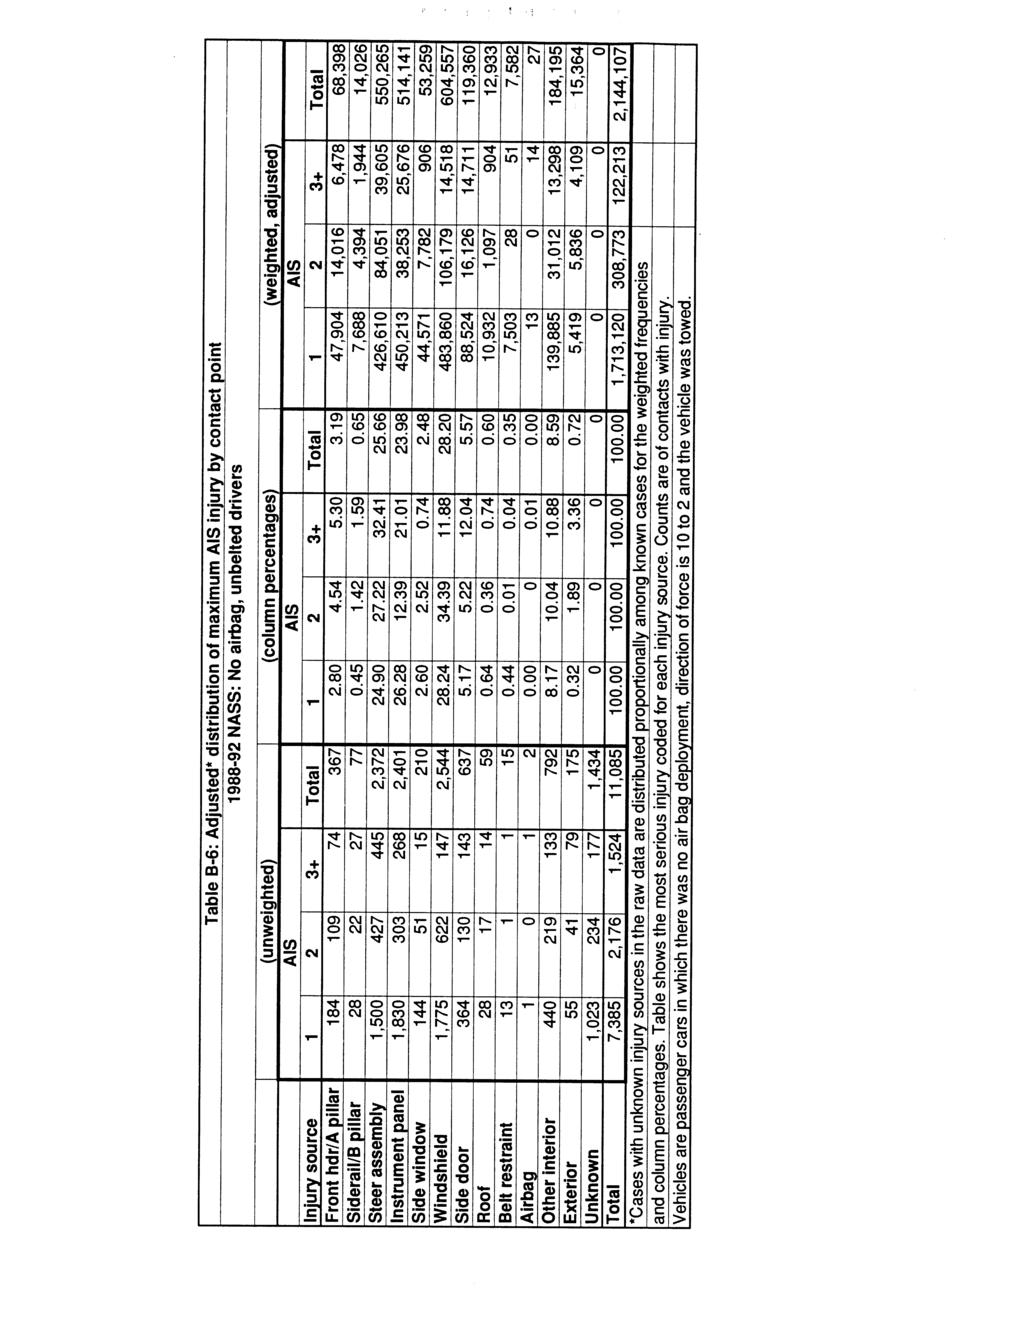
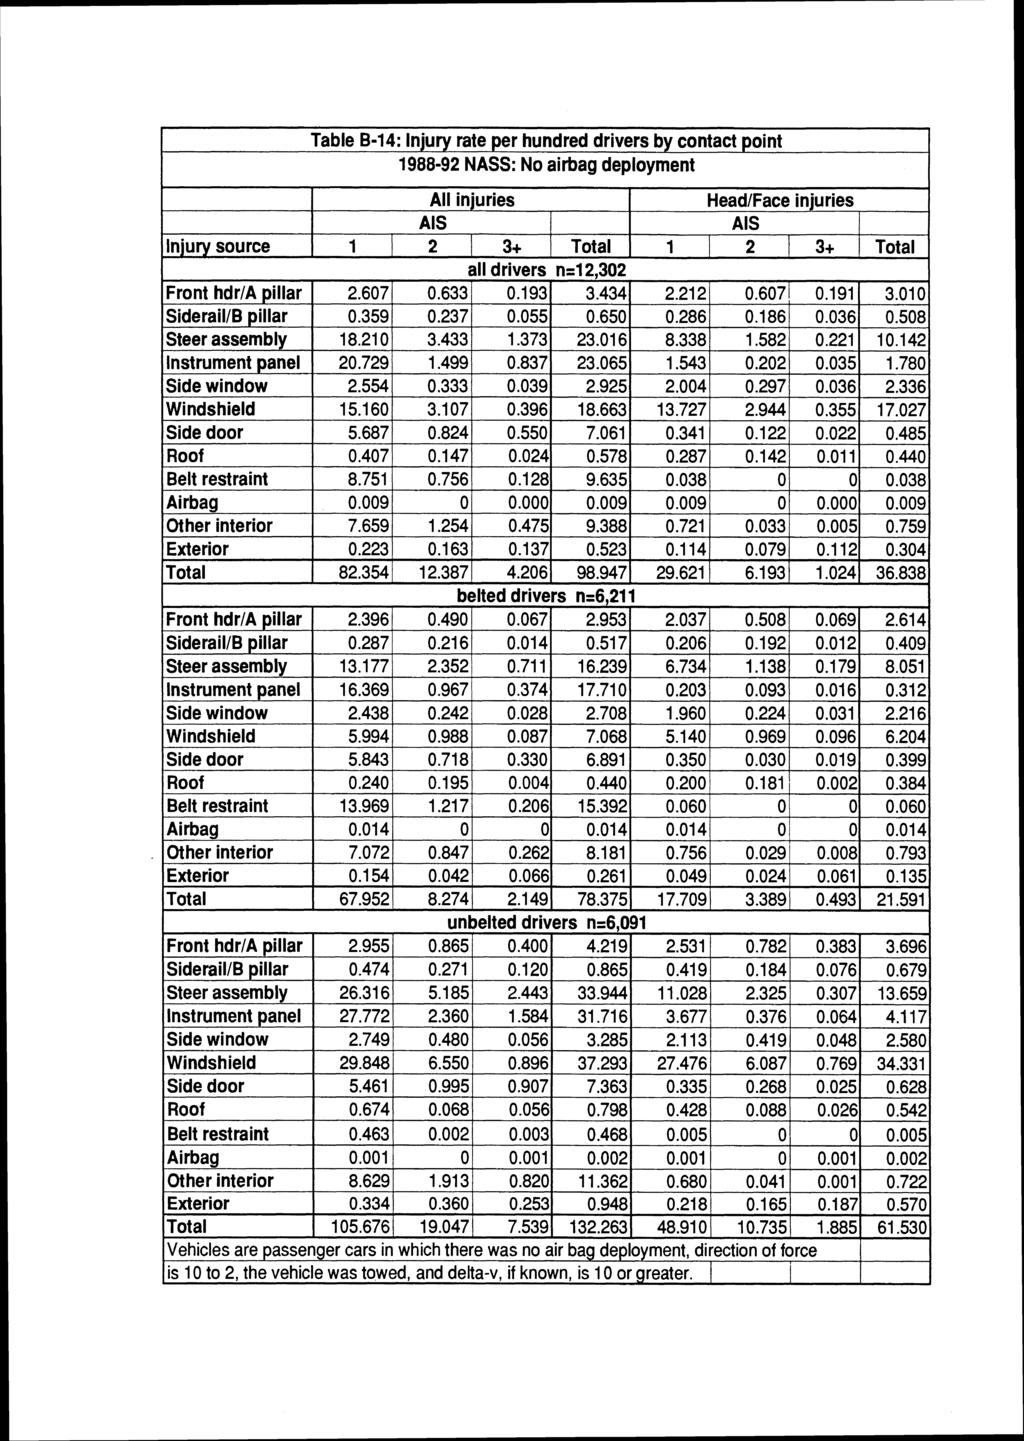
25 Appendix B Tables on injury-contacts with vehicle components Organization of the tables The leftmost section of each table shows the distribution of raw case frequencies, with the heading "unweighted." Cases with unknown injury-contacts are included. The middle section of the tables shows column percentages for the weighted cases. These percentages are calculated after the unknown cases have been distributed among cases with known injury sources. The percentages are shown to two decimal places. Some cells have no cases, and the percentage is given as just. Cells with a non-zero percentage smaller than. are shown as.. The rightmost section of the tables shows the weight, adjusted frequencies. Tables B- through B-6 show distributions of injury-contacts for all injuries. Tables B-7 through B-2 show headlface injuries by restraint use. There is one table for each combination of restraint use. Restraint uses represented are all permutations of airbagdeployment and three-point manual belt use. The table below provides a key to the tables. For example, Table B- covers all injuries to drivers of all airbag-deployed vehicles, whether belted or not. Numbering of Injury Contact Tables All injuries Headlface airbag all belted other B- B-2 B-3 B-7 B-8 B-9 no airbag all belted no belt B-4 B-5 B-6 B- B- B-2 Tables B-3 and B-4 show injury rates per hundred drivers. Table B-3 covers drivers of airbag-deployed vehicles; table B-4 covers the non-airbag-deployed group. Within each table there is a section for all drivers, belted drivers, and unbelted drivers. The left side of each section shows rates for all injuries, the right side of each section shows headlface injuries. It is particularly useful to line up columns of interest from table B-3 and table B-4 (airbag and no airbag) and see how the distributions change.
26 ~ -- Injury source Front hdria pillar SiderailIB pillar Steer assembly Instrument panel Side window Windshield Side door Roof Belt restraint Airbag - Other interior Exterior Unknown Table B-: Adjusted* -- distribution of maximum AIS injury by contact point NASS: ~irbag deployment accidents, all drivers (unweighted) (column percentages) (weighted, adjusted) AIS AIS AIS ,54,799 3, ~ ,567, , , , ,457 3,22, , ,627,59,6, ~ , , ~ 83-7, ~~~~~ ,855 2, , ,258 2, , , ,984 4,382 5,34 48,4 599 "Cases with unknown injury sources in the raw data are distributed proportionally among known cases for the weighted frequencies and column percentages. Table shows the most serious injury coded for each injury source. Counts are of contacts with injury.
27 Table 8-2: Adjusted* distribution of maximum AIS injury by contact point NASS: Airbag deployment accidents, belted drivers Injury source Front hdria pillar SiderailIB pillar Steer assembly Instrument panel Side window Windshield Side door Roof Belt restraint Airbag Other interior Exterior Unknown (unweighted) A IS (column percentages) AIS ,23 4,64 4,838 6,26 4 6,872 34,42 8, ,636 "Cases with unknown injury sources in the raw data are distributed proportionally among known cases for the weighted frequencies and column percentages. Table shows the most serious injury coded for each injury source. Counts are of contacts with injury. (weighted, adjusted) AIS ,6 69, ,295 2, ,82 5, ,289 7, ,954 35,37, ,
28
29
30 - Injury source Front hdr/a pillar SiderailIB pillar -- Steer assembly Instrument panel Side window Windshield Side door Roof Belt restraint Airbag Other interior - Exterior Unknown 55 3,39, , Table - 8-5: Adjusted* distribution of maximum AIS injury by contact point NASS: No airbag, belted drivers -- (unweighted) AIS ,68, , ,8 (column percentages) AIS ,893 7, ,92 429,729 64, ,42 6,3 366, ,648 4,32 6,372, , ,783,942 'Cases with unknown injury sources in the raw data are distributed proportionally among known cases for the weighted frequencies and column percentages. Table shows the most serious injury coded for each injury source. Counts are of contacts with injury. Vehicles are passenger cars in which there was no air bag deployment, direction of force is to 2 and the vehicle was towed. (weighted, adjusted) AIS 3+, , ,874 5,665 6,737 25,399 6,35 25,935 8,84 5,3 3,947 22,238, 2 7, ,53 3, ,334 9,82 ~ , ,97 2,272 85,564 8,669 8,92 97,539 5,44 44, , ,763,723 56,47 6,855 2,57,564 --
31
32 ~ -- Injury source Front hdra pillar SiderailIB pillar Steer assembly Instrument panel Side window Windshield Side door Roof -.- Belt restraint Airbag Other interior Exterior Unknown - - Table 8-7: Adjusted* distribution of maximum AIS HeadIFace injury by contact point NASS: Airbag deployment, all drivers (unweighted) (column percentages) (weighted, adjusted) AIS AIS , 5, ,566 9, ,563 AIS , , , *Cases with unknown injury sources in the raw data are distributed proportionally among known cases for the weighted frequencies and column percentages. Table shows the most serious headlface injury coded for each injury source. Counts are of contacts with injury ,622 8, , ,96 ~ ,559
33
34 ~ Injury source Front hdrla pillar SiderailIB pillar Steer assembly Instrument panel Side window Windshield Side door Roof Belt restraint Airbag Other interior Exterior Unknown Table B-9: Adjusted* distribution of maximum AIS HeadlFace injury by contact point NASS: Airbag deployment, unbelted drivers (unweighted) AIS (column percentages) AIS ,84 3, , , *Cases with unknown injury sources in the raw data are distributed proportionally among known cases for the weighted frequencies and column percentages. Table shows the most serious headlface injury coded for each injury source. Counts are of contacts with injury. -- (weighted, adjusted) AIS , , ,329 4, , ,
 AIS 2 3+ 52 43 344 65 9 76 28 24 4 32")
35 ~ 8.7 Table B-: Adjusted* distribution of maximum AIS HeadJFace injury by contact point NASS: No airbag, all drivers Injury source Front hdrla pillar SiderailJB pillar Steer assembly Instrument panel Side window Windshield Side door Roof Belt restraint Airbag Other interior Exterior Unknown 39 49, , (unweighted) AIS , , (column percentages AIS ,93 2,57 354,85 65,529 85,89 582,93 4,496 2,74, ,65 4,85 (weighted, adjusted) AIS ,77 8,9 7,887,525 67,7 9,44 8,575,48 2,595,525 25, 5,92 5, ,4 48 5, ,337 4,74 43,52 5,2, ,38....,257,89 262,99 *Cases with unknown injury sources in the raw data are distributed proportionally among known cases for the weighted frequencies and column percentages. Table shows the most serious headlface injury coded for each injury source. Counts are of contacts with injury. Vehicles are passenger cars in which there was no air bag deployment, direction of force is to 2, and the vehicle was towed ,82 2,569 43,659 75,585 99,28 723,6 2,6 8,693, ,25 2,927,564,3
36 pp Injury source Front hdria pillar - SiderailIB pillar Steer assembly Instrument panel Side window Windshield Side door Roof Belt restraint Airbag Other interior Exterior Unknown Table B-: -- Adjusted* distribution of maximum AIS HeadIFace injury by contact point NASS: No airbag, belted drivers (unweighted) AIS (column percentages) AIS , , ,92 88,969 "Cases with unknown injury sources in the raw data are distributed proportionally among known cases for the weighted frequencies and column percentages. Table shows the most serious headlface injury coded for each injury source. Counts are of contacts with injury. Vehicles are passenger cars in which there was no air bag deployment, direction of force is to 2, and the vehicle was towed ,484 5,398 76,778 5,322 5,468 34,937 9,8 5,256, ,852,297 (weighted, adjusted) AIS ,342,83 5, ,872 4,77 2, , ,433 2, , ,6 2,949 68,629,732 2,358 8,92 58,84 62,885,485, , , ,839 --
37

38 Airbag Other interior Exterior lo
39
Remote, Redesigned Air Bag Special Study FOR NHTSA S INTERNAL USE ONLY Dynamic Science, Inc., Case Number ( J) 1998 Dodge Caravan Indiana
 1998 Dodge Caravan Indiana") Remote, Redesigned Air Bag Special Study FOR NHTSA S INTERNAL USE ONLY Dynamic Science, Inc., Case Number (1998-073-111J) 1998 Dodge Caravan Indiana September/1998 Technical Report Documentation Page 1.
Remote, Redesigned Air Bag Special Study FOR NHTSA S INTERNAL USE ONLY Dynamic Science, Inc., Case Number (1998-073-111J) 1998 Dodge Caravan Indiana September/1998 Technical Report Documentation Page 1.
Remote, Redesigned Air Bag Special Study FOR NHTSA S INTERNAL USE ONLY Dynamic Science, Inc., Case Number ( E) 1998 Mercury Tracer
 1998 Mercury Tracer") Remote, Redesigned Air Bag Special Study FOR NHTSA S INTERNAL USE ONLY Dynamic Science, Inc., Case Number (1998-082-801E) 1998 Mercury Tracer Washington July/1998 Technical Report Documentation Page 1.
Remote, Redesigned Air Bag Special Study FOR NHTSA S INTERNAL USE ONLY Dynamic Science, Inc., Case Number (1998-082-801E) 1998 Mercury Tracer Washington July/1998 Technical Report Documentation Page 1.
Remote, Redesigned Air Bag Special Study FOR NHTSA S INTERNAL USE ONLY Dynamic Science, Inc., Case Number ( E) 1998 Buick Century Colorado
 1998 Buick Century Colorado") Remote, Redesigned Air Bag Special Study FOR NHTSA S INTERNAL USE ONLY Dynamic Science, Inc., Case Number (1998-075-803E) 1998 Buick Century Colorado October, 1998 Technical Report Documentation Page 1.
Remote, Redesigned Air Bag Special Study FOR NHTSA S INTERNAL USE ONLY Dynamic Science, Inc., Case Number (1998-075-803E) 1998 Buick Century Colorado October, 1998 Technical Report Documentation Page 1.
Remote, Redesigned Air Bag Special Study Dynamic Science, Inc., Case Number ( C) 1998 Nissan Altima Texas August/1998
 1998 Nissan Altima Texas August/1998") Remote, Redesigned Air Bag Special Study Dynamic Science, Inc., Case Number ( 1998-49-136C) 1998 Nissan Altima Texas August/1998 Technical Report Documentation Page 1. Report No. 2. Government Accession
Remote, Redesigned Air Bag Special Study Dynamic Science, Inc., Case Number ( 1998-49-136C) 1998 Nissan Altima Texas August/1998 Technical Report Documentation Page 1. Report No. 2. Government Accession
Remote Combination Adaptive Driving Equipment Investigation Dynamic Science, Inc. (DSI), Case Number G 1990 Ford Bronco Arizona October
, Case Number G 1990 Ford Bronco Arizona October") Remote Combination Adaptive Driving Equipment Investigation Dynamic Science, Inc. (DSI), Case Number 2007-76-131G 1990 Ford Bronco Arizona October 2007 This document is disseminated under the sponsorship
Remote Combination Adaptive Driving Equipment Investigation Dynamic Science, Inc. (DSI), Case Number 2007-76-131G 1990 Ford Bronco Arizona October 2007 This document is disseminated under the sponsorship
SEVERITY MEASUREMENTS FOR ROLLOVER CRASHES
 SEVERITY MEASUREMENTS FOR ROLLOVER CRASHES Kennerly H Digges 1, Ana Maria Eigen 2 1 The National Crash Analysis Center, The George Washington University, USA 2 National Highway Traffic Safety Administration,
Remote, Redesigned Air Bag Special Study FOR NHTSA S INTERNAL USE ONLY Dynamic Science, Inc., Case Number ( J) 1998 Ford Taurus station
 1998 Ford Taurus station") Remote, Redesigned Air Bag Special Study FOR NHTSA S INTERNAL USE ONLY Dynamic Science, Inc., Case Number (1999-79-122J) 1998 Ford Taurus station wagon California September/1999 Technical Report Documentation
Remote, Redesigned Air Bag Special Study FOR NHTSA S INTERNAL USE ONLY Dynamic Science, Inc., Case Number (1999-79-122J) 1998 Ford Taurus station wagon California September/1999 Technical Report Documentation
The Evolution of Side Crash Compatibility Between Cars, Light Trucks and Vans
 2003-01-0899 The Evolution of Side Crash Compatibility Between Cars, Light Trucks and Vans Hampton C. Gabler Rowan University Copyright 2003 SAE International ABSTRACT Several research studies have concluded
Rates of Motor Vehicle Crashes, Injuries, and Deaths in Relation to Driver Age, United States,
 RESEARCH BRIEF This Research Brief provides updated statistics on rates of crashes, injuries and death per mile driven in relation to driver age based on the most recent data available, from 2014-2015.
HAS MOTORIZATION IN THE U.S. PEAKED? PART 9: VEHICLE OWNERSHIP AND DISTANCE DRIVEN, 1984 TO 2015
 SWT-2017-4 FEBRUARY 2017 HAS MOTORIZATION IN THE U.S. PEAKED? PART 9: VEHICLE OWNERSHIP AND DISTANCE DRIVEN, 1984 TO 2015 MICHAEL SIVAK SUSTAINABLE WORLDWIDE TRANSPORTATION HAS MOTORIZATION IN THE U.S.
CRASH ATTRIBUTES THAT INFLUENCE THE SEVERITY OF ROLLOVER CRASHES
 CRASH ATTRIBUTES THAT INFLUENCE THE SEVERITY OF ROLLOVER CRASHES Kennerly H. Digges Ana Maria Eigen The National Crash Analysis Center, The George Washington University USA Paper Number 231 ABSTRACT This
The Emerging Risk of Fatal Motorcycle Crashes with Guardrails
 Gabler (Revised 1-24-2007) 1 The Emerging Risk of Fatal Motorcycle Crashes with Guardrails Hampton C. Gabler Associate Professor Department of Mechanical Engineering Virginia Tech Center for Injury Biomechanics
HAS MOTORIZATION IN THE U.S. PEAKED? PART 5: UPDATE THROUGH 2012
 UMTRI-2014-11 APRIL 2013 HAS MOTORIZATION IN THE U.S. PEAKED? PART 5: UPDATE THROUGH 2012 MICHAEL SIVAK HAS MOTORIZATION IN THE U.S. PEAKED? PART 5: UPDATE THROUGH 2012 Michael Sivak The University of
--- SA. Research Note -.,; People Saving People Injuries Associated With Hazards Involving ~ Motor Vehicle "Rollaways"
 u.s. Department of Transportation National Highway Traffic Safety Administration --- SA -.,;. a ----~ ----- - -. People Saving People http://www.nhtsa.dot.gov Research Note Injuries Associated With Hazards
Relevance of head injuries in side collisions in Germany Comparison with the analyses and proposals of the WG13
 Relevance of head injuries in side collisions in Germany Comparison with the analyses and proposals of the WG13 Relevanz von Kopfanprallverletzungen bei Seitenkollisionen in Deutschland Vergleich mit den
HAS MOTORIZATION IN THE U.S. PEAKED? PART 10: VEHICLE OWNERSHIP AND DISTANCE DRIVEN, 1984 TO 2016
 SWT-2018-2 JANUARY 2018 HAS MOTORIZATION IN THE U.S. PEAKED? PART 10: VEHICLE OWNERSHIP AND DISTANCE DRIVEN, 1984 TO 2016 MICHAEL SIVAK SUSTAINABLE WORLDWIDE TRANSPORTATION HAS MOTORIZATION IN THE U.S.
On Site Side Air Curtain Investigation / Vehicle to Vehicle Dynamic Science, Inc. / Case Number: DS Lexus GS300 California June, 2002
 On Site Side Air Curtain Investigation / Vehicle to Vehicle Dynamic Science, Inc. / Case Number: DS02018 2002 Lexus GS300 California June, 2002 This document is disseminated under the sponsorship of the
Digges 1 INJURIES TO RESTRAINED OCCUPANTS IN FAR-SIDE CRASHES. Kennerly Digges The Automotive Safety Research Institute Charlottesville, Virginia, USA
 INJURIES TO RESTRAINED OCCUPANTS IN FAR-SIDE CRASHES Kennerly Digges The Automotive Safety Research Institute Charlottesville, Virginia, USA Dainius Dalmotas Transport Canada Ottawa, Canada Paper Number
HAS MOTORIZATION IN THE U.S. PEAKED? PART 2: USE OF LIGHT-DUTY VEHICLES
 UMTRI-2013-20 JULY 2013 HAS MOTORIZATION IN THE U.S. PEAKED? PART 2: USE OF LIGHT-DUTY VEHICLES MICHAEL SIVAK HAS MOTORIZATION IN THE U.S. PEAKED? PART 2: USE OF LIGHT-DUTY VEHICLES Michael Sivak The University
IS THE U.S. ON THE PATH TO THE LOWEST MOTOR VEHICLE FATALITIES IN DECADES?
 UMTRI-2008-39 JULY 2008 IS THE U.S. ON THE PATH TO THE LOWEST MOTOR VEHICLE FATALITIES IN DECADES? MICHAEL SIVAK IS THE U.S. ON THE PATH TO THE LOWEST MOTOR VEHICLE FATALITIES IN DECADES? Michael Sivak
Insert the title of your presentation here. Presented by Name Here Job Title - Date
 Insert the title of your presentation here Presented by Name Here Job Title - Date Automatic Insert the triggering title of your of emergency presentation calls here Matthias Presented Seidl by Name and
Safety Briefing on Roof Crush How a Strong Federal Roof Crush Standard Can Save Many Lives & Why the Test Must Include Both Sides of the Roof
 Safety Briefing on Roof Crush How a Strong Federal Roof Crush Standard Can Save Many Lives & Why the Test Must Include Both Sides of the Roof ~ Public Citizen ~ www.citizen.org The Importance of Far Side
MOTORISTS' PREFERENCES FOR DIFFERENT LEVELS OF VEHICLE AUTOMATION: 2016
 SWT-2016-8 MAY 2016 MOTORISTS' PREFERENCES FOR DIFFERENT LEVELS OF VEHICLE AUTOMATION: 2016 BRANDON SCHOETTLE MICHAEL SIVAK SUSTAINABLE WORLDWIDE TRANSPORTATION MOTORISTS' PREFERENCES FOR DIFFERENT LEVELS
ASSUMED VERSUS ACTUAL WEIGHTS OF VEHICLE PASSENGERS
 SWT-2017-1 JANUARY 2017 ASSUMED VERSUS ACTUAL WEIGHTS OF VEHICLE PASSENGERS MICHAEL SIVAK BRANDON SCHOETTLE SUSTAINABLE WORLDWIDE TRANSPORTATION ASSUMED VERSUS ACTUAL WEIGHTS OF VEHICLE PASSENGERS Michael
UMTRI An Examination of the Michigan 2010 Motor Vehicle Traffic Crash Fatality Increase
 UMTRI-2011-31 An Examination of the Michigan 2010 Motor Vehicle Traffic Crash Fatality Increase Carol A. Flannagan Andrew J. Leslie Helen K. Spradlin Charles P. Compton Caroline S. Lupini September 2011
ESTIMATING THE LIVES SAVED BY SAFETY BELTS AND AIR BAGS
 ESTIMATING THE LIVES SAVED BY SAFETY BELTS AND AIR BAGS Donna Glassbrenner National Center for Statistics and Analysis National Highway Traffic Safety Administration Washington DC 20590 Paper No. 500 ABSTRACT
Opportunities for Safety Innovations Based on Real World Crash Data
 Opportunities for Safety Innovations Based on Real World Crash Data Kennerly Digges National Crash Analysis Center, George Washington University, Abstract An analysis of NASS and FARS was conducted to
Using Injury Data to Understand Traffic and Vehicle Safety
 Using Injury Data to Understand Traffic and Vehicle Safety Carol A. Flannagan, Ph.D. Center for the Management of Information for Safe and Sustainable Transportation (CMISST), Biosciences, UMTRI Injury
Side Curtain Air Bag Investigation Dynamic Science, Inc. (DSI), Case Number DS Subaru B9 Tribeca Nebraska May 2008
, Case Number DS Subaru B9 Tribeca Nebraska May 2008") Side Curtain Air Bag Investigation Dynamic Science, Inc. (DSI), Case Number 2006 Subaru B9 Tribeca Nebraska May 2008 This document is disseminated under the sponsorship of the Department of Transportation
Side Curtain Air Bag Investigation Dynamic Science, Inc. (DSI), Case Number 2006 Subaru B9 Tribeca Nebraska May 2008 This document is disseminated under the sponsorship of the Department of Transportation
Statement before Massachusetts Auto Damage Appraiser Licensing Board. Institute Research on Cosmetic Crash Parts. Stephen L. Oesch.
 Statement before Massachusetts Auto Damage Appraiser Licensing Board Institute Research on Cosmetic Crash Parts Stephen L. Oesch INSURANCE INSTITUTE FOR HIGHWAY SAFETY 1005 N. GLEBE RD. ARLINGTON, VA 22201-4751
REAR SEAT BELT EFFECTIVENESS IN MICHIGAN
 REAR SEAT BELT EFFECTIVEESS I MICHIGA Kenneth L. Campbell Statistical Research Group University of Michigan Transportation Research Institute March 1988 This document is disseminated under the sponsorship
National Center for Statistics and Analysis Research and Development
 U.S. Department of Transportation National Highway Traffic Safety Administration DOT HS 809 271 June 2001 Technical Report Published By: National Center for Statistics and Analysis Research and Development
MOTORISTS' PREFERENCES FOR DIFFERENT LEVELS OF VEHICLE AUTOMATION
 UMTRI-2015-22 JULY 2015 MOTORISTS' PREFERENCES FOR DIFFERENT LEVELS OF VEHICLE AUTOMATION BRANDON SCHOETTLE MICHAEL SIVAK MOTORISTS' PREFERENCES FOR DIFFERENT LEVELS OF VEHICLE AUTOMATION Brandon Schoettle
ON-ROAD FUEL ECONOMY OF VEHICLES
 SWT-2017-5 MARCH 2017 ON-ROAD FUEL ECONOMY OF VEHICLES IN THE UNITED STATES: 1923-2015 MICHAEL SIVAK BRANDON SCHOETTLE SUSTAINABLE WORLDWIDE TRANSPORTATION ON-ROAD FUEL ECONOMY OF VEHICLES IN THE UNITED
TRANSPORTATION EMISSIONS IN THE CONTEXT
 SWT-2016-9 JULY 2016 TRANSPORTATION EMISSIONS IN THE CONTEXT OF EMISSIONS FROM OTHER ECONOMIC SECTORS: 1990-2014 MICHAEL SIVAK BRANDON SCHOETTLE SUSTAINABLE WORLDWIDE TRANSPORTATION TRANSPORTATION EMISSIONS
Remote, Redesigned Air Bag Special Study FOR NHTSA S INTERNAL USE ONLY Dynamic Science, Inc., Case Number ( E) 1998 Mercury Sable Nebraska
 1998 Mercury Sable Nebraska") Remote, Redesigned Air Bag Special Study FOR NHTSA S INTERNAL USE ONLY Dynamic Science, Inc., Case Number ( 1998-74-804E) 1998 Mercury Sable Nebraska October / 1998 Technical Report Documentation Page
Remote, Redesigned Air Bag Special Study FOR NHTSA S INTERNAL USE ONLY Dynamic Science, Inc., Case Number ( 1998-74-804E) 1998 Mercury Sable Nebraska October / 1998 Technical Report Documentation Page
Petition for Rulemaking; 49 CFR Part 571 Federal Motor Vehicle Safety Standards; Rear Impact Guards; Rear Impact Protection
 The Honorable David L. Strickland Administrator National Highway Traffic Safety Administration 1200 New Jersey Avenue, SE Washington, D.C. 20590 Petition for Rulemaking; 49 CFR Part 571 Federal Motor Vehicle
Crash Investigation Data in the United States October 2017
 Crash Investigation Data in the United States October 2017 Terry Shelton National Highway Traffic Safety Administration U.S. Department of Transportation NHTSA s Mission Save lives, prevent injuries and
BENEFITS OF RECENT IMPROVEMENTS IN VEHICLE FUEL ECONOMY
 UMTRI-2014-28 OCTOBER 2014 BENEFITS OF RECENT IMPROVEMENTS IN VEHICLE FUEL ECONOMY MICHAEL SIVAK BRANDON SCHOETTLE BENEFITS OF RECENT IMPROVEMENTS IN VEHICLE FUEL ECONOMY Michael Sivak Brandon Schoettle
STUDY OF AIRBAG EFFECTIVENESS IN HIGH SEVERITY FRONTAL CRASHES
 STUDY OF AIRBAG EFFECTIVENESS IN HIGH SEVERITY FRONTAL CRASHES Jeya Padmanaban (JP Research, Inc., Mountain View, CA, USA) Vitaly Eyges (JP Research, Inc., Mountain View, CA, USA) ABSTRACT The primary
FUEL-ECONOMY DISTRIBUTIONS OF PURCHASED NEW VEHICLES IN THE U.S.: MODEL YEARS 2008 AND 2014
 UMTRI-2015-4 FEBRUARY 2015 FUEL-ECONOMY DISTRIBUTIONS OF PURCHASED NEW VEHICLES IN THE U.S.: MODEL YEARS 2008 AND 2014 MICHAEL SIVAK BRANDON SCHOETTLE FUEL-ECONOMY DISTRIBUTIONS OF PURCHASED NEW VEHICLES
INDIANA UNIVERSITY TRANSPORTATION RESEARCH CENTER
 INDIANA UNIVERSITY TRANSPORTATION RESEARCH CENTER School of Public and Environmental Affairs 222West Second Street Bloomington, Indiana 47403-1501 (812) 855-3908 Fax: (812) 855-3537 SCI/NASS COMBINATION
Traffic Safety Facts
 Part 1: Read Sources Source 1: Informational Article 2008 Data Traffic Safety Facts As you read Analyze the data presented in the articles. Look for evidence that supports your position on the dangers
Statement before the Transportation Subcommittee, U.S. House of Representatives Appropriations Committee
 Statement before the Transportation Subcommittee, U.S. House of Representatives Appropriations Committee Airbag test requirements under proposed new rule Brian O Neill INSURANCE INSTITUTE FOR HIGHWAY SAFETY
Integrating OEM Vehicle ROPS to Improve Rollover Injury Probability Susie Bozzini*, Nick DiNapoli** and Donald Friedman***
 Integrating OEM Vehicle ROPS to Improve Rollover Injury Probability Susie Bozzini*, Nick DiNapoli** and Donald Friedman*** *Safety Engineering International Goleta, CA, USA ** Consultant *** Center for
Child Safety Seat Investigation Dynamic Science, Inc. / Case Number: DS Mercedes-Benz 190E California January 2008
 Child Safety Seat Investigation Dynamic Science, Inc. / Case Number: DS08001 1985 Mercedes-Benz 190E California January 2008 This document is disseminated under the sponsorship of the Department of Transportation
I-95 high-risk driver analysis using multiple imputation methods
 I-95 high-risk driver analysis using multiple imputation methods Kyla Marcoux Traffic Injury Research Foundation New Orleans, Louisiana July 26, 2010 Acknowledgements Authors: Robertson, R., Wood, K.,
First Do No Harm: Why Seatbelts are a Patient Care Issue. Noah Smith, NHTSA Office of EMS
 First Do No Harm: Why Seatbelts are a Patient Care Issue Noah Smith, NHTSA Office of EMS Hi, I m Noah Standard Bureaucratic Disclaimer To the extent that I mention specific brands or products in this presentation,
An Evaluation of the Relationship between the Seat Belt Usage Rates of Front Seat Occupants and Their Drivers
 An Evaluation of the Relationship between the Seat Belt Usage Rates of Front Seat Occupants and Their Drivers Vinod Vasudevan Transportation Research Center University of Nevada, Las Vegas 4505 S. Maryland
Appendix Baseline seats High Retention seats MAIS
 Appendix Table A1: 2001-2008 NASS-CDS crashes with GAD = B and 1992-2008 model year GM vehicles with baseline or high retention seats (n: sample size, se: standard error. Baseline seats High Retention
D1.3 FINAL REPORT (WORKPACKAGE SUMMARY REPORT)
") WP 1 D1.3 FINAL REPORT (WORKPACKAGE SUMMARY REPORT) Project Acronym: Smart RRS Project Full Title: Innovative Concepts for smart road restraint systems to provide greater safety for vulnerable road users.
WP 1 D1.3 FINAL REPORT (WORKPACKAGE SUMMARY REPORT) Project Acronym: Smart RRS Project Full Title: Innovative Concepts for smart road restraint systems to provide greater safety for vulnerable road users.
DRIVER SPEED COMPLIANCE WITHIN SCHOOL ZONES AND EFFECTS OF 40 PAINTED SPEED LIMIT ON DRIVER SPEED BEHAVIOURS Tony Radalj Main Roads Western Australia
 DRIVER SPEED COMPLIANCE WITHIN SCHOOL ZONES AND EFFECTS OF 4 PAINTED SPEED LIMIT ON DRIVER SPEED BEHAVIOURS Tony Radalj Main Roads Western Australia ABSTRACT Two speed surveys were conducted on nineteen
Rollovers of the future: strong roofs, ESC, and curtain airbags
 Rollovers of the future: strong roofs, ESC, and curtain airbags Matthew Brumbelow SAE Government / Industry Meeting 30 January 2013 Occupant fatalities per 1 million registrations Fatality rates in 1-3
A Cost-Benefit Analysis of Heavy Vehicle Underrun Protection
 A Cost-Benefit Analysis of Heavy Vehicle Underrun Protection Narelle Haworth 1 ; Mark Symmons 1 (Presenter) 1 Monash University Accident Research Centre Biography Mark Symmons is a Research Fellow at Monash
SCHOOL BUS COLLISION SUMMARY CANADA TP E
 SCHOOL BUS COLLISION SUMMARY CANADA 1989-1997 TP 13412 E SCHOOL BUS COLLISION SUMMARY CANADA 1989-1997 Prepared for: Transport Canada Safety and Security Road Safety and Motor Vehicle Regulation Ottawa,
POLICY POSITION ON THE PEDESTRIAN PROTECTION REGULATION
 POLICY POSITION ON THE PEDESTRIAN PROTECTION REGULATION SAFETY Executive Summary FIA Region I welcomes the European Commission s plan to revise Regulation 78/2009 on the typeapproval of motor vehicles,
White Paper. Compartmentalization and the Motorcoach
 White Paper Compartmentalization and the Motorcoach By: SafeGuard, a Division of IMMI April 9, 2009 Table of Contents Introduction 3 Compartmentalization in School Buses...3 Lap-Shoulder Belts on a Compartmentalized
Road Safety s Mid Life Crisis The Trends and Characteristics for Middle Aged Controllers Involved in Road Trauma
 Road Safety s Mid Life Crisis The Trends and Characteristics for Middle Aged Controllers Involved in Road Trauma Author: Andrew Graham, Roads and Traffic Authority, NSW Biography: Andrew Graham has been
DOT HS September NHTSA Technical Report
 DOT HS 809 144 September 2000 NHTSA Technical Report Analysis of the Crash Experience of Vehicles Equipped with All Wheel Antilock Braking Systems (ABS)-A Second Update Including Vehicles with Optional
Enhancing School Bus Safety and Pupil Transportation Safety
 For Release on August 26, 2002 (9:00 am EDST) Enhancing School Bus Safety and Pupil Transportation Safety School bus safety and pupil transportation safety involve two similar, but different, concepts.
The Weak Impact Of New NHTSA Side-Impact Standards
 The Weak Impact Of New NHTSA Side-Impact Standards By Walter C. Greenough Law360 January 31, 2014 Styrofoam does a decent job of keeping beer cold in a cooler. But, as anyone who has accidentally stepped
WHITE PAPER. Preventing Collisions and Reducing Fleet Costs While Using the Zendrive Dashboard
 WHITE PAPER Preventing Collisions and Reducing Fleet Costs While Using the Zendrive Dashboard August 2017 Introduction The term accident, even in a collision sense, often has the connotation of being an
BAC and Fatal Crash Risk
 BAC and Fatal Crash Risk David F. Preusser PRG, Inc. 7100 Main Street Trumbull, Connecticut Keywords Alcohol, risk, crash Abstract Induced exposure, a technique whereby not-at-fault driver crash involvements
National Center for Statistics and Analysis Research and Development
 U.S. Department of Transportation National Highway Traffic Safety Administration DOT HS 809 360 October 2001 Technical Report Published By: National Center for Statistics and Analysis Research and Development
CRASH TEST OF MILE POST MARKER. T. J. Hirsch Research Engineer. and. Eugene Buth Assistant Research Engineer. Research Report Number 146-8
 CRASH TEST OF MILE POST MARKER by T. J. Hirsch Research Engineer and Eugene Buth Assistant Research Engineer Research Report Number 146-8 Studies of Field Adaption of Impact Attenuation Systems Research
Missouri Seat Belt Usage Survey for 2017
 Missouri Seat Belt Usage Survey for 2017 Conducted for the Highway Safety & Traffic Division of the Missouri Department of Transportation by The Missouri Safety Center University of Central Missouri Final
HEAD AND NECK INJURY POTENTIAL IN INVERTED IMPACT TESTS
 HEAD AND NECK INJURY POTENTIAL IN INVERTED IMPACT TESTS Steve Forrest Steve Meyer Andrew Cahill SAFE Research, LLC United States Brian Herbst SAFE Laboratories, LLC United States Paper number 07-0371 ABSTRACT
NEW CRASH TESTS: SMALL CARS IMPROVE AND THE TOP PERFORMERS ALSO ARE FUEL SIPPERS
 NEWS RELEASE May 26, 2011 Contact: Russ Rader at 703/247-1500 (office) or at 202/257-3591 (cell) VNR: Thurs. 5/26/2011 10:30-11 am EDT (C) GALAXY 19/Trans. 15 (dl4000v) repeat 1:30-2 pm EDT (C) GALAXY
Fatal Motor Vehicle Crashes on Indian Reservations
 April 2004 DOT HS 809 727 Fatal Motor Vehicle Crashes on Indian Reservations 1975-2002 Technical Report Colleges & Universities 2% Other Federal Properties 9% Other 4% Indian Reservations 65% National
Hydro Plant Risk Assessment Guide
 September 2006 Hydro Plant Risk Assessment Guide Appendix E8: Battery Condition Assessment E8.1 GENERAL Plant or station batteries are key components in hydroelectric powerplants and are appropriate for
KENTUCKY TRANSPORTATION CENTER
 Research Report KTC-08-10/UI56-07-1F KENTUCKY TRANSPORTATION CENTER EVALUATION OF 70 MPH SPEED LIMIT IN KENTUCKY OUR MISSION We provide services to the transportation community through research, technology
Figure 15. Yearly Trend in Death Rates for Motor Vehicle Transport: NSW, Year
 6.0 MOTOR VEHICLE TRANSPORT 6.1 Deaths due to Motor Vehicle Transport: The motor vehicle transport (MV) death rate showed a statistically significant decrease overall between 1989 and 1999 although the
On-Site Rollover Investigation Dynamic Science, Inc. (DSI), Case Number DS Honda Civic LX Coupe Washington May 2008
, Case Number DS Honda Civic LX Coupe Washington May 2008") On-Site Rollover Investigation Dynamic Science, Inc. (DSI), Case Number DS08018 2006 Honda Civic LX Coupe Washington May 2008 This document is disseminated under the sponsorship of the Department of Transportation
On-Site Rollover Investigation Dynamic Science, Inc. (DSI), Case Number DS08018 2006 Honda Civic LX Coupe Washington May 2008 This document is disseminated under the sponsorship of the Department of Transportation
Investigation of Relationship between Fuel Economy and Owner Satisfaction
 Investigation of Relationship between Fuel Economy and Owner Satisfaction June 2016 Malcolm Hazel, Consultant Michael S. Saccucci, Keith Newsom-Stewart, Martin Romm, Consumer Reports Introduction This
ENERGY INTENSITIES OF FLYING AND DRIVING
 UMTRI-2015-14 APRIL 2015 ENERGY INTENSITIES OF FLYING AND DRIVING MICHAEL SIVAK ENERGY INTENSITIES OF FLYING AND DRIVING Michael Sivak The University of Michigan Transportation Research Institute Ann Arbor,
There have been airbag-like devices for aeroplanes as early as the 1940s, with the first patents filed in the 1950s.
 Airbags An airbag, also known as a Supplementary/Secondary Restraint System (SRS) or as an Air Cushion Restraint System (ACRS), is a flexible membrane or envelope, inflatable to contain air or some other
Traffic Safety Facts Research Note
 Traffic Safety Facts Research Note DOT HS 810 947 May 2008 Fatalities to Occupants of 15-Passenger Vans, 1997-2006 Summary n In 2006, fatalities to occupants of 15-passenger vans reached the lowest level
SEAT BELTS AND AIRBAGS. Mercedes-Benz
 SEAT BELTS AND AIRBAGS Mercedes-Benz Competence in Safety. Safety is indivisible. Mercedes-Benz has been passionate about making cars each one even better than the last from day one. Since the first model
Methodologies and Examples for Efficient Short and Long Duration Integrated Occupant-Vehicle Crash Simulation
 13 th International LS-DYNA Users Conference Session: Automotive Methodologies and Examples for Efficient Short and Long Duration Integrated Occupant-Vehicle Crash Simulation R. Reichert, C.-D. Kan, D.
NEW-VEHICLE MARKET SHARES OF CARS VERSUS LIGHT TRUCKS IN THE U.S.: RECENT TRENDS AND FUTURE OUTLOOK
 SWT-2017-10 JUNE 2017 NEW-VEHICLE MARKET SHARES OF CARS VERSUS LIGHT TRUCKS IN THE U.S.: RECENT TRENDS AND FUTURE OUTLOOK MICHAEL SIVAK BRANDON SCHOETTLE SUSTAINABLE WORLDWIDE TRANSPORTATION NEW-VEHICLE
Frontal Corner Impacts Crash Tests and Real-World Experience
 Frontal Corner Impacts Crash Tests and Real-World Experience D J Dalmotas*, A German* and P Prasad** * D.J. Dalmotas Consulting Inc., 370 Chemin d'aylmer, Gatineau, QC J9H 1A7, Canada ** Prasad Engineering,
Understanding Traffic Data: How To Avoid Making the Wrong Turn
 Traffic Records Forum 2011 Understanding Traffic Data: How To Avoid Making the Wrong Turn Presenter: Marc Starnes (202) 366-2186 marc.starnes@dot.gov August 3rd, 2011 1 Summary of Topics Police Crash Reports
Sport Shieldz Skull Cap Evaluation EBB 4/22/2016
 Summary A single sample of the Sport Shieldz Skull Cap was tested to determine what additional protective benefit might result from wearing it under a current motorcycle helmet. A series of impacts were
Correct driving posture
 Correct driving posture Drive in a good posture as follows: Sit upright and well back in the seat. ( P. 22) Adjust the position of the seat forward or backward to ensure the pedals can be reached and easily
Types of Product Liability Claims to Consider. Toby D. Brown, Esq. Cunningham Bounds, LLC 1601 Dauphin Street Mobile, Alabama 36604
 Types of Product Liability Claims to Consider Toby D. Brown, Esq. Cunningham Bounds, LLC 1601 Dauphin Street Mobile, Alabama 36604 Screen all serious injury cases for Auto product liability claims Workplace
VOLKSWAGEN. Volkswagen Safety Features
 Volkswagen Safety Features Volkswagen customers recognize their vehicles are designed for comfort, convenience and performance. But they also rely on vehicles to help protect them from events they hope
Why do People Die in Road Crashes?
 Why do People Die in Road Crashes? Prepared for: Ministry of Transport April 2016 Page 1 of 24 Transport Engineering Research New Zealand Limited (TERNZ) is a research organisation providing high quality
NON-FATAL ELECTRICAL INJURIES AT WORK
 NON-FATAL ELECTRICAL INJURIES AT WORK Richard Campbell May 2018 Copyright 2018 National Fire Protection Association (NFPA) CONTENTS Findings and Trends 1 Key Takeaways 2 Background on Data Sources and
REPORT NUMBER: 301-CAL SAFETY COMPLIANCE TESTING FOR FMVSS 301 FUEL SYSTEM INTEGRITY HONDA MOTOR COMPANY 2007 HONDA ACCORD 4-DOOR SEDAN
 REPORT NUMBER: 301-CAL-07-05 SAFETY COMPLIANCE TESTING FOR FMVSS 301 FUEL SYSTEM INTEGRITY HONDA MOTOR COMPANY 2007 HONDA ACCORD 4-DOOR SEDAN NHTSA NUMBER: C75304 CALSPAN TEST NUMBER: 8832-F301-05 CALSPAN
Stakeholder Meeting: FMVSS Considerations for Automated Driving Systems
 Stakeholder Meeting: FMVSS Considerations for Automated Driving Systems 200-Series Breakout Sessions 1 200-Series Breakout Session Focus Panel Themes 201 202a 203 204 205 206 207 208 210 214 216a 219 222
Statistics and Facts About Distracted Driving
 Untitled Document Statistics and Facts About Distracted Driving What does it mean to be a distracted driver? Are you one? Learn more here. What Is Distracted Driving? There are three main types of distraction:
INSURANCE INSTITUTE FOR HIGHWAY SAFETY
 INSURANCE INSTITUTE FOR HIGHWAY SAFETY Rosalyn G. Millman, Acting Administrator National Highway Traffic Safety Administration 400 7th Street S.W. Washington, D.C. 20590 Dear Ms. Millman: Re: Docket No.
DOT HS April 2013
 TRAFFIC SAFETY FACTS 2011 Data DOT HS 811 753 April 2013 Overview Motor vehicle travel is the primary means of transportation in the United States, providing an unprecedented degree of mobility. Yet for
Keywords: wheelchair base frames, frontal-impact crashworthiness, crash testing, wheelchair transportation safety, surrogate seating system
 Patterns of Occupied Wheelchair Frame Response in Forward-Facing Frontal-Impact Sled Tests Julia E. Samorezov, Miriam A. Manary, Monika M. Skowronska, Gina E. Bertocci*, and Lawrence W. Schneider University
In-depth analysis of speed-related road crashes
 Summary In-depth analysis of speed-related road crashes TØI Report 1569/2017 Author: Alena Høye Oslo 2017 109 pages Norwegian language The report summarizes detailed results of in-depth investigations
KANSAS Occupant Protection Observational Survey Supplementary Analyses Summer Study
 KANSAS Occupant Protection Observational Survey Supplementary Analyses 2018 Summer Study Submitted To: Kansas Department of Transportation Bureau of Transportation Safety and Technology Prepared by: DCCCA
Development of Turning Templates for Various Design Vehicles
 Transportation Kentucky Transportation Center Research Report University of Kentucky Year 1991 Development of Turning Templates for Various Design Vehicles Kenneth R. Agent Jerry G. Pigman University of
AIRBAG: IS IT AN EFFECTIVE OCCUPANT PROTECTION SYSTEM?
 AIRBAG: IS IT AN EFFECTIVE OCCUPANT PROTECTION SYSTEM? Rajasekhar Basavaraju Center for Transportation Research and Education Iowa State University ABSTRACT The role of airbag as an occupant protection
Driver Speed Compliance in Western Australia. Tony Radalj and Brian Kidd Main Roads Western Australia
 Driver Speed Compliance in Western Australia Abstract Tony Radalj and Brian Kidd Main Roads Western Australia A state-wide speed survey was conducted over the period March to June 2 to measure driver speed
UNDERSTANDING MOTOR VEHICLE CRASH MECHANISMS AND INJURIES
 UNDERSTANDING MOTOR VEHICLE CRASH MECHANISMS AND INJURIES Todd G. Thoma, MD FACEP Coroner, Caddo Parish Associate Professor, Department of Emergency Medicine Louisiana State University Health Sciences