Analysis of unsustainable inequalities of CO2 emissions from countries and per capita
|
|
|
- Derek Hunter
- 6 years ago
- Views:
Transcription
1 Renewables International, July 2014, Analysis of unsustainable inequalities of CO2 emissions from countries and per capita Bernard CHABOT Renewable Energy Consultant and Trainer BCCONSULT, Garbejaire B107, VALBONE, France 1
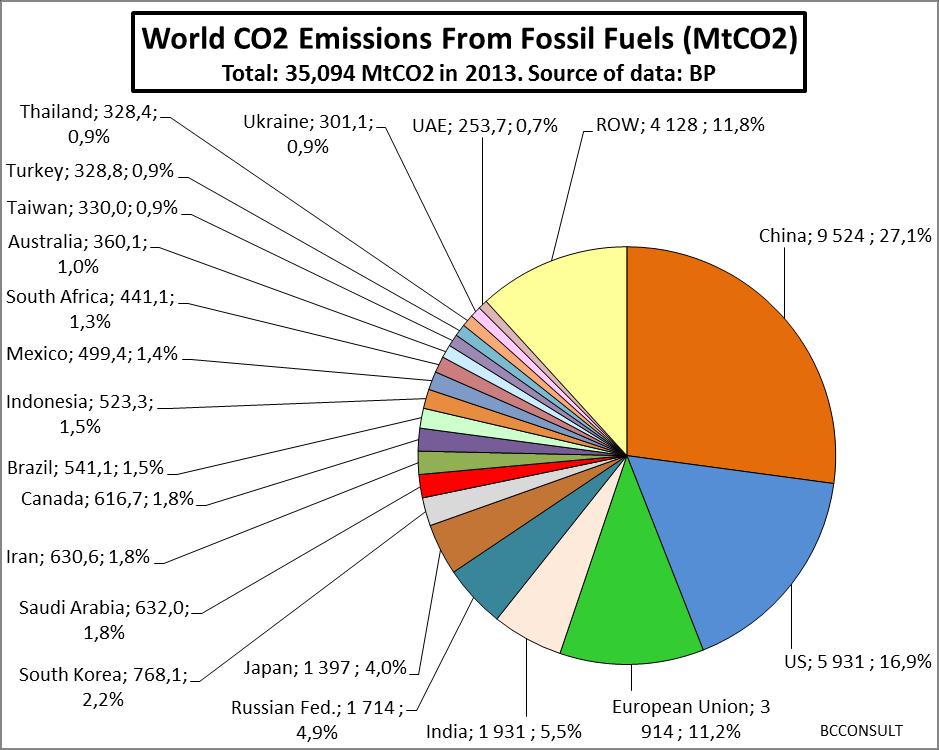
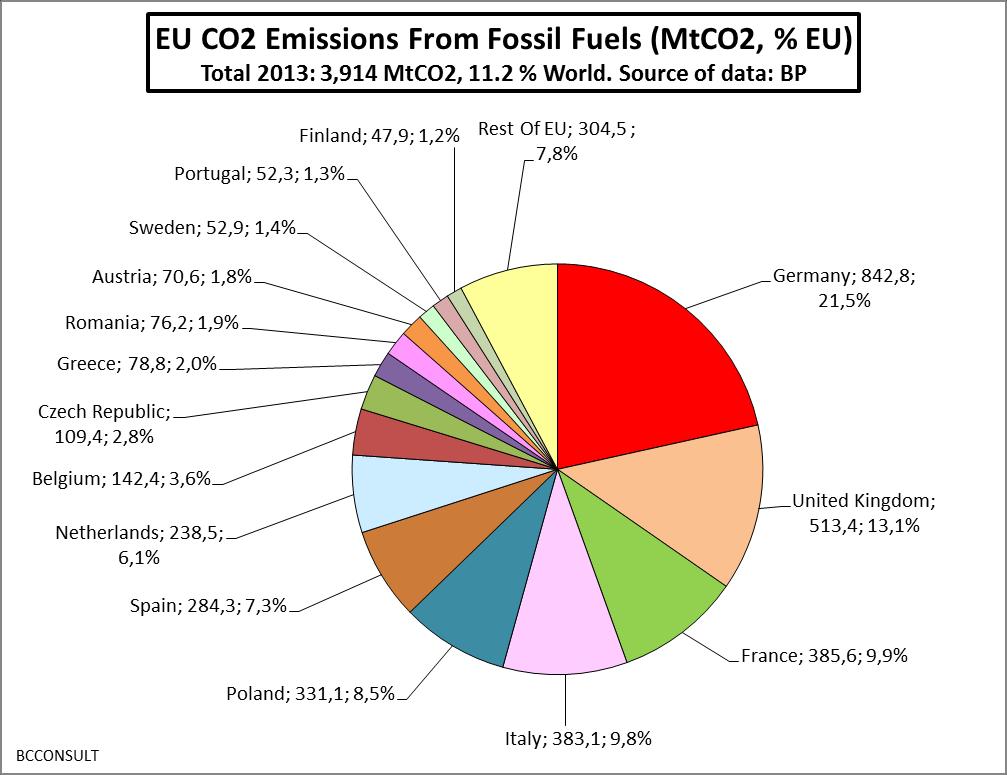
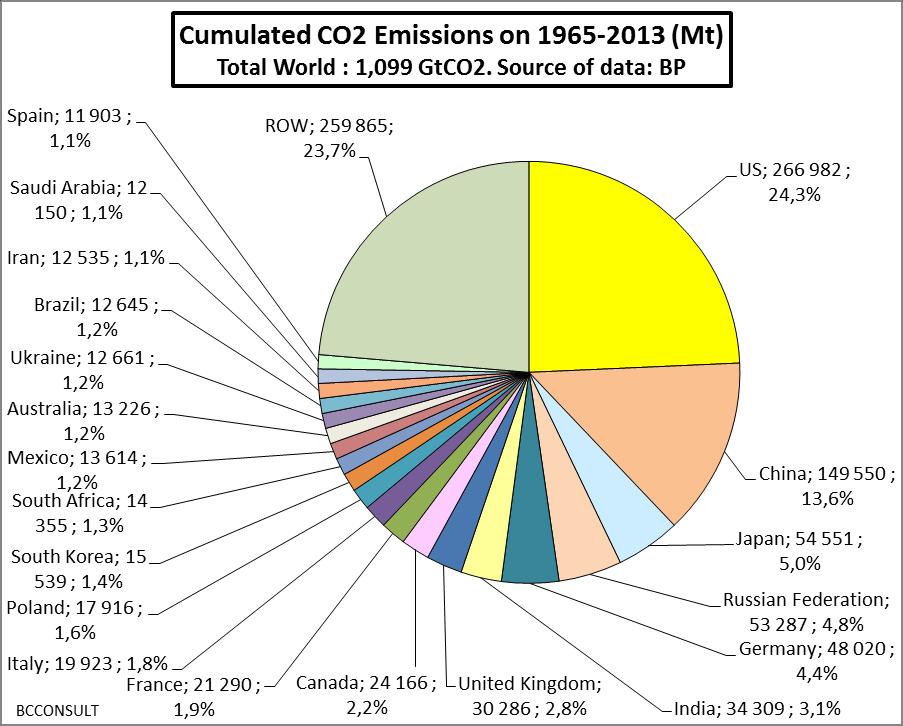
2 Main Findings and Conclusions (1/2) CO2 emissions from fossil fuels in 2013 by group of countries (slide 6) shows the discrepancies between emissions from OECD and non OECD countries (40 % versus 60 %), the large relative parts of BRICS (Brazil, Russia, India, China, South Africa: 40 % of which 27 % from China), and in OECD countries the large part (1/3 rd ) from the three main economies: USA (17 %), European Union (EU: 11 %) and Japan (4 %). Common bilateral positions and proposals between major emitters such as [China + USA] (44 % of world CO2 emissions) and [USA + EU] (32 %) could help to define and to implement effective policies and measures to decrease CO2 emissions. Detailed CO2 emissions from countries shows the large share from a limited number of countries: ¾ of world CO2 emissions in 2013 are from only 9 countries (considering EU as one country, see slide 7), and ¾ in the EU from only 7 countries (slide 8). 80 % of world emissions are from only 12 countries, 90 % from only 27 countries and 95 % from only 41 countries (see table in slide 9). If EU countries are considered separately (see table in slide 25), 90 % of world CO2 emissions in 2012 were from only 33 countries representing 73 % of the world population. Those discrepancies are even more obvious for the shares of the 1100 Gt of cumulative emissions of CO2 from fossil fuels on (slide 9): ¼ from USA, more than ½ form only 5 countries, and more than ¾ from only 20 countries. Forget average world CO2 emissions per capita : looking only to this average (5,35 tco2 per capita emitted from burning fossil fuels and cement production in 2012) hides the unsustainable discrepancies of this fundamental parameter between countries, not speaking of discrepancies within each country between emissions by their classes of inhabitants (rural versus urban, high income versus low income ). Near 80 % of world 2012 CO2 emissions are from countries with mean emissions per capita higher than the world average of 5.35 tco2/capita (slide 12), and 40 % of world population emit more than this average (slide 13). Those large discrepancies between emissions per capita in the different countries require a detailed analysis base both on actual data and case studies and on a model which is proposed here (see next slide). 2
3 Main Findings and Conclusions (2/2) 22 case studies based on 2012 CO2 emissions from fossil fuels and cement production from group of countries are presented: 11 for the most CO2 emitting per capita group of countries (slide 14) and 11 for the less CO2 emitting per capita group of countries (slide 15) 4 countries (case study 2 on slide 14) with only 10.8 Million inhabitants and emitting more than 33 tco2/capita emitted more than 1.2 % of the world CO2 in 2012: 405 MtCO2, more than from the less emitting 1.2 billion inhabitants. 14 countries or territories (case study 4 on slide 14) with 5.67 % of world population (393 M people) and emitting more than 19.3 tco2/capita emitted more than 20 % of the world CO2 in 2012 (6.8 btco2, more than the aggregated CO2 emissions from the less emitting 4 billion inhabitants on our planet) More than 1.5 billion people (22 % of world population, case study N 15 in table 15) emitting less than 1.63 tco2/year (or less than 31 % of the world average of 5.35 tco2/capita in 2012) emitted only 2 % of the world CO2 (661 Mt), less than the 731 MtCO2 emitted by the 81.5 million inhabitants of Germany. Near 100 million people in four countries or territories (1.43 % of world population, case study N 22 in table 15) and emitting less than 43 kgco2/capita in 2012 or less than 0.8 % of the world 2012 average of 5350 kgco2/capita) emitted only 4.1 MtCO2 in 2012, less than the 4.21 MtCO2 emitted by the.256 thousand inhabitants of the New Caledonia territory. The best model to describe those discrepancies in CO2 emissions per capita versus the cumulated number of inhabitants is a logarithmic one (slides 17 and 18). The related curve of the cumulative % of world CO2 emissions versus the cumulative % of inhabitants describes fits very well with actual data and case studies (slides 19 to 22). Comparison of this curve with a fair perfect theoretical distribution model of emissions (slide 23) shows clearly how unsustainable is the present distribution of CO2 emissions per capita, and puts in evidence the required dramatic decrease in CO2 emissions per capita to change this situation by deciding and implementing fair and efficient energy and climate change policies and measures. 3
4 Introduction and Content Analysis based mainly on data from the «BP Statistical Review 2014» ( from the «Global Carbon Budget 2013» ( and from the Carbon Dioxide Information Analysis Center CDIAC ( and for the number of inhabitants from the US-EIA data for 2010 ( Refer to preceding analysis and conclusions on CO2 emissions from primary energy consumption and from electricity production: «King Coal Demystified: Its Too Large Share In Primary Energy Consumption (PEC) And Its Huge Responsibility In CO2 Emissions», on line July 15, and downloadable as PDF at: Analysis of the Global Electricity Production up to 2013 With a Focus On the Contribution From Renewables, on line July 14, and downloadable as PDF at: The three Elephants in the Room : Coal, Oil and Gas in the Primary Energy Consumption (PEC) and their CO2 Emissions up to 2013, on line on July 9, 2014 and downloadable as PDF at: CONTENT: CO2 emissions by countries: Slides N 4-9 CO2 Emissions per capita: Slides N A proposed model for C02 emissions per capita: Slides N ANNEX : Detailed data on CO2 emissions : Slides
5 World CO2 Emissions By Countries and Group of Countries in 2013 and on

6 USA + China: Mt; 44 % 6
7 7
8 8
9 Source of data: BP Statistical Review 2014 Total North Am erica ,1% Total S. & Cent. America ,1% Total Europe & Eurasia ,8% Total Middle East ,0% Total Africa ,3% Total Asia Pacific ,7% Total World ,0% of w hich: OECD ,7% Non-OECD ,3% European Union ,2% Former Soviet Union ,3% ROW ,6% 100,0% 1 China ,1% 27,1% 2 US ,9% 44,0% 3 European Union ,2% 55,2% 4 India ,50% 60,7% 5 Russian Federation ,88% 65,6% 6 Japan ,98% 69,6% 7 South Korea 768,1 2,19% 71,7% 8 Saudi Arabia 632,0 1,80% 73,6% 9 Iran 630,6 1,80% 75,3% 10 Canada 616,7 1,76% 77,1% 11 Brazil 541,1 1,54% 78,6% 12 Indonesia 523,3 1,49% 80,1% 14 Mexico 499,4 1,42% 81,6% 15 South Africa 441,1 1,26% 82,8% 18 Australia 360,1 1,03% 83,8% 20 Taiw an 330,0 0,94% 84,8% 21 Turkey 328,8 0,94% 85,7% 22 Thailand 328,4 0,94% 86,7% 23 Ukraine 301,1 0,86% 87,5% 24 United Arab Emirates 253,7 0,72% 88,2% 25 Malaysia 234,7 0,67% 88,9% 26 Singapore 224,6 0,64% 89,5% 27 Egypt 224,0 0,64% 90,2% 28 Kazakhstan 209,5 0,60% 90,8% 29 Argentina 194,5 0,55% 91,3% 30 Venezuela 176,6 0,50% 91,8% 31 Pakistan 166,4 0,47% 92,3% 32 Vietnam 137,1 0,39% 92,7% 33 Algeria 121,9 0,35% 93,1% 34 Uzbekistan 110,5 0,31% 93,4% 35 Kuw ait 104,5 0,30% 93,7% 36 Chile 92,2 0,26% 93,9% 37 China Hong Kong SAR 90,8 0,26% 94,2% 38 Philippines 90,8 0,26% 94,4% 39 Colombia 82,2 0,23% 94,7% 40 Qatar 80,7 0,23% 94,9% 41 Israel 76,1 0,22% 95,1% 42 Bangladesh 67,9 0,19% 95,3% 43 Turkmenistan 66,4 0,19% 95,5% 44 Belarus 65,6 0,19% 95,7% 45 Trinidad & Tobago 53,0 0,15% 95,8% 46 Peru 47,9 0,14% 96,0% 47 Sw itzerland 44,3 0,13% 96,1% 48 New Zealand 37,1 0,11% 96,2% 49 Ecuador 36,8 0,10% 96,3% 50 Azerbaijan 32,3 0,09% 96,4% 9
10 10
11 CO2 Emissions Per Capita From Burning Fossil Fuels And From Cement Production in
12 12
13 13
14 World N Country/territ. : % population, emit: 100,00 % world CO2 Million people: Sum MtCO2/y: Emit average: 5,35 tco2/cap.year N Country/territ. : 1 0,03 % pop, emit more than: 0,27 % world CO2 Million people: 1,85 Sum MtCO2/y: 90,36 Emit > to: 48,9 tco2/cap.year N Country/territ. : 4 0,16 % pop, emit more than: 1,21 % world CO2 Million people: 10,8 Cum CO2/an: 405,16 Emit > to: 33,2 tco2/cap.year N Country/territ. : 11 0,61 % pop, emit more than: 3,06 % world CO2 Million people: 42,4 Cum CO2/an: Emit > to: 19,3 tco2/cap.year N Country/territ. : 14 5,67 % pop, emit more than: 20,37 % world CO2 Million people: 393,1 Cum CO2/an: Emit > to: 16,4 tco2/cap.year N Country/territ. : 21 8,24 % pop, emit more than: 27,35 % world CO2 Million people: 571,3 Cum CO2/an: Emit > to: 12,6 tco2/cap.year N Country/territ. : 26 9,35 % pop, emit more than: 30,14 % world CO2 Million people: 648,1 Cum CO2/an: Emit > to: 11,3 tco2/cap.year N Country/territ. : 34 11,84 % pop, emit more than: 35,28 % world CO2 Million people: 820,7 Cum CO2/an: Emit > to: 9,84 tco2/cap.year N Country/territ. : 38 13,95 % pop, emit more than: 39,29 % world CO2 Million people: 966,9 Cum CO2/an: Emit > to: 8,98 tco2/cap.year N Country/territ. : 41 14,56 % pop, emit more than: 40,31 % world CO2 Million people: Cum CO2/an: Emit > to: 8,00 tco2/cap.year N Country/territ. : 53 37,14 % pop, emit more than: 74,30 % world CO2 Million people: Cum CO2/an: Emit > to: 7,20 tco2/cap.year N Country/territ. : 81 41,82 % pop, emit more than: 80,04 % world CO2 Million people: Cum CO2/an: Emit > to: 4,84 tco2/cap.year Example: case N 4: 14 countries or territories with 5.67 % of world population (393 M people) and emitting more than 19.3 tco2/capita emitted more than 20 % of world CO2 in 2012 (6.8 btco2, more than from the less emitting 58 % of people) 14
15 World N Country/territ. : % population, emit: 100,00 % world CO2 Source of data: CDIAC, EIA Million people: Sum MtCO2/y: Emit average: 5,35 tco2/cap.year BCCONSULT, July 2014 N Country/territ. : ,77% of people emit less than: 13,7% % world CO2 Less CO2/year than: Million people: Cum. Mt/an: Emit < to: 2,62 tco2/cap.year USA (311.6 M people) N Country/territ. : 84 42,03% of people emit less than: 9,8% % world CO2 Less CO2/year than: Million people: Cum. Mt/an: Emit < to: 1,88 tco2/cap.year European Union (510 M people) N Country/territ. : 82 24,73% of people emit less than: 3,0% % world CO2 Less CO2/year than: Million people: Cum. Mt/an: 998,8 Emit < to: 1,81 tco2/cap.year Japan (127.5 M people) N Country/territ. : 76 21,97% of people emit less than: 2,0% % world CO2 Less CO2/year than: Million people: Cum. Mt/an: 661,1 Emit < to: 1,63 tco2/cap.year Germany (81.47 M people) N Country/territ. : 59 16,71% of people emit less than: 0,99% % world CO2 Less CO2/year than: Million people: Cum. Mt/an: 331,6 Emit < to: 0,813 tco2/cap.year France (65.3 M people) N Country/territ. : 42 15,42% of people emit less than: 0,82% % world CO2 Less CO2/year than: Million people: Cum. Mt/an: 272,6 Emit < to: 0,489 tco2/cap.year Spain (46.75 M people) N Country/territ. : 32 9,05% of people emit less than: 0,26% % world CO2 Less CO2/year than: Million people: 626,9 Cum. Mt/an: 85,57 Emit < to: 0,305 tco2/cap.year Qatar (1.85 M people) N Country/territ. : 19 5,79% of people emit less than: 0,10% % world CO2 Less CO2/year than: Million people: 401,1 Cum. Mt/an: 32,63 Emit < to: 0,138 tco2/cap.year Ireland (4.67 M people) N Country/territ. : 13 4,09% of people emit less than: 0,05% % world CO2 Less CO2/year than: Million people: 283,5 Cum. Mt/an: 18,05 Emit < to: 0,096 tco2/cap.year Estonia (1.28 M people) N Country/territ. : 9 3,24% of people emit less than: 0,04% % world CO2 Less CO2/year than: Million people: 224,5 Cum. Mt/an: 12,76 Emit < to: 0,076 tco2/cap.year Singapore (5.247 M people) N Country/territ. : 4 1,43% of people emit less than: 0,012% % world CO2 Less CO2/year than: Million people: 98,9 Cum. Mt/an: 4,09 Emit < to: 0,043 tco2/cap.year New Caldonia (0.256 M people) Example 1: Case N 15: more than 1.5 billion people (22 % of world population) emitting less than 1.63 tco2/year (or less than 31 % of the world average of 5.35 tco2/capita in 2012) emitted only 2 % of the world CO2 (661 Mt), less than the 731 MtCO2 emitted by the 81.5 million inhabitants of Germany. Example 2: Case N 22: near 100 million people in four countries or territories (1.43 % of world population) and emitting less than 43 kgco2/capita in 2012 or less than 0.8 % of the world 2012 average of 5350 kgco2/capita) emitted only 4.1 MtCO2 in 2012, less than the 4.21 MtCO2 emitted by the million inhabitants of the New Caledonia territory. 15
16 A proposed model for the analysis of CO2 emissions per capita and their cumulated values 16
17 17
18 The proposed logarithmic model for the per capita emissions versus the cumulated % of population 18
19 The resulting model for the % of world C02 emissions versus the cumulated % of population 19
20 The model fits well with the actual distribution of % of world C02 emissions vs cumulated % of population Blue diamonds : 16 cases of emissions of group of countries 20
21 The model fits well with the actual distribution of % of world C02 emissions vs cumulated % of population 21
22 The model fits well with the actual distribution of % of world C02 emissions vs cumulated % of population 22
23 The resulting model for the % of world C02 emissions versus the cumulated % of population and its comparison with a fair and perfect theoretical distribution model of emissions 23
24 ANNEX: Detailed Data for CO2 Emissions From Burning Fossil Fuels And From Cement Production in
25 2012 ranking of CO2 emissions from fossil fuels and cement production Source of data: CDIAC, EIA Rank Country MtCO tco2/c.y N people % MtCO2 Cum. % CO2 % people Cum % p. 1 China 9 620,67 7, ,718 28,81% 28,8% 19,29% 19,3% 2 USA 5 117,84 16,42 311,592 15,32% 44,1% 4,50% 23,8% 3 India 2 239,53 1, ,173 6,71% 50,8% 17,16% 40,9% 4 Russian Fed ,10 12,64 142,526 5,40% 56,2% 2,06% 43,0% 5 Japan 1 254,08 9,84 127,470 3,75% 60,0% 1,84% 44,8% 6 Germany 731,76 8,98 81,472 2,19% 62,2% 1,18% 46,0% 7 South Korea 610,71 12,49 48,900 1,83% 64,0% 0,71% 46,7% 8 Iran 602,72 7,74 77,891 1,80% 65,8% 1,12% 47,8% 9 Saudi Arabia 505,18 19,33 26,132 1,51% 67,3% 0,38% 48,2% 10 Canada 504,97 14,84 34,031 1,51% 68,8% 0,49% 48,7% 11 Indonesia 476,27 1,94 246,065 1,43% 70,3% 3,55% 52,3% 12 Mexico 476,11 4,19 113,724 1,43% 71,7% 1,64% 53,9% 13 United Kingdom 470,80 7,51 62,698 1,41% 73,1% 0,90% 54,8% 14 South Africa 460,72 9,40 49,004 1,38% 74,5% 0,71% 55,5% 15 Brazil 447,31 2,26 197,596 1,34% 75,8% 2,85% 58,4% 16 Italy 375,08 6,15 61,017 1,12% 76,9% 0,88% 59,2% 17 Australia 370,60 17,03 21,767 1,11% 78,0% 0,31% 59,6% 18 France 343,36 5,26 65,296 1,03% 79,1% 0,94% 60,5% 19 Ukraine 323,84 7,17 45,135 0,97% 80,0% 0,65% 61,2% 20 Thailand 322,59 4,84 66,720 0,97% 81,0% 0,96% 62,1% 21 Turkey 310,93 3,95 78,786 0,93% 81,9% 1,14% 63,3% 22 Poland 307,39 8,00 38,442 0,92% 82,9% 0,55% 63,8% 23 Kazakhstan 291,72 16,86 17,305 0,87% 83,7% 0,25% 64,1% 24 Spain 277,28 5,93 46,755 0,83% 84,6% 0,67% 64,7% 25 Taiwan 262,19 11,31 23,174 0,79% 85,4% 0,33% 65,1% 26 Malaysia 216,00 7,52 28,729 0,65% 86,0% 0,41% 65,5% 27 Egypt 214,89 2,62 82,080 0,64% 86,6% 1,18% 66,7% 28 Venezuela 207,38 7,50 27,636 0,62% 87,3% 0,40% 67,1% 29 Argentina 196,20 4,70 41,770 0,59% 87,9% 0,60% 67,7% 30 UAE 171,19 33,25 5,149 0,51% 88,4% 0,07% 67,7% 31 Netherlands 166,42 9,99 16,654 0,50% 88,9% 0,24% 68,0% 32 Viet Nam 163,50 1,81 90,549 0,49% 89,4% 1,31% 69,3% 33 Pakistan 161,41 0,86 187,343 0,48% 89,8% 2,70% 72,0% 34 Algeria 138,02 3,77 36,654 0,41% 90,2% 0,53% 72,5% 35 Iraq 122,12 4,02 30,400 0,37% 90,6% 0,44% 73,0% 36 Uzbekistan 110,09 3,91 28,129 0,33% 90,9% 0,41% 73,4% 37 Czech Republic 103,65 10,17 10,190 0,31% 91,3% 0,15% 73,5% 38 Belgium 99,11 9,50 10,431 0,30% 91,5% 0,15% 73,7% 39 Kuwait 96,58 37,21 2,596 0,29% 91,8% 0,04% 73,7% 40 Chile 90,79 5,37 16,915 0,27% 92,1% 0,24% 73,9% 41 Qatar 90,36 48,86 1,849 0,27% 92,4% 0,03% 74,0% 42 Philippines 86,56 0,85 101,834 0,26% 92,6% 1,47% 75,4% 43 Greece 81,67 7,59 10,760 0,24% 92,9% 0,16% 75,6% 44 Romania 81,38 3,72 21,905 0,24% 93,1% 0,32% 75,9% 45 Nigeria 81,15 0,49 165,823 0,24% 93,4% 2,39% 78,3% 46 Colombia 80,54 1,80 44,726 0,24% 93,6% 0,65% 79,0% 47 Israel 76,68 10,26 7,473 0,23% 93,8% 0,11% 79,1% 48 North Korea 75,13 3,09 24,300 0,22% 94,1% 0,35% 79,4% 49 Syria 65,57 2,91 22,518 0,20% 94,3% 0,32% 79,7% 50 Peru 65,24 2,23 29,249 0,20% 94,5% 0,42% 80,2% 2012 ranking of CO2 emissions from fossil fuels and cement production Source of data: CDIAC, EIA Rank Country MtCO tco2/c.y N people % MtCO2 Cum. % CO2 % people Cum % p. 51 Bangladesh 64,88 0,41 158,571 0,19% 94,7% 2,29% 82,4% 52 Belarus 61,95 6,41 9,662 0,19% 94,8% 0,14% 82,6% 53 Libya 61,10 10,59 5,767 0,18% 95,0% 0,08% 82,7% 54 Austria 59,77 7,27 8,217 0,18% 95,2% 0,12% 82,8% 55 Oman 58,97 19,47 3,028 0,18% 95,4% 0,04% 82,8% 56 Norway 58,02 12,37 4,692 0,17% 95,6% 0,07% 82,9% 57 Turkmenistan 55,18 11,04 4,998 0,17% 95,7% 0,07% 83,0% 58 Portugal 52,64 4,89 10,760 0,16% 95,9% 0,16% 83,1% 59 Morocco 52,29 1,64 31,968 0,16% 96,0% 0,46% 83,6% 60 Azerbaijan 50,92 5,42 9,397 0,15% 96,2% 0,14% 83,7% 61 Serbia 47,84 6,54 7,311 0,14% 96,3% 0,11% 83,8% 62 Finland 47,83 9,10 5,259 0,14% 96,5% 0,08% 83,9% 63 Trinidad and Tobago 47,03 38,31 1,228 0,14% 96,6% 0,02% 83,9% 64 Hungary 46,44 4,66 9,976 0,14% 96,7% 0,14% 84,1% 65 Bulgaria 45,49 6,41 7,094 0,14% 96,9% 0,10% 84,2% 66 Sweden 44,82 4,93 9,089 0,13% 97,0% 0,13% 84,3% 67 Cuba 39,83 3,59 11,087 0,12% 97,1% 0,16% 84,5% 68 Hong Kong 38,41 5,39 7,123 0,12% 97,3% 0,10% 84,6% 69 Switzerland 37,98 4,84 7,850 0,11% 97,4% 0,11% 84,7% 70 Denmark 36,67 6,63 5,530 0,11% 97,5% 0,08% 84,8% 71 Ireland 36,24 7,76 4,671 0,11% 97,6% 0,07% 84,8% 72 Slovakia 35,50 6,48 5,477 0,11% 97,7% 0,08% 84,9% 73 Ecuador 34,86 2,32 15,007 0,10% 97,8% 0,22% 85,1% 74 Bosnia and Herzegovina 32,51 8,37 3,882 0,10% 97,9% 0,06% 85,2% 75 New Zealand 32,44 7,56 4,290 0,10% 98,0% 0,06% 85,2% 76 Angola 30,83 1,76 17,545 0,092% 98,1% 0,25% 85,5% 77 Tunisia 27,33 2,57 10,629 0,082% 98,2% 0,15% 85,6% 78 Bahrain 24,68 20,31 1,215 0,074% 98,2% 0,02% 85,7% 79 Yemen 23,59 0,98 24,133 0,071% 98,3% 0,35% 86,0% 80 Jordan 22,17 3,41 6,508 0,066% 98,4% 0,09% 86,1% 81 Dominican Rep. 22,07 2,22 9,957 0,066% 98,4% 0,14% 86,2% 82 Croatia 21,43 4,78 4,484 0,064% 98,5% 0,06% 86,3% 83 Lebanon 21,09 5,09 4,143 0,063% 98,6% 0,06% 86,4% 84 Estonia 19,23 14,99 1,283 0,058% 98,6% 0,02% 86,4% 85 Bolivia 18,42 1,82 10,119 0,055% 98,7% 0,15% 86,5% 86 Slovenia 15,75 7,87 2,000 0,047% 98,7% 0,03% 86,6% 87 Sudan 14,43 0,33 43,697 0,043% 98,8% 0,63% 87,2% 88 Sri Lanka 13,80 0,65 21,284 0,041% 98,8% 0,31% 87,5% 89 Lithuania 13,62 3,85 3,536 0,041% 98,9% 0,05% 87,6% 90 Singapore 13,15 2,51 5,247 0,039% 98,9% 0,08% 87,6% 91 Kenya 12,78 0,30 41,944 0,038% 98,9% 0,61% 88,2% 92 Mongolia 12,18 3,89 3,133 0,036% 99,0% 0,05% 88,3% 93 Guatemala 11,30 0,82 13,824 0,034% 99,0% 0,20% 88,5% 94 Macedonia (Rep.) 11,28 5,43 2,077 0,034% 99,0% 0,03% 88,5% 95 Luxembourg 11,02 21,89 0,503 0,033% 99,1% 0,01% 88,5% 96 Brunei Darussalam 10,04 24,98 0,402 0,030% 99,1% 0,01% 88,5% 97 Myanmar 9,83 0,20 48,000 0,029% 99,1% 0,69% 89,2% 98 Panama 9,76 2,82 3,460 0,029% 99,2% 0,05% 89,3% 99 Zimbabwe 9,76 0,81 12,084 0,029% 99,2% 0,17% 89,4% 100 Ghana 9,22 0,38 24,108 0,028% 99,2% 0,35% 89,8% 25
26 2012 ranking of CO2 emissions from fossil fuels and cement production Source of data: CDIAC, EIA Rank Country/Territory MtCO tco2/c.y N people % MtCO2 Cum. % CO2 % people Cum % p. 101 Afghanistan 8,89 0,30 29,758 0,027% 99,2% 0,43% 90,2% 102 Honduras 8,22 1,01 8,144 0,025% 99,3% 0,12% 90,3% 103 Costa Rica 7,88 1,72 4,577 0,024% 99,3% 0,07% 90,4% 104 Latvia 7,85 3,56 2,205 0,024% 99,3% 0,03% 90,4% 105 Cyprus 7,71 6,89 1,120 0,023% 99,3% 0,02% 90,4% 106 Cameroon 7,43 0,38 19,711 0,022% 99,4% 0,28% 90,7% 107 Senegal 7,30 0,58 12,644 0,022% 99,4% 0,18% 90,9% 108 Jamaica 7,25 2,53 2,868 0,022% 99,4% 0,04% 91,0% 109 Tanzania 7,16 0,16 45,591 0,021% 99,4% 0,66% 91,6% 110 Uruguay 6,80 2,05 3,309 0,020% 99,4% 0,05% 91,7% 111 Ethiopia 6,70 0,08 88,589 0,020% 99,5% 1,28% 92,9% 112 Kyrgyzstan 6,54 1,20 5,451 0,020% 99,5% 0,08% 93,0% 113 Georgia 6,43 1,40 4,586 0,019% 99,5% 0,07% 93,1% 114 El Salvador 6,32 1,04 6,072 0,019% 99,5% 0,09% 93,2% 115 Côte d'ivoire 6,15 0,29 21,504 0,018% 99,5% 0,31% 93,5% 116 Botswana 5,37 2,60 2,065 0,016% 99,6% 0,03% 93,5% 117 Benin 5,33 0,57 9,325 0,016% 99,6% 0,13% 93,6% 118 Paraguay 5,14 0,80 6,459 0,015% 99,6% 0,09% 93,7% 119 Moldova 5,00 1,35 3,694 0,015% 99,6% 0,05% 93,8% 120 Equatorial Guinea 4,97 7,44 0,668 0,015% 99,6% 0,01% 93,8% 121 Netherlands Antilles 4,79 20,79 0,231 0,014% 99,6% 0,00% 93,8% 122 Nicaragua 4,60 0,81 5,666 0,014% 99,6% 0,08% 93,9% 123 Cambodia 4,54 0,31 14,702 0,014% 99,7% 0,21% 94,1% 124 Réunion 4,49 5,35 0,840 0,013% 99,7% 0,01% 94,1% 125 Armenia 4,40 1,48 2,968 0,013% 99,7% 0,04% 94,2% 126 Albania 4,31 1,44 2,995 0,013% 99,7% 0,04% 94,2% 127 Mauritius 4,22 3,24 1,304 0,013% 99,7% 0,02% 94,2% 128 New Caledonia 4,21 16,42 0,256 0,013% 99,7% 0,00% 94,2% 129 Nepal 4,05 0,14 29,392 0,012% 99,7% 0,42% 94,6% 130 Uganda 3,87 0,12 32,560 0,012% 99,7% 0,47% 95,1% 131 Papua New Guinea 3,43 0,55 6,188 0,010% 99,8% 0,09% 95,2% 132 Namibia 3,23 1,50 2,148 0,010% 99,8% 0,03% 95,2% 133 Dem. Rep. Congo 3,12 0,04 71,713 0,009% 99,8% 1,03% 96,3% 134 Mozambique 2,99 0,13 22,949 0,009% 99,8% 0,33% 96,6% 135 Tajikistan 2,92 0,38 7,627 0,009% 99,8% 0,11% 96,7% 136 Montenegro 2,67 4,03 0,662 0,008% 99,8% 0,01% 96,7% 137 Gabon 2,65 1,68 1,577 0,008% 99,8% 0,02% 96,7% 138 Malta 2,59 6,34 0,408 0,008% 99,8% 0,01% 96,7% 139 Palestine 2,58 0,61 4,226 0,008% 99,8% 0,06% 96,8% 140 Zambia 2,51 0,19 13,425 0,008% 99,8% 0,19% 97,0% 141 Bahamas 2,50 7,97 0,313 0,007% 99,8% 0,00% 97,0% 142 Suriname 2,42 4,37 0,553 0,007% 99,8% 0,01% 97,0% 143 Aruba 2,35 22,18 0,106 0,007% 99,9% 0,00% 97,0% 144 Martinique 2,31 5,65 0,409 0,007% 99,9% 0,01% 97,0% 145 Mauritania 2,26 0,69 3,282 0,007% 99,9% 0,05% 97,1% 146 Haiti 2,15 0,22 9,720 0,006% 99,9% 0,14% 97,2% 147 Congo 2,09 0,49 4,244 0,006% 99,9% 0,06% 97,3% 148 Madagascar 2,06 0,10 21,421 0,006% 99,9% 0,31% 97,6% 149 Iceland 1,98 6,36 0,311 0,006% 99,9% 0,00% 97,6% 150 Laos 1,98 0,31 6,477 0,006% 99,9% 0,09% 97,7% 2012 ranking of CO2 emissions from fossil fuels and cement production Source of data: CDIAC, EIA Rank Country/Territory MtCO tco2/c.y N people % MtCO2 Cum. % CO2 % people Cum % p. 151 Guadeloupe 1,76 3,72 0,473 0,005% 99,9% 0,01% 97,7% 152 Guyana 1,72 2,32 0,745 0,005% 99,9% 0,01% 97,7% 153 Burkina Faso 1,71 0,10 16,751 0,005% 99,9% 0,24% 97,9% 154 Togo 1,60 0,24 6,772 0,005% 99,9% 0,10% 98,0% 155 Barbados 1,54 5,36 0,287 0,005% 99,9% 0,00% 98,0% 156 Niger 1,45 0,09 15,802 0,004% 99,9% 0,23% 98,3% 157 Fiji 1,41 1,59 0,883 0,004% 99,9% 0,01% 98,3% 158 Malawi 1,27 0,08 15,879 0,004% 99,9% 0,23% 98,5% 159 Guinea 1,25 0,12 10,601 0,004% 99,9% 0,15% 98,7% 160 Maldives 1,17 2,97 0,395 0,004% 99,9% 0,01% 98,7% 161 Macao 1,13 1,97 0,573 0,003% 99,9% 0,01% 98,7% 162 Swaziland 1,05 0,76 1,370 0,003% 99,95% 0,02% 98,7% 163 French Polynesia 0,97 3,55 0,272 0,003% 99,95% 0,00% 98,7% 164 Liberia 0,81 0,22 3,787 0,002% 99,96% 0,05% 98,8% 165 Seychelles 0,71 8,01 0,089 0,002% 99,96% 0,00% 98,8% 166 Faeroe Islands 0,71 14,43 0,049 0,002% 99,96% 0,00% 98,8% 167 French Guiana 0,71 3,00 0,236 0,002% 99,96% 0,00% 98,8% 168 Sierra Leone 0,71 0,13 5,364 0,002% 99,96% 0,08% 98,8% 169 Greenland 0,64 11,15 0,058 0,002% 99,97% 0,00% 98,8% 170 Mali 0,63 0,04 15,032 0,002% 99,97% 0,22% 99,1% 171 Somalia 0,62 0,06 9,926 0,002% 99,97% 0,14% 99,2% 172 Rwanda 0,60 0,05 11,370 0,002% 99,97% 0,16% 99,4% 173 Cayman Islands 0,60 11,65 0,051 0,002% 99,97% 0,00% 99,4% 174 Djibouti 0,55 0,72 0,757 0,002% 99,98% 0,01% 99,4% 175 Eritrea 0,52 0,09 5,939 0,002% 99,98% 0,09% 99,5% 176 Antigua and Barbuda 0,52 5,92 0,088 0,002% 99,98% 0,00% 99,5% 177 Bhutan 0,51 0,72 0,708 0,002% 99,98% 0,01% 99,5% 178 Bermuda 0,48 7,04 0,069 0,001% 99,98% 0,00% 99,5% 179 Gambia 0,48 0,27 1,798 0,001% 99,98% 0,03% 99,5% 180 Chad 0,48 0,04 10,759 0,001% 99,98% 0,16% 99,7% 181 Gibraltar 0,46 15,82 0,029 0,001% 99,99% 0,00% 99,7% 182 Belize 0,43 1,33 0,321 0,001% 99,99% 0,00% 99,7% 183 Saint Lucia 0,41 2,53 0,162 0,001% 99,99% 0,00% 99,7% 184 Cape Verde 0,36 0,70 0,516 0,001% 99,99% 0,01% 99,7% 185 Burundi 0,32 0,03 10,216 0,001% 99,99% 0,15% 99,8% 186 Central African Republic 0,27 0,05 4,950 0,001% 99,99% 0,07% 99,9% 187 Grenada 0,26 2,43 0,108 0,001% 99,99% 0,00% 99,9% 188 Saint Kitts and Nevis 0,25 5,02 0,050 0,001% 99,99% 0,00% 99,9% 189 Western Sahara 0,24 0,48 0,507 0,001% 99,99% 0,01% 99,9% 190 Guinea-Bissau 0,24 0,15 1,597 0,001% 99,99% 0,02% 99,9% 191 Solomon Islands 0,22 0,39 0,572 0,001% 99,99% 0,01% 99,9% 192 Saint Vincent and the Grenadines 0,21 2,04 0,104 0,001% 99,995% 0,00% 99,9% 193 Timor-Leste 0,20 0,18 1,115 0,001% 99,996% 0,02% 99,9% 194 Samoa 0,18 0,91 0,193 0,001% 99,996% 0,00% 100,0% 195 Tonga 0,17 1,63 0,106 0,001% 99,997% 0,00% 100,0% 196 Turks and Caicos Islands 0,16 3,65 0,045 0,0005% 99,997% 0,00% 100,0% 197 Comoros 0,14 0,20 0,722 0,0004% 99,998% 0,01% 100,0% 198 Dominica 0,14 1,88 0,073 0,0004% 99,998% 0,00% 100,0% 199 Vanuatu 0,13 0,51 0,251 0,0004% 99,998% 0,00% 100,0% 200 Sao Tome and Principe 0,10 0,56 0,180 0,0003% 99,999% 0,00% 100,0% 26
27 Rank Country or tco2 per territory capita TOTAL WORLD 5,35 1 Qatar 48,86 2 Trinidad and Tobago 38,31 3 Kuwait 37,21 4 UAE 33,25 5 Brunei Darussalam 24,98 6 Aruba 22,18 7 Luxembourg 21,89 8 Netherlands Antilles 20,79 9 Bahrain 20,31 10 Oman 19,47 11 Saudi Arabia 19,33 12 Australia 17,03 13 Kazakhstan 16,86 14 USA 16,42 15 New Caledonia 16,42 16 Gibraltar 15,82 17 Montserrat 15,19 18 Estonia 14,99 19 Canada 14,84 20 Faeroe Islands 14,43 21 Russian Fed. 12,64 22 South Korea 12,49 23 Norway 12,37 24 Saint Pierre and Miq. 11,99 25 Cayman Islands 11,65 26 Taiwan 11,31 27 Greenland 11,15 28 Turkmenistan 11,04 29 Libya 10,59 30 Israel 10,26 31 Czech Republic 10,17 32 Netherlands 9,99 33 Nauru 9,89 34 Japan 9,84 35 Belgium 9,50 36 South Africa 9,40 37 Finland 9,10 38 Germany 8,98 39 Bosnia & Herzegovina 8,37 40 Seychelles 8,01 tco2 per capita in 2012, data from CDIAC and EIA 41 Poland 8,00 42 Bahamas 7,97 43 Slovenia 7,87 44 Ireland 7,76 45 Iran 7,74 46 Greece 7,59 47 New Zealand 7,56 48 Malaysia 7,52 49 Ukraine 7,51 50 Venezuela 7,50 51 Equatorial Guinea 7,44 52 Austria 7,27 53 China 7,20 54 Ukraine 7,17 55 Bermuda 7,04 56 Cyprus 6,89 57 Cook Islands 6,84 58 Denmark 6,63 59 Serbia 6,54 60 Slovakia 6,48 61 Bulgaria 6,41 62 Belarus 6,41 63 Iceland 6,36 64 Malta 6,34 65 Italy 6,15 66 Spain 5,93 67 Antigua and Barbuda 5,92 68 Niue 5,72 69 Martinique 5,65 70 Macedonia (Rep.) 5,43 71 Azerbaijan 5,42 72 Hong Kong 5,39 73 Chile 5,37 74 Barbados 5,36 75 Réunion 5,35 76 France 5,26 77 Lebanon 5,09 78 Saint Kitts and Nevis 5,02 79 Sweden 4,93 80 Portugal 4,89 81 Switzerland 4,84 82 Thailand 4,84 83 Croatia 4,78 84 Argentina 4,70 85 Hungary 4,66 86 Suriname 4,37 87 Mexico 4,19 88 Montenegro 4,03 89 Iraq 4,02 90 Turkey 3,95 91 Uzbekistan 3,91 92 Mongolia 3,89 93 Lithuania 3,85 94 Algeria 3,77 95 Guadeloupe 3,72 96 Romania 3,72 97 Turks & Caicos Islands 3,65 98 Cuba 3,59 99 Latvia 3, French Polynesia 3, Jordan 3, Mauritius 3, North Korea 3, French Guiana 3, Maldives 2, Syria 2, Panama 2, Egypt 2, Botswana 2, Tunisia 2, Saint Lucia 2, Jamaica 2, Singapore 2, Grenada 2, Ecuador 2, Guyana 2, Brazil 2, Peru 2, Dominican Rep. 2, Uruguay 2, St Vincent & the Gren. 2, Macao 1, Indonesia 1, Dominica 1, India 1, Bolivia 1, Viet Nam 1, Colombia 1, Angola 1, Costa Rica 1, Gabon 1, Morocco 1, Tonga 1, Fiji 1, Namibia 1, Armenia 1, Saint Helena 1, Albania 1, Georgia 1, Moldova 1, Belize 1, Kyrgyzstan 1, El Salvador 1, Honduras 1, Yemen 0, Samoa 0, Pakistan 0, Philippines 0, Guatemala 0, Nicaragua 0, Zimbabwe 0, Paraguay 0, Swaziland 0, Djibouti 0, Bhutan 0, Cape Verde 0, Mauritania 0, Kiribati 0, Sri Lanka 0, Palestine 0, Senegal 0, Benin 0, Sao Tome & Principe 0, Papua New Guinea 0, Vanuatu 0, Congo 0, Nigeria 0, Western Sahara 0, Bangladesh 0, Solomon Islands 0, Tajikistan 0, Ghana 0, Cameroon 0, Sudan 0, Cambodia 0, Laos 0, Kenya 0, Afghanistan 0, Côte d'ivoire 0, Gambia 0, Togo 0, Haiti 0, Liberia 0, Myanmar 0, Comoros 0, Zambia 0, Timor-Leste 0, Tanzania 0, Guinea-Bissau 0, Nepal 0, Sierra Leone 0, Mozambique 0, Uganda 0, Guinea 0, Burkina Faso 0, Madagascar 0, Niger 0, Eritrea 0, Malawi 0, Ethiopia 0, Somalia 0, Central African Rep. 0, Rwanda 0, Chad 0, Dem. Rep. Congo 0, Mali 0, Burundi 0, Lesotho 0,01 27
Table 19 Production, trade and supply of other kerosene Thousand metric tons and kilograms per capita
 Table Notes Production includes output from refineries and plants. For China, data include kerosene-type jet fuel. Please refer to the Definitions Section on pages ix to xv for the appropriate product
Country Risk Scores Table Results
 s Table - 2014 Results Afghanistan 73 73 53 71 70 49 48 50 59 54 63 75 54 89 4.7 Albania 60 67 59 73 50 32 39 26 35 47 32 43 46 32 8.8 Algeria 79 82 88 67 63 30 39 24 79 81 74 49 51 38 10.0 Andorra 47
Green: 348. Yellow/Orange: Yellow/Orange: Green: 348. Yellow/Orange: Green: 348. Yellow/Orange:137 Bronze: 145
 Afghanistan 348 Albania 186 Algeria 348 Andorra 286 348 137 Bronze: 145 Angola 137 Antigua and Barbuda 314 137 Argentina 279 137 Armenia 286 165 186 Australia 2768 Austria Azerbaijan Warm red 485 282 348
Summary of debt securities outstanding
 Summary of debt securities outstanding All countries........................ 22,695 15,852 6,665 3,427 1,762 Developed countries........................ 16,504 13,087 5,869 2,716 701 Austria 510 173 44
LPI ranking and scores, 2014
 ing and scores, 2014 Germany 1 4.12 100.0 Netherlands 2 4.05 97.6 Belgium 3 4.04 97.5 United Kingdom 4 4.01 96.6 Singapore 5 4.00 96.2 Sweden 6 3.96 94.9 Norway 7 3.96 94.8 Luxembourg 8 3.95 94.4 United
Total fleet. Oil tankers
 184 as at 1 January 2011 (in thousands of dwt) DEVELOPING ECONOMIES OF AFRICA Algeria 809 30 204 66 0 509 Angola 58 10 0 14 0 34 Benin 0 0 0 0 0 0 Cameroon 10 0 0 4 0 6 Cape Verde 22 5 0 12 0 6 Comoros
Table 19 Production, trade and supply of other kerosene Thousand metric tons and kilograms per capita
 Table 19 Production, trade and supply of other kerosene Table Notes Production includes output from refineries and plants. For China, data up to 2013 include kerosenetype jet fuel. Please refer to the
Global and Regional Tables
 Global and Regional Tables Freedom of the Press 2006 1 Finland 9 F Iceland 9 F 3 Denmark 10 F Norway 10 F Sweden 10 F 6 Belgium 11 F Luxembourg 11 F Netherlands 11 F Switzerland 11 F 10 Liechtenstein 13
Figure Geographic distribution Change in country participation in international nongovernmental organizations (NGOs): 1992 and 2002
: 1992 and 2002") Figure 2.2.3. Geographic distribution Change in country participation in international nongovernmental s (NGOs): 1992 and 2002 This table gives the and (international NGOs of types A to F) for a given
Figure 2.2.3. Geographic distribution Change in country participation in international nongovernmental s (NGOs): 1992 and 2002 This table gives the and (international NGOs of types A to F) for a given
From Wikipedia, the free encyclopedia
 1 of 6 14/09/2011 22:38 From Wikipedia, the free encyclopedia This is a list of countries by natural gas exports mostly based on The World Factbook [1] (https://www.cia.gov/library/publications/the-world-factbook/rankorder/2183rank.html).
5.01 Secondary education enrollment rate
 5.01 Secondary education enrollment rate Gross secondary education enrollment rate 2011 or most recent year available RANK COUNTRY/ECONOMY Value 1 Australia 8...131.3 2 Spain...128.5 3 Seychelles...123.9
9.01 ICT use for business-to-business transactions
 9.01 ICT use for business-to-business transactions To what extent do businesses in your country use ICTs for communicating and carrying out transactions with other businesses? [1 = not at all; 7 = extensively]
STATES ELIGIBLE FOR ELECTION
 ANNEX STATES ELIGIBLE FOR ELECTION List No. 1 States Eligible for Election as Members of the Executive Committee of the Paris Union (that is, States members of the Assembly of the Paris Union) (175) 1
Global Competitiveness Index Rankings
 APPENDIX B Global Competitiveness Index 2017 2018 Rankings The following pages report the GCI 2017 2018 rankings for the three subindexes (Table 1) and their corresponding pillars (Tables 2 4). Detailed
International Sugar Organization WORLD SUGAR BALANCES 2002/ /16
 International Sugar Organization WORLD SUGAR BALANCES 2002/2003-2015/16 FEBRUARY 2016 WORLD SUGAR BALANCES (October/September) in thousand tonnes, tel quel Production 166,833 171,180 171,386 172,029 164,629
TABLE 1 WHO ASSESSED CONTRIBUTIONS: MEMBERS WITH NO CHANGE IN CONTRIBUTION
 :25/'+($/7+25*$1,=$7,21 (;(&87,9(%2$5' WK6HVVLRQ 3URYLVLRQDODJHQGDLWHP (%,1)'2& 'HFHPEUH $VVHVVPHQWVIRU 1. Document EB109/21 includes as an Annex a table indicating for each Member and Associate Member
Table 20 Production, trade and supply of jet fuels Thousand metric tons and kilograms per capita
 Table 20 Production, trade and supply of jet fuels Table Notes Data refer to aviation gasoline, gasoline-type jet fuel and kerosene-type jet fuel. Production includes output from refineries and plants.
Summary of Contributions to UN Peacekeeping by Country and Post.
 Summary of Contributions to UN Peacekeeping by Country and Post. Police,UN Military, s and Troops 31/07/2018 1 Country Name POST MALE FEMALE TOTAL Algeria 2 3 4 5 6 7 Argentina Armenia Australia Austria
2.01 Availability of latest technologies
 2.01 Availability of latest technologies To what extent are the latest technologies available in your country? [1 = not available; 7 = widely available] 2010 2011 weighted average RANK COUNTRY/ECONOMY
Part III STATISTICAL ANNEX
 Part III STATISTICAL ANNEX STATISTICAL ANNEX 125 TABLE A1 Production of livestock products, 1995 2007 Meat Milk Eggs (Thousand tonnes) (Annual % (Thousand tonnes) (Annual % (Thousand tonnes) (Annual %
Section III Macroeconomic environment
 Data Tables Section III Macroeconomic environment 2.2: Data Tables Section III: Macroeconomic environment 422 3.01 Government budget balance General government budget balance as a percentage of GDP 2010
FCCC/SBI/2016/INF.15. United Nations. Revised indicative contributions for the biennium
 United Nations FCCC/SBI//INF.15 Distr.: General 20 September English only Subsidiary Body for Implementation Forty fifth session Marrakech, 7 14 November Item 17(a) of the provisional agenda Administrative,
Fiche 1 Quelques données de la Banque Mondiale
 Fiche 1 Quelques données de la Banque Mondiale 274 WORLD DEVELOPMENT REPORT 2000 2001 Table 1. Size of the economy Surface Population area density Gross national product (GNP) GNP per capita GNP measured
Hotel Price Indicatice max. as from 22 Nov International per diem TOWNS/ DESTINATION COUNTRY
 Appendix 1: VLIR-UOS hotel allowances and international amounts valid from 22 Nov, 2017, onwards COUNTRY Afghanistan all destinations 180 72 Albania all destinations 175 96 Algeria all destinations 219
International Investment Position: World and Regional Tables
 BOPCOM/08/18 Twenty-First Meeting of the IMF Committee on Balance of Payments Statistics Washington, D.C., November 4 7, 2008 International Investment Position: World and Regional Tables Prepared by the
Table 33 Electricity supply and consumption Gigawatt-hours and kilowatt-hours per capita
 Table 33 Electricity supply and consumption Table Notes is calculated as production plus imports minus exports. EIOU and losses refers to energy industries own use of electricity, including for pumped
Table 13 Production, trade and supply of conventional crude oil Thousand metric tons; kilograms per capita; reserves production ratio (R/P) in years
 in years") , trade and supply of conventional crude oil Thousand metric tons; kilograms per capita; reserves production ratio (R/P) in years Table Notes The Reserves / ratio refers to crude oil and natural gas liquids.
, trade and supply of conventional crude oil Thousand metric tons; kilograms per capita; reserves production ratio (R/P) in years Table Notes The Reserves / ratio refers to crude oil and natural gas liquids.
Lower bound. Upper bound. Lower bound. Afghanistan
 EMBARGOED UNTIL 00:01 GMT 18 September 2018 Under-five () with 90 per cent uncertainty interval () (per cent) under-five with 90 per cent uncertainty interval Afghanistan 175 160 192 68 52 85 3.5 2.6 4.5
Table 13 Production, trade and supply of conventional crude oil Thousand metric tons; kilograms per capita; reserves production ratio (R/P) in years
 in years") Million metric tons Million metric tons Table 13, trade and supply of conventional crude oil Thousand metric tons; kilograms per capita; reserves production ratio (R/P) in years Table Notes The Reserves
Million metric tons Million metric tons Table 13, trade and supply of conventional crude oil Thousand metric tons; kilograms per capita; reserves production ratio (R/P) in years Table Notes The Reserves
Table 6A: External positions of reporting banks vis-à-vis all sectors
 Table 6A: External positions of reporting banks vis-à-vis all sectors Vis-à-vis individual countries in millions of US dollars All countries 29,841,389 29,212,683 28,267,608 28,518,559 75,538 1,110,929
Table 6A: External positions of reporting banks vis-à-vis all sectors
 Table 6A: External positions of reporting banks vis-à-vis all sectors Vis-à-vis individual countries in millions of US dollars All countries 29,227,490 29,015,072 28,531,726 28,040,625 1,147,749 1,456,989
Table 7B: External loans and deposits of reporting banks vis-à-vis the non-bank sector
 Table 7B: External loans and deposits of reporting banks vis-à-vis the non-bank sector Vis-à-vis individual countries in millions of US dollars All countries 6,618,147 6,859,916 6,854,545 6,829,602 92,045
Table 7B: External loans and deposits of reporting banks vis-à-vis the non-bank sector
 Table 7B: External loans and deposits of reporting banks vis-à-vis the non-bank sector Vis-à-vis individual countries in millions of US dollars All countries 6,871,257 7,040,175 6,972,597 6,946,298 71,425
UNITED NATIONS EDUCATIONAL, SCIENTIFIC AND CULTURAL ORGANIZATION EXECUTIVE BOARD. Hundred and sixty-fourth Session
 164 EX/INF.7 PARIS, 14 May 2002 English & French only UNITED NATIONS EDUCATIONAL, SCIENTIFIC AND CULTURAL ORGANIZATION EXECUTIVE BOARD Hundred and sixty-fourth Session Item 3.1.1 of the provisional agenda
Table 13 Production, trade and supply of conventional crude oil Thousand metric tons; kilograms per capita; reserves production ratio (R/P) in years
 in years") Table 13, trade and supply of conventional crude oil Thousand metric tons; kilograms per capita; reserves production ratio (R/P) in years Table Notes The Reserves / ratio refers to crude oil and natural
Table 13, trade and supply of conventional crude oil Thousand metric tons; kilograms per capita; reserves production ratio (R/P) in years Table Notes The Reserves / ratio refers to crude oil and natural
Table 21 Production, trade and supply of gas oil/diesel oil Thousand metric tons and kilograms per capita
 Table Notes Production includes output from refineries and plants, together with quantities from other sources which include any blended biodiesel. Please refer to the Definitions Section on pages ix to
A. Assessment of Member States under General Assembly resolution 71/268
 United Nations Secretariat Distr.: General 9 January 2017 Original: English Assessment of Member States contributions for the financing of the International Tribunal for the Prosecution of Persons Responsible
Country Rate Country Rate Country Rate
 Afghanistan $1.080 Alaska $0.099 Albania $0.259 Algeria $0.269 American Samoa $0.139 American Samoa (Mobile) $0.209 Andorra $0.089 Andorra (Mobile) $0.319 Angola $0.349 Angola (Mobile) $0.569 Anguilla
Table 9A: Consolidated claims of reporting banks - immediate borrower basis
 Table 9A: Consolidated claims of reporting banks - immediate borrower basis On individual countries by maturity and sector / Amounts outstanding In millions of US dollars Total Consolidated cross-border
Table 5 Production, trade and supply of hard coal Thousand metric tons and kilograms per capita
 Table Notes Production includes production from other sources as defined in the previous table. Data for China include brown coal. Please refer to the Definitions Section on pages ix to xv for the appropriate
PwC Belgium Daily lump-sum allowances list for traveling abroad please visit for more information
 allowances list for traveling abroad Allowances given by an employer to his employee to cover foreign business travel expenses are costs proper to the employer. These allowances are tax exempt for the
Percentage and total number of foreign national prisoners worldwide
 Percentage and total number of foreign national prisoners worldwide Source: World Prison Brief (International Centre for Prison Studies www.prisonstudies.org) 1 Country % Total 2003 FNP 2003 % Total 2005
SAVER PLAN Standard Rate Table Service Description Rate AUD$ (per minute) Flagfall Other Charges
 Flagfall Other Charges") SAVER PLAN Standard Rate Table Service Description Voicemail Retrieval (121, 1211, 1212, 1213, 1218, 1219) Call Forward Hello Mobile Customer Care via 126 999 Hello Mobile Customer Care via 1300 126 999
SAVER PLAN Standard Rate Table Service Description Voicemail Retrieval (121, 1211, 1212, 1213, 1218, 1219) Call Forward Hello Mobile Customer Care via 126 999 Hello Mobile Customer Care via 1300 126 999
Price (CZK) with V.A.T.
 with V.A.T.") Price category 100 100 101* 101* 102 102 103 103 Weight (kg) Price (CZK) 0,5 kg 229,74 278,00 229,74 278,00 599,97 726,00 699,96 847,00 1 kg 260,32 315,00 319,82 387,00 649,55 786,00 749,54 907,00 2 kg
Price category 100 100 101* 101* 102 102 103 103 Weight (kg) Price (CZK) 0,5 kg 229,74 278,00 229,74 278,00 599,97 726,00 699,96 847,00 1 kg 260,32 315,00 319,82 387,00 649,55 786,00 749,54 907,00 2 kg
C H AP TE R 1 G LO BAL EC O NO MIC P ROS P EC TS J U NE 2017
 4 C H AP TE R 1 G LO BAL EC O NO MIC P ROS P EC TS J U NE 2017 TABLE 1.1 Real GDP 1 (percent change from previous year) 2014 2015 2016 2017 2018 2019 2016 2017 2018 2019 Percentage point differences Estimates
Effective October 1, 2006, Sprint Global Savings will no longer be available to new customers.
 Sprint Global Savings International Calling Plan Dial-1 ute International for Calls Made from 1 Effective October 1, 2006, Sprint Global Savings will no longer be available to new customers. Some calls
Table 2 Components of total energy supply Petajoules and Gigajoules per capita
 Table 2 Components of total energy supply Table Notes Production Included in the production of primary energy for Solids are hard coal, lignite, peat, oil shale, primary solid biofuels and wastes; Liquids
Enterprise Voice Trunking: Domestic, International and inbound Toll Free Rates
 Overage Domestic Long Distance toll $0.03 On net* Inbound Toll Free $0.029 International Long Distance toll See table below Customers subscribing to MOU packages of 100,000 minutes and larger will receive
Net Migration Rate per 1,000 Population. Rate of Natural Increase (%)
") mid-2009 Births per POPULATION, HEALTH, AND ENVIRONMENT DATA AND ESTIMATES Deaths per Rate of Natural Increase Net Migration Rate per 2025 2050 Change 2009 2050 Infant Mortality Rate a Percent of Total
mid-2009 Births per POPULATION, HEALTH, AND ENVIRONMENT DATA AND ESTIMATES Deaths per Rate of Natural Increase Net Migration Rate per 2025 2050 Change 2009 2050 Infant Mortality Rate a Percent of Total
Governance Indicators World Map: Voice & Accountability
 Governance Indicators: Voice & Accountability (VA), Political Stability (PS), Government Effectiveness (GE), Regulatory Quality (RQ), Rule of Law (RL), Control of Corruption (CC) Percentile Ranks, 2004
Table 5 Production, trade and supply of hard coal Thousand metric tons and kilograms per capita
 Table Notes Production includes production from other sources as defined in the previous table. Data for China include brown coal. Please refer to the Definitions Section on pages ix to xv for the appropriate
Calls made to a mobile phone may be charged a per minute International Mobile Termination Surcharge, see Sprint Wireline Fees and Surcharges Matrix.
 A discounted rate will apply to the country a customer calls the most (based on total dollars). If the customer has equal Dial-1 voice usage to two or more countries, the tie breakers will be the number
GLOBAL ECONOMIC PROSPECTS January Statistical Annex
 1 TABLE A.1 GDP Growth (Constant 2010 U.S. Dollars) Annual estimates and forecasts a Quarterly growth b 2013 2014 00-10 c 2011 2012 2013 2014e 2015f 2016f 2017f Q1 Q2 Q3 Q4 Q1 Q2 Q3 World 2.8 3.1 2.4 2.5
Table 16 Refinery distillation capacity, throughput and output Thousand metric tons
 Million metric tons Table 16 Refinery distillation capacity, throughput and output Table Notes Output is equal to the sum of production from refineries for aviation gasoline, bitumen, gas/diesel oil, ethane,
Table 23 Production of minor oil products from refineries - by type Thousand metric tons
 Table 23 Production of minor oil from refineries - by type Table Notes Data refer to production from refineries of refinery, ethane, naphtha, lubricants, bitumen, paraffin, petroleum, white spirit, and
up to and including 31 December 2002
 The ISO Survey of ISO 9000 and ISO 14001 Certificates Twelfth cycle : up to and including 31 December T a b l e o f c o n t e n t s The ISO Survey : twelfth cycle () highlights......................................................................
Lincolnshire Business Call Charges
 Lincolnshire Business Call Charges Geographic Calls Call Charge (Pence Per Minute, At All Times) Voice Tariff KCOM 2 KCOM calling (K)* Local (A1) National (A2 & B) Ex VAT Inc. VAT Ex VAT Inc. VAT Ex VAT
Table 33 Electricity supply and consumption Gigawatt-hours and kilowatt-hours per capita
 Terawatt-hours Table 33 Table Notes is calculated as Production plus Imports minus Exports. EIOU and losses refers to energy industries own use of electricity, including for pumped storage, and losses.
Table III Immigrant Visas Issued (by Foreign State of Chargeability or Place of Birth) Fiscal Year 2018
 Fiscal Year 2018") Africa Algeria 437 2 198 18 1,343 1,998 Angola 26 0 14 1 17 58 Benin 138 0 60 1 237 436 Botswana 10 0 4 0 0 14 Burkina Faso 121 2 35 3 107 268 Burundi 74 0 13 0 97 184 Cabo Verde 395 1 980 6 1 1,383 Cameroon
Africa Algeria 437 2 198 18 1,343 1,998 Angola 26 0 14 1 17 58 Benin 138 0 60 1 237 436 Botswana 10 0 4 0 0 14 Burkina Faso 121 2 35 3 107 268 Burundi 74 0 13 0 97 184 Cabo Verde 395 1 980 6 1 1,383 Cameroon
THEIR RANKING BY SIZE, 1999 AND Population (thousands) Country or area
 Country or area") TABLE 5. POPULATION OF THE COUNTRIES OF THE WORLD AND THEIR RANKING BY SIZE, 1999 AND 2050 World 5 978 401 8 909 095 Afghanistan 21 923 61 004 45 25 Albania 3 113 4 322 129 132 Algeria 30 774 57 731 34
TABLE 5. POPULATION OF THE COUNTRIES OF THE WORLD AND THEIR RANKING BY SIZE, 1999 AND 2050 World 5 978 401 8 909 095 Afghanistan 21 923 61 004 45 25 Albania 3 113 4 322 129 132 Algeria 30 774 57 731 34
SOFTWARE REGIOGRAPH ANALYSIS PLANNING STRATEGY
 SOFTWARE REGIOGRAPH RegioGraph allows you to quickly and easily display your company data on digital maps. In combination with purchasing power data, this reveals trends and relationships that would not
JURISDICTIONS PARTICIPATING IN THE CONVENTION ON MUTUAL ADMINISTRATIVE ASSISTANCE IN TAX MATTERS
 JURISDICTIONS PARTICIPATING IN THE CONVENTION ON MUTUAL ADMINISTRATIVE ASSISTANCE IN TAX MATTERS STATUS 27 JULY 2018 ORIGINAL CONVENTION 27-05-2010) OR OR 1. ALBANIA 01-03-2013 (AC) 08-08-2013 01-12-2013
2014/ /2015 Ghana / /2015 Syrian Arab Republic / /2015
 Exhibit C: international cotton trade data Source: International Cotton Advisory Committee, ICAC World Cotton Database, available at www.icac.org, last checked 1 April 2016. International Cotton Advisory
Table 33 Electricity supply and consumption Gigawatt-hours and kilowatt-hours per capita
 Table Notes is calculated as Production plus Imports minus Exports. EIOU and losses refers to energy industries own use of electricity, including for pumped storage, and losses. Total Final (TFC) refers
Demographic and Socioeconomic Statistics
 Demographic and Socioeconomic Statistics Country WHO region number Population a annual growth rate in urban areas Total fertility rate a Adolescent fertility proportion b (000) 1995 (per woman) Year 1
Microsoft Social Engagement Translation Guide Last Updated: October 2017
 Microsoft Social Engagement Translation Guide Last Updated: October 2017 Microsoft Social Engagement is translated and supported by Microsoft and made generally available in the countries/regions and languages
SOFTWARE REGIOGRAPH ANALYSIS PLANNING STRATEGY
 SOFTWARE REGIOGRAPH RegioGraph allows you to quickly and easily display your company data on digital maps. In combination with purchasing power data, this reveals trends and relationships that would not
Delinquent Payments Voluntary Assessed Contributions to the Framework Convention on Tobacco Control
 Delinquent Payments Voluntary Assessed Contributions to the Framework Convention on Tobacco Control The operations of the Framework Convention on Tobacco Control (FCTC) are principally financed through
Imports of seed for sowing by country Calendar year 2011 Source: ISF compilation based on official statistics and international seed trade reports
 USA 157,432 15,562 464 173,458 523 318 67 908 Germany 195,159 5,913 520 201,592 595 97 22 714 France 125,701 4,389 277 130,367 522 150 11 683 Netherlands 140,899 12,253 796 153,948 250 330 48 628 Italy
Table 16 Refinery distillation capacity, throughput and output Thousand metric tons
 Table 16 Refinery distillation capacity, throughput and output Table Notes Output is equal to the sum of production from refineries for aviation gasoline, bitumen, gas/diesel oil, ethane, feedstocks, gasoline-type
Frontier Simply International Rate Plans
 Frontier Simply International Rate Plans Residential - Optional International Rate Plans Asia Canada Europe Mexico Block-Of-Time (minutes included per option) 125 150 150 50 Monthly Recurring Charge $4.99
Doing business in a more transparent world
 2012 Doing business in a more transparent world COMPARING REGULATION FOR DOMESTIC FIRMS IN 183 ECONOMIES ii DOING BUSINESS 2012 THE DOING BUSINESS WEBSITE Current features News on the Doing Business project
Table 1. Demographics and Standards of Living Across Countries Total Population Annual Annual # Under 5 GNP % under 5 s Net primary Total Maternal
 Table 1. Demographics and Standards of Living Across Countries Total Population Annual Annual # Under 5 GNP % under 5 s Net primary Total Maternal Population under 18 # of births < age 5 deaths mortality
Production of minor oil products from refineries - by type Thousand metric tons
 Production of minor oil from refineries - by type Table 23 Table Notes Data refer to production from refineries of refinery, ethane, naphtha, lubricants, bitumen, paraffin, petroleum, white spirit, and
Table 2 Components of total energy supply Petajoules and Gigajoules per capita
 Table 2 Components of total energy supply Table Notes Included in the Primary energy production for Solids are hard coal, lignite, peat, oil shale, primary solid biofuels and wastes; Liquids are comprised
REGIOGRAPH SOFTWARE AVAILABLE VERSIONS UPDATE AND UPGRADE PRICE ONGOING SAVINGS OF 50%! PRICE LIST
 PRICE LIST REGIOGRAPH SOFTWARE RegioGraph allows you to visualize and evaluate your company data directly on digital maps. This provides insight into data trends and relationships and lends objectivity
APPENDIX B KEY ASPECTS OF LONG-TERM FINANCE
 GLOBAL FINANCIAL DEVELOPMENT REPORT 2015/2016 APPENDIX B 165 APPENDIX B KEY ASPECTS OF LONG-TERM FINANCE Economies and Their Maturity Structure of Finance, 2013 GDP at Afghanistan 8.9 8.2 0.7 0.00 Albania
Table A1. Summary of World Output1
 Output: Summary Table A1. Summary of World Output 1 (Annual percent change) 1991 2000 2001 2002 2003 2004 2005 2006 2007 2008 2009 2010 2014 World 3.1 2.2 2.8 3.6 4.9 4.5 5.1 5.2 3.2 1.3 1.9 4.8 Advanced
Retail prices (street price), US$/gram
, US$/gram") 3.4 Prices 3.4.1 Opiates: Wholesale, street prices and purity levels Retail prices (street price), US$/gram EUROPE 1990 1991 1992 1993 1994 1995 1996 1997 1998 1999 2000 2001 2002 2003 2004 2005 2006 Austria
3.4 Prices 3.4.1 Opiates: Wholesale, street prices and purity levels Retail prices (street price), US$/gram EUROPE 1990 1991 1992 1993 1994 1995 1996 1997 1998 1999 2000 2001 2002 2003 2004 2005 2006 Austria
International Direct Dial (IDD)
") International Direct Dial (IDD) Flagfall (retail) Cost/min (retail) International Calls (per 60 secs) ex. GST inc. GST ex. GST inc. GST Zone Afghanistan $2.570000 $2.827000 IDD Zone1 Albania $2.290000
International Direct Dial (IDD) Flagfall (retail) Cost/min (retail) International Calls (per 60 secs) ex. GST inc. GST ex. GST inc. GST Zone Afghanistan $2.570000 $2.827000 IDD Zone1 Albania $2.290000
International Passenger Traffic to and from Reporting Airports (in Thousands) by Country Table 11
 by Country Table 11") International Passenger Traffic to and from Reporting Airports (in Thousands) by Country 2005-2015 Table 11 2005 2006 2007 2008 2009 2010 2011 2012 2013 2014 2015 AUSTRIA 1 796 1 788 1 877 1 826 1 746
International Passenger Traffic to and from Reporting Airports (in Thousands) by Country 2005-2015 Table 11 2005 2006 2007 2008 2009 2010 2011 2012 2013 2014 2015 AUSTRIA 1 796 1 788 1 877 1 826 1 746
RATES BROCHURE. Our locations: Ave NE, Calgary AB T2A 6C Parsons Road, Edmonton AB T6N 1B4 102 Central Ave, Sweet Grass MT 59484
 RATES BROCHURE Ship as if you were from the United States Use DYK Post s USA address to ship Save up to 70% on U.S. Bound or International Shipping Get the reverse logistics services for your return parcels
List of Tables. Output. Infl ation. Financial Policies. Foreign Trade. Current Account Transactions. Balance of Payments and External Financing
 STATISTICAL APPENDIX List of Tables Output A1. Summary of World Output 241 A2. Advanced Economies: Real GDP and Total Domestic Demand 242 A3. Advanced Economies: Components of Real GDP 243 A4. Emerging
JURISDICTIONS PARTICIPATING IN THE CONVENTION ON MUTUAL ADMINISTRATIVE ASSISTANCE IN TAX MATTERS
 JURISDICTIONS PARTICIPATING IN THE CONVENTION ON MUTUAL ADMINISTRATIVE ASSISTANCE IN TAX MATTERS COUNTRY/JURISDICTION * STATUS 15 DECEMBER 2017 1. ALBANIA 01-03-2013 (AC) 08-08-2013 01-12-2013 2. ANDORRA
Table 3A Early childhood care and education (ECCE): care
: care") 7 238 / ANNEX 2 Early childhood care and education (ECCE): care Education for All Global Monitoring Report Arab States Algeria Bahrain Djibouti Egypt Iraq Jordan Kuwait Lebanon Libyan Arab Jamahiriya Mauritania
7 238 / ANNEX 2 Early childhood care and education (ECCE): care Education for All Global Monitoring Report Arab States Algeria Bahrain Djibouti Egypt Iraq Jordan Kuwait Lebanon Libyan Arab Jamahiriya Mauritania
Global Performance (Data in US Dollars)
") Global Performance (Data in US Dollars) April 2007 vs April Year to Date - April 2007 vs April 2007 2007 2007 Occ. ADR RevPAR 2007 2007 2007 Occ. ADR RevPAR Asia Pacific 69.3 70.9 139.42 125.23 96.62 88.77-2.2
Global Performance (Data in US Dollars) April 2007 vs April Year to Date - April 2007 vs April 2007 2007 2007 Occ. ADR RevPAR 2007 2007 2007 Occ. ADR RevPAR Asia Pacific 69.3 70.9 139.42 125.23 96.62 88.77-2.2
JURISDICTIONS PARTICIPATING IN THE CONVENTION ON MUTUAL ADMINISTRATIVE ASSISTANCE IN TAX MATTERS
 JURISDICTIONS PARTICIPATING IN THE CONVENTION ON MUTUAL ADMINISTRATIVE ASSISTANCE IN TAX MATTERS COUNTRY/JURISDICTION * STATUS 10 NOVEMBER 2017 1. ALBANIA 01-03-2013 (AC) 08-08-2013 01-12-2013 2. ANDORRA
Euromoney Country Risk Q RESULTS
 1 Euromoney Country Risk Q3 218 RESULTS 2 TABLE OF CONTENTS 1. Introduction (Scoring) 2. Q/Q update 3. Y/Y update 4. Contacts 3 SCORING Euromoney Country Risk is a platform designed to capture and aggregate
Global Performance (Data in US Dollars)
") Global Performance (Data in US Dollars) September 2008 vs September Year to Date - September 2008 vs September September YTD 2008 2008 2008 Occ. ADR RevPAR 2008 2008 2008 Occ. ADR RevPAR Asia Pacific 61.3
Global Performance (Data in US Dollars) September 2008 vs September Year to Date - September 2008 vs September September YTD 2008 2008 2008 Occ. ADR RevPAR 2008 2008 2008 Occ. ADR RevPAR Asia Pacific 61.3
The Great Transition: Shifting from Fossil Fuels to Solar and Wind Energy Supporting Data - Hydropower
 The Great Transition: Shifting from Fossil Fuels to Solar and Wind Energy Supporting Data - Hydropower World Installed Hydroelectric Generating Capacity, 1980-2013 GRAPH: World Installed Hydroelectric
Selected Energy Indicators for 2004
 E E G Y D C A T O S Selected Energy ndicators for 2004 egion/ Popu- GDP GDP Energy et TPES Elec. CO 2 Country lation (PPP) Prod. mports Cons. (a) Emissions (b) (million) (billion (billion (Mtoe) (Mtoe)
Annex. Courtesy EcoPort (www.ecoport.org) : P. Oudhia
 : P. Oudhia") Courtesy EcoPort (www.ecoport.org) : P. Oudhia TABLE 1 Basic data on countries and areas Country/area Land area a Population 2004 GDP 2004 Total (1 000 ha) (1 000) Density (Population/ km 2 ) Annual growth
Courtesy EcoPort (www.ecoport.org) : P. Oudhia TABLE 1 Basic data on countries and areas Country/area Land area a Population 2004 GDP 2004 Total (1 000 ha) (1 000) Density (Population/ km 2 ) Annual growth
Production (bbl/day)
") 1 of 5 14/09/2011 22:15 From Wikipedia, the free encyclopedia This is a list of countries by oil production mostly based on CIA World Factbook data. [1] Note that oil production refers to the sum of barrels
1 of 5 14/09/2011 22:15 From Wikipedia, the free encyclopedia This is a list of countries by oil production mostly based on CIA World Factbook data. [1] Note that oil production refers to the sum of barrels
Private external debt as a percentage of exports exports. Government external debt as a percentage of GDP
 Net liabilities (+ = net asset, - = net liability) Current account (+ = surplus, - = deficit) External government debt payments as a revenue exports exports exports external debt payments projected to
International Tariff Guide for Residential Customers
 International Tariff Guide for Residential Customers Prices from 1 st December 2014 Notes 15.97p call set-up fee applies to Standard BT international rate calls made with Unlimited Calls, Unlimited Evening
 WORLD TARIFF PROFILES 2017 Applied MFN tariffs 0
 Call rates are charged on a pay-as-you-go (PAYG) basis, billed per minute. International rates are subject to change without notice.
 basis, billed per minute. International rates are subject to change without notice.") Updated: 23 January 2018 International call rates apply to all Pennytel customers who have chosen to enable the international calling feature on their service. Call rates are charged on a pay-as-you-go
Updated: 23 January 2018 International call rates apply to all Pennytel customers who have chosen to enable the international calling feature on their service. Call rates are charged on a pay-as-you-go
Updated: 13 June 2018
 Updated: 13 June 2018 PENNYTEL AUSTRALIA PTY LTD 4/580 George Street Sydney NSW 2000 ABN: 12 166 566 63 PennyTel mobile supports international calling. For security, this service is switched off by default.
67 th edition. Renewable energy. Appendices. 44 Other renewables consumption 45 Biofuels production
 Renewable energy 44 Other renewables consumption 45 Biofuels production Appendices A1 Solar Generation A2 Wind Generation A3 Geothermal, biomass and other Generation A4 Geothermal Cumulative installed
A5. Summary of Inflation 197 A6. Advanced Economies: Consumer Prices 198 A7. Emerging Market and Developing Economies: Consumer Prices 199
 Statistical Appendix List of Tables Output A1. Summary of World Output 190 A2. Advanced Economies: Real GDP and Total Domestic Demand 191 A3. Advanced Economies: Components of Real GDP 192 A4. Emerging