Draft Project Deliverables: Policy Implications and Technical Basis
|
|
|
- Tiffany Webster
- 6 years ago
- Views:
Transcription

1 Surveillance and Monitoring Program (SAMP) Joe LeClaire, PhD Richard Meyerhoff, PhD Rick Chappell, PhD Hannah Erbele Don Schroeder, PE February 25, 2016 Draft Project Deliverables: Policy Implications and Technical Basis CV-SALTS Executive Committee Policy Meeting
2 Presentation Outline SAMP Objectives Direction from the August 2015 Executive Committee Meeting Well Selection Methodology Results Policy Issues Three policy questions for CV-SALTS Executive Committee to discuss. Detailed Technical Discussion to Follow 2
3 SAMP Overview The Recycled Water Policy also requires that the SNMPs include a Surveillance and Monitoring Program (SAMP) as a component: A basin/sub-basin wide monitoring plan that includes an appropriate network of monitoring locations. The scale of the basin/sub-basin monitoring plan is dependent upon the sitespecific conditions and shall be adequate to provide a reasonable, cost-effective means of determining whether the concentrations of salt, nutrients, and other constituents of concern as identified in the salt and nutrient plans are consistent with applicable water quality objectives. 3
4 SAMP Objectives Demonstrate the effectiveness of implementation of the SNMP through: Establishment of a cost-efficient program that relies on data from existing monitoring programs to the maximum extent possible. Use of selected data sources that provide a statisticallysignificant dataset to periodically assess: Ambient water quality (AWQ). TDS and nitrate trends in groundwater. 4
5 August 2015 Executive Committee Meeting Authorization to begin work: March 18, Discussed policy-related questions at the Executive Committee policy meeting on August 13, Outcomes included: SAMP will focus on groundwater basins underlying the Valley floor. The monitoring network should include wells other than community supply wells to avoid a bias towards better water quality. Ambient water quality and trends will be assessed every five years. 5
6 August 2015 Executive Committee Meeting Discussed policy-related questions at the Executive Committee policy meeting on August 13, Outcomes included: SAMP data will include groundwater elevation, TDS, nitrate, electrical conductivity and ancillary water quality data only. CV-SALTS database will be used as the basis for ambient water quality determinations. 6
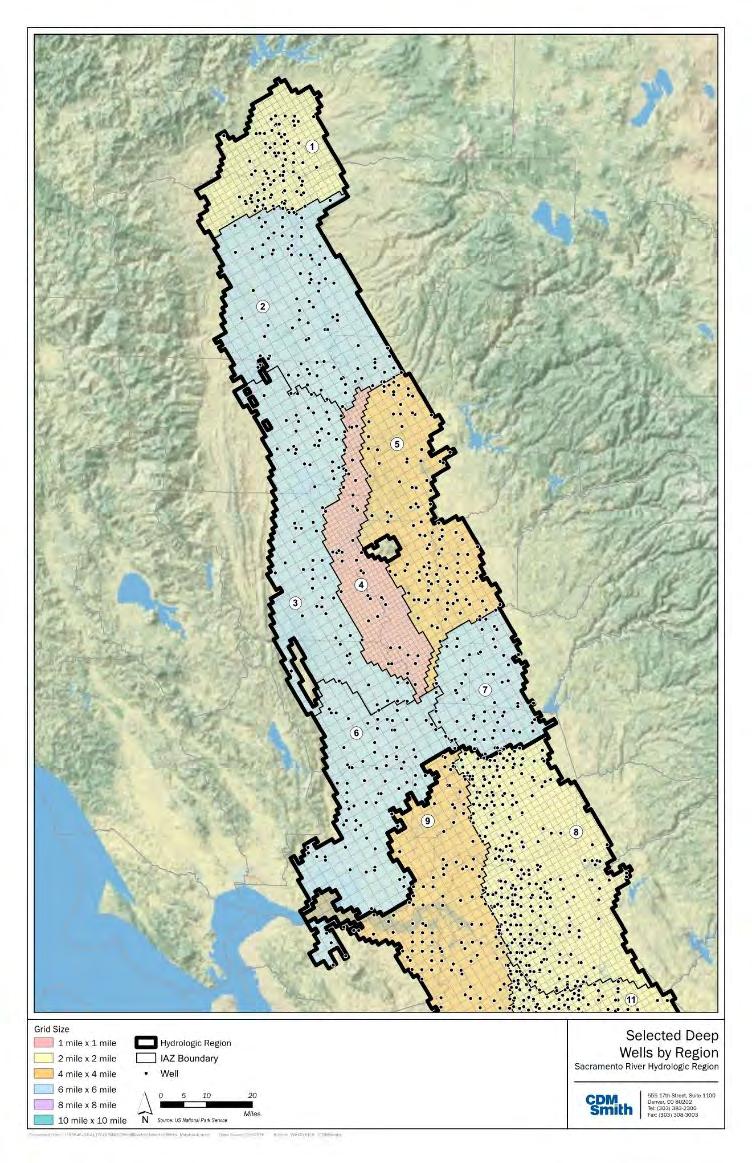
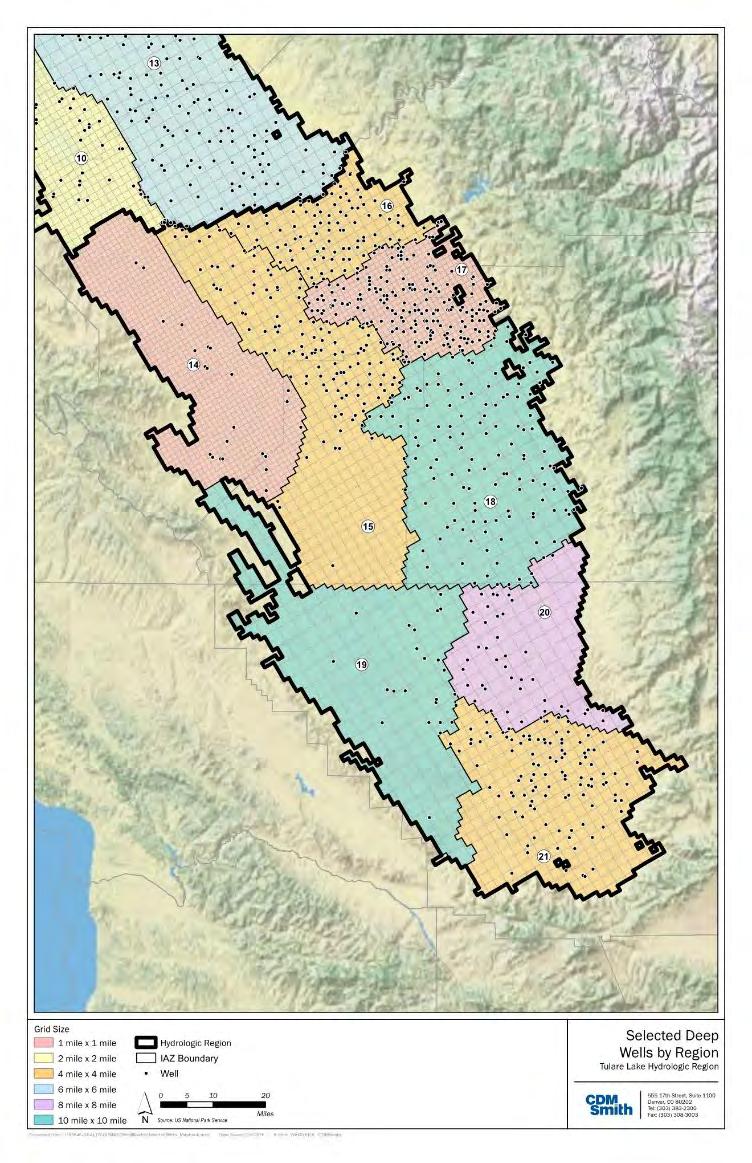
7 Methodology for Well Network Selection Methodology outlined in the work plan and refined after August 2015 Executive Committee Meeting Well monitoring network based on IAZs. Use regular, equal-area grids to decluster data. Size of the grid a function of the data variability; larger grid cells can represent the data with fewer required wells. Accomplished with statistical tools. Assign land use to each grid. One well selected per grid cell (shallow and deep). Algorithm developed to select wells within each grid cell. Executed with geographic information system tools. 7
8 Power Analyses and Grid Cell Selection 8
9 Proposed SAMP: Deep Zone Apply well selection methodology, Goal is to minimize the difference between average water quality in SAMP network and the average using all wells. Increases confidence that data are representative. IAZ SAMP Wells - Average Nitrate All Wells - Average Nitrate % Diff SAMP Wells - Average TDS All Wells - Average TDS % Diff % % % % % % % % % % % % % % % % % % % 1,071 1,011 6% % % % % % % % 1,041 1,160-11% % % % % % % % % % % % % % % % 1,191 1,092 9% 9
10 Proposed SAMP: Deep Zone Goal is to minimize the difference between average water quality in SAMP network and the average using all wells. Increase confidence that data are representative. IAZ SAMP Wells - Average Nitrate All Wells - Average Nitrate % Diff SAMP Wells - Average TDS All Wells - Average TDS % Diff % % % % % % % % % % % % % % % % % % % 1,071 1,011 6% % % % % % % % 1,041 1,160-11% % % % % % % % % % % % % % % % 1,191 1,092 9% 10
11 Proposed SAMP: Deep Data Sources Selected Wells IAZ All Selected CDPH Popultion Served > 25 CDWR DAIRY GAMA USGS Number of Selected Wells Total Available % Total % % % % % % % % % % % % % % % % % % % % % % Total:
12 Proposed SAMP: Shallow one Goal is to minimize the difference between average water quality in SAMP network and the average using all wells. Increase confidence that data are representative. IAZ SAMP Wells - Average Nitrate All Wells - Average Nitrate % Diff SAMP Wells - Average TDS All Wells - Average TDS % Diff % % % % % % % 2,448 2,451 0% % % % 968 1,338-32% % 1, % % % % 1,123 1,301-15% % 1,096 1,182-8% % 941 1,249-28% % % % % % 4,849 4,461 8% % 3,045 1,505 68% % % % % % % % 9,569 9,589 0% % 1,043 1,026 2% % % % 1,422 1,322 7% 12
13 Proposed SAMP: Shallow Data Sources Selected Wells IAZ CDPH CDWR DAIRY GAMA USGS Number of Selected Wells Total Available % Total % % % % % % % % % % % % % % % % % % % % % % Total:
14 SAMP Deliverables Maps of SAMP monitoring network; deep and shallow Tables of proposed wells by IAZ Statistical and geographic information system tools 14
15 15
16 16
17 Policy Issue 1. Shallow Zone Data The well coverage in the shallow zone is not spatially extensive. There is a high degree of data variability. CV-SALTS will need to accept this variability or it may want to consider a single monitoring network for the production zone as an alternate approach. Provides assessment of ambient water quality where most water is extracted from. Reduction in monitoring costs. However, one would lose the resolution to assess water quality in shallow vs. deep. This modified approach is also relevant to Policy Issue 2. 17
18 Policy Issue 2. Implication of Limiting Data Bias Using only community water system wells biases the network towards better water quality; therefore the SAMP instead selected wells randomly when the overlying land use was not urban or semi-agricultural (Direction provided by CV-SALTS Executive Committee in August 2015). As a result: In the deep zone, between 67 and 80 percent of the wells are believed to be monitored routinely under existing programs. In the shallow zone, routine monitoring by others does not occur to the same extent as the deep zone Outcome: Avoiding bias in well selection increases the number of wells that will need to be annually sampled by this SAMP. This affects the cost of implementation. 18
19 Policy Issue 3. SAMP Start-up & Implementation Many questions regarding how the SAMP will be initiated. Examples of issue requiring resolution include: Need to ground-truth deep/shallow wells in recommended network, i.e., verify list of wells that will need to be sampled under this SAMP. Establish sampling and analysis protocols to ensure data consistency (accept other protocols or develop new ones). Determine how SAMP is to be funded. Basic costs include sample collection at selected wells not part of an existing monitoring network, laboratory analyses, data management (next slide), ambient water quality determinations, and periodic reporting. 19
20 Policy Issue 3. SAMP Start-up & Implementation Long-term implementation also requires resolution of a number of data management issues: Use of the existing CV-SALTS database or other databases. Need for database protocols for managing new data generated by the SAMP and providing the electronic data deliverables to the appropriate state databases. Development of queries to retrieve data for wells from the state databases that are already routinely sampled. Establishment of data QA/QC protocols for periodically evaluating uploaded data. Determining where database will be stored, e.g., Central Valley Water Board and at least two other entities. 20
21 Policy Issue 3. SAMP Start-up & Implementation Given the numerous issues that need to be addressed during SAMP start-up and long term implementation, it is recommended that CV-SALTS establish a project committee or work group during the basin plan amendment process to work through each of the SAMP implementation issues. 21
22 Surveillance and Monitoring Program (SAMP) Joe LeClaire, PhD Richard Meyerhoff, PhD Rick Chappell, PhD Hannah Erbele February 25, 2016 CV-SALTS Executive Committee Policy Meeting Technical Discussion
23 Presentation Outline Review TDS and nitrate spatial distribution Methods to decluster data Power analyses and grid cell selection IAZ-17 pilot area/algorithm for well selection for monitoring network Proposed SAMP for the Central Valley at the IAZ-Level 23

24 Presentation Outline Review TDS and nitrate spatial distribution Methods to decluster data Power analyses and grid cell selection IAZ-17 pilot area/algorithm for well selection for monitoring network Proposed SAMP for the Central Valley at the IAZ-Level 24
25 Scale of SAMP SAMP at the IAZ Level 20,533 total square miles Range is 282 to 1648 square miles with an average of 933 square miles. Local SNMP can define management zones with a MZlevel SAMP. 25
26 Data Distribution Shallow Zone Period of analysis: 2003 to wells with nitrate and TDS data 4567 wells with nitrate only 706 wells with TDS only 26

27 Data Distribution Deep Zone Period of analysis: 2003 to wells with nitrate and TDS data 2693 wells with nitrate only 710 wells with TDS only 27
28 Data Distribution Unknown Zone Period of analysis: 2003 to wells with nitrate and TDS data 4 wells with nitrate only 131 wells with TDS only 28
29 TDS Areal Distribution Shallow Zone Period of analysis: 2003 to wells with TDS < 250 mg/l 561 wells with TDS between 250 and 500 mg/l 954 wells with TDS between 500 and 1000 mg/l 790 wells with TDS between 1000 and 5000 mg/l 60 wells with TDS between 5000 and 10,000 mg/l 45 wells with TDS > 10,000 mg/l 29
30 TDS Areal Distribution Deep Zone Period of analysis: 2003 to wells with TDS < 250 mg/l 2058 wells with TDS between 250 and 500 mg/l 765 wells with TDS between 500 and 1000 mg/l 245 wells with TDS between 1000 and 5000 mg/l 3 wells with TDS between 5000 and 10,000 mg/l 2 wells with TDS > 10,000 mg/l 30
31 Nitrate Areal Distribution Shallow Zone Period of analysis: 2003 to wells with nitrate < 2 mg/l 1054 wells with nitrate between 2 and 5 mg/l 988 wells with nitrate between 5 and 10 mg/l 927 wells with nitrate between 10 and 20 mg/l 624 wells with nitrate between 20 and 40 mg/l 376 wells with nitrate > 40 mg/l 31
32 Nitrate Areal Distribution Deep Zone Period of analysis: 2003 to wells with nitrate < 2 mg/l 2154 wells with nitrate between 2 and 5 mg/l 1306 wells with nitrate between 5 and 10 mg/l 592 wells with nitrate between 10 and 20 mg/l 286 wells with nitrate between 20 and 40 mg/l 89 wells with nitrate > 40 mg/l 32
33 Presentation Outline Review TDS and nitrate spatial distribution Methods to decluster data Power analyses and grid cell selection IAZ-17 pilot area/algorithm for well selection for monitoring network Proposed SAMP for the Central Valley at the IAZ-Level 33
34 Methods for Declustering Data Wells in the SAMP database are generally unequally distributed spatially across the IAZs Often contain both well clusters and areas without well coverage. It is therefore important that the method used to select wells for inclusion in the monitoring network incorporate the ability to simultaneously decluster and maximize coverage across the IAZ. 34
35 Methods for Declustering Data Three methods were considered: Equal-area and regularly-shaped (square in this case) grid cell method Equal-area and irregularly-shaped grid cell method developed by the USGS Unequal-area and irregularly-shaped grid cell method based on implementation of Thiessen polygons Second two methods can be spatially biased because the irregularly-shaped grid cells tending to estimate concentrations for large areas that lacked actual well coverage Equal-area and regularly-shaped was the selected method. 35
36 Presentation Outline Review TDS and nitrate spatial distribution Methods to decluster data Power analyses and grid cell selection IAZ-17 pilot area/algorithm for well selection for monitoring network Proposed SAMP for the Central Valley at the IAZ-Level 36
37 Power Analyses and Grid Cell Selection The equal-area, regularly-shaped grid cell method was selected because it focused on the actual data available and therefore minimized potential bias resulting from estimation across areas lacking well coverage. Square grid cells of various sizes were included for possible selection, ranging from 1 square mile (1 mile x 1 mile) to 16 square miles (4 mile x 4 mile). Selecting the most appropriate grid cell size for each IAZ was a function of the number of populated grid cells (number of grid cells containing at least one well) and the resulting variability in nitrate or TDS concentrations for the grid cell size and wells selected. 37


38 Power Analyses and Grid Cell Selection 38
39 Power Analyses and Grid Cell Selection 1. Select the grid cell size to evaluate, in sequence, beginning with the largest grid cell size (16 square mile grid) and ending with the smallest grid cell size (1 square mile grid). 2. Randomly select one well from each of the n populated grid cells. 3. Calculate the mean value of the n selected wells. 4. Repeat Steps 2-3 for m = 1000 bootstrap (with replacement) resamples. 39
40 Power Analyses and Grid Cell Selection 4. Calculate the mean of the resamples and determine the lower and upper confidence limits (LCL and UCL) of the mean as the 2.5th and 97.5th percentiles, respectively. 5. Calculate the lower and upper margins of error as the mean minus the LCL and the UCL minus the mean, respectively; and the lower and upper percent margins of error as the margins of error divided by the mean times Repeat Steps 1-6 for the next grid cell size, until all 10 grid cell sizes have been evaluated. 40
41 Power Analyses and Grid Cell Selection As the grid cell size decreases, the number of populated grid cells increases and the variability (margin of error) decreases. Therefore, the number of wells to include in the monitoring network depended on selecting a set of grid cell sizes that resulted in a practical and consistent margin of error across all IAZs (to the extent possible given the SAMP database). The target criterion for selection of a grid cell size was an upper margin of error (UME) of between 15 percent 41
42 Power Analysis for Mean of Avg NO3 (mg/l) : IAZ 17 : Deep Initial Analysis Zone (IAZ) : Depth Class : Deep Deep Deep Deep Deep Deep Deep Deep Deep Deep Grid Cell Size : 16_SQM_GRD 14_SQM_GRD 12_SQM_GRD 10_SQM_GRD 9_SQM_GRD 8_SQM_GRD 6_SQM_GRD 4_SQM_GRD 2_SQM_GRD 1_SQM_GRD Population Parameter : Mean Mean Mean Mean Mean Mean Mean Mean Mean Mean Confidence Level : Resample Size : Sample Size : Mean : Lower Confidence Limit : Upper Confidence Limit : Lower Margin of Error : Upper Margin of Error : % LME : % UME : Avg NO3 (mg/l) Upper Confidence Limit Mean Lower Confidence Limit 0 16_SQM_GRD 14_SQM_GRD 12_SQM_GRD 10_SQM_GRD 9_SQM_GRD 8_SQM_GRD 6_SQM_GRD 4_SQM_GRD 2_SQM_GRD 1_SQM_GRD 6 5 Margin of Error Upper (UCL - Mean) Lower (Mean - LCL) _SQM_GRD 14_SQM_GRD 12_SQM_GRD 10_SQM_GRD 9_SQM_GRD 8_SQM_GRD 6_SQM_GRD 4_SQM_GRD 2_SQM_GRD 1_SQM_GRD 42
43 IAZ Statistic Units 16 Square 14 Square 12 Square 10 Square 9 Square 8 Square 6 Square 4 Square 2 Square 1 Square Mile Grid Mile Grid Mile Grid Mile Grid Mile Grid Mile Grid Mile Grid Mile Grid Mile Grid Mile Grid 1 Mean TDS mg/l UME/Mean % Sample Size Mean TDS mg/l UME/Mean % Sample Size Mean TDS mg/l UME/Mean % Sample Size Mean TDS mg/l UME/Mean % Sample Size Mean TDS mg/l UME/Mean % Sample Size Mean TDS mg/l UME/Mean % Sample Size Mean TDS mg/l UME/Mean % Sample Size Mean TDS mg/l UME/Mean % Sample Size Mean TDS mg/l UME/Mean % Sample Size Mean TDS mg/l UME/Mean % Sample Size Mean TDS mg/l UME/Mean % Sample Size Mean TDS mg/l UME/Mean % Sample Size Mean TDS mg/l UME/Mean % Sample Size Mean TDS mg/l UME/Mean % Sample Size Mean TDS mg/l UME/Mean % Sample Size Mean TDS mg/l UME/Mean % Sample Size Mean TDS mg/l UME/Mean % Sample Size Mean TDS mg/l UME/Mean % Sample Size Mean TDS mg/l UME/Mean % Sample Size Mean TDS mg/l UME/Mean % Sample Size Mean TDS mg/l UME/Mean % Sample Size Mean TDS mg/l UME/Mean % Sample Size Square 14 Square 12 Square 10 Square IAZ Statistic Units Mile Grid Mile Grid Mile Grid Mile Grid 9 Square Mile Grid 8 Square Mile Grid 6 Square Mile Grid 4 Square Mile Grid 2 Square Mile Grid 1 Square Mile Grid 1 Mean TDS mg/l UME/Mean % Sample Size Mean TDS mg/l UME/Mean % Sample Size Mean TDS mg/l UME/Mean % Sample Size Mean TDS mg/l UME/Mean % Sample Size Mean TDS mg/l UME/Mean % Sample Size Mean TDS mg/l UME/Mean % Sample Size Mean TDS mg/l UME/Mean % Sample Size Mean TDS mg/l UME/Mean % Sample Size Mean TDS mg/l UME/Mean % Sample Size Mean TDS mg/l UME/Mean % Sample Size Mean TDS mg/l UME/Mean % Sample Size Mean TDS mg/l UME/Mean % Sample Size Mean TDS mg/l UME/Mean % Sample Size Mean TDS mg/l UME/Mean % Sample Size Mean TDS mg/l UME/Mean % Sample Size Mean TDS mg/l UME/Mean % Sample Size Mean TDS mg/l UME/Mean % Sample Size Mean TDS mg/l UME/Mean % Sample Size Mean TDS mg/l UME/Mean % Sample Size Mean TDS mg/l UME/Mean % Sample Size Mean TDS mg/l UME/Mean % Sample Size Mean TDS mg/l UME/Mean % Sample Size
44 Power Curve Analysis IAZ Statistic Units 16 Square 14 Square 12 Square 10 Square 9 Square 8 Square 6 Square 4 Square 2 Square 1 Square Mile Grid Mile Grid Mile Grid Mile Grid Mile Grid Mile Grid Mile Grid Mile Grid Mile Grid Mile Grid 1 Mean Nitrate mg/l UME/Mean % Sample Size Mean Nitrate mg/l UME/Mean % Sample Size Mean Nitrate mg/l UME/Mean % Sample Size Mean Nitrate mg/l UME/Mean % Sample Size Mean Nitrate mg/l UME/Mean % Sample Size Mean Nitrate mg/l UME/Mean % Sample Size
45 Power Curve Analysis IAZ Statistic Units 16 Square 14 Square 12 Square 10 Square 9 Square 8 Square 6 Square 4 Square 2 Square 1 Square Mile Grid Mile Grid Mile Grid Mile Grid Mile Grid Mile Grid Mile Grid Mile Grid Mile Grid Mile Grid 1 Mean Nitrate mg/l UME/Mean % Sample Size Mean Nitrate mg/l UME/Mean % Sample Size Mean Nitrate mg/l UME/Mean % Sample Size Mean Nitrate mg/l UME/Mean % Sample Size Mean Nitrate mg/l UME/Mean % Sample Size Mean Nitrate mg/l UME/Mean % Sample Size
46 Power Analyses and Grid Cell Selection First selected UME/Mean = 20 percent Revised to 15 percent Yields these grid cell sizes IAZ Deep Grids OLD Deep Grids NEW

47 Presentation Outline Review TDS and nitrate spatial distribution Methods to decluster data Power analyses and grid cell selection IAZ-17 pilot area/algorithm for well selection for monitoring network Proposed SAMP for the Central Valley at the IAZ-Level 47
48 Well Selection Algorithm One well per grid. Active status; if no active wells, then use inactive wells. Data between 2003 and 2014 Identify land use. Community land use CDPH/community water system wells given priority Semi-Agricultural: Dairy wells given priority Other land types: No well type are given priority selected by random number generator 48
49 Land use polygons Land use assigned to each grid cell 49
50 TDS distribution, using average of all wells in each grid cell. TDS distribution, using the selected well concentration in each grid cell. 50

51 Nitrate distribution, using average of all wells in each grid cell. Nitrate distribution, using the selected well concentration in each grid cell. 51


52 Presentation Outline Review TDS and nitrate spatial distribution Methods to decluster data Power analyses and grid cell selection IAZ-17 pilot area/algorithm for well selection for monitoring network Proposed SAMP for the Central Valley at the IAZLevel 52
53 Proposed SAMP Steps for automation Assign land use Randomly select wells based on priority criteria Assign water quality value to grid cell Compute area weighted concentrations (for cells that are not entirely contained within an IAZ Estimate area weighted concentrations for SAMP wells Compare with concentrations using all of the wells. 53
54 Proposed SAMP ArcGIS model builder used to automate the well selection process 54
55 Proposed SAMP: Deep Zone Goal is to minimize the difference between average water quality in SAMP network and the average using all wells. Increase confidence that data are representative. IAZ SAMP Wells - Average Nitrate All Wells - Average Nitrate % Diff SAMP Wells - Average TDS All Wells - Average TDS % Diff % % % % % % % % % % % % % % % % % % % 1,071 1,011 6% % % % % % % % 1,041 1,160-11% % % % % % % % % % % % % % % % 1,191 1,092 9% 55
56 Proposed SAMP: Deep Data Sources Selected Wells IAZ All Selected CDPH Popultion Served > 25 CDWR DAIRY GAMA USGS Number of Selected Wells Total Available % Total % % % % % % % % % % % % % % % % % % % % % % Total:
57 Proposed SAMP: Shallow one Goal is to minimize the difference between average water quality in SAMP network and the average using all wells. Increase confidence that data are representative. IAZ SAMP Wells - Average Nitrate All Wells - Average Nitrate % Diff SAMP Wells - Average TDS All Wells - Average TDS % Diff % % % % % % % 2,448 2,451 0% % % % 968 1,338-32% % 1, % % % % 1,123 1,301-15% % 1,096 1,182-8% % 941 1,249-28% % % % % % 4,849 4,461 8% % 3,045 1,505 68% % % % % % % % 9,569 9,589 0% % 1,043 1,026 2% % % % 1,422 1,322 7% 57
58 Proposed SAMP: Shallow Data Sources Selected Wells IAZ CDPH CDWR DAIRY GAMA USGS Number of Selected Wells Total Available % Total % % % % % % % % % % % % % % % % % % % % % % Total:
59 Proposed SAMP Cumulative density function plot. Compares distribution of wells and average concentration in SAMP grid cells. Avg NO3 (mg/l) DepthClass = Deep : IAZ = Percent Selected_Value_Weighted Avg_Value_Weighted 59
60 Proposed SAMP Data clustering yields higher average ambient concentrations. Avg NO3 (mg/l) DepthClass = Deep : IAZ = Percent Selected_Value_Weighted Avg_Value_Weighted 60
61 Proposed SAMP Data clustering yields higher average ambient concentrations. SAMP 50% < 5 mg/l; all wells 50% < 7.5 mg/l SAMP: 75 percent of grids < MCL; all wells 60 percent of wells < MCL Avg NO3 (mg/l) DepthClass = Deep : IAZ = Percent Selected_Value_Weighted Avg_Value_Weighted 61
62 62
63 63

64 Questions? 64
Merger of the generator interconnection processes of Valley Electric and the ISO;
 California Independent System Operator Corporation Memorandum To: ISO Board of Governors From: Karen Edson Vice President, Policy & Client Services Date: August 18, 2011 Re: Decision on Valley Electric
Missouri Seat Belt Usage Survey for 2017
 Missouri Seat Belt Usage Survey for 2017 Conducted for the Highway Safety & Traffic Division of the Missouri Department of Transportation by The Missouri Safety Center University of Central Missouri Final
Decision on Merced Irrigation District Transition Agreement
 California Independent System Operator Corporation Memorandum To: ISO Board of Governors From: Karen Edson, Vice President Policy & Client Services Date: March 13, 2013 Re: Decision on Merced Irrigation
Synthesis of Optimal Batch Distillation Sequences
 Presented at the World Batch Forum North American Conference Woodcliff Lake, NJ April 7-10, 2002 107 S. Southgate Drive Chandler, Arizona 85226-3222 480-893-8803 Fax 480-893-7775 E-mail: info@wbf.org www.wbf.org
Data Analytics in the Connected Vehicle Future to Revolutionize Safety, Emissions, and Funding
 1 Data Analytics in the Connected Vehicle Future to Revolutionize Safety, Emissions, and Funding H. Scott Matthews Civil and Environmental Engineering / Engineering and Public Policy Carnegie Mellon University
EXHIBIT B Water Meter Review and Testing November 2008
 EXHIBIT B Water Meter Review and Testing November 2008 Prepared by: HDR Engineering, Inc. Technical Memorandum To: Ken TeKippe, City of Dubuque From: HDR Engineering Project: Dubuque Water Meter Review
ENERGY STAR Program Requirements for Single Voltage External Ac-Dc and Ac-Ac Power Supplies. Eligibility Criteria.
 ENERGY STAR Program Requirements for Single Voltage External Ac-Dc and Ac-Ac Power Supplies Eligibility Criteria Table of Contents Section 1: Definitions 2 Section 2: Qualifying Products 3 Section 3: Energy-Efficiency
Verifying the accuracy of involute gear measuring machines R.C. Frazer and J. Hu Design Unit, Stephenson Building, University ofnewcastle upon Tyne,
 Verifying the accuracy of involute gear measuring machines R.C. Frazer and J. Hu Design Unit, Stephenson Building, University ofnewcastle upon Tyne, Abstract This paper describes the most common methods
Ricardo-AEA. Passenger car and van CO 2 regulations stakeholder meeting. Sujith Kollamthodi 23 rd May
 Ricardo-AEA Data gathering and analysis to improve understanding of the impact of mileage on the cost-effectiveness of Light-Duty vehicles CO2 Regulation Passenger car and van CO 2 regulations stakeholder
Getting Started with Correlated Component Regression (CCR) in XLSTAT-CCR
 in XLSTAT-CCR") Tutorial 1 Getting Started with Correlated Component Regression (CCR) in XLSTAT-CCR Dataset for running Correlated Component Regression This tutorial 1 is based on data provided by Michel Tenenhaus and
Tutorial 1 Getting Started with Correlated Component Regression (CCR) in XLSTAT-CCR Dataset for running Correlated Component Regression This tutorial 1 is based on data provided by Michel Tenenhaus and
Method for the estimation of the deformation frequency of passenger cars with the German In-Depth Accident Study (GIDAS)
") Method for the estimation of the deformation frequency of passenger cars with the German In-Depth Accident Study (GIDAS) S Große*, F Vogt*, L Hannawald* *Verkehrsunfallforschung an der TU Dresden GmbH,
Method for the estimation of the deformation frequency of passenger cars with the German In-Depth Accident Study (GIDAS) S Große*, F Vogt*, L Hannawald* *Verkehrsunfallforschung an der TU Dresden GmbH,
Product Loss During Retail Motor Fuel Dispenser Inspection
 Product Loss During Retail Motor Fuel Dispenser Inspection By: Christian Lachance, P. Eng. Senior Engineer - ment Engineering and Laboratory Services ment Canada Date: Product Loss During Retail Motor
Approach for determining WLTPbased targets for the EU CO 2 Regulation for Light Duty Vehicles
 Approach for determining WLTPbased targets for the EU CO 2 Regulation for Light Duty Vehicles Brussels, 17 May 2013 richard.smokers@tno.nl norbert.ligterink@tno.nl alessandro.marotta@jrc.ec.europa.eu Summary
Electric Vehicle Infrastructure Location Tool and Visualization Map
 Electric Vehicle Infrastructure Location Tool and Visualization Map Analysis and Methodology Overview February 2018 Agenda Electric Vehicle Fast Charging Infrastructure Planning Tools Overview & Analysis
U.S. Census Bureau News Joint Release U.S. Department of Housing and Urban Development
 Raemeka Mayo or Stephen Cooper Economic Indicators Division (01) 76-5160 FOR IMMEDIATE RELEASE TUESDAY, MARCH 17, 015 AT 8:0 A.M. EDT NEW RESIDENTIAL CONSTRUCTION IN FEBRUARY 015 The U.S. Census Bureau
The European Commission s science and knowledge service
 The European Commission s science and knowledge service Joint Research Centre Optimal allocation of electric vehicle charging infrastructure in cities and regions Andreea Maria Julea, Harald Scholz, Christian
Evaluation of methods for computing decadal waterquality
 Evaluation of methods for computing decadal waterquality loads Lee, C.J., Hirsch, R.M., Schwarz, G.E., Holtschlag, D.J., Preston, S.D., Crawford, C.G, Vecchia, A.V U.S. Department of the Interior U.S.
RE: Comments on Proposed Mitigation Plan for the Volkswagen Environmental Mitigation Trust
 May 24, 2018 Oklahoma Department of Environmental Quality Air Quality Division P.O. Box 1677 Oklahoma City, OK 73101-1677 RE: Comments on Proposed Mitigation Plan for the Volkswagen Environmental Mitigation
U.S. Census Bureau News Joint Release U.S. Department of Housing and Urban Development
 Raemeka Mayo or Stephen Cooper Economic Indicators Division (301) 763-5160 FOR IMMEDIATE RELEASE TUESDAY, MAY 17, 2016 AT 8:30 A.M. EDT NEW RESIDENTIAL CONSTRUCTION IN APRIL 2016 The U.S. Census Bureau
Planned Revisions to the NIJ Ballistic Resistant Body Armor Test Standard
 Outline Planned the NIJ Ballistic Resistant Body Armor Test Standard Michael A. Riley, Amanda Forster, Kirk Rice Office of Law Enforcement Standards National Institute of Standards and Technology Gaithersburg,
DRIVER SPEED COMPLIANCE WITHIN SCHOOL ZONES AND EFFECTS OF 40 PAINTED SPEED LIMIT ON DRIVER SPEED BEHAVIOURS Tony Radalj Main Roads Western Australia
 DRIVER SPEED COMPLIANCE WITHIN SCHOOL ZONES AND EFFECTS OF 4 PAINTED SPEED LIMIT ON DRIVER SPEED BEHAVIOURS Tony Radalj Main Roads Western Australia ABSTRACT Two speed surveys were conducted on nineteen
Using ArcGIS to Identify Hog Farms that Pose a Risk to Cause Eutrophication in the Neuse River Basin. Nolan Kirkwood 12/5/2014 GEOG 591
 Using ArcGIS to Identify Hog Farms that Pose a Risk to Cause Eutrophication in the Neuse River Basin Nolan Kirkwood 12/5/2014 GEOG 591 Introduction Eutrophication was first defined by SW Nixon in his 1995
PFI Quality Assurance/Quality Control (QA/QC) Program for Residential/Commercial Densified Fuels
 Program for Residential/Commercial Densified Fuels") PFI Quality Assurance/Quality Control (QA/QC) Program for Residential/Commercial Densified Fuels Scope: This program must be utilized by participating pellet fuel manufacturers to assure consistent quality
PFI Quality Assurance/Quality Control (QA/QC) Program for Residential/Commercial Densified Fuels Scope: This program must be utilized by participating pellet fuel manufacturers to assure consistent quality
Appendix E Water Supply Modeling
 Supply Modeling Modesto Irrigation District Treatment Plant Expansion Project Modeling I. Introduction The Modesto Irrigation District (MID) is situated adjacent to and north of the Tuolumne River. Over
PROCEDURES FOR ESTIMATING THE TOTAL LOAD EXPERIENCE OF A HIGHWAY AS CONTRIBUTED BY CARGO VEHICLES
 PROCEDURES FOR ESTIMATING THE TOTAL LOAD EXPERIENCE OF A HIGHWAY AS CONTRIBUTED BY CARGO VEHICLES SUMMARY REPORT of Research Report 131-2F Research Study Number 2-10-68-131 A Cooperative Research Program
Motorcoach Census. A Study of the Size and Activity of the Motorcoach Industry in the United States and Canada in 2015
 Motorcoach Census A Study of the Size and Activity of the Motorcoach Industry in the United States and Canada in 2015 Prepared for the American Bus Association Foundation by John Dunham & Associates October
WHITE PAPER. Preventing Collisions and Reducing Fleet Costs While Using the Zendrive Dashboard
 WHITE PAPER Preventing Collisions and Reducing Fleet Costs While Using the Zendrive Dashboard August 2017 Introduction The term accident, even in a collision sense, often has the connotation of being an
Voting Draft Standard
 page 1 of 7 Voting Draft Standard EL-V1M4 Sections 1.7.1 and 1.7.2 March 2013 Description This proposed standard is a modification of EL-V1M4-2009-Rev1.1. The proposed changes are shown through tracking.
CHARACTERIZATION AND DEVELOPMENT OF TRUCK LOAD SPECTRA FOR CURRENT AND FUTURE PAVEMENT DESIGN PRACTICES IN LOUISIANA
 CHARACTERIZATION AND DEVELOPMENT OF TRUCK LOAD SPECTRA FOR CURRENT AND FUTURE PAVEMENT DESIGN PRACTICES IN LOUISIANA LSU Research Team Sherif Ishak Hak-Chul Shin Bharath K Sridhar OUTLINE BACKGROUND AND
A Transit Plan for the Future. Draft Network Plan
 A Transit Plan for the Future Draft Network Plan Project Overview and Status Completed Market Analysis and Service Evaluation. Developed Plan Framework and Guiding Principles. Developed a draft Five Year
Asian paper mill increases control system utilization with ABB Advanced Services
 Case Study Asian paper mill increases control system utilization with ABB Advanced Services A Southeast Asian paper mill has 13 paper machines, which creates significant production complexity. They have
IEEE SCC21 Overview/Status IEEE Standards Coordinating Committee 21 on Fuel cells, Photovoltaics. Dispersed Generation, and Energy Storage
 IEEE SCC21 Overview/Status IEEE Standards Coordinating Committee 21 on Fuel cells, Photovoltaics. Dispersed Generation, and Energy Storage Richard DeBlasio SCC21 Chair/IEEE Standards Board Member/U.S.
Crashworthiness Evaluation. Roof Strength Test Protocol (Version III)
") Crashworthiness Evaluation Roof Strength Test Protocol (Version III) July 2016 CRASHWORTHINESS EVALUATION ROOF STRENGTH TEST PROTOCOL (VERSION III) Supporting documents for the Insurance Institute for
Crashworthiness Evaluation Roof Strength Test Protocol (Version III) July 2016 CRASHWORTHINESS EVALUATION ROOF STRENGTH TEST PROTOCOL (VERSION III) Supporting documents for the Insurance Institute for
Spatial and Temporal Analysis of Real-World Empirical Fuel Use and Emissions
 Spatial and Temporal Analysis of Real-World Empirical Fuel Use and Emissions Extended Abstract 27-A-285-AWMA H. Christopher Frey, Kaishan Zhang Department of Civil, Construction and Environmental Engineering,
June Safety Measurement System Changes
 June 2012 Safety Measurement System Changes The Federal Motor Carrier Safety Administration s (FMCSA) Safety Measurement System (SMS) quantifies the on-road safety performance and compliance history of
CORINE Title Land Cover. First name SURNAME György BÜTTNER Position Senior advisor
 CORINE Title Land Cover First name SURNAME György BÜTTNER Position Senior advisor Name EEA/ IDM4 of the entity Place, Copenhagen, date 19/10/2015 Outline CLC basics Geographic coverage of CLC2012 Methodology
GREENER SHIPPING SUMMIT 2017
 GREENER SHIPPING SUMMIT 2017 EU MRV Regulation Methods of Data Collection of Fuel Differences/Consequences/Evaluation of Methods Antonios Georgantzis 14 November 2017 Eugenides Foundation The EU MRV Timeline
EN 1 EN. Second RDE LDV Package Skeleton for the text (V3) Informal EC working document
 Informal EC working document") Second RDE LDV Package Skeleton for the text (V3) Informal EC working document Introduction This document is a skeleton of the intended second RDE package. The document identifies which sections-appendices
Second RDE LDV Package Skeleton for the text (V3) Informal EC working document Introduction This document is a skeleton of the intended second RDE package. The document identifies which sections-appendices
HARMFUL AQUATIC ORGANISMS IN BALLAST WATER
 E MARINE ENVIRONMENT PROTECTION COMMITTEE 70th session Agenda item 4 MEPC 70/4/17 19 August 2016 Original: ENGLISH HARMFUL AQUATIC ORGANISMS IN BALLAST WATER Proposal for revision of the draft MEPC resolution
MONTHLY NEW RESIDENTIAL CONSTRUCTION, NOVEMBER 2017
 FOR RELEASE AT 8:30 AM EST, TUESDAY, DECEMBER 19, MONTHLY NEW RESIDENTIAL CONSTRUCTION, NOVEMBER Release Number: CB17-206 December 19, - The U.S. Census Bureau and the U.S. Department of Housing and Urban
Algae is a superior renewable feedstock
 Tim Zenk VP of Corporate Affairs, Sapphire Energy Inc. October 11, 2012 Cost of production ($ per barrel) Algae is a superior renewable feedstock Superior attributes of algae Scalable to millions of barrels
SIMWIND: A Geospatial Infrastructure Model for Optimizing Wind Power Generation and Transmission
 Engineering Conferences International ECI Digital Archives Modeling, Simulation, And Optimization for the 21st Century Electric Power Grid Proceedings Fall 10-23-2012 SIMWIND: A Geospatial Infrastructure
Integrating remote sensing and ground monitoring data to improve estimation of PM 2.5 concentrations for chronic health studies
 Integrating remote sensing and ground monitoring data to improve estimation of PM 2.5 concentrations for chronic health studies Chris Paciorek and Yang Liu Departments of Biostatistics and Environmental
BQ-9000 Quality Management System Testing Laboratory Requirements
 Quality Management System Testing Laboratory Requirements Revision 0 Effective Date: March 1, 2009 2009 National Biodiesel Board This requirements document has been prepared by the National Biodiesel Accreditation
STATE IMPLEMENTATION PLAN CREDIT FOR EMISSION REDUCTIONS GENERATED THROUGH INCENTIVE PROGRAMS (Adopted June 20, 2013)
") RULE 9610 STATE IMPLEMENTATION PLAN CREDIT FOR EMISSION REDUCTIONS GENERATED THROUGH INCENTIVE PROGRAMS (Adopted June 20, 2013) 1.0 Purpose The purpose of this rule is to provide an administrative mechanism
RULE 9610 STATE IMPLEMENTATION PLAN CREDIT FOR EMISSION REDUCTIONS GENERATED THROUGH INCENTIVE PROGRAMS (Adopted June 20, 2013) 1.0 Purpose The purpose of this rule is to provide an administrative mechanism
Recommended Vision for the Downtown Rapid Transit Network
 Recommended Vision for the Downtown Rapid Transit Network April 2008 Presentation Overview Context Transit options Assessment of options Recommended network Building the network 2 1 Rapid Our Vision Reliable
Asset Category Batteries LPN
 Asset Category Batteries LPN Asset Stewardship Report 2013 Brian Matthews Approved by Richard Wakelen / Barry Hatton Approved date 03.06.2013 / 04.06.2013 Document Management and Governance by Victoria
Driver Personas. New Behavioral Clusters and Their Risk Implications. March 2018
 Driver Personas New Behavioral Clusters and Their Risk Implications March 2018 27 TABLE OF CONTENTS 1 2 5 7 8 10 16 18 19 21 Introduction Executive Summary Risky Personas vs. Average Auto Insurance Price
Vehicle Safety Risk Assessment Project Overview and Initial Results James Hurnall, Angus Draheim, Wayne Dale Queensland Transport
 Vehicle Safety Risk Assessment Project Overview and Initial Results James Hurnall, Angus Draheim, Wayne Dale Queensland Transport ABSTRACT The goal of Queensland Transport s Vehicle Safety Risk Assessment
H HILMAR. June 7, 2077
 Upper H HILMAR INGIT S June 7, 2077 Mr. Doug Patteson Supervising WRC Engineer CaLifornia RegionaL Water Quality Control Board CentraL Vattey Region - Region S Fresno Office 1685 E Street Fresno, Catifornia
Electric Vehicle Infrastructure Location Tool and Visualization Map. July 17, 2018
 Electric Vehicle Infrastructure Location Tool and Visualization Map Version 2.0 Analysis Summary July 17, 2018 Contents Electric Vehicle Fast Charging Infrastructure Planning Tools Overview & Analysis
EUROPEAN NEW CAR ASSESSMENT PROGRAMME (Euro NCAP) CAR SPECIFICATION, SPONSORSHIP, TESTING AND RETESTING PROTOCOL
 CAR SPECIFICATION, SPONSORSHIP, TESTING AND RETESTING PROTOCOL") EUROPEAN NEW CAR ASSESSMENT PROGRAMME (Euro NCAP) CAR SPECIFICATION, SPONSORSHIP, TESTING AND RETESTING PROTOCOL Version 2.1 June 2007 CAR SPECIFICATION, SPONSORSHIP, TESTING AND RETESTING PROTOCOL 1.
EUROPEAN NEW CAR ASSESSMENT PROGRAMME (Euro NCAP) CAR SPECIFICATION, SPONSORSHIP, TESTING AND RETESTING PROTOCOL Version 2.1 June 2007 CAR SPECIFICATION, SPONSORSHIP, TESTING AND RETESTING PROTOCOL 1.
ASTM D4169 Truck Profile Update Rationale Revision Date: September 22, 2016
 Over the past 10 to 15 years, many truck measurement studies have been performed characterizing various over the road environment(s) and much of the truck measurement data is available in the public domain.
MONTHLY NEW RESIDENTIAL CONSTRUCTION, FEBRUARY 2017
 FOR RELEASE AT 8:30 AM EDT, THURSDAY, MARCH 16, MONTHLY NEW RESIDENTIAL CONSTRUCTION, FEBRUARY Release Number: CB17-38 March 16, - The U.S. Census Bureau and the U.S. Department of Housing and Urban Development
Sample Geographic Information System (GIS) Staffing and Response Time Report Virtual County Fire Department GIS Analysis
 Staffing and Response Time Report Virtual County Fire Department GIS Analysis") Sample Geographic Information System (GIS) Staffing and Response Time Report Fire Department GIS Analysis Executive Summary This study examines predicted response times and geographic coverage areas for
Sample Geographic Information System (GIS) Staffing and Response Time Report Fire Department GIS Analysis Executive Summary This study examines predicted response times and geographic coverage areas for
LONG RANGE PERFORMANCE REPORT. Study Objectives: 1. To determine annually an index of statewide turkey populations and production success in Georgia.
 State: Georgia Grant Number: 08-953 Study Number: 6 LONG RANGE PERFORMANCE REPORT Grant Title: State Funded Wildlife Survey Period Covered: July 1, 2010 - June 30, 2011 Study Title: Wild Turkey Production
MONTHLY NEW RESIDENTIAL CONSTRUCTION, JULY 2017
 FOR RELEASE AT 8:30 AM EDT, WEDNESDAY, AUGUST 16, MONTHLY NEW RESIDENTIAL CONSTRUCTION, JULY Release Number: CB17-133 August 16, - The U.S. Census Bureau and the U.S. Department of Housing and Urban Development
HIGH PRODUCTIVITY MOTOR VEHICLES NEW ZEALAND S APPROACH. John de Pont, TERNZ
 HIGH PRODUCTIVITY MOTOR VEHICLES NEW ZEALAND S APPROACH John de Pont, TERNZ Outline Overview of the country and freight task Current HV fleet Legislative change for HPMVs Pro-forma design approach Implementation
Electric Vehicle Infrastructure Location Tool and Visualization Map
 Electric Vehicle Infrastructure Location Tool and Visualization Map NASEO Northeast Regional Meeting April 12, 2018 Agenda Electric Vehicle Fast Charging Infrastructure Planning Tools Overview & Analysis
Article: Sulfur Testing VPS Quality Approach By Dr Sunil Kumar Laboratory Manager Fujairah, UAE
 Article: Sulfur Testing VPS Quality Approach By Dr Sunil Kumar Laboratory Manager Fujairah, UAE 26th September 2017 For over a decade, both regional ECA and global sulphur limits within marine fuels have
MONTHLY NEW RESIDENTIAL SALES, SEPTEMBER 2018
 FOR RELEASE AT 10:00 AM EDT, WEDNESDAY, OCTOBER 24, MONTHLY NEW RESIDENTIAL SALES, SEPTEMBER Release Number: CB18 160 October 24, The U.S. Census Bureau and the U.S. Department of Housing and Urban Development
MONTHLY NEW RESIDENTIAL CONSTRUCTION, APRIL 2017
 FOR RELEASE AT 8:30 AM EDT, TUESDAY, MAY 16, MONTHLY NEW RESIDENTIAL CONSTRUCTION, APRIL Release Number: CB17-75 May 16, - The U.S. Census Bureau and the U.S. Department of Housing and Urban Development
Fleet Safety Initiative Status Summary
 Fleet Safety Initiative Status Summary Deborah Majeski DTE Energy Company October 7, 2008 DTE Energy s Primary Subsidiaries are Gas and Electric Utilities 2 Non-Utility Energy Related Businesses 3 Impact
HOW MUCH DRIVING DATA DO WE NEED TO ASSESS DRIVER BEHAVIOR?
 0 0 0 0 HOW MUCH DRIVING DATA DO WE NEED TO ASSESS DRIVER BEHAVIOR? Extended Abstract Anna-Maria Stavrakaki* Civil & Transportation Engineer Iroon Polytechniou Str, Zografou Campus, Athens Greece Tel:
U.S. Census Bureau News Joint Release U.S. Department of Housing and Urban Development
 Raemeka Mayo or Stephen Cooper Economic Indicators Division (01) 76-5160 FOR IMMEDIATE RELEASE WEDNESDAY, MARCH 16, 016 AT 8:0 A.M. EDT NEW RESIDENTIAL CONSTRUCTION IN FEBRUARY 016 The U.S. Census Bureau
Executive Summary. Treasure Valley High Capacity Transit Study Priority Corridor Phase 1 Alternatives Analysis October 13, 2009.
 Treasure Valley High Capacity Transit Study Priority Corridor Phase 1 Alternatives Analysis October 13, 2009 Background As the Treasure Valley continues to grow, high-quality transportation connections
U.S. Census Bureau News Joint Release U.S. Department of Housing and Urban Development
 Raemeka Mayo or Stephen Cooper Economic Indicators Division (01) 76-5160 FOR IMMEDIATE RELEASE FRIDAY, JUNE 17, 016 AT 8:0 A.M. EDT NEW RESIDENTIAL CONSTRUCTION IN MAY 016 The U.S. Census Bureau and the
ENERGY STRATEGY FOR YUKON. Independent Power Production Policy
 ENERGY STRATEGY FOR YUKON Independent Power Production Policy May 20, 2014 Page 2 of 11 BACKGROUND The Government of Yukon released the Energy Strategy for Yukon in January 2009. The strategy sets out
WLTP DHC subgroup. Draft methodology to develop WLTP drive cycle
 WLTP DHC subgroup Date 30/10/09 Title Working paper number Draft methodology to develop WLTP drive cycle WLTP-DHC-02-05 1.0. Introduction This paper sets out the methodology that will be used to generate
Bus Stop Optimization Study
 Bus Stop Optimization Study Executive Summary February 2015 Prepared by: Passero Associates 242 West Main Street, Suite 100 Rochester, NY 14614 Office: 585 325 1000 Fax: 585 325 1691 In association with:
CITY OF LOS ANGELES INTER-DEPARTMENTAL MEMORANDUM
 Date: March 26, 2013 CITY OF LOS ANGELES INTER-DEPARTMENTAL MEMORANDUM To: From: The Honorable City Council c/o City Clerk, Room 395 Attention: Honorable Mitchell Englander, Chair, Public Safety Committee
Agenda. Industry Rate Trends Summary of Financial Targets Cost of Service Information. Valuation of Solar
 Agenda Industry Rate Trends Summary of Financial Targets Cost of Service Information Customer charges Residential Demand Charges Time of Use Rates Valuation of Solar Industry Trends Increasing demand charges
Methodology. Supply. Demand
 Methodology Supply Demand Tipping the Scale 1 Overview Latin America and the Caribbean, a major petroleum product importing region, provides an important counterbalance to surpluses in refined product
Southern California Edison s Preferred Resources Pilot (PRP) Solar Siting Survey. Summary Document
 Solar Siting Survey. Summary Document") Southern California Edison s Preferred Resources Pilot (PRP) Solar Siting Survey Summary Document Introduction The Southern California Edison (SCE) Preferred Resources Pilot (PRP) Solar Siting Survey,
Southern California Edison s Preferred Resources Pilot (PRP) Solar Siting Survey Summary Document Introduction The Southern California Edison (SCE) Preferred Resources Pilot (PRP) Solar Siting Survey,
Performance of Batteries in Grid Connected Energy Storage Systems. June 2018
 Performance of Batteries in Grid Connected Energy Storage Systems June 2018 PERFORMANCE OF BATTERIES IN GRID CONNECTED ENERGY STORAGE SYSTEMS Authors Laurie Florence, Principal Engineer, UL LLC Northbrook,
Driver Speed Compliance in Western Australia. Tony Radalj and Brian Kidd Main Roads Western Australia
 Driver Speed Compliance in Western Australia Abstract Tony Radalj and Brian Kidd Main Roads Western Australia A state-wide speed survey was conducted over the period March to June 2 to measure driver speed
Effect of Sample Size and Method of Sampling Pig Weights on the Accuracy of Estimating the Mean Weight of the Population 1
 Effect of Sample Size and Method of Sampling Pig Weights on the Accuracy of Estimating the Mean Weight of the Population C. B. Paulk, G. L. Highland 2, M. D. Tokach, J. L. Nelssen, S. S. Dritz 3, R. D.
Renewable Fuels Association One Massachusetts Ave. NW Suite 820 Washington, DC Telephone: (202) Fax: (202)
 Fax: (202)") Guidelines for Establishing Ethanol Plant Quality Assurance and Quality Control Programs Renewable Fuels Association One Massachusetts Ave. NW Suite 820 Washington, DC 20001 Telephone: (202) 289-3835 Fax:
Guidelines for Establishing Ethanol Plant Quality Assurance and Quality Control Programs Renewable Fuels Association One Massachusetts Ave. NW Suite 820 Washington, DC 20001 Telephone: (202) 289-3835 Fax:
City of Palo Alto (ID # 6416) City Council Staff Report
 City Council Staff Report") City of Palo Alto (ID # 6416) City Council Staff Report Report Type: Informational Report Meeting Date: 1/25/2016 Summary Title: Update on Second Transmission Line Title: Update on Progress Towards Building
City of Palo Alto (ID # 6416) City Council Staff Report Report Type: Informational Report Meeting Date: 1/25/2016 Summary Title: Update on Second Transmission Line Title: Update on Progress Towards Building
WNTE. WNTE control area evaluation with respect to the real-world engine operation envelope. TNO Knowledge for Business
 OCE Informal Document No. 42 Thirteenth Plenary Meeting of the Working Group On Off-Cycle Emissions 5 & The Hague, Netherlands WNTE WNTE control area evaluation with respect to the real-world engine operation
Solargis Report. Solar Resource Overview. Plataforma Solar de Almeria, Spain. 03 August Solargis s.r.o.
 Solargis Report Solar Resource Overview Site name: Plataforma Solar de Almeria, Spain Date of Issue: 03 August 2017 Type of Data: Daily time series (01/01/1994-31/12/2016) Customer: Solargis s.r.o. Issued
BUILDING A ROBUST INDUSTRY INDEX BASED ON LONGITUDINAL DATA
 CASE STUDY BUILDING A ROBUST INDUSTRY INDEX BASED ON LONGITUDINAL DATA Hanover built a first of its kind index to diagnose the health, trends, and hidden opportunities for the fastgrowing auto care industry.
Understanding Impacts of Distributed Solar Generation on Cost Recovery and Rates IAMU Annual Energy Conference Preconference Seminar
 Understanding Impacts of Distributed Solar Generation IAMU Annual Energy Conference Preconference Seminar David A. Berg, PE Principal November 3, 2015 Your Presenter David Berg, PE Principal Dave Berg
Petroleum Brownfields Management Tools: A Site Inventory Case Study
 Petroleum Brownfields Management Tools: A Site Inventory Case Study J. Ryan Kellogg, M.A., R.E.H.S. Tacoma-Pierce County Health Department 17 th Annual UST/LUST National Conference March 15, 2005 2 Pierce
PUBLIC Law, Chapter 539 LD 1535, item 1, 124th Maine State Legislature An Act To Create a Smart Grid Policy in the State
 PLEASE NOTE: Legislative Information cannot perform research, provide legal advice, or interpret Maine law. For legal assistance, please contact a qualified attorney. Emergency preamble. Whereas, acts
Moving Forward on Los Altos Parking Issues
 Moving Forward on Los Altos Parking Issues Jean Mordo, with R. Bodner, K. Cranston, M. Rogge, D. Rock January 24, 2017 Preface What is the City-wide parking problem? City code needs to be simple, reasonable,
Somatic Cell Count Benchmarks
 Table of Contents Introduction... 3 Methods... 3 Mastitis and Somatic Cell Counts... 3 Methods of Evaluating Somatic Cell Counts... 4 Table 1: Relationship between SCC Scores and Somatic Cell Counts...
Transportation Performance Management Overview. Laura Toole 2018 Ohio Planning Conference
 Transportation Performance Management Overview Laura Toole 2018 Ohio Planning Conference What is Transportation Performance Management (TPM)? Strategic approach Uses system information to make decisions
MEETING GOVERNMENT MANDATES TO REDUCE FLEET SIZE
 H O W W I R E L E S S F L E E T M A N A G E M E N T C A N H E L P E X C E E D F L E E T O P T I M I Z AT I O N G O A L S Table of Contents 3 4 4 5 5 6 6 6 8 8 Overview Using Wireless Fleet Management to
MONTHLY NEW RESIDENTIAL CONSTRUCTION, AUGUST 2017
 FOR RELEASE AT 8:30 AM EDT, TUESDAY, SEPTEMBER 19, MONTHLY NEW RESIDENTIAL CONSTRUCTION, AUGUST Release Number: CB17-158 Notice: For information on the impact of Hurricanes Harvey and Irma on the compilation
Ambient PM 10 Monitoring Sechelt, B.C Update
 Ministry of Environment LOWER MAINLAND REGION Ambient PM 10 Monitoring Sechelt, B.C. 2004-2005 Update E N V I R O N M E N T A L Q U A L I T Y Library and Archives Canada Cataloguing in Publication Data
Accelerated Testing of Advanced Battery Technologies in PHEV Applications
 Page 0171 Accelerated Testing of Advanced Battery Technologies in PHEV Applications Loïc Gaillac* EPRI and DaimlerChrysler developed a Plug-in Hybrid Electric Vehicle (PHEV) using the Sprinter Van to reduce
POLLUTION PREVENTION AND RESPONSE (MATTERS EMANATING FROM THE FIFTH SESSION OF THE SUB-COMMITTEE)
") E MARITIME SAFETY COMMITTEE 100th session Agenda item 8 MSC 100/8/1 XX October 2018 Original: ENGLISH POLLUTION PREVENTION AND RESPONSE (MATTERS EMANATING FROM THE FIFTH SESSION OF THE SUB-COMMITTEE) Effective
E MARITIME SAFETY COMMITTEE 100th session Agenda item 8 MSC 100/8/1 XX October 2018 Original: ENGLISH POLLUTION PREVENTION AND RESPONSE (MATTERS EMANATING FROM THE FIFTH SESSION OF THE SUB-COMMITTEE) Effective
ANNEX 7. RESOLUTION MEPC.182(59) Adopted on 17 July 2009
 Adopted on 17 July 2009") ANNEX 7 RESOLUTION MEPC.182(59) Adopted on 17 July 2009 2009 GUIDELINES FOR THE SAMPLING OF FUEL OIL FOR DETERMINATION OF COMPLIANCE WITH THE REVISED MARPOL ANNEX VI THE MARINE ENVIRONMENT PROTECTION COMMITTEE,
ANNEX 7 RESOLUTION MEPC.182(59) Adopted on 17 July 2009 2009 GUIDELINES FOR THE SAMPLING OF FUEL OIL FOR DETERMINATION OF COMPLIANCE WITH THE REVISED MARPOL ANNEX VI THE MARINE ENVIRONMENT PROTECTION COMMITTEE,
EV - Smart Grid Integration. March 14, 2012
 EV - Smart Grid Integration March 14, 2012 If Thomas Edison were here today 1 Thomas Edison, circa 1910 with his Bailey Electric vehicle. ??? 2 EVs by the Numbers 3 10.6% of new vehicle sales expected
Ecodesign Directive for Batteries
 January 2019 Ecodesign Directive for Batteries RECHARGE View on Criteria for Sustainable Batteries Introduction Over the next 15 years, a significant and constant growth is expected in battery volumes
Commissioning Director for Environment. Officer Contact Details Lisa Wright; Summary
 Finchley and Golders Green Area Committee 30 November 2016 Title Report of Wards Status Urgent Key Enclosures Westbury Road Vehicles Activated Signs (VAS) - Monitoring Commissioning Director for Environment
Environmental Management Systems and ISO Certification. MD-DC Utilities Association Environmental Conference Dan Norden October 10, 2012
 Environmental Management Systems and ISO 14001 Certification MD-DC Utilities Association Environmental Conference Dan Norden October 10, 2012 Overview EMS and ISO Background Audits and Readiness Gas Certification
Florida Strategic Highway Safety Planning Florida Strategic Highway Safety Plan (SHSP) Update and Performance Overview
 Update and Performance Overview") Session 1 Florida Strategic Highway Safety Planning Florida Strategic Highway Safety Plan (SHSP) Update and Performance Overview Joe Santos, PE, FDOT, State Safety Office October, 23, 2013 Florida Statistics
Session 1 Florida Strategic Highway Safety Planning Florida Strategic Highway Safety Plan (SHSP) Update and Performance Overview Joe Santos, PE, FDOT, State Safety Office October, 23, 2013 Florida Statistics
Final Report. Solar feed in tariff for regional Queensland for
 Final Report Solar feed in tariff for regional Queensland for 2014 15 May 2014 Table of Contents Table of Contents 1 INTRODUCTION 1 1.1 Terms of reference 1 1.2 Background 1 1.3 About this review 2 1.4