Heavy Commercial Volumes at Selected Piezo and Wim Sites( )
|
|
|
- Gladys Morgan
- 6 years ago
- Views:
Transcription
")

1 Heavy Commercial Volumes at Selected Piezo and Wim Sites( ) Minnesota Department of Transportation Traffic Forecast and Analysis Section April 2012
2 \
3
4 Piezo and WIM Analysis Piezos record vehicle classification data 24 hours a day and 365 days a year. Automatic Traffic Recorders (ATRs) continuously collect hourly traffic data at various sites in Minnesota. Products from this data are Monthly ATR reports, Annual ATR Reports, historical Annual Average Daily Traffic (AADT), and adjustment factors for adjusting short duration counts. Automatic Vehicle Classifiers (AVC, Piezo) can be considered ATRs that collect classification data and are used to develop seasonal adjustment factors for adjusting short-duration classification counts. Weigh-In-Motion (WIM) is a type of ATR that also has sensors to collect weight data along with volume, axle spacing, length, speed, and vehicle type data. Data is recorded at continuously operating traffic volume stations, classification volume stations, and WIM stations located on the state s interstates, trunk highways, county state aid highways and municipal state aid streets. Currently, there are 70+ active devices maintained by MnDOT throughout the state in the sevencounty metro area and 35+ in greater Minnesota. Four categories of ATRs produce different data. ATR 1 produces total volume, ATR 2 produces speed and volume, ATR 3 produces volume, speed, and class, and ATR 4 are WIMs that also produce weight. ATRs are on Interstates, U.S Trunk Highways, Minnesota Trunk Highways, and County State Aid Roads (CSAHs).. Since 2008, The Office of Transportation Data and Analysis (TDA) has been using monthly ATR data to produce a monthly ATR report. The purpose of the ATR monthly report is to monitor the most recent traffic conditions on Minnesota roads. ATR data also contributes to our understanding of design hour volumes. Such an understanding contributes to decisions made in designing roads. By analyzing these continuous counts over a period of years, one can get a sense of traffic and vehicle type patterns and trends for the entire traffic stream AADT. Our focus in this report is the truck component that makes up the portion of AADT known as HCAADT (Heavy Commercial Annual Average Daily Traffic). Any number of trends can be studied among these are change over time in heavy commercial distribution and volume by month, day and year. The following is an update of the tables and charts initially produced in the September 2009 report (Heavy Commercial Volume Trends at Selected Piezos ( ) and builds upon that database to include additional WIMs and piezos. Piezo data has been collected with other selected first-time sites and is being added to our existing piezo database. Each year additional sites will be added to continually expand our piezo information database from which we hope to discern observable trends and long term patterns. Each piezo analyzed in this report is based on a full year of data. Where 365 days of data did not exist at any particular piezo, the data was interpolated based on previous days and months from the same piezo in the same year. For the newest study, no piezos with less than about 30 days of data missing were used and the majority of sites had only a few missing days. Thus, the data selected from the WIMs and piezos represents very little inclusion of estimated data for individual truck categories.
5 Any non piezos and WIMs that were not functioning, not working, or contained large amounts of incomplete data were not used in this report. That accounts for the variability of individual years of data reported at each site. It was important to get accurate data and keep the interpolation of truck categories to a minimum to insure complete and reliable reporting. The term AADT is the estimate of daily traffic on a road segment that represents the total traffic on a segment that occurs in a one-year period divided by 365. HCAADT is the estimate of daily heavy commercial traffic on a road segment that occurs in a one year period divided by 365. HCAADT is defined as all vehicles with at least two axles and six tires. A brief overview of each Piezo follows: Please note that most of the discussion includes two and three axle single unit trucks as well as five or more axle semi trucks. Those categories make up the largest percentage of trucks and cause the most damage on the roadway system. Three and four axle semis, as well as heavy trucks with trailers and the twin trailer categories do not comprise nearly the volumes of the other categories. A glance at the charts that accompany the piezos will reveal this trend.

6 WIM 26 I 35, Steele County, Ellendale, 3.5 miles north of TH30 north of Ellendale
7 WIM 29 US 53, St. Louis County, Cotton, 2.7 miles north of Cotton South of Virginia Problem with equipment in 2010 resulted in little usable data Although there are gaps between 2008 and 2011 in reported data for WIM29, the increase in two axle single unit trucks is substantial. Numbers of five plus axle semis have decreased slightly, while most other categories with the exception of Twins have increased in volume.
8 WIM 31 US 2, Polk County, East Grand Forks, 6 miles east of East Grand Forks Between 2009 and 2010, average daily total volume increased, but that increase was mostly passenger cars. Trucks declined, mainly in the 2 axle single unit category. There was a slight increase in the number of 5 plus axle semis. In 2011, there was a decrease in passenger vehicles and an increase in volume in virtually all truck categories.
9 WIM 33 US 212, Renville County, Olivia,.7 miles east of Olivia Between 2009 and 2010, total average daily total volume increased very slightly, and that increase was about 100 passenger cars and roughly the same number of 5 plus axle semis. Total trucks increased slightly with most categories other than 5 plus axle semis remaining constant. In 2011, little change occurred in average daily truck volume, with the exception of a decline in five plus axle semis and passenger cars.
10 WIM 34 TH23, Chippewa County, Clara City, 3.1 miles south of Clara City Between 2009 and 2010, average daily total volume decreased somewhat, and that decrease was fairly constant throughout all the truck categories.
11 WIM 35 US2, Beltrami County, Bemidji, 3.2 miles east of Bagley Average daily total volume remained fairly static between 2008 and 2009, with an increase in A significant increase in two axle single unit trucks occurred between 2008 and 2009, only to drop back to 2008 levels in A decrease in five axle semis took place between 2008 and 2009, with those numbers remaining unchanged between 2009 and Other truck categories remained virtually unchanged. In 2011 average daily total volume remained virtually unchanged while average daily truck volume increased slightly in most categories, with the largest increase in average daily truck volume in the two axle single unite category.
12 WIM 36 TH36, Washington County, Lake Elmo, 3.3 miles east of I-694 Average daily total volume remained fairly steady between 2009 and 2010 (only a slight increase). A small increase in two axle single unit trucks occurred between 2009 and 2010, while five axle plus semis remained virtually unchanged from 2009 to Other truck categories remained relatively constant. In 2011 most categories experienced no decrease or a slight decrease in daily truck volume. Average daily total volume also decreased slightly.

13 WIM 37 I-94 MINN ROAD Wright County, 6.6 Miles North of TH25
,")
14 WIM 38 I 535 St Louis County, SW of MSAS149(Garfield Avenue), Duluth
15 WIM39 - TH43 Winona County, NE of MSAS 101, Winona Between 2010 and 2011, the average daily total volume decreased slightly, due to a decline in passenger vehicles, while all truck categories increased in average daily truck volume
16 WIM 40 TH52 Dakota County,.5 Mi N of CSAH14 (Southview Blvd), West St Paul Between 2010 and 2011, average daily total volume decreased as did average daily truck volume. The truck volume decreased at lower percent than passenger cars, thus reflecting in the slight rise of average daily truck percent from 2010 to Thus trucks were a bigger percentage of the total vehicles in 2011.
17 WIM 41 CSAH 14, Polk County, Crookston, 1.3 miles north of CSAH 45 south of Crookston AADT on CSAH14 is relatively low, with little change in average daily total volume and average daily truck volume between 2009 and 2011.
18 WIM 54 CSAH 1, Dodge County, West Concord,.5 miles south of CSAH24 west of West Concord AADT remained fairly steady between 2009 and 2010 (only a slight increase). No change in two axle single unit trucks occurred between 2009 and 2010, while five axle plus semis remained virtually unchanged from 2009 to 2010 (with a slight increase of 6 vehicles). Other truck categories remained relatively constant, with a very small amount of trucks on the route. In 2011, there was very little change from the previous years in both volume and percent of vehicle totals. \
19 WIM 56 CSAH 5, Cottonwood, Storden, 2.5 miles north ofth30 north of Storden WIM 56 Yearly Heavy Commercial Volume Trends By Truck Type axsu 3+axsu 3axsemi 4axsemi 5Plusaxsemi TrkTrlBus Twins
20 PIEZO 101 I 535, St Louis County, Duluth, North of Garfield Avenue AADT increased about six percent while heavy commercial traffic decreased slightly between 2008 and Most of the minor decrease in truck traffic occurred in the five plus axle semi category, with other truck categories remaining fairly constant. Construction in 2010 on I-35 caused a decrease in traffic PIEZO 101 Yearly Heavy Commercial Volume Trends By Truck Type axsu 3+axsu 3axsemi 4axsemi 5Plusaxsemi TrkTrlBus Twins
21 PIEZO 103 I 35 St Louis County, Duluth East of Central Avenue AADT and heavy commercial traffic dropped slightly between the years The volume of single unit trucks has remained stable over the time period; however, the volume and percent of five plus axle semis slowly and steadily declined from a high average of 1637 in 2004 to 1334 in AADT was approximately in 2007 on this Interstate in Duluth. Lane closures and repairs in 2008 and 2009 (July and August) resulted in lower traffic and thus data was not used for those years. In April 1, 2009 lanes one and two were not working for classification. More recent data was not used due to pavement repairs and lane closures in July and August of 2008 and In 2010 sensors were destroyed by construction PIEZO 103 Yearly Heavy Commercial Volume Trends By Truck Type axsu 3+axsu 3axsemi 4axsemi 5Plusaxsemi TrkTrlBus Twins

22 PIEZO 175 I 94 - Stearns County, Sauk Centre, SE of CR 186 SE of Sauk Centre AADT dropped steadily from 2004 to 2009 while the heavy commercial percent increased slightly. Overall total truck volume remained virtually unchanged. The heavy commercial percent averaged around 20% over the measured time period. Five plus axle semi traffic decreased while two axle single unit truck volumes increased. The truck trailers and bus category increased steadily from 2004 until 2009 both in percent and volume data was not used to due to incomplete months. In 2011, average daily truck volume decreased significantly in the two axle single unit category. From 2004 onward, that category has shown to widely fluctuate from one year to the next. Five plus axle semis decreased slightly in average truck volume while four axle semis increased somewhat. Other categories showed little variability from 2009 to The average daily volume of four axle semis increased between 2009 and 2011.
23 PIEZO 179 US 59 Lyon County, Garvin, SE of CR186 SE of Sauk Centre AADT on this trunk highway averaged about 2100 over the six year period from 2005 through AADT has remained virtually unchanged, while the percentage of heavy commercial trucks rose each year until a drop in Total heavy commercial volume has gradually increased about 1% per year since 2005 but decreased in 2009 remaining unchanged through Individual truck category volumes remained virtually constant throughout the six years of reported data. In 2011, little has changed over time at this piezo. One glance at the chart elow indicates little change in total volume and truck volume since 2005, other than the drop in five plus axle semis between 2008 and 2009.

24 PIEZO 187 US 10, Benton County, Rice, 1.7 mile north of Jct. of CSAH31 and TH10 Between 2009 and 2011, there was a decrease in average daily truck volume and average daily total volume at this site. Overall, the numbers of trucks by categories fluctuated slightly, with the number of five axle plus semis decreasing at a larger rate than other truck categories. The average daily truck percent changed little the previous two years.
25 PIEZO 191- I 35, Chisago County, Wyoming, 1.4 Miles north of CSAH22 (East of Viking Blvd) There was minor fluctuation in AADT between 2008 and During the three year period, heavy commercial trucks varied by about 1%. There was a spike in the two axle single unit category between 2008 and 2009, and then a sudden decrease back below 2008 levels. The five plus axle semi category fluctuated within a narrow range of about 100 trucks per day between 2008 and 2010.

26 PIEZO 197 TH 60, Watonwan County, St James,.7 Mi W of W Jct. TH4 SW of St James AADT increased slightly between 2006 and 2007 with the percent of heavy commercial trucks remaining virtually unchanged. Single unit truck volume increased slightly while five plus axle semis declined from 744 to 724 over the two year period PIEZO 197 Yearly Heavy Commercial Volume Trends axsu 3+axsu 3axsemi 4axsemi 5Plusaxsemi TrkTrlBus Twins
27 PIEZO 198 US 212, Renville County, Granite Falls, E of TH23 West of Sacred Heart AADT decreased slightly between 2004 and 2007 but spiked upward in 2008, with the heavy commercial percentage increasing slightly each year ( ), from 16.2% and 18.3%. While the heavy commercial truck percentages increased slightly, the volume of single unit trucks changed little. The five plus axle semi volumes were unchanged until 2008, which increased by 66, from 298 to 364. Year 2009 data was not reliable due to more than 50% imputed data in one direction and inadequate October data. In 2010, there was a decrease in traffic due to construction on TH212. The gap between 2008 and 2011 reported data has shown an increase in all truck categories (except the Twins category) in average daily truck volume and average total volume. Most increases were modest, with the numbers of five plus axle semis being the highest since 2004.
28 PIEZO 199 US 75, Pipestone County, Pipestone,.5 Mi N of CR69 N of Pipestone AADT averaged about 1375 over the four year period through AADT never varied by more than 25 total vehicles. Heavy commercial percent fluctuated somewhat, averaging about 15.7% during the four year period with a high of 17.6% and a low of 14.3%. Two axle single unit truck volumes varied during this four year period with the 2008 volume of 37 the lowest in four years. A small but steady increase occurred in the five plus axle semi category. Year 2009 data was incomplete due to a lack of about two months data PIEZO 199 Yearly Heavy Commercial Volume Trends By Truck Type axsu 3+axsu 3axsemi 4axsemi 5Plusaxsemi TrkTrlBus Twins


29 PIEZO 204 US 169, Mille Lacs County, Onamia,.3 Mi. N. of CSAH22 S. of Onamia The AADT between 2004 and 2009 fluctuated slightly, with about 1200 fewer vehicles in brought an increase back to 2007 levels. Heavy commercial total truck volumes remained unchanged between 2009 and Over the six year time period, there was a fairly minor decrease in five plus axle semis volumes between 2004 and Two axle single units have remained constant, with the exception being an increase in In 2011 average daily truck volume decreased slightly for most categories, or remained virtually the same. Average daily total volume changed little from The overall trend for five plus axle semis has been downward modestly since 2004.
30 PIEZO 212 TH 14, Olmsted County, Rochester, E of CR104 (60 th Ave NW), W of Rochester

31 PIEZO 213 TH 61, Lake County, Two Harbors,.5 Mi SW of CR103 SW of Two Harbors Over a five year period from 2004 through 2008, AADT dropped 11% from 7900 to 7100, while the heavy commercial percent dropped about 1.3% over the same time frame (7.4% - 6.1%). The volume of two axle single units dropped in four of the five measured years, while the five plus axle semi volume decreased every year. In 2010 there was a decrease of traffic in July and August due to construction and the data was not used PIEZO 213 Yearly Heavy Commercial Volume Trends By Truck Type axsu 3+axsu 3axsemi 4axsemi 5Plusaxsemi TrkTrlBus Twins `
32 PIEZO 219 US 2, Itasca County, Warba, 1.1 Mi NW of TH65 SE of Warba Between 2004 and 2007, the AADT dropped by approximately 1000 vehicles (or 27%) from about 3900 to AADT then increased from 2008 to Heavy commercial percent has remained steady over the period from 2004 through 2010 averaging around 13.5%. The trend in 2 axle single unit trucks, as well as 5+ axle semi trucks shows a steady decrease from 2004 to 2007, with a slight increase in both vehicle types in 2008 to Year 2009 data was not reliable or incomplete as several months of data failed to record. In 2011, the average daily truck volume has remained steady from the previous year, with slight decreases in most categories. The five axle plus semi category has fluctuated the most reaching a high in 2004 of 375 and a low of 247 in 2007.
33 PIEZO 220 US 71, Hubbard County, Park Rapids, S of CR89 N. of Park Rapids Five years of data shows a steady increase in heavy commercial percent from 2005 to 2009 (12%- 14%) then a sharp decrease back to 2005 levels in AADT increased between 2007 and 2008 and then leveled off in 2009 and 2010 still lower than the AADT in Two axle single unit truck volumes and five plus axle semis have fluctuated since Total trucks are less than they were in From to 2010 to 2011, there was little change in average daily truck volume and average daily total volume. Five plus axle semi volumes have fluctuated somewhat until 2009, with a steady rise in volume through A spike in 2 axle single unit volume in 2009 has shown to be somewhat of an anomaly.
34 PIEZO 221- TH 34, Hubbard County, Nevis, 1.5 Mi NE of CSAH2 NE of Nevis AADT has increased between 2007 and 2010 after having dropped between 2005 and Between 2005 and 2008, heavy commercial percentage dropped, but increased in 2010, as did volumes. Two axle single unit truck volume fluctuated between 2005 and 2008 but increased to their highest levels in The number of five plus axle semis slowly decreased from 2005 to 2008 then also increased in Year 2009 data was not reliable or incomplete as it contained several bad months of data.

35 PIEZO 223- TH 371, Cass County, Walker, 1.2 miles south of TH200 south of Walker Piezo 223 Yearly Heavy Commercial Volume Trends By Truck Type axsu 3+axsu 3axsemi 4axsemi 5Plusaxsemi TrkTrlBus Twins

36 PIEZO TH 210, Ottertail County, in Battle Lake, 2.1 miles west of CSAH47 W of Battle Lake AADT and heavy commercial percent increased slightly each year from 2008 through 2010, with all truck categories varying slightly.
37 PIEZO 227 I 90, Freeborn County, Albert Lea, 1.5 miles west of TH13 NW of Albert Lea Two successive years, 2004 and 2005, resulted in a slight decrease in AADT and a slight increase in heavy commercial percentage. A glance at the graphics shows a consistent average volume of five plus axle semis with only a variance of 50 vehicles from one year to the next. Other heavy truck types remained basically unchanged. Year 2009 data was incomplete, with only 174 days of class data recorded. In addition, 2010 data was invalid until August of In year 2011, complete data in the intervening six years shows a slight increase in several truck categories, with the average daily truck volume increasing while the average total volume decreasing. A steady increase in five plus axle semis occurred between 2004 and 2011, while two axle single unit trucks declined. The average daily truck percentage has increased slowly during this time frame.
38 PIEZO 341 I 694, Washington County, Oakdale, south of CSAH35(50 th St) in Oakdale 2011 data at this site was not accurate or complete enough for inclusion into the database Piezo 341 Yearly Heavy Commercial Volume Trends By Truck Type axsu 3+axsu 3axsemi 4axsemi 5Plusaxsemi TrkTrlBus Twins
. Other categories changed little during the three year period.")

39 PIEZO US 10, Anoka County, Ramsey, Daytonport scale in Ramsey Between 2008 and 2010, AADT dropped each year, along with a decrease in 2 and 3+ axle single unit trucks. During the three year period, 5+axle semis fluctuated (decreasing from 2008 to 2009, and then increasing slightly in 2010). Other categories changed little during the three year period. A glance at the below graph reveals a few trends, namely the slow but steady decline in average truck volume in the two axle and three plus axle single unit trucks as well as tractor trailers/buses. The semi truck categories bounce around with the five plus axle semi category at its lowest point in average daily volume since shows a consistent decrease in 2 and 3+ axle single unit trucks. There was a decrease in 5+ axle semi trucks, as well as a reductions in AADT, average daily truck percent, average daily total volume and average daily truck volume
40 PIEZO 353 US 169, Scott County, Jordan, SW of CR59 SW of Jordan Five years of data between 2004 and 2009 indicated that AADT fluctuated somewhat and the heavy commercial percent remained relatively stable varying by only about one percent ( %). Five plus axle semis fluctuated during the five year period peaking at 1600 in 2005, and dropping steadily by almost 400 through Between 2007 and 2008, two axle single unit trucks increased by about 75 (after having fluctuated in prior years). They remained virtually unchanged between 2008 and In 2010, there was a decline in volume in all truck categories except three plus axle single units. Conversely, 2011 showed a reverse in this trend, with an upward tic in virtually all truck categories. Five plus axle semis peaked in 2005 and have been declining steadily until 2010, with an increase in average daily truck volume in 2011.
41 PIEZO US 212, Carver County, Cologne, 1.7 mile west of CSAH51 west of Cologne Between 2008 and 2010 there was a 15% increase in AADT and significant increases in every individual truck category - including 2 axle single units (13%) and 5+axle semis (18.5%). Only twin trailers remained constant between 2009 and In 2011, most truck categories declined in average daily truck volume. Also, average daily total volume declined marginally.
.")
42 PIEZO 388 US 8, Chisago County, Forest Lake 1 Mi N of TH61 N of Forest Lake Five years of data revealed a slowly declining AADT(with the exception of 2009). The heavy commercial truck percentage changed little over the period from (averaging around 4-5 percent). There was a spike in four axle semis in 2006 followed by a gradual reduction through The total number of 2 axle single units and 5+ axle semis has moved within a narrow range over the five year timeframe with a gradual reduction in 5+ axle semis since In 2011, there was a decline in overall average daily truck volume and average daily total volume. A steep decline in five plus axle semis occurred between 2010 and 2011, as well as decline in three plus axle single unit trucks. Both three and four axle semis increased volume significantly between 2010 and 2011.

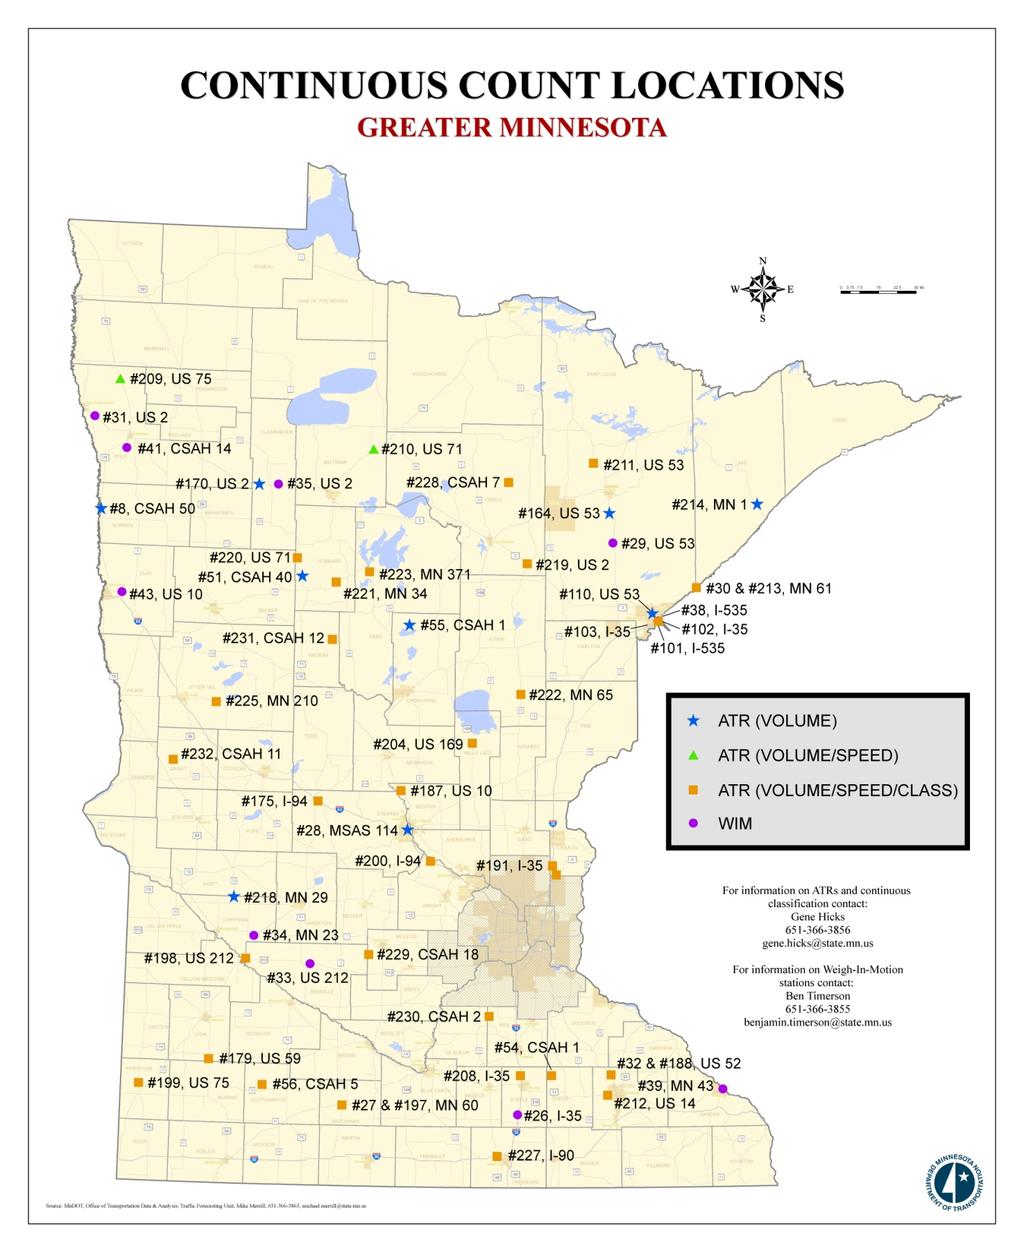
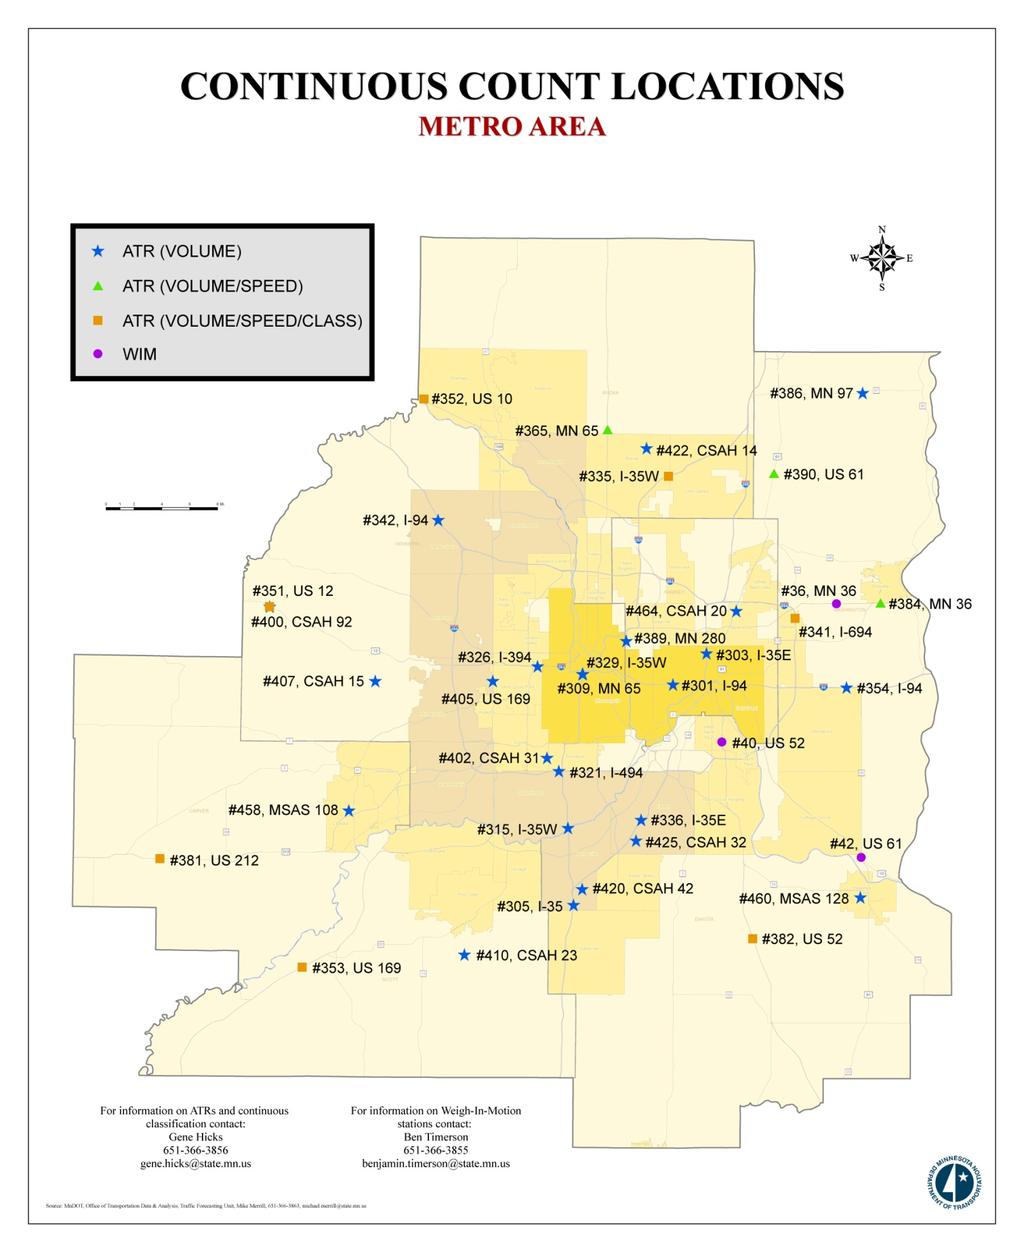
43 Location of Piezos and WIMs used in this report
44 SUMMARY Piezo data has been and continues to be analyzed on a monthly basis in addition to the annual summaries described above. We have analyzed piezo data on a monthly basis to determine seasonal adjustment factors for each vehicle type by analyzing Monday through Friday data. Vehicle classification counts are typically taken on weekdays in the months from April through October. The factors derived from an analysis of piezo data are used to adjust vehicle classification counts to HCAADT which are then used in MnDOT s traffic forecasting process. In addition, factors determined in rural and urban areas of the state are used to develop different factors to adjust heavy commercial data collected from short duration classification counts. Several piezo sites have been added in recent years and our plan is to convert all of our ATR s to piezo sites in the coming years. This will increase our understanding of truck patterns throughout the state and enable us to effectively maintain, manage and monitor truck travel on the trunk highway system throughout Minnesota. The vehicle-miles of travel has been increasing for decades in Minnesota, but since the year 2004 traffic has remained at about the same level. In recent years, the highest growth in VMT in Minnesota has been in the counties surrounding the Twin Cites while the growth has slowed or declined on many of the rural counties. The VMT in Minnesota has been slightly declining from 2007 to Due to factors such as the economic environment, we anticipate, at least in the near-term that VMT will continue to decrease, but at a more moderate rate than Minnesota has seen over the past decades. An analysis of the selected piezo data in this report has indicated a stability in heavy truck numbers at most sites between 2004 and Between 2007 and 2008, there was no consistent pattern regarding increases or decreases in AADT, five plus axle semi volumes or heavy commercial percentages. Overall, between 2007 and 2008 most of the selected piezos increased in heavy commercial percent, while about half increased and half decreased in AADT and five plus axle semi volumes. In 2009, there were nine piezos and one WIM that were compared to 2008 data. The results, shown in the table below, indicate no discernible pattern or connection between AADT growth and heavy commercial percent growth. Trend analysis is only useful at individual piezo sites. Appendix 1 shows that between 2010 and 2011, there was a decrease in average daily total volume and average daily truck volume at selected piezo and wim sites. Seven sites showed an increase in truck volume, while just two sites increased in total volume. Please note that while percentages may increase or decrease at a higher rate, the wide disparity between total volume at sites may show larger swings for smaller AADT locations thus giving the appearance of larger actual volume changes. A glance at the volume numbers shown on the following two appendix tables will reveal this. Appendix 2 shows a sum total of average annual percent change of all selected sites from the beginning of the series of reports on Piezo and Wim sites. The change is annualized depending on the number of years of complete data. Thus, for example, two years of data versus seven years of data provides a similar annual percent change. Usually, larger volume sites have smaller percentage

45 swings. Since, 2005, of the 30 plus sites analyzed for this study, the majority of sites have decreased over time in total volume percent change, total truck volume percent change, and total five plus axle semi percent change. It is pretty impossible to make sweeping assumptions regarding vehicle change on Minnesota s roadways. However, the user of this report can get a pretty good feel what the volume of auto and truck activity has been over time at the selected Piezos and Wims shown in this report Summary Data Appendix 1

46 Summary Data Appendix 2 If you have any questions on the information presented here, please contact Mark Levenson at or Thomas Nelson at
Project Title: Using Truck GPS Data for Freight Performance Analysis in the Twin Cities Metro Area Prepared by: Chen-Fu Liao (PI) Task Due: 9/30/2013
 Task Due: 9/30/2013") MnDOT Contract No. 998 Work Order No.47 213 Project Title: Using Truck GPS Data for Freight Performance Analysis in the Twin Cities Metro Area Prepared by: Chen-Fu Liao (PI) Task Due: 9/3/213 TASK #4:
MnDOT Contract No. 998 Work Order No.47 213 Project Title: Using Truck GPS Data for Freight Performance Analysis in the Twin Cities Metro Area Prepared by: Chen-Fu Liao (PI) Task Due: 9/3/213 TASK #4:
WIM #41 CSAH 14, MP 14.9 CROOKSTON, MINNESOTA APRIL 2014 MONTHLY REPORT
 WIM #41 CSAH 14, MP 14.9 CROOKSTON, MINNESOTA APRIL 2014 MONTHLY REPORT In order to understand the vehicle classes and groupings, the MnDOT Vehicle Classification Scheme and the Vehicle Classification
Project Title: Using Truck GPS Data for Freight Performance Analysis in the Twin Cities Metro Area Prepared by: Chen-Fu Liao (PI) Task Due: 7/31/2013
 Task Due: 7/31/2013") Project Title: Using Truck GPS Data for Freight Performance Analysis in the Twin Cities Metro Area Prepared by: Chen-Fu Liao (PI) Task Due: 7/31/2013 TASK #3 PROCESS TRUCK GPS DATA AND DERIVE PERFORMANCE
Project Title: Using Truck GPS Data for Freight Performance Analysis in the Twin Cities Metro Area Prepared by: Chen-Fu Liao (PI) Task Due: 7/31/2013 TASK #3 PROCESS TRUCK GPS DATA AND DERIVE PERFORMANCE
WIM #41 CSAH 14, MP 14.9 CROOKSTON, MINNESOTA MAY 2013 MONTHLY REPORT
 WIM #41 CSAH 14, MP 14.9 CROOKSTON, MINNESOTA MAY 2013 MONTHLY REPORT In order to understand the vehicle classes and groupings the Mn/DOT Vehicle Classification Scheme and the Vehicle Classification Groupings
Freight Performance Measures Using Truck GPS Data and the Application of National Performance Measure Research Data Set (NPMRDS)
") Freight Performance Measures Using Truck GPS Data and the Application of National Performance Measure Research Data Set (NPMRDS) Chen-Fu Liao Department of Civil, Environmental, and Geo- Engineering University
Freight Performance Measures Using Truck GPS Data and the Application of National Performance Measure Research Data Set (NPMRDS) Chen-Fu Liao Department of Civil, Environmental, and Geo- Engineering University
Subarea Study. Manning Avenue (CSAH 15) Corridor Management and Safety Improvement Project. Final Version 1. Washington County.
 Corridor Management and Safety Improvement Project. Final Version 1. Washington County.") Subarea Study Manning Avenue (CSAH 15) Corridor Management and Safety Improvement Project Final Version 1 Washington County June 12, 214 SRF No. 138141 Table of Contents Introduction... 1 Forecast Methodology
Subarea Study Manning Avenue (CSAH 15) Corridor Management and Safety Improvement Project Final Version 1 Washington County June 12, 214 SRF No. 138141 Table of Contents Introduction... 1 Forecast Methodology
Atlas 14 Regionalization
 Atlas 14 Regionalization Methodology Statewide precipitation depth raster data was obtained from NOAA s Atlas 14 Precipitation Frequency Data Server for the 10 year-10 minute, 50 year-30 minute, and 50
Metropolitan Freeway System 2013 Congestion Report
 Metropolitan Freeway System 2013 Congestion Report Metro District Office of Operations and Maintenance Regional Transportation Management Center May 2014 Table of Contents PURPOSE AND NEED... 1 INTRODUCTION...
2016 Congestion Report
 2016 Congestion Report Metropolitan Freeway System May 2017 2016 Congestion Report 1 Table of Contents Purpose and Need...3 Introduction...3 Methodology...4 2016 Results...5 Explanation of Percentage Miles
August ATR Monthly Report
 August ATR Monthly Report Minnesota Department of Transportation Office of Transportation Data and Analysis August 2011 Introduction The purpose of this report is to examine monthly traffic trends on
Traffic Data For Mechanistic Pavement Design
 NCHRP 1-391 Traffic Data For Mechanistic Pavement Design NCHRP 1-391 Required traffic loads are defined by the NCHRP 1-37A project software NCHRP 1-39 supplies a more robust mechanism to enter that data
May ATR Monthly Report
 May ATR Monthly Report Minnesota Department of Transportation Office of Transportation Data and Analysis May 2011 Introduction The purpose of this report is to examine monthly traffic trends on Minnesota
WIM #48 is located on CSAH 5 near Storden in Cottonwood county.
 WIM Site Location WIM #48 is located on CSAH 5 near Storden in Cottonwood county. System Operation WIM #48 was operational for the entire month of August 2017. Volume was computed using all monthly data.
Metropolitan Freeway System 2007 Congestion Report
 Metropolitan Freeway System 2007 Congestion Report Minnesota Department of Transportation Office of Traffic, Safety and Operations Freeway Operations Section Regional Transportation Management Center March
2013 Semi-Annual Foreclosures in Minnesota:
 Semi-Annual Foreclosures in Minnesota: A Report Based on County Sheriff s Sale Data August 9, Published by: Prepared by: 25 Market Street Suite 509 Telephone: (612) 522-2500 Facsimile: (612) 521-15 www.housinglink.org
WIM #39 MN 43, MP 45.2 WINONA, MN APRIL 2010 MONTHLY REPORT
 WIM #39 MN 43, MP 45.2 WINONA, MN APRIL 2010 MONTHLY REPORT In order to understand the vehicle classes and groupings the Mn/DOT Vehicle Classification Scheme and the Vehicle Class Groupings for Forecasting
Foreclosures in Minnesota: A Report Based on County Sheriff s Sale Data
 Foreclosures in Minnesota: A Report Based on County Sheriff s Sale Data August 2, 2009 Supplement Published by: Prepared by: 600 18 th Avenue North Minneapolis, MN 55411 Telephone: 612-522-2500 Facsimile:
Open House. Highway212. Meetings. Corridor Access Management, Safety & Phasing Plan. 5:30 to 6:30 p.m. - Southwest Corridor Transportation Coalition
 Welcome Meetings 5:30 to 6:30 p.m. - Southwest Corridor Transportation Coalition 6:30 to 8:00 p.m. - Open House Why is Highway 212 Project Important? Important Arterial Route Local Support Highway 212
Appendix J Traffic Impact Study
 MRI May 2012 Appendix J Traffic Impact Study Level 2 Traffic Assessment Limited Impact Review Appendix J [This page was left blank intentionally.] www.sgm-inc.com Figure 1. Site Driveway and Trail Crossing
Technical Memorandum. Purpose of Report and Study Objectives. Summary of Results
 Technical Memorandum To: Derek Leuer, MnDOT Traffic Safety Engineer From: Max Moreland, P.E. and Bryant Ficek, P.E., P.T.O.E. Date: February 17, 217 Re: Median Acceleration Lane Usage Purpose of Report
WIM #40 US 52, MP S. ST. PAUL, MN APRIL 2010 MONTHLY REPORT
 WIM #40 US 52, MP 126.8 S. ST. PAUL, MN APRIL 2010 MONTHLY REPORT In order to understand the vehicle classes and groupings the Mn/DOT Vehicle Classification Scheme and the Vehicle Class Groupings for Forecasting
Expansion Projects Description
 Expansion Projects Description The Turnpike expansion program was authorized by the Florida Legislature in 1990 to meet the State s backlog of needed highway facilities. The Legislature set environmental
WIM #37 was operational for the entire month of September Volume was computed using all monthly data.
 SEPTEMBER 2016 WIM Site Location WIM #37 is located on I-94 near Otsego in Wright county. The WIM is located only on the westbound (WB) side of I-94, meaning that all data mentioned in this report pertains
WIM #29 was operational for the entire month of October Volume was computed using all monthly data.
 OCTOBER 2015 WIM Site Location WIM #29 is located on US 53 near Cotton in St Louis county. System Operation WIM #29 was operational for the entire month of October 2015. Volume was computed using all monthly
Introduction and Background Study Purpose
 Introduction and Background The Brent Spence Bridge on I-71/75 across the Ohio River is arguably the single most important piece of transportation infrastructure the Ohio-Kentucky-Indiana (OKI) region.
2010 Motorcycle Risk Study Update
 2010 Motorcycle Risk Study Update Introduction This report provides an update to the Motorcycle Risk Study from AI.16 of the 2005 Rate Application. The original study was in response to Public Utilities
WIM #40 is located on US 52 near South St. Paul in Dakota county.
 WIM Site Location WIM #40 is located on US 52 near South St. Paul in Dakota county. System Operation WIM #40 was operational for the entire month of November 2017. Volume was computed using all monthly
CHARACTERIZATION AND DEVELOPMENT OF TRUCK LOAD SPECTRA FOR CURRENT AND FUTURE PAVEMENT DESIGN PRACTICES IN LOUISIANA
 CHARACTERIZATION AND DEVELOPMENT OF TRUCK LOAD SPECTRA FOR CURRENT AND FUTURE PAVEMENT DESIGN PRACTICES IN LOUISIANA LSU Research Team Sherif Ishak Hak-Chul Shin Bharath K Sridhar OUTLINE BACKGROUND AND
PORTABLE WEIGH-IN-MOTION FIELD EVALUATION. Minnesota Local Road Research Board
 PORTABLE WEIGH-IN-MOTION FIELD EVALUATION Minnesota Local Road Research Board 11/24/ Acknowledgments 2 LRRB: Joe Triplett, Chisago County MnDOT Technical Liaison: Ben Timerson MnDOT ORS Project Coordinator:
2 EXISTING ROUTE STRUCTURE AND SERVICE LEVELS
 2 EXISTING ROUTE STRUCTURE AND SERVICE LEVELS In the Study Area, as in most of the Metro Transit network, there are two distinct route structures. The base service structure operates all day and the peak
Oregon DOT Slow-Speed Weigh-in-Motion (SWIM) Project: Analysis of Initial Weight Data
 Project: Analysis of Initial Weight Data") Portland State University PDXScholar Center for Urban Studies Publications and Reports Center for Urban Studies 7-1997 Oregon DOT Slow-Speed Weigh-in-Motion (SWIM) Project: Analysis of Initial Weight Data
Portland State University PDXScholar Center for Urban Studies Publications and Reports Center for Urban Studies 7-1997 Oregon DOT Slow-Speed Weigh-in-Motion (SWIM) Project: Analysis of Initial Weight Data
WIM #31 US 2, MP 8.0 EAST GRAND FORKS, MN JANUARY 2015 MONTHLY REPORT
 WIM #31 US 2, MP 8.0 EAST GRAND FORKS, MN JANUARY 2015 MONTHLY REPORT WIM #31 EAST GRAND FORKS MONTHLY REPORT - JANUARY 2015 WIM Site Location WIM #31 is located on US 2 at mile post 8.0, southeast of
The major roadways in the study area are State Route 166 and State Route 33, which are shown on Figure 1-1 and described below:
 3.5 TRAFFIC AND CIRCULATION 3.5.1 Existing Conditions 3.5.1.1 Street Network DRAFT ENVIRONMENTAL IMPACT REPORT The major roadways in the study area are State Route 166 and State Route 33, which are shown
In this report, last week multiple commodities came down in price while parts of Wall Street hit new all-time highs.
 This is the Scrap Metal & Commodities Recycling report, by BENLEE Roll off, Lugger and Open Top Trailers and Raleigh and Goldsboro Metal Recycling Monday August 8th, 2016. In this report, last week multiple
HISTORIC TRAFFIC COUNT DATA ( )
") HISTORIC TRAFFIC COUNT DATA (1980 2015) Highlights The traffic trends for 25 locations in the 22202 zip code area have decreased by 20 percent (on average) since 2000, when traffic peaked. Currently, average
HISTORIC TRAFFIC COUNT DATA (1980 2015) Highlights The traffic trends for 25 locations in the 22202 zip code area have decreased by 20 percent (on average) since 2000, when traffic peaked. Currently, average
Funding Scenario Descriptions & Performance
 Funding Scenario Descriptions & Performance These scenarios were developed based on direction set by the Task Force at previous meetings. They represent approaches for funding to further Task Force discussion
Appendix SAN San Diego, California 2003 Annual Report on Freeway Mobility and Reliability
 (http://mobility.tamu.edu/mmp) Office of Operations, Federal Highway Administration Appendix SAN San Diego, California 2003 Annual Report on Freeway Mobility and Reliability This report is a supplement
February 2012 Caltrain Annual Passenger Counts Key Findings
 February 2012 Caltrain Annual Passenger Counts Key Findings Key Findings February 2012 Caltrain Annual Passenger Counts The 2012 annual Caltrain passenger counts, which were conducted in February 2012,
Passive Investors and Managed Money in Commodity Futures. Part 2: Liquidity. Prepared for: The CME Group. Prepared by:
 Passive Investors and Managed Money in Commodity Futures Part 2: Liquidity Prepared for: The CME Group Prepared by: October, 2008 Table of Contents Section Slide Number Objectives and Approach 3 Findings
Total Three Months 8. Breastfed Two Weeks 5. Total Twelve Months 12. Breastfed Twelve Months 13. Total Two Weeks 4. Initiated Breastfeeding 3
 Preliminary Breastfeeding Initiation and Duration at Weeks and,, Six and Months for CHB City of Residence 1 2 Months 7 Minnesota Department of Health WIC Program 1 July 2018 Months 9 Six Six Aitkin-Itasca-
2002 Virginia Department of Transportation Daily Traffic Volume Estimates Including Vehicle Classification Estimates. Special Locality Report 129
 Daily Traffic Volume Estimates Including Vehicle Classification Estimates where available Special Locality Report 129 Prepared By In Cooperation With U.S. Department of Transportation Federal Highway Administration
ST. CROIX RIVER CROSSING PROJECT 2004 SUPPLEMENTAL ENVIRONMENTAL IMPACT STATEMENT TECHNICAL MEMORANDUM SUPPLEMENT FOR THE PREFERRED ALTERNATIVE:
 ST. CROIX RIVER CROSSING PROJECT 2004 SUPPLEMENTAL ENVIRONMENTAL IMPACT STATEMENT TECHNICAL MEMORANDUM SUPPLEMENT FOR THE PREFERRED ALTERNATIVE: TRAVEL DEMAND FORECASTS May 12, 2005 Prepared for Minnesota
2017 Total 2017 Calendar Year Unduplicated Minnesota WIC Participation Count by City of Residence Minnesota WIC Information System
 2017 CHB/ City Women Pregnant F Mostly Some N Infants Infants F MINNESOTA 181,119 50,326 (27.8) 27,155 (54) 5,478 (10.9) 2,460 (4.9) 5,245 (10.4%) 9,988 (19.8) 52,745 (29.1) 8,801 (16.7) 4,163 (7.9) 10,053
APPENDIX C CATEGORIZATION OF TRAFFIC LOADS
 APPENDIX C CATEGORIZATION OF TRAFFIC LOADS TABLE OF CONTENTS Page INTRODUCTION...C-1 CATEGORIZATION OF TRAFFIC LOADS...C-1 Classification of Vehicles...C-2 Axle Load Distribution Factor...C-2 Estimation
FOR IMMEDIATE RELEASE
 Article No. 7433 Available on www.roymorgan.com Roy Morgan Unemployment Profile Friday, 12 January 2018 2.6m Australians unemployed or under-employed in December The latest data for the Roy Morgan employment
CITY OF VANCOUVER ADMINISTRATIVE REPORT
 Supports Item No. 1 T&T Committee Agenda May 13, 2008 CITY OF VANCOUVER ADMINISTRATIVE REPORT Report Date: April 29, 2008 Author: Don Klimchuk Phone No.: 604.873.7345 RTS No.: 07283 VanRIMS No.: 13-1400-10
MAY 2014 ROCHESTER PUBLIC SCHOOLS ENROLLMENT ANALYSIS ROCHESTER PUBLIC SCHOOLS TEAMWORKS INTERNATIONAL
 ROCHESTER PUBLIC SCHOOLS ENROLLMENT ANALYSIS MAY 2014 ROCHESTER PUBLIC SCHOOLS TEAMWORKS INTERNATIONAL ROCHESTER PUBLIC SCHOOLS ROCHESTER, MN ENROLLMENT ANALYSIS 1 INTRODUCTION, METHODOLOGY & SUMMARY 7
Post Opening Project Evaluation. M6 Toll
 M6 Toll Five Post Years Opening After Study: Project Summary Evaluation Report Post Opening Project Evaluation M6 Toll Five Years After Study Summary Report October 2009 Document History JOB NUMBER: 5081587/905
Alpine Highway to North County Boulevard Connector Study
 Alpine Highway to North County Boulevard Connector Study prepared by Avenue Consultants March 16, 2017 North County Boulevard Connector Study March 16, 2017 Table of Contents 1 Summary of Findings... 1
TRAFFIC VOLUME TRENDS July 2002
 TRAFFIC VOLUME TRENDS July 2002 Travel on all roads and streets changed by +2.3 percent for July 2002 as compared to July 2001. Estimated Vehicle-Miles of Travel by Region - July 2002 - (in Billions) West
LARGE TRUCK MONITORING PROGRAM
 LARGE TRUCK MONITORING PROGRAM WIM Station Annual Report for 2008 Prepared for: NEW JERSEY DEPARTMENT OF TRANSPORTATION Bureau of Freight Services Prepared by: LARGE TRUCK MONITORING PROGRAM WIM Station
Transportation accomplishments
 1 1 Welcome Transportation accomplishments Federal Funding State Funding Challenges Future Projects 2 Transportation Project: The NDDOT had a record construction season in 2011. Completed $595.6 million
Who has trouble reporting prior day events?
 Vol. 10, Issue 1, 2017 Who has trouble reporting prior day events? Tim Triplett 1, Rob Santos 2, Brian Tefft 3 Survey Practice 10.29115/SP-2017-0003 Jan 01, 2017 Tags: missing data, recall data, measurement
Southern Windsor County 2016 Traffic Count Program Summary April 2017
 Southern Windsor County 2016 Traffic Count Program Summary April 2017 The Southern Windsor County Regional Planning Commission (the RPC ) has been monitoring traffic at 19 locations throughout the southern
Year Over Year Unemployment Rates Decline Or Hold Steady In All 12 Wisconsin Metro Areas For 58 th Consecutive Month
 Department of Workforce Development Secretary s Office 201 E. Washington Avenue P.O. Box 7946 Madison, WI 53707 Telephone: (608) 266-3131 Fax: (608) 266-1784 Email: sec@dwd.wisconsin.gov Scott Walker,
MPO Staff Report Technical Advisory Committee: July 12, 2017
 MPO Staff Report Technical Advisory Committee: July 12, 2017 RECOMMENDED ACTION: 2 nd TAC Meeting with Kimley-Horn/WSB in Updating the Street/Highway Element of 2045 Metropolitan Transportation Plan. Matter
Transitways. Chapter 4
 4 Transitways Figure 4-1: Hiawatha LRT Train at the Lake Street/Midtown Station The 23 Transportation Policy Plan identifies a network of transitway corridors to be implemented by 23. Transitways recommended
Truck Axle Weight Distributions
 Truck Axle Weight Distributions Implementation Report IR-16-02 Prepared for Texas Department of Transportation Maintenance Division Prepared by Texas A&M Transportation Institute Cesar Quiroga Jing Li
Table of Contents. Attachment 1 Caltrain Service History Attachment 2 Tables and Graphs Caltrain Annual Passenger Counts 1 of 12 Final
 February 2013 Caltrain Annual Passenger Counts Key Finding gs Table of Contents Methodology and Background... 2 Recent Service Changes... 2 Weekday Ridership... 2 Stations... 4 Baby Bullet Stations...
Rates of Motor Vehicle Crashes, Injuries, and Deaths in Relation to Driver Age, United States,
 RESEARCH BRIEF This Research Brief provides updated statistics on rates of crashes, injuries and death per mile driven in relation to driver age based on the most recent data available, from 2014-2015.
Executive Summary. Light-Duty Automotive Technology and Fuel Economy Trends: 1975 through EPA420-S and Air Quality July 2006
 Office of Transportation EPA420-S-06-003 and Air Quality July 2006 Light-Duty Automotive Technology and Fuel Economy Trends: 1975 through 2006 Executive Summary EPA420-S-06-003 July 2006 Light-Duty Automotive
LONG RANGE PERFORMANCE REPORT. Study Objectives: 1. To determine annually an index of statewide turkey populations and production success in Georgia.
 State: Georgia Grant Number: 08-953 Study Number: 6 LONG RANGE PERFORMANCE REPORT Grant Title: State Funded Wildlife Survey Period Covered: July 1, 2010 - June 30, 2011 Study Title: Wild Turkey Production
KANSAS Occupant Protection Observational Survey Supplementary Analyses Summer Study
 KANSAS Occupant Protection Observational Survey Supplementary Analyses 2018 Summer Study Submitted To: Kansas Department of Transportation Bureau of Transportation Safety and Technology Prepared by: DCCCA
Fine particle pollution
 www.pca.state.mn.us Fine particle pollution Fine particle pollution is a complex mixture of extremely small particles and liquid droplets that are created during combustion and can also be formed as other
TRAFFIC IMPACT STUDY. USD #497 Warehouse and Bus Site
 TRAFFIC IMPACT STUDY for USD #497 Warehouse and Bus Site Prepared by: Jason Hoskinson, PE, PTOE BG Project No. 16-12L July 8, 216 145 Wakarusa Drive Lawrence, Kansas 6649 T: 785.749.4474 F: 785.749.734
Downtown Lee s Summit Parking Study
 Downtown Lee s Summit Parking Study As part of the Downtown Lee s Summit Master Plan, a downtown parking and traffic study was completed by TranSystems Corporation in November 2003. The parking analysis
ALG July/August 2011 Edition Report
 ALG July/August 2011 Edition Report ALG July/August 2011 Edition Report Introduction: For the July/August 2011 edition, ALG has updated both gas price and used supply outlook to reflect the latest available
RTCSNV CRASH ANALYSIS REPORT
 2011-2015 RTCSNV CRASH ANALYSIS REPORT TABLE OF CONTENTS Summary... 3 Crash Types... 4 Time and Day of Crashes... 7 Crash Factors... 9 Fatalities... 10 Driver s Behavior... 11 Crash Locations... 15 Non-Motorized
Missouri Seat Belt Usage Survey for 2017
 Missouri Seat Belt Usage Survey for 2017 Conducted for the Highway Safety & Traffic Division of the Missouri Department of Transportation by The Missouri Safety Center University of Central Missouri Final
Simulating Trucks in CORSIM
 Simulating Trucks in CORSIM Minnesota Department of Transportation September 13, 2004 Simulating Trucks in CORSIM. Table of Contents 1.0 Overview... 3 2.0 Acquiring Truck Count Information... 5 3.0 Data
TRAFFIC VOLUME TRENDS
 Page 1 U. S. Department Transportation Federal Highway Administration Office Highway Policy Information TRAFFIC VOLUME TRENDS September Travel on all roads and streets changed by +2.5 (5.8 billion vehicle
Trunk Highway 13 Corridor Study Update Existing and No-Build Conditions Technical Memo #2B: Traffic Forecasts and Operations Analysis SEH No.
 TECHNICAL MEMORANDUM TO: FROM: Molly McCartney MnDOT Project Manager Haifeng Xiao, PE Tom Sohrweide, PE, PTOE DATE: November 27, 2012 RE: Trunk Highway 13 Corridor Study Update Existing and No-Build Conditions
Sound Transit Operations July 2016 Service Performance Report. Ridership
 Ridership Total Boardings by Mode Mode Jul-15 Jul-16 % YTD-15 YTD-16 % ST Express 1,618,779 1,545,852-4.5% 10,803,486 10,774,063-0.3% Sounder 333,000 323,233-2.9% 2,176,914 2,423,058 11.3% Tacoma Link
Traffic and Toll Revenue Estimates
 The results of WSA s assessment of traffic and toll revenue characteristics of the proposed LBJ (MLs) are presented in this chapter. As discussed in Chapter 1, Alternatives 2 and 6 were selected as the
PROCEDURES FOR ESTIMATING THE TOTAL LOAD EXPERIENCE OF A HIGHWAY AS CONTRIBUTED BY CARGO VEHICLES
 PROCEDURES FOR ESTIMATING THE TOTAL LOAD EXPERIENCE OF A HIGHWAY AS CONTRIBUTED BY CARGO VEHICLES SUMMARY REPORT of Research Report 131-2F Research Study Number 2-10-68-131 A Cooperative Research Program
UPPER GREEN RIVER OZONE INVESTIGATION (O3i) LUMAN AND PARADISE ROAD TRAFFIC COUNT STUDY 03/05/2009 AND 06/09/2009. Study Summary.
 LUMAN AND PARADISE ROAD TRAFFIC COUNT STUDY 03/05/2009 AND 06/09/2009. Study Summary.") UPPER GREEN RIVER OZONE INVESTIGATION (O3i) LUMAN AND PARADISE ROAD TRAFFIC COUNT STUDY 03/05/2009 AND 06/09/2009 Study Summary Prepared for WYOMING DEPARTMENT OF ENVIRONMENTAL QUALITY 122 West 25 th Street
UPPER GREEN RIVER OZONE INVESTIGATION (O3i) LUMAN AND PARADISE ROAD TRAFFIC COUNT STUDY 03/05/2009 AND 06/09/2009 Study Summary Prepared for WYOMING DEPARTMENT OF ENVIRONMENTAL QUALITY 122 West 25 th Street
County State Aid Highway 32 (Cliff Road) and Dodd Road Intersection Study
 and Dodd Road Intersection Study") County State Aid Highway 32 (Cliff Road) and Dodd Road Intersection Study City of Eagan, Dakota County, Minnesota Date: March 2012 Project No. 14957.000 444 Cedar Street, Suite 1500 Saint Paul, MN 55101
County State Aid Highway 32 (Cliff Road) and Dodd Road Intersection Study City of Eagan, Dakota County, Minnesota Date: March 2012 Project No. 14957.000 444 Cedar Street, Suite 1500 Saint Paul, MN 55101
Act 229 Evaluation Report
 R22-1 W21-19 W21-20 Act 229 Evaluation Report Prepared for Prepared by Table of Contents 1. Documentation Page 3 2. Executive Summary 4 2.1. Purpose 4 2.2. Evaluation Results 4 3. Background 4 4. Approach
STH 60 Northern Reliever Route Feasibility Study Report
 #233087 v3 STH 60 Northern Reliever Route Feasibility Study Report Washington County Public Works Committee Meeting September 28, 2016 1 STH 60 Northern Reliever Route Feasibility Study Hartford Area Development
February 2011 Caltrain Annual Passenger Counts Key Findings
 February 2011 Caltrain Annual Passenger Counts Key Findings Key Findings February 2011 Caltrain Annual Passenger Counts The 2011 annual Caltrain passenger counts, which were conducted in February 2011,
UNDERSTANDING THE SIGNIFICANCE OF AXLE VERSUS LENGTH CLASSIFICATION ON AXLE FACTORS AND THE EFFECT ON AADT TO ENSURE RELIABLE TRAFFIC DATA
 WISCONSIN DOT CASE STUDY FINDINGS UNDERSTANDING THE SIGNIFICANCE OF AXLE VERSUS LENGTH CLASSIFICATION ON AXLE FACTORS AND THE EFFECT ON AADT TO ENSURE RELIABLE TRAFFIC DATA NATMEC 2014, Chicago, Illinois
MEMO VIA . Ms. Amy Roth DPS Director, City of Three Rivers. To:
 MEMO To: Ms. Amy Roth DPS Director, City of Three Rivers VIA EMAIL From: Michael J. Labadie, PE Julie M. Kroll, PE, PTOE Brandon Hayes, PE, P.Eng. Fleis & VandenBrink Date: January 5, 2017 Re: Proposed
Asian AOIC NH 1. Black/AA AOIC NH 2
 AOIC 1 AOIC 2 H AITKIN-ITASCA- KOOCHICHING ANOKA BENTON BLUE EARTH BROWN-NICOLLET # of Vouchers 987 154 14 25 751
Clean Harbors Canada, Inc.
 Clean Harbors Canada, Inc. Proposed Lambton Landfill Expansion Environmental Assessment Terms of Reference Transportation Assessment St. Clair Township, Ontario September 2009 itrans Consulting Inc. 260
Table of Contents INTRODUCTION... 3 PROJECT STUDY AREA Figure 1 Vicinity Map Study Area... 4 EXISTING CONDITIONS... 5 TRAFFIC OPERATIONS...
 Crosshaven Drive Corridor Study City of Vestavia Hills, Alabama Table of Contents INTRODUCTION... 3 PROJECT STUDY AREA... 3 Figure 1 Vicinity Map Study Area... 4 EXISTING CONDITIONS... 5 TRAFFIC OPERATIONS...
Energy Technical Memorandum
 Southeast Extension Project Lincoln Station to RidgeGate Parkway Prepared for: Federal Transit Administration Prepared by: Denver Regional Transportation District May 2014 Table of Contents Page No. Chapter
Key Findings. February 2009 Caltrain Annual Passenger Counts
 Key Findings February 2009 Caltrain Annual Passenger Counts The 2009 annual Caltrain passenger counts, which were conducted starting in late-january and were complete by mid-february, followed the same
Western ND Meeting. February 19, 2014 Grant Levi, NDDOT Director
 Western ND Meeting February 19, 2014 Grant Levi, NDDOT Director 1 Traffic Trends in North Dakota 2 Truck Traffic 2008 3 Truck Traffic 2012 4 Average Daily Traffic 5 ND Vehicle Miles Traveled Statewide
WHITE PAPER. Preventing Collisions and Reducing Fleet Costs While Using the Zendrive Dashboard
 WHITE PAPER Preventing Collisions and Reducing Fleet Costs While Using the Zendrive Dashboard August 2017 Introduction The term accident, even in a collision sense, often has the connotation of being an
Interstate Operations Study: Fargo-Moorhead Metropolitan Area Simulation Output
 NDSU Dept #2880 PO Box 6050 Fargo, ND 58108-6050 Tel 701-231-8058 Fax 701-231-6265 www.ugpti.org www.atacenter.org Interstate Operations Study: Fargo-Moorhead Metropolitan Area 2015 Simulation Output Technical
Prepared by: Bernadette Bañez. Reviewed by: Neil Beckett/Philp Blagdon. Approved for issue by: David Darwin
 Annual Weigh-In-Motion (WiM) Report 211 This report has been prepared for the benefit of the NZ Transport Agency (NZTA). No liability is accepted by this company or any employee or sub-consultant of this
Edmonton Region Commodity Flow Study
 A Joint Alberta Transportation, City of Edmonton and Economic Development Edmonton Venture Supported by: Alberta Motor Transport Association (AMTA) Alberta Capital Region Alliance (ACRA) Page 1 27,748
A Guide to the medium General Service. BC Hydro Last Updated: February 24, 2012
 A Guide to the medium General Service Conservation Rate BC Hydro Last Updated: February 24, 2012 Executive summary The way Medium General Service (MGS) accounts pay for electricity is changing. MGS is
1 TO 2 2 TO 3 3 TO 4 11 TO TO 1
 STATION: New York State Department of Transportation Traffic Count Hourly Report Page of ROUTE #: NY ROAD NAME: FROM: RT : END / OLAP COUNTY: Onondaga : Eastbound FACR GROUP: REC. SERIAL #: AP FUNC. CLASS:
Predicted availability of safety features on registered vehicles a 2015 update
 Highway Loss Data Institute Bulletin Vol. 32, No. 16 : September 2015 Predicted availability of safety features on registered vehicles a 2015 update Prior Highway Loss Data Institute (HLDI) studies have
Michigan. Traffic. Profile
 June 2014 Revised 5/11/15 Michigan 2013 Traffic Crash Profile Reporting Criteria Please pay particular attention to the wording when interpreting the three levels of data gathered for this report. Crash
Technical Memorandum Analysis Procedures and Mobility Performance Measures 100 Most Congested Texas Road Sections What s New for 2015
 Technical Memorandum Analysis Procedures and Mobility Performance Measures 100 Most Congested Texas Road Sections Prepared by Texas A&M Transportation Institute August 2015 This memo documents the analysis
2014 Community Report Portales
 4 Portales Produced for the New Mexico Department of Transportation, Traffic Safety Division, Traffic Records Bureau, Under Contract 58 by the University of New Mexico, Geospatial and Population Studies,
DOWNTOWN PARKING STUDY AND STRATEGIC PLAN
 INTRODUCTION This report includes a summary of several key components of the Rapid City Downtown Parking Study and Strategic Plan, including: Current Conditions Analysis (Inventory and Occupancy and Length
2014 Community Report Luna County
 4 Luna County Produced for the New Mexico Department of Transportation, Traffic Safety Division, Traffic Records Bureau, Under Contract 58 by the University of New Mexico, Geospatial and Population Studies,