Serial No. N6426 SCS Doc. 15/06 SCIENTIFIC COUNCIL MEETING 2015 PORTUGUESE RESEARCH REPORT FOR 2014
|
|
|
- Lucinda Franklin
- 5 years ago
- Views:
Transcription
.")
1 Northwest Atlantic Fisheries Organization Serial No. N6426 SCS Doc. 15/06 SCIENTIFIC COUNCIL MEETING 2015 PORTUGUESE RESEARCH REPORT FOR 2014 by J. Vargas, R. Alpoim, E. Santos and A. M. Ávila de Melo INSTITUTO PORTUGUÊS DO MAR E DA ATMOSFERA IPMA, I.P. Av. BRASÍLIA , LISBOA, PORTUGAL A. Status of the fisheries In 2015, the Portuguese provisional nominal catches proceeding from NAFO Regulatory Sub Area 3 reached ton (Table 1-A). Nominal catches increased continuously from 2000 to 2003, when they peaked at ton, but declined sharply afterwards (Table I-B); during catches stabilized between and ton. Over recent years ( ) catches increased from around ton ( ) to near ton ( ) and reached, in 2014, the highest values since 2003 (more 1400 ton relatively to 2013). The 2014 fishing effort (Table II) and the catches are provisional (data extracted from NAFO Database STATLANT 21A on 15 May 2015 and STATLANT 21B on 9 June 2015), In 2014, 12 trawlers composed the Portuguese fleet that operated in the NAFO area. Due to the reopening, in 2010, of the fishery for cod in Div 3M (Flemish Cap), this species represents now about 50% of the total catch in this division and more than 25% of the Portuguese catches in all Sub Area 3 the catches of cod in this division raised more than 800 ton from 2013 to Catches of redfish, after remaining more or less stable in Div. 3L and 3N, doubled in division 3L and fell more than by half in division 3N. In Div. 3M, after two years of decreases, the catch remains stable; because of that, the total catches of this specie decreased around 3000 ton from 2011 to 2014, representing now around 35% of the total catches in this division. In Div. 3O, the catches of redfish increased about 1000 ton from 2012 to 2013 and remained stable at same level in 2014, but the relative proportion decreased from around 90% to 80% of the catches in this division (due an strong increase in silver hake catches 500 ton) and were 26% of the Portuguese catches in all Sub Area 3. Redfish remains by far the most important species in the Portuguese commercial catches from Sub Area 3, representing in recent years around 50% of the overall catch. The catches of roughhead grenadier, after a strong decrease observed in Div. 3L and 3M during 2013, increased four times from 2013 to 2014 (328 ton) been the second highest value since The shrimp fishery in Div. 3L, that in 2009 its catches reached 20% of the total catch in this division, declined significantly in 2010 and was reduced to values around zero in The Greenland halibut catches remains stable in the divisions 3L and 3M, but its total catch decreased 160 ton, due mainly of loss in Div. 3N (100 ton). Greenland halibut together with redfish continues to be the bulk of the catch on Div. 3L (around 85% of the overall catch since 2009). The American plaice catches remains stable in all divisions, except in Div. 3N (loss more of 100 ton). The witch flounder catches almost doubled (due the increase of 80 ton in Div. 3M) and the yellowtail flounder catches, that in 2013 decreased around 400 ton (-80%) in divisions 3N and 3O combined, are now residual and around 30 ton; skates catches less almost 80 ton in division 3N and remains more or less stable in all others divisions; the catch of haddock more than doubled relatively 2013, mainly due the increase of his fishery in Div. 3M. The catches of other species remained more or less stable in all divisions.
2 2 The catch in Div. 3M (mainly cod and redfish) continue in 2014, like the most recent years, to represent around 50% of the total catch. This division is, at present, the most important ground for the Portuguese NAFO fishery, but cod replaced redfish as the most important fishery. On division 3O, redfish continues the most important fishery, with almost 90% of the catches and this division represents now around 30% of the year catch. From 2013 to 2014, the catches in Div. 3N fell by half, due mainly of the loss of around 350 ton in redfish fishery and the same value in the bulk of the catches of cod, Greenland halibut, American plaice and skates; despite that, the catches of skates represent now around 45% of the catches in Div. 3N, against only 33% of redfish. B. Portuguese Annual Sampling Program 1. Catch and effort sampling. Effort and CPUE data for 2014 Portuguese trawl fishery on the NAFO Regulatory Area were obtained through the revision of skipper logbooks from three trawlers, kindly supplied by its owners. All the information (round weight of the catch by species, fishing effort, positions and depths) has been recorded on a tow-bytow basis. The vessel conversion factors were used to convert its processed landings in catches. The daily catch and effort data from the logbook were used to estimate the directed effort and CPUE for each of the target species/stock, as well as the main by-catch species and depth range of the different fisheries, on a monthly basis. From the data available, the majority of the fishing effort was directed towards cod, redfish and Greenland halibut. Data regarding directed effort and catch rates of the Greenland halibut fishery are presented in Table III to IV-B and Fig. 1. The Greenland halibut CPUE series was updated with the 2014 observed CPUEs. The additive model (Ávila de Melo and Alpoim, 1995), was upgraded in 1998 (Alpoim et al., 1998) and used, like in previous years, to standardize the observed CPUEs, but excluding the vessel factor because the sampling program in recent years was carried out on vessels that were not sampled before. If the vessel factor is applied, these new vessels will increased a lot the noised. Because they are the only vessels sampled in the recent years, we assumed that all vessels belong to the same category what is realistic. From January 1988 till April 1995 each monthly observed CPUE of this series was previously corrected for 130mm mesh size (Ávila de Melo and Alpoim, 1996). In this analysis, any observation corresponding to a month and a trawler with less than 10 hours of directed effort was rejected. The CPUEs are presented in Tables IV and Fig. 1, with the associated standard errors (+/- 2 standard errors in the Figures) and coefficients of variation Comments on catch and effort data (based on the vessels sampled) Greenland halibut in Div. 3L, 3M, 3N and 3O In Div. 3L catch rates declined prior to the boom of the deep-water fishery (Table IV-A, Fig. 1). However, it is from 1990 to 1991, i.e. from the first to the second year of this new fishery in the Regulatory Area, that CPUEs fell by half. Between 1991 and 1994 catch rates remained stable at a low level. Since then, catch rates gradually increased, reaching an upper level in Catch rates declined in 2001 and remained stable at that lower level in 2002 and In 2004 the catch rates decline again, reaching the lowest value since However, after 2004 the Greenland halibut catch rates recovered continuously and, despite the high variability from 2006 to 2014, the catch rates reached, in this period, the highest values observed of the time series (the Greenland halibut CPUE remains stable from 2013 to 2014). Div. 3M catch rates despite more noisy follows the same trend as the ones in Div. 3L. For all Div. 3LMNO combined (Table IV-A, Fig. 1) the observed catch rates series follows the Div. 3L pattern, since this is the division of Sub Area 3 with the highest concentration of Greenland halibut fishing effort. 2. Biological Sampling In 2014, biological sampling was obtained from three stern trawlers fishing in Div. 3L, 3M, 3N and 3O during all the year. Apart from species under moratoria, a priority to be sampled whenever they appear in the hauls, biological sampling was conducted for the two most abundant species in each haul, following the NAFO sampling recommendations.
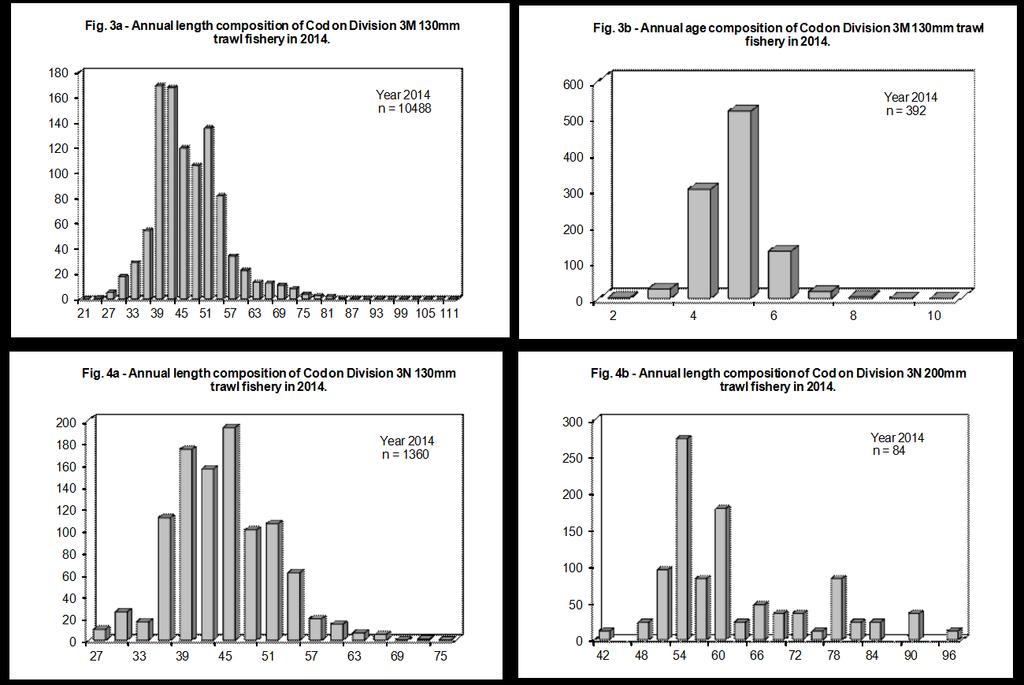
3 3 Cod, redfish (S. mentella) and American plaice were sampled in Div. 3L, 3M, 3N and 3O (Tab. V). Greenland halibut was sampled in Div. 3L, 3M and 3N. Witch flounder was sampled in Div. 3M, 3N and 3O. Roughhead grenadier was sampled in Div. 3L and 3M. Thorny skate and redfish (S. marinus) were sampled only in Div. 3M and white hake only in Div. 3O. Since 1996, all commercial information is representative of the catch as a whole, although sampling continues to be carried out by sex, with the exception of cod, white hake, Atlantic halibut and haddock. Mean weight and mean weight in the catch are derived from the length-weight relationships calculated from the commercial sampling in 2014 and are presented in Table VI. However, for species/stock with a low sampling level in 2014, the length-weight relationships calculated in previous years were used Catch and by-catch composition of the 2014 trawl fishery (130mm codend mesh size). The regular mesh size in the codend used by the monitored trawlers fishing groundfish was the 130mm and, when the mesh size is not mentioned it, means that the sample refers to the 130mm mesh size. Nevertheless, some sets in Div. 3N were made with a skate trawl net with 200mm/280mm mesh size in the codend, representing 6% in Div. 3N of the total effort sampled (lengths only). The size of these catches within the overall sampled catch in Div. 3N is about 2% for cod, 18% for American plaice, 100% for yellowtail flounder and 9% for thorny skate Cod Div. 3L Information on length composition of the cod by-catch in Div. 3L is available for March and from May to November, except for August (Table VII, Fig. 2), from 245 m to 471 m depth. Lengths between 33 cm and 51 cm dominated the catch, with a modal class at 39 cm (mean length and weight of 43.7 cm and 1137 g) Cod Div. 3M Information on length composition of the cod trawl catch in Div. 3M is available from February to November, (Table VIII-A, Fig. 3), from 149 m to 541 m depth. Lengths between 39 cm and 54 cm dominated the catch, with two modal classes at 39 cm and 42 cm (mean length and weight of 47.8 cm and 1216 g). An annual Div. 3M cod age-length key (3rd and 4th quarters combined) is presented in Table VIII-B and Fig. 3b. This age-length key was used to derive the age composition by quarters and year. The 2006 to 2008 year classes, 4 to 6 years old in 2014, dominated the trawl catches, being the 2007 year class the most represented (Tab. VIII-C) Cod Div. 3N Information on length composition of the cod by-catch in Div. 3N is available for June, August and September (Table IX-A, Fig. 4a), from 42 m to 590 m depth. Lengths between 36 cm and 51 cm dominated the catch, with a very modal class at 45 cm (mean length and weight of 45.4 cm and 764 g) Cod Div. 3N 200 mm mesh size Information on length composition of the cod by-catch in Div. 3N (200 mm mesh size) is available only for October (Table IX-B, Fig. 4b), from 48 m to 53 m depth. Despite the small sampling (84 fish measured), the data shows that lengths at 54 cm and at 60 cm dominated the catch, with a modal class at 54 cm (mean length and weight of 63.6 cm and 2259 g).
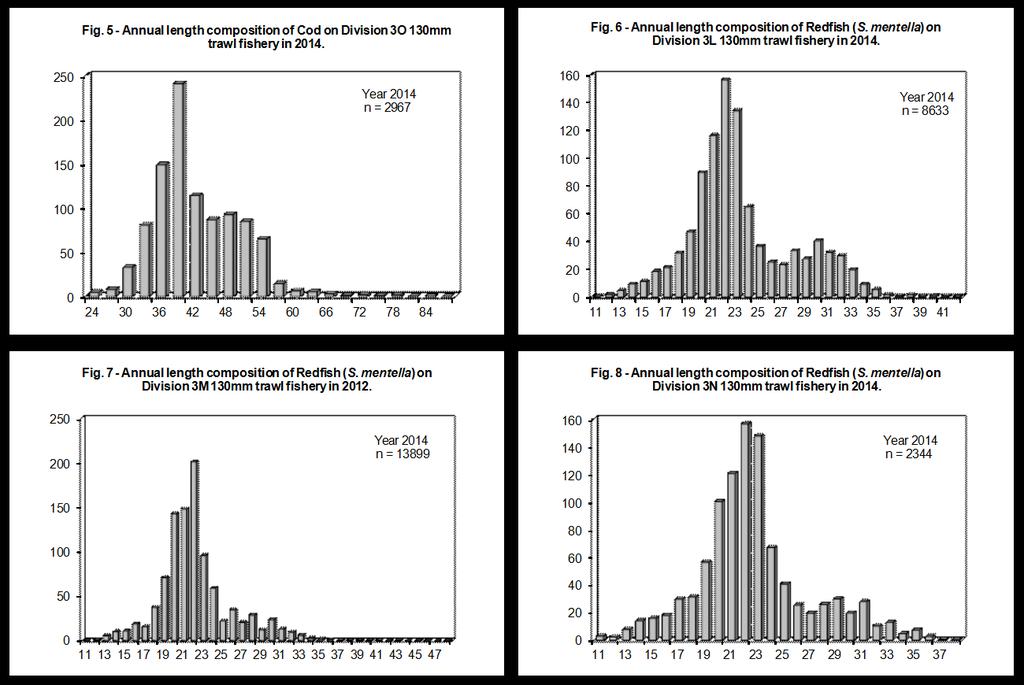
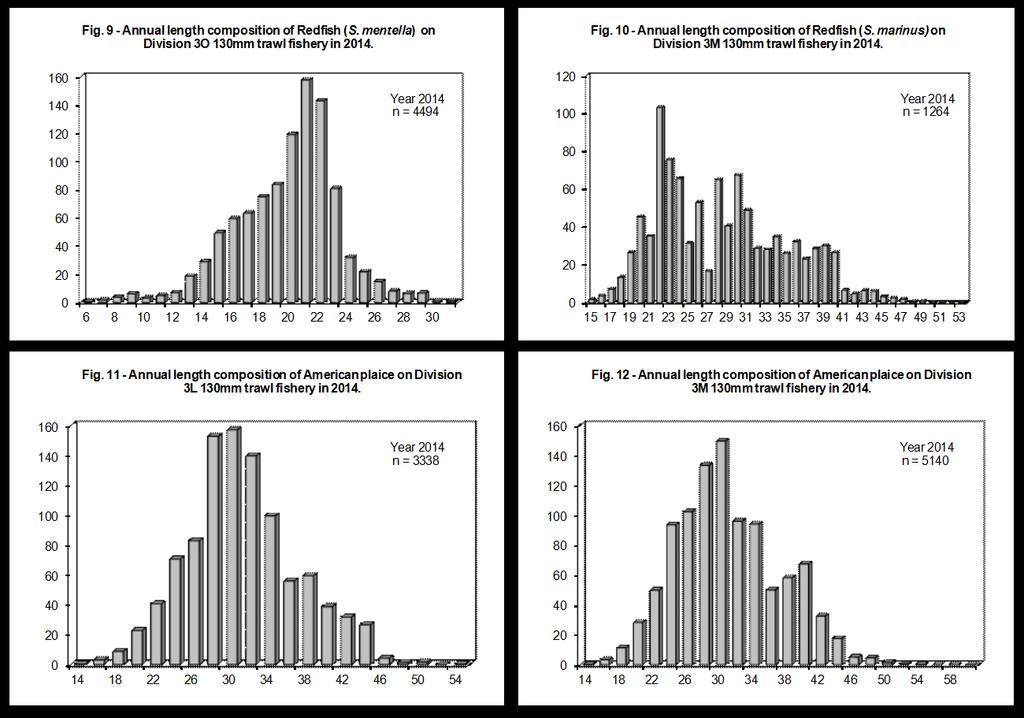
4 Cod Div. 3O Information on length composition of the cod by-catch in Div. 30 is available from March to October, except for April (Table X, Fig. 5), from 69 m to 457 m depth. Lengths between 33 cm and 51 cm dominated the catch, with a very clear modal class at 39 cm (mean length and weight of 43.7 cm and 696 g) Redfish (S. mentella) Div. 3L Information on length composition of the redfish (S. mentella) trawl catches in Div. 3L is available from March to November, except for April (Table XI, Fig. 6), from 245 m to 1190 m depth. Lengths between 20 cm and 24 cm dominated the catch, with a modal class at 22 cm (mean length and weight of 23.9 cm and 184 g) Redfish (S. mentella) Div. 3M Information on length composition of the redfish (S. mentella) trawl catches in Div. 3M is available from February to November (Table XII, Fig. 7), from 145 m to 1078 m depth. Lengths between 20 cm and 23 cm dominated the catch, with a modal class at 22 cm (mean length and weight of 22.7 cm and 180 g) Redfish (S. mentella) Div. 3N Information on length composition of the redfish (S. mentella) trawl catches in Div. 3N is available for March and April and from June to September, except for July (Table XIII, Fig. 8), from 275 m to 590 m depth. Lengths between 20 cm and 23 cm dominated the catch, with a modal class at 22 cm (mean length and weight of 23.1 cm and 167 g) Redfish (S. mentella) Div. 3O Information on length composition of the redfish (S. mentella) trawl catches in Div. 3O is available from March to September (Table XIV, Fig. 9), from 159 m to 519 m depth. Lengths between 19 cm and 23 cm dominated the catches, with a modal class at 21 cm (mean length and weight of 20.2 cm and 125 g) Redfish (S. marinus) Div. 3M Information on length composition of the redfish (S. marinus) trawl catches in Div. 3M is available for May, July and August (Table XV, Fig. 10), from 145 m to 315 m depth. Lengths between 22 cm and 24 cm and at 28 cm and 30 cm dominated the catches, with a clear modal class at 22 (mean length and weight of 28.8 cm and 371 g) American plaice Div. 3L Information on length composition of the American plaice by-catch in Div. 3L is available for May and June and from September to November (Table XVI, Fig. 11), from 245 m to 344 m depth. Lengths between 26 and 34 cm dominated the catch, with two modal classes at 28 cm and 30 cm (mean length and weight of 32 cm and 313 g) American plaice Div. 3M Information on length composition of the American plaice by-catch in Div. 3M is available from February to November, except for April (Table XVII, Fig. 12), from 141 m to 541 m depth. Lengths between 24 and 34 cm dominated the catch, with a modal class at 30 cm (mean length and weight of 31.8 cm and 304 g).
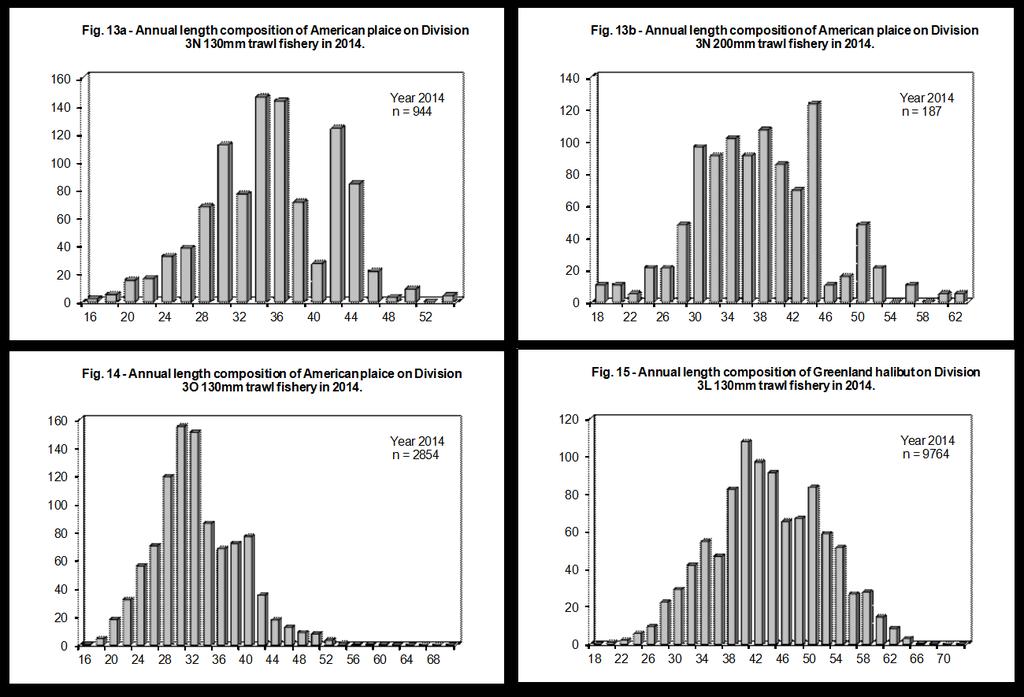
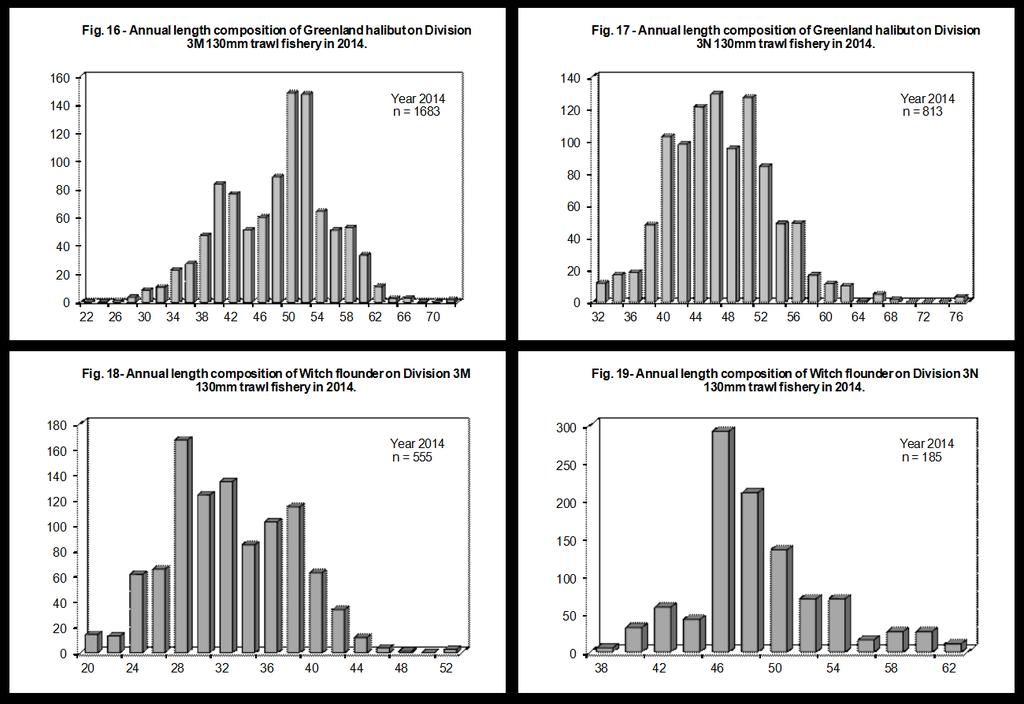
5 American plaice Div. 3N Information on length composition of the American plaice by-catch in Div. 3N is available from June to September, except for July (Table XVIII-A, Fig. 13a), from 42 m to 407 m depth. Lengths between 28 and 38 cm and at 42 cm and 44 cm dominated the catch, with two modal classes at 34 cm and 36 cm (mean length and weight of 35.9 cm and 452 g) American plaice Div. 3N 200 mm mesh size Information on length composition of the American plaice by-catch in Div. 3N (200 mm mesh size) is available only for October (Table XVIII-B, Fig. 13b), from 48 m to 53 m depth. Despite a small sampling (187 fish measured), the data shows that the lengths between 30 and 44 cm dominated the catch, with a modal class at 44 cm (mean length and weight of 38.3 cm and 570 g) American plaice Div. 3O Information on length composition of the American plaice by-catch in Div. 3O is available from April to October (Table XIX, Fig. 14), from 69 m to 458 m depth. Lengths between 26 and 40 cm dominated the catch, with two modal classes at 30 cm and 32 cm (mean length and weight of 33.4 cm and 364 g) Greenland halibut Div. 3L Information on length composition of the Greenland halibut catches in Div. 3L is available from March to November, except for May and September (Table XX, Fig. 15), from 772 m to 1485 m depth. Lengths between 38 cm and 44 cm and at 50 cm dominated the catch, with a modal class at 40 cm (mean length and weight of 44.4 cm and 837 g) Greenland halibut Div. 3M Information on length composition of the Greenland halibut catches in Div. 3M is available from March to July, except for May (Table XXI, Fig. 16), from 749 m to 1148 m depth. Lengths at 40 cm and 42 cm and between 48 cm and 52 cm dominated the catch, with a two modal classes at 50 cm and 52 cm (mean length and weight of 48.9 cm and 1079 g) Greenland halibut Div. 3N Information on length composition of the Greenland halibut catches in Div. 3N is available only for July and August (Table XXII, Fig. 17), from 891 m to 1400 m depth. Lengths between 40 cm and 52 cm dominated the catch, with a no clear modal class (mean length and weight of 47.7 cm and 991 g) Witch flounder Div. 3M Information on length composition of the witch flounder by-catch in Div. 3M is available from September to November (Table XXIII, Fig. 18), from 141 m to 204 m depth. Lengths between 28 cm and 38 cm, with a very clear modal class at 28 cm (mean length and weight of 33.3 cm and 435 g) Witch flounder Div. 3N Information on length composition of the witch flounder by-catch in Div. 3N is available only for August (Table XXIV, Fig. 19), from 470 m to 1100 m depth. Despite the small sampling (185 fish measured), the data shows that the lengths between 46 cm and 50 cm dominated the catch, with a very clear modal class at 46 cm (mean length and weight of 49.4 cm and 1030 g).
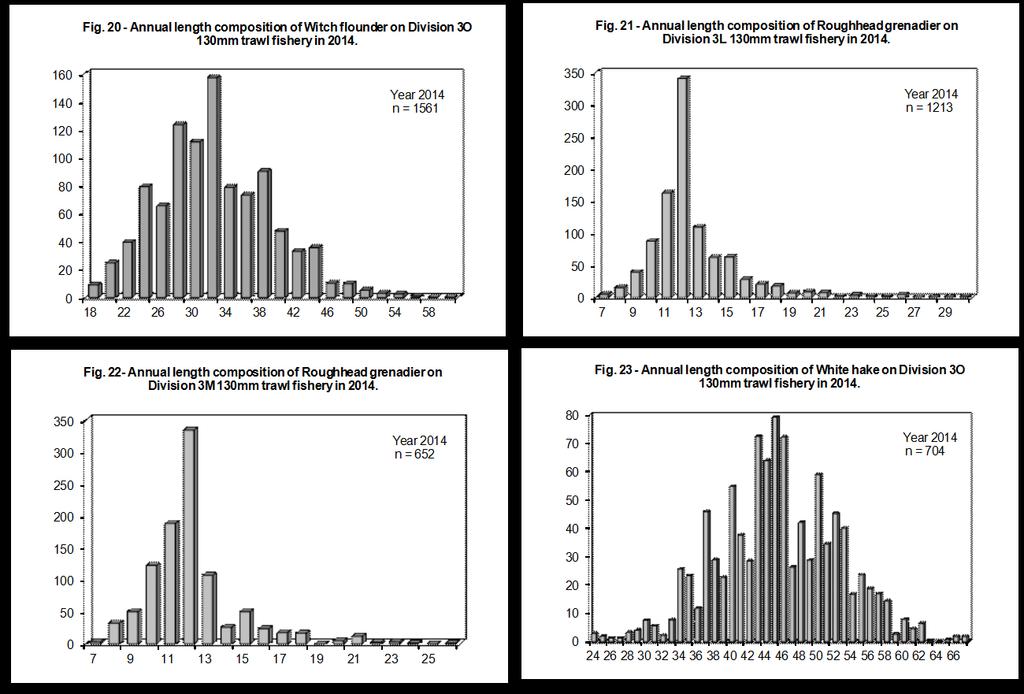
6 Witch flounder Div. 3O Information on length composition of the witch flounder by-catch in Div. 3O is available from July to September (Table XXV, Fig. 20), from 259 m to 431 m depth. Lengths between 28 cm and 38 cm dominated the catch, with a modal class at 32 cm (mean length and weight of 33.1 cm and 237 g) Roughhead grenadier Div. 3L Information on length composition of the roughhead grenadier catches in Div. 3L is available for March and from June to August (Table XXVI, Fig. 21), from 829 m to 1255 m depth. Anal fin lengths between 10 cm and 13 cm dominated the catch, with a very clear modal class at 12 cm (mean length and weight of 13.2 cm and 238 g) Roughhead grenadier Div. 3M Information on length composition of the roughhead grenadier catch in Div. 3M is available only for March and July (Table XXVII, Fig. 22), from 873 m to 1135 m depth. Anal fin lengths between 10 cm and 13 cm dominated the catch, with a very clear modal class at 12 cm (mean length and weight of 12.6 cm and 206 g) Thorny skate Div. 3M Information on length composition of the thorny skate catches in Div. 3M is available only for February (Table XXVIII), from 377 m to 391 m depth. Because the small sampling (1 samples, 22 fish measured) we not take any conclusion about the dominated lengths in the catch (mean length and weight of 64 cm and 3074 g) White hake Div. 3O Information on length composition of the white hake catches in Div. 3O is available from May to September, except for July (Table XXIX, Fig. 23), from 251 m to 431 m depth. Despite the large range of lengths, the data show that lengths between 43 cm and 46 cm, dominated the catch (mean length and weight of 45.8 cm and 836 g). 3. Acknowledgements This study was supported by the European Commission (Program for the Collection of Data in Fisheries Sector) and IPMA, I.P. 4. References ALPOIM, R., GODINHO, M. L., SANTOS, E. and ÁVILA de MELO, A. M "Portuguese research Report for 1998". NAFO SCS Doc. 98/13 Ser. No N3025, 38p. ÁVILA de MELO, A. M., ALPOIM, R "Portuguese Cod Fisheries in NAFO Divisions 3N and 3O, ". NAFO Sci. Coun. Studies 23: ÁVILA de MELO, A. M., ALPOIM, R "Greenland halibut deepwater fishery in Divisions 3L and 3N: an analysis of catch rate trends from Portuguese trawlers, " NAFO SCR Doc. 96/33 Ser. No N2708,16p.
7 7 TABLE I-A: PORTUGUESE NOMINAL TRAWL CATCHES (mt) IN NAFO AREA, 2014 (data extracted from NAFO Database Statlant 21A on 15 May 2015). DIVISION TOTAL SPECIES 3L 3M 3N 3O 2014 Cod Redfish American plaice Yellowtail flounder Witch flounder Greenland halibut Atlantic halibut Roughhead grenadier Roundnose grenadier Anarhichas spp. 3 3 Hadocck Pollock White hake Red hake Silver Hake Capelin Skates Monkfish Squid Shrimp Unidentified TOTAL
8 8 TABLE I - B: PORTUGUESE NOMINAL TRAWL CATCHES (mt) IN NAFO DIV. 3LMNO (data extracted from NAFO Database Statlant 21A on 15 May 2015). SPECIES / YEAR Cod Redfish American plaice Yellowtail flounder Witch flounder Greenland halibut Atlantic halibut Roughhead grenadier Roundnose grenadier Anarhichas spp Hadocck Pollock White hake Red hake Capelin Skates Monkfish Squid Shrimp Unidentified TOTAL TABLE I - B: cont. SPECIES / YEAR Cod Redfish American plaice Yellowtail flounder Witch flounder Greenland halibut Atlantic halibut Roughhead grenadier Roundnose grenadier Anarhichas spp Hadocck Pollock White hake 8 Red hake Capelin 14 Skates Monkfish Squid Shrimp Unidentified TOTAL TABLE II : PORTUGUESE TRAWL EFFORT IN FISHING DAYS IN NAFO Div. 3LMNO (data extracted from NAFO. (Database Statlant 21B on 9 June 2015) YEAR 3L 3M 3N 3O Total geral (a) a) not extracted from Database Statlant 21B, provisional
9 9 TABLE III: Portuguese trawl fishery cpue's and bycatch by month and division for DIVISION TARGET MONTH DEPTH RANGE (m) CPUE MAIN BYCATCH WITCH FLOUNDER TOTAL SPECIES MIN. MAX. (ton/hour) SPECIES % BYCATCH (%) BYCATCH (%) 3M COD FEB RED M COD MAR RED M COD APR RED M COD MAY RED M COD JUL RED M COD AUG RED M COD SEP RED M COD OCT RED L RED APR GHL L RED JUN COD L RED JUL COD L RED AUG RHG L RED SEP COD L RED OCT COD L RED NOV COD M RED FEB COD M RED MAR COD M RED MAY COD M RED JUL COD M RED SEP COD N RED MAR COD N RED APR HAL N RED MAY HAL N RED JUN COD N RED AUG WIT N RED SEP COD O RED MAR COD O RED APR COD O RED MAY COD O RED JUN COD O RED JUL HAL O RED AUG COD O RED SEP COD O RED OCT COD L GHL MAR RHG L GHL APR RED L GHL MAY RHG L GHL JUN RHG L GHL JUL RHG L GHL AUG RHG L GHL OCT RHG L GHL NOV RHG M GHL MAR RHG M GHL APR RNG M GHL MAY RHG M GHL JUN RHG M GHL JUL RNG N GHL MAR SKA N GHL APR RHG N GHL MAY RHG N GHL JUL WIT N GHL AUG RHG N RHG APR GHL O HKW SEP COD N SKA AUG COD N SKA OCT PLA
10 10 TABLE IV - A: GREENLAND HALIBUT TRAWL CATCH RATES, : mean annual cpue's corrected for the month, division and vessel of each observation. 3L 3M 3N 3LMN CPUE ST.ERROR C.V. CPUE ST.ERROR C.V. CPUE ST.ERROR C.V. CPUE ST.ERROR C.V TABLE IV - B: GREENLAND HALIBUT TRAWL CATCH RATES, mean cpue's by division corrected for the year, month and vessel of each observation. CPUE ST.ERROR C.V. 3L L 3M M 3N N 3LMN LMN
11 11 TABLE V: Intensity of the trawl sampling during 2014, by species, division and month. SPECIES DIV. MONTH Nº OF Nº FISH SAMPLING OTOLITHS SAMPLES MEASURED WEIGHT(Kg) Nº LENGTH RANGE (cm) COD 3L MAR COD 3L MAY COD 3L JUN COD 3L JUL COD 3L SEP COD 3L OCT COD 3L NOV COD 3M FEB COD 3M MAR COD 3M APR COD 3M MAY COD 3M JUN COD 3M JUL COD 3M AUG COD 3M SEP COD 3M OCT COD 3M NOV COD 3N JUN COD 3N AUG COD 3N SEP COD 3N OCT COD 3O MAR COD 3O MAY COD 3O JUN COD 3O JUL COD 3O AUG COD 3O SEP COD 3O OCT REDFISH (S. mentella ) 3L MAR REDFISH (S. mentella ) 3L MAY REDFISH (S. mentella ) 3L JUN REDFISH (S. mentella ) 3L JUL REDFISH (S. mentella ) 3L AUG REDFISH (S. mentella ) 3L SEP REDFISH (S. mentella ) 3L OCT REDFISH (S. mentella ) 3L NOV REDFISH (S. mentella ) 3M FEB REDFISH (S. mentella ) 3M MAR REDFISH (S. mentella ) 3M APR REDFISH (S. mentella ) 3M MAY REDFISH (S. mentella ) 3M JUN REDFISH (S. mentella ) 3M JUL REDFISH (S. mentella ) 3M AUG REDFISH (S. mentella ) 3M SEP REDFISH (S. mentella ) 3M OCT REDFISH (S. mentella ) 3M NOV
12 12 TABLE V: (cont.) SPECIES DIV. MONTH Nº OF Nº FISH SAMPLING OTOLITHS SAMPLES MEASURED WEIGHT(Kg) Nº LENGTH RANGE (cm) REDFISH (S. mentella ) 3N MAR REDFISH (S. mentella ) 3N APR REDFISH (S. mentella ) 3N JUN REDFISH (S. mentella ) 3N AUG REDFISH (S. mentella ) 3N SEP REDFISH (S. mentella ) 3O MAR REDFISH (S. mentella ) 3O APR REDFISH (S. mentella ) 3O MAY REDFISH (S. mentella ) 3O JUN REDFISH (S. mentella ) 3O JUL REDFISH (S. mentella ) 3O AUG REDFISH (S. mentella ) 3O SEP REDFISH (S. marinus ) 3M MAY REDFISH (S. marinus ) 3M JUL REDFISH (S. marinus ) 3M AUG AMERICAN PLAICE 3L MAY AMERICAN PLAICE 3L JUN AMERICAN PLAICE 3L SEP AMERICAN PLAICE 3L OCT AMERICAN PLAICE 3L NOV AMERICAN PLAICE 3M FEB AMERICAN PLAICE 3M MAR AMERICAN PLAICE 3M MAY AMERICAN PLAICE 3M JUN AMERICAN PLAICE 3M JUL AMERICAN PLAICE 3M AUG AMERICAN PLAICE 3M SEP AMERICAN PLAICE 3M OCT AMERICAN PLAICE 3M NOV AMERICAN PLAICE 3N JUN AMERICAN PLAICE 3N AUG AMERICAN PLAICE 3N SEP AMERICAN PLAICE 3N OCT AMERICAN PLAICE 3O APR AMERICAN PLAICE 3O MAY AMERICAN PLAICE 3O JUN AMERICAN PLAICE 3O JUL AMERICAN PLAICE 3O AUG AMERICAN PLAICE 3O SEP AMERICAN PLAICE 3O OCT
13 13 TABLE V: (cont.) SPECIES DIV. MONTH Nº OF Nº FISH SAMPLING OTOLITHS SAMPLES MEASURED WEIGHT(Kg) Nº LENGTH RANGE (cm) GREENLAND HALIBUT 3L MAR GREENLAND HALIBUT 3L APR GREENLAND HALIBUT 3L JUN GREENLAND HALIBUT 3L JUL GREENLAND HALIBUT 3L AUG GREENLAND HALIBUT 3L OCT GREENLAND HALIBUT 3L NOV GREENLAND HALIBUT 3M MAR GREENLAND HALIBUT 3M APR GREENLAND HALIBUT 3M JUN GREENLAND HALIBUT 3M JUL GREENLAND HALIBUT 3N JUL GREENLAND HALIBUT 3N AUG ROUGHHEAD GRENADIER 3L MAR ROUGHHEAD GRENADIER 3L JUN ROUGHHEAD GRENADIER 3L JUL ROUGHHEAD GRENADIER 3L AUG ROUGHHEAD GRENADIER 3M MAR ROUGHHEAD GRENADIER 3M JUL WITCH FLOUNDER 3M SEP WITCH FLOUNDER 3M OCT WITCH FLOUNDER 3M NOV WITCH FLOUNDER 3N AUG WITCH FLOUNDER 3O JUL WITCH FLOUNDER 3O AUG WITCH FLOUNDER 3O SEP WHITE HAKE 3O MAY WHITE HAKE 3O JUN WHITE HAKE 3O AUG WHITE HAKE 3O SEP THORNY SKATE 3M FEB
14 14 TABLE VI: Length-weight relationship by species, stock and sex in Species Stock Sex a b n r 2 Length interval (cm) COD 2J3KL T COD 3M T COD 3NO T GHL 2J3KLMNO F GHL 2J3KLMNO M GHL 2J3KLMNO T PLA 3LNO F PLA 3LNO M PLA 3LNO T PLA 3M F PLA 3M M PLA 3M T REB 3LN F REB 3LN M REB 3LN T REB 3M F REB 3M M REB 3M T REB 3O F REB 3O M REB 3O T REG 3M F REG 3M M REG 3M T
15 15 TABLE VII: COD, DIV. 3L, 2014: length composition (0/000) of the 130mm trawl catches. LENGTH MAR MAY JUN JUL SEP OCT NOV 1st Q. 2nd Q. 3rd Q. 4th Q. YEAR LENGTH TOTAL No. SAMPLES SAMPLING WEIGHT(kg) No. F.MEASURED MEAN LENGTH(cm) MEAN WEIGHT (g) DEPTH RANGE (m) 380/ / / / / / / / / / / /471 TABLE VIII-A: COD, DIV. 3M, 2014: length composition (0/000) of the 130mm trawl catches. LENGTH FEB MAR APR MAY JUN JUL AUG SEP OCT NOV 1st Q. 2nd Q. 3rd Q. 4th Q. YEAR LENGTH TOTAL No. SAMPLES SAMPLING WEIGHT(kg) No. F.MEASURED MEAN LENGTH(cm) MEAN WEIGHT (g) DEPTH RANGE (m) 292/ / / / / / / / / / / / / / /541
16 16 TABLE VIII-B: COD, DIV. 3M, 2014: Age length key. LENGTH AGES LENGTH TOTAL TOTAL TABLE VIII-C: COD, DIV. 3M, 2014: age composition (0/000), mean length (cm) and mean weigth (kg) at age, of the 130mm trawl catches. 1st Q. 2nd Q. 3rd Q. 4th Q. YEAR AGE MEAN MEAN MEAN MEAN MEAN MEAN MEAN MEAN MEAN MEAN AGE LENGTH WEIGHT LENGTH WEIGHT LENGTH WEIGHT LENGTH WEIGHT LENGTH WEIGHT TOTAL
17 17 TABLE IX-A: COD, DIV. 3N, 2014: length composition (0/000) of the 130mm trawl catches. LENGTH JUN AUG SEP 2nd Q. 3rd Q. YEAR LENGTH TOTAL TABLE IX-B: COD, DIV. 3N, 2014: length composition (0/000) of the 200mm trawl catches. LENGTH OCT LENGTH = YEAR TOTAL 1000 No. SAMPLES SAMPLING WEIGHT(kg) No. F.MEASURED MEAN LENGTH(cm) MEAN WEIGHT (g) DEPTH RANGE (m) 331/356 42/51 246/ /356 42/590 42/590 No. SAMPLES 1 SAMPLING WEIGHT(kg) 270 No. F.MEASURED 84 MEAN LENGTH(cm) 63.6 MEAN WEIGHT (g) 2259 DEPTH RANGE (m) 48/53
18 18 TABLE X: COD, DIV. 3O, 2014: length composition (0/000) of the 130mm trawl catches. LENGTH MAR MAY JUN JUL AUG SEP OCT 1st Q. 2nd Q. 3rd Q. 4th Q. YEAR LENGTH TOTAL No. SAMPLES SAMPLING WEIGHT(kg) No. F.MEASURED MEAN LENGTH(cm) MEAN WEIGHT (g) DEPTH RANGE (m) 327/ / / / /364 94/427 69/ / /426 94/457 69/263 69/457
19 19 TABLE XI: REDFISH (S. mentella ), DIV. 3L, 2014: length composition (0/000) of the 130mm trawl catches. LENGTH MAR MAY JUN JUL AUG SEP OCT NOV 1st Q. 2nd Q. 3rd Q. 4th Q. YEAR LENGTH TOTAL No. SAMPLES SAMPLING WEIGHT(kg) No. F.MEASURED MEAN LENGTH(cm) MEAN WEIGHT (g) DEPTH RANGE (m) 772/ / / / / / / / / / / / /1190
20 20 TABLE XII: REDFISH (S. mentella ), DIV. 3M, 2014: length composition (0/000) of the 130mm trawl catches. LENGTH FEB MAR APR MAY JUN JUL AUG SEP OCT NOV 1st Q. 2nd Q. 3rd Q. 4th Q. YEAR LENGTH TOTAL No. SAMPLES SAMPLING WEIGHT(kg) No. F.MEASURED MEAN LENGTH(cm) MEAN WEIGHT (g) DEPTH RANGE (m) 377/ / / / / / / / / / / / / / /1078
21 21 TABLE XIII: REDFISH (S. mentella ), DIV. 3N, 2014: length composition (0/000) of the 130mm trawl catches. LENGTH MAR APR JUN AUG SEP 1st Q. 2nd Q. 3rd Q. YEAR LENGTH TOTAL No. SAMPLES SAMPLING WEIGHT(kg) No. F.MEASURED MEAN LENGTH(cm) MEAN WEIGHT (g) DEPTH RANGE (m) 320/ / / / / / / / /590
22 22 TABLE XIV: REDFISH (S. mentella ), DIV. 3O, 2014: length composition (0/000) of the 130mm trawl catches. LENGTH MAR APR MAY JUN JUL AUG SEP 1st Q. 2nd Q. 3rd Q. YEAR LENGTH TOTAL No. SAMPLES SAMPLING WEIGHT(kg) No. F.MEASURED MEAN LENGTH(cm) MEAN WEIGHT (g) DEPTH RANGE (m) 355/ / / / / / / / / / /519
23 23 TABLE XV: REDFISH (S. marinus ), DIV. 3M, 2014: length composition (0/000) of the 130mm trawl catches. LENGTH MAY JUL AUG 2nd Q. 3rd Q. YEAR LENGTH TOTAL No. SAMPLES SAMPLING WEIGHT(kg) No. F.MEASURED MEAN LENGTH(cm) MEAN WEIGHT (g) DEPTH RANGE (m) 191/ / / / / /315
24 24 TABLE XVI: AMERICAN PLAICE, DIV. 3L, 2014: length composition (0/000) of the 130mm trawl catches. LENGTH MAY JUN SEP OCT NOV 2nd Q. 3rd Q. 4th Q. YEAR LENGTH TOTAL No. SAMPLES SAMPLING WEIGHT(kg) No. F.MEASURED MEAN LENGTH(cm) MEAN WEIGHT (g) DEPTH RANGE (m) 245/ / / / / / / / /344
25 25 TABLE XVII: AMERICAN PLAICE, DIV. 3M, 2014: length composition (0/000) of the 130mm trawl catches. LENGTH FEB MAR MAY JUN JUL AUG SEP OCT NOV 1st Q. 2nd Q. 3rd Q. 4th Q. YEAR LENGTH TOTAL No. SAMPLES SAMPLING WEIGHT(kg) No. F.MEASURED MEAN LENGTH(cm) MEAN WEIGHT (g) DEPTH RANGE (m) 506/ / / / / / / / / / / / / /541
26 26 TABLE XVIII-A: AMERICAN PLAICE, DIV. 3N, 2014: length composition (0/000) of the 130mm trawl catches. LENGTH JUN AUG SEP 2nd Q. 3rd Q. YEAR LENGTH TOTAL No. SAMPLES SAMPLING WEIGHT(kg) No. F.MEASURED MEAN LENGTH(cm) MEAN WEIGHT (g) DEPTH RANGE (m) 331/356 42/60 246/ /356 42/407 42/407 TABLE XVIII-B: AMERICAN PLAICE, DIV. 3N, 2014: length composition (0/000) of the 200mm trawl catches. LENGTH OCT LENGTH = YEAR TOTAL 1000 No. SAMPLES 1 SAMPLING WEIGHT(kg) 111 No. F.MEASURED 187 MEAN LENGTH(cm) 38.3 MEAN WEIGHT (g) 570 DEPTH RANGE (m) 48/53
27 27 TABLE XIX: AMERICAN PLAICE, DIV. 3O, 2014: length composition (0/000) of the 130mm trawl catches. LENGTH APR MAY JUN JUL AUG SEP OCT 2nd Q. 3rd Q. 4th Q. YEAR LENGTH TOTAL No. SAMPLES SAMPLING WEIGHT(kg) No. F.MEASURED MEAN LENGTH(cm) MEAN WEIGHT (g) DEPTH RANGE (m) 373/ / / / /415 94/420 69/ /458 94/420 69/263 69/458
28 28 TABLE XX: GREENLAND HALIBUT, DIV. 3L, 2014: length composition (0/000) of the 130mm trawl catches. LENGTH MAR APR JUN JUL AUG OCT NOV 1st Q. 2nd Q. 3rd Q. 4th Q. YEAR LENGTH TOTAL No. SAMPLES SAMPLING WEIGHT(kg) No. F.MEASURED MEAN LENGTH(cm) MEAN WEIGHT (g) DEPTH RANGE (m) 772/ / / / / / / / / / / /1485
29 29 TABLE XXI: GREENLAND HALIBUT, DIV. 3M, 2014: length composition (0/000) of the 130mm trawl catches. LENGTH MAR APR JUN JUL 1st Q. 2nd Q. 3rd Q. YEAR LENGTH TOTAL No. SAMPLES SAMPLING WEIGHT(kg) No. F.MEASURED MEAN LENGTH(cm) MEAN WEIGHT (g) DEPTH RANGE (m) 873/ / / / / / / /1148
30 30 TABLE XXII: GREENLAND HALIBUT, DIV. 3N, 2014: length composition (0/000) of the 130mm trawl catches. LENGTH JUL AUG 3rd Q. LENGTH = YEAR TOTAL TABLE XXIII: WITCH FLOUNDER, DIV. 3M, 2014: length composition (0/000) of the 130mm trawl catches. LENGTH SEP OCT NOV 3rd Q. 4th Q. YEAR LENGTH TOTAL No. SAMPLES SAMPLING WEIGHT(kg) No. F.MEASURED MEAN LENGTH(cm) MEAN WEIGHT (g) DEPTH RANGE (m) 891/ / /1400 No. SAMPLES SAMPLING WEIGHT(kg) No. F.MEASURED MEAN LENGTH(cm) MEAN WEIGHT (g) DEPTH RANGE (m) 141/ / / / / /204
31 31 TABLE XXIV: WITCH FLOUNDER, DIV. 3N, 2014: length composition (0/000) of the 130mm trawl catches. LENGTH AUG LENGTH =YEAR TOTAL 1000 No. SAMPLES 1 SAMPLING WEIGHT(kg) 124 No. F.MEASURED 185 MEAN LENGTH(cm) 49.4 MEAN WEIGHT (g) 1030 DEPTH RANGE (m) 470/1100 TABLE XXV: WITCH FLOUNDER, DIV. 3O, 2014: length composition (0/000) of the 130mm trawl catches. LENGTH JUL AUG SEP 3rd Q. LENGTH =YEAR TOTAL No. SAMPLES SAMPLING WEIGHT(kg) No. F.MEASURED MEAN LENGTH(cm) MEAN WEIGHT (g) DEPTH RANGE (m) 362/ / / /431
32 32 TABLE XXVI: ROUGHHEAD GRENADIER, DIV. 3L, 2014: length composition (0/000) of the 130mm trawl catches. LENGTH MAR JUN JUL AUG 1st Q. 2nd Q. 3rd Q. YEAR LENGTH TOTAL No. SAMPLES SAMPLING WEIGHT(kg) No. F.MEASURED MEAN LENGTH(cm) MEAN WEIGHT (g) DEPTH RANGE (m) 854/ / / / / / / /1255
33 33 TABLE XXVII: ROUGHHEAD GRENADIER, DIV. 3M, 2014: length composition (0/000) of the 130mm trawl catches. LENGTH MAR JUL 1st Q. 3rd Q. YEAR LENGTH TOTAL No. SAMPLES SAMPLING WEIGHT(kg) No. F.MEASURED MEAN LENGTH(cm) MEAN WEIGHT (g) DEPTH RANGE (m) 873/ / / / /1135 TABLE XXVIII: THORNY SKATE, DIV. 3M, 2014: length composition (0/000) of the 130mm trawl catches. LENGTH FEB LENGTH = YEAR TOTAL 1000 No. SAMPLES 1 SAMPLING WEIGHT(kg) 69 No. F.MEASURED 22 MEAN LENGTH(cm) 64.0 MEAN WEIGHT (g) 3074 DEPTH RANGE (m) 377/391
34 34 TABLE XXIX: WHITE HAKE, DIV. 3O, 2014: length composition (0/000) of the 130mm trawl catches. LENGTH MAY JUN AUG SEP 2nd Q. 3rd Q. YEAR LENGTH TOTAL No. SAMPLES SAMPLING WEIGHT(kg) No. F.MEASURED MEAN LENGTH(cm) MEAN WEIGHT (g) DEPTH RANGE (m) 393/ / / / / / /431
35 35 TABLE XXVII: ROUGHHEAD GRENADIER, DIV. 3M, 2014: length composition (0/000) 130mm trawl catches. LENGTH MAR JUL YEAR LENGTH =1st Q. =3rd Q TOTAL No. SAMPLES SAMPLING WEIGHT(kg) No. F.MEASURED MEAN LENGTH(cm) MEAN WEIGHT (g) DEPTH RANGE (m) 873/ / /1135 TABLE XXVIII: THORNY SKATE, DIV. 3M, 2014: length composition (0/000) of the 130mm trawl catches. LENGTH FEB LENGTH = YEAR TOTAL 1000 No. SAMPLES 1 SAMPLING WEIGHT(kg) 69 No. F.MEASURED 22 MEAN LENGTH(cm) 64.0 MEAN WEIGHT (g) 3074 DEPTH RANGE (m) 377/391
36 36 TABLE XXIX: WHITE HAKE, DIV. 3O, 2014: length composition (0/000) of the 130mm trawl catches. LENGTH MAY JUN AUG SEP 2nd Q. 3rd Q. YEAR LENGTH TOTAL No. SAMPLES SAMPLING WEIGHT(kg) No. F.MEASURED MEAN LENGTH(cm) MEAN WEIGHT (g) DEPTH RANGE (m) 393/ / / / / / /431

37 t/hora t/hora t/hora t/hora Div.3L Ano Div.3M Ano Div.3N Ano Div.3LMNO Ano Fig. 1: Greenland halibut trawl catch rates by division, Fig. 2 - Annual length composition of Cod on Division 3L 130mm trawl fishery in Year 2014 n =
38 38
39 39
40 40
Abstract. 1 Introduction. 2 Materials and Methods
 NOT TO BE CITED WITHOUT PRIOR REFERENCE TO THE AUTHOR(S) Northwest Atlantic Fisheries Organization Serial No. N5637 NAFO SCR Doc. 09/11 SCIENTIFIC COUNCIL MEETING JUNE 2009 Stock Abundance Indices and
SCIENTIFIC COUNCIL MEETING JUNE 2011
 NOT TO BE CITED WITHOUT PRIOR REFERENCE TO THE AUTHOR(S) Northwest Atlantic Fisheries Organization Serial No. N598 NAFO SCR Doc. 11/24 SCIENTIFIC COUNCIL MEETING JUNE 211 Biomass and Abundance of Demersal
AD Table 3.--Goodrich Evacuation Systems Installed on Certain Airbus Model Airplanes
 Table 3.--Goodrich Evacuation Systems Installed on Certain Airbus Model Airplanes Goodrich evacuation system having P/N - (i) 4A3928-1 (ii) 4A3928-2 (iii) 4A3931-1 and 4A3931-3 (iv) 4A3931-2 and 4A3931-4
5 Plaice, turbot, dab, and brill in the Baltic
 ICES WGBFAS REPORT 2012 259 5 Plaice, turbot, dab, and brill in the Baltic The landing data of plaice, turbot, dab, and brill according to ICES Subdivisions and countries are presented in Tables 5.1 5.4.
Serial No. N4674 NAFO SCR Doc. 02/62 SCIENTIFIC COUNCIL MEETING JUNE 2002
 NOT TO BE CITED WITHOUT PRIOR REFERENCE TO THE AUTHOR(S) Northwest Atlantic Fisheries Organization Serial No. N4674 NAFO SCR Doc. 02/62 SCIENTIFIC COUNCIL MEETING JUNE 2002 An Assessment of American Plaice
Flounder (Platichthys flesus) in Subarea 4 and Division 3.a (North Sea, Skagerrak and Kattegat)
 in Subarea 4 and Division 3.a (North Sea, Skagerrak and Kattegat)") ICES Advice on fishing opportunities, catch, and effort Greater North Sea Ecoregion Published 30 June 2017 DOI: 10.17895/ices.pub.3113 Flounder (Platichthys flesus) in Subarea 4 and Division 3.a (North
ICES Advice on fishing opportunities, catch, and effort Greater North Sea Ecoregion Published 30 June 2017 DOI: 10.17895/ices.pub.3113 Flounder (Platichthys flesus) in Subarea 4 and Division 3.a (North
Commercial-in-Confidence Ashton Old Baths Financial Model - Detailed Cashflow
 Year 0 1 2 3 4 5 6 7 8 9 10 11 12 13 Oct-16 Nov-16 Dec-16 Jan-17 Feb-17 Mar-17 Apr-17 May-17 Jun-17 Jul-17 Aug-17 Sep-17 Oct-17 2,038 2,922 4,089 4,349 6,256 7,124 8,885 8,885 8,885 8,885 8,885 8,885 9,107
GAZIFÈRE INC. Prime Rate Forecasting Process 2017 Rate Case
 Overview A consensus forecast is used to estimate the prime rate charged by commercial banks. As the prime rate is subject to competitive pressures faced by individual lenders and is set on an individual
A Research, Science and Discovery based Polyurethane Technology company
 HAMISAR HEALTHCARE Polyurethane Education, Contract research and Training ANNOUNCEMENT: SHORT TERM COURSES 1) Course: INTRODUCTION TO FLEXIBLE POLYURETHANE MOULDED FOAMS AND TROUBLE SHOOTING 1) DATE :
COMPILED BY GLASS S. Auction Report - LCV November 2013
 GLASS S Auction Report - LCV November 2013 Contents Market Commentary Page 3 Whole Market Summary Page 8 Average Sales Price Year on Year Page 9 Sales Price Compared to Number of Entries (all ages) Page
Sebastes marinus in Subareas I and II
 3...b Sebastes marinus in Subareas I and II State of stock/exploitation: It has not been possible to assess the state of this stock with respect to safe biological limits. Available data from the Barents
FOR IMMEDIATE RELEASE
 Article No. 5842 Available on www.roymorgan.com Roy Morgan Unemployment Profile Thursday, 2 October 2014 Unemployment climbs to 9.9% in September as full-time work lowest since October 2011; 2.2 million
8.4.9 Advice June Baltic Sea Flounder in Subdivisions (Baltic Sea)
") 8.4.9 Advice June 2012 ECOREGION STOCK Baltic Sea Flounder in Subdivisions 22 32 (Baltic Sea) Advice for 2013 Based on the ICES approach for data-limited stocks, ICES advises that catches should be no
8.4.9 Advice June 2012 ECOREGION STOCK Baltic Sea Flounder in Subdivisions 22 32 (Baltic Sea) Advice for 2013 Based on the ICES approach for data-limited stocks, ICES advises that catches should be no
532: 2006 Bicycle tube valves and valve tubing Specification (third revision) 2414: 2005 Cycle and rickshaw pneumatic tyres (fourth revision)
 2414: 2005 Cycle and rickshaw pneumatic tyres (fourth revision)") For BIS use only Draft Indian Standard CYCLE RUBBER TUBES (MOULDED/JOINTED) SPECIFICATION (fourth revision of IS 2415) Not to be reproduced without the permission Last date for receipt of comments is of
For BIS use only Draft Indian Standard CYCLE RUBBER TUBES (MOULDED/JOINTED) SPECIFICATION (fourth revision of IS 2415) Not to be reproduced without the permission Last date for receipt of comments is of
FOR IMMEDIATE RELEASE
 Article No. 7845 Available on www.roymorgan.com Roy Morgan Unemployment Profile Friday, 18 January 2019 Unemployment in December is 9.7% and under-employment is 8.8% FOR IMMEDIATE RELEASE Australian unemployment
FOR IMMEDIATE RELEASE
 Article No. 7353 Available on www.roymorgan.com Roy Morgan Unemployment Profile Wednesday, 11 October 2017 2.498 million Australians (18.9%) now unemployed or under-employed In September 1.202 million
WIM #37 was operational for the entire month of September Volume was computed using all monthly data.
 SEPTEMBER 2016 WIM Site Location WIM #37 is located on I-94 near Otsego in Wright county. The WIM is located only on the westbound (WB) side of I-94, meaning that all data mentioned in this report pertains
FOR IMMEDIATE RELEASE
 Article No. 7761 Available on www.roymorgan.com Roy Morgan Unemployment Profile Monday, 8 October 2018 Unemployment down to 9.4% in September off two-year high Australian employment has grown solidly over
Saithe (Pollachius virens) in Subareas I and II (Northeast Arctic)
 in Subareas I and II (Northeast Arctic)") ICES Advice on fishing opportunities, catch and effort Barents Sea and Norwegian Sea Ecoregions Published 12 June 2015 3.3.10 Saithe (Pollachius virens) in Subareas I and II (Northeast Arctic) ICES stock
ICES Advice on fishing opportunities, catch and effort Barents Sea and Norwegian Sea Ecoregions Published 12 June 2015 3.3.10 Saithe (Pollachius virens) in Subareas I and II (Northeast Arctic) ICES stock
D G A G R I D A S H B O A R D : A P P L E S
 75 79 60 56 49 74 65 59 54 42 76 63 58 53 78 55 42 43 79 44 81 63 47 83 64 59 53 48 Sources: Eurostat, MSs notifications, DG Agri, Comext, Comtrade, GTA, ITC, AMI, Expert groups, Freshfel, Wapa. 89 68
Total Production by Month (Acre Feet)
") Production by Month (acre-feet) 2008 2009 2010 2011 2012 2013 2014 2015 2016 January 25 339.10 228.90 249.50 297.99 243.06 327.14 247.66 212.37 February 234.00 218.80 212.10 241.52 245.82 279.08 234.16
Production by Month (acre-feet) 2008 2009 2010 2011 2012 2013 2014 2015 2016 January 25 339.10 228.90 249.50 297.99 243.06 327.14 247.66 212.37 February 234.00 218.80 212.10 241.52 245.82 279.08 234.16
University of Michigan Eco-Driving Index (EDI) Latest data: October 2017
 Latest data: October 2017") University of Michigan Eco-Driving Index () http://www.ecodrivingindex.org Latest data: October 2017 Developed and issued monthly by Michael Sivak and Brandon Schoettle Sustainable Worldwide Transportation
University of Michigan Eco-Driving Index () http://www.ecodrivingindex.org Latest data: October 2017 Developed and issued monthly by Michael Sivak and Brandon Schoettle Sustainable Worldwide Transportation
FOR IMMEDIATE RELEASE
 Article No. 7433 Available on www.roymorgan.com Roy Morgan Unemployment Profile Friday, 12 January 2018 2.6m Australians unemployed or under-employed in December The latest data for the Roy Morgan employment
3.3.3 Capelin (Mallotus villosus) in subareas 1 and 2 (Northeast Arctic), excluding Division 2.a west of 5 W (Barents Sea capelin)
 in subareas 1 and 2 (Northeast Arctic), excluding Division 2.a west of 5 W (Barents Sea capelin)") ICES Advice on fishing opportunities, catch, and effort Barents Sea and Norwegian Sea Ecoregions Published 11 October 2016 3.3.3 Capelin (Mallotus villosus) in subareas 1 and 2 (Northeast Arctic), excluding
ICES Advice on fishing opportunities, catch, and effort Barents Sea and Norwegian Sea Ecoregions Published 11 October 2016 3.3.3 Capelin (Mallotus villosus) in subareas 1 and 2 (Northeast Arctic), excluding
Construction Sector Indices
 STATISTICAL RELEASE UGANDA BUREAU OF STATISTICS January to April 212 Construction Sector Indices HIGHLIGHTS Annual Changes show that the prices for the Whole Construction Sector (covering material prices,
September 2016 Water Production & Consumption Data
 September 2016 Water Production & Consumption Data September 2016 monthly water production (288.48 AF) was lowest in at least 17 years. Monthly water production has increased slightly each month since
November 2018 Customer Switching Report for the Electricity and Gas Retail Markets
 An Coimisiún um Rialáil Fóntas Commission for Regulation of Utilities November 2018 Customer Switching Report for the Electricity and Gas Retail Markets Information Paper Reference: CRU18266 Date Published:
Sound Transit Operations July 2016 Service Performance Report. Ridership
 Ridership Total Boardings by Mode Mode Jul-15 Jul-16 % YTD-15 YTD-16 % ST Express 1,618,779 1,545,852-4.5% 10,803,486 10,774,063-0.3% Sounder 333,000 323,233-2.9% 2,176,914 2,423,058 11.3% Tacoma Link
Electricity Industry Code Minimum Service Standards & Guaranteed Service Levels Quarterly Report July September 2008
 Electricity Industry Code Minimum Service Standards & Guaranteed Service Levels Quarterly Report July September 2008 2 Table of Contents Administrative Data...3 Network Performance...3 Reliability Measures
MONTHLY NEW RESIDENTIAL CONSTRUCTION, JULY 2017
 FOR RELEASE AT 8:30 AM EDT, WEDNESDAY, AUGUST 16, MONTHLY NEW RESIDENTIAL CONSTRUCTION, JULY Release Number: CB17-133 August 16, - The U.S. Census Bureau and the U.S. Department of Housing and Urban Development
Report of the North Western Working Group (NWWG)
") ICES NWWG REPORT 2017 ICES ADVISORY COMMITTEE ICES CM 2017/ACOM:08 REF. ACOM Report of the North Western Working Group (NWWG) 27 April 4 May 2017 Copenhagen, Denmark International Council for the Exploration
ICES NWWG REPORT 2017 ICES ADVISORY COMMITTEE ICES CM 2017/ACOM:08 REF. ACOM Report of the North Western Working Group (NWWG) 27 April 4 May 2017 Copenhagen, Denmark International Council for the Exploration
MONTHLY NEW RESIDENTIAL CONSTRUCTION, APRIL 2017
 FOR RELEASE AT 8:30 AM EDT, TUESDAY, MAY 16, MONTHLY NEW RESIDENTIAL CONSTRUCTION, APRIL Release Number: CB17-75 May 16, - The U.S. Census Bureau and the U.S. Department of Housing and Urban Development
GOVERNMENT OF PAKSITAN MINISTRY OF FINANCE, ECONOMIC AFFAIRS, STATISTICS AND REVENUE (REVENUE DIVISION) **** NOTIFICAITON (SALES TAX)
 **** NOTIFICAITON (SALES TAX)") GOVERNMENT OF PAKSITAN MINISTRY OF FINANCE, ECONOMIC AFFAIRS, STATISTICS AND REVENUE (REVENUE DIVISION) **** NOTIFICAITON (SALES TAX) Islamabad, the 11 th June, 2008 S.R.O. 549(I)/2008: In exercise of
GOVERNMENT OF PAKSITAN MINISTRY OF FINANCE, ECONOMIC AFFAIRS, STATISTICS AND REVENUE (REVENUE DIVISION) **** NOTIFICAITON (SALES TAX) Islamabad, the 11 th June, 2008 S.R.O. 549(I)/2008: In exercise of
FOR IMMEDIATE RELEASE
 Article No. 6928 Available on www.roymorgan.com Roy Morgan Unemployment Profile Wednesday, 17 August 2016 Australian real unemployment jumps to 10.5% (up 0.9%) in July during post-election uncertainty
Price Category Breakdown - February 2010
 SINGLE FAMILY RESIDENTIAL BREAKDOWN ruary 21 ruary Sales and Average Price Increase Annually TORONTO - Wednesday, March 3, 21 7.3 % 24.6 % 1.8 % 7.3%.2%.1 % Greater Toronto REALTORS reported 7,291 sales
MONTHLY NEW RESIDENTIAL CONSTRUCTION, NOVEMBER 2017
 FOR RELEASE AT 8:30 AM EST, TUESDAY, DECEMBER 19, MONTHLY NEW RESIDENTIAL CONSTRUCTION, NOVEMBER Release Number: CB17-206 December 19, - The U.S. Census Bureau and the U.S. Department of Housing and Urban
Bulk Storage Containers
 UCSB AST SPCC SELF-INSPECTION CHECKLIST Year: Responsible Department: Tank Location: Tank ID: Bulk Storage Containers Total tank capacity: Petroleum type and amount: Secondary containment type: (diesel,
Summary of the Industry-DFO Collaborative Post-season Trap Surveys for Snow Crab in Div. 2J3KLOPs4R
 Wp: 2013/ Summary of the Industry-DFO Collaborative Post-season Trap Surveys for Snow Crab in Div. 2J3KLOPs4R by D.E. Stansbury, D. Fiander and D. Maddock Parsons INTRODUCTION The industry-department of
increase of over four per cent compared to the average of $409,058 reported in January 2010.
 SINGLE FAMILY RESIDENTIAL BREAKDOWN uary 211 26.8 % 1.7 % 7.%.4%.1 % Good Start to 211 TORONTO - February 4, 211 Greater Toronto REALTORS reported 4,337 transactions through the TorontoMLS system in uary
Appendix E Water Supply Modeling
 Supply Modeling Modesto Irrigation District Treatment Plant Expansion Project Modeling I. Introduction The Modesto Irrigation District (MID) is situated adjacent to and north of the Tuolumne River. Over
MONTHLY NEW RESIDENTIAL CONSTRUCTION, AUGUST 2017
 FOR RELEASE AT 8:30 AM EDT, TUESDAY, SEPTEMBER 19, MONTHLY NEW RESIDENTIAL CONSTRUCTION, AUGUST Release Number: CB17-158 Notice: For information on the impact of Hurricanes Harvey and Irma on the compilation
COMPARISON OF FIXED & VARIABLE RATES (25 YEARS) CHARTERED BANK ADMINISTERED INTEREST RATES - PRIME BUSINESS*
 CHARTERED BANK ADMINISTERED INTEREST RATES - PRIME BUSINESS*") COMPARISON OF FIXED & VARIABLE RATES (25 YEARS) 2 Fixed Rates Variable Rates For Internal Use Only. FIXED RATES OF THE PAST 25 YEARS AVERAGE RESIDENTIAL MORTGAGE LENDING RATE - 5 YEAR* (Per cent) Year
COMPARISON OF FIXED & VARIABLE RATES (25 YEARS) 2 Fixed Rates Variable Rates For Internal Use Only. FIXED RATES OF THE PAST 25 YEARS AVERAGE RESIDENTIAL MORTGAGE LENDING RATE - 5 YEAR* (Per cent) Year
COMPARISON OF FIXED & VARIABLE RATES (25 YEARS) CHARTERED BANK ADMINISTERED INTEREST RATES - PRIME BUSINESS*
 CHARTERED BANK ADMINISTERED INTEREST RATES - PRIME BUSINESS*") COMPARISON OF FIXED & VARIABLE RATES (25 YEARS) 2 Fixed Rates Variable Rates FIXED RATES OF THE PAST 25 YEARS AVERAGE RESIDENTIAL MORTGAGE LENDING RATE - 5 YEAR* (Per cent) Year Jan Feb Mar Apr May Jun
COMPARISON OF FIXED & VARIABLE RATES (25 YEARS) 2 Fixed Rates Variable Rates FIXED RATES OF THE PAST 25 YEARS AVERAGE RESIDENTIAL MORTGAGE LENDING RATE - 5 YEAR* (Per cent) Year Jan Feb Mar Apr May Jun
December. Next release: 13 February Oct/Sep Nov/Oct Dec/Nov Janu19 January Febru13 February 2018 Oct/Sep Nov/Oct Dec/Nov 2017
 Oct/Sep Nov/Oct Dec/Nov 2017 19 Janu19 January 2018 13 Febru13 February 2018 Oct/Sep Nov/Oct Dec/Nov 2017 Next release: 13 February 2018 DecembDecember December TABLE OF CONTENTS Page Charts 1 Latest IEA
Name and address of DISCOM with Logo. TARIFF NOTIFICATION The 22 rd March, 2018 RETAIL SUPPLY TARIFF EFFECTIVE FROM 1 st APRIL, 2018
 Name and address of DISCOM with Logo TARIFF NOTIFICATION The 22 rd March, 2018 RETAIL SUPPLY TARIFF EFFECTIVE FROM 1 st APRIL, 2018 In exercise of the powers conferred under section 64(3) and other related
TECHNICAL SERVICE BULLETIN
 TECHNICAL SERVICE BULLETIN To: Minuteman Dealers and Customers From: Minuteman Technical Support Date: 1/12/2011 Subject: TSB for the KIT # K-FRSPEEDSWT. For the FR17115, FR17220, FR20115 and FR20220 models.
-1- INTRODUCTION. This report presents historical tabulated data on landings and value of the New Bedford sea scallop fishery from
 -1- INTRODUCTION Since the late 1930's, New Bedford, Massachusetts,has been the leading port for sea scallop (Placopecten magellanicus) landings in the United States. In 1983, New Bedford sea scallop landings
VEHICLE / PEDESTRIAN COLLISIONS
 Info item No. 1 Crosswalk Safety Advisory Committee March 31, 2016 VEHICLE / PEDESTRIAN COLLISIONS HRM: January December 20 DISCLAIMER: All figures presented in this report reflect the information held
U.S. Census Bureau News Joint Release U.S. Department of Housing and Urban Development
 Raemeka Mayo or Stephen Cooper Economic Indicators Division (01) 76-5160 FOR IMMEDIATE RELEASE TUESDAY, MARCH 17, 015 AT 8:0 A.M. EDT NEW RESIDENTIAL CONSTRUCTION IN FEBRUARY 015 The U.S. Census Bureau
RIDERSHIP TRENDS. April 2018
 RIDERSHIP TRENDS April Prepared by the Division of Strategic Capital Planning June Table of Contents Executive Summary...1 Ridership...3 Estimated Passenger Trips by Line...3 Estimated Passenger Trips
MONTHLY NEW RESIDENTIAL CONSTRUCTION, FEBRUARY 2017
 FOR RELEASE AT 8:30 AM EDT, THURSDAY, MARCH 16, MONTHLY NEW RESIDENTIAL CONSTRUCTION, FEBRUARY Release Number: CB17-38 March 16, - The U.S. Census Bureau and the U.S. Department of Housing and Urban Development
November 2017 Customer Switching Report for the Electricity and Gas Retail Markets
 An Coimisiún um Rialáil Fóntas Commission for Regulation of Utilities November 2017 Customer Switching Report for the Electricity and Gas Retail Markets Information Paper Reference: CRU18011 Date Published:
Inventory Levels - All Prices. Inventory Levels - By Price Range
 Inventory Levels - All Prices Idaho Falls Bonneville Total 7-Apr-17 154 111 265 6-Apr-18 113 91 204-23% Inventory Levels - By Price Range 7-Apr-17 6-Apr-18 0-100,000 36 10 100,001-125,000 13 9 125,001-150,000
FOR IMMEDIATE RELEASE
 Article No. 7137 Available on www.roymorgan.com Roy Morgan Unemployment Profile Wednesday, 8 February 2017 Over 12 million Australians have jobs for the first time including over 8 million full-time jobs,
Inventory Levels - All Prices. Inventory Levels - By Price Range
 Inventory Levels - All Prices Idaho Falls Bonneville Total 3-Mar-17 152 108 260 2-Mar-18 109 78 187-28% Inventory Levels - By Price Range 3-Mar-17 2-Mar-18 0-100,000 41 6 100,001-125,000 19 8 125,001-150,000
The Peoples Gas Light and Coke Company
 History of Gas Charges Due to the Operation of Rider 2 (Cents per Therm) Factors for Transportation Customers (Riders FST, SST, P, CFY and AGG) Non- Total Standby Standby Aggregation Commodity Commodity
Residential Load Profiles
 Residential Load Profiles TABLE OF CONTENTS PAGE 1 BACKGROUND... 1 2 DATA COLLECTION AND ASSUMPTIONS... 1 3 ANALYSIS AND RESULTS... 2 3.1 Load Profiles... 2 3.2 Calculation of Monthly Electricity Bills...
Energy Conservation Efforts
 Hennepin County Property Services Energy Conservation Efforts MEPC Presentation September 2010 HENNEPIN COUNTY PROPERTY SERVICES DEPARTMENT MONTHLY ENERGY COSTS $1,200,000 $1,000,000 Cold 2009 October
Andaman Sea Fisheries Research and Development Center 77 Tumbon Vichit, Maung District, Phuket Thailand
 Foreign Tuna Fleets Unloading in Phuket, Thailand During 1995-2009 Praulai Nootmorn, Supachai Rodpradit, Nantana Nakosiri, Thumawadee Chaiyen, and Sampan Panjarat SUMMARY Andaman Sea Fisheries Research
August 2018 MLS Statistical Report
 January February March April May June July August Septem October Novem Decem August 218 MLS Statistical Report Total Sales Overall, sales are down 3%; however, total volume sold is up 7% and Median Sale
TRANSPACIFIC CUSTOMER ADVISORY Implementation of New BAF Formula Effective January 01, 2019
 December 7, 2018 TRANSPACIFIC CUSTOMER ADVISORY Implementation of New BAF Formula Effective January 01, 2019 Dear Valued Customer, Bunker is one of the important cost components for a container shipping
D G A G R I D A S H B O A R D : T O M A T O E S Last update: EU AVG PRICES
 tonnes Weightedaverages by volume of production per MS Ongoing adjustments on weights by variety group 000 tonnes D G A G R I D A S H B O A R D : T O M A T O E S Last update: 20.04.2018 EU AVG PRICES MS
CENTRAL MARKS DEPARTMENT II (Legal) Our Ref: CMD-II(L)/16:
 Our Ref: CMD-II(L)/16:") CENTRAL MARKS DEPARTMENT II (Legal) Our Ref: CMD-II(L)/16: 15633 22 04 5 Subject: Coents on Draft Aendent 4 April 5 to IS 15633:2005 Specification for Autootive Vehicles Pneuatic Tyres for Passenger Car
CENTRAL MARKS DEPARTMENT II (Legal) Our Ref: CMD-II(L)/16: 15633 22 04 5 Subject: Coents on Draft Aendent 4 April 5 to IS 15633:2005 Specification for Autootive Vehicles Pneuatic Tyres for Passenger Car
Appendix E Hydrology, Erosion and Sediment Transport Studies
 Appendix E Hydrology, Erosion and Sediment Transport Studies Hatch 2012/10 Appendix E1 EA Hydrology Memorandum February 2011 (Hatch. 2011a) Hatch 2012/10 Project Memo February 23, 2011 TO: Larry King FROM:
RIDERSHIP TRENDS. July 2018
 RIDERSHIP TRENDS July Prepared by the Division of Strategic Capital Planning September Table of Contents Executive Summary...1 Ridership...3 Estimated Passenger Trips by Line...3 Estimated Passenger Trips
U.S. Census Bureau News Joint Release U.S. Department of Housing and Urban Development
 Raemeka Mayo or Stephen Cooper Economic Indicators Division (301) 763-5160 FOR IMMEDIATE RELEASE TUESDAY, MAY 17, 2016 AT 8:30 A.M. EDT NEW RESIDENTIAL CONSTRUCTION IN APRIL 2016 The U.S. Census Bureau
Comparing the Quality of Service of Bus Companies Operating in two Cities in Brazil
 Comparing the Quality of Service of Bus Companies Operating in two Cities in Brazil D. I. De Souza, D. Kipper, G. P. Azevedo Abstract The main objective of this work is to compare the quality of service
ADDENDUM #1. A. Alternate Bid Item #3A - The procurement and installation of a new 12,000 gallon UL 2085 rated AGT tank for
 ADDENDUM #1 The Plymouth Airport Commission is committed to fulfilling the New Fuel Farm Facility project within the scope of the permit, not exceeding our funding and to satisfy the time constraint associated
THE INSTITUTE OF PAPER CHEMISTRY. Appleton, Wisconsin MODIFIED RING COMPRESSION TESTS ON CORRUGATING MEDIUM. / Project Preliminary Report
 . --.c.l. < 4.../ti.-1 i /cf.?- f:.... '( [, 0 THE INSTITUTE OF PAPER CHEMISTRY '4d-~-W-ktWLt:e cl.3 Appleton, Wisconsin I' 9~) MODIFIED RING COMPRESSION TESTS ON CORRUGATING MEDIUM / Project 1108-55 Preliminary
Secretary s DO Report
 Secretary s DO Report FLASH REPORT FOR THE MONTH OF AUGUST 2010 JANUARY - 2018 (2017 18) Secretary s DO Report (Flash Report) OCTOBER 2010 Secretary s DO Report (Flash Report) JANUARY 2018 (FY 2017 18)
Inventory Levels - All Prices. Inventory Levels - By Price Range
 Inventory Levels - All Prices Idaho Falls Bonneville Total 3-Nov-17 198 128 326 2-Nov-18 155 134 289-11% Inventory Levels - By Price Range 3-Nov-17 2-Nov-18 0-100,000 17 11 100,001-125,000 15 9 125,001-150,000
Brill (Scophthalmus rhombus) in Subarea 4 and divisions 3.a and 7.d e (North Sea, Skagerrak and Kattegat, English Channel)
 in Subarea 4 and divisions 3.a and 7.d e (North Sea, Skagerrak and Kattegat, English Channel)") ICES Advice on fishing opportunities, catch, and effort Celtic Seas and Greater North Sea Ecoregions Published 30 June 2017 DOI: 10.17895/ices.pub.3058 Brill (Scophthalmus rhombus) in Subarea 4 and divisions
ICES Advice on fishing opportunities, catch, and effort Celtic Seas and Greater North Sea Ecoregions Published 30 June 2017 DOI: 10.17895/ices.pub.3058 Brill (Scophthalmus rhombus) in Subarea 4 and divisions
Economic & Steel Market Development in Japan
 1 Economic & Steel Market Development in Japan 68 th OECD Steel Committee Paris May 6-7, 2010 The Japan Iron & Steel Federation 2 Macro-economic overview Steel Supply and Demand v v v Steel Production
MONTHLY NEW RESIDENTIAL SALES, SEPTEMBER 2018
 FOR RELEASE AT 10:00 AM EDT, WEDNESDAY, OCTOBER 24, MONTHLY NEW RESIDENTIAL SALES, SEPTEMBER Release Number: CB18 160 October 24, The U.S. Census Bureau and the U.S. Department of Housing and Urban Development
Number 10 of 2012 MOTOR VEHICLE (DUTIES AND LICENCES) ACT 2012 ARRANGEMENT OF SECTIONS. 3. Amendment of Part I of Schedule to Act of 1952.
 ACT 2012 ARRANGEMENT OF SECTIONS. 3. Amendment of Part I of Schedule to Act of 1952.") Number 10 of 2012 MOTOR VEHICLE (DUTIES AND LICENCES) ACT 2012 Section 1. Definitions. ARRANGEMENT OF SECTIONS 2. Application of sections 3 to 5. 3. Amendment of Part I of Schedule to Act of 1952. 4. Amendment
Number 10 of 2012 MOTOR VEHICLE (DUTIES AND LICENCES) ACT 2012 Section 1. Definitions. ARRANGEMENT OF SECTIONS 2. Application of sections 3 to 5. 3. Amendment of Part I of Schedule to Act of 1952. 4. Amendment
Hospitality & Tourism Management January 2015 Calendar Sunday Monday Tuesday Wednesday Thursday Friday Saturday 1 2 3
 Jan-14 Week 1 Week 2 January 2015 Calendar 1 2 3 New Year's Day - 4 5 6 7 8 9 10 New Intake-L4 (EFTH) Assign-Presentation L4 Assign-Presentation L5 Last Exam Reg- CTH Assign Marking Assign Marking Module-
FY2/18 2Q(March 2017~August 2018)
") FY2/18 2Q(March 2017~August 2018) Fact Book 1. Trends in the current fiscal year and previous fiscal year 3. Business overview (1) Performance overview P.1 (1) No. of students at the end of month P.7 (2)
FY2/18 2Q(March 2017~August 2018) Fact Book 1. Trends in the current fiscal year and previous fiscal year 3. Business overview (1) Performance overview P.1 (1) No. of students at the end of month P.7 (2)
Number 5 of 2003 MOTOR VEHICLE (DUTIES AND LICENCES) ACT 2003 ARRANGEMENT OF SECTIONS. 4. Amendment of Part I of Schedule to Act of 1952.
 ACT 2003 ARRANGEMENT OF SECTIONS. 4. Amendment of Part I of Schedule to Act of 1952.") Number 5 of 2003 MOTOR VEHICLE (DUTIES AND LICENCES) ACT 2003 ARRANGEMENT OF SECTIONS Section 1. Interpretation. 2. Application of sections 3 to 6. 3. Amendment of section 1 of Act of 1952. 4. Amendment
Number 5 of 2003 MOTOR VEHICLE (DUTIES AND LICENCES) ACT 2003 ARRANGEMENT OF SECTIONS Section 1. Interpretation. 2. Application of sections 3 to 6. 3. Amendment of section 1 of Act of 1952. 4. Amendment
Table 1 of nafo by year. Controlling for trpty=large mesh Total. Table 2 of nafo by year. Controlling for trpty=small mesh
 Table 1. Number of CORE Stations for all years As used in this analysis Note * Numbers are not equal but are from Core Stns. Table 1 of nafo by year Controlling for trpty=large mesh nafo year 4 5 6 7 8
Used Vehicle Supply: Future Outlook and the Impact on Used Vehicle Prices
 Used Vehicle Supply: Future Outlook and the Impact on Used Vehicle Prices AT A GLANCE When to expect an increase in used supply Recent trends in new vehicle sales Changes in used supply by vehicle segment
Wheat Marketing Situation
 Wheat Marketing Situation Prepared by: Darrell L. Hanavan Executive Director Colorado Wheat Administrative Committee If you would like to receive an email when this report is updated, email gmostek@coloradowheat.org
Capacity Analysis Report. For. William E. Dunn Water Reclamation Facility 4111 Dunn Drive Palm Harbor, Florida 34683
 Capacity Analysis Report For William E. Dunn Water Reclamation Facility 4111 Dunn Drive Palm Harbor, Florida 34683 Florida Department of Environmental Protection Facility Identification No. FLA0128775
Solomon Islands Government. Statistical Bulletin: 11/2011. HONIARA CONSUMER PRICE INDEX (June 2011)
") Solomon Islands Government Statistical Bulletin: 11/2011 HONIARA CONSUMER PRICE INDEX (June 2011) Solomon Islands National Statistics Office Ministry of Finance & Treasury PO Box G6 Honiara Enquiries:
Solomon Islands Government Statistical Bulletin: 11/2011 HONIARA CONSUMER PRICE INDEX (June 2011) Solomon Islands National Statistics Office Ministry of Finance & Treasury PO Box G6 Honiara Enquiries:
Up and Down Months of the Stock Market
 Up and Down Months of the Stock Market 1926-2017 Positive years (66) in the stock market were not good all year long and losing years (24) were not losers throughout the year. Winning years produce losing
Passive Investors and Managed Money in Commodity Futures. Part 2: Liquidity. Prepared for: The CME Group. Prepared by:
 Passive Investors and Managed Money in Commodity Futures Part 2: Liquidity Prepared for: The CME Group Prepared by: October, 2008 Table of Contents Section Slide Number Objectives and Approach 3 Findings
Q3 report Joakim Olsson CEO and President October 24, Innovative Vehicle Technology
 Q3 report 2008 Joakim Olsson CEO and President October 24, 2008 Innovative Vehicle Technology 2008-10-24 Summary YTD 2008 Orders Received of 6 401 MSEK (6 077) Currency adjusted orders increased with 9
Sprinkler System Waiver Application Packet
 Sprinkler System Waiver Application Packet According to the City s municipal code, use of sprinklers is conditional upon use of a water budget and the City continues to discourage customers from irrigating
U.S. Census Bureau News Joint Release U.S. Department of Housing and Urban Development
 Raemeka Mayo or Stephen Cooper Economic Indicators Division (01) 76-5160 FOR IMMEDIATE RELEASE WEDNESDAY, MARCH 16, 016 AT 8:0 A.M. EDT NEW RESIDENTIAL CONSTRUCTION IN FEBRUARY 016 The U.S. Census Bureau
U.S. Census Bureau News Joint Release U.S. Department of Housing and Urban Development
 Raemeka Mayo or Stephen Cooper Economic Indicators Division (01) 76-5160 FOR IMMEDIATE RELEASE FRIDAY, JUNE 17, 016 AT 8:0 A.M. EDT NEW RESIDENTIAL CONSTRUCTION IN MAY 016 The U.S. Census Bureau and the
1. Trends in the current fiscal year and previous fiscal year 3. Business overview 2. Secular trends in first quarter financial results
 FY2/19 (March 2018~May 2018) Fact Book 1. Trends in the current fiscal year and previous fiscal year 3. Business overview (1) Performance overview P. 1 (1) No. of students at the end of month P. 6 (2)
D G A G R I D A S H B O A R D : A P P L E S
 Sources: Eurostat, MSs notifications, DG Agri, Comext, Comtrade, GTA, ITC, AMI, Expert groups, Freshfel, Wapa. 000 tonnes 39 41 31 22 29 22 32 27 17 18 9 27 15 12 6 6 6 4 5 6 5 4 11 25 15 9 9 93 62 51
SODANKYLÄ GEOPHYSICAL OBSERVATORY PUBLICATIONS. N o. 97 MAGNETIC RESULTS SO D A N K Y L Ä JOHANN ES KULTIMA TERO RAITA
 SODANKYLÄ GEOPHYSICAL OBSERVATORY PUBLICATIONS N o. 9 MAGNETIC RESULTS SO D A N K Y L Ä 0 JOHANN ES KULTIMA TERO RAITA OULU 05 Editor: Johannes Kultima Sodankylä Geophysical Observatory FIN-9900 SODANKYLÄ,
Action Requested From AMWG
 Action Requested From AMWG NONE, These Two Presentations Are For Information Transfer Only The information is derived from a multi-year synthesis research effort related to existing data on flow, sediment-transport
India & Asia. Steel Scrap Industry BY: VED PRAKASH GEMINI CORPORATION N. V., BELGIUM
 India & Asia Steel Scrap Industry BY: VED PRAKASH GEMINI CORPORATION N. V., BELGIUM 1 GEMINI CORPORATION N. V. Steel, Recyclable Plastics, Rubber and Engineered Wood Panels 2 Content How competitive are
Sigbjørn Mehl, Asgeir Aglen ans Espen Johnsen Institute of Marine Research P.O. Box 1870 Nordnes, N-5817 Bergen, Norway
 FISKEN OG HAVET nr. 10/2016 Re-estimation of swept area indices with CVs for main demersao Àsh species in the Barents Sea winter survey 1994 2016 applying the Sea2Data StoX software Sigbjørn Mehl, Asgeir
Glendale Water & Power Smart Grid Project
 Glendale Water & Power Smart Grid Project Key Dates in Project History Key Dates Project History On July 10, 2007, City Council directed GWP to develop a long term plan for smart meters On October 23,
Meter Insights for Downtown Store
 Meter Insights for Downtown Store Commodity: Analysis Period: Prepared for: Report Date: Electricity 1 December 2013-31 December 2014 Arlington Mills 12 February 2015 Electricity use over the analysis
2016 Meteorological Summary for the Galeta Marine Island Laboratory. Prepared by: Steven Paton
 0 2016 Meteorological Summary for the Galeta Marine Island Laboratory Prepared by: Steven Paton 1 Introduction This is the fourth in a series of yearly reports summarising the past year s Smithsonian Tropical
For BIS Use Only Doc: CED 50(7436) BUREAU OF INDIAN STANDARDS
 BUREAU OF INDIAN STANDARDS") For BIS Use Only Doc: CED 50(7436) BUREAU OF INDIAN STANDARDS DRAFT FOR COMMENTS ONLY (Not to be reproduced without the permission of BIS or used as an Indian Standard) Draft Indian Standard SPECIFICATION
For BIS Use Only Doc: CED 50(7436) BUREAU OF INDIAN STANDARDS DRAFT FOR COMMENTS ONLY (Not to be reproduced without the permission of BIS or used as an Indian Standard) Draft Indian Standard SPECIFICATION
2017 Meteorological Summary for the Galeta Marine Island Laboratory. Prepared by: Steven Paton
 0 2017 Meteorological Summary for the Galeta Marine Island Laboratory Prepared by: Steven Paton 1 Introduction This is the 5 th in a series of yearly reports summarising the past year s Smithsonian Tropical